UNDERSTANDING STUDENTS FROM A BEHAVIORAL … · annual limits on Stafford loans, SAP rates, and...
38
1- SIMA GANDHI- FINAL 3.DOC (DO NOT DELETE) 4/21/2008 2:47:31 PM 130 UNDERSTANDING STUDENTS FROM A BEHAVIORAL ECONOMICS PERSPECTIVE: HOW ACCELERATING STUDENT LOAN SUBSIDIES GENERATES MORE BANG FOR THE BUCK ♣ Sima J. Gandhi ∗ INTRODUCTION** Federal funding for higher education has played a substantial role in providing students with access to higher education from the 1944 direct subsidies of the GI Bill, to the 1965 subsidized student loans of the Higher Education Act (HEA), to the more recent tax credits and deductions of the 2001 tax bill. In 2002, federal financial aid for higher education totaled a staggering $105.1 billion dollars, or 5.8% of the federal budget. 1 Despite the substantial amount of federal aid, higher education in America remains primarily for the well-off. About ninety percent of high school graduates from families earning more than $80,000 attend college by the time they are twenty- ♣ A policy-focused version of this paper won the Brookings Institute’s Hamilton Project Economic Policy Innovation Prize. ∗ By Sima J. Gandhi, Tax Attorney at Simpson Thacher & Bartlett, L.L.P. L.L.M. Tax Candidate, 2010, New York University School of Law; J.D. 2007, New York University School of Law; B.A. with Honors, 2004, Stanford University; B.S., 2004, Stanford University. My thanks to the 2006-07 Tax & Social Policy Seminar at NYU School of Law for their support and comments. My special thanks to Professor Lily Batchelder for her dedication, encouragement, and invaluable insight, without which this piece would not have been possible. ∗∗ The legislation and data referred to in this paper were current as of June, 2007. Recent legislation like the College Cost Reduction Act (CCRA), which was signed into law in September 2007, will affect the size of the subsidy to the extent that changes were made to the maximum annual limits on Stafford loans, SAP rates, and interest rates. For more recent data, please reference "Viewing Education Through a Myopic Lens: A Revenue-Neutral Proposal for Accelerating Student Loan Subsidies", a Hamilton Project Discussion Paper published by the Brookings Institute, available at www.brookings.edu/projects/hamiltonproject/Research- Commentary.aspx. 1. Elaine M. Maag & Katie Fitzpatrick, Federal Financial Aid for Higher Education: Programs and Prospects, 2004 URBAN INSTITUTE 7 (2004), available at http://www.tax policycenter.org/ UploadedPDF/410996_federal_financial_aid.pdf; see also OFFICE OF MGMT. & BUDGET, EXEC. OFFICE OF THE PRESIDENT, BUDGET OF THE UNITED STATES GOVERNMENT, FISCAL YEAR 2002 (2001), available at http://www.gpoaccess.gov/usbudget/fy02/pdf/budget.pdf.
Transcript of UNDERSTANDING STUDENTS FROM A BEHAVIORAL … · annual limits on Stafford loans, SAP rates, and...
1- SIMA GANDHI- FINAL 3.DOC (DO NOT DELETE) 4/21/2008 2:47:31 PM
130
UNDERSTANDING STUDENTS FROM A BEHAVIORAL ECONOMICS PERSPECTIVE: HOW ACCELERATING
STUDENT LOAN SUBSIDIES GENERATES MORE BANG FOR THE BUCK♣
Sima J. Gandhi∗
INTRODUCTION**
Federal funding for higher education has played a substantial role in providing students with access to higher education from the 1944 direct subsidies of the GI Bill, to the 1965 subsidized student loans of the Higher Education Act (HEA), to the more recent tax credits and deductions of the 2001 tax bill. In 2002, federal financial aid for higher education totaled a staggering $105.1 billion dollars, or 5.8% of the federal budget.1 Despite the substantial amount of federal aid, higher education in America remains primarily for the well-off. About ninety percent of high school graduates from families earning more than $80,000 attend college by the time they are twenty-
♣ A policy-focused version of this paper won the Brookings Institute’s Hamilton Project Economic Policy Innovation Prize. ∗ By Sima J. Gandhi, Tax Attorney at Simpson Thacher & Bartlett, L.L.P. L.L.M. Tax Candidate, 2010, New York University School of Law; J.D. 2007, New York University School of Law; B.A. with Honors, 2004, Stanford University; B.S., 2004, Stanford University. My thanks to the 2006-07 Tax & Social Policy Seminar at NYU School of Law for their support and comments. My special thanks to Professor Lily Batchelder for her dedication, encouragement, and invaluable insight, without which this piece would not have been possible. ∗∗ The legislation and data referred to in this paper were current as of June, 2007. Recent legislation like the College Cost Reduction Act (CCRA), which was signed into law in September 2007, will affect the size of the subsidy to the extent that changes were made to the maximum annual limits on Stafford loans, SAP rates, and interest rates. For more recent data, please reference "Viewing Education Through a Myopic Lens: A Revenue-Neutral Proposal for Accelerating Student Loan Subsidies", a Hamilton Project Discussion Paper published by the Brookings Institute, available at www.brookings.edu/projects/hamiltonproject/Research-Commentary.aspx.
1. Elaine M. Maag & Katie Fitzpatrick, Federal Financial Aid for Higher Education: Programs and Prospects, 2004 URBAN INSTITUTE 7 (2004), available at http://www.tax policycenter.org/ UploadedPDF/410996_federal_financial_aid.pdf; see also OFFICE OF MGMT. & BUDGET, EXEC. OFFICE OF THE PRESIDENT, BUDGET OF THE UNITED STATES GOVERNMENT, FISCAL YEAR 2002 (2001), available at http://www.gpoaccess.gov/usbudget/fy02/pdf/budget.pdf.

1- SIMA GANDHI- FINAL 3.DOC (DO NOT DELETE) 4/21/2008 2:47:31 PM
2008] GANDHI: STUDENT LOAN SUBSIDIES 131
four, compared to only sixty percent from families earning less than $33,000.2 Widening income inequality and an increasingly skills-dependent economy raise a pressing question: how, given the substantial funds dedicated to subsidizing higher education, can the government most efficiently structure federal aid to induce more students to enter college.3
The bulk of the legal literature on federal funding for higher education focuses on the monetary inadequacy of the subsidies4 and the distributional inequities of the funding mechanisms.5 Still other scholars focus on complexity issues, arguing that consolidating different aid packages would decrease rule complexity and increase take-up.6 But no study to date has
2. Lawrence E. Gladieux, Low-Income Students and the Affordability of Higher Education, in AMERICA’S UNTAPPED RESOURCE: LOW-INCOME STUDENTS IN HIGHER EDUCATION 17, 20 (Richard D. Kahlenberg ed., 2004); see also Thomas J. Kane, College-Going and Inequality: A Literature Review, 2004 RUSSELL SAGE FOUND. 3, available at http://www.russellsage.org/ programs/main/inequality/050516.322671 (“The gaps by family income were particularly large in four-year college entrance, with 55 % of the highest-income youth attending a four-year college at some point and only 29 % of the lowest income youth.”).
3. See Maag & Fitzpatrick, supra note 1, at 8 (“The government subsidizes three kinds of education expenditures: the savings accumulated for college before a student enrolls, the costs incurred while a student attends college, and the costs carried over from college after a student completes his or her education.” While creating subsidies for saving is an important part of funding higher education, this paper specifically focuses on the decisional node presented to students at the time costs are incurred).
4. See, e.g., Jacqueline T. Albus, Comment, The Deduction for Interest on Student Loans: Relief is on the Way, 42 ST. LOUIS U. L.J. 591 (1998); Luize E. Zubrow, Is Loan Forgiveness Divine? Another View, 59 GEO. WASH. L. REV. 451 (1991); Amanda Sharkey, Paying for Postsecondary Education: An Issue Brief on College Costs & Financial Aid, 2005 CTR. FOR AM. PROGRESS, available at http://www.americanprogress.org/kf/ paying%20for%20postsecondary %20education%20final.pdf; Susan Dynarski, Loans, Liquidity, and Schooling Decisions (Nat’l Bureau of Econ. Research, Working Paper, 2002), available at http://ksghome.harvard.edu /~SDynarski/Dynarski_loans.pdf [hereinafter Dynarski, Loans]; SUSAN P. CHOY, XIAOJIE LI & C. DENNIS CARROLL, U.S. DEP’T OF EDUC., DEALING WITH DEBT: 1992-1993 BACHELOR’S DEGREE RECIPIENTS 10 YEARS LATER (2006), available at http://nces.ed.gov/pubs2006/ 2006156.pdf; Donald E. Heller, Merit Aid and College Access, 2006 WIS. CTR. FOR THE ADVANCEMENT OF POSTSECONDARY EDUC. available at http://www.personal.psu.edu/faculty/ d/e/deh29/papers/WISCAPE_2006_paper.pdf.
5. Scholars generally applaud funding increases for higher education, but reminiscent of Stanley Surrey, note that delivering funding through nonrefundable credits in the tax system presents the most benefits to wealthiest taxpayers who need financial aid the least. Surrey cautioned that certain tax benefits, like nonrefundable tax credits or below-the-line deductions, create upside-down subsidies because they are most likely to benefit those that least need help. See, e.g., Wayne M. Gazur, Abandoning Principles: Qualified Tuition Programs and Wealth Transfer Doctrine, 2 PITTSBURGH TAX REV. 1, 4 (2004); Albus, supra note 4, at 613; Joseph M. Dodge, Taxing Human Capital Acquisition Costs — Or Why Costs of Higher Education Should not be Deducted or Amortized, 54 OHIO ST. L.J. 927, 971 (1993); Maag & Fitzpatrick, supra note 1, at 7.
6. See, e.g., Susan M. Dynarski & Judith E. Scott-Clayton, The Cost of Complexity in Federal Student Aid: Lessons from Optimal Tax Theory and Behavioral Economics (Nat’l Bureau of Econ. Research, Working Paper No. 12227, 2006), available at http://www.nber.org/papers/ w12227; Julie-Anne Cronin, The Economic Effects and Beneficiaries of the Administration’s Proposed Higher Education Tax Subsidies, 50 NAT’L TAX J. 519 (1997); Vincent G. Kalafat, Rethinking Treasury Regulation § 1.162-5 and Slaying the Monster in the
1- SIMA GANDHI- FINAL 3.DOC (DO NOT DELETE) 4/21/2008 2:47:31 PM
132 KANSAS JOURNAL OF LAW & PUBLIC POLICY [Vol. XVII:2
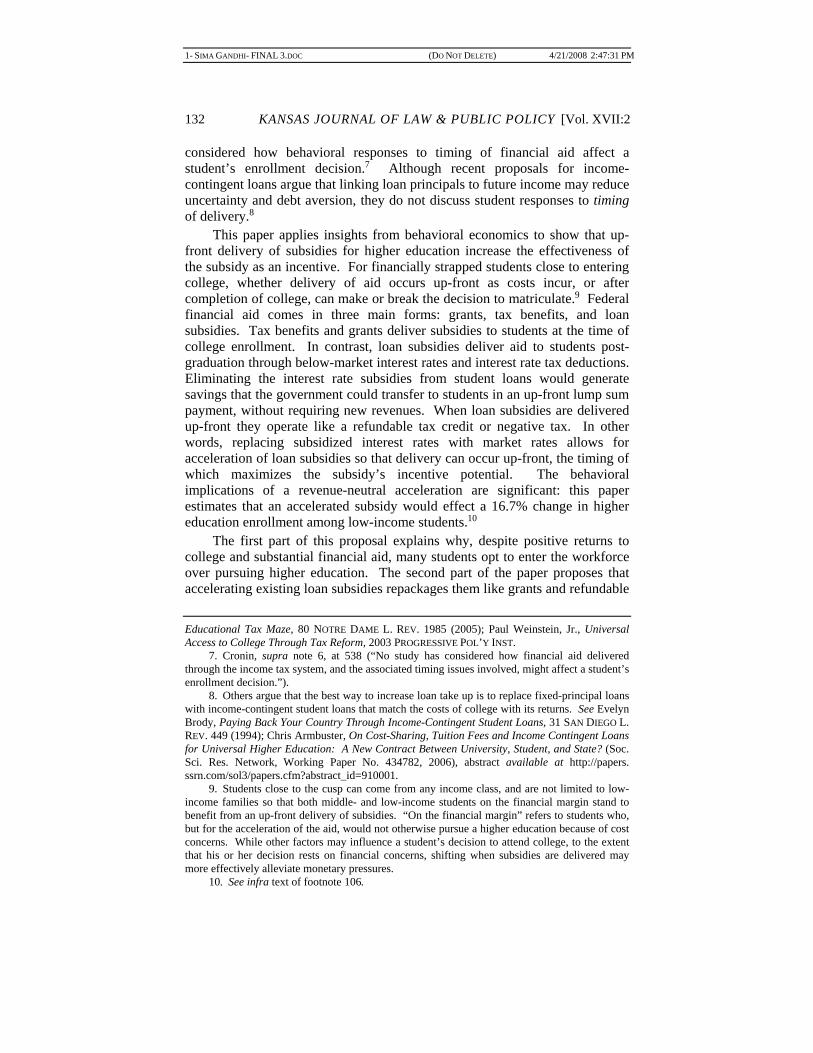
considered how behavioral responses to timing of financial aid affect a student’s enrollment decision.7 Although recent proposals for income-contingent loans argue that linking loan principals to future income may reduce uncertainty and debt aversion, they do not discuss student responses to timing of delivery.8
This paper applies insights from behavioral economics to show that up-front delivery of subsidies for higher education increase the effectiveness of the subsidy as an incentive. For financially strapped students close to entering college, whether delivery of aid occurs up-front as costs incur, or after completion of college, can make or break the decision to matriculate.9 Federal financial aid comes in three main forms: grants, tax benefits, and loan subsidies. Tax benefits and grants deliver subsidies to students at the time of college enrollment. In contrast, loan subsidies deliver aid to students post-graduation through below-market interest rates and interest rate tax deductions. Eliminating the interest rate subsidies from student loans would generate savings that the government could transfer to students in an up-front lump sum payment, without requiring new revenues. When loan subsidies are delivered up-front they operate like a refundable tax credit or negative tax. In other words, replacing subsidized interest rates with market rates allows for acceleration of loan subsidies so that delivery can occur up-front, the timing of which maximizes the subsidy’s incentive potential. The behavioral implications of a revenue-neutral acceleration are significant: this paper estimates that an accelerated subsidy would effect a 16.7% change in higher education enrollment among low-income students.10
The first part of this proposal explains why, despite positive returns to college and substantial financial aid, many students opt to enter the workforce over pursuing higher education. The second part of the paper proposes that accelerating existing loan subsidies repackages them like grants and refundable Educational Tax Maze, 80 NOTRE DAME L. REV. 1985 (2005); Paul Weinstein, Jr., Universal Access to College Through Tax Reform, 2003 PROGRESSIVE POL’Y INST.
7. Cronin, supra note 6, at 538 (“No study has considered how financial aid delivered through the income tax system, and the associated timing issues involved, might affect a student’s enrollment decision.”).
8. Others argue that the best way to increase loan take up is to replace fixed-principal loans with income-contingent student loans that match the costs of college with its returns. See Evelyn Brody, Paying Back Your Country Through Income-Contingent Student Loans, 31 SAN DIEGO L. REV. 449 (1994); Chris Armbuster, On Cost-Sharing, Tuition Fees and Income Contingent Loans for Universal Higher Education: A New Contract Between University, Student, and State? (Soc. Sci. Res. Network, Working Paper No. 434782, 2006), abstract available at http://papers. ssrn.com/sol3/papers.cfm?abstract_id=910001.
9. Students close to the cusp can come from any income class, and are not limited to low-income families so that both middle- and low-income students on the financial margin stand to benefit from an up-front delivery of subsidies. “On the financial margin” refers to students who, but for the acceleration of the aid, would not otherwise pursue a higher education because of cost concerns. While other factors may influence a student’s decision to attend college, to the extent that his or her decision rests on financial concerns, shifting when subsidies are delivered may more effectively alleviate monetary pressures.
10. See infra text of footnote 106.
1- SIMA GANDHI- FINAL 3.DOC (DO NOT DELETE) 4/21/2008 2:47:31 PM
2008] GANDHI: STUDENT LOAN SUBSIDIES 133
tax credits, both of which would maximize efficiency by increasing students’ behavioral response. Finally, this paper illustrates the practical behavioral impact of accelerated loan subsidies on students from different income classes.
I. THE CASE FOR UP-FRONT HIGHER EDUCATION SUBSIDIES: INCREASING EFFICIENCY WITHOUT INCREASING COSTS
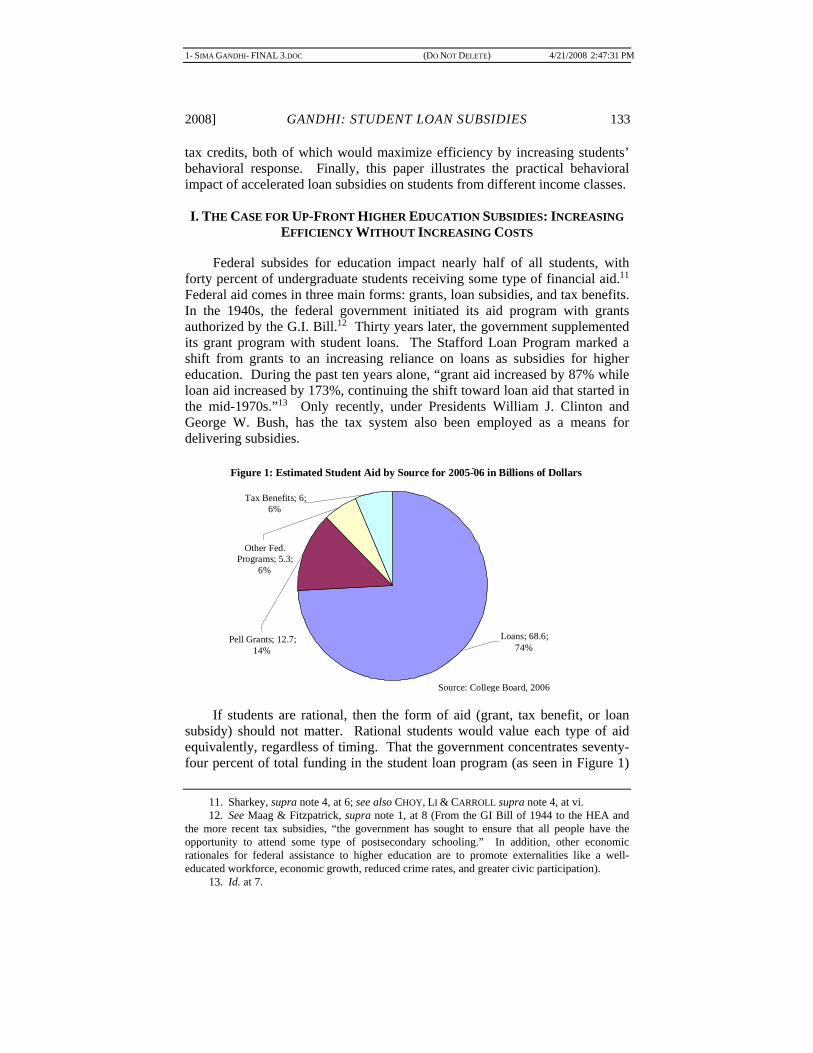
Federal subsides for education impact nearly half of all students, with forty percent of undergraduate students receiving some type of financial aid.11 Federal aid comes in three main forms: grants, loan subsidies, and tax benefits. In the 1940s, the federal government initiated its aid program with grants authorized by the G.I. Bill.12 Thirty years later, the government supplemented its grant program with student loans. The Stafford Loan Program marked a shift from grants to an increasing reliance on loans as subsidies for higher education. During the past ten years alone, “grant aid increased by 87% while loan aid increased by 173%, continuing the shift toward loan aid that started in the mid-1970s.”13 Only recently, under Presidents William J. Clinton and George W. Bush, has the tax system also been employed as a means for delivering subsidies.
If students are rational, then the form of aid (grant, tax benefit, or loan
subsidy) should not matter. Rational students would value each type of aid equivalently, regardless of timing. That the government concentrates seventy-four percent of total funding in the student loan program (as seen in Figure 1)
11. Sharkey, supra note 4, at 6; see also CHOY, LI & CARROLL supra note 4, at vi. 12. See Maag & Fitzpatrick, supra note 1, at 8 (From the GI Bill of 1944 to the HEA and
the more recent tax subsidies, “the government has sought to ensure that all people have the opportunity to attend some type of postsecondary schooling.” In addition, other economic rationales for federal assistance to higher education are to promote externalities like a well-educated workforce, economic growth, reduced crime rates, and greater civic participation).
13. Id. at 7.
Figure 1: Estimated Student Aid by Source for 2005-06 in Billions of Dollars -
Tax Benefits; 6;
6%
Other Fed. Programs; 5.3; 6%
Pell Grants; 12.7; 14% Loans; 68.6;
74%
Source: College Board, 2006

1- SIMA GANDHI- FINAL 3.DOC (DO NOT DELETE) 4/21/2008 2:47:31 PM
134 KANSAS JOURNAL OF LAW & PUBLIC POLICY [Vol. XVII:2
should not matter as much as the total value of aid available. However, in challenging classical economic assumptions about rational actors, behavioral economic theories of loss aversion and myopia suggest that the size of the subsidy is actually secondary to when such subsidies are delivered.14 Behavioral economists argue that students behave irrationally, and as a result, value money now more than later. The policy implication for student aid is significant: the government should front-load savings in order to maximize students’ behavioral response because any given subsidy amount will generate a larger behavioral response in student enrollment simply by virtue of its earlier delivery. Indeed, empirical studies also suggest that college enrollment is more sensitive to grant aid than loan aid.15 (“Replacing the loan portion of a financial aid package with a grant increased matriculation by 3%,” Linsenmeier 2001; “Psychic cost of holding debt affects how students value otherwise equivalent monetary options,” Field 2006; “$1,000 of grant aid increased college enrollment by 3.6%,” Dynarski 2003). Collectively, behavioral economics and empirical evidence present a compelling case for concentrating subsidies to education up-front at the time a student incurs costs.
This section first explains how students should operate under the traditional economic assumptions that characterize agents as rational. Under classic economic theory, if the returns to education outweigh the costs, students as rational investors will not hesitate to select higher education over immediate labor-force entry because the former ultimately maximizes wealth.16
The second part of this section discusses the behavioral theories of myopia and loss aversion, which suggest that students may not operate under classical economic assumptions. Despite the positive internal rate of return or higher education, on top of which the government provides subsidies and financial aid, students do not always choose to invest in higher education.
14. The concepts of myopia and loss aversion stem from Kahneman and Tversky’s Prospect Theory. In prospect theory, utility-maximizing outcomes are not calculated by simply multiplying the value of an outcome with its probability. Rather, the value of an outcome is defined in terms of gains and losses according to deviations from a reference point. Losses loom larger than gains, meaning that responses to loss are more extreme than responses to gains. Because gains and losses are measured relative to a reference point, how one frames the reference point affects the perception of a gain or loss. In this sense, subjective perception significantly affects outcomes. See Daniel Kahneman, Maps of Bounded Reality: Psychology for Behavioral Economics, 93 AM. ECON. REV. 1449, 1456 (2003); Richard H. Thaler, et. al., The Effect of Myopia and Loss Aversion on Risk Taking: An Experimental Test, 112 Q. J. OF ECON. 647, 650-51 (1997); Amos Tversky & Daniel Kahneman, Rational Choice and the Framing of Decisions, J. OF BUS., Oct. 1986, at S251, S263.
15. Maag & Fitzpatrick, supra note 1, at 23; see also Susan Dynarski, Does Aid Matter? Measuring the Effect of Student Aid on College Attendance and Completion, 93 AM. ECON. REV. 279 (2003)[hereinafter Dynarski, Does Aid Matter?]; David Linsenmeier, Harvey S. Rosen & Cecilia Elena, Financial Aid Packages and College Enrollment Decisions: An Econometric Case Study (Nat’l Bureau of Econ. Research, Working Paper No. 9228, 2002), available at http://papers.ssrn.com/sol3/papers.cfm?abstract_id=332272#PaperDownload (“Replacing the loan portion of a financial aid package with a grant increased matriculation by 3%,”); LARRY LESLIE & PAUL BRINKMAN, THE ECONOMIC VALUE OF HIGHER EDUCATION (1988).
16. See Dodge, supra note 5.

1- SIMA GANDHI- FINAL 3.DOC (DO NOT DELETE) 4/21/2008 2:47:31 PM
2008] GANDHI: STUDENT LOAN SUBSIDIES 135
When students operate irrationally, their cost-benefit calculations return distorted outcomes that result in poor decision-making.17
The third part of this section examines the empirical literature which finds that, in line with behavioral economists’ prediction, up-front subsidies generate a larger student enrollment response.
A: Higher Education Generates Positive Returns
In adopting the neo-classical assumption that people are rational utility-maximizers, the Chicago School’s economists put forth the Human Capital Hypothesis (HCH). The HCH posits that the costs of higher education should not be subsidized because the high returns to education more than compensate for the initial costs. In taking as its baseline assumption that students are rational, the HCH argues that students presented with the choice between a higher education and entering the workforce would choose the former because the returns result in a higher expected state of wealth. Accordingly, all education subsidies – including subsidized loans, grants, and tax benefits – essentially pay a student to make money.
In fact, studies support the HCH’s tenet that college graduates enjoy high
financial returns to their education. In 2003, the average full-time worker with a four-year college degree earned $49,900, 62% more than the $30,800 earned
17. Tversky & Kahneman, supra note 14, at S274 (Actual decisions involving significant
monetary payoffs remain subject to decisional errors caused by myopic loss aversion. “In particular,” myopic loss aversion causes “elementary blunders of probabilistic reasoning, major inconsistencies of choice, and violations of stochastic dominance” in real life problems).
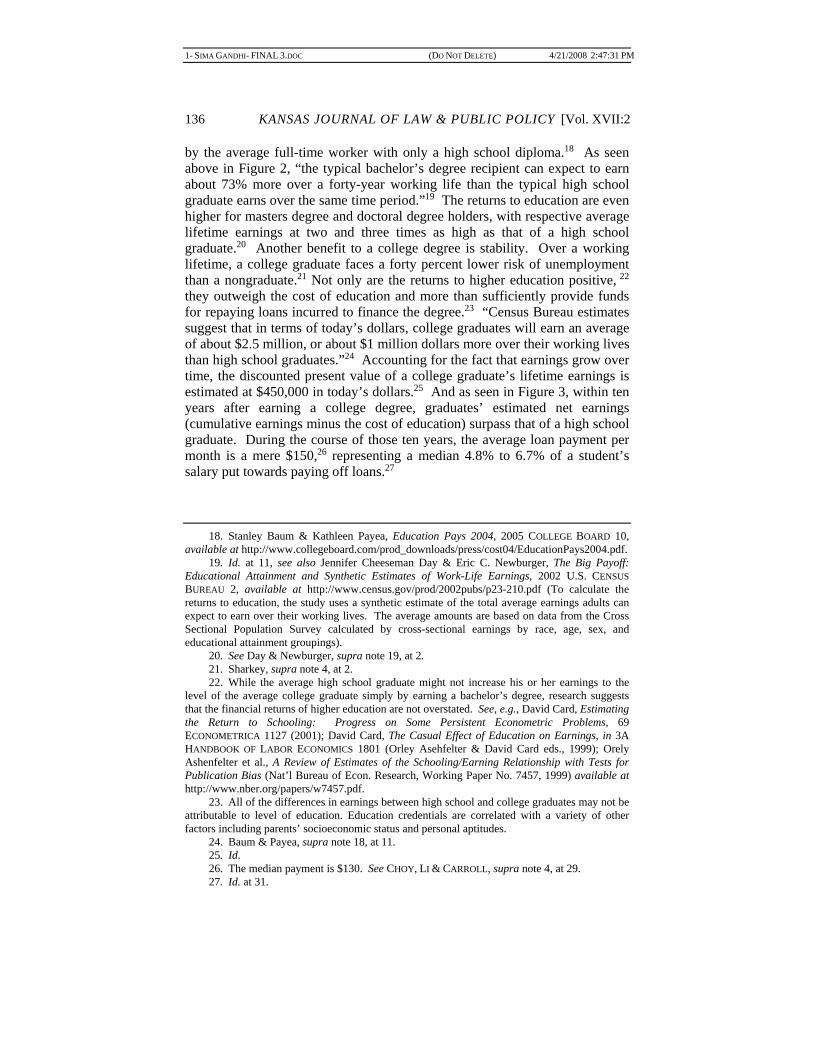
Figure 2: Expected Lifetime Earnings Relative to a High School Graduate, By Education Level (in 1999 dollars)
Not a High School Graduate, 0.73
High School Graduate, 1.00
Some College 1.20
Associate's Degree 1.27
Bachelor's Degree 1.75
Master's Degree 2.10
Doctoral Degree 3.14
Professional Degree 3.83
0.00
0.50
1.00
1.50
2.00
2.50
3.00
3.50
4.00
4.50
Earnings Ratio
Source: Day and Newbuger, 2002. Calculations by Author.
1- SIMA GANDHI- FINAL 3.DOC (DO NOT DELETE) 4/21/2008 2:47:31 PM
136 KANSAS JOURNAL OF LAW & PUBLIC POLICY [Vol. XVII:2
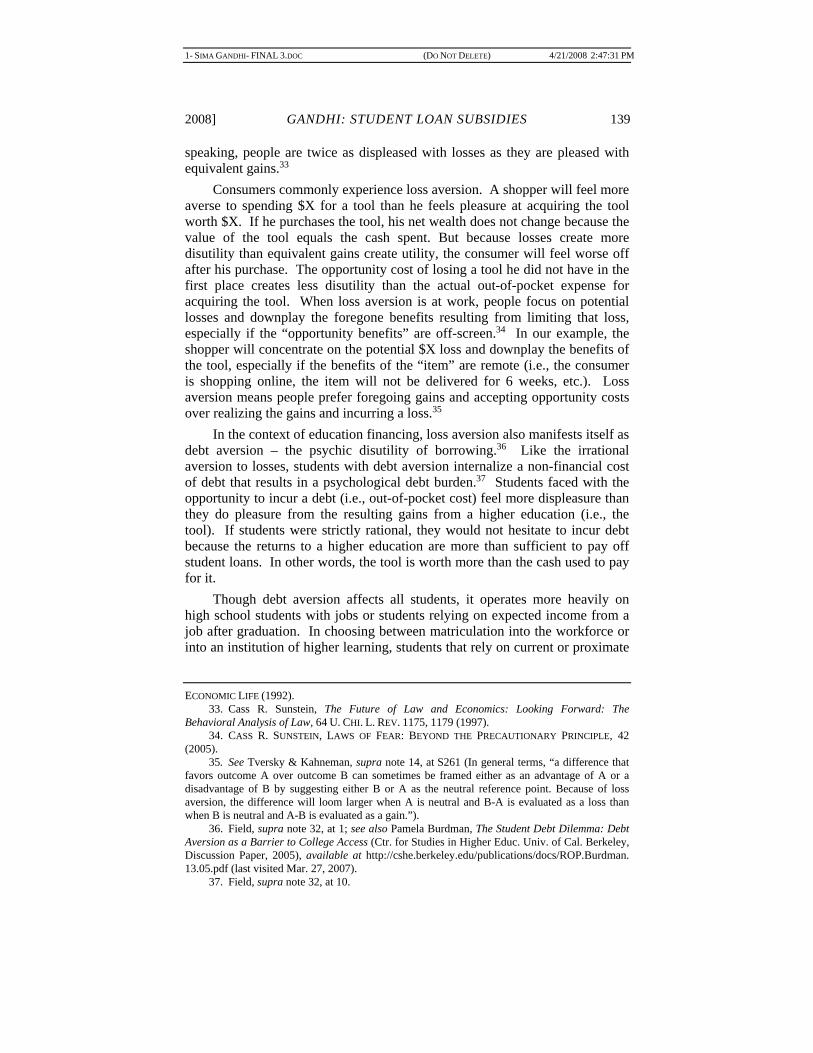
by the average full-time worker with only a high school diploma.18 As seen above in Figure 2, “the typical bachelor’s degree recipient can expect to earn about 73% more over a forty-year working life than the typical high school graduate earns over the same time period.”19 The returns to education are even higher for masters degree and doctoral degree holders, with respective average lifetime earnings at two and three times as high as that of a high school graduate.20 Another benefit to a college degree is stability. Over a working lifetime, a college graduate faces a forty percent lower risk of unemployment than a nongraduate.21 Not only are the returns to higher education positive, 22 they outweigh the cost of education and more than sufficiently provide funds for repaying loans incurred to finance the degree.23 “Census Bureau estimates suggest that in terms of today’s dollars, college graduates will earn an average of about $2.5 million, or about $1 million dollars more over their working lives than high school graduates.”24 Accounting for the fact that earnings grow over time, the discounted present value of a college graduate’s lifetime earnings is estimated at $450,000 in today’s dollars.25 And as seen in Figure 3, within ten years after earning a college degree, graduates’ estimated net earnings (cumulative earnings minus the cost of education) surpass that of a high school graduate. During the course of those ten years, the average loan payment per month is a mere $150,26 representing a median 4.8% to 6.7% of a student’s salary put towards paying off loans.27
18. Stanley Baum & Kathleen Payea, Education Pays 2004, 2005 COLLEGE BOARD 10, available at http://www.collegeboard.com/prod_downloads/press/cost04/EducationPays2004.pdf.
19. Id. at 11, see also Jennifer Cheeseman Day & Eric C. Newburger, The Big Payoff: Educational Attainment and Synthetic Estimates of Work-Life Earnings, 2002 U.S. CENSUS BUREAU 2, available at http://www.census.gov/prod/2002pubs/p23-210.pdf (To calculate the returns to education, the study uses a synthetic estimate of the total average earnings adults can expect to earn over their working lives. The average amounts are based on data from the Cross Sectional Population Survey calculated by cross-sectional earnings by race, age, sex, and educational attainment groupings).
20. See Day & Newburger, supra note 19, at 2. 21. Sharkey, supra note 4, at 2. 22. While the average high school graduate might not increase his or her earnings to the
level of the average college graduate simply by earning a bachelor’s degree, research suggests that the financial returns of higher education are not overstated. See, e.g., David Card, Estimating the Return to Schooling: Progress on Some Persistent Econometric Problems, 69 ECONOMETRICA 1127 (2001); David Card, The Casual Effect of Education on Earnings, in 3A HANDBOOK OF LABOR ECONOMICS 1801 (Orley Asehfelter & David Card eds., 1999); Orely Ashenfelter et al., A Review of Estimates of the Schooling/Earning Relationship with Tests for Publication Bias (Nat’l Bureau of Econ. Research, Working Paper No. 7457, 1999) available at http://www.nber.org/papers/w7457.pdf.
23. All of the differences in earnings between high school and college graduates may not be attributable to level of education. Education credentials are correlated with a variety of other factors including parents’ socioeconomic status and personal aptitudes.
24. Baum & Payea, supra note 18, at 11. 25. Id. 26. The median payment is $130. See CHOY, LI & CARROLL, supra note 4, at 29. 27. Id. at 31.

1- SIMA GANDHI- FINAL 3.DOC (DO NOT DELETE) 4/21/2008 2:47:31 PM
2008] GANDHI: STUDENT LOAN SUBSIDIES 137
Given the overwhelming data on the benefits to higher education, the
HCH fails to explain why disparities in enrollment rates between high-income and low-income students exist. If students are rational utility-maximizing investors who recognize the returns to education, they should matriculate even without subsidies. Under the HCH, students without the funds to finance the education will simply take out loans to front the initial expense because they recognize that the future financial and increased income from a higher education outweigh the current costs. Yet disturbingly, college enrollment rates show stark disparities by family income level. “In 2001, 80% of high-income high-school graduates aged 16-23 enrolled in college by the October after graduation, compared to only 44% of graduates from low-income families.”28 Despite the minimal burden of loan repayments on salaries and the overwhelming data on the positive returns to a college education, seventy-one percent of Americans believe that a four-year college education is not affordable and sixty-five percent of Americans list the cost of a college education as a top concern.29 Clearly, students do not operate within neo-classical paradigms where choices are made strictly based on financial terms.
B: Students Fail to Invest in Higher Education because They Exhibit Myopic Loss Aversion
Although a confluence of factors including societal pressure or simply a lack of desire may affect a student’s decision to attend college, to the extent
28. Sharkey, supra note 4, at 1. 29. Weinstein, supra note 6, at 3.
Source: Education Pays, Figure 3 in College Board 2004 at 11.
Figure 3: Estimated Cumulative Earnings Net College Costs

1- SIMA GANDHI- FINAL 3.DOC (DO NOT DELETE) 4/21/2008 2:47:31 PM
138 KANSAS JOURNAL OF LAW & PUBLIC POLICY [Vol. XVII:2
that the decision is based on financial concerns, behavioral economic theories suggest that students’ failure to invest is irrational and that up-front subsidies may best combat such irrationality. Behavioral economic theories suggest that because students are loss averse and myopic, they will value front-loaded subsidies more than the delayed subsidies provided through loans.30 Nevertheless, Stafford loans grew from 28% of total financial aid in 1995 to more than half in 2006, having increased during the 1990s alone by 173%.31 As Figure 4 shows, the growing shift from up-front grants towards Stafford loans means that the lion’s share of education subsidies are delivered via loans after students complete their education. From a behavioral economics perspective, this divergence away from grants to loans is troublesome because it is inefficient.
1. Loss Aversion and Debt Aversion: Irrational Exhibitions of Behavior
A conventional assumption of economics is that people will rationally discount costs and benefits of alternate courses of action to present value and evaluate them equally without bias. However, loss aversion posits that losses generate more disutility than equivalent gains do utility, such that people exhibit biases against losses like out-of-pocket expenses and debt.32 Roughly
30. See supra note 14 for the discussion on myopia and loss aversion. 31. Maag & Fitzpatrick, supra note 1, at 7. 32. See Erica Field, Educational Debt Burden and Career Choice: Evidence from a
Financial Aid Experiment at NYU Law School, 1 (Nat’l Bureau of Econ. Research, Working Paper No. 12282, 2006), available at http://www.nber.org/papers/w12282 (Loss aversion posits that individuals are not standard expected-utility-maximizers in the sense that they associate higher disutility with a loss than the utility associated with an equivalent gain. If individuals evaluate going into debt and payment concurrently, then debt aversion stems from pre-existing tendencies toward loss aversion. Thus, if debt averse individuals are also characterized by loss averse preferences, reactions toward debt are understood by the same analysis applied to loss aversion); See also RICHARD THALER, THE WINNER’S CURSE: PARADOXES AND ANOMALIES OF
Figure 4: Ten-Year Trend In Financing of Postsecondary Education Expenses, 1995-96 to 2005-06
Source: Trends in Higher Education, Figure 1 in College Board 2006, at 4.
1- SIMA GANDHI- FINAL 3.DOC (DO NOT DELETE) 4/21/2008 2:47:31 PM
2008] GANDHI: STUDENT LOAN SUBSIDIES 139
speaking, people are twice as displeased with losses as they are pleased with equivalent gains.33
Consumers commonly experience loss aversion. A shopper will feel more averse to spending $X for a tool than he feels pleasure at acquiring the tool worth $X. If he purchases the tool, his net wealth does not change because the value of the tool equals the cash spent. But because losses create more disutility than equivalent gains create utility, the consumer will feel worse off after his purchase. The opportunity cost of losing a tool he did not have in the first place creates less disutility than the actual out-of-pocket expense for acquiring the tool. When loss aversion is at work, people focus on potential losses and downplay the foregone benefits resulting from limiting that loss, especially if the “opportunity benefits” are off-screen.34 In our example, the shopper will concentrate on the potential $X loss and downplay the benefits of the tool, especially if the benefits of the “item” are remote (i.e., the consumer is shopping online, the item will not be delivered for 6 weeks, etc.). Loss aversion means people prefer foregoing gains and accepting opportunity costs over realizing the gains and incurring a loss.35
In the context of education financing, loss aversion also manifests itself as debt aversion – the psychic disutility of borrowing.36 Like the irrational aversion to losses, students with debt aversion internalize a non-financial cost of debt that results in a psychological debt burden.37 Students faced with the opportunity to incur a debt (i.e., out-of-pocket cost) feel more displeasure than they do pleasure from the resulting gains from a higher education (i.e., the tool). If students were strictly rational, they would not hesitate to incur debt because the returns to a higher education are more than sufficient to pay off student loans. In other words, the tool is worth more than the cash used to pay for it.
Though debt aversion affects all students, it operates more heavily on high school students with jobs or students relying on expected income from a job after graduation. In choosing between matriculation into the workforce or into an institution of higher learning, students that rely on current or proximate
ECONOMIC LIFE (1992).
33. Cass R. Sunstein, The Future of Law and Economics: Looking Forward: The Behavioral Analysis of Law, 64 U. CHI. L. REV. 1175, 1179 (1997).
34. CASS R. SUNSTEIN, LAWS OF FEAR: BEYOND THE PRECAUTIONARY PRINCIPLE, 42 (2005).
35. See Tversky & Kahneman, supra note 14, at S261 (In general terms, “a difference that favors outcome A over outcome B can sometimes be framed either as an advantage of A or a disadvantage of B by suggesting either B or A as the neutral reference point. Because of loss aversion, the difference will loom larger when A is neutral and B-A is evaluated as a loss than when B is neutral and A-B is evaluated as a gain.”).
36. Field, supra note 32, at 1; see also Pamela Burdman, The Student Debt Dilemma: Debt Aversion as a Barrier to College Access (Ctr. for Studies in Higher Educ. Univ. of Cal. Berkeley, Discussion Paper, 2005), available at http://cshe.berkeley.edu/publications/docs/ROP.Burdman. 13.05.pdf (last visited Mar. 27, 2007).
37. Field, supra note 32, at 10.

1- SIMA GANDHI- FINAL 3.DOC (DO NOT DELETE) 4/21/2008 2:47:31 PM
140 KANSAS JOURNAL OF LAW & PUBLIC POLICY [Vol. XVII:2
incomes will register greater disutility from losing income than they will feel utility from the distant returns of a college education. In contrast, financially secure students who do not rely on current or proximate incomes will not register losses upon matriculation, and hence feel minimal disutility. Consequently, debt-averse students will be more willing to accept the opportunity cost of refusing to take on debt to finance college than they will be willing to incur the debt itself. For these debt-averse students, the opportunity cost is a college education. 2. Myopia & Hyperbolic Discounting: Now is Always Better
In addition to loss aversion, the increased sensitivity to decreases in wealth over equivalent increases, people exhibit irrational behavior by hyperbolically discounting. Since R.H. Stroz’s 1955 paper, economists have known that intertemporal choices are time consistent only if people discount using a constant discount rate over time.38 But substantial empirical evidence points to the fact that people’s preferences are dynamically inconsistent. More specifically, people act myopically because they hyperbolically discount – they weigh current and near-term consumption more heavily than future consumption.39
Hyperbolic discount functions are characterized by a relatively high discount rate over short horizons and a relatively low discount rate over long horizons.40 For example, consider a choice between two rewards: a small reward at time t, (St); and a big one at time t + 1, B(t+1). When t is far off, agents prefer B(t+1) since the difference in the value of the prizes exceeds the perceived costs of waiting. But as t approaches zero, the ratio of discounted value increases, causing people to switch their preferences. Such present-biased preferences can be captured with models that employ hyperbolic discounting.41
Myopic choices are often explained as due to hyperbolic discounting, meaning that a person’s preference for one alternative over another may be due to its proximity, not its magnitude.42 A freshman in high school may be more comfortable with the idea of going to college because both the costs and benefits are far in the future. As high school graduation nears and the idea of going to college becomes a reality, the student may grow uncomfortable because the costs are now short-term while the benefits are still far off in the
38. See generally R.H. Stroz, Myopia and Inconsistency in Dynamic Utility Maximization,
23 REV. ECON. STUD. 165 (1955) (In other words, people must weigh the future equally with the present).
39. Richard H. Thaler & Shlomo Benartzi, Save More Tomorrow: Using Behavioral Economics to Increase Employee Saving, 112 J. POL. ECON. S164, S167-68 (2004).
40. David Laibson, Golden Eggs and Hyperbolic Discounting, 112 MIT PRESS Q. J. ECON. 443, 445 (1997).
41. Thaler & Benartzi, supra note 39, at S167-68; See also Laibson, supra note 40, at 445. 42. George Ainslie & John Monterosso, Symposium: Preferences and Rational Choice:
New Perspectives and Legal Implications: Will as Intertemporal Bargaining: Implications for Rationality, 151 U. PA. L. REV. 825, 832-33 (2003).

1- SIMA GANDHI- FINAL 3.DOC (DO NOT DELETE) 4/21/2008 2:47:31 PM
2008] GANDHI: STUDENT LOAN SUBSIDIES 141
future. Students who invest in education are influenced by the returns to
education, but they evaluate such returns on a short evaluation period.43 Surveys of college students indicate that future earnings are strongly considered by many, but not all, students. Moreover, when considered, in contrast to Milton’s permanent income hypothesis, “earnings appear to be viewed mainly in terms of starting salaries as opposed to lifetime earning curves.”44 Actual behavior deviates from that predicted by Friedman’s hypothesis for an assortment of reasons: (1) hyperbolic discounting results in self-control and procrastination problems that favor the status quo,45 and (2) given that a student does not start realizing income until time t+4 (assuming a four-year college program), at time t a student’s minimal wealth may result in an undervaluation of future income.46
The consequence of myopia is that students hyperbolically discount both the growth rate of their future earnings and the earnings itself, resulting in a massive tendency towards undervaluing the total returns to education. Though the present value of the average college graduate’s lifetime earnings equals $450,000, myopic students measure the returns to college by hyperbolically discounting their expected salary upon graduation instead of their lifetime earnings per the PIH. For a student weighing the immediate costs of education (including opportunity costs) against such future earnings, hyperbolic discounting means future benefits are undervalued and present costs are overvalued. The resulting assessment – to forego the education – is a myopic decision based not on faulty information, but on a psychological preference for present consumption. It is not surprising that empirical data indicates price reductions result in larger student enrollment responses for low-income students. For lower-income students, decreasing the price of education decreases the risk incurred and tips the balance in the cost-benefit calculation.
Loss aversion, in conjunction with the myopic preference for money now over later, means the irrational exhibition of myopic loss aversion disproportionately manifests itself in working students who must forego current income and in students relying on proximate earnings from a paying-
43. Dodge, supra note 16, at 940. 44. See generally Milton Friedman, A Theory of the Consumption Function, Nat’l Bureau of
Econ. Research (1957) (Milton Friedman’s Permanent Income Hypothesis (PIH) represents a classic example of long-term framing in the rational model. According to the PIH, the choices made by a consumer about his consumption patterns are determined not by current income but by their longer-term income expectations.); See Dodge, supra note 16, at 940 (However, empirical evidence indicates people do not consume consistently – they actually overconsume during their high-income years, and underconsume early and late in their lifetime. Behavioral economists explain the discrepancy between PIH theory and reality by proposing that people mentally account for their assets by dividing them up into different types of assets – current income, current assets (savings), and capital income. Framing such economically equivalent assets differently results in decision-making that relies heavily on immediate consequences.).
45. Thaler & Benartzi, supra note 39, at 169. 46. Dodge, supra note 5, at 940.

1- SIMA GANDHI- FINAL 3.DOC (DO NOT DELETE) 4/21/2008 2:47:31 PM
142 KANSAS JOURNAL OF LAW & PUBLIC POLICY [Vol. XVII:2
job upon high school graduation.47 Students from financially secure backgrounds do not experience the same level of disutility generated from taking out loans as working students, who view every dollar in loans as an out-of-pocket expense that creates a two-fold disutility over every dollar gained through higher education. In contrast, students who do not need to take out loans face no losses, and hence operate outside behavioral patterns predicted by myopic loss aversion. Because their losses are minimal, undervaluation of future returns does not alter their cost-benefit calculation. On the other hand, enrollment responses are “either small or nonexistent for middle and high-income students,” indicating that price is not as significant a factor in matriculation decisions. 48 Overall, to the extent that price subsidies do affect a student’s decision to enroll, future delivery of a price subsidy reduces its effectiveness because its value is hyperbolically discounted, thus diminishing its ability to offset the debt aversion experienced at the time enrollment.
C: Empirical Studies Strongly Suggest Up-Front Subsidies Increase Efficiency
Although behavioral economic theories explain why up-front subsidies for higher education maximize efficiency, empirical studies substantiate theory with findings that strongly suggest college enrollment is more sensitive to grant aid than loan aid.49 The stronger behavioral response to up-front subsidies occurs because myopic loss averse students do not undervalue up-front subsidies like grants and tax benefits (assuming they can realize the benefit from nonrefundable credits). In contrast, myopic loss-averse students will fail to fully internalize the value of dilatory aid from loan subsidies.
A grant’s strong incentive effect stems from its immediately tangible benefits.50 Delivering grants when a student incurs costs means it acts like a price subsidy, and studies indicate that lower costs of tuition yield measurable results on college attendance.51 For example, Manski and Wise found that Pell
47. See generally CHOY, LI & CARROLL, supra note 4 (Working students who are dependent on their income tend to be concentrated among lower-income families. For students with parents that lack the financial resources to help them repay the loans if the student cannot do so by themselves, the risk associated with the loan can compound the underlying behavior initiated by loss aversion).
48. Julie-Anne Cronin, supra note 6, at 538. 49. See Maag & Fitzpatrik, supra note 1, at 21; see also Susan Dynarski, The Behavioral
and Distributional Implications of Aid for College, 92 AM. ECON. REV. 279, 279-85 (2002); David Linsenmeier, Harvey S. Rosen & Cecilia Rouse, Financial Aid Packages and College Enrollment Decisions: An Econometric Case Study, (Princeton Univ. Indus. Relations Section, Working Paper No. 9228, 2002); LARRY L. LESLIE & PAUL T. BRINKMAN, THE ECONOMIC VALUE OF HIGHER EDUCATION (1988).
50. See MAAG & FITZPATRIK, supra note 1, at 21; see also Susan Dynarski, Does Aid Matter? Measuring the Effect of Student Aid on College Attendance and Completion, 93 AM. ECON. REV., 279, 279-88 (2003).
51. Dynarski, supra note 4; see also, MICHAEL MCPHERSON & MORTON OWEN SCHAPIRO, KEEPING COLLEGE AFFORDABLE: GOVERNMENT AND EDUCATIONAL OPPORTUNITY, 45 (Brookings Institution Press 1991).

1- SIMA GANDHI- FINAL 3.DOC (DO NOT DELETE) 4/21/2008 2:47:31 PM
2008] GANDHI: STUDENT LOAN SUBSIDIES 143
Grants substantially affect rates of enrollment, estimating drops in enrollment rates of twenty-one percent if the program ceased.52 In another study, a mere $1,000 increase in grant aid produced a four-percentage point increase in college attendance rates by recent high school graduates.53 A review of twenty-five different studies by Leslie and Brinkman suggests that price increases result in lower enrollment, but that student aid in the form of grants increases enrollment by effectively reducing tuition costs. They estimate that at least twenty percent of enrollment by lower-income and thirteen percent of enrollment by middle-income students is due to the availability of grant aid.54 Although a Pell Grant only provides a minimal portion of a student’s total tuition costs,55studies indicate that its redeeming characteristics stem from its time of delivery (when the student enrolls) and from the fact that the grant does not eventually need to be repaid.
Although grants clearly increase matriculation, the effect of loans on enrollment is not as convincing. Erica Field analyzes experimental data from NYU Law School’s Financial Aid Study in which two career-contingent financial aid packages were randomly assigned to participating admits.56 Students agreeing to accept public interest jobs upon graduation were eligible for an aid package with up-front tuition waivers or post-graduation debt forgiveness. In present value terms, the amount of debt forgiven equaled the tuition waiver. Because the packages had equivalent monetary values and differed only in the duration of indebtedness, differences in career choices associated with financial aid assignment can be attributed to psychological debt aversion. Field found that participants randomly assigned to the low-debt package were nearly twice as likely to enroll, and that for entering classes where lottery winners were announced post-matriculation, students with the low-debt package had a 36-45% higher rate of accepting a job in public interest law upon graduation. 57 Field concluded that psychological debt aversion affects how students value otherwise equivalent monetary options. In a related
52. MCPHERSON & SCHAPIRO, supra note 51, at 46; See also CHARLES F. MANKSI &
DAVID WISE, COLLEGE CHOICE IN AMERICA (Harvard Univ. Press 1983). 53. Thomas J. Kane, College Entry by Blacks since 1970: The Role of College Costs,
Family Background, and the Returns to Education, 102 J. POL. ECON. 878, 882-83 (1994); see also Susan Dynarski, supra note 50, at 282 (Noting $1,000 of student benefits increased college enrollment rates among those eligible by 3.6% and increased the number of years of schooling by one year); Thomas J. Kane, An Evaluation of the CalGrant Program, (Nov. 20, 2003) (CalGrants increased college enrollment among those eligible by 3-4 percentage points.); LESLIE & BRINKMAN, supra note 49.
54. LESLIE & BRINKMAN, supra note 49. 55. See Larry D. Singell & Joe A. Stone, For Whom the Pell Tolls: The Response of
University Tuition to Federal Grants-in-Aid, (Univ. Or., Working Paper, 2004) available at http://darkwing.uoregon.edu/~lsingell/Pell_Bennett.pdf (despite concerns about the Bennett hypothesis (the appropriation of Pell Grants by colleges through tuition hikes), studies on the effectiveness of Pell Grants show a strong correlation between the amount of the grant and the enrollment response).
56. Field, supra note 32. 57. Id.

1- SIMA GANDHI- FINAL 3.DOC (DO NOT DELETE) 4/21/2008 2:47:31 PM
144 KANSAS JOURNAL OF LAW & PUBLIC POLICY [Vol. XVII:2
study, Linsenmeier, Rosen, and Rouse examined the financial aid package at Northeastern University. When Northeastern replaced the loan portion of its aid packages with grants, matriculation by low-income and low-income minority students increased.58 By changing the composition rather than the amount of the aid, the program increased the likelihood of enrollment for low-income students by about three percentage points, with an effect on low-income minority students at approximately eight to ten percentage points.59 In a more targeted study, Dynarski focused on identifying the impact of loan subsidies on matriculation. She found that enrollment did not increase at a statistically significant level when students were provided with subsidized loans, a type of loan that bears close resemblance to a price subsidy because the government pays interest while the student is in school.60 Despite the substantial subsidy, students did not internalize the benefit because they failed to recognize the funding as a tuition subsidy.
The empirical studies all strongly suggest that while financial aid in the form of a loan or a grant both create discounts to the posted tuition price, students react differently to various forms of financial aid and tuition charges based upon delivery, even if the economic value of each is the same.61 Because students perceive grant aid as price subsidies, the substitution of grant aid with loan aid deters students on the financial margin of entering college.62 As loan aid continues to replace funding declines for grants, enrollment levels for students most sensitive to changes in price will drop. Together, the behavioral and empirical studies add a new dimension to funding debates; rather than simply haggling over the dollar values of loans and subsidies, discussions must also consider when such amounts are delivered.
II. POLICY PROPOSAL: ACCELERATING LOAN SUBSIDIES INCREASES ENROLLMENT RATES WITHOUT INCREASING COSTS
“The logic of choice does not provide an adequate . . .theory for decision making.” – Tversky & Kahneman63
If students are not rational, but exhibit myopic loss averse behavior, up-front subsidies to higher education – including grants, the HOPE, LLC, and Tuition Tax Credits – may affect behavior more effectively than loan subsidies that are doled over time.64 Accelerating the subsidy from delivery post-
58. Lindsenmeier et al., supra note 49. 59. Id. 60. Dynarski, supra note 4 (finding a 1.7% point increase for every $1,000 of loan
eligibility, but the results are inconclusive because the supporting data is weak). 61. Donald E. Heller, Student Price Response in Higher Education: An Update to Leslie
and Brinkman, 68 J. HIGHER EDUC. 624 (1997). 62. Dynarski, supra note 49. 63. Tversky & Kahneman, supra note 14. 64. Richard H. Thaler et al., The Effect of Myopia and Loss Aversion on Risk Taking: An

1- SIMA GANDHI- FINAL 3.DOC (DO NOT DELETE) 4/21/2008 2:47:31 PM
2008] GANDHI: STUDENT LOAN SUBSIDIES 145
graduation to a lump-sum at the time of enrollment creates a revenue-neutral means of restructuring the loan subsidy to effectively operate like a grant. Even pay-as-you-go budget proponents should find the proposal to accelerate delivery appealing; not only does acceleration increase the efficiency of extant government funding, it does so at no additional cost. Taken together, front-loading education subsidies to correspond with when students incur enrollment cost has great potential to influence behavior on the margin by confronting myopic loss aversion.
The following section of the paper first examines the timing of grants, tax benefits, and loan subsidies to show that differences in delivery influence the effectiveness of a subsidy. The second part steps through the details of loan acceleration, including the calculation of the up-front subsidy. And finally, this section looks at the mechanics around eligibility and delivery of the loan subsidy.
A. Subsidies to Higher Education Inefficiently Back-Load Aid
Subsidies to higher education are delivered in three main ways: grants, tax benefits, and loan subsidies. Grants and subsidies delivered via the tax system are both delivered at the time of enrollment. The only delay between costs incurred and receipt of tax subsidies is the time it takes for the IRS to process the tax refund. Loans, on the other hand, provide subsidies after a student completes her education. Unlike grants and tax benefits, the discount component of a student loan is generally not realized until the student starts repaying her loans post-graduation. Only upon repayment of loans does a
Experimental Test, 112 Q. J. ECON. 647, 659 (1997) (Just as Thaler’s seminal study on pension plans found that reframing decisions and redefining time horizons can combat myopic loss aversion, so too can simple alterations in financial aid profoundly affect students’ decision to invest in education. A classic illustration of how myopic loss aversion affects important decisions comes from a study conducted by Thaler on defined contribution pension plans. He found that though decisions made by employees were not always profit-maximizing, their decisions varied considerably by changing descriptions of their investment opportunities, and the manner and frequency with which they receive feedback on their returns. Once Thaler confirmed that decisions were not rational, but were influenced by loss aversion and myopia, he combated such tendencies by positively reframing the employees’ decision choices and construing a longer evaluation horizon. The study shows that “while myopia and loss aversion may well be general features of human cognition . . . these features do not produce good decision making.” However, understanding decisional errors makes it easier to identify how myopic loss-averse investors can avoid the mistakes to which they are prone. At the end of his study, Thaler assisted employees in maximizing their returns in a manner they may have wanted but were not able to do for themselves); Thaler & Benartzi, supra note 39, at S185-86 (Libertarians may protest that restructuring choices insults free will because the state paternalistically interfered, justifying its action by a claim that the person interfered with will be better off or protected from harm. However, Thaler’s actions categorize more as soft paternalism than strict paternalism in that people’s choices are not curtailed. Indeed, soft or “libertarian paternalism” is “a philosophy that advocates designing institutions that help people make better decisions but do not impinge on their freedom to choose. Automatic enrollment is a good example of libertarian paternalism.” It is not coercion – it simply “changes that presumption.”).

1- SIMA GANDHI- FINAL 3.DOC (DO NOT DELETE) 4/21/2008 2:47:31 PM
146 KANSAS JOURNAL OF LAW & PUBLIC POLICY [Vol. XVII:2
student realize the benefit of deferral, a below-market interest rate, and deduction of interest payments.65 Thus, not only does form of subsidy distinguish loans from the tax system and grants, but so too does timing of the subsidy’s delivery. 1. Grants deliver subsidies Up-Front at the Time of Enrollment
Grants, unlike loans, do not need to be repaid and are generally provided up-front at the time a student enrolls in college. Pell Grants comprise the federal government’s largest grant program, with amounts awarded according to a “financial need” formula set by Congress using information submitted through the Free Application for Federal Student Aid (FAFSA). Pell Grants are extremely distributive: sixty-two percent of undergraduate students from families with income below $32,000 received Pell grants in 2003-04, with only one percent of students from families with incomes exceeding $92,000 receiving grants.66 But though the statutorily-set maximum amount in 2005-06 was $4,050, the average grant was almost $2,000 lower at $2,354. Accounting for inflation, the real value of Pell Grants in 1975 and 2005 are relatively similar. But as seen in Figure 5, the increasing tuition costs means the value of Pell Grants relative to tuition costs has dropped.
65. The interest rate deduction on loans, though technically realized through the tax system,
is grouped with student loans because of the direct relationship between the loan and the deduction.
66. COLLEGE BOARD, TRENDS IN STUDENT AID 18 (2006), available at http://www. collegeboard.com/prod_downloads/press/cost06/trends_aid_06.pdf (“Sixty-two percent of undergraduate students from families with income below $32,000 received federal grants in 2003-04. Fourteen percent of those from families with income between $32,000 and $92,000 and 1 percent of those from families with incomes exceeding $92,000 received federal grants.”); See also NAT’L CTR. FOR EDUC. STATISTICS, U.S. DEP’T OF EDUC. INSTITUTE OF EDUC. SCIENCES, UNDERGRADUATE FINANCIAL AID ESTIMATES FOR 2003-04 BY TYPE OF INSTITUTION, NCES 2005-163 at 11, available at http://nces.ed.gov/pubs2005/2005163.pdf.
Source: Lawrence E. Gladieux, “Statement to the Committee on Governmental Affairs: U.S. Senate Hearing on the Rising Cost of College Tuition and the Effectiveness of Government Financial Aid, ” The College Board, Figure 9, (Feb. 2000), available at: http://www.ed.gov/about/bdscomm/list/ acsfa/edlite-testimonyfeb99.html (last visited April 13, 2007).
Figure 5: The Maximum Pell Grant Share as a Cost of Attendance, 1973-74 to 2000-01

1- SIMA GANDHI- FINAL 3.DOC (DO NOT DELETE) 4/21/2008 2:47:31 PM
2008] GANDHI: STUDENT LOAN SUBSIDIES 147
Figure 6: Grant Versus Loans, % Share of Total Aid
Source: The College Board: Trends in Student Aid
With the expansion of the Stafford loan program in 1992, Stafford Loans
are providing an increasingly utilized funding alternative. Figure 6 shows how a fifteen percent drop in grant aid as a share of total aid during 1991-2005 corresponded with an eleven percent increase in borrowing over that same period.67 As loan aid replaces grant aid, federal aid becomes less redistributive. In 1999-2000, forty-nine percent of students in the lowest quarter took out loans, up only three percent from ten years earlier. In contrast, thirty-five percent of students in the highest quarter took out loans, nearly tripling from thirteen percent in 1989-90. With the expansion of non-need based loans, families in the middle and highest quartile now receive a larger portion of subsidies than they previously did.
The trend towards subsidizing education through loans is troubling
because it moves funds away from the lowest-income quartiles. Furthermore, the very characteristics that make grants so effective – they do not need to be repaid and are delivered up-front at the time of enrollment – are lacking in loan subsidies.
67. COLLEGE BOARD, supra note 66, at 14.

1- SIMA GANDHI- FINAL 3.DOC (DO NOT DELETE) 4/21/2008 2:47:31 PM
148 KANSAS JOURNAL OF LAW & PUBLIC POLICY [Vol. XVII:2
Table 1
F E D E R A L F I N A N C I A L A I D S U B S I D I E S – G R A N T S , T A X B E N E F I T S , A N D L O A N S
B e n e f i t A n n u a l L im i t
E x p e n s e s t h a t Q u a l i f y C o n d i t io n s M a x .
I n c o m e
P e l l G r a n t $ 4 ,0 5 0 T u i t io n a n d F e e s
N e e d -B a s e d G r a n t
$ 4 ,0 5 0 . G r a n ts v a r y o n a n e e d s -o n ly b a s is
c a lc . w /d a ta s u b m i t t e d
v ia F A F S A
S t a f f o r d L o a n s
T h e m a x i m u m d e b t f r o m S ta f f o rd
L o a n s u p o n g r a d u a t io n i s $ 4 6 ,0 0 0 . N o
m o r e th a n $ 2 3 ,0 0 0 o f th a t c a n b e s u b s id iz e d
lo a n s . In t e r e s t i s c a p p e d a t
6 .2 5 % .
T u i t io n a n d F e e s
G e n e r a l ly , 1 0 o r 3 0 -y e a r r e p a y m e n t
t e r m s
O v e r f o u r y e a r s ,
$ 3 5 ,1 2 5 f o r in d e p e n d e n t
s tu d e n ts a n d
$ 1 6 ,7 6 5 f o r d e p e n d a n t
s tu d e n ts
S t u d e n t L o a n
I n t e r e s t D e d u c t io n s
$ 2 ,5 0 0 p e r y e a r
T u i t io n a n d f e e s , b o o k s ,
s u p p l i e s , r o o m a n d
b o a r d , t r a n s p o r t a t io n
A b o v e th e l in e d e d u c t io n
$ 6 5 ,0 0 0 ; J o in t
R e tu r n s : $ 1 3 5 ,0 0 0
H O P E T a x C r e d i t
U p to $ 1 ,5 0 0 p e r s tu d e n t
f o r th e f i r s t 2 u n d e r g r a d u a te
y e a r s
T u i t io n a n d F e e s
N o n r e fu n d a b le c r e d i t ;
T a x p a y e r c a n n o t c l a im
th is d e d u c t io n a n d L L C
$ 5 0 ,0 0 0 ; J o in t
R e tu r n s : $ 1 0 0 ,0 0 0
L L C T a x C r e d i t
U p to $ 2 ,0 0 0 p e r r e tu r n
T u i t io n a n d F e e s f o r o n e
o r m o r e c o u r s e s
( e n ro l lm e n t in a p r o g r a m n o t r e q u i r e d )
N o n r e fu n d a b le c r e d i t ;
T a x p a y e r c a n n o t c l a im
th is d e d u c t io n a n d th e H O P E
$ 5 0 ,0 0 0 ; J o in t
R e tu r n s : $ 1 0 0 ,0 0 0
H ig h e r E d u c a t io n
E x p e n s e D e d u c t io n
U p to $ 4 ,0 0 0 p e r r e tu r n
T u i t io n , f e e s , b o o k s
A b o v e th e l in e d e d u c t io n ; T a x p a y e r
c a n n o t c l a im th is d e d u c t io n a n d th e H O P E
o r L L C
$ 8 0 ,0 0 0 ; J o in t
R e tu r n s : $ 1 6 0 ,0 0 0
Source: IRS Publication 970

1- SIMA GANDHI- FINAL 3.DOC (DO NOT DELETE) 4/21/2008 2:47:31 PM
2008] GANDHI: STUDENT LOAN SUBSIDIES 149
2. Tax Deductions and Refundable Tax Credits Optimize Efficiency when they Provide Subsidies at the Time of Enrollment
After a modest start in 1986 under President Reagan (with education savings bonds), tax subsidies more recently gained prominence during the Clinton administration. A leading champion of using the tax code to fund education, President Clinton explained, “I have long believed that the tax system should better encourage investment in college education and job training.” Clinton won over Congress, and in 1997, Title II of the Taxpayer Relief Act (TRA) created “Education Incentives” including a deduction for interest paid on student loans, the HOPE and LLC nonrefundable credits, and education individual retirement accounts (later renamed Coverdell Savings Accounts).68 The “education incentives” of the 1997 Taxpayer Relief Act were the “product of a compromise between President Clinton’s agenda of deductions or credits for tuition costs and a Republican vision of permanently tax-exempt savings vehicles.”69 Congress rationalized the “Education Incentives” as necessary in giving America “a better educated population, a more competitive economy, and a society in which the rewards are more equally shared” because “education is the key to higher wages and a better standard of living.”70 Though Clinton spearheaded the effort to utilize the tax system for delivering education subsidies, his successor continued the use of the tax system for delivering federal aid. In 2001, President George W. Bush oversaw passage of the Economic Growth and Tax Relief Reconciliation Act (EGTRRA), which expanded on the interest rate deductions and Coverdell accounts initiated by Clinton in the TRA. It also introduced new initiatives including § 529 savings vehicles and Higher Education Tuition Deductions. Although the tuition deduction expired in 2005, Congress extended the deduction to December 31, 2007 and allowed for retroactive application of the deduction to the 2005 tax year.71 Whether or not the deduction continues depends on whether the 10th Congress extends it again. Currently, there are four tax benefits aimed at promoting higher education.72 The HOPE and LLC
68. Albus, supra note 4, at 600. 69. Wayne M. Gazur, Abandoning Principles: Qualified Tuition Programs and Wealth
Transfer Doctrine, 2 PITT. TAX REV. 1, 9 n.41 (2004). 70. Albus, supra note 4, at 601 nn.77 & 78. 71. I.R.S., U. S. DEP’T OF THE TREASURY, PUBLICATION 970: TAX BENEFITS FOR
EDUCATION (2005) available at http://www.irs.gov/pub/irs-prior/p970--2005.pdf (Under the Higher Education Tax Deduction, taxpayers can take an above-the-line deduction of up to $4,000 for the years 2004-2007. The deduction for the Higher Education Tax Deduction phases out for single filers with adjusted gross incomes of $65,000-$80,000, and $130,000-$160,000 for joint filers. Within the phase-out band, the deduction is limited to $2,000. As of the writing of this paper, the deduction is set to expire in 2007. A significant limitation of the Higher Education Tuition Deduction is that a taxpayer cannot take it in conjunction with the HOPE or LLC credit. As a result, the deduction is most popular among joint filers who earn under the phase-out cap of $160,000 but make too much money to qualify for the HOPE and LLC credits, both of which phase out at $135,000).
72. Coverdell Savings Accounts and § 529 savings vehicles are not discussed within the

1- SIMA GANDHI- FINAL 3.DOC (DO NOT DELETE) 4/21/2008 2:47:31 PM
150 KANSAS JOURNAL OF LAW & PUBLIC POLICY [Vol. XVII:2
credits, as well as the Higher Education Tuition Deduction all utilize the tax system to deliver aid up-front when a student purchases her college education (the fourth tax benefit is the loan interest deduction, discussed below with loan subsidies because it delivers aid post-graduation when a student starts repaying her loans). Like grants, financial aid in the form of tax credits and deductions subsidize the costs of post-secondary education at the time of enrollment.73 Though both grants and tax benefits deliver aid up-front, grants provide subsidies equal to their nominal value, irrespective of the recipient’s tax liability. In contrast, the value of a nonrefundable tax credit or deduction hinges, respectively, on the recipient’s tax liability or tax rate. Note that in the case of any of the aforementioned tax benefits, students filing independently or filers claiming a student as a dependent realize the tax credit or deduction.74
The value of an above-the-line deduction like the Higher Education Tax Deduction depends on the taxpayer’s marginal tax rate. If a taxpayer’s MTR is 50%, he will value a $1,000 deduction at $500 because his tax liability decreases by $500. But if a taxpayer’s MTR is 25%, he will value a $1,000 deduction at $250 because his tax liability decreases by $250. Consequently, a taxpayer with a higher MTR will realize a greater value from a deduction than a taxpayer with a lower MTR.
The value of a tax credit, like the HOPE and LLC, also depends on a taxpayer’s tax rate. A taxpayer enjoys tax credits by subtracting them directly from his tax liability, not from taxable income as in the case of a deduction. A taxpayer with a tax liability of $1,000 who has a tax credit of $200, reduces his liability to $800. But nonrefundable credits are valuable only to the extent that a taxpayer has tax liability to reduce. For example, if a taxpayer’s tax liability of $800 is smaller than a nonrefundable credit of $1,000, the credit reduces the $800 tax liability to zero but the remaining $200 worth of the credit is not refunded to the taxpayer. Both the HOPE and LLC are nonrefundable credits and therefore, a taxpayer can only realize the value of the credit to the extent of his own tax liability. Similarly, deductions like the Higher Education Tuition deduction are worth less to households in lower tax brackets and of no value at all to households with no income tax liability. In any given year, “almost half of all children live in households with no income tax liability and 80% of children in single parent households are part of tax units with no income tax liability.”75 For these children, deductions, exclusions, and nonrefundable credits are worthless. Out of an estimated 136 million federal tax returns for scope of this paper. Clearly, scholars should examine the effectiveness of all tax benefits, but in so far as this paper focuses on the merits of front-loaded versus back-loaded tax subsidies, it draws a distinction between tax benefits that create savings incentives before a student enrolls in college and tax benefits that provide subsidies once a student has decided to matriculate.
73. See generally Maag & Fitzpatrick, supra note 1, at 15; Albus, supra note 4, at 600. 74. I.R.S., supra note 71 (To qualify for the HOPE or LLC credit, an eligible taxpayer must
file a federal tax return. In addition, the taxpayer must claim an eligible student as a dependent on the tax return, unless the credit is for the taxpayer or the taxpayer’s spouse).
75. Lily L. Batchelder, Fred T. Goldberg, Jr. & Peter R. Orszag, Efficiency and Tax Incentives: The Case for Refundable Tax Credits, 59 STAN. L. REV. 23, 54 (2006).

1- SIMA GANDHI- FINAL 3.DOC (DO NOT DELETE) 4/21/2008 2:47:31 PM
2008] GANDHI: STUDENT LOAN SUBSIDIES 151
the fiscal year 2006, roughly 32% of households will value the Higher Education Tuition Deduction and the nonrefundable credits provided by the HOPE and LLC at zero.76
3. Loan Subsidies, as Currently Structured, Inefficiently Deliver Aid
Unlike tax credits and deductions, the discount component of a student loan is generally not realized until a student starts repaying her loans. Totaling more than fifty percent of the annual federal aid portfolio, the Stafford Loan Program77 reaches more than six million undergraduates who borrowed almost $37 billion in the 2005-06 academic year.78
Loan subsidies come in many forms: a) a below market interest rate
76. Scott A. Hodge, Number of Americans Paying Zero Federal Income Tax Grows to 43.4
Million, Tax Foundation (Mar. 30, 2006) available at http://www.taxfoundation.org/ news/show/1410.html.
77. See Appendix 2 (detailing the maximum annual Stafford Loan limits for independent and dependent students).
78. Anne Marie Chaker, House Approves Cuts In Cost of Student Loans, WALL ST. J. ONLINE, Jan. 19, 2007, available at http://www.collegejournal.com/aidadmissions/newstrends /20070119-chaker.html.
O M B B U D G E T O F T H E U . S . G O V E R N M E N T F O R F Y 2 0 0 7 ( I N B I L L I O N S )
2 0 0 5 2 0 0 6 2 0 0 7 2 0 0 8 2 0 0 9 2 0 1 0 2 0 1 1 2 0 0 7 -1 1
H O P E 3 . 7 1 3 . 6 5 3 . 0 6 3 . 0 9 3 . 2 2 3 . 2 4 3 . 4 8 1 6 . 0 9 L L C 2 . 3 3 2 . 3 4 2 . 0 2 2 . 0 3 2 . 0 6 2 . 0 9 2 . 2 2 1 0 . 4 2
H i g h e r E d u c a t i o n D e d u c t i o n
1 . 8 3 1 . 8 4 - - - - - -
S t u d e n t -L o a n
I n t e r e s t D e d u c t i o n
0 . 7 8 0 . 8 0 . 8 1 0 . 8 2 0 . 8 3 0 . 8 4 0 . 7 8 4 . 0 8
Projected Cost of Higher Education Tax Benefits 2007-11
HOPE (16.09B) 53%
LLC (10.42B)34%
Student-Loan Interest Deduction (4.08B)
13%
Figure 7: OMB Budget Costs for Higher Education Tax Benefits in Billions

1- SIMA GANDHI- FINAL 3.DOC (DO NOT DELETE) 4/21/2008 2:47:31 PM
152 KANSAS JOURNAL OF LAW & PUBLIC POLICY [Vol. XVII:2
(currently set at 6.8%), b) interest rate deductions of up to $2,500 a year,79 and c) in the case of subsidized Stafford loans, the government’s recompense of interest while the student remains at university. Both the below-market interest rate subsidy and the interest rate deduction are benefits that a student will not realize at the time she takes out loans to pay for the costs of entering college. Only upon repayment of the loan will she realize the deduction, and only over time will she realize the lower accrual rate resulting from the below-market interest rate. As seen in Table 2, from 1994-2004, it cost the government $40 billion to subsidize the below-market interest rate.80 As for the interest rate deductions, the OMB’s 2007 Analytical Perspectives projects
the cost to the government at $4 billion over the 2007-2011 fiscal years. Like the below-market interest rate and interest deductions, the benefits
conferred by the subsidized Stafford loan are not realized until graduation. For subsidized loans, the government essentially pays the interest on the student’s loan while the student is in college. The Department of Education measured the 2006 subsidy rate for subsidized loans at 16.81%, with a cost per average loan of $590.25.81 And on aggregate, the subsidy cost for all federal student loans is 12%, meaning it costs the government $12 for every $100 it lends.
In the aggregate, Stafford Loans’ three price subsidies comprise more than half the government’s budget for higher education aid. In 2006, student loan volume (excluding consolidation) was valued at $50 billion, with a subsidy rate of nearly 8%.82 When added to the student interest rate
79. I.R.S., supra note 71 (The EGTRRA of 2001 removed the 60-month limitation on claiming deductions, meaning that taxpayers can now deduct interest payments up to $2,500/year throughout their entire loan repayment time frame. The EGTRRA also increased the income phaseout thresholds by $10,000 so that eligibility for the interest deduction phases out for single filers with a modified AGI between $50,000-$65,000 and married filers with a modified AGI of $105,000-$135,000, adjusted for inflation starting in 2003).
80. GAO, REPORT TO CONGRESSIONAL COMMITTEES, FEDERAL STUDENT LOANS: CHALLENGES IN ESTIMATING FEDERAL SUBSIDY COSTS, GAO-05-874 (Sept. 2005) available at http://www.gao.gov/new.items/d05874.pdf.
81. See Appendix 1. DEP’T OF EDUC. Student Loans Overview: Fiscal Year 2008 Budget Request, Q-15-16, available at http://www.ed.gov/about/overview/budget/budget08/ justifications /q-loansoverview.pdf (The subsidy cost was calculated using the weighted average of the cost for the FFEL and the FDLP subsidized loans).
82. See Appendix 1 (where $50 billion is the sum of the loan volume for all types of loans
Source: “Federal Student Loans: Challenges in Estimating Federal Subsidy Costs, United States Government Accountability Office”, September 2005, GAO-05-874.
Total Subsidy (billions)
Total Loan Volume Disbursed (billions)
Subsidy per $100 Disbursed
Total Loans Disbursed
(1994-2004) $39.1 $546 $10.90
Table 2: Ten-Year Average of the Subsidy Cost per $100 Disbursed from 1994-2004

1- SIMA GANDHI- FINAL 3.DOC (DO NOT DELETE) 4/21/2008 2:47:31 PM
2008] GANDHI: STUDENT LOAN SUBSIDIES 153
deductions, the subsidy cost for Stafford Loans totals over $5 billion.83 Through these three subsidies, the Stafford Loan Program creates price subsidies for higher education by effectively lowering the cost of tuition.84 Although the below market interest rates, interest rate deductions, and deferral (or in the case of subsidized loans – forgiveness) of interest presents students with a significant subsidy to higher education, unlike grants and tax benefits, these loan subsidies are distributed over time. Unless students pay off interest while in college,85 they do not realize the benefits until they repay the loans. For students with limited resources who are forced to deliberate whether the immediate costs of education outweigh the long-term returns, a deferred tax benefit in the form of amortization deductions is probably not enough to render higher education a viable option.86 And insofar as such benefits are delivered in the future through the interest rate deduction and interest rate subsidy, hyperbolic discounting by myopic students means these “higher education cost breaks” are valued at less than their nominal value. Though the size of the subsidy is ultimately quite substantial, the delay in providing the subsidy means students are faced with significant up-front costs with minimal up-front assistance.
B. Accelerating Loan Subsidies Increases Efficiency while Maintaining Revenue Neutrality
1. The Special Allowance Payment (SAP) measures the Size of the Loan Subsidy
Private lenders, such as banks, fund the Stafford loan programs because the federal government guarantees lenders a statutorily specified minimum yield tied to market financial instruments. 87 The federal government provides these lenders with subsidy payments called special allowance payments (SAP) if interest rates paid by borrowers fall below the market yield.88 The amount of the SAP also includes the cost of borrower default.89
except for consolidation loans, and the sum of the subsidy costs for the loans excluding the consolidation loans was divided by the $50 billion to get 8%).
83. See Appendix 1 (author calculating $4,251,572,400 in loan subsidies + $800,000,000 in student interest rate deductions = $5,051,572,400).
84. Dynarski, supra note 51, at 21. 85. For students with subsidized Stafford loans, the interest deduction is moot because their
loan does not accrue interest until graduation. Students who incurred unsubsidized Stafford Loans, assuming liquidity and an income to offset the interest deduction with, can take advantage of the $2,000 deduction immediately by beginning to pay interest while still in college.
86. Dodge, supra note 5, at 943. 87. U. S. DEP’T OF EDUC., OFFICE OF POSTSECONDARY EDUC. § 682.3 (Federal Payments
of Interest and Special Allowance), available at http://a257.g.akamaitech.net/7/257/2422/ 01nov20051500/edocket.access.gpo.gov/cfr_2005/julqtr/pdf/34cfr682.300.pdf.
88. GAO, supra note 80; See also DEP’T OF EDUC. FEDERAL STUDENT AID OFFICE, LETTER: REPORTING CHANGES FOR LENDERS, FP-06-04 (Apr. 2006), available at http://www.nslp.com/pages/pdf/FP0604.pdf.
89. GAO, supra note 80; See also DEP’T OF EDUC. FEDERAL STUDENT AID OFFICE, supra

1- SIMA GANDHI- FINAL 3.DOC (DO NOT DELETE) 4/21/2008 2:47:31 PM
154 KANSAS JOURNAL OF LAW & PUBLIC POLICY [Vol. XVII:2
The size of the SAP for Stafford Loans depends on the rate differential between the market and federally-subsidized interest level. Historically, while a student was in college, the interest rate on the loan was adjusted annually using a formula based on the prevailing market interest rate. The formula for calculating borrower interest rates on Stafford loans disbursed on or after October 1, 1998 was based on the 91-day Treasury bill rate plus 1.7% while the borrower is in school and 2.3% when the borrower is in repayment. Rates were reset on July 1 of each year, based on the T-bill rate from the last Treasury auction conducted before June 1, but were not to exceed 8.25%.90 Under 2002 legislation, however, Stafford Loans issued on or after July 1, 2006, have a fixed interest rate of 6.8% but pending legislation could phase the rate down to 3.4% by 2011.91
note 88.
90. GAO, supra note 80. 91. Paul Kane, House Votes to Reduce Rates on Student Loans: Cut in Lender Subsidies
Offsets Impact, WASHINGTONPOST.COM, (Jan. 18, 2007) http://www.washingtonpost.com/wp-dyn/content/article/2007/01/17/AR2007011701602_pf.html (Under 2002 legislation, Stafford Loans made on or after July 1, 2006, have a fixed interest rate of 6.8% but pending legislation could drop the rate to 3.4% over the course of five years. On January 17, 2007, the “House overwhelmingly approved a bill . . . that is designed to cut interest rates on college loans, creating a plan that could potentially save students $2,300 over the course of a loan. But the reduction in rates would be phased in and would not take full effect until 2011, when the legislation would automatically expire unless renewed by Congress.” The provision would “drop the rate paid on federally subsidized student loans from 6.8 to 3.4 percent over five years.” The plan would cost $6 billion).

1- SIMA GANDHI- FINAL 3.DOC (DO NOT DELETE) 4/21/2008 2:47:31 PM
2008] GANDHI: STUDENT LOAN SUBSIDIES 155
As Congress adopts lower fixed interest rates that bear no relation to the
market, the cost of the SAP will grow if market rates increase. Before Congress fixed the interest rate, floating rates tied to the T-bill rate allowed for annual adjustments which guaranteed that the price of the loan to the student bore a stable relationship to the cost of the loan to the lender. Though interest rates on student loans are now fixed, the size of the SAP remains contingent on the differential between the congressionally mandated interest rate and the prevailing market rate, meaning that costs increase if the interest differential grows. In 2003 alone, when loan rates were at an all time low of 3.42%,92 the SAP (including consolidation) grew to $3 billion for loans made in fiscal year 2003 from $1.3 billion for loans made in fiscal year 2002.93 As seen in Table 3, the upward trend continued in more recent years: the SAP provided by the federal government on student loans issued in 2004 was $8 billion, and for loans issued in 2005 the costs increased to $11 billion.94
The recent growth in the cost of the SAP is largely driven by loan consolidation. When a student leaves college, she has the option of consolidating her Stafford loan (including both subsidized and unsubsidized loans) into a single loan at the prevailing subsidized interest rate which remains fixed through the term of the loan. For over two decades, the federal government has made consolidation loans available to students in order to
92. Maag & Fitzpatrik, supra note 1, at 14. 93. GAO, REPORT TO CONGRESSIONAL REQUESTERS, STUDENT LOAN PROGRAMS: AS
FEDERAL COSTS OF LOAN CONSOLIDATION RISE, OTHER OPTIONS SHOULD BE EXAMINED, GAO-04-101 (Oct. 2003) available at http://www.gao.gov/new.items/d05874.pdf.
94. U.S. GOV’T PRINTING OFFICE, ANALYTICAL PERSPECTIVES: BUDGET OF THE UNITED STATES GOVERNMENT, FISCAL YEAR 2004 (2003), available at http://www.whitehouse.gov/ omb/budget/fy2004/pdf/spec.pdf.
Source: Kevin A. Hassett and Robert J. Shapiro, The Fiscal and Social Costs of Consolidating Student Loans at Fixed Interest Rates, AEI Working Paper No. 104 at 32-33 (March 2004) available at http://www.cbanet.org/issues/Student_Lending/documents/Report_on_Student_Loan_Consolidation_Final_Hassett_S.pdf (last visited Mar. 24, 2007).
Treasury Bill Rate
Consolidated Loan Rate
Commercial Paper Rate
1992-93 3.84% 9.00% 3.40%1993-94 3.12% 9.00% 3.70%1994-95 4.33% 8.00% 5.89%1995-96 5.82% 9.00% 5.72%1996-97 5.16% 9.00% 5.69%1997-98 5.16% 8.25% 5.69%1998-99 5.16% 7.50% 5.20%1999-00 4.62% 7.00% 6.06%2000-01 5.89% 8.25% 5.71%2001-02 3.69% 6.00% 2.28%2003-03 1.76% 4.13% 1.42%2003-04 1.12% 3.50% 1.07%
Table 3: Interest Rates on Treasury Bills, Consolidated Loans, and Commercial Paper, 1992-1994

1- SIMA GANDHI- FINAL 3.DOC (DO NOT DELETE) 4/21/2008 2:47:31 PM
156 KANSAS JOURNAL OF LAW & PUBLIC POLICY [Vol. XVII:2
decrease default costs by extending repayment periods from ten to thirty years, and by allowing students to lock in a fixed interest rate. 95 The cost of the SAP is amplified by consolidation because the net present value of cash flows decreases when students lock-in interest at a lower rate and extend their repayment periods. Lower interest rates directly affect the cost of consolidation because the differential between the market rate and subsidized rate widens, and indirectly affects the size of the subsidy by attracting larger numbers of students to consolidate when interest rates drop. The Congressional Budget Office estimates that the option to consolidate has cost the government nearly five percent of borrowers’ loan principal.96
Indeed, the growing spread between statutorily-set student interest rates and a higher market interest rate resulted in a five-fold increase in loan volume between 2002 and 2004. In 2002, FFEL loan consolidation volume was $0.651 billion, but one year later rose to $2.135.97 And with interest rates as low as 3.33% for borrowers consolidating in 2005, the cost to the government was higher than anticipated.98 Kevin A. Hassett and Robert S. Shapiro projected future interest rates to estimate the size of the government subsidy delivered through the consolidation option. A conservative estimate of the cost to taxpayers is $14.6 billion on outstanding loans, but if interest rates reach levels like those in the 1970s and 1980s, the subsidy could run up to $81 billion.99 Despite the substantial size of the loan consolidation program, students do not realize any of the savings until after they graduate and begin paying off their loans. 2. Eliminating the interest rate subsidy on student loans accelerates the SAP and provides students with an up-front subsidy
Replacing the below-market interest rate subsidy on Stafford Loans with a market interest rate could shift funding from the SAP to an accelerated subsidy. For example, the interest rate on Stafford loans as of July 2007 was set at a maximum of 6.8%.100 By comparison, the rate on loans from private
95. GAO, supra note 93 (The federal government makes consolidation loans available to
help borrowers manage their student loan debt. By combining loans into one and extending the repayment period, a consolidation loan reduces monthly payments, which may lower default risk and reduce federal costs of loan defaults).
96. U.S. CONG. BUDGET OFFICE, PUB. NO. 2691, THE COST OF THE CONSOLIDATION OPTION FOR STUDENT LOANS vii (2006), available at http://www.cbo.gov/ftpdocs/71xx/ doc7196/05-09-StudentLoans.pdf.
97. Student Loan Programs: Lower Interest Rates and Higher Loan Volume have Increased Consolidation Costs: Hearing Before the H. Comm. on Educ. And the Workforce, 108th Cong. 2 (2004) (statement of Cornelia M. Ashby, Dir. of Educ., Workforce, and Income Sec. Issues), available at http://www.gao.gov/new.items/d04568t.pdf.
98. Sharkey, supra note 4, at 7. 99. Kevin A. Hassett & Robert J. Shapiro, The Fiscal and Social Costs of Consolidating
Student Loans at Fixed Interest Rates 21 (Am. Enter. Inst. for Pub. Policy Research, Working Paper No. 104, 2004), available at http://www.aei.org/docLib/20040825_wp104.pdf.
100. Anne Marie Chaker, Your Money Matters (A Special Report): Nest Egg—Seven Myths about College Financial Aid, WALL ST. J., July 9, 2007, at R1.
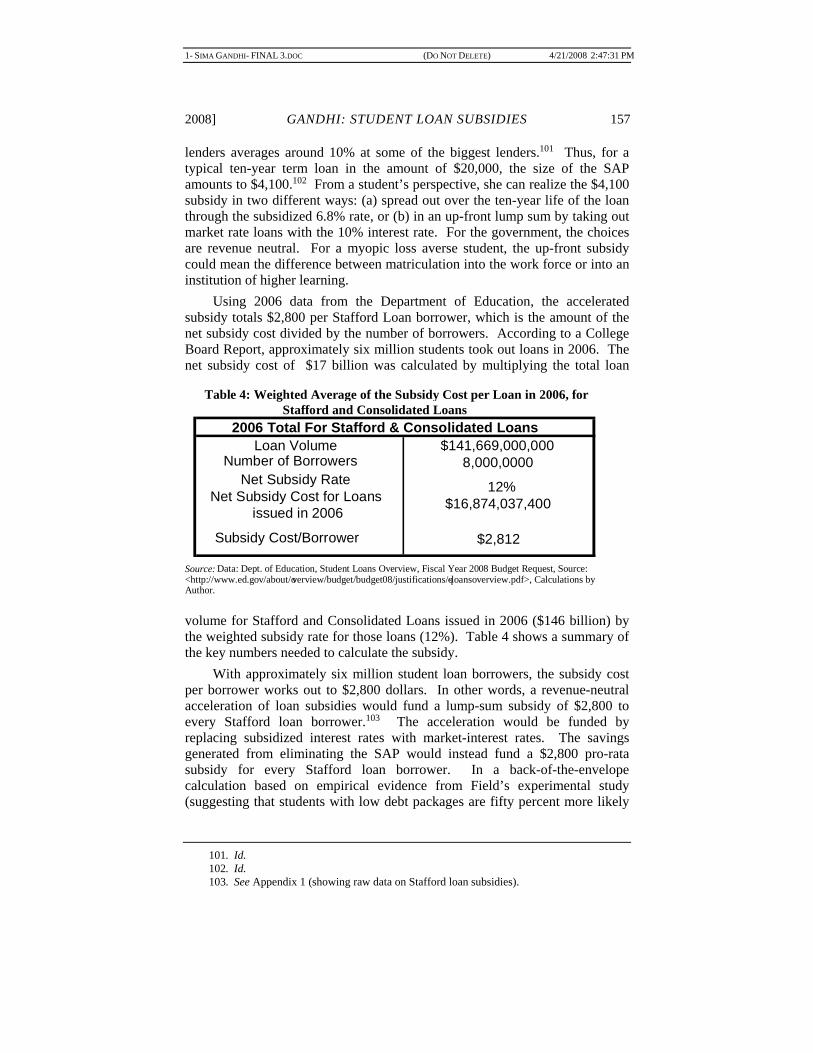
1- SIMA GANDHI- FINAL 3.DOC (DO NOT DELETE) 4/21/2008 2:47:31 PM
2008] GANDHI: STUDENT LOAN SUBSIDIES 157
lenders averages around 10% at some of the biggest lenders.101 Thus, for a typical ten-year term loan in the amount of $20,000, the size of the SAP amounts to $4,100.102 From a student’s perspective, she can realize the $4,100 subsidy in two different ways: (a) spread out over the ten-year life of the loan through the subsidized 6.8% rate, or (b) in an up-front lump sum by taking out market rate loans with the 10% interest rate. For the government, the choices are revenue neutral. For a myopic loss averse student, the up-front subsidy could mean the difference between matriculation into the work force or into an institution of higher learning.
Using 2006 data from the Department of Education, the accelerated subsidy totals $2,800 per Stafford Loan borrower, which is the amount of the net subsidy cost divided by the number of borrowers. According to a College Board Report, approximately six million students took out loans in 2006. The net subsidy cost of $17 billion was calculated by multiplying the total loan
volume for Stafford and Consolidated Loans issued in 2006 ($146 billion) by the weighted subsidy rate for those loans (12%). Table 4 shows a summary of the key numbers needed to calculate the subsidy.
With approximately six million student loan borrowers, the subsidy cost per borrower works out to $2,800 dollars. In other words, a revenue-neutral acceleration of loan subsidies would fund a lump-sum subsidy of $2,800 to every Stafford loan borrower.103 The acceleration would be funded by replacing subsidized interest rates with market-interest rates. The savings generated from eliminating the SAP would instead fund a $2,800 pro-rata subsidy for every Stafford loan borrower. In a back-of-the-envelope calculation based on empirical evidence from Field’s experimental study (suggesting that students with low debt packages are fifty percent more likely
101. Id. 102. Id. 103. See Appendix 1 (showing raw data on Stafford loan subsidies).
Table 4: Weighted Average of the Subsidy Cost per Loan in 2006, for Stafford and Consolidated Loans
Source: Data: Dept. of Education, Student Loans Overview, Fiscal Year 2008 Budget Request, Source: <http://www.ed.gov/about/o verview/budget/budget08/justifications/q-loansoverview.pdf>, Calculations by Author.
Loan Volume $141,669,000,000 Number of Borrowers 8,000,0000
Net Subsidy Rate 12% Net Subsidy Cost for Loans issued in 2006
$16,874,037,400
$2,812
2006 Total For Stafford & Consolidated Loans
Subsidy Cost/Borrower

1- SIMA GANDHI- FINAL 3.DOC (DO NOT DELETE) 4/21/2008 2:47:31 PM
158 KANSAS JOURNAL OF LAW & PUBLIC POLICY [Vol. XVII:2
to enroll than equivalent high debt financial aid packages)104 and Dynarski’s point-to-point study (strongly suggesting enrollment increases by four percent for every $1,000 in grant aid),105 this simple revenue-neutral conversion from a loan subsidy to up-front grant results in an enrollment increase of 5.6% points, reflecting a 9.3% increase in enrollment among low-income students.106
The 9.3% change in enrollment is a conservative measure because the pro-rata $2,800 subsidy fails to maintain distributional neutrality. Currently, loan subsidies are more heavily concentrated in subsidized Stafford loans which, in addition to the below market interest rates found on unsubsidized loans, also forgive interest on interest accrued while students are in college. To maintain distributional neutrality, the revenue neutral accelerated subsidy should be allocated in greater proportion to students who currently receive subsidized Stafford loans. Unlike unsubsidized Stafford loans, subsidized Stafford loans are available on a need-only basis. Recipients tend to be low-income, with about half of borrowers in 2003-2004 coming from families with incomes less than $45,000.107 Maintaining distributional neutrality means that subsidized Stafford borrowers actually stand to gain more than $2,800 in accelerated subsidies. Spreading the net loan subsidy among the current holders of subsidized Stafford loans generates an accelerated subsidy worth $3,150. This distributional and revenue neutral loan subsidy has more potent effects than the pro-rata subsidy. Delivery of the $3,150 subsidy results in a 10.5% change in enrollment among low-income students.108
104. Field, supra note 32, at 14. 105. Dynarski, Does Aid Matter?, supra note 15, at 285-86. 106. Increase in enrollment equals change in aid times a student’s enrollment elasticity to
aid. Thus, according to data from Dynarski, Does Aid Matter?, supra note 103, increase in enrollment = change in aid/$1,000 * 4%. Both Field and David Linsenmeier et. al. estimate that students value loans at half their face value. Thus, converting a current loan subsidy of $2,812 to a grant results in a 5.63% enrollment, calculated by: ($2,812-$2,812*50%)/$1,000 * 4%. And with enrollment by low-income students estimated at 60%, the resulting percentage change equals 5.63/60 = 9.3%. See Field, supra note 32, at 14 (finding that students assigned low-debt financial aid packages are twice as likely to enroll in law school); Linsenmeier, Rosen & Rouse, supra note 15 (replacing loans with grants increased enrollment of low-income students); Gladieux, supra note 2, at 20 (showing 60% enrollment rate of low-income statistic).
107. Chaker, supra note 78, at D2. 108. The increase in enrollment is 6.3%, as calculated by: ($3,150-$3,150*50%)/$1,000
*4%. The $3,150 comes from dividing the aggregate loan subsidy amount ($141,669,000,000) by the number of subsidized Stafford loan borrowers (5,353,000) and multiplying by the subsidy rate (12%). A 6.3% increase from the current 60% enrollment rate for low-income students equals a 10.5% percent change for enrollment among low-income students. See supra text accompanying note 106.

1- SIMA GANDHI- FINAL 3.DOC (DO NOT DELETE) 4/21/2008 2:47:31 PM
2008] GANDHI: STUDENT LOAN SUBSIDIES 159
Adding a redistributional element can increase the accelerated subsidy
to approximately $5,000 for students from families with incomes less than $26,000, resulting in a 16.7% change in enrollment rates among low-income students.109 Redistribution requires allocating more of the net subsidy to lower income Stafford subsidized borrowers than to higher income Stafford subsidized borrowers. Thus, some students will receive more than the distributionally neutral $3,150, and alternatively, those from relatively well-off families will receive less. In 2003-04, about half of all subsidized Stafford loan borrowers had family incomes of $26,000 to $68,000, with a median income for families of borrowers at $45,000.110 If the accelerated subsidy mimics the need-based distribution of subsidized Stafford loans, then a quartile distribution suggests that half of the subsidy should go to families with incomes between $26,000 to $68,000, phased up or down according to income such that the median subsidy amount clusters near the $45,000 income level. A rough estimate results in an average subsidy cost of $5,000 per subsidized Stafford borrower from families with income less than $26,000. The result is significant, with enrollment in higher education increasing from sixty percent to seventy percent for low-income students. The accelerated subsidy maximizes the efficiency of every dollar delivered because it not only generates larger behavioral responses from students than loan subsidies, but students on the financial margin also have a higher elasticity to grant aid than do high-income students.111
Because loans are accounted for on an accrual basis under the Federal Credit Reform Act (FRCA), shifting the interest rate subsidies forward would not affect federal budget estimates.112 Prior to the FRCA, the government calculated costs on a cash basis: costs and revenues recorded when money was paid or received.113 The FRCA significantly changed the way that the federal
109. The increase in enrollment is 10%, as calculated by: ($5,000-$5,000*50%)/$1,000 *4%. With only 60% of students from low-income families earning less than $33,000 attending college, the enrollment increase is 16.7%. However, because empirical studies suggest that students from low-income families have a higher elasticity to financial aid than students from higher-income families, the enrollment increase may in fact be higher than the 10% estimate. See supra text accompanying note 106.
110. Chaker, supra note 78, at D2. 111. Cronin, supra note 6, at 538. 112. GAO, supra note 88, at 4. 113. Id.
Table 5: Three Options for how to Distribute the Accelerated Loan Subsidy
Distribution of the Revenue Neutral Accelerated Subsidy
Amount Percent increase in enrollment among low-income students
Pro-Rata: Goes to every Stafford Loan Borrower
$2,800 9.3%
Distributionally Neutral: Goes to only subsidized Stafford Loan Borrowers
$3,150 10.5%
Redistributional: Goes to Lower-income subsidized Stafford Loan Borrowers
$5,000 16.7%
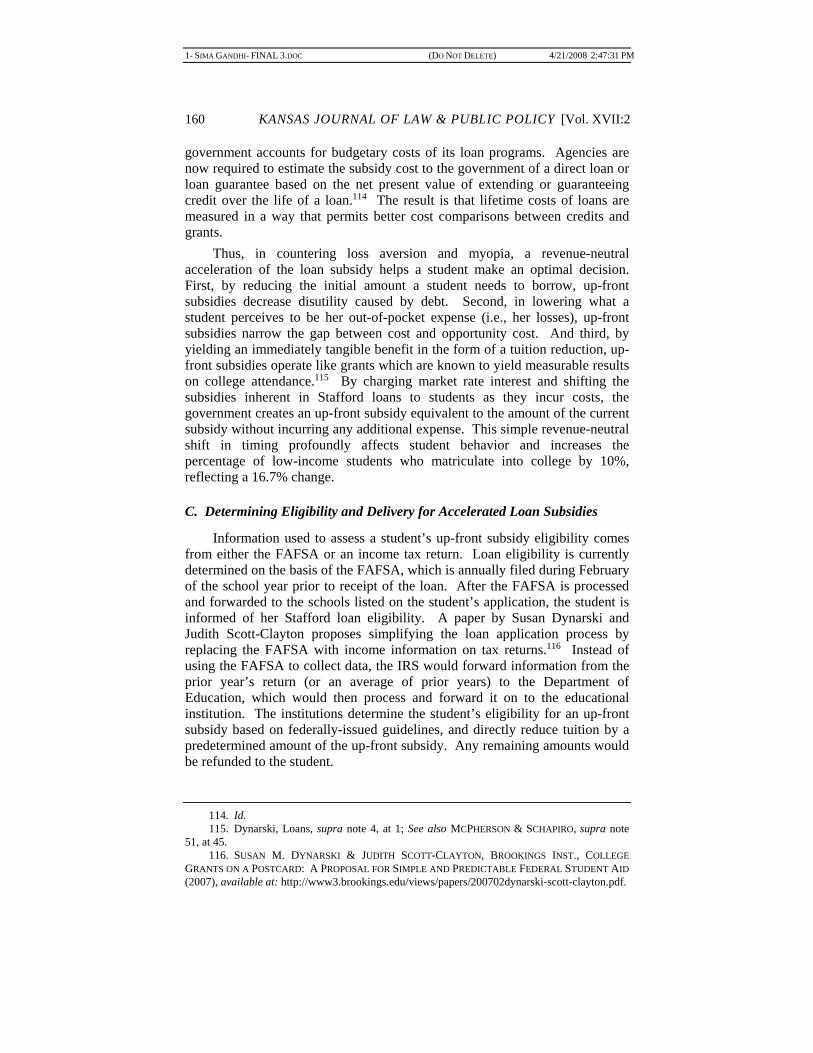
1- SIMA GANDHI- FINAL 3.DOC (DO NOT DELETE) 4/21/2008 2:47:31 PM
160 KANSAS JOURNAL OF LAW & PUBLIC POLICY [Vol. XVII:2
government accounts for budgetary costs of its loan programs. Agencies are now required to estimate the subsidy cost to the government of a direct loan or loan guarantee based on the net present value of extending or guaranteeing credit over the life of a loan.114 The result is that lifetime costs of loans are measured in a way that permits better cost comparisons between credits and grants.
Thus, in countering loss aversion and myopia, a revenue-neutral acceleration of the loan subsidy helps a student make an optimal decision. First, by reducing the initial amount a student needs to borrow, up-front subsidies decrease disutility caused by debt. Second, in lowering what a student perceives to be her out-of-pocket expense (i.e., her losses), up-front subsidies narrow the gap between cost and opportunity cost. And third, by yielding an immediately tangible benefit in the form of a tuition reduction, up-front subsidies operate like grants which are known to yield measurable results on college attendance.115 By charging market rate interest and shifting the subsidies inherent in Stafford loans to students as they incur costs, the government creates an up-front subsidy equivalent to the amount of the current subsidy without incurring any additional expense. This simple revenue-neutral shift in timing profoundly affects student behavior and increases the percentage of low-income students who matriculate into college by 10%, reflecting a 16.7% change.
C. Determining Eligibility and Delivery for Accelerated Loan Subsidies
Information used to assess a student’s up-front subsidy eligibility comes from either the FAFSA or an income tax return. Loan eligibility is currently determined on the basis of the FAFSA, which is annually filed during February of the school year prior to receipt of the loan. After the FAFSA is processed and forwarded to the schools listed on the student’s application, the student is informed of her Stafford loan eligibility. A paper by Susan Dynarski and Judith Scott-Clayton proposes simplifying the loan application process by replacing the FAFSA with income information on tax returns.116 Instead of using the FAFSA to collect data, the IRS would forward information from the prior year’s return (or an average of prior years) to the Department of Education, which would then process and forward it on to the educational institution. The institutions determine the student’s eligibility for an up-front subsidy based on federally-issued guidelines, and directly reduce tuition by a predetermined amount of the up-front subsidy. Any remaining amounts would be refunded to the student.
114. Id. 115. Dynarski, Loans, supra note 4, at 1; See also MCPHERSON & SCHAPIRO, supra note
51, at 45. 116. SUSAN M. DYNARSKI & JUDITH SCOTT-CLAYTON, BROOKINGS INST., COLLEGE
GRANTS ON A POSTCARD: A PROPOSAL FOR SIMPLE AND PREDICTABLE FEDERAL STUDENT AID (2007), available at: http://www3.brookings.edu/views/papers/200702dynarski-scott-clayton.pdf.

1- SIMA GANDHI- FINAL 3.DOC (DO NOT DELETE) 4/21/2008 2:47:31 PM
2008] GANDHI: STUDENT LOAN SUBSIDIES 161
Whether information from the FAFSA or return is used to determine
eligibility, delivering the up-front subsidy through the transfer system would look almost identical to the current Federal Direct Loan Program (FDLP). As seen in Figure 8, once eligibility is determined, students can elect to borrow through either the Federal Family Education Loan Program (FFEL) or the FDLP, the former of which funds over 90% of total lending and 88% of subsidized Stafford lending.117 FFEL loans are funded by private lenders who direct funds to the university, while FDLP loans are funded with public capital that is channeled to the Department of Education and then to the education institution. In both cases, upon receipt of funds, the institution withholds a predetermined portion for tuition costs, but refunds any remaining amounts to the student.
From an economic point of view, whether the up-front subsidy is delivered through the tax system as a credit or the transfer system, it does not matter so long as credits delivered through the tax system are refundable.118 Because the value of nonrefundable credits is limited to the taxpayer’s tax liability, the number of taxpayers ineligible for nonrefundable credits is significant.119 For the fiscal year 2006,Tax Foundation economists estimate
117. Because FFEL loans provide students with payment options and flexibility like
discounting for automatic payments or series of one-time payments, students generally opt for private lenders if their institution of choice participates in the FFEL program. See Appendix 1 (showing data of high loan volume for FFEL loans).
118. See David A. Weisbach & Jacob Nussim, The Integration of Tax & Spending Programs, 113 YALE L.J. 955, 957 (2004) (discussing efficiency differences between enacting programs through the tax system or as grants through the transfer system).
119. See Batchelder, Goldberg, Jr. & Orszag, supra note 75, at 54; Maag & Fitzpatrick, supra note 1, at 16. Currently, the HOPE and LLC credits are nonrefundable, meaning that a taxpayer is eligible for the credit only to the extent of his or her own tax liability. Over a twenty-year period, roughly three-fifths of tax units have no federal income tax liability in one or more years. Batchelder, Goldberg, Jr. & Orszag, supra note 75, at 54. For these households,
Figure 8: The Student Aid Application Process
Source: Susan M. Dynarski and Judith Scott-Clayton, “College Grants on a Postcard: A Proposal for Simple and Predictable Federal Student Aid”, Brookings Institute, The Hamilton Project Discussion Paper at 7 (Feb. 2007),.

1- SIMA GANDHI- FINAL 3.DOC (DO NOT DELETE) 4/21/2008 2:47:31 PM
162 KANSAS JOURNAL OF LAW & PUBLIC POLICY [Vol. XVII:2
that out of a total of136 million federal tax returns, approximately 32% of households will value the Higher Education Tuition Deduction and the nonrefundable credits provided by the HOPE and LLC at zero.120 Without a refundable credit, students close to the cusp may not receive the funds they would have otherwise received via a loan, thus rendering null any incentive and redistributive potential of the subsidy.121
The main difference between delivery through the tax system and transfer system hinges on timing. If the accelerated subsidy is delivered through the tax system as a refundable credit, the IRS could refund amounts either directly to the family or, like FDLP and FFEL lenders, to the institution, which then refunds amounts in excess of tuition back to the student. But because of the time lag between payment of tuition (Fall of Year 1) and delivery of tax refunds when the family applies for its credit upon filing its return (April of Year 2), families strapped for cash may find delivery through the transfer system more appealing. Alternatively, the tax system could be utilized if institutions with their larger operating budgets absorb the inconvenience of the refund delay. Institutions could front the reduction in tuition and apply in the following year for a refundable credit equivalent to the amount of the student’s up-front subsidy. Using the institution as an intermediary has the added advantages of increasing accountability and simplifying the process for families without the same level of financial sophistication as institutions.
III. ACCELERATED LOANS EFFICIENTLY TARGET THE PERSON ON THE MARGIN: AN ILLUSTRATION
If a simple change in timing of delivery creates a stronger incentive without even changing the dollar amount of the subsidy, then the government provides a more efficient subsidy because it would give incentives to students close to the cusp to acquire the higher education they would not otherwise gain. In addition to revenue-neutral efficiency increases, the example below
deductions, exclusions, and nonrefundable credits are worthless. Besides the shocking number of ineligible families, the nonrefundable education credits also have low take-up rates among eligible families. The actual cost of the HOPE and LLC credits during the 1997–2001 period was $18.3 billion, approximately 71% of the IRS’ initial $25.8 billion estimate. The less than universal take-up rate may have resulted from lack of awareness about eligibility. Maag & Fitzpatrick, supra note 1, at 16. Because lower-income families bear the burden of income shocks, with annually fluctuating incomes, they are more likely to base their spending decisions on after-tax income and not on income including refunded amounts. If policymakers want to create stronger incentives through the individual income tax for obtaining education, refundable tax credits are imperative. Batchelder, Goldberg, Jr. & Orszag, supra note 75, at 54. See also Maag & Fitzpatrick, supra note 1, at 16.
120. Hodge, supra note 76. 121. Batchelder, Goldberg, Jr. & Orszag, supra note 75, at 101, 117. See also, Brody,
supra note 8 (criticizing the federal student loan program for not efficiently transferring resources to low-income students); Albus, supra note 4 (discussing the disadvantages of student loan deductions under the Taxpayer Relief Act of 1997); Kalafat, supra note 6 (proposing a unified education tax credit for higher education).

1- SIMA GANDHI- FINAL 3.DOC (DO NOT DELETE) 4/21/2008 2:47:31 PM
2008] GANDHI: STUDENT LOAN SUBSIDIES 163
shows how up-front subsidies also promote equitable redistribution by inadvertently targeting students concentrated on the financial cusp who are generally those that are also most in need of the aid. In fact, rough estimates show that allocating the subsidy on a needs-only basis can increase enrollment by 16.7%.
A. Annie, Sara, and Noosh: Applying Up-Front Subsidies in the Year 2006
Table 6 below illustrates the impact of acceleration on students from different backgrounds. Shifting the loan subsidy from post-graduation to an up-front lump sum moves them one step closer to operating like a tax benefit or grant, the latter of which are known to increase college attendance by serving as a de facto price subsidy.122 The accelerated subsidy would operate differently for students from different economic backgrounds.
In the example above, Annie’s family is part of the lowest income
quantile, with an income of $19,000. Sara’s family earns the median income of $46,326, but she files independently, and Noosh’s family is in the top five percent with an income of $300,000.123 Based on their respective income levels, Annie receives a $5,000 accelerated subsidy each year, Sara receives the average $3,512, and Noosh receives nothing. Alternatively, if loans were structured without a redistricutive element, each borrower would receive
122. Dynarski, Loans, supra note 4, at 1. 123. Note that Sara’s median income reflects the income distribution of the United States
population in the year 2005. However, the accelerated subsidy is calculated based on loan amounts in 2006. See U.S. CENSUS BUREAU, CURRENT POPULATION SURVEY, 2006 ANNUAL SOCIAL AND ECONOMIC SUPPLEMENT, TABLE HINC-04: PRESENCE OF CHILDREN UNDER 18 YEARS OLD—HOUSEHOLDS, BY TOTAL MONEY INCOME IN 2005, TYPE OF HOUSEHOLD, RACE AND HISPANIC ORIGIN OF HOUSEHOLDER (2006) available at http://pubdb3.census.gov/macro/ 032006/hhinc/new04_001.htm (listing median household income for all races as $46,326).
SUBSIDIES IN 2006 YR 1 YR 2 YR 3 YR 4 SUM
Annie (19,000) Subsidized Loan Unsubsidized Loan Total Debt w/o Subsidy Accelerated Subsidy Debt with Acc. Subsidy
$ 2,265 $ 0 $ 2,265 debt $ 5,000 $ 2,735 refund
$ 3,500 $ 0 $ 3,500 debt $ 5,000 $ 1,500 refund
$ 5,500 $ 0 $ 5,500 debt $ 5,000 $ 500 debt
$ 5,500 $ 0 $ 5,00 debt $ 5,000 $ 500 debt
$16,765 $ 0 $ 16,765 debt $ 20,000 $ 3, 235 refund
Sara (46,326) Subsidized Loan Unsubsidized Loan Total Debt w/o Subsidy Accelerated Subsidy Debt with Acc. Subsidy
$ 2,265 $ 4,000 $ 6,265 debt $ 3,150 $ 3,113 debt
$ 3,500 $ 4,000 $ 7,500 $ 3,150 $ 4,348 debt
$ 5,500 $ 5,000 $ 10,500 $ 3,150 $ 7,348 debt
$ 5,500 $ 5,000 $ 10,500 $ 3,150 $ 7,348 debt
$ 16,765 $ 18,000 $ 34,765 $ 12,600 $ 22, 165 debt
Noosh (300,000) Subsidized Loan Unsubsidized Loan Total Debt w/o Subsidy Accelerated Subsidy Debt with Acc. Subsidy
$ 0 $ 2,265 $ 2,265 $ 0 $ 2,265 debt
$ 0 $ 3,500 $ 3,500 $ 0 $ 3,500 debt
$ 0 $ 5,500 $ 5,500 $ 0 $ 5,500 debt
$ 0 $ 5,500 $ 5,500 $ 0 $ 5,500 debt
$ 0 $ 16,765 $ 16,765 $ 0 $ 16,765 debt
Table 6: An Illustration of the Three Ways of Accelerating Loan Subsidies: Pro-Rata, Distributional-Neutral, or Redistributional
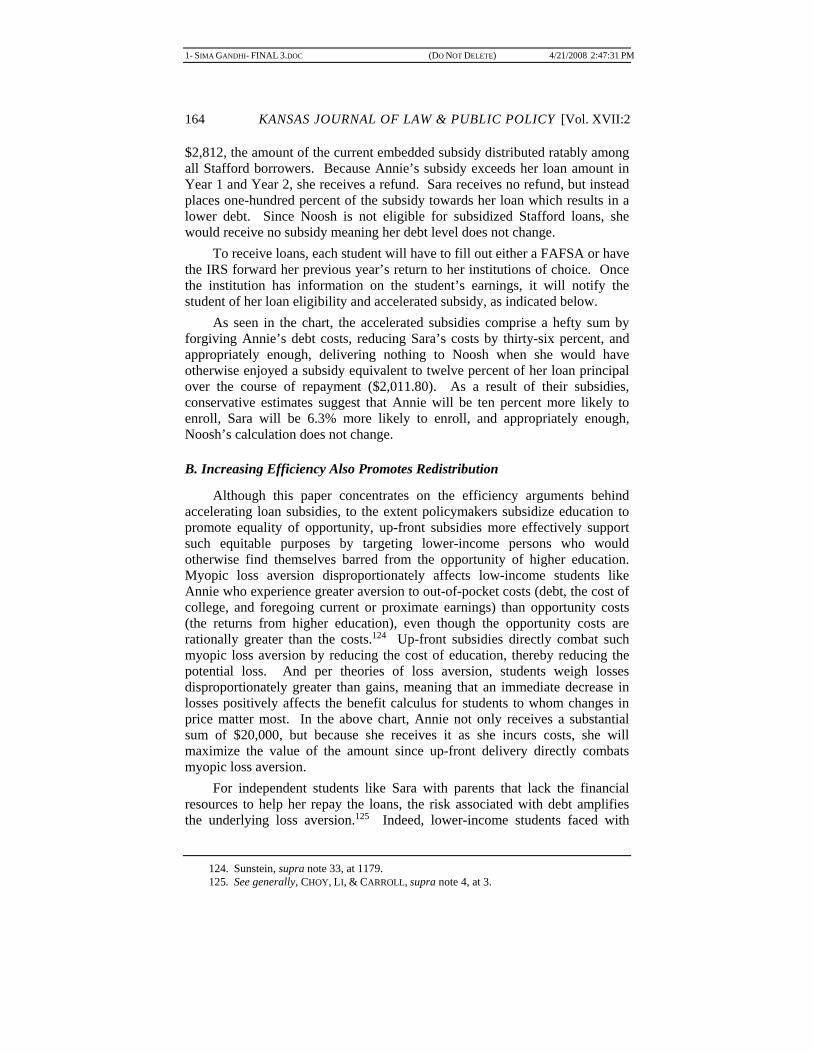
1- SIMA GANDHI- FINAL 3.DOC (DO NOT DELETE) 4/21/2008 2:47:31 PM
164 KANSAS JOURNAL OF LAW & PUBLIC POLICY [Vol. XVII:2
$2,812, the amount of the current embedded subsidy distributed ratably among all Stafford borrowers. Because Annie’s subsidy exceeds her loan amount in Year 1 and Year 2, she receives a refund. Sara receives no refund, but instead places one-hundred percent of the subsidy towards her loan which results in a lower debt. Since Noosh is not eligible for subsidized Stafford loans, she would receive no subsidy meaning her debt level does not change.
To receive loans, each student will have to fill out either a FAFSA or have the IRS forward her previous year’s return to her institutions of choice. Once the institution has information on the student’s earnings, it will notify the student of her loan eligibility and accelerated subsidy, as indicated below.
As seen in the chart, the accelerated subsidies comprise a hefty sum by forgiving Annie’s debt costs, reducing Sara’s costs by thirty-six percent, and appropriately enough, delivering nothing to Noosh when she would have otherwise enjoyed a subsidy equivalent to twelve percent of her loan principal over the course of repayment ($2,011.80). As a result of their subsidies, conservative estimates suggest that Annie will be ten percent more likely to enroll, Sara will be 6.3% more likely to enroll, and appropriately enough, Noosh’s calculation does not change.
B. Increasing Efficiency Also Promotes Redistribution
Although this paper concentrates on the efficiency arguments behind accelerating loan subsidies, to the extent policymakers subsidize education to promote equality of opportunity, up-front subsidies more effectively support such equitable purposes by targeting lower-income persons who would otherwise find themselves barred from the opportunity of higher education. Myopic loss aversion disproportionately affects low-income students like Annie who experience greater aversion to out-of-pocket costs (debt, the cost of college, and foregoing current or proximate earnings) than opportunity costs (the returns from higher education), even though the opportunity costs are rationally greater than the costs.124 Up-front subsidies directly combat such myopic loss aversion by reducing the cost of education, thereby reducing the potential loss. And per theories of loss aversion, students weigh losses disproportionately greater than gains, meaning that an immediate decrease in losses positively affects the benefit calculus for students to whom changes in price matter most. In the above chart, Annie not only receives a substantial sum of $20,000, but because she receives it as she incurs costs, she will maximize the value of the amount since up-front delivery directly combats myopic loss aversion.
For independent students like Sara with parents that lack the financial resources to help her repay the loans, the risk associated with debt amplifies the underlying loss aversion.125 Indeed, lower-income students faced with
124. Sunstein, supra note 33, at 1179. 125. See generally, CHOY, LI, & CARROLL, supra note 4, at 3.

1- SIMA GANDHI- FINAL 3.DOC (DO NOT DELETE) 4/21/2008 2:47:31 PM
2008] GANDHI: STUDENT LOAN SUBSIDIES 165
significant amounts of debt principally substitute education “investments” for entering the labor force or joining the military.126 Thus, up-front subsidies perceived as price subsidies decrease the risk incurred, and tip the balance for students on the margin. It is not surprising that empirical data indicates price reductions result in larger student enrollment responses for low-income students.127
In contrast, students like Noosh who do not need to take out loans (but may currently choose to do so because of the low interest rate) face no losses, and thus operate outside behavioral patterns predicted by myopic loss aversion. Enrollment responses are either small or nonexistent for middle- and high-income students, indicating price is not as significant a factor in matriculation decisions.128 Short of a liquidity crisis, up-front subsidies eliminate the incentive for wealthy students like Noosh to drain the resources of the federal loan system. Instead, because students on the margin perceive up-front subsidies as positively revaluing their cost-benefit ratio, accelerated subsidies efficiently target those students for whom such subsidy will make or break the decision to matriculate in higher education.
V. CONCLUSION
Acceleration matters because when subsidies are delivered significantly implicates how students perceive and react. If students are myopic and loss averse, then accelerating delivery of subsidies to an up-front initial sum increases the effectiveness of subsidies as incentives,129 because myopic and loss averse students perceive funding now as better than funding later. At a subsidy cost in 2006 of $12 per $100 disbursed, the subsidy cost per loan averages at $1,037 or $2,812 per borrower. But limiting distribution of the net subsidy to students currently eligible for a need-based subsidized Stafford loan, results in a $3,150 up-front subsidy. This acceleration of the loan subsidy increases efficiency by restructuring loan subsidies to look more like the price subsidies generated by grants and tax benefits. Thus, for the same amount on net, subsidies delivered as students incur costs are more effective incentives because they generate stronger behavioral incentives for persons on the margin who would otherwise forego higher education.
If financial aid truly aims to create equality of opportunity, then subsidies must be targeted in such a way that students on the margin get the most “bang for their buck.”130 Given the large cost to the government of subsidizing education, and the growing importance of higher education as a means to economic success, a revenue- neutral acceleration of subsidies is common sense. Where at no cost to itself the government can induce more students to
126. Dodge, supra note 5, at 943. 127. Cronin, supra note 6, at 538. 128. Id. 129. See id. 130. Batchelder, Goldberg, Jr. & Orszag, supra note 75, at 124.
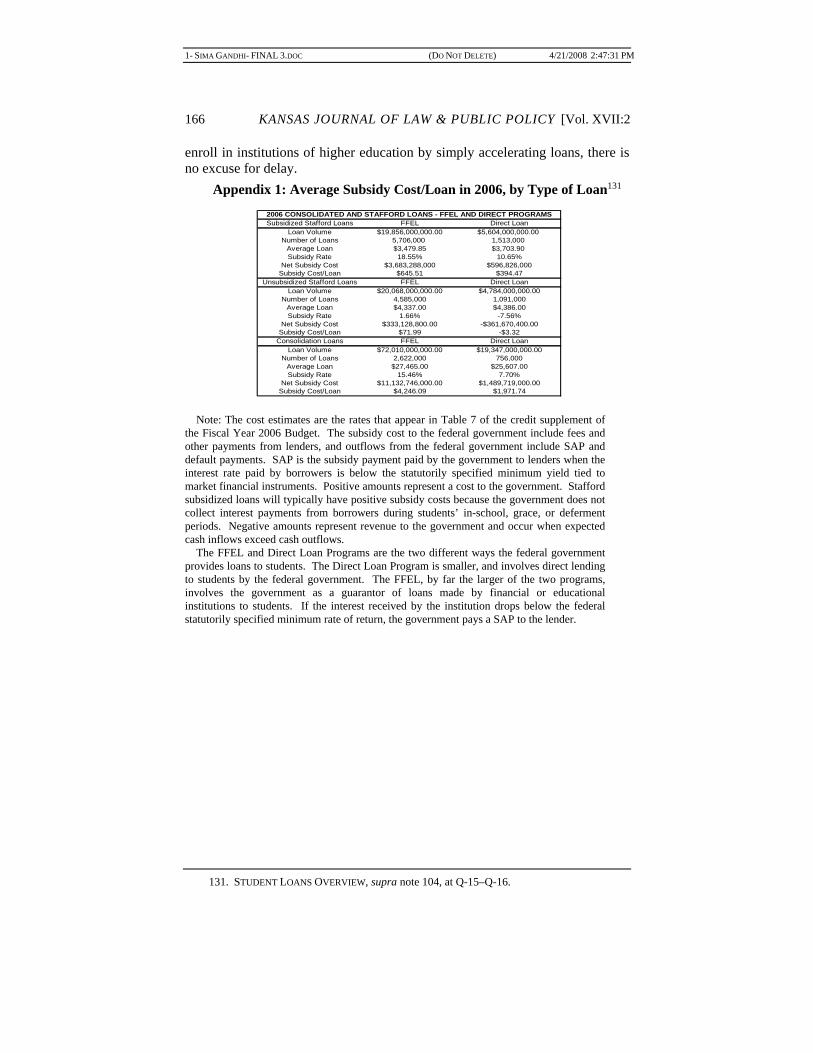
1- SIMA GANDHI- FINAL 3.DOC (DO NOT DELETE) 4/21/2008 2:47:31 PM
166 KANSAS JOURNAL OF LAW & PUBLIC POLICY [Vol. XVII:2
enroll in institutions of higher education by simply accelerating loans, there is no excuse for delay.
Appendix 1: Average Subsidy Cost/Loan in 2006, by Type of Loan131 Note: The cost estimates are the rates that appear in Table 7 of the credit supplement of the Fiscal Year 2006 Budget. The subsidy cost to the federal government include fees and other payments from lenders, and outflows from the federal government include SAP and default payments. SAP is the subsidy payment paid by the government to lenders when the interest rate paid by borrowers is below the statutorily specified minimum yield tied to market financial instruments. Positive amounts represent a cost to the government. Stafford subsidized loans will typically have positive subsidy costs because the government does not collect interest payments from borrowers during students’ in-school, grace, or deferment periods. Negative amounts represent revenue to the government and occur when expected cash inflows exceed cash outflows. The FFEL and Direct Loan Programs are the two different ways the federal government provides loans to students. The Direct Loan Program is smaller, and involves direct lending to students by the federal government. The FFEL, by far the larger of the two programs, involves the government as a guarantor of loans made by financial or educational institutions to students. If the interest received by the institution drops below the federal statutorily specified minimum rate of return, the government pays a SAP to the lender.
131. STUDENT LOANS OVERVIEW, supra note 104, at Q-15–Q-16.
Subsidized Stafford Loans FFEL Direct LoanLoan Volume $19,856,000,000.00 $5,604,000,000.00
Number of Loans 5,706,000 1,513,000Average Loan $3,479.85 $3,703.90Subsidy Rate 18.55% 10.65%
Net Subsidy Cost $3,683,288,000 $596,826,000Subsidy Cost/Loan $645.51 $394.47
Unsubsidized Stafford Loans FFEL Direct LoanLoan Volume $20,068,000,000.00 $4,784,000,000.00
Number of Loans 4,585,000 1,091,000Average Loan $4,337.00 $4,386.00Subsidy Rate 1.66% -7.56%
Net Subsidy Cost $333,128,800.00 -$361,670,400.00Subsidy Cost/Loan $71.99 -$3.32
Consolidation Loans FFEL Direct LoanLoan Volume $72,010,000,000.00 $19,347,000,000.00
Number of Loans 2,622,000 756,000Average Loan $27,465.00 $25,607.00Subsidy Rate 15.46% 7.70%
Net Subsidy Cost $11,132,746,000.00 $1,489,719,000.00Subsidy Cost/Loan $4,246.09 $1,971.74
2006 CONSOLIDATED AND STAFFORD LOANS - FFEL AND DIRECT PROGRAMS

1- SIMA GANDHI- FINAL 3.DOC (DO NOT DELETE) 4/21/2008 2:47:31 PM
2008] GANDHI: STUDENT LOAN SUBSIDIES 167
Appendix 2: Maximum Annual Stafford Loan Limits132
MAXIMUM ANNUAL LOAN LIMITS FOR UNDERGRADUATE STAFFORD LOAN RECIPIENTS Independent Students Dependent Students
1st year $6,625, with no more than $2,265 in subsidized loans
$2,265, with no more than $2,265 in subsidized loans
2nd year $7,500, with no more than $3,500 of in subsidized loans
$3,500, with no more than $3,500 of in subsidized loans
3rd & 4th Year
$10,500, with no more than $5,500 in subsidized loans
$5,500 with no more than $5,500 in subsidized loans
Total $35,125, with no more than $16,765 in subsidized loans
$16,765 with no more than $16,765 in subsidized loans
Note: Effective July 2007, increased the annual limits on Stafford loans for dependent freshmen and sophomores are $3,500 and $4,500, respectively, up from $2,625 and $3,500. Juniors and seniors can borrow up to $5,500 a year.
132. U.S. DEP’T OF EDUC., THE STUDENT GUIDE: FINANCIAL AID FROM THE U.S.
DEPARTMENT OF EDUCATION 2005-2006 21 (2005), available at www.http://studentaid.ed.gob/ students/publications/student_guide/20052006/english/typesperkinsandstaffordloans.htm#maximum_annual_loan_chart.


![005014899 00138€¦ · 252 WILLS AND FITZPATRICK Catherine. Effects £485. FITZPATRICK Daniel. £79 15B. ti561 FITZPATRICK Edward. Effects £318 IOS. 118] FITZPATRICK Jane,](https://static.fdocuments.in/doc/165x107/6059be5bdbe04d125f77fe02/005014899-252-wills-and-fitzpatrick-catherine-effects-485-fitzpatrick-daniel.jpg)