
Understanding Structural Changes in LMR-NMC Materials€¦ · Understanding Structural Changes in...
23
Understanding Structural Changes in LMR- NMC Materials Project ID: ES194 Jason R. Croy Voltage Fade Team Annual Merit Review Washington DC, June 16-20, 2014 This presentation does not contain any proprietary, confidential, or otherwise restricted information.
Transcript of Understanding Structural Changes in LMR-NMC Materials€¦ · Understanding Structural Changes in...
Understanding Structural Changes in LMR-NMC Materials Project ID: ES194
Jason R. Croy Voltage Fade Team Annual Merit Review Washington DC, June 16-20, 2014
This presentation does not contain any proprietary, confidential, or otherwise restricted information.
2
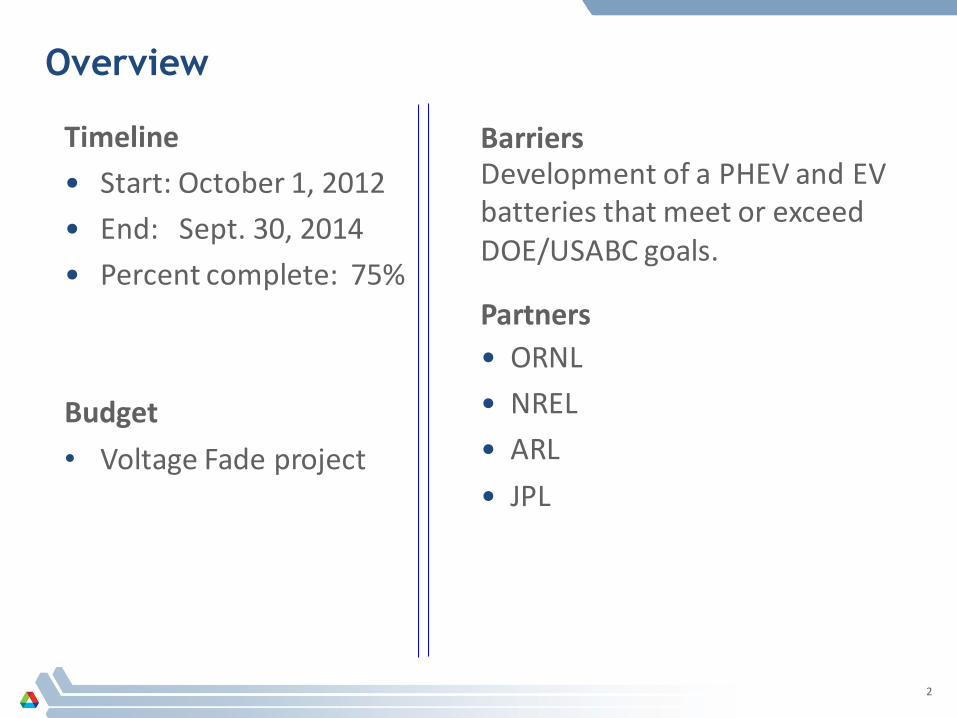
Overview
Timeline • Start: October 1, 2012 • End: Sept. 30, 2014 • Percent complete: 75% Budget • Voltage Fade project
Barriers Development of a PHEV and EV batteries that meet or exceed DOE/USABC goals. Partners • ORNL • NREL • ARL • JPL
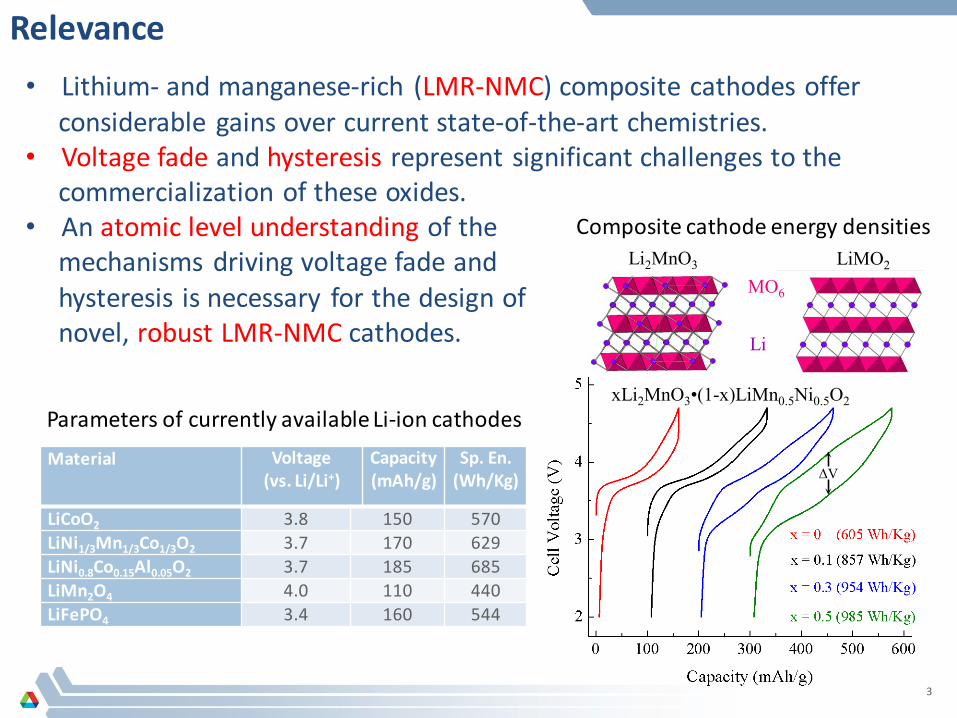
Relevance • Lithium- and manganese-rich (LMR-NMC) composite cathodes offer considerable gains over current state-of-the-art chemistries. • Voltage fade and hysteresis represent significant challenges to the commercialization of these oxides. • An atomic level understanding of the mechanisms driving voltage fade and hysteresis is necessary for the design of novel, robust LMR-NMC cathodes.
Material Voltage (vs. Li/Li+)
Capacity (mAh/g)
Sp. En. (Wh/Kg)
LiCoO2 3.8 150 570 LiNi1/3Mn1/3Co1/3O2 3.7 170 629 LiNi0.8Co0.15Al0.05O2 3.7 185 685 LiMn2O4 4.0 110 440 LiFePO4 3.4 160 544
Parameters of currently available Li-ion cathodes
Composite cathode energy densities
3
Li2MnO3 LiMO2
Li
MO6
ΔV
xLi2MnO3•(1-x)LiMn0.5Ni0.5O2
Approach
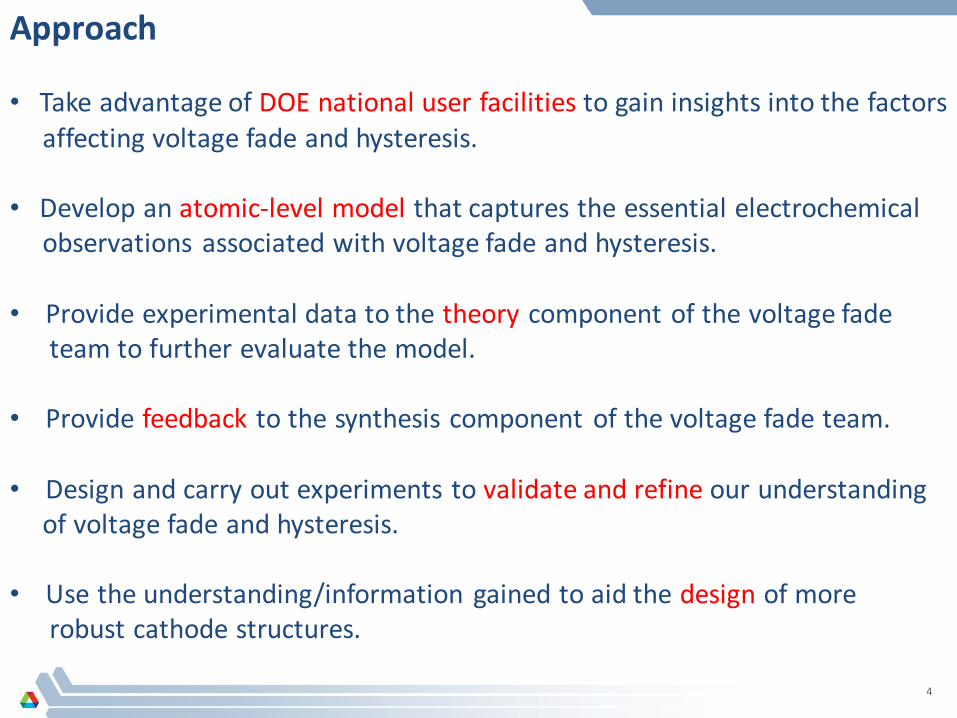
• Take advantage of DOE national user facilities to gain insights into the factors affecting voltage fade and hysteresis.
• Develop an atomic-level model that captures the essential electrochemical observations associated with voltage fade and hysteresis. • Provide experimental data to the theory component of the voltage fade team to further evaluate the model. • Provide feedback to the synthesis component of the voltage fade team.
• Design and carry out experiments to validate and refine our understanding of voltage fade and hysteresis. • Use the understanding/information gained to aid the design of more robust cathode structures.
4
Progress - What We Know About LMR-NMC
• Local structure is driven by charge ordering giving regions of two types: TM-rich (LiMO2) – High M-M coordination giving “standard” electrochemical behavior. Mn-rich (Li2MnO3) – Li/Mn rich regions which show strong tendencies for Li-Mn ordering. Low Mn-M coordination, electrochemically different than bulk Li2MnO3.
• Activation of the “Li2MnO3 component” (LiMn6-type ordered regions) is necessary to induce voltage fade – concomitant with a structural hysteresis. • Voltage fade and hysteresis increase with increasing Li and Mn ordering
increasing x in xLi2MnO3•(1-x)LiMO2.
• Mn-rich regions undergo more severe structural changes relative to TM-rich regions Li/Mn ordering plays a key role in VF and hysteresis. • Hysteresis and voltage fade are correlated and depend on Li utilization, voltage, rate, and temperature (cycling is worse than high voltage ageing). • A model has been developed to help us understand these observations.
5
Li
Mn O
0 1 2 3 4 5 6 7 8
(d) Ni K
FT m
agni
tude
(a.u
.)
R (Å)
x = 0.5
x = 0.1x = 0.3
x = 0
Ni-O
Ni-M
Ni-O-Ni
0 1 2 3 4 5 6 7 8
FT m
agni
tude
(a.u
.)(c) Mn K
R (Å)
Li2MnO3
x = 0.5
x = 0.1x = 0.3
x = 0
Mn-M
Mn-O
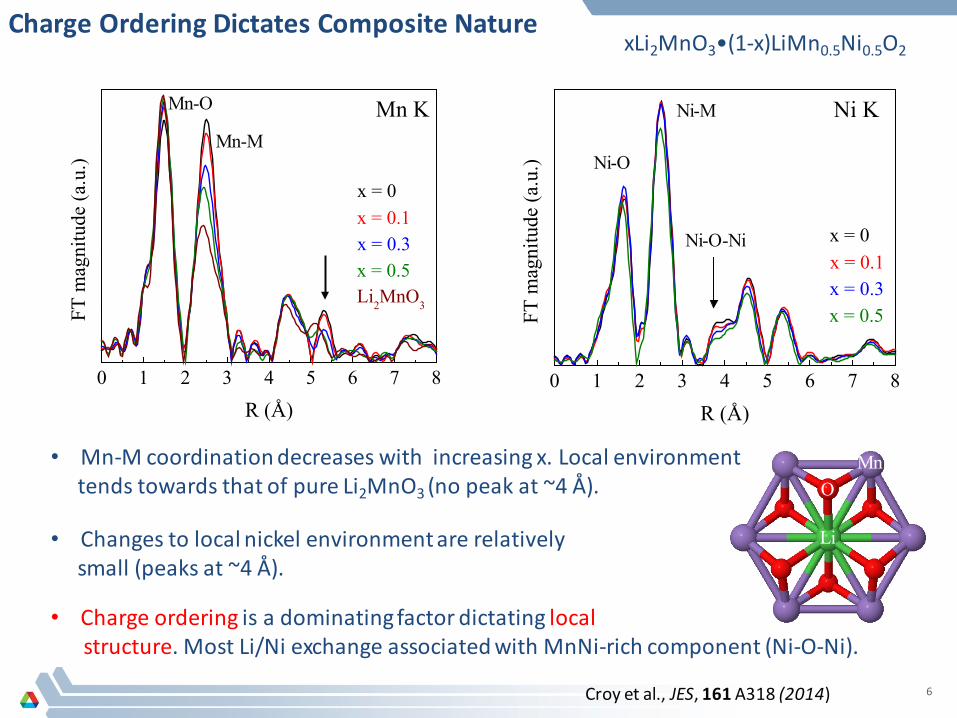
Charge Ordering Dictates Composite Nature
• Mn-M coordination decreases with increasing x. Local environment tends towards that of pure Li2MnO3
(no peak at ~4 Å).
• Changes to local nickel environment are relatively small (peaks at ~4 Å).
• Charge ordering is a dominating factor dictating local structure. Most Li/Ni exchange associated with MnNi-rich component (Ni-O-Ni).
Croy et al., JES, 161 A318 (2014) 6
xLi2MnO3•(1-x)LiMn0.5Ni0.5O2
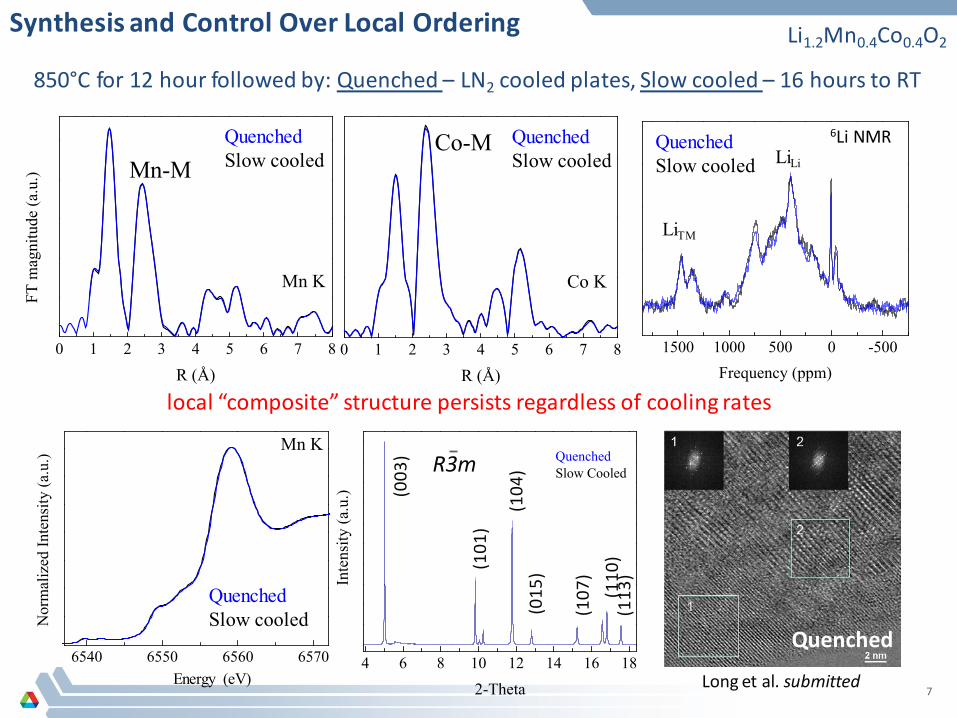
Synthesis and Control Over Local Ordering
0 1 2 3 4 5 6 7 8
FT m
agni
tude
(a.u
.)
R (Å)
QuenchedControlled(c)
Mn K
Quenched Slow cooled
0 1 2 3 4 5 6 7 8
R (Å)
QuenchedControlled
Co K
(d) Quenched Slow cooled
1500 1000 500 0 -500Frequency (ppm)
ControlledQuenched
6Li NMR Quenched Slow cooled
LiTM
LiLi
6540 6550 6560 6570
Nor
mal
ized
Inte
nsity
(a.u
.)
QuenchedControlled
(a) Mn K
Quenched Slow cooled
850°C for 12 hour followed by: Quenched – LN2 cooled plates, Slow cooled – 16 hours to RT
Mn-M Co-M
local “composite” structure persists regardless of cooling rates
Long et al. submitted
Quenched 4 6 8 10 12 14 16 18
Inte
nsity
(a.u
.)
2-Theta
QuenchedSlow Cooled
(003
)
(101
)
(104
) (0
15)
(107
) (1
10)
(113
)
R3m
Energy (eV) 7
Li1.2Mn0.4Co0.4O2
6540 6550 6560 6570
Li1.2Mn0.4Co0.4O2Nor
mal
ized
Inte
nsity
(a.u
.)
Energy (eV)
Li1.2Mn0.6Ni0.2O2
(a) Mn K
0 1 2 3 4 5 6 7 8
FT m
agni
tude
(a.u
.)
R (Å)
(b)
Mn K
Li1.2Mn0.4Co0.4O2Li1.2Mn0.6Ni0.2O2
Mn – M Mn – O
6540 6550 6560 6570Energy (eV)
QuenchedLi2MnO3
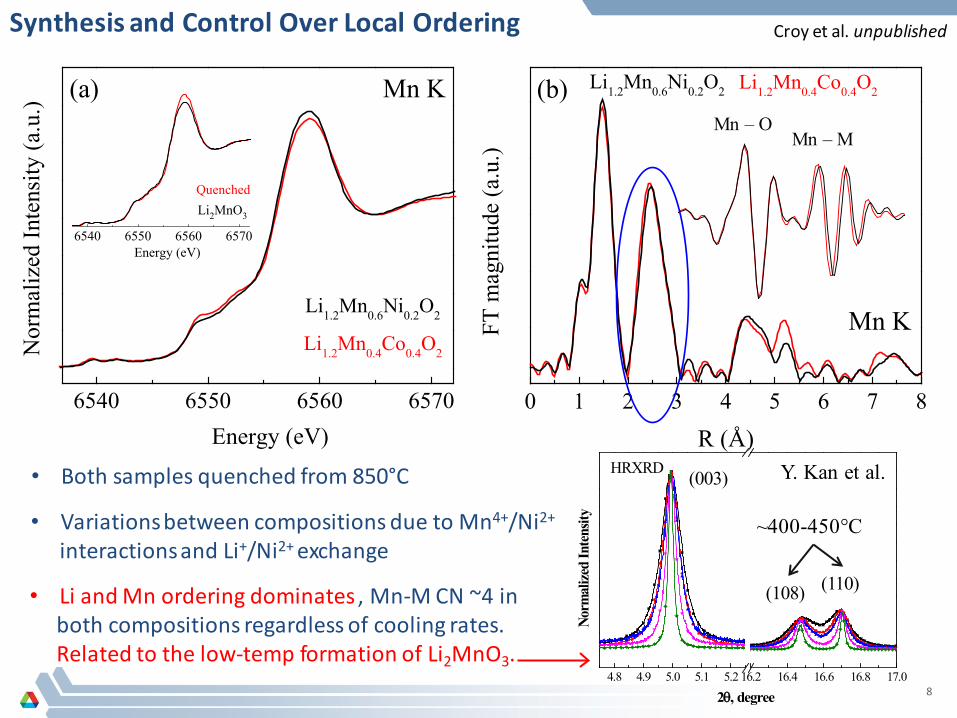
• Variations between compositions due to Mn4+/Ni2+
interactions and Li+/Ni2+ exchange
• Li and Mn ordering dominates , Mn-M CN ~4 in both compositions regardless of cooling rates. Related to the low-temp formation of Li2MnO3.
• Both samples quenched from 850°C
Croy et al. unpublished
4.8 4.9 5.0 5.1 5.2 16.2 16.4 16.6 16.8 17.0
Norm
alize
d In
tens
ity
2θ, degree
450 oC 550 oC 650 oC 750 oC 850 oC
003
108 110
(003)
(108) (110)
~400-450°
C
Y. Kan et al. HRXRD
Synthesis and Control Over Local Ordering
8
6540 6550 6560 6570 6580
Nor
mal
ized
Inte
nsity
(a.u
.)
Energy (eV)
Mn K
Li2MnO3
(a)
0 1 2 3 4 5 6 7 8
(b)
FT m
ag. (
a.u.
)
R (Å)
Mn K
Li2MnO3
5.1 V100 mAh/g200 mAh/g2.0 V
Mn-O
Mn-Mn
0 1 2 3 4 5 6 7 8
(b)
FT m
ag. (
a.u.
)
R (Å)
Mn K
Li2MnO3
5.1 V2.0 V
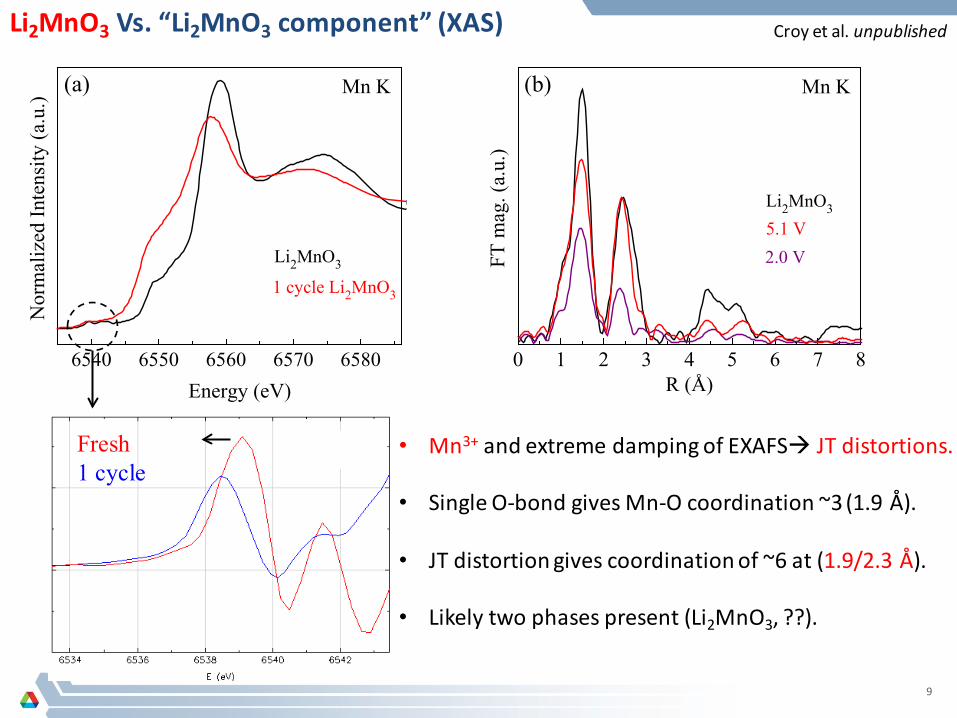
• Mn3+ and extreme damping of EXAFS JT distortions.
• Single O-bond gives Mn-O coordination ~3 (1.9 Å).
• JT distortion gives coordination of ~6 at (1.9/2.3 Å).
• Likely two phases present (Li2MnO3, ??).
Croy et al. unpublished
6540 6550 6560 6570 6580
5.1 V ~300 mAh/g
Nor
mal
ized
Inte
nsity
(a.u
.)
Energy (eV)
Mn K
Li2MnO3
(a)
6540 6550 6560 6570 6580
5.1 V
200 mAh/g100 mAh/g
2.0 V
Nor
mal
ized
Inte
nsity
(a.u
.)
Energy (eV)
Mn K
Li2MnO3
(a)
6540 6550 6560 6570 6580
1 cycle Li2MnO3
Nor
mal
ized
Inte
nsity
(a.u
.)
Energy (eV)
Mn K
Li2MnO3
(a)
Fresh 1 cycle
Li2MnO3 Vs. “Li2MnO3 component” (XAS)
9
0 1 2 3 4 5 6 7 8
(b)
FT m
ag. (
a.u.
)
R (Å)
Mn K
1 cycle Li2MnO3
1 cycle HE5050
Li2MnO3
6540 6550 6560 6570 6580
1 cycle Li2MnO3
1 cycle HE5050Nor
mal
ized
Inte
nsity
(a.u
.)
Energy (eV)
Mn K
Li2MnO3
(a)
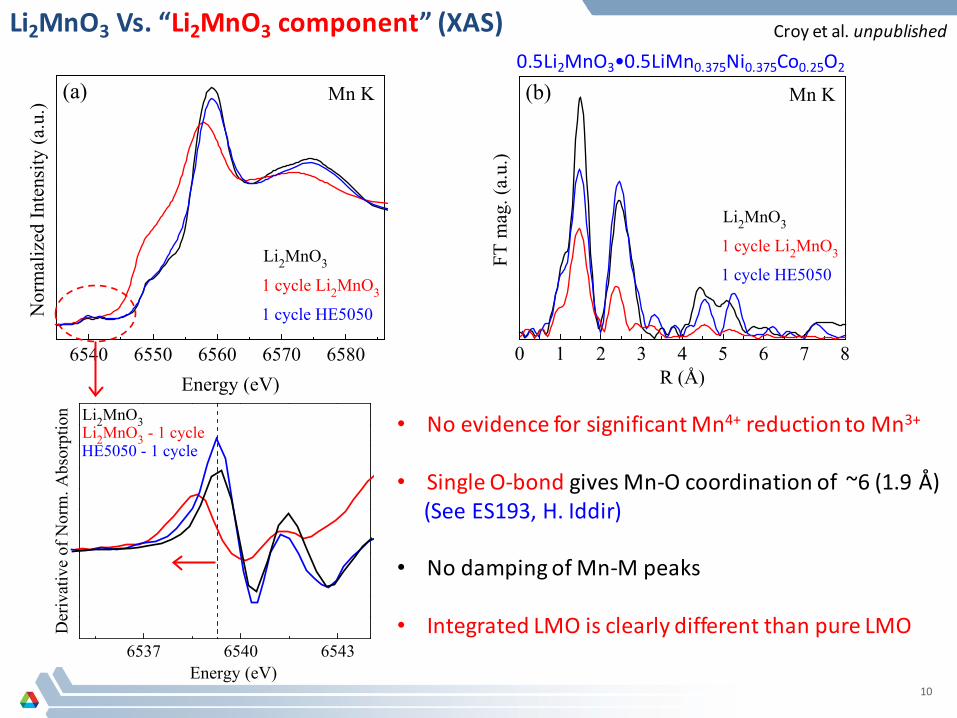
• No evidence for significant Mn4+ reduction to Mn3+
• Single O-bond gives Mn-O coordination of ~6 (1.9 Å) (See ES193, H. Iddir)
• No damping of Mn-M peaks • Integrated LMO is clearly different than pure LMO
Li2MnO3 Vs. “Li2MnO3 component” (XAS) Croy et al. unpublished
0.5Li2MnO3•0.5LiMn0.375Ni0.375Co0.25O2
6537 6540 6543
Der
ivat
ive
of N
orm
. Abs
orpt
ion
Energy (eV)
Li2MnO3 - 1 cycleHE5050 - 1 cycle
Li2MnO3
10
0 1 2 3 4 5 6 7 8
Mn - M
FT
mag
nitu
de (a
.u.)
R (Å)
(a) Mn K
Li2MnO3_Ni
3 cycles
50 cycles
Mn - O
0 1 2 3 4 5 6 7 8
R (Å)
Li2MnO3_Ni
3 cycles
50 cycles
Ni KNi - M
Ni - O
(b)
FT m
agni
tude
(a.u
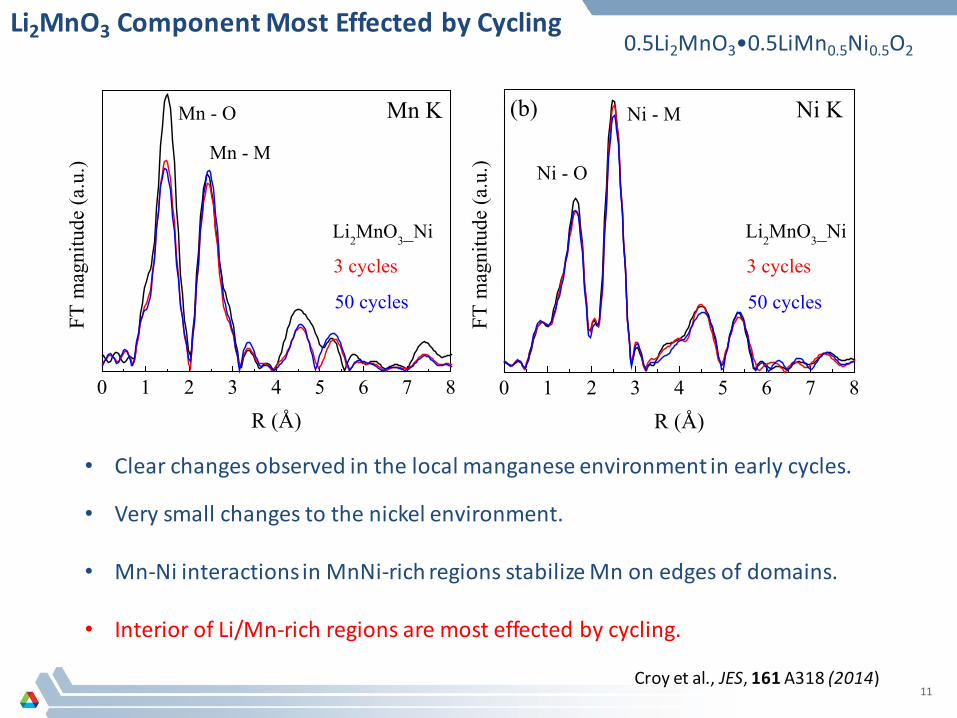
.)• Clear changes observed in the local manganese environment in early cycles.
• Very small changes to the nickel environment.
• Mn-Ni interactions in MnNi-rich regions stabilize Mn on edges of domains.
• Interior of Li/Mn-rich regions are most effected by cycling.
Li2MnO3 Component Most Effected by Cycling
Croy et al., JES, 161 A318 (2014) 11
0.5Li2MnO3•0.5LiMn0.5Ni0.5O2
• Charge ordering, especially between Li and Mn, is the dominant factor dictating local, nanocomposite nature of xLi2MnO3•(1-x)LiMO2 oxides. • Li/Mn rich domains form at low temperatures early in synthesis resulting in two different average environments for Mn relative to other TMs. • Li/Mn rich domains are locally similar to Li2MnO3 ; however, the observed electrochemistry is different than pure Li2MnO3.
• Li/Mn ordering plays a critical role in structural changes on cycling.
Part 1 Summary
12
x [xLi2MnO3•(1-x)LiMn0.5Ni0.5O2] 0.1 0.3 0.5
Voltage Fade vs. x
0
10
20
30
40
50
60
70
80
3.7
V C
harg
e C
apac
ity (m
Ah/
g)
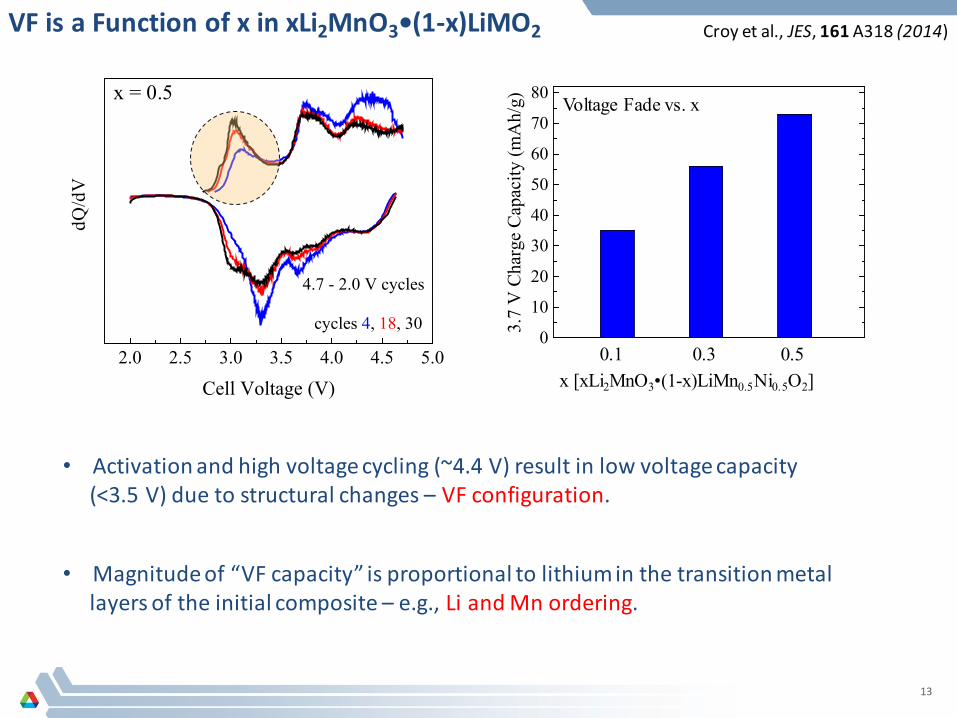
VF is a Function of x in xLi2MnO3•(1-x)LiMO2 Croy et al., JES, 161 A318 (2014)
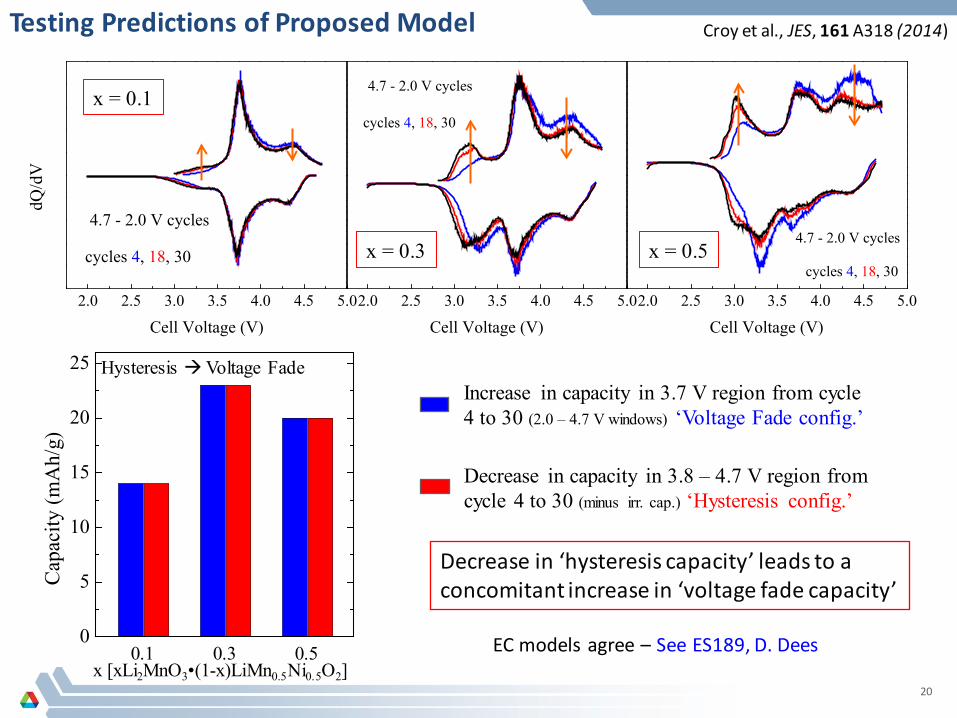
2.0 2.5 3.0 3.5 4.0 4.5 5.0
Cell Voltage (V)
4.7 - 2.0 V cycles
cycles 4, 18, 30
x = 0.5 dQ
/dV
• Activation and high voltage cycling (~4.4 V) result in low voltage capacity (<3.5 V) due to structural changes – VF configuration.
• Magnitude of “VF capacity” is proportional to lithium in the transition metal layers of the initial composite – e.g., Li and Mn ordering.
13
0.0 0.2 0.4 0.60
150
300
450
600
∆V a
t 50%
SO
C (m
V)
x [xLi2MnO3_(1-x)LiMn0.5Ni0.5O2]
Hysteresis vs. x
x [xLi2MnO3•(1-x)LiMn0.5Ni0.5O2]
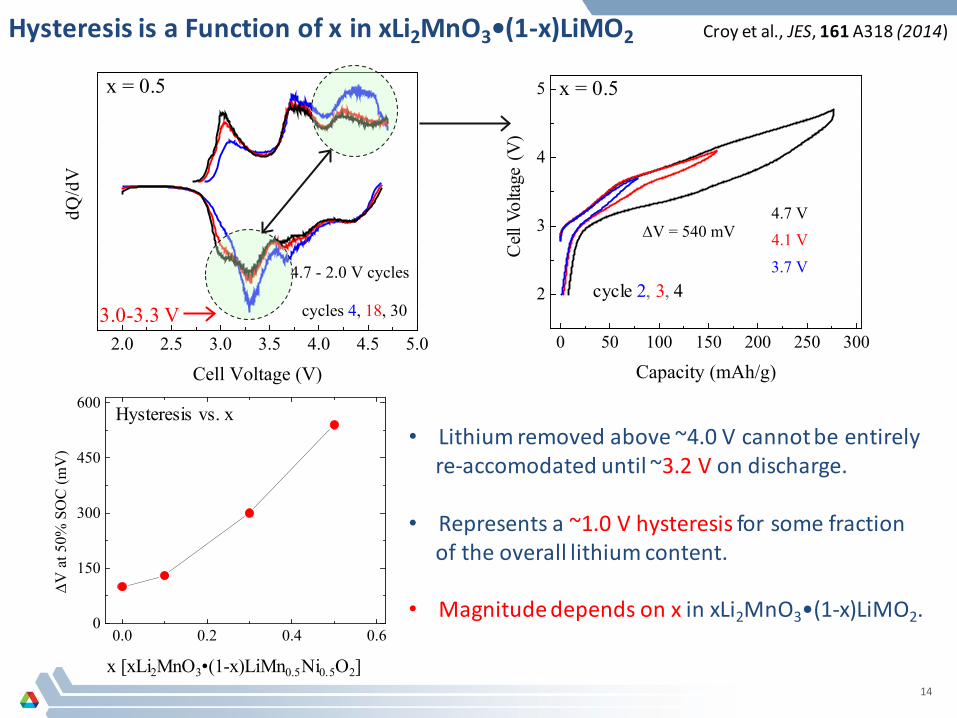
Hysteresis is a Function of x in xLi2MnO3•(1-x)LiMO2
0 50 100 150 200 250 300
2
3
4
5
∆V = 540 mV
Capacity (mAh/g)
4.7 V
3.7 V
4.1 V
x = 0.5
cycle 2, 3, 4
Cell
Vol
tage
(V
)
Croy et al., JES, 161 A318 (2014)
2.0 2.5 3.0 3.5 4.0 4.5 5.0
Cell Voltage (V)
4.7 - 2.0 V cycles
cycles 4, 18, 30
x = 0.5 dQ
/dV
3.0-3.3 V
• Lithium removed above ~4.0 V cannot be entirely re-accomodated until ~3.2 V on discharge. • Represents a ~1.0 V hysteresis for some fraction of the overall lithium content. • Magnitude depends on x in xLi2MnO3•(1-x)LiMO2.
14
2 3 4 5
2
0
2
1
2
dQ/d
V
Cell voltage (V)
3
4
5 6 7
8
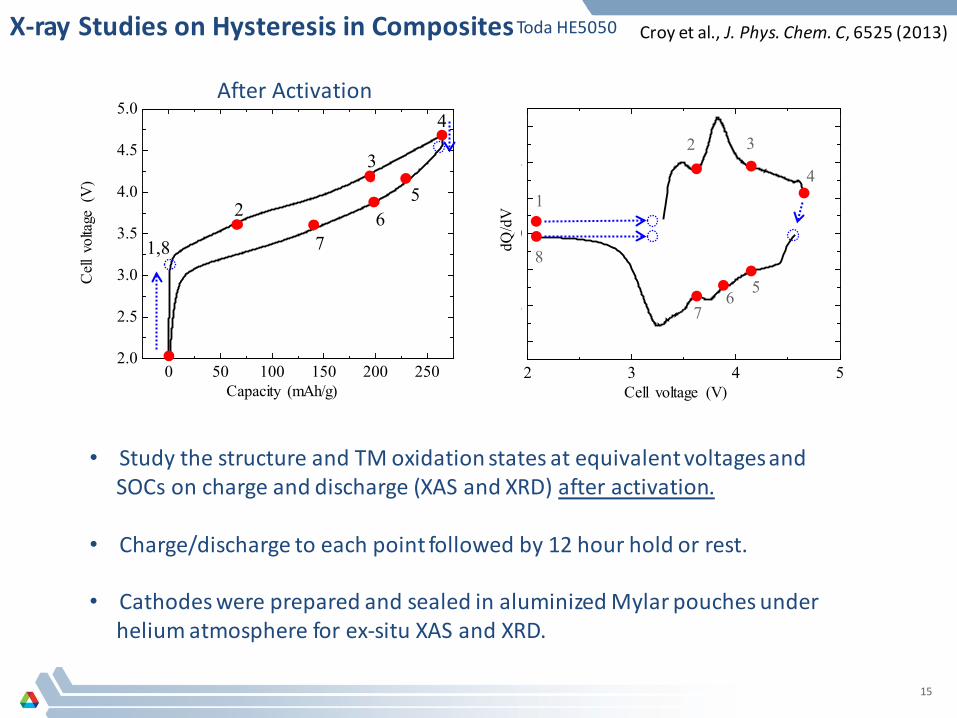
• Study the structure and TM oxidation states at equivalent voltages and SOCs on charge and discharge (XAS and XRD) after activation. • Charge/discharge to each point followed by 12 hour hold or rest. • Cathodes were prepared and sealed in aluminized Mylar pouches under helium atmosphere for ex-situ XAS and XRD.
0 50 100 150 200 2502.0
2.5
3.0
3.5
4.0
4.5
5.0
76
5
4
3
2
1,8
Capacity (mAh/g)
Cell
vol
tage
(V
) After Activation
Croy et al., J. Phys. Chem. C, 6525 (2013) X-ray Studies on Hysteresis in Composites Toda HE5050
15
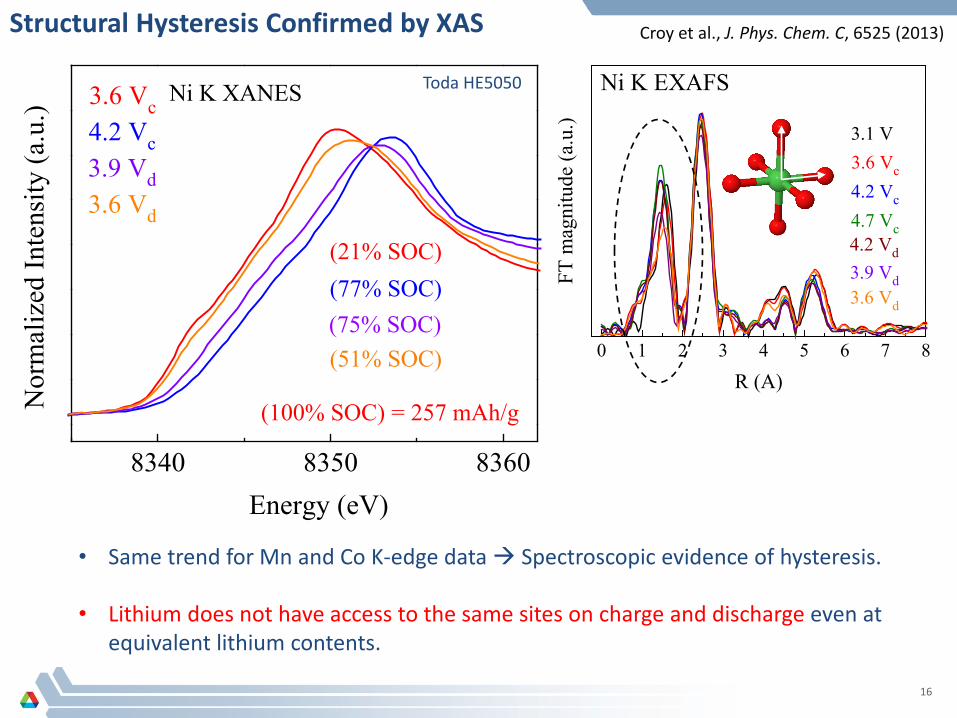
0 1 2 3 4 5 6 7 8
FT m
agni
tude
(a.u
.)
R (A)
3.6 Vd
3.9 Vd
4.2 Vd
3.6 Vc
4.2 Vc
4.7 Vc
3.1 V
(a) Ni K EXAFS
• Same trend for Mn and Co K-edge data Spectroscopic evidence of hysteresis. • Lithium does not have access to the same sites on charge and discharge even at
equivalent lithium contents.
8340 8350 8360
3.6 Vd
3.9 Vd
Nor
mal
ized
Inte
nsity
(a.u
.)
Energy (eV)
3.6 Vc4.2 Vc
(21% SOC) (77% SOC) (75% SOC) (51% SOC)
(100% SOC) = 257 mAh/g
Ni K XANES
Croy et al., J. Phys. Chem. C, 6525 (2013) Structural Hysteresis Confirmed by XAS
Toda HE5050
16
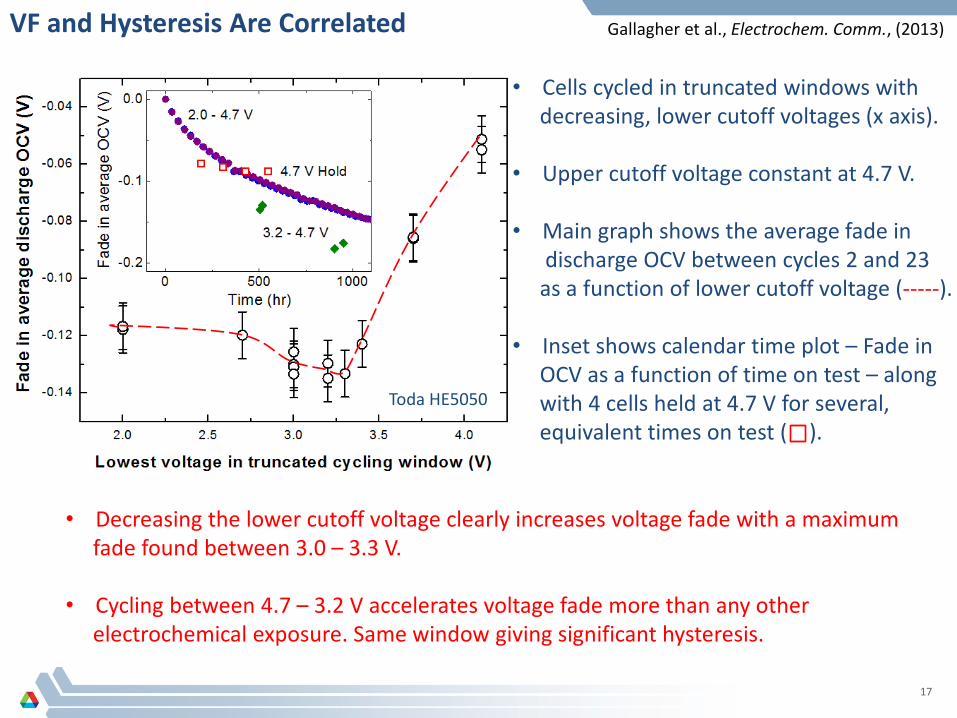
VF and Hysteresis Are Correlated
• Cells cycled in truncated windows with decreasing, lower cutoff voltages (x axis).
• Upper cutoff voltage constant at 4.7 V.
• Main graph shows the average fade in discharge OCV between cycles 2 and 23 as a function of lower cutoff voltage (-----). • Inset shows calendar time plot – Fade in OCV as a function of time on test – along with 4 cells held at 4.7 V for several, equivalent times on test ( ).
• Decreasing the lower cutoff voltage clearly increases voltage fade with a maximum fade found between 3.0 – 3.3 V. • Cycling between 4.7 – 3.2 V accelerates voltage fade more than any other electrochemical exposure. Same window giving significant hysteresis.
Toda HE5050
Gallagher et al., Electrochem. Comm., (2013)
17
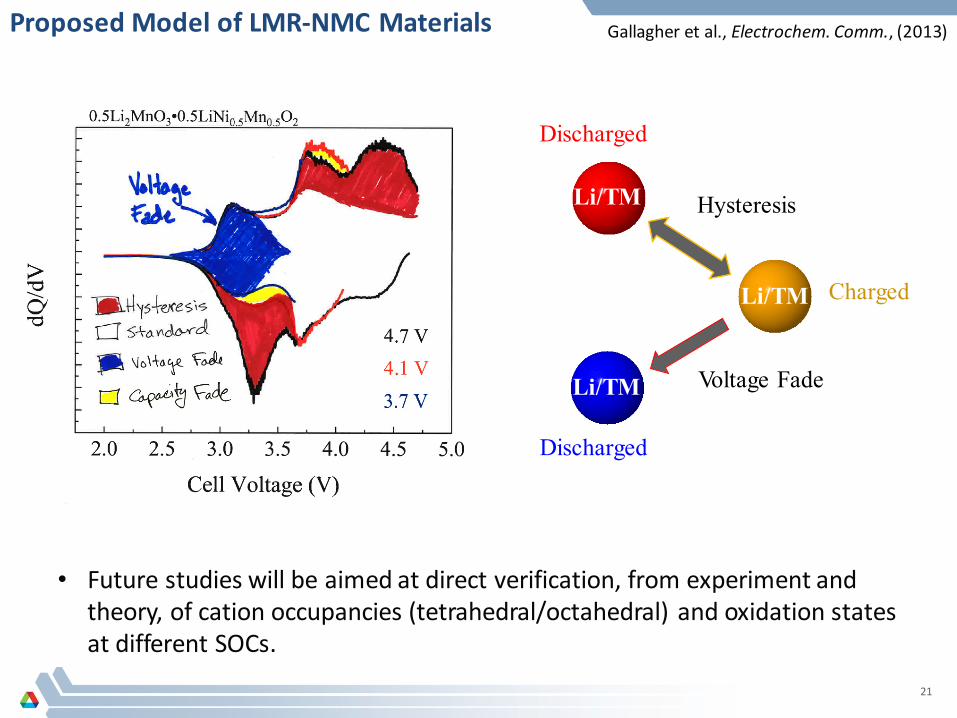
Li/TM
Li/TM
Li/TM
Discharged
Charged
Discharged
Hysteresis
Voltage Fade
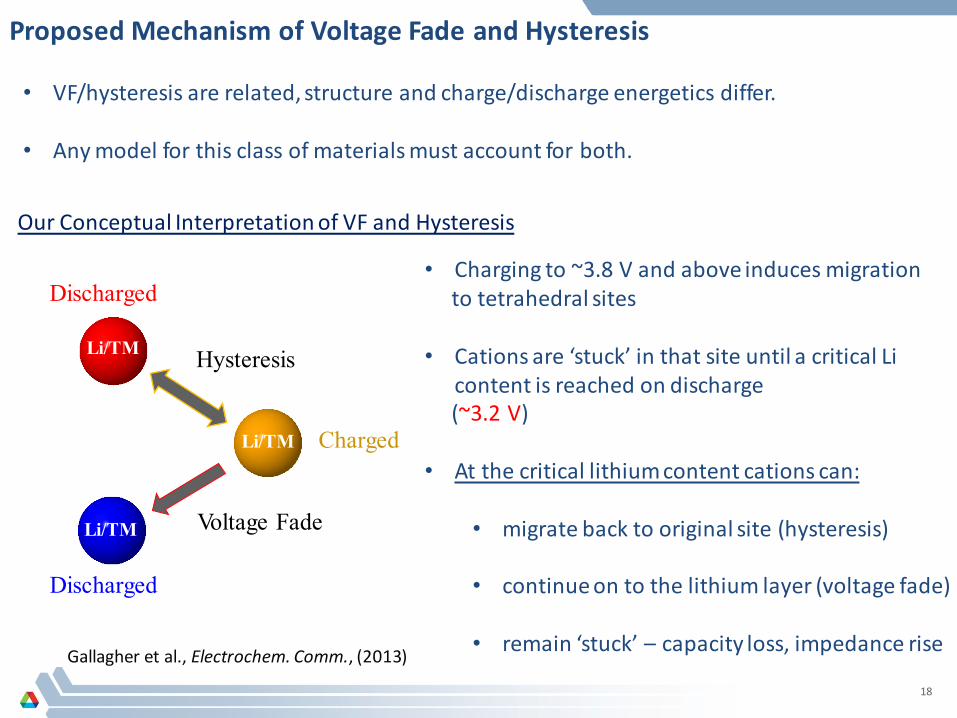
Proposed Mechanism of Voltage Fade and Hysteresis
• VF/hysteresis are related, structure and charge/discharge energetics differ.
• Any model for this class of materials must account for both.
Our Conceptual Interpretation of VF and Hysteresis
Gallagher et al., Electrochem. Comm., (2013)
• Charging to ~3.8 V and above induces migration to tetrahedral sites
• Cations are ‘stuck’ in that site until a critical Li
content is reached on discharge (~3.2 V) • At the critical lithium content cations can:
• migrate back to original site (hysteresis)
• continue on to the lithium layer (voltage fade)
• remain ‘stuck’ – capacity loss, impedance rise
18
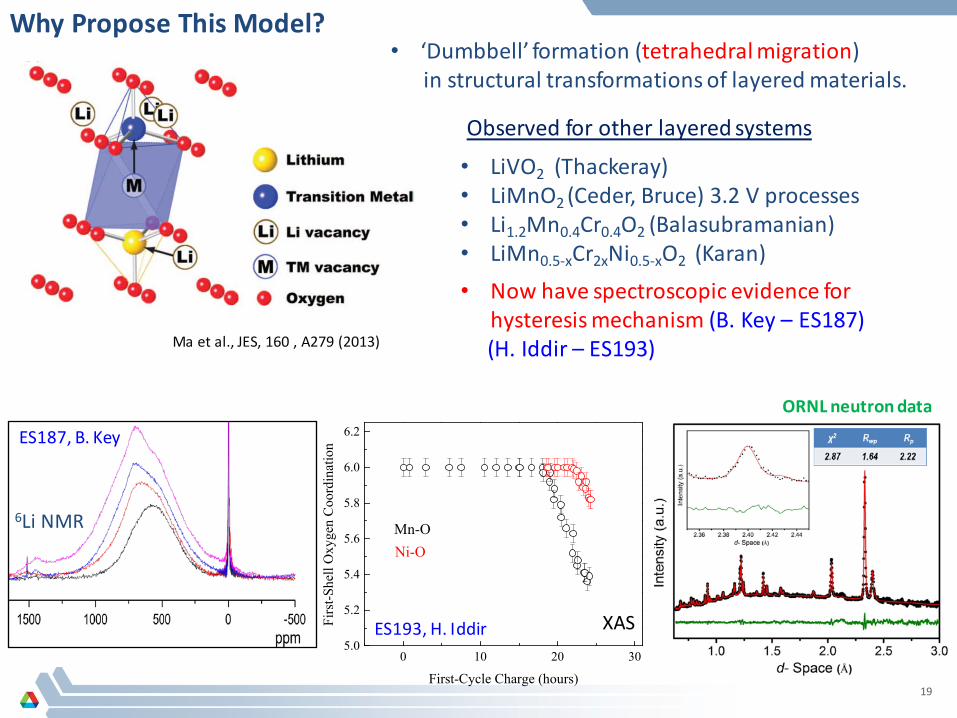
Why Propose This Model? • ‘Dumbbell’ formation (tetrahedral migration) in structural transformations of layered materials.
Ma et al., JES, 160 , A279 (2013)
• Now have spectroscopic evidence for hysteresis mechanism (B. Key – ES187)
(H. Iddir – ES193)
Observed for other layered systems
• LiVO2 (Thackeray) • LiMnO2 (Ceder, Bruce) 3.2 V processes • Li1.2Mn0.4Cr0.4O2 (Balasubramanian) • LiMn0.5-xCr2xNi0.5-xO2 (Karan)
ES187, B. Key
6Li NMR
0 10 20 305.0
5.2
5.4
5.6
5.8
6.0
6.2
Firs
t-She
ll O
xyge
n C
oord
inat
ion
First-Cycle Charge (hours)
Mn-ONi-O
ES193, H. Iddir XAS
19
ORNL neutron data
2.0 2.5 3.0 3.5 4.0 4.5 5.0
Cell Voltage (V)
4.7 - 2.0 V cycles
cycles 4, 18, 30
2.0 2.5 3.0 3.5 4.0 4.5 5.0
Cell Voltage (V)
4.7 - 2.0 V cycles
cycles 4, 18, 30
2.0 2.5 3.0 3.5 4.0 4.5 5.0
dQ
/dV
Cell Voltage (V)
4.7 - 2.0 V cycles
cycles 4, 18, 30
x = 0.1
x = 0.3 x = 0.5
Increase in capacity in 3.7 V region from cycle 4 to 30 (2.0 – 4.7 V windows) ‘Voltage Fade config.’
Decrease in capacity in 3.8 – 4.7 V region from cycle 4 to 30 (minus irr. cap.) ‘Hysteresis config.’
Hysteresis Voltage Fade
Decrease in ‘hysteresis capacity’ leads to a concomitant increase in ‘voltage fade capacity’
x [xLi2MnO3•(1-x)LiMn0.5Ni0.5O2] 0.1 0.3 0.5
0
5
10
15
20
25
Cap
acity
(mA
h/g)
Croy et al., JES, 161 A318 (2014)
EC models agree – See ES189, D. Dees
Testing Predictions of Proposed Model
20
Li/TM
Li/TM
Li/TM
Discharged
Charged
Discharged
Hysteresis
Voltage Fade
Proposed Model of LMR-NMC Materials
• Future studies will be aimed at direct verification, from experiment and theory, of cation occupancies (tetrahedral/octahedral) and oxidation states at different SOCs.
Gallagher et al., Electrochem. Comm., (2013)
21
Summary • Charge ordering drives local “composite” nature of LMR-NMC materials.
– Activation of the Li2MnO3 component is necessary for both – Both increase in prominence with increasing x – Cycling above ~4 V extracts lithium that is not accommodated on discharge until 3.0 – 3.3 V – Window studies show that a lower cutoff of 3.0 – 3.3 V accelerates Voltage fade faster than any other electrochemical exposure
• Proposed model involves tetrahedral migration of lithium and TMs on charge creating a barrier to lithium insertion until a sufficient driving force is established at some critical lithium content on discharge (~3.2 V). • Driving force triggers one of three possibilities:
1) TM/Li returns to its original octahedral position in the TM layer Hysteresis 2) TM/Li migrates to a new octahedral position (e.g. in the Li layer) Voltage Fade 3) TM/Li becomes trapped in the tetrahedral site Loss of capacity, increased impedance
• Voltage fade and hysteresis are related and depend on x in xLi2MnO3•(1-x)LiMnO2.
23


![AP-LMR2000 LMR Gateway Presentation File [호환 모드] Contents • Product Overview AP-LMR2000 LMR Gateway Product Overview • Hardware Specification • APOS Technology • LMR(Land-to-Mobile](https://static.fdocuments.in/doc/165x107/5e06d97e4d6fba74fe28842f/ap-lmr2000-lmr-gateway-presentation-file-eeoe-contents-a-product-overview.jpg)