UNDERSTANDING SOUTH AFRICA'S …€¦ · Description ATC 5th level Dec 2015 ... 3rd generation...
19
UNDERSTANDING SOUTH AFRICA'S CONSUMPTION OF ANTIMICROBIALS Pharmacy Society of South Africa Conference 2018 Ruth Lancaster
Transcript of UNDERSTANDING SOUTH AFRICA'S …€¦ · Description ATC 5th level Dec 2015 ... 3rd generation...

UNDERSTANDING SOUTH AFRICA'S CONSUMPTION OF ANTIMICROBIALS
Pharmacy Society of South Africa
Conference 2018
Ruth Lancaster
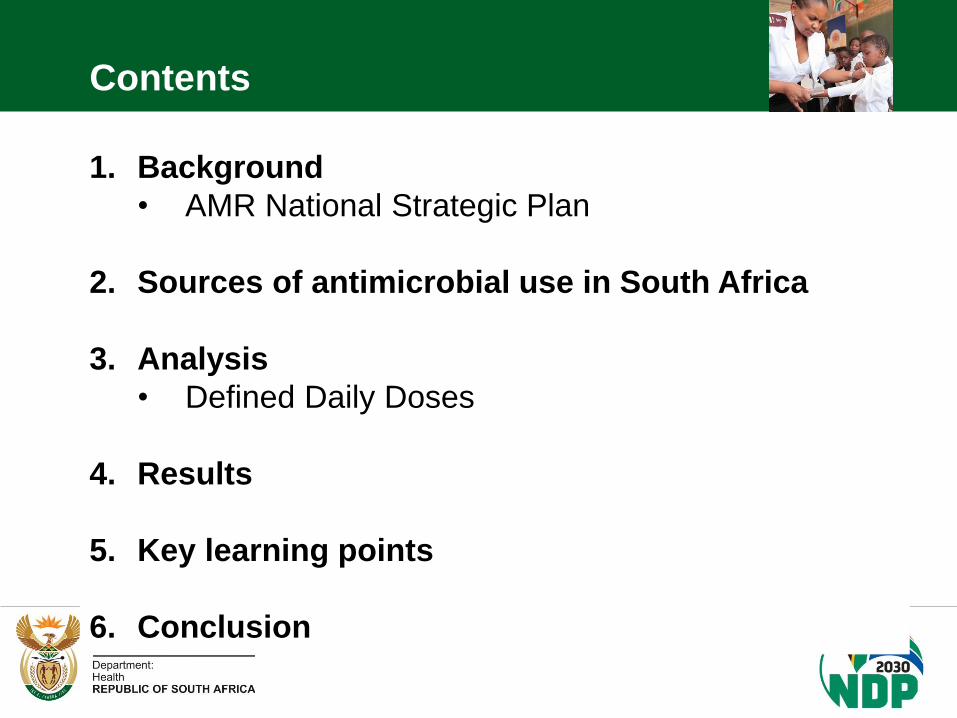
1. Background
• AMR National Strategic Plan
2. Sources of antimicrobial use in South Africa
3. Analysis
• Defined Daily Doses
4. Results
5. Key learning points
6. Conclusion
Contents

WHA endorses Global Action Plan on AMR in
May 2014
AMR Strategy Framework
October 2015
AMR Implementation plan
Approved in June 2015
AMS One Health Governance Guidelines
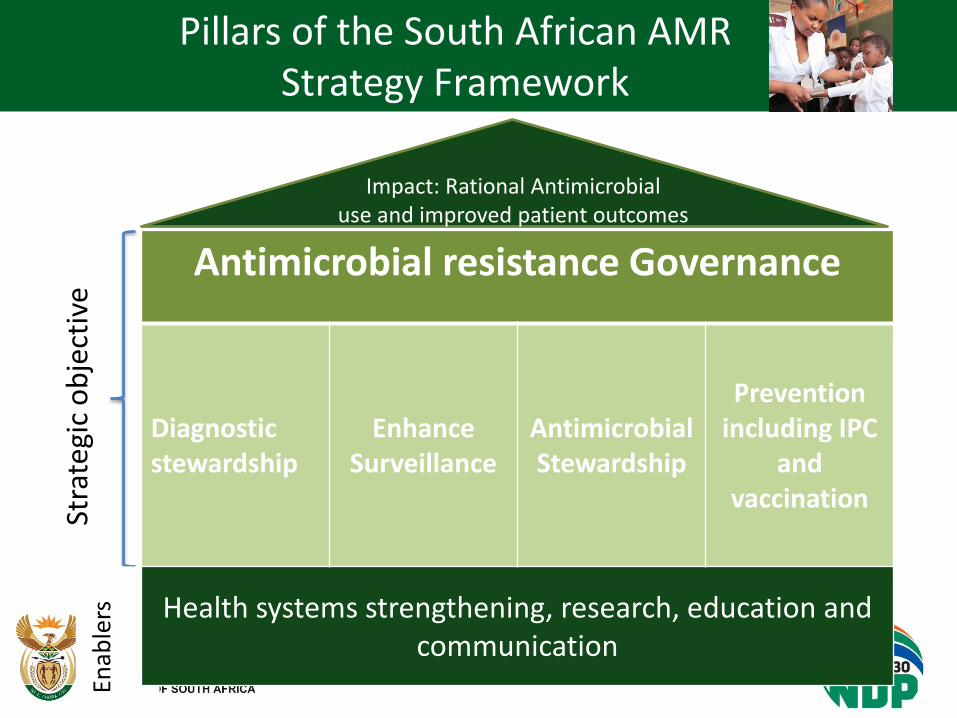
Pillars of the South African AMR Strategy Framework
Stra
tegi
c o
bje
ctiv
e
En
able
rs
Antimicrobial resistance Governance
Diagnostic stewardship
Enhance Surveillance
Antimicrobial Stewardship
Prevention including IPC
and vaccination
Health systems strengthening, research, education and communication
Impact: Rational Antimicrobial use and improved patient outcomes

Strategic Objective 2 & 3
5
Improve appropriate use of diagnostics and optimise surveillance
Strengthen passive and active surveillance locally and nationally
• Antimicrobial resistance
• Antimicrobial use
MAC-AMR: Surveillance Working Group co-ordinating the consolidation of data
from private and public sectors on AMR resistance – Goal: advise NDoH on EML
and formularies; yearly report with resistance maps
80-10060-7940-5920-390-9
Figure 1-2: Percentage of extended-spectrum beta-lactamase producing Escherichia coli*, by country (most recent year, 2011-2014)
Source: CDDEP 2015, WHO 2014 and PAHO, forthcoming
No data10-19
Escherichia coli (E coli) – world
benchmark
11
Sources of AMU in SA
6
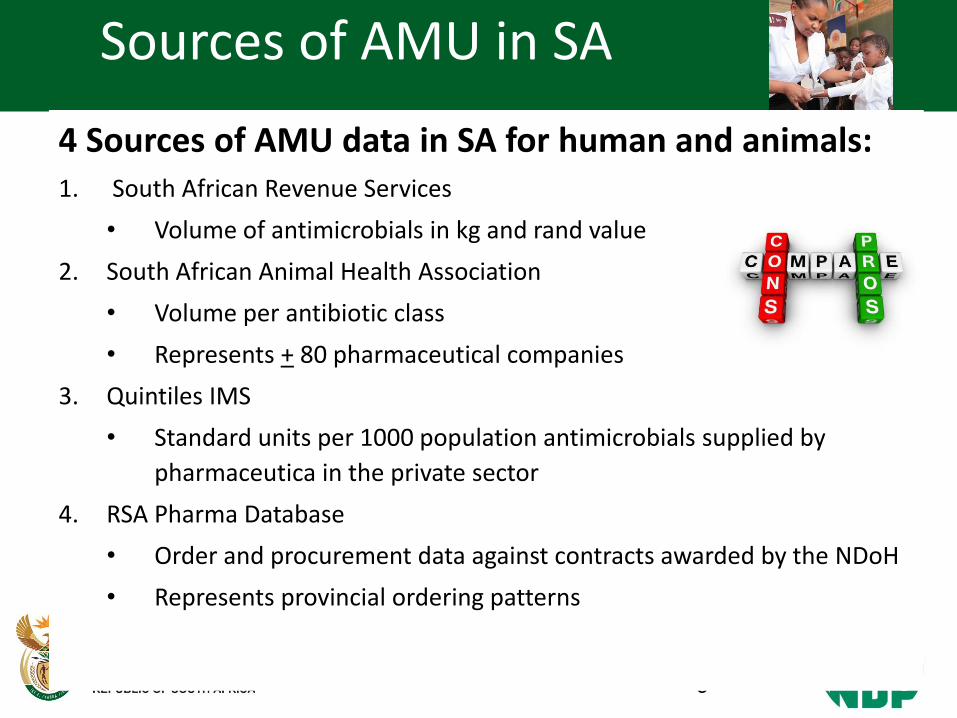
4 Sources of AMU data in SA for human and animals: 1. South African Revenue Services
• Volume of antimicrobials in kg and rand value
2. South African Animal Health Association
• Volume per antibiotic class
• Represents + 80 pharmaceutical companies
3. Quintiles IMS
• Standard units per 1000 population antimicrobials supplied by
pharmaceutica in the private sector
4. RSA Pharma Database
• Order and procurement data against contracts awarded by the NDoH
• Represents provincial ordering patterns
7
Sources of AMU in SA
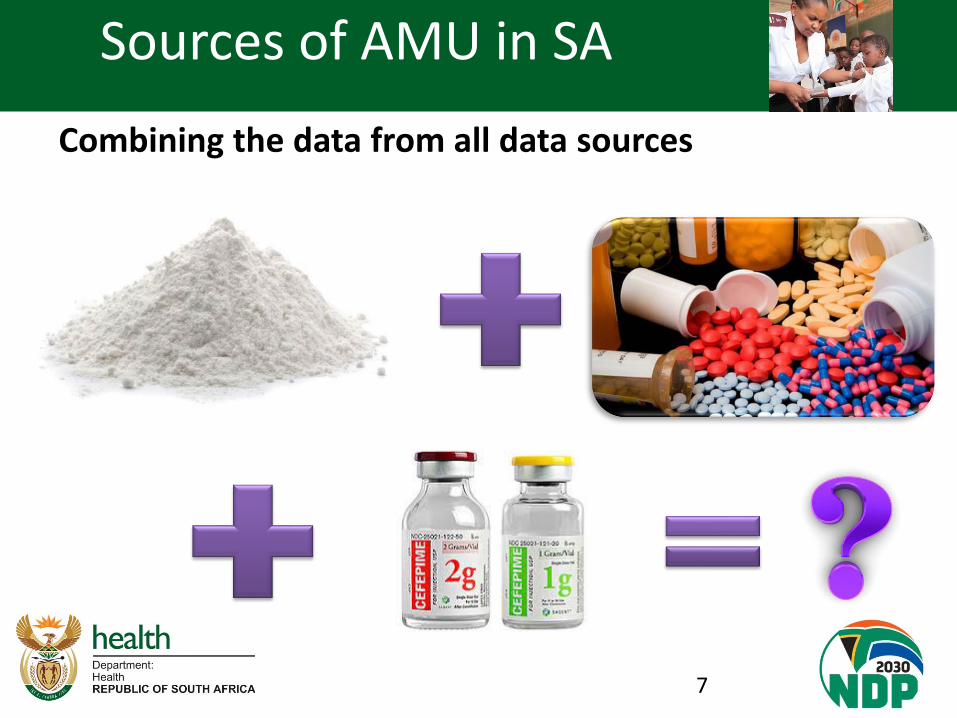
Combining the data from all data sources
https://www.whocc.no/ddd/definition_and_general_considera/
8
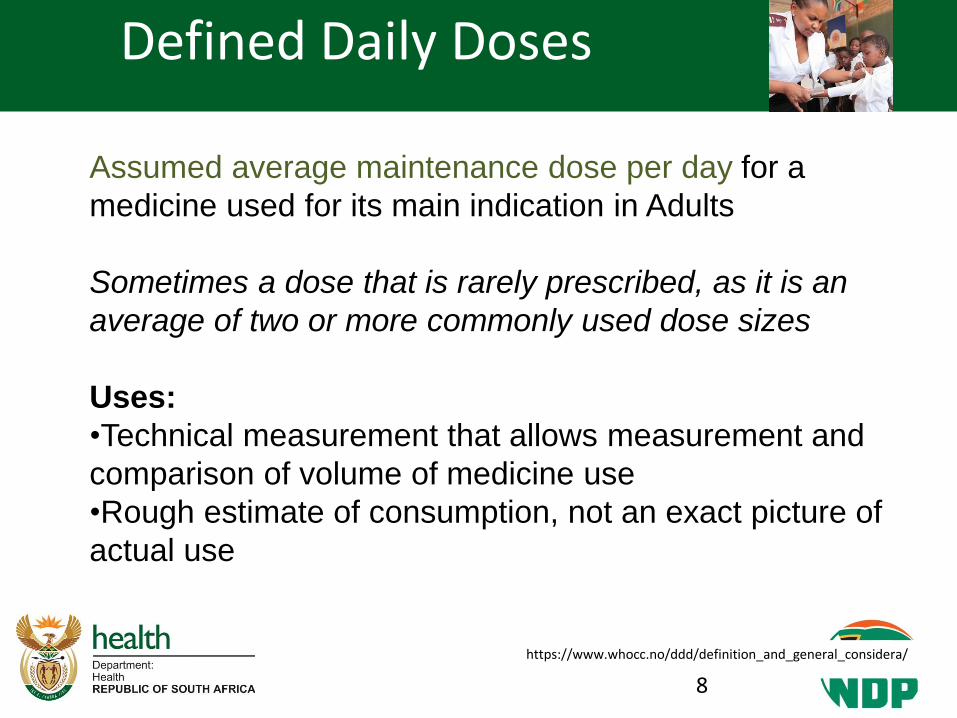
Assumed average maintenance dose per day for a
medicine used for its main indication in Adults
Sometimes a dose that is rarely prescribed, as it is an
average of two or more commonly used dose sizes
Uses:
•Technical measurement that allows measurement and
comparison of volume of medicine use
•Rough estimate of consumption, not an exact picture of
actual use
Defined Daily Doses
9
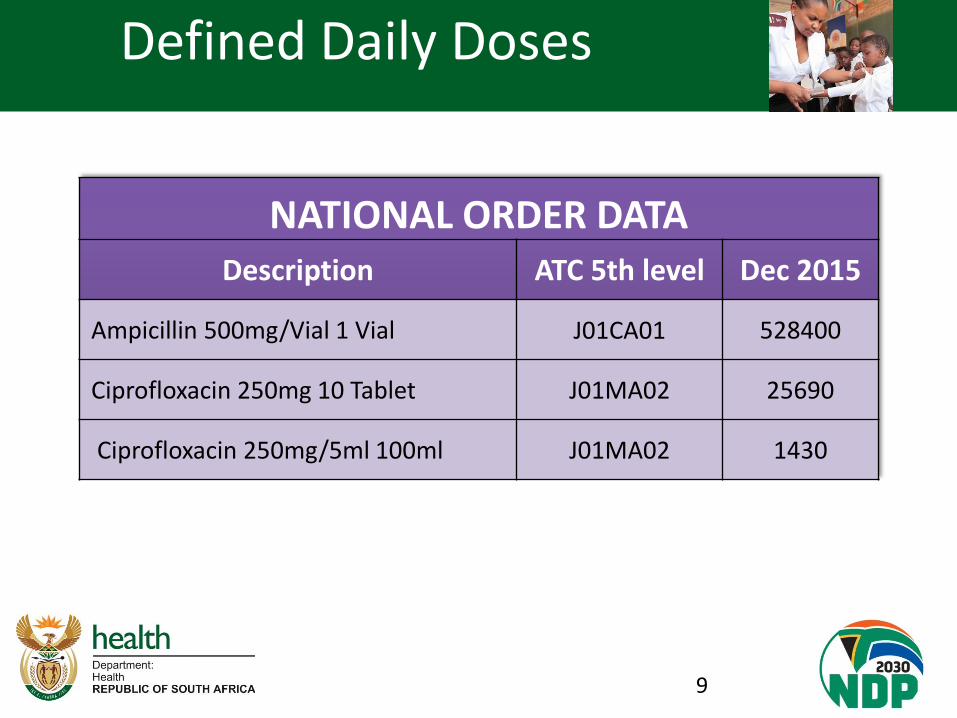
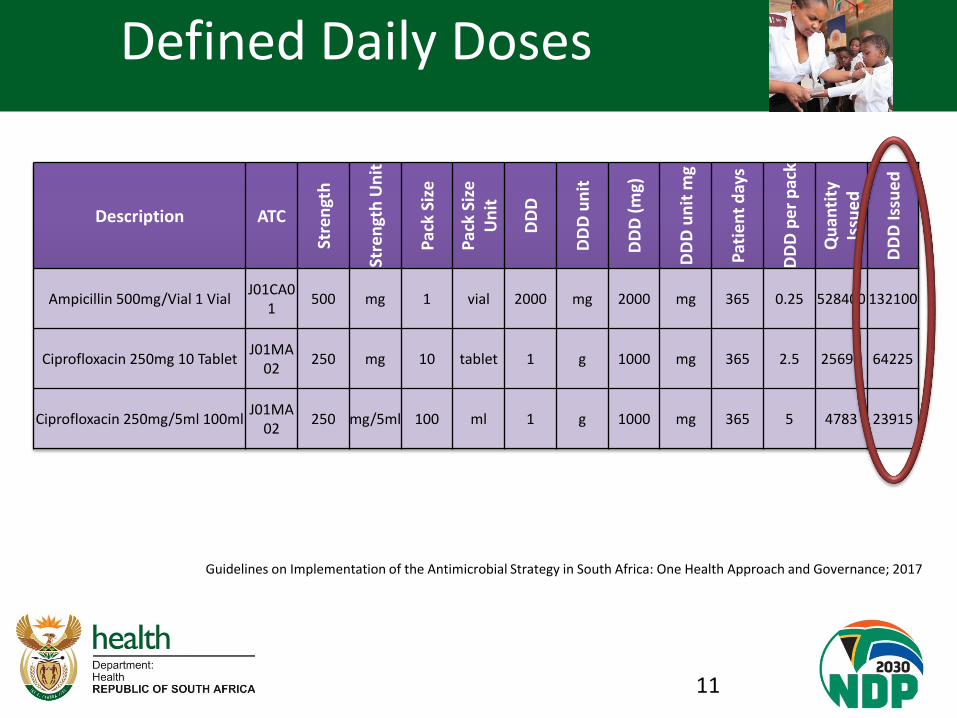
NATIONAL ORDER DATA Description ATC 5th level Dec 2015
Ampicillin 500mg/Vial 1 Vial J01CA01 528400
Ciprofloxacin 250mg 10 Tablet J01MA02 25690
Ciprofloxacin 250mg/5ml 100ml J01MA02 1430
Defined Daily Doses

10
Description ATC
Stre
ngt
h
Stre
ngt
h U
nit
Pac
k Si
ze
Pac
k Si
ze
Un
it
DD
D
DD
D u
nit
DD
D (
mg)
DD
D u
nit
mg
Pat
ien
t d
ays
DD
D p
er
pac
k
Qu
anti
ty
Issu
ed
DD
D Is
sue
d
Ampicillin 500mg/Vial 1 Vial J01CA0
1 500 mg 1 vial 2000 mg 2000 mg 365 0.25 528400 132100
Ciprofloxacin 250mg 10 Tablet J01MA
02 250 mg 10 tablet 1 g 1000 mg 365 2.5 25690 64225
Ciprofloxacin 250mg/5ml 100ml J01MA
02 250 mg/5ml 100 ml 1 g 1000 mg 365 5 4783 23915
Defined Daily Doses
Guidelines on Implementation of the Antimicrobial Strategy in South Africa: One Health Approach and Governance; 2017
11
Description ATC
Stre
ngt
h
Stre
ngt
h U
nit
Pac
k Si
ze
Pac
k Si
ze
Un
it
DD
D
DD
D u
nit
DD
D (
mg)
DD
D u
nit
mg
Pat
ien
t d
ays
DD
D p
er
pac
k
Qu
anti
ty
Issu
ed
DD
D Is
sue
d
Ampicillin 500mg/Vial 1 Vial J01CA0
1 500 mg 1 vial 2000 mg 2000 mg 365 0.25 528400 132100
Ciprofloxacin 250mg 10 Tablet J01MA
02 250 mg 10 tablet 1 g 1000 mg 365 2.5 25690 64225
Ciprofloxacin 250mg/5ml 100ml J01MA
02 250 mg/5ml 100 ml 1 g 1000 mg 365 5 4783 23915
Defined Daily Doses
Guidelines on Implementation of the Antimicrobial Strategy in South Africa: One Health Approach and Governance; 2017
12
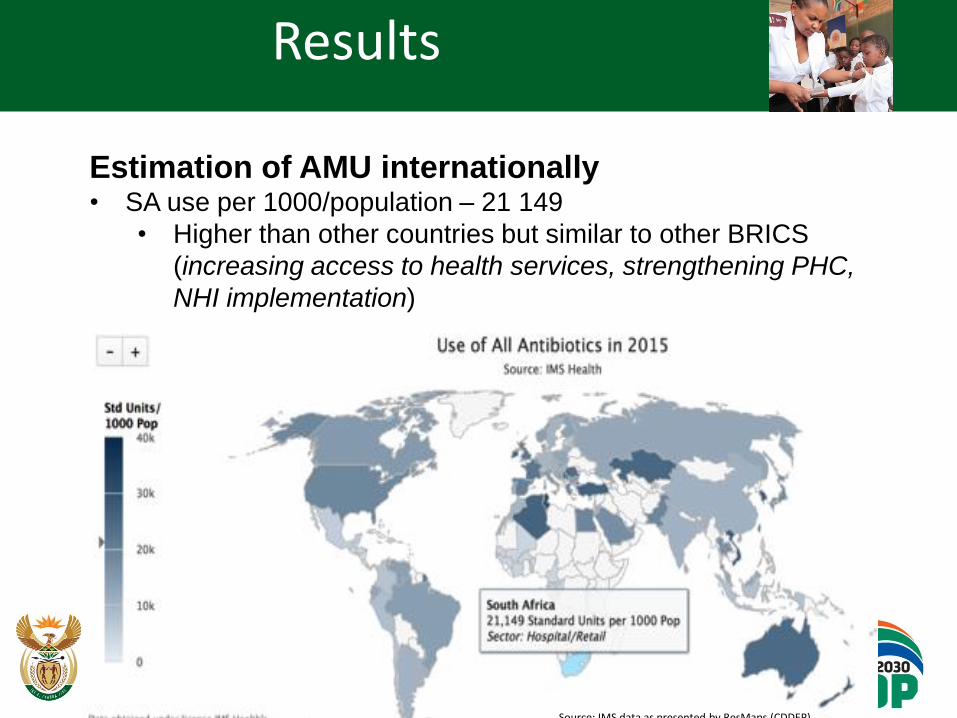
Estimation of AMU internationally • SA use per 1000/population – 21 149
• Higher than other countries but similar to other BRICS
(increasing access to health services, strengthening PHC,
NHI implementation)
Results
Source: IMS data as presented by ResMaps (CDDEP)

13
Results
Source: IMS data as presented by ResMaps (CDDEP)
Estimation of AMU nationally • SA use per 1000/population – 21 149
• 1/3 = cotrimoxazole
• PJP prophylaxis
• Increasing broad spectrum penicillin use
• 1.3 – 3.3 x other BRICS countries
• 0.8 x UK and USA

14 Source: IMS data as presented by ResMaps (CDDEP)
49% 51%
Antibacterials: J01 Pharmadatabase 2015-17
Co-trimoxazole
Antibacterials for systemic useexcluding Co-trimoxazole
Antibacterials: J01 excluding cotrimoxazole RSA Pharmadatabase 2015-2017
Broad spectrum
Narrow spectrum
Carbapenems
Vancomycin
3rd generation cephalosporins
Fluoroquinolones
Macrolides

15
Results
Source: IMS data as presented by ResMaps (CDDEP)
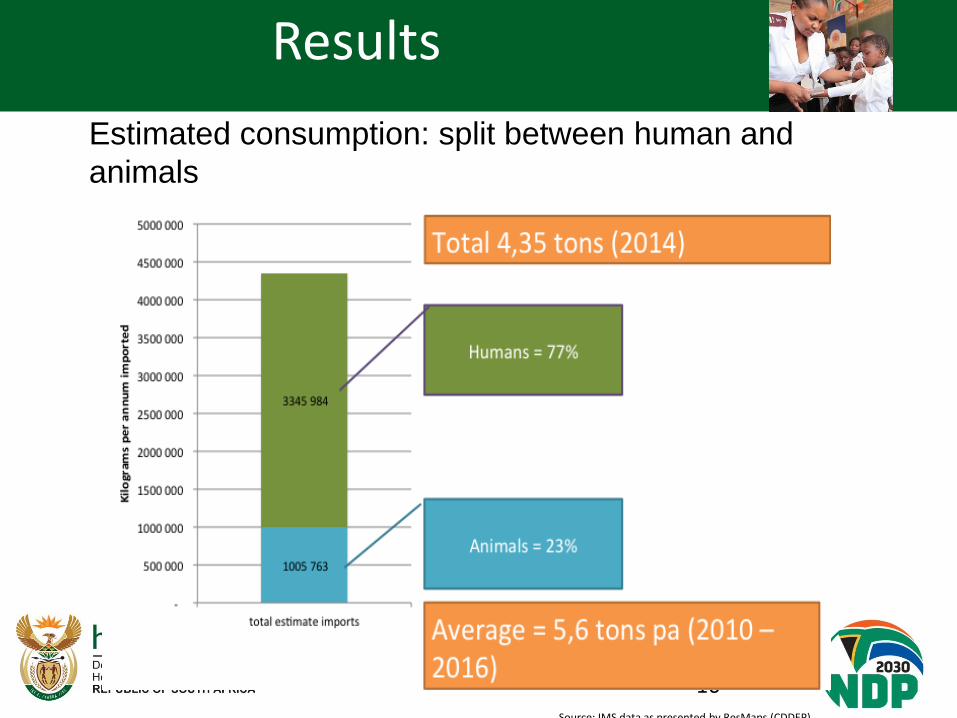
Estimation of AMU: human vs animal • South Africa imported 4.35 tons of antimicrobials (2014)
• Animals = 23%
• USA reported 80% consumption by animal health
16
Results
Source: IMS data as presented by ResMaps (CDDEP)
Estimated consumption: split between human and
animals

17
Key learning points
Source: IMS data as presented by ResMaps (CDDEP)
• Limitations to the data
• Initial overview of the country AMU can be seen:
• Human use > animal use
• Broad spectrum penicillin most used antibiotic class
Community or Hospital?
Public or Private?
Adherence to Standard Treatment Guidelines?

18
Conclusion
Source: IMS data as presented by ResMaps (CDDEP)
• Sustainable and consistent sources of data are critical
• Trend analysis to monitor interventions put into place
http://www.bioethics.net/2018/04/the-end-is-nigh-bioethics-and-antibiotic-resistance/

19
Thanks to
Source: IMS data as presented by ResMaps (CDDEP)
• Dr Kim Faure