UNDERSTANDING RESEARCH RESULTS: STATISTICAL INFERENCE © 2012 The McGraw-Hill Companies, Inc.
23
UNDERSTANDING RESEARCH RESULTS: STATISTICAL INFERENCE © 2012 The McGraw-Hill Companies, Inc.
-
Upload
janice-quinn -
Category
Documents
-
view
213 -
download
0
Transcript of UNDERSTANDING RESEARCH RESULTS: STATISTICAL INFERENCE © 2012 The McGraw-Hill Companies, Inc.

UNDERSTANDING RESEARCH RESULTS: STATISTICAL
INFERENCE
© 2012 The McGraw-Hill Companies, Inc.

Explain how researchers use inferential statistics to evaluate sample data
Distinguish between the null hypothesis and the research hypothesis
Discuss probability in statistical inference, including the meaning of statistical significance
© 2012 The McGraw-Hill Companies, Inc.
Describe the t test, and explain the difference between one-tailed and two-tailed tests
Describe the F test, including systematic variance and error variance
Distinguish between Type I and Type II errors
© 2012 The McGraw-Hill Companies, Inc.
Discuss the factors that influence the probability of a Type II error
Discuss the reasons a researcher may obtain nonsignificant results
Define power of a statistical test Describe the criteria for selecting an
appropriate statistical test
© 2012 The McGraw-Hill Companies, Inc.

Inferential statistics are necessary because the results of a given study are based on data
obtained from a single sample of researcher participants and
Data are not based on an entire population of scores
Allows conclusions on the basis of sample data
© 2012 The McGraw-Hill Companies, Inc.

Allow researchers to make inferences about the true differences in populations of scores based on a sample of data from that population
Allows that the difference between sample means may reflect random error rather than a real difference
© 2012 The McGraw-Hill Companies, Inc.

Null Hypothesis H0: The means of the populations from which the
samples were drawn equal Research Hypothesis
H1: The means of the populations from which the samples were drawn equal
© 2012 The McGraw-Hill Companies, Inc.

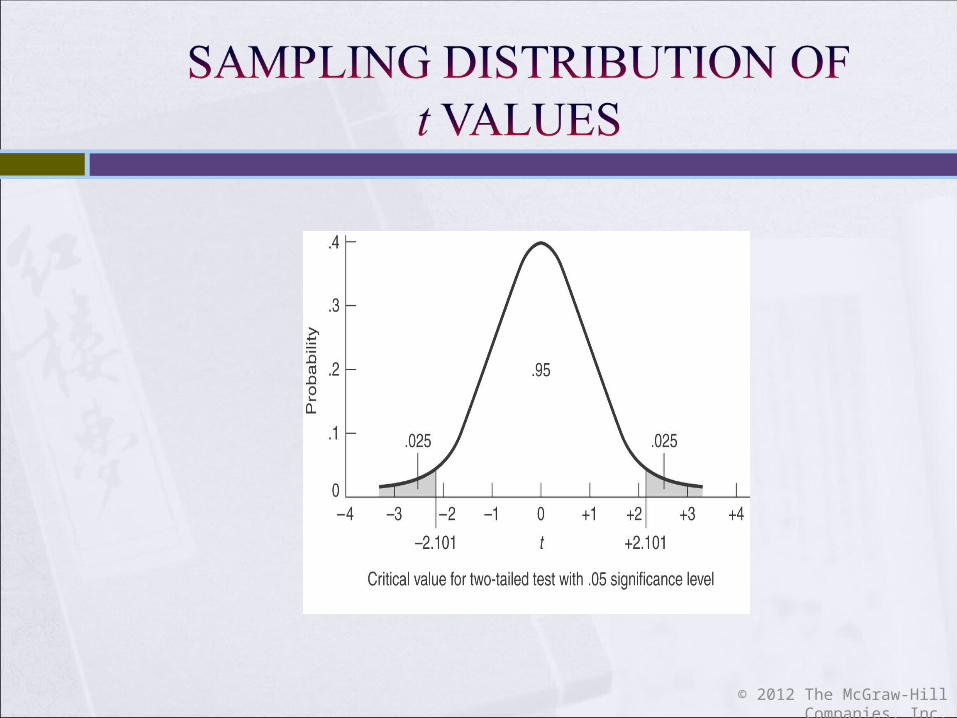
Probability: The Case of ESP Are correct answers due to chance or due to
something more? Sampling Distributions Sample Size
© 2012 The McGraw-Hill Companies, Inc.
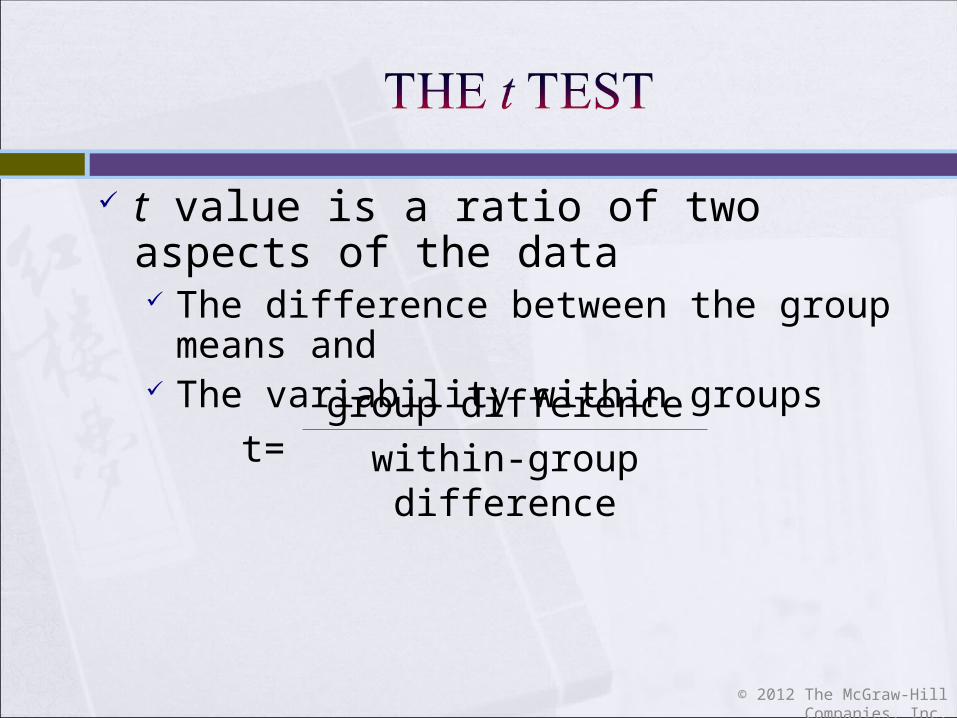
t value is a ratio of two aspects of the data The difference between the group means and The variability within groups
© 2012 The McGraw-Hill Companies, Inc.
t= group difference
within-group difference
© 2012 The McGraw-Hill Companies, Inc.

Degrees of Freedom One-Tailed Two-Tailed Tests The F Test (analysis of variance)
Systematic variance Error variance
© 2012 The McGraw-Hill Companies, Inc.

Calculating Effect Size Confidence Intervals and Statistical
Significance Statistical Significance
© 2012 The McGraw-Hill Companies, Inc.

Type I Errors Made when the null hypothesis is rejected but the
null hypothesis is actually true Obtained when a large value of t or F is obtained
by chance alone
© 2012 The McGraw-Hill Companies, Inc.

Type II Errors Made when the null hypothesis is accepted
although in the population the research hypothesis is true
Factors related to making a Type II error Significance (alpha) level Sample size Effect size
© 2012 The McGraw-Hill Companies, Inc.

© 2012 The McGraw-Hill Companies, Inc.

Researchers traditionally have used either a .05 or a .01 significance level in the decision to reject the null hypothesis
There is universal agreement that the consequences of making a Type I error are more serious than those associated with a Type II error
© 2012 The McGraw-Hill Companies, Inc.

Power is a statistical test that determines optimal sample size based on probability of correctly rejecting the null hypothesis
Power = 1 – p (probability of Type II error) Effect sizes range and desired power
Smaller effect sizes require larger samples to be significant
Higher desired power demands a greater sample size Researchers usually strive power between .70 and .90
© 2012 The McGraw-Hill Companies, Inc.

Scientists attach little importance to results of a single study
Detailed understanding requires numerous studies examining same variables
Researchers look at the results of studies that replicate previous investigations
© 2012 The McGraw-Hill Companies, Inc.

Is the relationship statistically significant? H0: r = 0 and
H1: r ≠ 0
It is proper to conduct a t-test to compare the
r-value with the null correlation of 0.00
© 2012 The McGraw-Hill Companies, Inc.

Software Programs include SPSS SAS Minitab Microsoft Excel
Steps in analysis Input data
Rows represent cases or each participant’s scores Columns represent for a participant’s score for a specific variable
Conduct analysis Interpret output
© 2012 The McGraw-Hill Companies, Inc.

One Independent Variable Nominal Scale Data Ordinal Scale Data Interval or Ratio Scale Data
© 2012 The McGraw-Hill Companies, Inc.

© 2012 The McGraw-Hill Companies, Inc.
IV DV Statistical Test
NominalMale-Female
NominalVegetarian – Yes / No
Chi Square
Nominal (2 Groups)Male-Female
Interval / RatioGrade Point Average
t-test
Nominal (3 groups)Study time (Low, Medium, High)
Interval / RatioTest Score
One-way ANOVA
Interval / RatioOptimism Score
Interval / RatioSick Days Last Year
Pearson’s correlation

Multiple Independent Variables Nominal Scale Data – Factorial Design Ordinal Scale Data – no appropriate test is
available Interval or Ratio Scale Data – Multiple Regression
© 2012 The McGraw-Hill Companies, Inc.