Understanding Red Hat OpenStack · you will need to interact with services using both the HA...
43
OpenStack Team Red Hat OpenStack Platform 10 Understanding Red Hat OpenStack Platform High Availability Understanding, deploying, and managing High Availability in Red Hat OpenStack Platform
Transcript of Understanding Red Hat OpenStack · you will need to interact with services using both the HA...
OpenStack Team
Red Hat OpenStack Platform10Understanding Red Hat OpenStackPlatform High Availability
Understanding, deploying, and managing High Availability in Red HatOpenStack Platform


Red Hat OpenStack Platform 10 Understanding Red Hat OpenStackPlatform High Availability
Understanding, deploying, and managing High Availability in Red HatOpenStack Platform
OpenStack [email protected]
Legal Notice
Copyright © 2017 Red Hat, Inc.
The text of and illustrations in this document are licensed by Red Hat under a Creative CommonsAttribution–Share Alike 3.0 Unported license ("CC-BY-SA"). An explanation of CC-BY-SA isavailable athttp://creativecommons.org/licenses/by-sa/3.0/. In accordance with CC-BY-SA, if you distribute this document or an adaptation of it, you mustprovide the URL for the original version.
Red Hat, as the licensor of this document, waives the right to enforce, and agrees not to assert,Section 4d of CC-BY-SA to the fullest extent permitted by applicable law.
Red Hat, Red Hat Enterprise Linux, the Shadowman logo, JBoss, OpenShift, Fedora, the Infinitylogo, and RHCE are trademarks of Red Hat, Inc., registered in the United States and othercountries.
Linux ® is the registered trademark of Linus Torvalds in the United States and other countries.
Java ® is a registered trademark of Oracle and/or its affiliates.
XFS ® is a trademark of Silicon Graphics International Corp. or its subsidiaries in the United Statesand/or other countries.
MySQL ® is a registered trademark of MySQL AB in the United States, the European Union andother countries.
Node.js ® is an official trademark of Joyent. Red Hat Software Collections is not formally related toor endorsed by the official Joyent Node.js open source or commercial project.
The OpenStack ® Word Mark and OpenStack logo are either registered trademarks/service marksor trademarks/service marks of the OpenStack Foundation, in the United States and other countriesand are used with the OpenStack Foundation's permission. We are not affiliated with, endorsed orsponsored by the OpenStack Foundation, or the OpenStack community.
All other trademarks are the property of their respective owners.
AbstractTo keep your OpenStack environment up and running efficiently, Red Hat OpenStack Platform 10Director lets you create configurations that offer high availability and load balancing across all majorservices in OpenStack. This document describes: A foundational HA setup, created by Red HatOpenStack Platform 10 Director, that you can use as a reference model for understanding andworking with OpenStack HA features. HA features that are used to make various services includedin Red Hat OpenStack Platform 10 highly available. Examples of tools for working with andtroubleshooting HA features in Red Hat OpenStack Platform 10.

. . . . . . . . . . . . . . . . . . . . . . . . . . . . . . . . . . . . . . . . . . . . . . . . . . . . . . . . . . . . . . . . . . . . . . . . . . . . . . . . . . . . . . . . . . . . . . . . . . . . . . . . . . . . . . . . . . . . . . . . . . . . . . . . . . . . . . . . . . . . . . . . . . . . . . . . . . . . . . . . . . . . . . . . . . . . . . . . . . . . . . . . . . . . . . . . . . . . . . . . . . . . . . . . . . . . . . . . . . . . . . . . . . . . . . . . . . . . . . . . . . . . . . . . . . . . . . . . . . . . . . . . . . . . . . . . . . . . . . . .
. . . . . . . . . . . . . . . . . . . . . . . . . . . . . . . . . . . . . . . . . . . . . . . . . . . . . . . . . . . . . . . . . . . . . . . . . . . . . . . . . . . . . . . . . . . . . . . . . . . . . . . . . . . . . . . . . . . . . . . . . . . . . . . . . . . . . . . . . . . . . . . . . . . . . . . . . . . . . . . . . . . . . . . . . . . . . . . . . . . . . . . . . . . . . . . . . . . . . . . . . . . . . . . . . . . . . . . . . . . . . . . . . . . . . . . . . . . . . . . . . . . . . . . . . . . . . . . . . . . . . . . . . . . . . . . . . . . . . . . .
. . . . . . . . . . . . . . . . . . . . . . . . . . . . . . . . . . . . . . . . . . . . . . . . . . . . . . . . . . . . . . . . . . . . . . . . . . . . . . . . . . . . . . . . . . . . . . . . . . . . . . . . . . . . . . . . . . . . . . . . . . . . . . . . . . . . . . . . . . . . . . . . . . . . . . . . . . . . . . . . . . . . . . . . . . . . . . . . . . . . . . . . . . . . . . . . . . . . . . . . . . . . . . . . . . . . . . . . . . . . . . . . . . . . . . . . . . . . . . . . . . . . . . . . . . . . . . . . . . . . . . . . . . . . . . . . . . . . . . . .
. . . . . . . . . . . . . . . . . . . . . . . . . . . . . . . . . . . . . . . . . . . . . . . . . . . . . . . . . . . . . . . . . . . . . . . . . . . . . . . . . . . . . . . . . . . . . . . . . . . . . . . . . . . . . . . . . . . . . . . . . . . . . . . . . . . . . . . . . . . . . . . . . . . . . . . . . . . . . . . . . . . . . . . . . . . . . . . . . . . . . . . . . . . . . . . . . . . . . . . . . . . . . . . . . . . . . . . . . . . . . . . . . . . . . . . . . . . . . . . . . . . . . . . . . . . . . . . . . . . . . . . . . . . . . . . . . . . . . . . .
. . . . . . . . . . . . . . . . . . . . . . . . . . . . . . . . . . . . . . . . . . . . . . . . . . . . . . . . . . . . . . . . . . . . . . . . . . . . . . . . . . . . . . . . . . . . . . . . . . . . . . . . . . . . . . . . . . . . . . . . . . . . . . . . . . . . . . . . . . . . . . . . . . . . . . . . . . . . . . . . . . . . . . . . . . . . . . . . . . . . . . . . . . . . . . . . . . . . . . . . . . . . . . . . . . . . . . . . . . . . . . . . . . . . . . . . . . . . . . . . . . . . . . . . . . . . . . . . . . . . . . . . . . . . . . . . . . . . . . . .
. . . . . . . . . . . . . . . . . . . . . . . . . . . . . . . . . . . . . . . . . . . . . . . . . . . . . . . . . . . . . . . . . . . . . . . . . . . . . . . . . . . . . . . . . . . . . . . . . . . . . . . . . . . . . . . . . . . . . . . . . . . . . . . . . . . . . . . . . . . . . . . . . . . . . . . . . . . . . . . . . . . . . . . . . . . . . . . . . . . . . . . . . . . . . . . . . . . . . . . . . . . . . . . . . . . . . . . . . . . . . . . . . . . . . . . . . . . . . . . . . . . . . . . . . . . . . . . . . . . . . . . . . . . . . . . . . . . . . . . .
. . . . . . . . . . . . . . . . . . . . . . . . . . . . . . . . . . . . . . . . . . . . . . . . . . . . . . . . . . . . . . . . . . . . . . . . . . . . . . . . . . . . . . . . . . . . . . . . . . . . . . . . . . . . . . . . . . . . . . . . . . . . . . . . . . . . . . . . . . . . . . . . . . . . . . . . . . . . . . . . . . . . . . . . . . . . . . . . . . . . . . . . . . . . . . . . . . . . . . . . . . . . . . . . . . . . . . . . . . . . . . . . . . . . . . . . . . . . . . . . . . . . . . . . . . . . . . . . . . . . . . . . . . . . . . . . . . . . . . . .
. . . . . . . . . . . . . . . . . . . . . . . . . . . . . . . . . . . . . . . . . . . . . . . . . . . . . . . . . . . . . . . . . . . . . . . . . . . . . . . . . . . . . . . . . . . . . . . . . . . . . . . . . . . . . . . . . . . . . . . . . . . . . . . . . . . . . . . . . . . . . . . . . . . . . . . . . . . . . . . . . . . . . . . . . . . . . . . . . . . . . . . . . . . . . . . . . . . . . . . . . . . . . . . . . . . . . . . . . . . . . . . . . . . . . . . . . . . . . . . . . . . . . . . . . . . . . . . . . . . . . . . . . . . . . . . . . . . . . . . .
. . . . . . . . . . . . . . . . . . . . . . . . . . . . . . . . . . . . . . . . . . . . . . . . . . . . . . . . . . . . . . . . . . . . . . . . . . . . . . . . . . . . . . . . . . . . . . . . . . . . . . . . . . . . . . . . . . . . . . . . . . . . . . . . . . . . . . . . . . . . . . . . . . . . . . . . . . . . . . . . . . . . . . . . . . . . . . . . . . . . . . . . . . . . . . . . . . . . . . . . . . . . . . . . . . . . . . . . . . . . . . . . . . . . . . . . . . . . . . . . . . . . . . . . . . . . . . . . . . . . . . . . . . . . . . . . . . . . . . . .
Table of Contents
CHAPTER 1. OVERVIEW1.1. MANAGING HIGH AVAILABILITY SERVICES
CHAPTER 2. UNDERSTANDING RED HAT OPENSTACK PLATFORM HIGH AVAILABILITY FEATURES
CHAPTER 3. GETTING INTO YOUR OPENSTACK HA ENVIRONMENT
CHAPTER 4. USING PACEMAKER4.1. GENERAL PACEMAKER INFORMATION4.2. VIRTUAL IP ADDRESSES CONFIGURED IN PACEMAKER4.3. OPENSTACK SERVICES CONFIGURED IN PACEMAKER4.4. PACEMAKER FAILED ACTIONS4.5. OTHER PACEMAKER INFORMATION FOR CONTROLLERS4.6. FENCING HARDWARE
CHAPTER 5. USING HAPROXY5.1. HAPROXY STATS5.2. REFERENCES
CHAPTER 6. USING GALERA6.1. INVESTIGATING DATABASE CLUSTER INTEGRITY6.2. INVESTIGATING DATABASE CLUSTER NODE6.3. INVESTIGATING DATABASE REPLICATION PERFORMANCE
CHAPTER 7. INVESTIGATING AND FIXING HA CONTROLLER RESOURCES7.1. CORRECTING RESOURCE PROBLEMS ON CONTROLLERS
CHAPTER 8. INVESTIGATING HA CEPH NODES
APPENDIX A. BUILDING THE RED HAT OPENSTACK PLATFORM 10 HA ENVIRONMENTA.1. HARDWARE SPECIFICATIONA.2. UNDERCLOUD CONFIGURATION FILESA.3. OVERCLOUD CONFIGURATION FILES
33
5
6
888
11131314
151616
17171920
2324
26
28283033
Table of Contents
1

Red Hat OpenStack Platform 10 Understanding Red Hat OpenStack Platform High Availability
2
CHAPTER 1. OVERVIEW
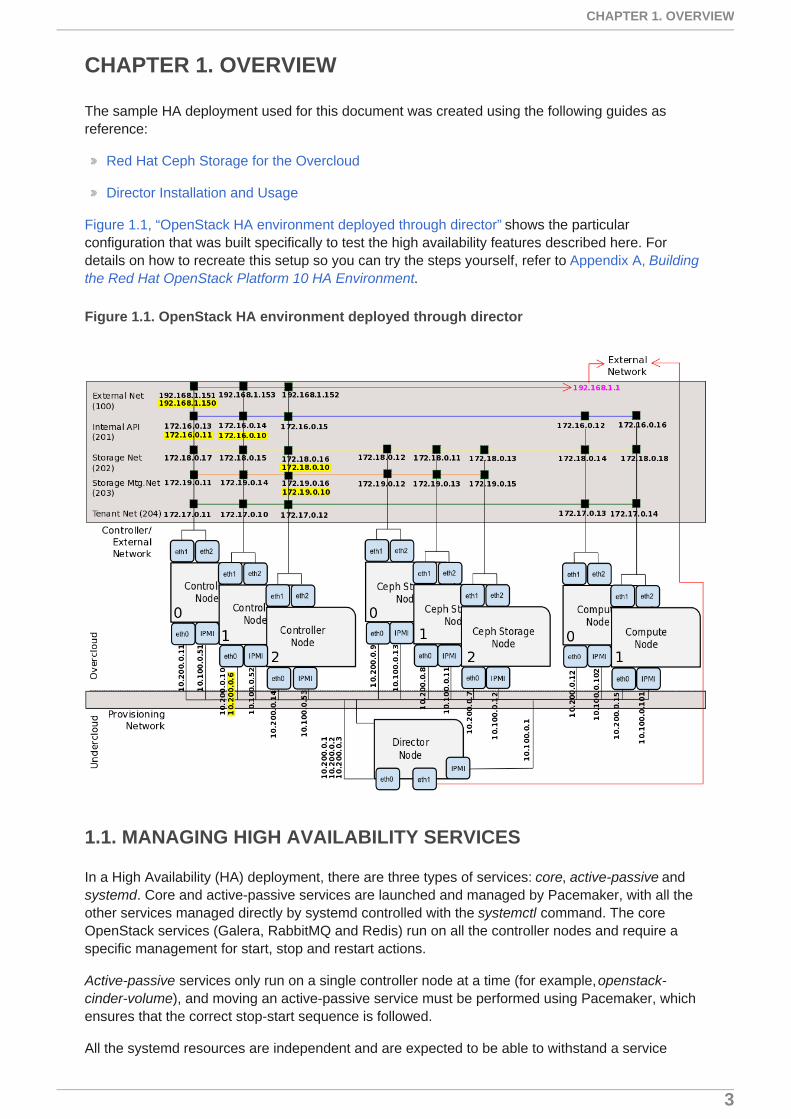
The sample HA deployment used for this document was created using the following guides asreference:
Red Hat Ceph Storage for the Overcloud
Director Installation and Usage
Figure 1.1, “OpenStack HA environment deployed through director” shows the particularconfiguration that was built specifically to test the high availability features described here. Fordetails on how to recreate this setup so you can try the steps yourself, refer to Appendix A, Buildingthe Red Hat OpenStack Platform 10 HA Environment.
Figure 1.1. OpenStack HA environment deployed through director
1.1. MANAGING HIGH AVAILABILITY SERVICES
In a High Availability (HA) deployment, there are three types of services: core, active-passive andsystemd. Core and active-passive services are launched and managed by Pacemaker, with all theother services managed directly by systemd controlled with the systemctl command. The coreOpenStack services (Galera, RabbitMQ and Redis) run on all the controller nodes and require aspecific management for start, stop and restart actions.
Active-passive services only run on a single controller node at a time (for example, openstack-cinder-volume), and moving an active-passive service must be performed using Pacemaker, whichensures that the correct stop-start sequence is followed.
All the systemd resources are independent and are expected to be able to withstand a service
CHAPTER 1. OVERVIEW
3

interruption, with the result that you will not need to manually restart any service (such asopenstack-nova-api.service) if you restart galera. When orchestrating your HA deployment entirelyin director, the templates and puppet modules used by director ensure that all services areconfigured and launched correctly, particularly for HA. In addition, when troubleshooting HA issues,you will need to interact with services using both the HA framework and the systemctl command.
Red Hat OpenStack Platform 10 Understanding Red Hat OpenStack Platform High Availability
4
CHAPTER 2. UNDERSTANDING RED HAT OPENSTACKPLATFORM HIGH AVAILABILITY FEATURES
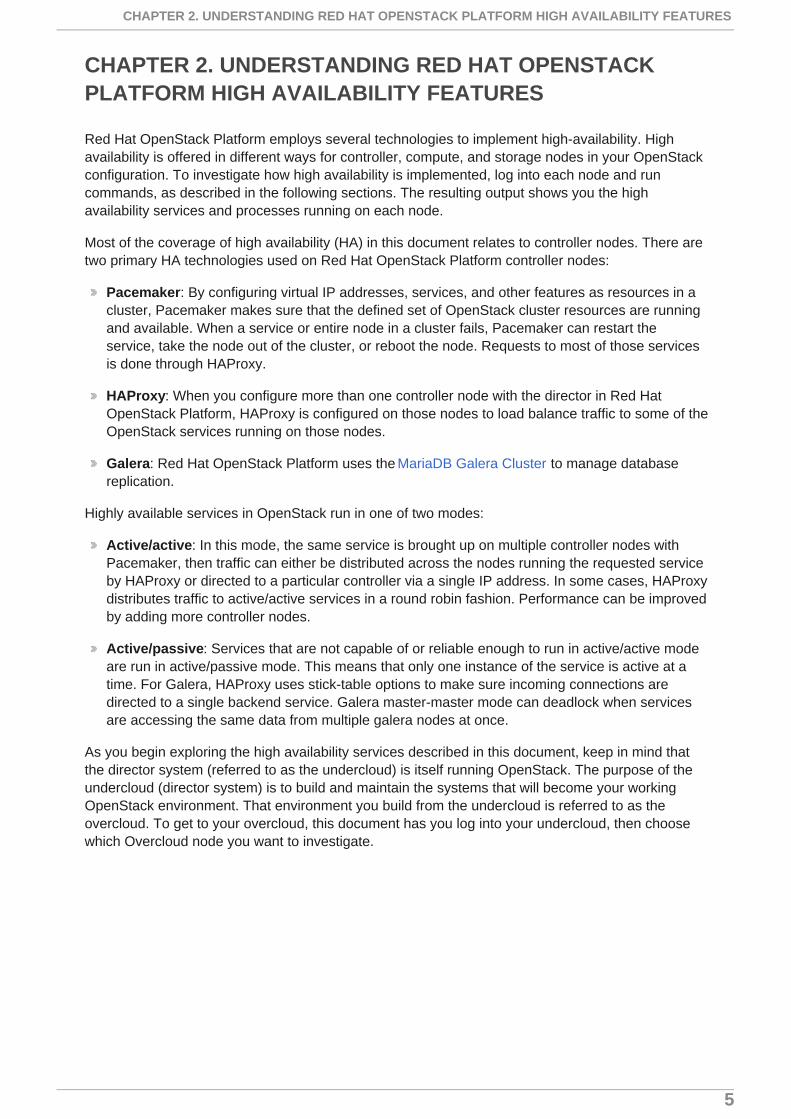
Red Hat OpenStack Platform employs several technologies to implement high-availability. Highavailability is offered in different ways for controller, compute, and storage nodes in your OpenStackconfiguration. To investigate how high availability is implemented, log into each node and runcommands, as described in the following sections. The resulting output shows you the highavailability services and processes running on each node.
Most of the coverage of high availability (HA) in this document relates to controller nodes. There aretwo primary HA technologies used on Red Hat OpenStack Platform controller nodes:
Pacemaker: By configuring virtual IP addresses, services, and other features as resources in acluster, Pacemaker makes sure that the defined set of OpenStack cluster resources are runningand available. When a service or entire node in a cluster fails, Pacemaker can restart theservice, take the node out of the cluster, or reboot the node. Requests to most of those servicesis done through HAProxy.
HAProxy: When you configure more than one controller node with the director in Red HatOpenStack Platform, HAProxy is configured on those nodes to load balance traffic to some of theOpenStack services running on those nodes.
Galera: Red Hat OpenStack Platform uses the MariaDB Galera Cluster to manage databasereplication.
Highly available services in OpenStack run in one of two modes:
Active/active: In this mode, the same service is brought up on multiple controller nodes withPacemaker, then traffic can either be distributed across the nodes running the requested serviceby HAProxy or directed to a particular controller via a single IP address. In some cases, HAProxydistributes traffic to active/active services in a round robin fashion. Performance can be improvedby adding more controller nodes.
Active/passive: Services that are not capable of or reliable enough to run in active/active modeare run in active/passive mode. This means that only one instance of the service is active at atime. For Galera, HAProxy uses stick-table options to make sure incoming connections aredirected to a single backend service. Galera master-master mode can deadlock when servicesare accessing the same data from multiple galera nodes at once.
As you begin exploring the high availability services described in this document, keep in mind thatthe director system (referred to as the undercloud) is itself running OpenStack. The purpose of theundercloud (director system) is to build and maintain the systems that will become your workingOpenStack environment. That environment you build from the undercloud is referred to as theovercloud. To get to your overcloud, this document has you log into your undercloud, then choosewhich Overcloud node you want to investigate.
CHAPTER 2. UNDERSTANDING RED HAT OPENSTACK PLATFORM HIGH AVAILABILITY FEATURES
5
CHAPTER 3. GETTING INTO YOUR OPENSTACK HAENVIRONMENT
With the OpenStack HA environment running, log into your director (undercloud) system. Then,become the stack user by running:
# sudo su - stack
From there, you can interact with either the undercloud and overcloud by loading its correspondingenvironment variables. To interact with the undercloud, run:
$ source ~/stackrc
Likewise, to interact with the overcloud, run:
$ source ~/overcloudrc
For more information about accessing either undercloud or overcloud, see Accessing the Overcloud.
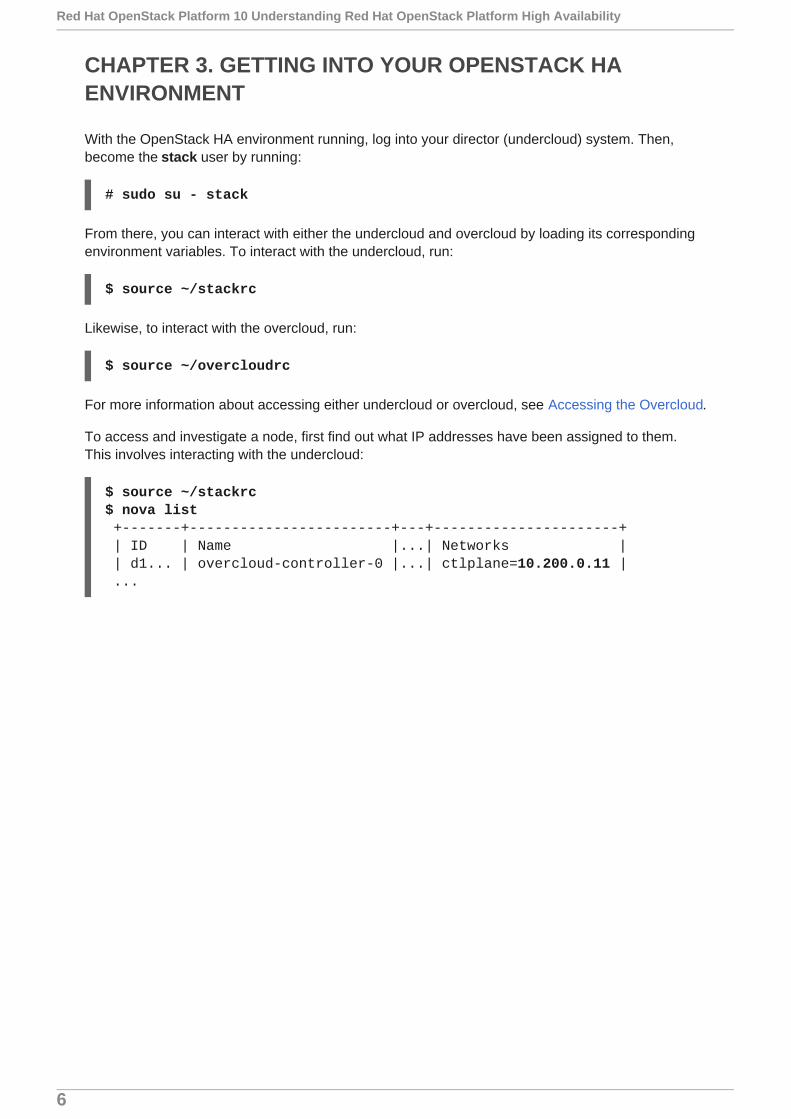
To access and investigate a node, first find out what IP addresses have been assigned to them.This involves interacting with the undercloud:
$ source ~/stackrc$ nova list +-------+------------------------+---+----------------------+ | ID | Name |...| Networks | | d1... | overcloud-controller-0 |...| ctlplane=10.200.0.11 | ...
Red Hat OpenStack Platform 10 Understanding Red Hat OpenStack Platform High Availability
6

Note
For reference, the director deployed the following names and addresses in our testenvironment:
Names Addresses
overcloud-controller-0 10.200.0.11
overcloud-controller-1 10.200.0.10
overcloud-controller-1 10.200.0.6 (virtual IP)
overcloud-controller-2 10.200.0.14
overcloud-compute-0 10.200.0.12
overcloud-compute-1 10.200.0.15
overcloud-cephstorage-0 10.200.0.9
overcloud-cephstorage-1 10.200.0.8
overcloud-cephstorage-2 10.200.0.7
In your own test environment, even if you use the same address ranges, the IP addressesassigned to each node may be different.
Once you know the IP addresses of your overcloud nodes, you can run the following command tolog into one of those nodes. Doing so involves interacting with the overcloud. For example, to loginto overcloud-controller-0 as the heat-admin user:
$ source ~stack/overcloudrc$ ssh [email protected]
After logging into a controller, compute, or storage system, you can begin investigating the HAfeatures there.
CHAPTER 3. GETTING INTO YOUR OPENSTACK HA ENVIRONMENT
7
CHAPTER 4. USING PACEMAKER
In the OpenStack configuration illustrated in Figure 1.1, “OpenStack HA environment deployedthrough director”, most OpenStack services are running on the three controller nodes. To investigatehigh availability features of those services, log into any of the controllers as the heat-admin userand look at services controlled by Pacemaker. Output from the Pacemaker pcs status commandincludes general Pacemaker information, virtual IP addresses, services, and other Pacemakerinformation.
4.1. GENERAL PACEMAKER INFORMATION
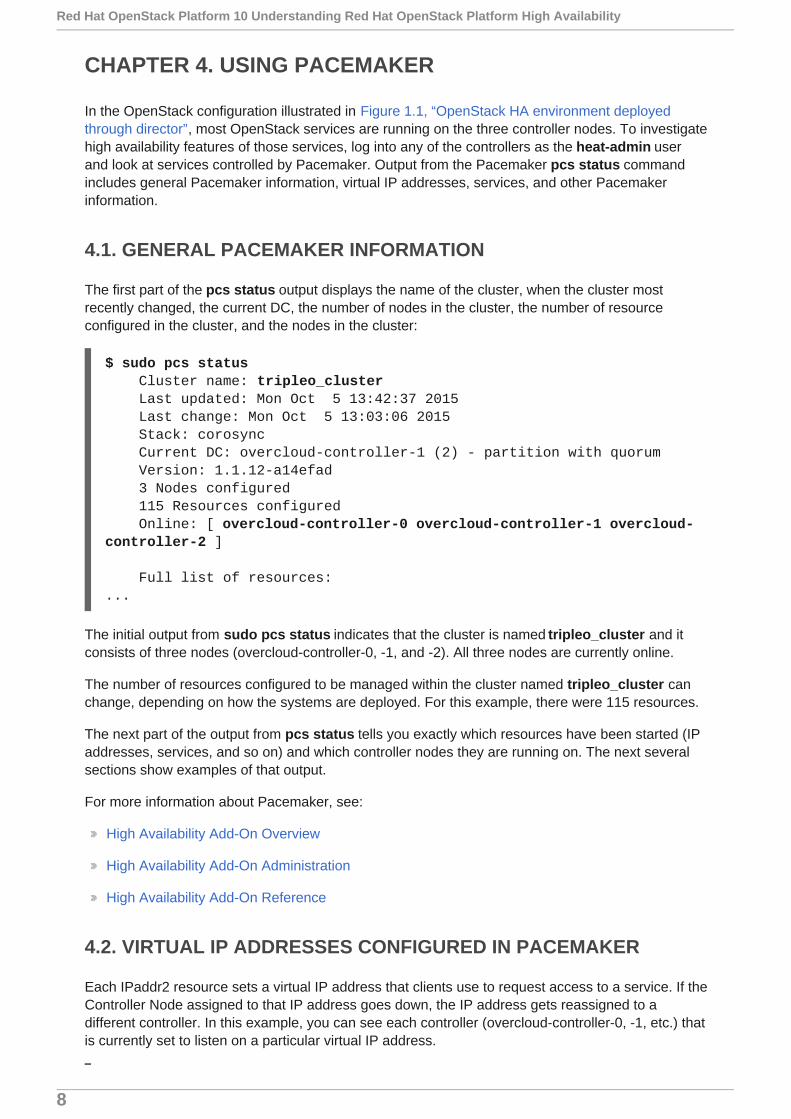
The first part of the pcs status output displays the name of the cluster, when the cluster mostrecently changed, the current DC, the number of nodes in the cluster, the number of resourceconfigured in the cluster, and the nodes in the cluster:
$ sudo pcs status Cluster name: tripleo_cluster Last updated: Mon Oct 5 13:42:37 2015 Last change: Mon Oct 5 13:03:06 2015 Stack: corosync Current DC: overcloud-controller-1 (2) - partition with quorum Version: 1.1.12-a14efad 3 Nodes configured 115 Resources configured Online: [ overcloud-controller-0 overcloud-controller-1 overcloud-controller-2 ]
Full list of resources:...
The initial output from sudo pcs status indicates that the cluster is named tripleo_cluster and itconsists of three nodes (overcloud-controller-0, -1, and -2). All three nodes are currently online.
The number of resources configured to be managed within the cluster named tripleo_cluster canchange, depending on how the systems are deployed. For this example, there were 115 resources.
The next part of the output from pcs status tells you exactly which resources have been started (IPaddresses, services, and so on) and which controller nodes they are running on. The next severalsections show examples of that output.
For more information about Pacemaker, see:
High Availability Add-On Overview
High Availability Add-On Administration
High Availability Add-On Reference
4.2. VIRTUAL IP ADDRESSES CONFIGURED IN PACEMAKER
Each IPaddr2 resource sets a virtual IP address that clients use to request access to a service. If theController Node assigned to that IP address goes down, the IP address gets reassigned to adifferent controller. In this example, you can see each controller (overcloud-controller-0, -1, etc.) thatis currently set to listen on a particular virtual IP address.
Red Hat OpenStack Platform 10 Understanding Red Hat OpenStack Platform High Availability
8
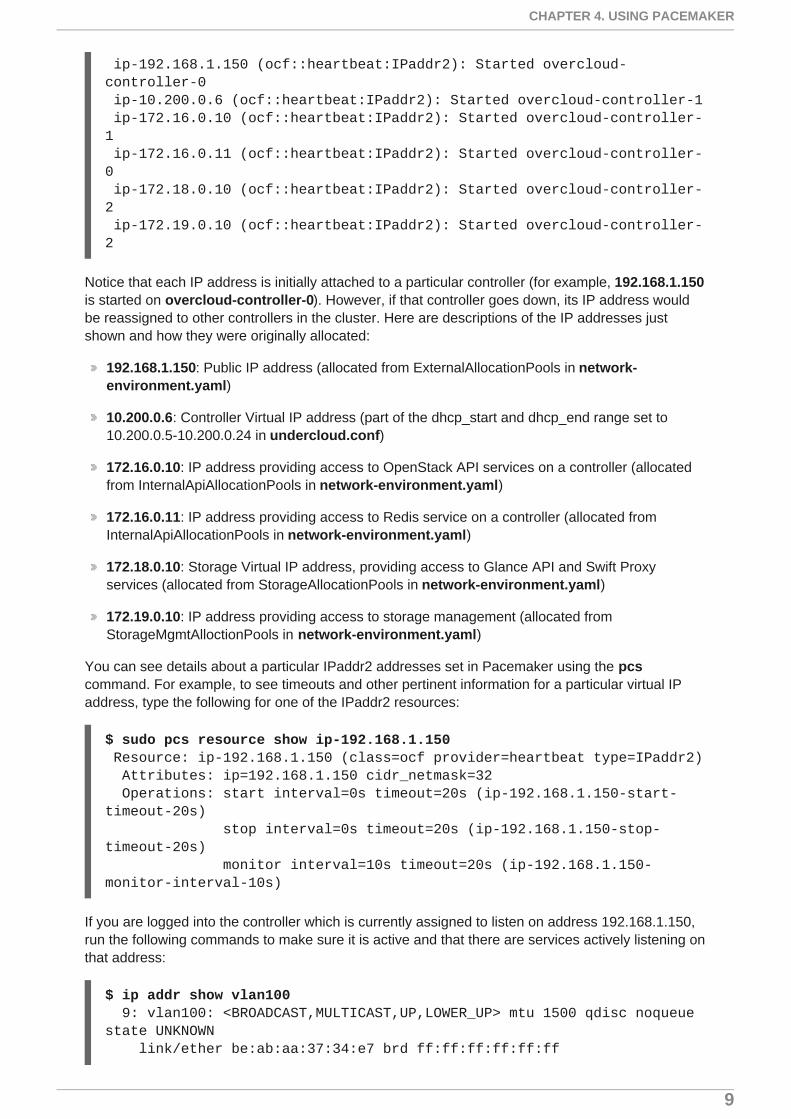
ip-192.168.1.150 (ocf::heartbeat:IPaddr2): Started overcloud-controller-0 ip-10.200.0.6 (ocf::heartbeat:IPaddr2): Started overcloud-controller-1 ip-172.16.0.10 (ocf::heartbeat:IPaddr2): Started overcloud-controller-1 ip-172.16.0.11 (ocf::heartbeat:IPaddr2): Started overcloud-controller-0 ip-172.18.0.10 (ocf::heartbeat:IPaddr2): Started overcloud-controller-2 ip-172.19.0.10 (ocf::heartbeat:IPaddr2): Started overcloud-controller-2
Notice that each IP address is initially attached to a particular controller (for example, 192.168.1.150is started on overcloud-controller-0). However, if that controller goes down, its IP address wouldbe reassigned to other controllers in the cluster. Here are descriptions of the IP addresses justshown and how they were originally allocated:
192.168.1.150: Public IP address (allocated from ExternalAllocationPools in network-environment.yaml)
10.200.0.6: Controller Virtual IP address (part of the dhcp_start and dhcp_end range set to10.200.0.5-10.200.0.24 in undercloud.conf)
172.16.0.10: IP address providing access to OpenStack API services on a controller (allocatedfrom InternalApiAllocationPools in network-environment.yaml)
172.16.0.11: IP address providing access to Redis service on a controller (allocated fromInternalApiAllocationPools in network-environment.yaml)
172.18.0.10: Storage Virtual IP address, providing access to Glance API and Swift Proxyservices (allocated from StorageAllocationPools in network-environment.yaml)
172.19.0.10: IP address providing access to storage management (allocated fromStorageMgmtAlloctionPools in network-environment.yaml)
You can see details about a particular IPaddr2 addresses set in Pacemaker using the pcscommand. For example, to see timeouts and other pertinent information for a particular virtual IPaddress, type the following for one of the IPaddr2 resources:
$ sudo pcs resource show ip-192.168.1.150 Resource: ip-192.168.1.150 (class=ocf provider=heartbeat type=IPaddr2) Attributes: ip=192.168.1.150 cidr_netmask=32 Operations: start interval=0s timeout=20s (ip-192.168.1.150-start-timeout-20s) stop interval=0s timeout=20s (ip-192.168.1.150-stop-timeout-20s) monitor interval=10s timeout=20s (ip-192.168.1.150-monitor-interval-10s)
If you are logged into the controller which is currently assigned to listen on address 192.168.1.150,run the following commands to make sure it is active and that there are services actively listening onthat address:
$ ip addr show vlan100 9: vlan100: <BROADCAST,MULTICAST,UP,LOWER_UP> mtu 1500 qdisc noqueue state UNKNOWN link/ether be:ab:aa:37:34:e7 brd ff:ff:ff:ff:ff:ff
CHAPTER 4. USING PACEMAKER
9

inet 192.168.1.151/24 brd 192.168.1.255 scope global vlan100 valid_lft forever preferred_lft forever inet 192.168.1.150/32 brd 192.168.1.255 scope global vlan100 valid_lft forever preferred_lft forever
$ sudo netstat -tupln | grep 192.168.1.150 tcp 0 0 192.168.1.150:6080 0.0.0.0:* LISTEN 4333/haproxy tcp 0 0 192.168.1.150:9696 0.0.0.0:* LISTEN 4333/haproxy tcp 0 0 192.168.1.150:8000 0.0.0.0:* LISTEN 4333/haproxy tcp 0 0 192.168.1.150:8003 0.0.0.0:* LISTEN 4333/haproxy tcp 0 0 192.168.1.150:8004 0.0.0.0:* LISTEN 4333/haproxy tcp 0 0 192.168.1.150:8773 0.0.0.0:* LISTEN 4333/haproxy tcp 0 0 192.168.1.150:8774 0.0.0.0:* LISTEN 4333/haproxy tcp 0 0 192.168.1.150:5000 0.0.0.0:* LISTEN 4333/haproxy tcp 0 0 192.168.1.150:8776 0.0.0.0:* LISTEN 4333/haproxy tcp 0 0 192.168.1.150:8777 0.0.0.0:* LISTEN 4333/haproxy tcp 0 0 192.168.1.150:9292 0.0.0.0:* LISTEN 4333/haproxy tcp 0 0 192.168.1.150:8080 0.0.0.0:* LISTEN 4333/haproxy tcp 0 0 192.168.1.150:80 0.0.0.0:* LISTEN 4333/haproxy tcp 0 0 192.168.1.150:35357 0.0.0.0:* LISTEN 4333/haproxy udp 0 0 192.168.1.150:123 0.0.0.0:* 459/ntpd ... tcp 0 0 0.0.0.0:22 0.0.0.0:* LISTEN 2471/sshd tcp 0 0 0.0.0.0:4567 0.0.0.0:* LISTEN 10064/mysqld ... udp 0 0 0.0.0.0:51475 0.0.0.0:* 545/dhclient udp 0 0 0.0.0.0:123 0.0.0.0:* 459/ntpd udp 0 0 0.0.0.0:161 0.0.0.0:* 1633/snmpd ...
The ip command shows that the vlan100 interface is listening on both the 192.168.1.150 and192.168.1.151 IPv4 addresses. In output from the netstat command, you can see all the processeslistening on the 192.168.1.150 interface. Besides the ntpd process (listening on port 123), thehaproxy process is the only other one listening specifically on 192.168.1.150. Also, keep in mind thatprocesses listening on all local addresses (0.0.0.0) are also available through 192.168.1.150 (sshd,mysqld, dhclient, ntpd and so on).
Red Hat OpenStack Platform 10 Understanding Red Hat OpenStack Platform High Availability
10
The port numbers shown in the netstat output help you identify the exact service haproxy islistening for. You could look inside the /etc/haproxy/haproxy.cfg file to see what services thoseport numbers represent. Here are just a few examples:
TCP port 6080: nova_novncproxy
TCP port 9696: neutron
TCP port 8000: heat_cfn
TCP port 8003: heat_cloudwatch
TCP port 80: horizon
At this time, there are 14 services in haproxy.cfg listening specifically on 192.168.1.150 on all threecontrollers. However, only controller-0 is currently actually listening externally on 192.168.1.150. So,if controller-0 goes down, HAProxy only needs to reassign 192.168.1.150 to another controller andall the services will already be running.
4.3. OPENSTACK SERVICES CONFIGURED IN PACEMAKER
Most services are configured as Clone Set resources (or clones), where they are started the sameway on each controller and set to always run on each controller. Services are cloned if they need tobe active on multiple nodes. As such, you can only clone services that can be active on multiplenodes simultaneously (ie. cluster-aware services).
Other services are configured as Multi-state resources. Multi-state resources are specialized typeof clones: unlike ordinary Clone Set resources, a Multi-state resource can be in either a master orslave state. When an instance is started, it must come up in the slave state. Other than this, thenames of either state do not have any special meaning. These states, however, allow clones of thesame service to run under different rules or constraints.
Keep in mind that, even though a service may be running on multiple controllers at the same time,the controller itself may not be listening on the IP address needed to actually reach those services.
Clone Set resources (clones)
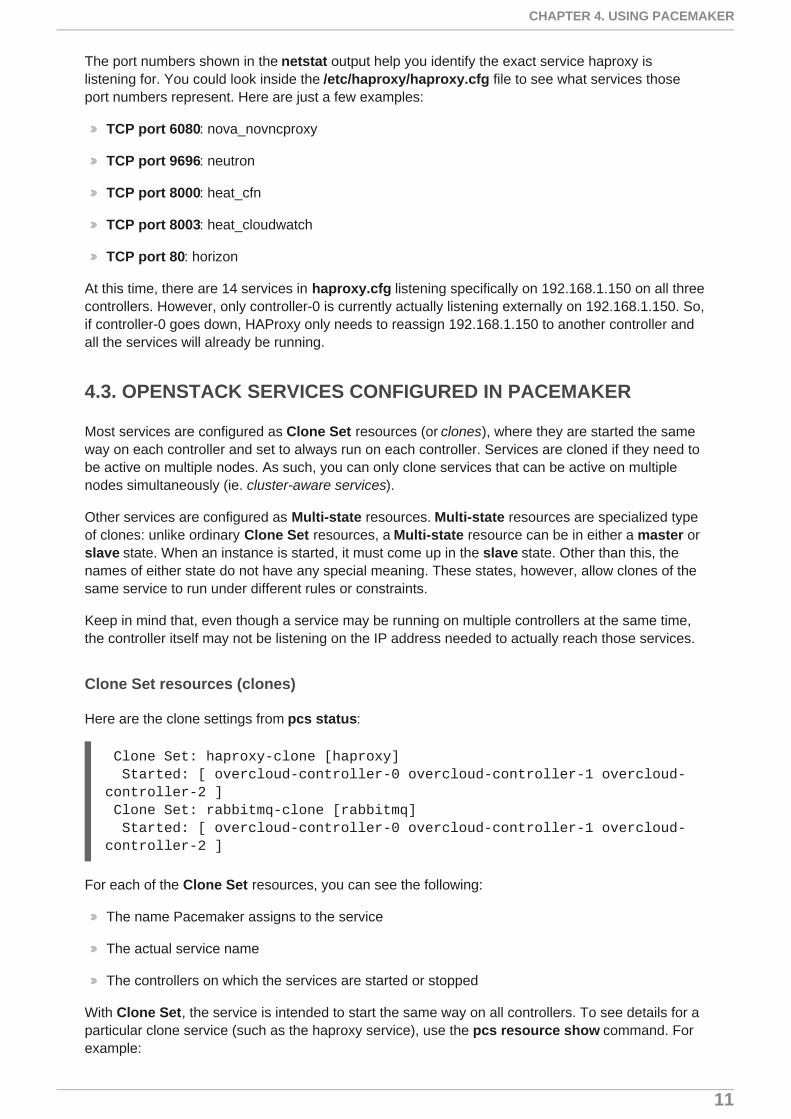
Here are the clone settings from pcs status:
Clone Set: haproxy-clone [haproxy] Started: [ overcloud-controller-0 overcloud-controller-1 overcloud-controller-2 ] Clone Set: rabbitmq-clone [rabbitmq] Started: [ overcloud-controller-0 overcloud-controller-1 overcloud-controller-2 ]
For each of the Clone Set resources, you can see the following:
The name Pacemaker assigns to the service
The actual service name
The controllers on which the services are started or stopped
With Clone Set, the service is intended to start the same way on all controllers. To see details for aparticular clone service (such as the haproxy service), use the pcs resource show command. Forexample:
CHAPTER 4. USING PACEMAKER
11

$ sudo pcs resource show haproxy-clone Clone: haproxy-clone Resource: haproxy (class=systemd type=haproxy) Operations: start interval=0s timeout=60s (haproxy-start-timeout-60s) monitor interval=60s (haproxy-monitor-interval-60s)$ sudo systemctl status haproxyhaproxy.service - Cluster Controlled haproxy Loaded: loaded (/usr/lib/systemd/system/haproxy.service; disabled) Drop-In: /run/systemd/system/haproxy.service.d └─50-pacemaker.conf Active: active (running) since Tue 2015-10-06 08:58:49 EDT; 1h 52min ago Main PID: 4215 (haproxy-systemd) CGroup: /system.slice/haproxy.service ├─4215 /usr/sbin/haproxy-systemd-wrapper -f /etc/haproxy/haproxy.cfg -p /run/haproxy.pid ├─4216 /usr/sbin/haproxy -f /etc/haproxy/haproxy.cfg -p /run/haproxy.pid -Ds └─4217 /usr/sbin/haproxy -f /etc/haproxy/haproxy.cfg -p /run/haproxy.pid -Ds
The haproxy-clone example displays the resource settings for HAProxy. Although HAProxyprovides high availability services by load-balancing traffic to selected services, keeping HAProxyitself highly available is done here by configuring it as a Pacemaker clone service.
From the output, notice that the resource is a systemd service named haproxy. It also has startinterval and timeout values as well as monitor intervals. The systemctl status command shows thathaproxy is currently active. The actual running processes for the haproxy service are listed at theend of the output. Because the whole command line is shown, you can see the configuration file(haproxy.cfg) and PID file (haproxy.pid) associated with the command.
Run those same commands on any Clone Set resource to see its current level of activity anddetails about the commands the service runs. Note that systemd services controlled by Pacemakerare set to disabled by systemd, since you want Pacemaker and not the system’s boot process tocontrol when the service comes up or goes down.
For more information about Clone Set resources, see Resource Clones in the High Availability Add-On Reference.
Multi-state resources (master/slave)
The Galera and Redis services are run as Multi-state resources. Here is what the pcs statusoutput looks like for those two types of services:
[...]Master/Slave Set: galera-master [galera] Masters: [ overcloud-controller-0 overcloud-controller-1 overcloud-controller-2 ]
Master/Slave Set: redis-master [redis] Masters: [ overcloud-controller-2 ] Slaves: [ overcloud-controller-0 overcloud-controller-1 ][...]
For the galera-master resource, all three controllers are running as Galera masters. For the redis-
Red Hat OpenStack Platform 10 Understanding Red Hat OpenStack Platform High Availability
12

master resource, overcloud-controller-2 is running as the master, while the other two controllersare running as slaves. This means that at the moment, the galera service is running under one setof constraints on all three controllers, while redis may be subject to different constraints on themaster and slave controllers.
For more information about Multi-State resources, see Multi-State Resources: Resources ThatHave Multiple Modes in the High Availability Add-On Reference.
For more information about troubleshooting the Galera resource, see Chapter 6, Using Galera.
4.4. PACEMAKER FAILED ACTIONS
If any of the resources fail in any way, they will be listed under the Failed actions heading of the pcs status output. Here is an example where the openstack-cinder-volume service stopped workingon controller-0:
Failed Actions:* openstack-cinder-volume_monitor_60000 on overcloud-controller-0 'not running' (7): call=74, status=complete, exitreason='none', last-rc-change='Wed Dec 14 08:33:14 2016', queued=0ms, exec=0ms
In this case, the systemd service openstack-cinder-volume just needed to be re-enabled (it wasdeliberately disabled). In other cases, you need to track down and fix the problem, then clean up theresources. See Section 7.1, “Correcting Resource Problems on Controllers” for details.
4.5. OTHER PACEMAKER INFORMATION FOR CONTROLLERS
The last sections of the pcs status output shows information about your power management fencing(IPMI in this case) and the status of the Pacemaker service itself:
my-ipmilan-for-controller-0 (stonith:fence_ipmilan): Started my-ipmilan-for-controller-0 my-ipmilan-for-controller-1 (stonith:fence_ipmilan): Started my-ipmilan-for-controller-1 my-ipmilan-for-controller-2 (stonith:fence_ipmilan): Started my-ipmilan-for-controller-2
PCSD Status: overcloud-controller-0: Online overcloud-controller-1: Online overcloud-controller-2: Online
Daemon Status: corosync: active/enabled pacemaker: active/enabled openstack-cinder-volume (systemd:openstack-cinder-volume): Started overcloud-controller-0
pcsd: active/enabled
The my-ipmilan-for-controller settings show the type of fencing done for each node(stonith:fence_ipmilan) and whether or not the IPMI service is stopped or running. The PCSDStatus shows that all three controllers are currently online. The Pacemaker service itself consists ofthree daemons: corosync, pacemaker, and pcsd. Here, all three services are active and enabled.
CHAPTER 4. USING PACEMAKER
13

4.6. FENCING HARDWARE
When a controller node fails a health check, the controller acting as the Pacemaker designatedcoordinator (DC) uses the Pacemaker stonith service to fence off the offending node. Stonith is anacronym for the term "Shoot the other node in the head". So, the DC basically kicks the node out ofthe cluster.
To see how your fencing devices are configured by stonith for your OpenStack Platform HA cluster,run the following command:
$ sudo pcs stonith show --full Resource: my-ipmilan-for-controller-0 (class=stonith type=fence_ipmilan) Attributes: pcmk_host_list=overcloud-controller-0 ipaddr=10.100.0.51 login=admin passwd=abc lanplus=1 cipher=3 Operations: monitor interval=60s (my-ipmilan-for-controller-0-monitor-interval-60s) Resource: my-ipmilan-for-controller-1 (class=stonith type=fence_ipmilan) Attributes: pcmk_host_list=overcloud-controller-1 ipaddr=10.100.0.52 login=admin passwd=abc lanplus=1 cipher=3 Operations: monitor interval=60s (my-ipmilan-for-controller-1-monitor-interval-60s) Resource: my-ipmilan-for-controller-2 (class=stonith type=fence_ipmilan) Attributes: pcmk_host_list=overcloud-controller-2 ipaddr=10.100.0.53 login=admin passwd=abc lanplus=1 cipher=3 Operations: monitor interval=60s (my-ipmilan-for-controller-2-monitor-interval-60s)
The show --full listing shows details about the three controller nodes that relate to fencing. Thefence device uses IPMI power management (fence_ipmilan) to turn the machines on and off asrequired. Information about the IPMI interface for each node includes the IP address of the IPMIinterface (10.100.0.51), the user name to log in as (admin) and the password to use (abc). You canalso see the interval at which each host is monitored (60 seconds).
For more information on fencing with Pacemaker, see "Fencing Configuration" in Red Hat EnterpriseLinux 7 High Availability Add-On Administration.
Red Hat OpenStack Platform 10 Understanding Red Hat OpenStack Platform High Availability
14
CHAPTER 5. USING HAPROXY
HAProxy provides high-availability features to OpenStack by load-balancing traffic to controllersrunning OpenStack services. The haproxy package contains the haproxy daemon, which is startedfrom the systemd service of the same name, along with logging features and sample configurations.As noted earlier, Pacemaker manages the HAProxy service itself as a highly available service(haproxy-clone).
Note
Refer to the KCS solution How can I verify my haproxy.cfg is correctly configured to loadbalance openstack services? for information on validating an HAProxy configuration.
In Red Hat OpenStack Platform, the director configures multiple OpenStack services to takeadvantage of the haproxy service. The director does this by configuring those services in the/etc/haproxy/haproxy.cfg file. For each service in that file, you can see:
listen: The name of the service that is listening for requests
bind: The IP address and TCP port number on which the service is listening
server: The name of each server providing the service, the server’s IP address and listeningport, and other information.
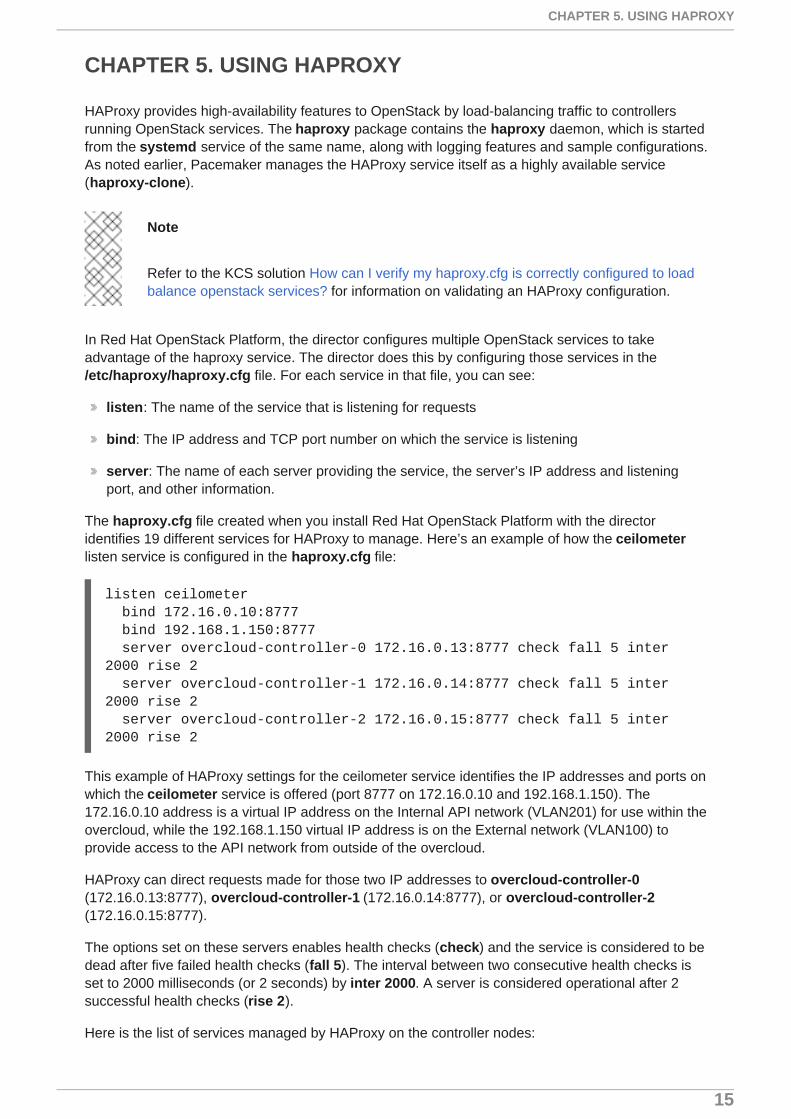
The haproxy.cfg file created when you install Red Hat OpenStack Platform with the directoridentifies 19 different services for HAProxy to manage. Here’s an example of how the ceilometerlisten service is configured in the haproxy.cfg file:
listen ceilometer bind 172.16.0.10:8777 bind 192.168.1.150:8777 server overcloud-controller-0 172.16.0.13:8777 check fall 5 inter 2000 rise 2 server overcloud-controller-1 172.16.0.14:8777 check fall 5 inter 2000 rise 2 server overcloud-controller-2 172.16.0.15:8777 check fall 5 inter 2000 rise 2
This example of HAProxy settings for the ceilometer service identifies the IP addresses and ports onwhich the ceilometer service is offered (port 8777 on 172.16.0.10 and 192.168.1.150). The172.16.0.10 address is a virtual IP address on the Internal API network (VLAN201) for use within theovercloud, while the 192.168.1.150 virtual IP address is on the External network (VLAN100) toprovide access to the API network from outside of the overcloud.
HAProxy can direct requests made for those two IP addresses to overcloud-controller-0(172.16.0.13:8777), overcloud-controller-1 (172.16.0.14:8777), or overcloud-controller-2(172.16.0.15:8777).
The options set on these servers enables health checks (check) and the service is considered to bedead after five failed health checks (fall 5). The interval between two consecutive health checks isset to 2000 milliseconds (or 2 seconds) by inter 2000. A server is considered operational after 2successful health checks (rise 2).
Here is the list of services managed by HAProxy on the controller nodes:
CHAPTER 5. USING HAPROXY
15
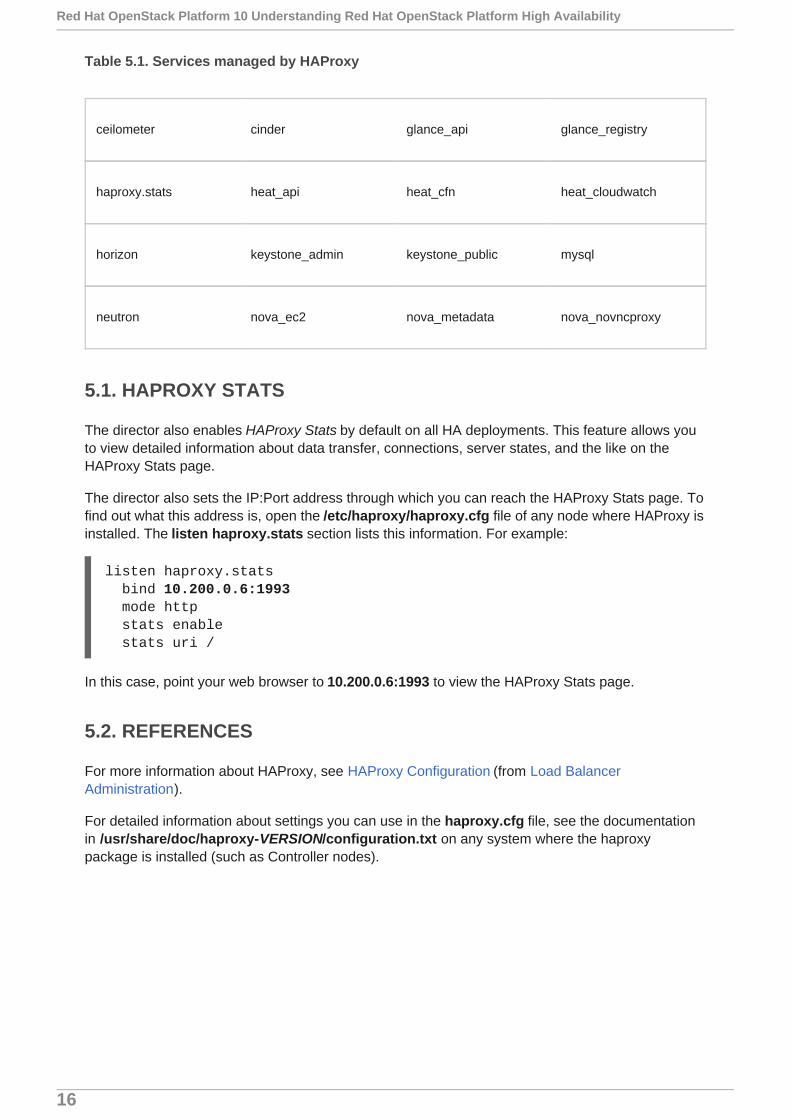
Table 5.1. Services managed by HAProxy
ceilometer cinder glance_api glance_registry
haproxy.stats heat_api heat_cfn heat_cloudwatch
horizon keystone_admin keystone_public mysql
neutron nova_ec2 nova_metadata nova_novncproxy
5.1. HAPROXY STATS
The director also enables HAProxy Stats by default on all HA deployments. This feature allows youto view detailed information about data transfer, connections, server states, and the like on theHAProxy Stats page.
The director also sets the IP:Port address through which you can reach the HAProxy Stats page. Tofind out what this address is, open the /etc/haproxy/haproxy.cfg file of any node where HAProxy isinstalled. The listen haproxy.stats section lists this information. For example:
listen haproxy.stats bind 10.200.0.6:1993 mode http stats enable stats uri /
In this case, point your web browser to 10.200.0.6:1993 to view the HAProxy Stats page.
5.2. REFERENCES
For more information about HAProxy, see HAProxy Configuration (from Load BalancerAdministration).
For detailed information about settings you can use in the haproxy.cfg file, see the documentationin /usr/share/doc/haproxy-VERSION/configuration.txt on any system where the haproxypackage is installed (such as Controller nodes).
Red Hat OpenStack Platform 10 Understanding Red Hat OpenStack Platform High Availability
16
CHAPTER 6. USING GALERA
In a high-availability deployment, Red Hat OpenStack Platform uses the MariaDB Galera Cluster tomanage database replication. As mentioned in Section 4.3, “OpenStack Services Configured inPacemaker”, Pacemaker runs the Galera service using a Master/Slave Set resource. You can usepcs status to check if galera-master is running, and on which controllers:
Master/Slave Set: galera-master [galera] Masters: [ overcloud-controller-0 overcloud-controller-1 overcloud-controller-2 ]
Hostname resolution
When troubleshooting the MariaDB Galera Cluster, start by verifying hostname resolution.By default, the director binds the Galera resource to a hostname rather than an IP address[1]. As such, any problems preventing hostname resolution (for example, a misconfigured orfailed DNS) could, in turn, prevent Pacemaker from properly managing the Galera resource.
Once you rule out hostname resolution problems, check the integrity of the cluster itself. To do so,check the status of write-set replication on each Controller node’s database.
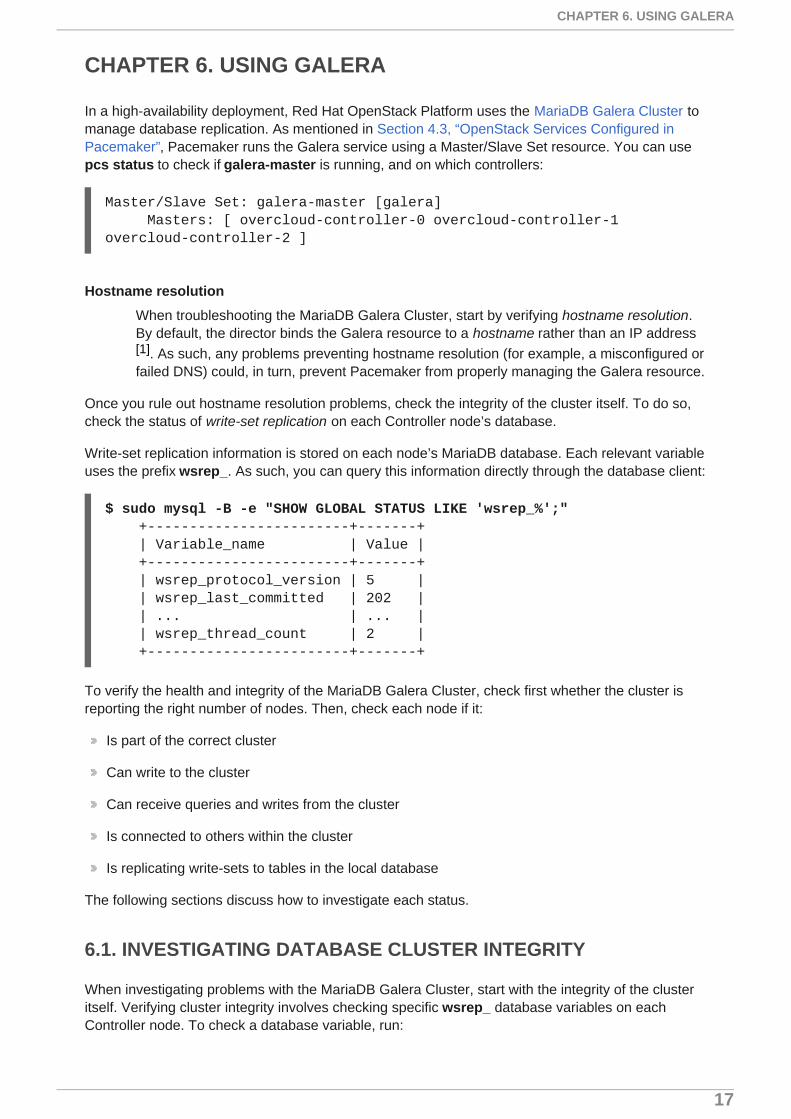
Write-set replication information is stored on each node’s MariaDB database. Each relevant variableuses the prefix wsrep_. As such, you can query this information directly through the database client:
$ sudo mysql -B -e "SHOW GLOBAL STATUS LIKE 'wsrep_%';" +------------------------+-------+ | Variable_name | Value | +------------------------+-------+ | wsrep_protocol_version | 5 | | wsrep_last_committed | 202 | | ... | ... | | wsrep_thread_count | 2 | +------------------------+-------+
To verify the health and integrity of the MariaDB Galera Cluster, check first whether the cluster isreporting the right number of nodes. Then, check each node if it:
Is part of the correct cluster
Can write to the cluster
Can receive queries and writes from the cluster
Is connected to others within the cluster
Is replicating write-sets to tables in the local database
The following sections discuss how to investigate each status.
6.1. INVESTIGATING DATABASE CLUSTER INTEGRITY
When investigating problems with the MariaDB Galera Cluster, start with the integrity of the clusteritself. Verifying cluster integrity involves checking specific wsrep_ database variables on eachController node. To check a database variable, run:
CHAPTER 6. USING GALERA
17
$ sudo mysql -B -e "SHOW GLOBAL STATUS LIKE 'VARIABLE';"
Replace VARIABLE with the wsrep_ database variable you want to check. For example, to view thenode’s cluster state UUID:
$ sudo mysql -B -e "SHOW GLOBAL STATUS LIKE 'wsrep_cluster_state_uuid';" +--------------------------+--------------------------------------+ | Variable_name | Value | +--------------------------+--------------------------------------+ | wsrep_cluster_state_uuid | e2c9a15e-5485-11e0-0800-6bbb637e7211 | +--------------------------+--------------------------------------+
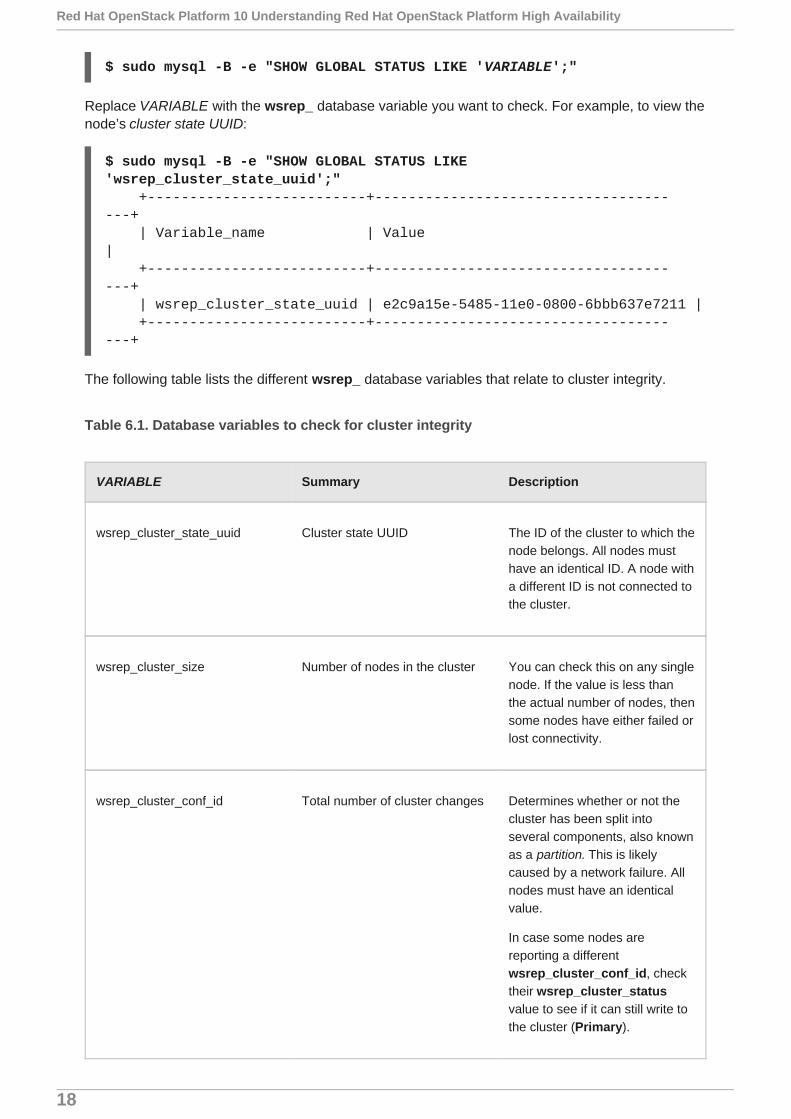
The following table lists the different wsrep_ database variables that relate to cluster integrity.
Table 6.1. Database variables to check for cluster integrity
VARIABLE Summary Description
wsrep_cluster_state_uuid Cluster state UUID The ID of the cluster to which thenode belongs. All nodes musthave an identical ID. A node witha different ID is not connected tothe cluster.
wsrep_cluster_size Number of nodes in the cluster You can check this on any singlenode. If the value is less thanthe actual number of nodes, thensome nodes have either failed orlost connectivity.
wsrep_cluster_conf_id Total number of cluster changes Determines whether or not thecluster has been split intoseveral components, also knownas a partition. This is likelycaused by a network failure. Allnodes must have an identicalvalue.
In case some nodes arereporting a differentwsrep_cluster_conf_id, checktheir wsrep_cluster_statusvalue to see if it can still write tothe cluster (Primary).
Red Hat OpenStack Platform 10 Understanding Red Hat OpenStack Platform High Availability
18
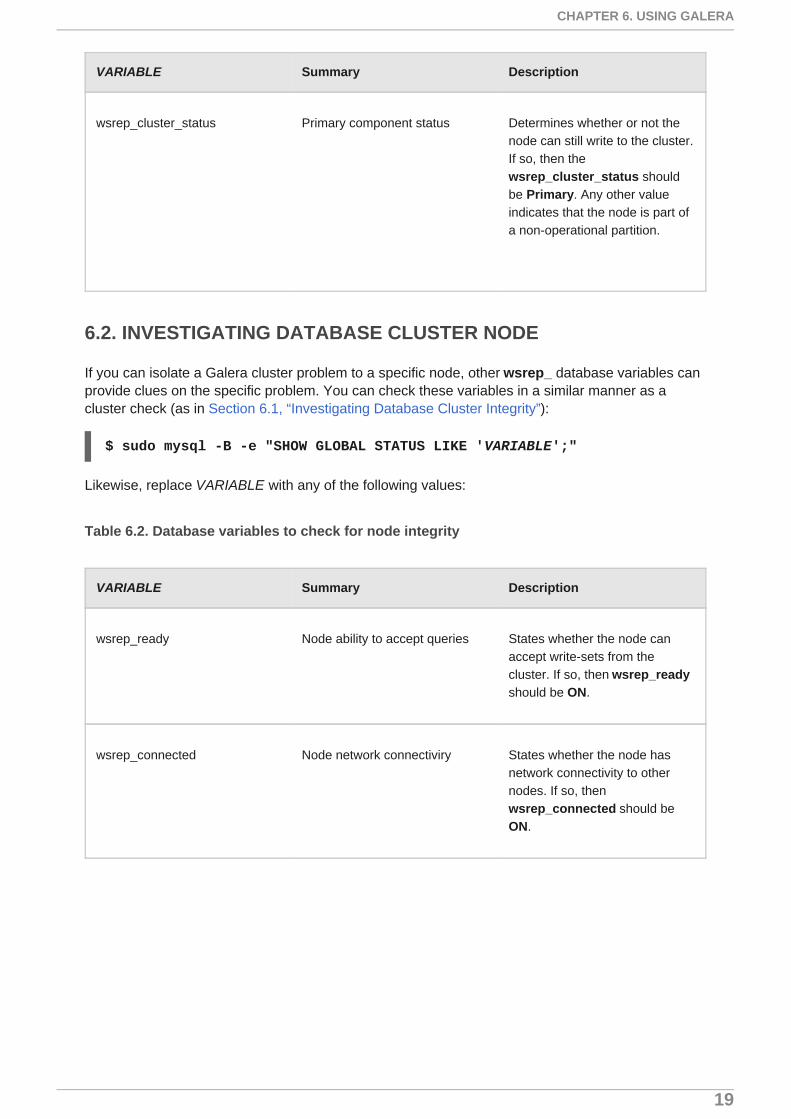
wsrep_cluster_status Primary component status Determines whether or not thenode can still write to the cluster.If so, then thewsrep_cluster_status shouldbe Primary. Any other valueindicates that the node is part ofa non-operational partition.
VARIABLE Summary Description
6.2. INVESTIGATING DATABASE CLUSTER NODE
If you can isolate a Galera cluster problem to a specific node, other wsrep_ database variables canprovide clues on the specific problem. You can check these variables in a similar manner as acluster check (as in Section 6.1, “Investigating Database Cluster Integrity”):
$ sudo mysql -B -e "SHOW GLOBAL STATUS LIKE 'VARIABLE';"
Likewise, replace VARIABLE with any of the following values:
Table 6.2. Database variables to check for node integrity
VARIABLE Summary Description
wsrep_ready Node ability to accept queries States whether the node canaccept write-sets from thecluster. If so, then wsrep_readyshould be ON.
wsrep_connected Node network connectiviry States whether the node hasnetwork connectivity to othernodes. If so, thenwsrep_connected should beON.
CHAPTER 6. USING GALERA
19
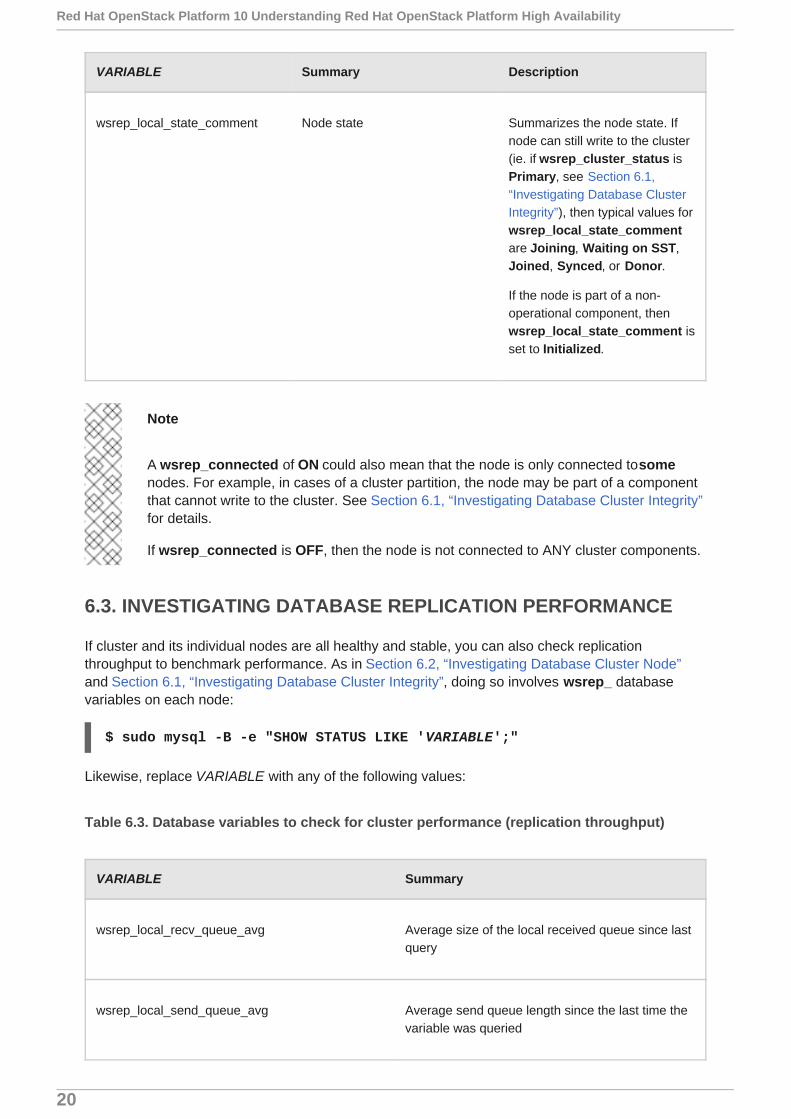
wsrep_local_state_comment Node state Summarizes the node state. Ifnode can still write to the cluster(ie. if wsrep_cluster_status isPrimary, see Section 6.1,“Investigating Database ClusterIntegrity”), then typical values forwsrep_local_state_commentare Joining, Waiting on SST,Joined, Synced, or Donor.
If the node is part of a non-operational component, thenwsrep_local_state_comment isset to Initialized.
VARIABLE Summary Description
Note
A wsrep_connected of ON could also mean that the node is only connected to somenodes. For example, in cases of a cluster partition, the node may be part of a componentthat cannot write to the cluster. See Section 6.1, “Investigating Database Cluster Integrity”for details.
If wsrep_connected is OFF, then the node is not connected to ANY cluster components.
6.3. INVESTIGATING DATABASE REPLICATION PERFORMANCE
If cluster and its individual nodes are all healthy and stable, you can also check replicationthroughput to benchmark performance. As in Section 6.2, “Investigating Database Cluster Node”and Section 6.1, “Investigating Database Cluster Integrity”, doing so involves wsrep_ databasevariables on each node:
$ sudo mysql -B -e "SHOW STATUS LIKE 'VARIABLE';"
Likewise, replace VARIABLE with any of the following values:
Table 6.3. Database variables to check for cluster performance (replication throughput)
VARIABLE Summary
wsrep_local_recv_queue_avg Average size of the local received queue since lastquery
wsrep_local_send_queue_avg Average send queue length since the last time thevariable was queried
Red Hat OpenStack Platform 10 Understanding Red Hat OpenStack Platform High Availability
20
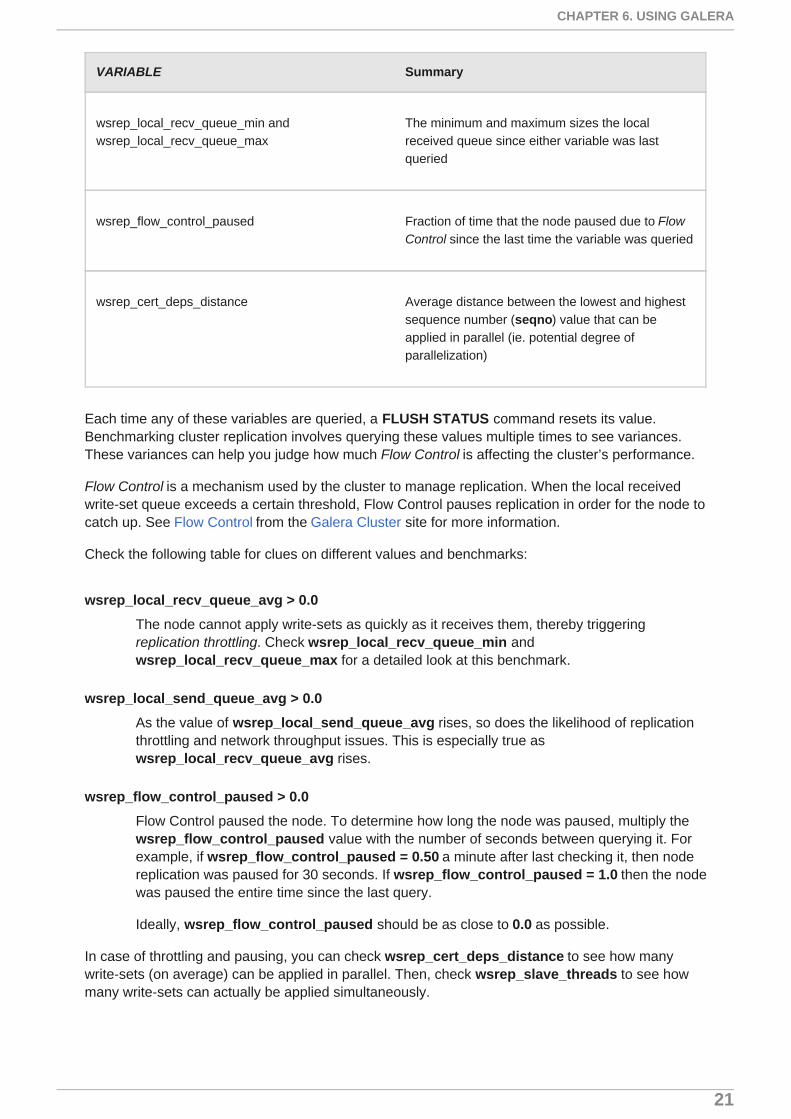
wsrep_local_recv_queue_min andwsrep_local_recv_queue_max
The minimum and maximum sizes the localreceived queue since either variable was lastqueried
wsrep_flow_control_paused Fraction of time that the node paused due to FlowControl since the last time the variable was queried
wsrep_cert_deps_distance Average distance between the lowest and highestsequence number (seqno) value that can beapplied in parallel (ie. potential degree ofparallelization)
VARIABLE Summary
Each time any of these variables are queried, a FLUSH STATUS command resets its value.Benchmarking cluster replication involves querying these values multiple times to see variances.These variances can help you judge how much Flow Control is affecting the cluster’s performance.
Flow Control is a mechanism used by the cluster to manage replication. When the local receivedwrite-set queue exceeds a certain threshold, Flow Control pauses replication in order for the node tocatch up. See Flow Control from the Galera Cluster site for more information.
Check the following table for clues on different values and benchmarks:
wsrep_local_recv_queue_avg > 0.0
The node cannot apply write-sets as quickly as it receives them, thereby triggeringreplication throttling. Check wsrep_local_recv_queue_min andwsrep_local_recv_queue_max for a detailed look at this benchmark.
wsrep_local_send_queue_avg > 0.0
As the value of wsrep_local_send_queue_avg rises, so does the likelihood of replicationthrottling and network throughput issues. This is especially true aswsrep_local_recv_queue_avg rises.
wsrep_flow_control_paused > 0.0
Flow Control paused the node. To determine how long the node was paused, multiply thewsrep_flow_control_paused value with the number of seconds between querying it. Forexample, if wsrep_flow_control_paused = 0.50 a minute after last checking it, then nodereplication was paused for 30 seconds. If wsrep_flow_control_paused = 1.0 then the nodewas paused the entire time since the last query.
Ideally, wsrep_flow_control_paused should be as close to 0.0 as possible.
In case of throttling and pausing, you can check wsrep_cert_deps_distance to see how manywrite-sets (on average) can be applied in parallel. Then, check wsrep_slave_threads to see howmany write-sets can actually be applied simultaneously.
CHAPTER 6. USING GALERA
21

Configuring a higher wsrep_slave_threads can help mitigate throttling and pausing. For example,wsrep_cert_deps_distance reads 20, then doubling wsrep_slave_threads from 2 to 4 can alsodouble the amount of write-sets that the node can apply. However, wsrep_slave_threads shouldonly be set as high as the node’s number of CPU cores.
If a problematic node already has an optimal wsrep_slave_threads setting, then consider excludingthe node from the cluster as you investigate possible connectivity issues.
[1] This method was implemented to allow Galera to start successfully in overclouds that use IPv6(specifically, to address BZ#1298671).
Red Hat OpenStack Platform 10 Understanding Red Hat OpenStack Platform High Availability
22
CHAPTER 7. INVESTIGATING AND FIXING HACONTROLLER RESOURCES
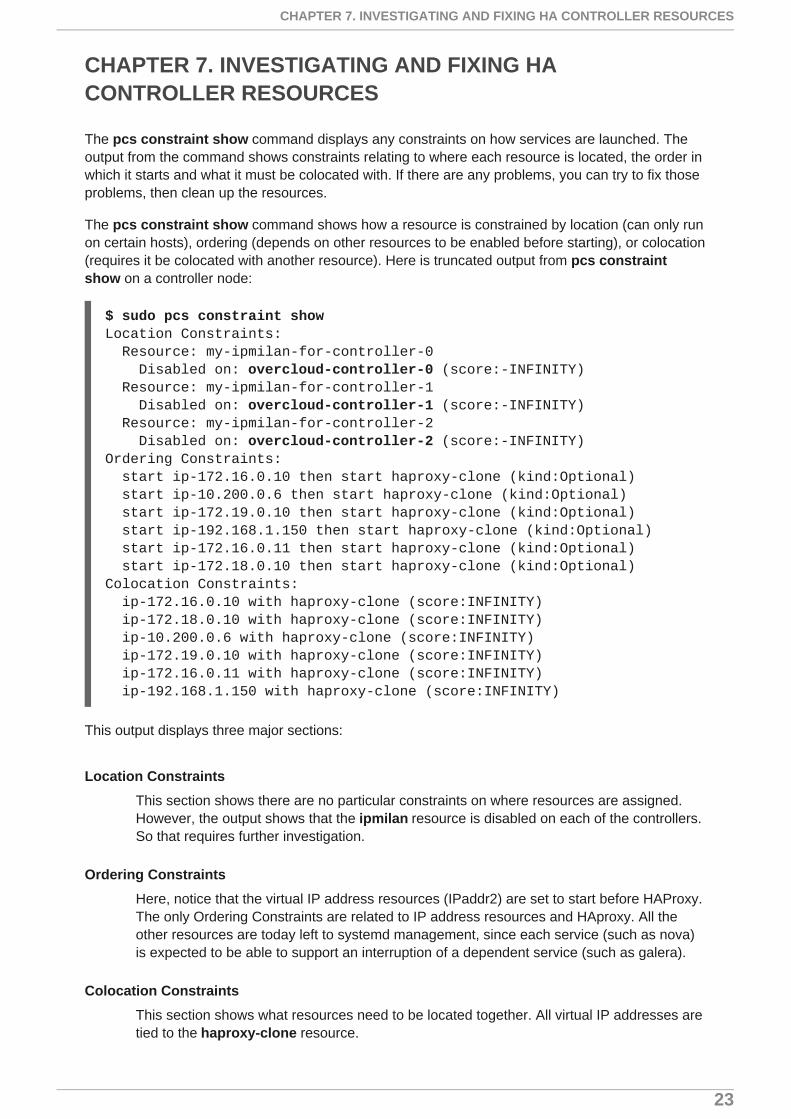
The pcs constraint show command displays any constraints on how services are launched. Theoutput from the command shows constraints relating to where each resource is located, the order inwhich it starts and what it must be colocated with. If there are any problems, you can try to fix thoseproblems, then clean up the resources.
The pcs constraint show command shows how a resource is constrained by location (can only runon certain hosts), ordering (depends on other resources to be enabled before starting), or colocation(requires it be colocated with another resource). Here is truncated output from pcs constraintshow on a controller node:
$ sudo pcs constraint showLocation Constraints: Resource: my-ipmilan-for-controller-0 Disabled on: overcloud-controller-0 (score:-INFINITY) Resource: my-ipmilan-for-controller-1 Disabled on: overcloud-controller-1 (score:-INFINITY) Resource: my-ipmilan-for-controller-2 Disabled on: overcloud-controller-2 (score:-INFINITY)Ordering Constraints: start ip-172.16.0.10 then start haproxy-clone (kind:Optional) start ip-10.200.0.6 then start haproxy-clone (kind:Optional) start ip-172.19.0.10 then start haproxy-clone (kind:Optional) start ip-192.168.1.150 then start haproxy-clone (kind:Optional) start ip-172.16.0.11 then start haproxy-clone (kind:Optional) start ip-172.18.0.10 then start haproxy-clone (kind:Optional)Colocation Constraints: ip-172.16.0.10 with haproxy-clone (score:INFINITY) ip-172.18.0.10 with haproxy-clone (score:INFINITY) ip-10.200.0.6 with haproxy-clone (score:INFINITY) ip-172.19.0.10 with haproxy-clone (score:INFINITY) ip-172.16.0.11 with haproxy-clone (score:INFINITY) ip-192.168.1.150 with haproxy-clone (score:INFINITY)
This output displays three major sections:
Location Constraints
This section shows there are no particular constraints on where resources are assigned.However, the output shows that the ipmilan resource is disabled on each of the controllers.So that requires further investigation.
Ordering Constraints
Here, notice that the virtual IP address resources (IPaddr2) are set to start before HAProxy.The only Ordering Constraints are related to IP address resources and HAproxy. All theother resources are today left to systemd management, since each service (such as nova)is expected to be able to support an interruption of a dependent service (such as galera).
Colocation Constraints
This section shows what resources need to be located together. All virtual IP addresses aretied to the haproxy-clone resource.
CHAPTER 7. INVESTIGATING AND FIXING HA CONTROLLER RESOURCES
23
7.1. CORRECTING RESOURCE PROBLEMS ON CONTROLLERS
Failed actions relating to the resources managed by the cluster are listed by the pcs statuscommand. There are many different kinds of problems that can occur. In general, you can approachproblems in the following ways:
Controller problem
If health checks to a controller are failing, log into the controller and check if services canstart up without problems. Service startup problems could indicate a communicationproblem between controllers. Other indications of communication problems betweencontrollers include:
A controller gets fenced disproportionately more than other controllers, and/or
A suspiciously large amount of services are failing from a specific controller.
Individual resource problem
If services from a controller are generally working, but an individual resource is failing, see ifyou can figure out the problem from the pcs status messages. If you need moreinformation, log into the controller where the resource is failing and try some of the stepsbelow.
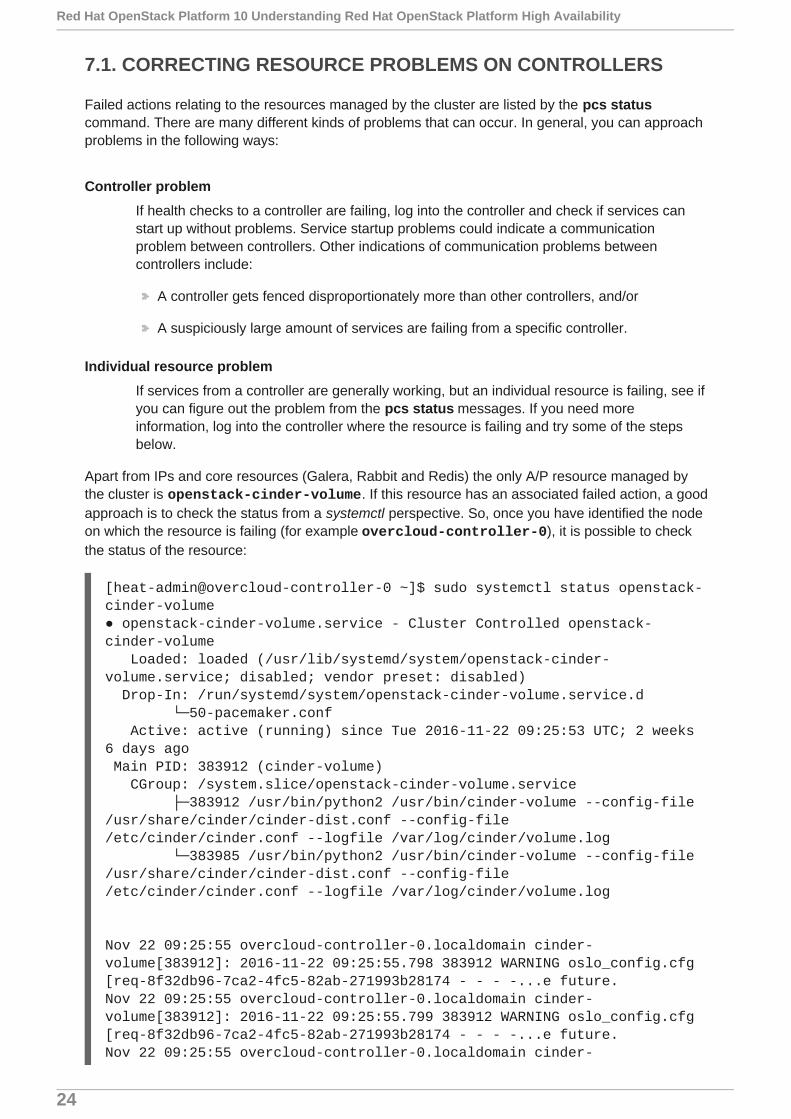
Apart from IPs and core resources (Galera, Rabbit and Redis) the only A/P resource managed bythe cluster is openstack-cinder-volume. If this resource has an associated failed action, a goodapproach is to check the status from a systemctl perspective. So, once you have identified the nodeon which the resource is failing (for example overcloud-controller-0), it is possible to checkthe status of the resource:
[heat-admin@overcloud-controller-0 ~]$ sudo systemctl status openstack-cinder-volume● openstack-cinder-volume.service - Cluster Controlled openstack-cinder-volume Loaded: loaded (/usr/lib/systemd/system/openstack-cinder-volume.service; disabled; vendor preset: disabled) Drop-In: /run/systemd/system/openstack-cinder-volume.service.d └─50-pacemaker.conf Active: active (running) since Tue 2016-11-22 09:25:53 UTC; 2 weeks 6 days ago Main PID: 383912 (cinder-volume) CGroup: /system.slice/openstack-cinder-volume.service ├─383912 /usr/bin/python2 /usr/bin/cinder-volume --config-file /usr/share/cinder/cinder-dist.conf --config-file /etc/cinder/cinder.conf --logfile /var/log/cinder/volume.log └─383985 /usr/bin/python2 /usr/bin/cinder-volume --config-file /usr/share/cinder/cinder-dist.conf --config-file /etc/cinder/cinder.conf --logfile /var/log/cinder/volume.log
Nov 22 09:25:55 overcloud-controller-0.localdomain cinder-volume[383912]: 2016-11-22 09:25:55.798 383912 WARNING oslo_config.cfg [req-8f32db96-7ca2-4fc5-82ab-271993b28174 - - - -...e future.Nov 22 09:25:55 overcloud-controller-0.localdomain cinder-volume[383912]: 2016-11-22 09:25:55.799 383912 WARNING oslo_config.cfg [req-8f32db96-7ca2-4fc5-82ab-271993b28174 - - - -...e future.Nov 22 09:25:55 overcloud-controller-0.localdomain cinder-
Red Hat OpenStack Platform 10 Understanding Red Hat OpenStack Platform High Availability
24
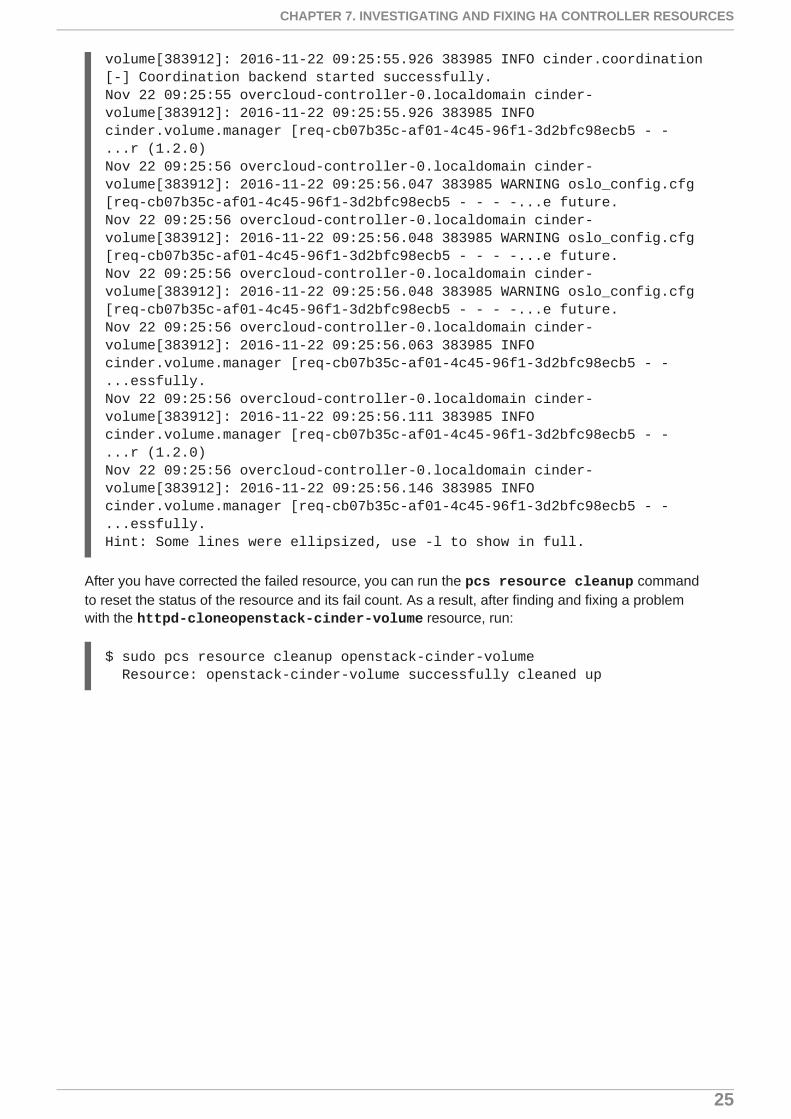
volume[383912]: 2016-11-22 09:25:55.926 383985 INFO cinder.coordination [-] Coordination backend started successfully.Nov 22 09:25:55 overcloud-controller-0.localdomain cinder-volume[383912]: 2016-11-22 09:25:55.926 383985 INFO cinder.volume.manager [req-cb07b35c-af01-4c45-96f1-3d2bfc98ecb5 - - ...r (1.2.0)Nov 22 09:25:56 overcloud-controller-0.localdomain cinder-volume[383912]: 2016-11-22 09:25:56.047 383985 WARNING oslo_config.cfg [req-cb07b35c-af01-4c45-96f1-3d2bfc98ecb5 - - - -...e future.Nov 22 09:25:56 overcloud-controller-0.localdomain cinder-volume[383912]: 2016-11-22 09:25:56.048 383985 WARNING oslo_config.cfg [req-cb07b35c-af01-4c45-96f1-3d2bfc98ecb5 - - - -...e future.Nov 22 09:25:56 overcloud-controller-0.localdomain cinder-volume[383912]: 2016-11-22 09:25:56.048 383985 WARNING oslo_config.cfg [req-cb07b35c-af01-4c45-96f1-3d2bfc98ecb5 - - - -...e future.Nov 22 09:25:56 overcloud-controller-0.localdomain cinder-volume[383912]: 2016-11-22 09:25:56.063 383985 INFO cinder.volume.manager [req-cb07b35c-af01-4c45-96f1-3d2bfc98ecb5 - - ...essfully.Nov 22 09:25:56 overcloud-controller-0.localdomain cinder-volume[383912]: 2016-11-22 09:25:56.111 383985 INFO cinder.volume.manager [req-cb07b35c-af01-4c45-96f1-3d2bfc98ecb5 - - ...r (1.2.0)Nov 22 09:25:56 overcloud-controller-0.localdomain cinder-volume[383912]: 2016-11-22 09:25:56.146 383985 INFO cinder.volume.manager [req-cb07b35c-af01-4c45-96f1-3d2bfc98ecb5 - - ...essfully.Hint: Some lines were ellipsized, use -l to show in full.
After you have corrected the failed resource, you can run the pcs resource cleanup commandto reset the status of the resource and its fail count. As a result, after finding and fixing a problemwith the httpd-cloneopenstack-cinder-volume resource, run:
$ sudo pcs resource cleanup openstack-cinder-volume Resource: openstack-cinder-volume successfully cleaned up
CHAPTER 7. INVESTIGATING AND FIXING HA CONTROLLER RESOURCES
25
CHAPTER 8. INVESTIGATING HA CEPH NODES
When deployed with Ceph storage, Red Hat OpenStack Platform uses ceph-mon as a monitordaemon for the Ceph cluster. The director deploys this daemon on all controller nodes.
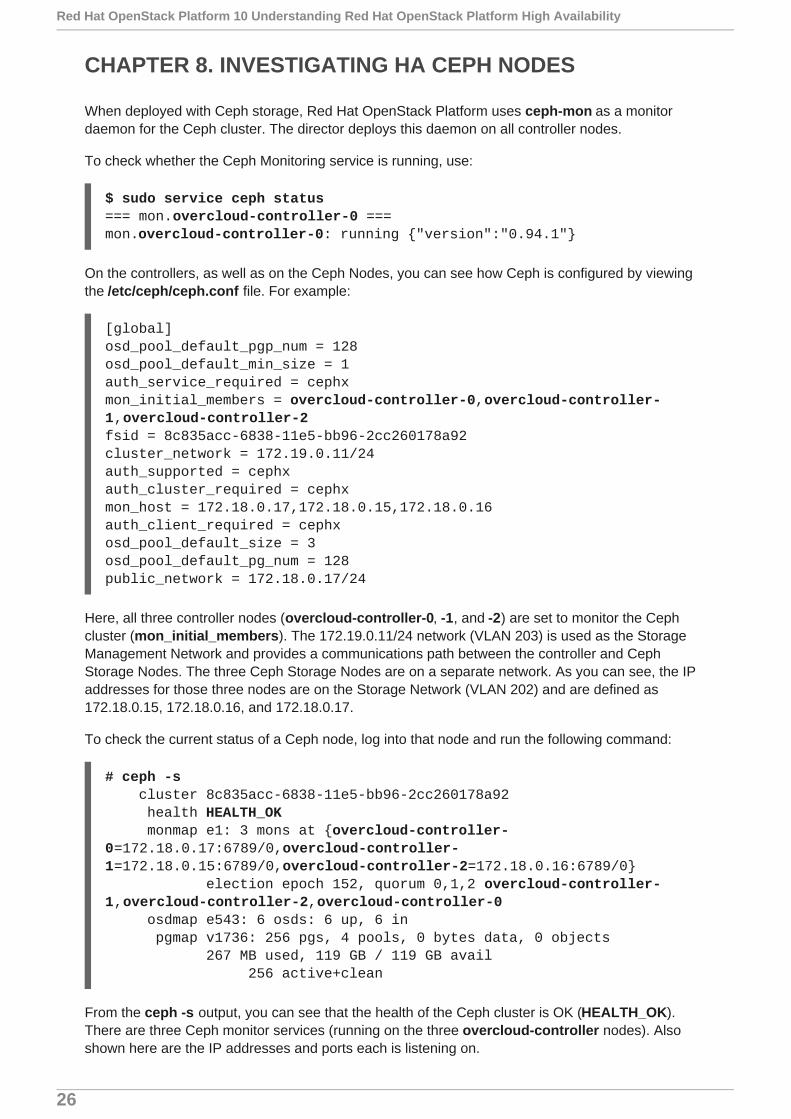
To check whether the Ceph Monitoring service is running, use:
$ sudo service ceph status=== mon.overcloud-controller-0 ===mon.overcloud-controller-0: running {"version":"0.94.1"}
On the controllers, as well as on the Ceph Nodes, you can see how Ceph is configured by viewingthe /etc/ceph/ceph.conf file. For example:
[global]osd_pool_default_pgp_num = 128osd_pool_default_min_size = 1auth_service_required = cephxmon_initial_members = overcloud-controller-0,overcloud-controller-1,overcloud-controller-2fsid = 8c835acc-6838-11e5-bb96-2cc260178a92cluster_network = 172.19.0.11/24auth_supported = cephxauth_cluster_required = cephxmon_host = 172.18.0.17,172.18.0.15,172.18.0.16auth_client_required = cephxosd_pool_default_size = 3osd_pool_default_pg_num = 128public_network = 172.18.0.17/24
Here, all three controller nodes (overcloud-controller-0, -1, and -2) are set to monitor the Cephcluster (mon_initial_members). The 172.19.0.11/24 network (VLAN 203) is used as the StorageManagement Network and provides a communications path between the controller and CephStorage Nodes. The three Ceph Storage Nodes are on a separate network. As you can see, the IPaddresses for those three nodes are on the Storage Network (VLAN 202) and are defined as172.18.0.15, 172.18.0.16, and 172.18.0.17.
To check the current status of a Ceph node, log into that node and run the following command:
# ceph -s cluster 8c835acc-6838-11e5-bb96-2cc260178a92 health HEALTH_OK monmap e1: 3 mons at {overcloud-controller-0=172.18.0.17:6789/0,overcloud-controller-1=172.18.0.15:6789/0,overcloud-controller-2=172.18.0.16:6789/0} election epoch 152, quorum 0,1,2 overcloud-controller-1,overcloud-controller-2,overcloud-controller-0 osdmap e543: 6 osds: 6 up, 6 in pgmap v1736: 256 pgs, 4 pools, 0 bytes data, 0 objects 267 MB used, 119 GB / 119 GB avail 256 active+clean
From the ceph -s output, you can see that the health of the Ceph cluster is OK (HEALTH_OK).There are three Ceph monitor services (running on the three overcloud-controller nodes). Alsoshown here are the IP addresses and ports each is listening on.
Red Hat OpenStack Platform 10 Understanding Red Hat OpenStack Platform High Availability
26

For more information about Red Hat Ceph, see the Red Hat Ceph product page.
CHAPTER 8. INVESTIGATING HA CEPH NODES
27
APPENDIX A. BUILDING THE RED HAT OPENSTACKPLATFORM 10 HA ENVIRONMENT
The Red Hat Ceph Storage for the Overcloud guide provides instructions for deploying the type ofhighly available OpenStack environment described in this document. The Director Installation andUsage guide was also used for reference throughout the process.
A.1. HARDWARE SPECIFICATION
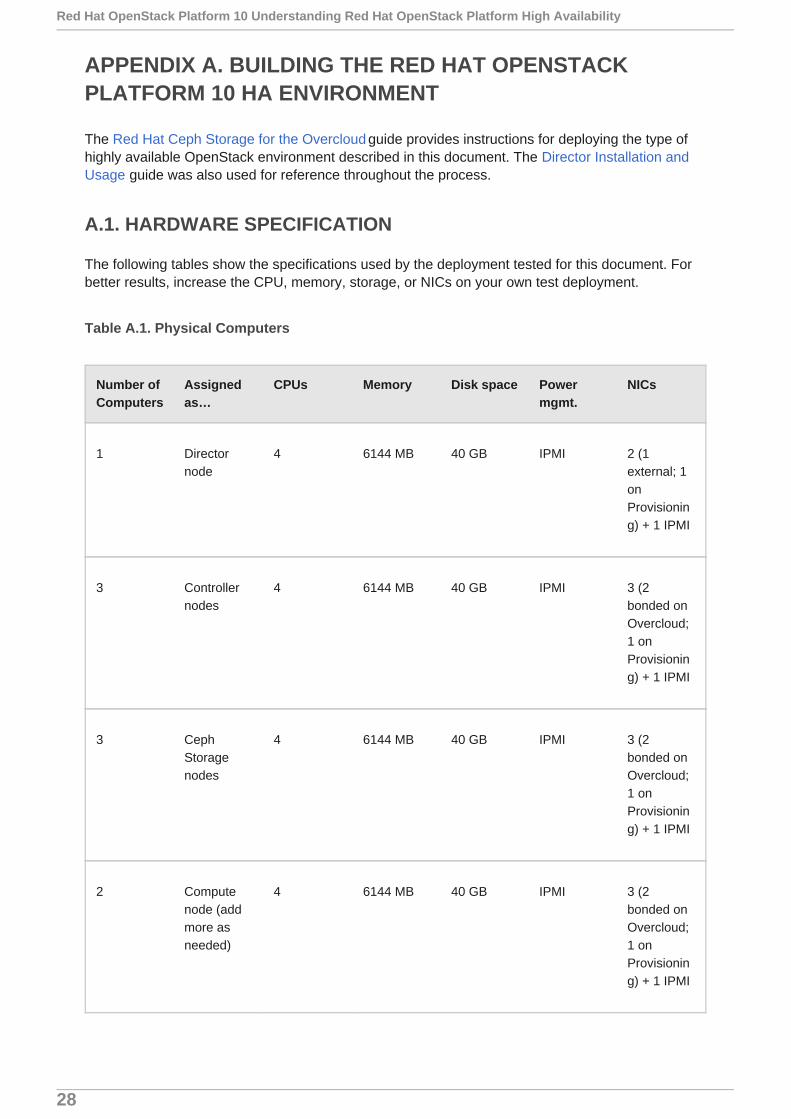
The following tables show the specifications used by the deployment tested for this document. Forbetter results, increase the CPU, memory, storage, or NICs on your own test deployment.
Table A.1. Physical Computers
Number ofComputers
Assignedas…
CPUs Memory Disk space Powermgmt.
NICs
1 Directornode
4 6144 MB 40 GB IPMI 2 (1external; 1onProvisioning) + 1 IPMI
3 Controllernodes
4 6144 MB 40 GB IPMI 3 (2bonded onOvercloud;1 onProvisioning) + 1 IPMI
3 CephStoragenodes
4 6144 MB 40 GB IPMI 3 (2bonded onOvercloud;1 onProvisioning) + 1 IPMI
2 Computenode (addmore asneeded)
4 6144 MB 40 GB IPMI 3 (2bonded onOvercloud;1 onProvisioning) + 1 IPMI
Red Hat OpenStack Platform 10 Understanding Red Hat OpenStack Platform High Availability
28
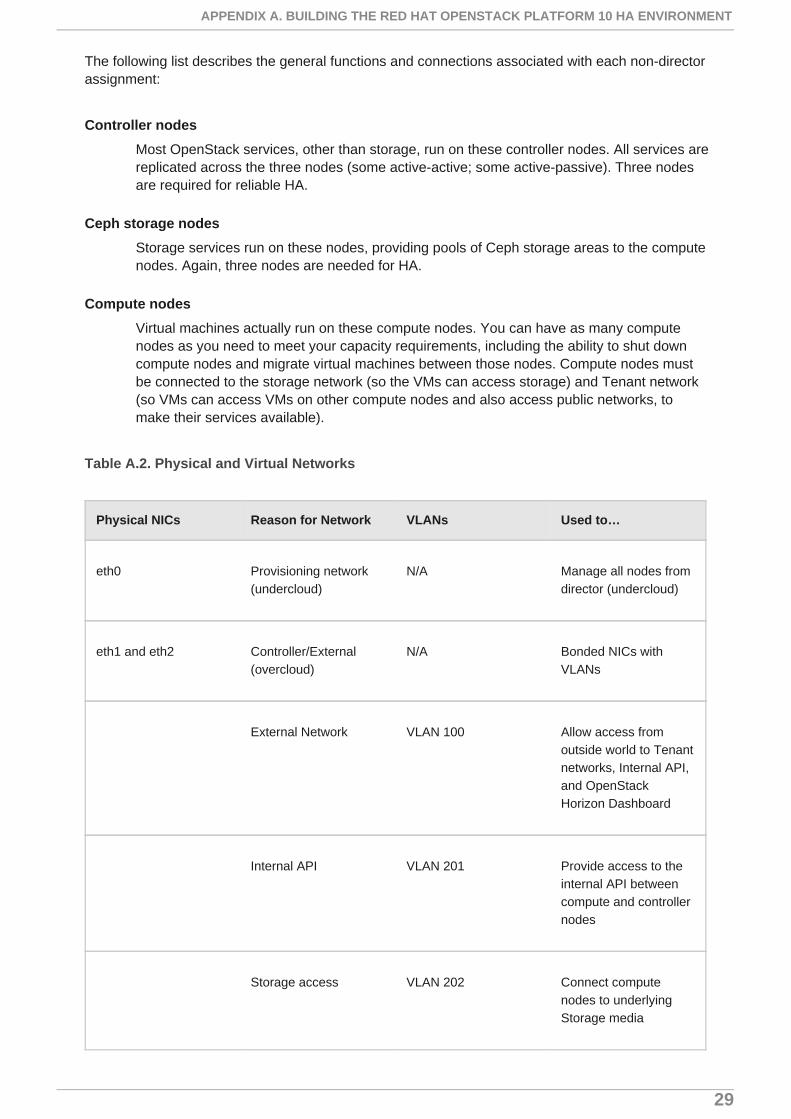
The following list describes the general functions and connections associated with each non-directorassignment:
Controller nodes
Most OpenStack services, other than storage, run on these controller nodes. All services arereplicated across the three nodes (some active-active; some active-passive). Three nodesare required for reliable HA.
Ceph storage nodes
Storage services run on these nodes, providing pools of Ceph storage areas to the computenodes. Again, three nodes are needed for HA.
Compute nodes
Virtual machines actually run on these compute nodes. You can have as many computenodes as you need to meet your capacity requirements, including the ability to shut downcompute nodes and migrate virtual machines between those nodes. Compute nodes mustbe connected to the storage network (so the VMs can access storage) and Tenant network(so VMs can access VMs on other compute nodes and also access public networks, tomake their services available).
Table A.2. Physical and Virtual Networks
Physical NICs Reason for Network VLANs Used to…
eth0 Provisioning network(undercloud)
N/A Manage all nodes fromdirector (undercloud)
eth1 and eth2 Controller/External(overcloud)
N/A Bonded NICs withVLANs
External Network VLAN 100 Allow access from
outside world to Tenantnetworks, Internal API,and OpenStackHorizon Dashboard
Internal API VLAN 201 Provide access to the
internal API betweencompute and controllernodes
Storage access VLAN 202 Connect compute
nodes to underlyingStorage media
APPENDIX A. BUILDING THE RED HAT OPENSTACK PLATFORM 10 HA ENVIRONMENT
29
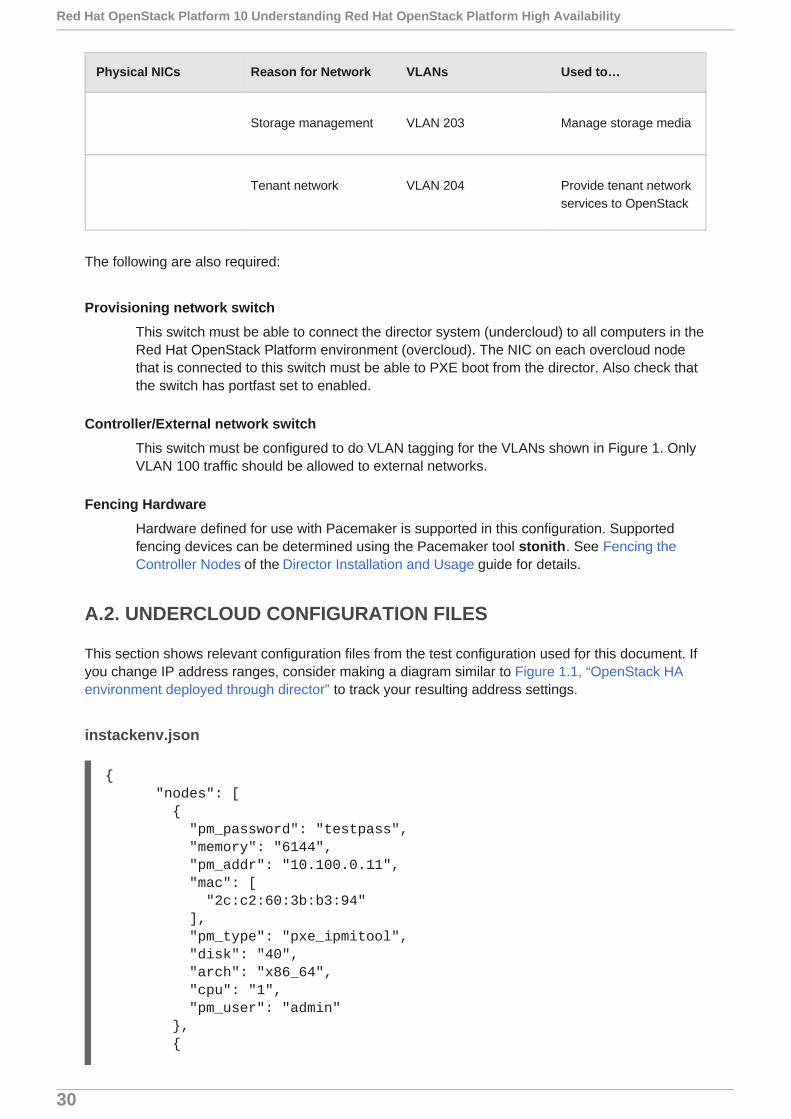
Storage management VLAN 203 Manage storage media
Tenant network VLAN 204 Provide tenant network
services to OpenStack
Physical NICs Reason for Network VLANs Used to…
The following are also required:
Provisioning network switch
This switch must be able to connect the director system (undercloud) to all computers in theRed Hat OpenStack Platform environment (overcloud). The NIC on each overcloud nodethat is connected to this switch must be able to PXE boot from the director. Also check thatthe switch has portfast set to enabled.
Controller/External network switch
This switch must be configured to do VLAN tagging for the VLANs shown in Figure 1. OnlyVLAN 100 traffic should be allowed to external networks.
Fencing Hardware
Hardware defined for use with Pacemaker is supported in this configuration. Supportedfencing devices can be determined using the Pacemaker tool stonith. See Fencing theController Nodes of the Director Installation and Usage guide for details.
A.2. UNDERCLOUD CONFIGURATION FILES
This section shows relevant configuration files from the test configuration used for this document. Ifyou change IP address ranges, consider making a diagram similar to Figure 1.1, “OpenStack HAenvironment deployed through director” to track your resulting address settings.
instackenv.json
{ "nodes": [ { "pm_password": "testpass", "memory": "6144", "pm_addr": "10.100.0.11", "mac": [ "2c:c2:60:3b:b3:94" ], "pm_type": "pxe_ipmitool", "disk": "40", "arch": "x86_64", "cpu": "1", "pm_user": "admin" }, {
Red Hat OpenStack Platform 10 Understanding Red Hat OpenStack Platform High Availability
30
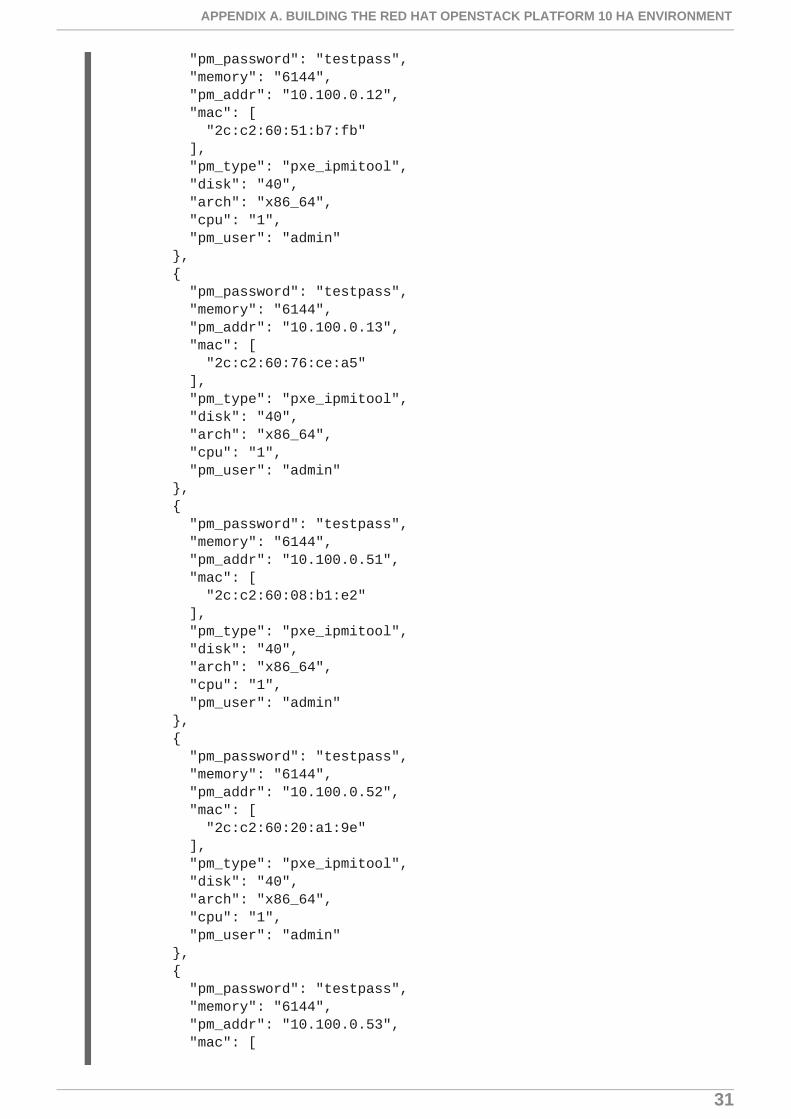
"pm_password": "testpass", "memory": "6144", "pm_addr": "10.100.0.12", "mac": [ "2c:c2:60:51:b7:fb" ], "pm_type": "pxe_ipmitool", "disk": "40", "arch": "x86_64", "cpu": "1", "pm_user": "admin" }, { "pm_password": "testpass", "memory": "6144", "pm_addr": "10.100.0.13", "mac": [ "2c:c2:60:76:ce:a5" ], "pm_type": "pxe_ipmitool", "disk": "40", "arch": "x86_64", "cpu": "1", "pm_user": "admin" }, { "pm_password": "testpass", "memory": "6144", "pm_addr": "10.100.0.51", "mac": [ "2c:c2:60:08:b1:e2" ], "pm_type": "pxe_ipmitool", "disk": "40", "arch": "x86_64", "cpu": "1", "pm_user": "admin" }, { "pm_password": "testpass", "memory": "6144", "pm_addr": "10.100.0.52", "mac": [ "2c:c2:60:20:a1:9e" ], "pm_type": "pxe_ipmitool", "disk": "40", "arch": "x86_64", "cpu": "1", "pm_user": "admin" }, { "pm_password": "testpass", "memory": "6144", "pm_addr": "10.100.0.53", "mac": [
APPENDIX A. BUILDING THE RED HAT OPENSTACK PLATFORM 10 HA ENVIRONMENT
31

"2c:c2:60:58:10:33" ], "pm_type": "pxe_ipmitool", "disk": "40", "arch": "x86_64", "cpu": "1", "pm_user": "admin" }, { "pm_password": "testpass", "memory": "6144", "pm_addr": "10.100.0.101", "mac": [ "2c:c2:60:31:a9:55" ], "pm_type": "pxe_ipmitool", "disk": "40", "arch": "x86_64", "cpu": "2", "pm_user": "admin" }, { "pm_password": "testpass", "memory": "6144", "pm_addr": "10.100.0.102", "mac": [ "2c:c2:60:0d:e7:d1" ], "pm_type": "pxe_ipmitool", "disk": "40", "arch": "x86_64", "cpu": "2", "pm_user": "admin" } ], "overcloud": {"password": "7adbbbeedc5b7a07ba1917e1b3b228334f9a2d4e", "endpoint": "http://192.168.1.150:5000/v2.0/" }}
undercloud.conf
[DEFAULT]image_path = /home/stack/imageslocal_ip = 10.200.0.1/24undercloud_public_vip = 10.200.0.2undercloud_admin_vip = 10.200.0.3undercloud_service_certificate = /etc/pki/instack-certs/undercloud.pemlocal_interface = eth0masquerade_network = 10.200.0.0/24dhcp_start = 10.200.0.5dhcp_end = 10.200.0.24network_cidr = 10.200.0.0/24network_gateway = 10.200.0.1
Red Hat OpenStack Platform 10 Understanding Red Hat OpenStack Platform High Availability
32
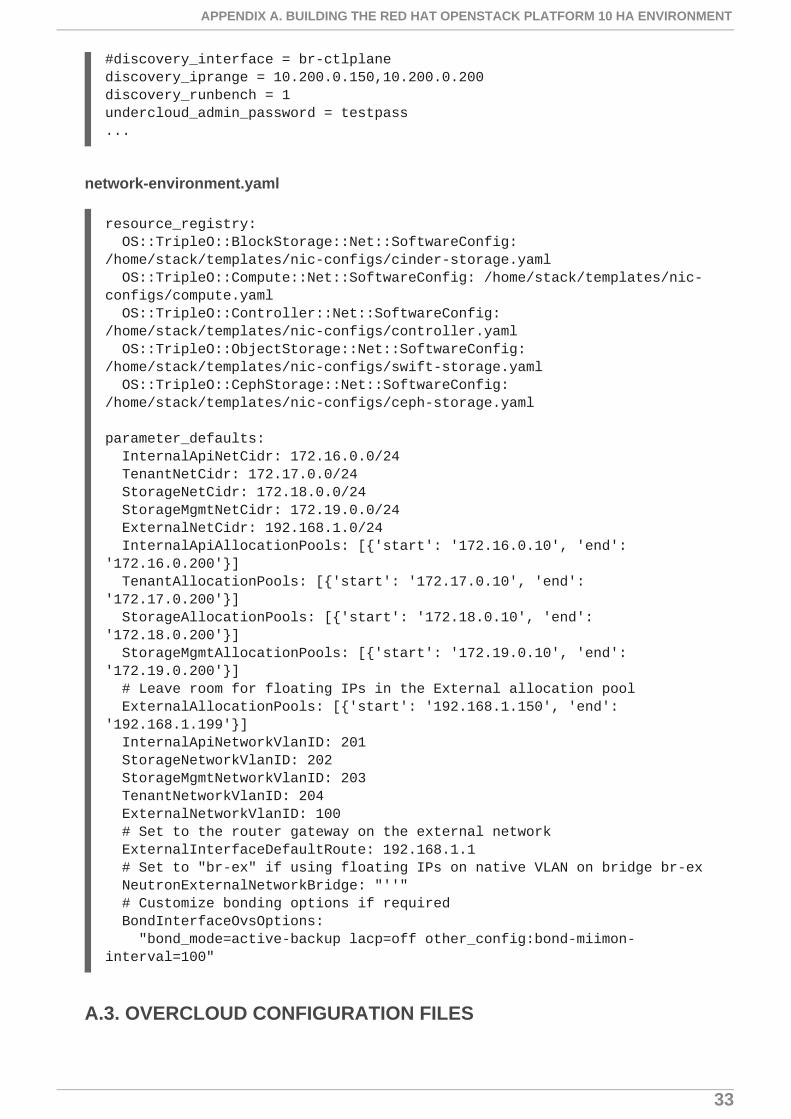
#discovery_interface = br-ctlplanediscovery_iprange = 10.200.0.150,10.200.0.200discovery_runbench = 1undercloud_admin_password = testpass...
network-environment.yaml
resource_registry: OS::TripleO::BlockStorage::Net::SoftwareConfig: /home/stack/templates/nic-configs/cinder-storage.yaml OS::TripleO::Compute::Net::SoftwareConfig: /home/stack/templates/nic-configs/compute.yaml OS::TripleO::Controller::Net::SoftwareConfig: /home/stack/templates/nic-configs/controller.yaml OS::TripleO::ObjectStorage::Net::SoftwareConfig: /home/stack/templates/nic-configs/swift-storage.yaml OS::TripleO::CephStorage::Net::SoftwareConfig: /home/stack/templates/nic-configs/ceph-storage.yaml
parameter_defaults: InternalApiNetCidr: 172.16.0.0/24 TenantNetCidr: 172.17.0.0/24 StorageNetCidr: 172.18.0.0/24 StorageMgmtNetCidr: 172.19.0.0/24 ExternalNetCidr: 192.168.1.0/24 InternalApiAllocationPools: [{'start': '172.16.0.10', 'end': '172.16.0.200'}] TenantAllocationPools: [{'start': '172.17.0.10', 'end': '172.17.0.200'}] StorageAllocationPools: [{'start': '172.18.0.10', 'end': '172.18.0.200'}] StorageMgmtAllocationPools: [{'start': '172.19.0.10', 'end': '172.19.0.200'}] # Leave room for floating IPs in the External allocation pool ExternalAllocationPools: [{'start': '192.168.1.150', 'end': '192.168.1.199'}] InternalApiNetworkVlanID: 201 StorageNetworkVlanID: 202 StorageMgmtNetworkVlanID: 203 TenantNetworkVlanID: 204 ExternalNetworkVlanID: 100 # Set to the router gateway on the external network ExternalInterfaceDefaultRoute: 192.168.1.1 # Set to "br-ex" if using floating IPs on native VLAN on bridge br-ex NeutronExternalNetworkBridge: "''" # Customize bonding options if required BondInterfaceOvsOptions: "bond_mode=active-backup lacp=off other_config:bond-miimon-interval=100"
A.3. OVERCLOUD CONFIGURATION FILES
APPENDIX A. BUILDING THE RED HAT OPENSTACK PLATFORM 10 HA ENVIRONMENT
33
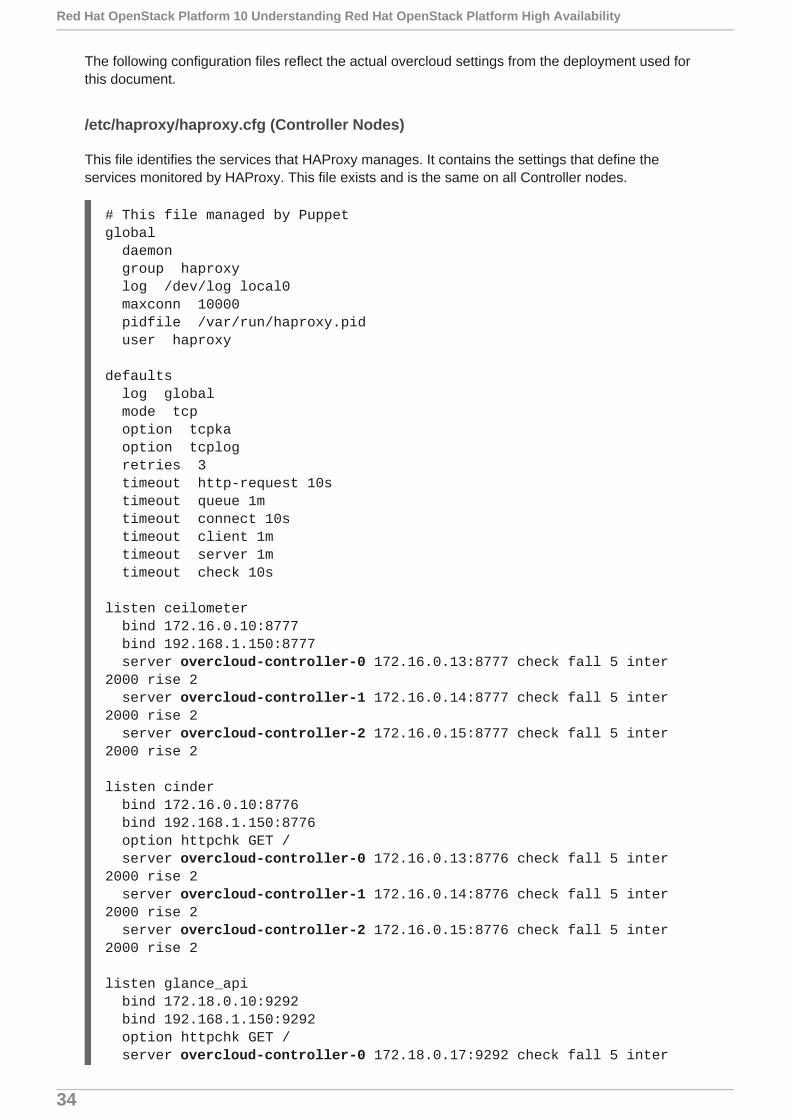
The following configuration files reflect the actual overcloud settings from the deployment used forthis document.
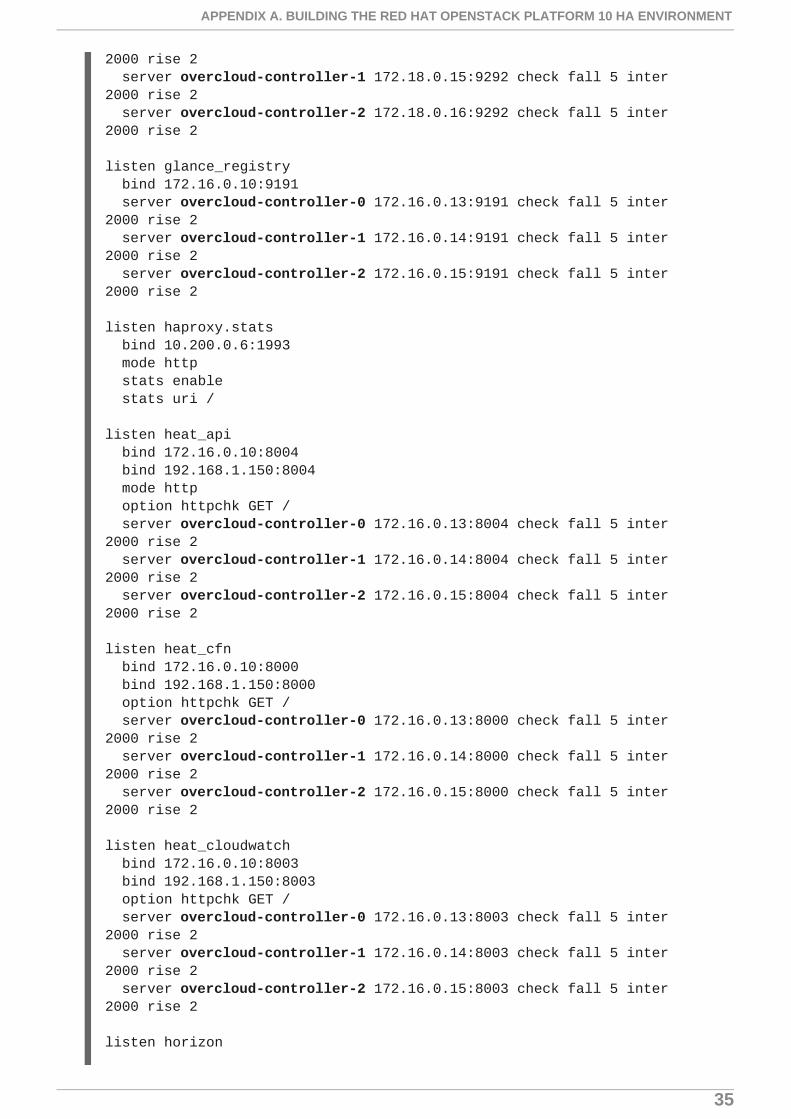
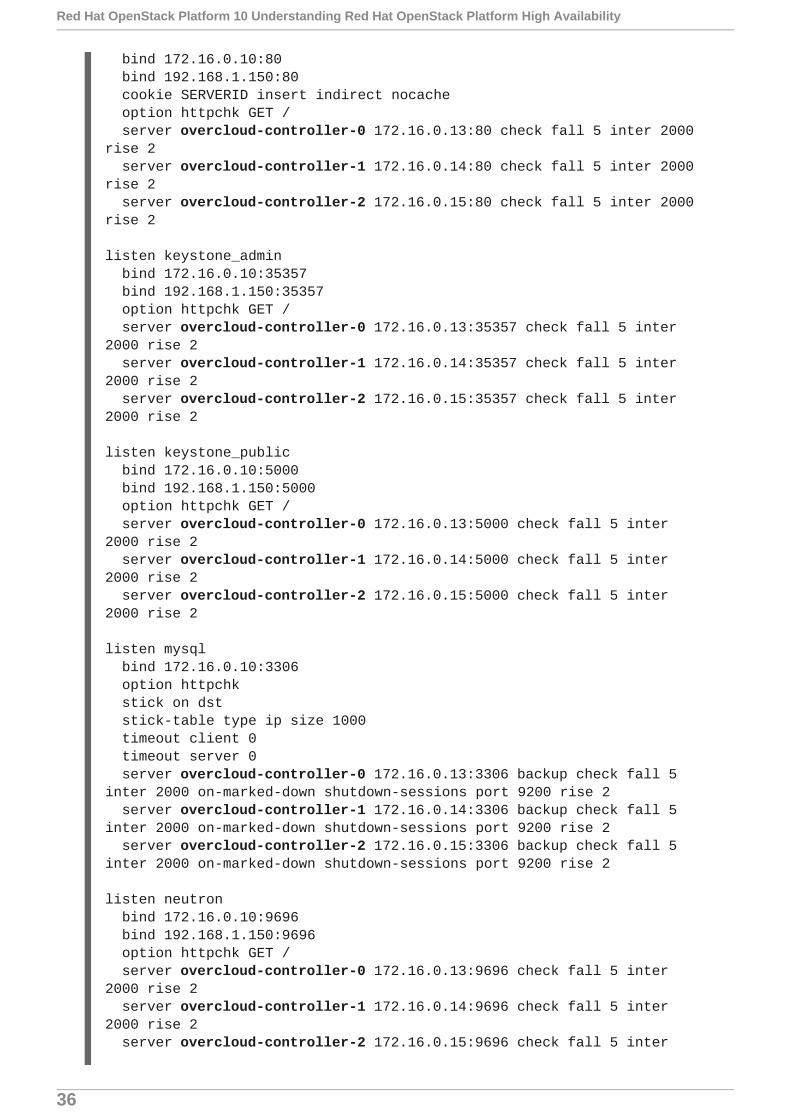
/etc/haproxy/haproxy.cfg (Controller Nodes)
This file identifies the services that HAProxy manages. It contains the settings that define theservices monitored by HAProxy. This file exists and is the same on all Controller nodes.
# This file managed by Puppetglobal daemon group haproxy log /dev/log local0 maxconn 10000 pidfile /var/run/haproxy.pid user haproxy
defaults log global mode tcp option tcpka option tcplog retries 3 timeout http-request 10s timeout queue 1m timeout connect 10s timeout client 1m timeout server 1m timeout check 10s
listen ceilometer bind 172.16.0.10:8777 bind 192.168.1.150:8777 server overcloud-controller-0 172.16.0.13:8777 check fall 5 inter 2000 rise 2 server overcloud-controller-1 172.16.0.14:8777 check fall 5 inter 2000 rise 2 server overcloud-controller-2 172.16.0.15:8777 check fall 5 inter 2000 rise 2
listen cinder bind 172.16.0.10:8776 bind 192.168.1.150:8776 option httpchk GET / server overcloud-controller-0 172.16.0.13:8776 check fall 5 inter 2000 rise 2 server overcloud-controller-1 172.16.0.14:8776 check fall 5 inter 2000 rise 2 server overcloud-controller-2 172.16.0.15:8776 check fall 5 inter 2000 rise 2
listen glance_api bind 172.18.0.10:9292 bind 192.168.1.150:9292 option httpchk GET / server overcloud-controller-0 172.18.0.17:9292 check fall 5 inter
Red Hat OpenStack Platform 10 Understanding Red Hat OpenStack Platform High Availability
34
2000 rise 2 server overcloud-controller-1 172.18.0.15:9292 check fall 5 inter 2000 rise 2 server overcloud-controller-2 172.18.0.16:9292 check fall 5 inter 2000 rise 2
listen glance_registry bind 172.16.0.10:9191 server overcloud-controller-0 172.16.0.13:9191 check fall 5 inter 2000 rise 2 server overcloud-controller-1 172.16.0.14:9191 check fall 5 inter 2000 rise 2 server overcloud-controller-2 172.16.0.15:9191 check fall 5 inter 2000 rise 2
listen haproxy.stats bind 10.200.0.6:1993 mode http stats enable stats uri /
listen heat_api bind 172.16.0.10:8004 bind 192.168.1.150:8004 mode http option httpchk GET / server overcloud-controller-0 172.16.0.13:8004 check fall 5 inter 2000 rise 2 server overcloud-controller-1 172.16.0.14:8004 check fall 5 inter 2000 rise 2 server overcloud-controller-2 172.16.0.15:8004 check fall 5 inter 2000 rise 2
listen heat_cfn bind 172.16.0.10:8000 bind 192.168.1.150:8000 option httpchk GET / server overcloud-controller-0 172.16.0.13:8000 check fall 5 inter 2000 rise 2 server overcloud-controller-1 172.16.0.14:8000 check fall 5 inter 2000 rise 2 server overcloud-controller-2 172.16.0.15:8000 check fall 5 inter 2000 rise 2
listen heat_cloudwatch bind 172.16.0.10:8003 bind 192.168.1.150:8003 option httpchk GET / server overcloud-controller-0 172.16.0.13:8003 check fall 5 inter 2000 rise 2 server overcloud-controller-1 172.16.0.14:8003 check fall 5 inter 2000 rise 2 server overcloud-controller-2 172.16.0.15:8003 check fall 5 inter 2000 rise 2
listen horizon
APPENDIX A. BUILDING THE RED HAT OPENSTACK PLATFORM 10 HA ENVIRONMENT
35
bind 172.16.0.10:80 bind 192.168.1.150:80 cookie SERVERID insert indirect nocache option httpchk GET / server overcloud-controller-0 172.16.0.13:80 check fall 5 inter 2000 rise 2 server overcloud-controller-1 172.16.0.14:80 check fall 5 inter 2000 rise 2 server overcloud-controller-2 172.16.0.15:80 check fall 5 inter 2000 rise 2
listen keystone_admin bind 172.16.0.10:35357 bind 192.168.1.150:35357 option httpchk GET / server overcloud-controller-0 172.16.0.13:35357 check fall 5 inter 2000 rise 2 server overcloud-controller-1 172.16.0.14:35357 check fall 5 inter 2000 rise 2 server overcloud-controller-2 172.16.0.15:35357 check fall 5 inter 2000 rise 2
listen keystone_public bind 172.16.0.10:5000 bind 192.168.1.150:5000 option httpchk GET / server overcloud-controller-0 172.16.0.13:5000 check fall 5 inter 2000 rise 2 server overcloud-controller-1 172.16.0.14:5000 check fall 5 inter 2000 rise 2 server overcloud-controller-2 172.16.0.15:5000 check fall 5 inter 2000 rise 2
listen mysql bind 172.16.0.10:3306 option httpchk stick on dst stick-table type ip size 1000 timeout client 0 timeout server 0 server overcloud-controller-0 172.16.0.13:3306 backup check fall 5 inter 2000 on-marked-down shutdown-sessions port 9200 rise 2 server overcloud-controller-1 172.16.0.14:3306 backup check fall 5 inter 2000 on-marked-down shutdown-sessions port 9200 rise 2 server overcloud-controller-2 172.16.0.15:3306 backup check fall 5 inter 2000 on-marked-down shutdown-sessions port 9200 rise 2
listen neutron bind 172.16.0.10:9696 bind 192.168.1.150:9696 option httpchk GET / server overcloud-controller-0 172.16.0.13:9696 check fall 5 inter 2000 rise 2 server overcloud-controller-1 172.16.0.14:9696 check fall 5 inter 2000 rise 2 server overcloud-controller-2 172.16.0.15:9696 check fall 5 inter
Red Hat OpenStack Platform 10 Understanding Red Hat OpenStack Platform High Availability
36

2000 rise 2
listen nova_ec2 bind 172.16.0.10:8773 bind 192.168.1.150:8773 option httpchk GET / server overcloud-controller-0 172.16.0.13:8773 check fall 5 inter 2000 rise 2 server overcloud-controller-1 172.16.0.14:8773 check fall 5 inter 2000 rise 2 server overcloud-controller-2 172.16.0.15:8773 check fall 5 inter 2000 rise 2
listen nova_metadata bind 172.16.0.10:8775 option httpchk GET / server overcloud-controller-0 172.16.0.13:8775 check fall 5 inter 2000 rise 2 server overcloud-controller-1 172.16.0.14:8775 check fall 5 inter 2000 rise 2 server overcloud-controller-2 172.16.0.15:8775 check fall 5 inter 2000 rise 2
listen nova_novncproxy bind 172.16.0.10:6080 bind 192.168.1.150:6080 option httpchk GET / server overcloud-controller-0 172.16.0.13:6080 check fall 5 inter 2000 rise 2 server overcloud-controller-1 172.16.0.14:6080 check fall 5 inter 2000 rise 2 server overcloud-controller-2 172.16.0.15:6080 check fall 5 inter 2000 rise 2
listen nova_osapi bind 172.16.0.10:8774 bind 192.168.1.150:8774 option httpchk GET / server overcloud-controller-0 172.16.0.13:8774 check fall 5 inter 2000 rise 2 server overcloud-controller-1 172.16.0.14:8774 check fall 5 inter 2000 rise 2 server overcloud-controller-2 172.16.0.15:8774 check fall 5 inter 2000 rise 2
listen redis bind 172.16.0.11:6379 balance first option tcp-check tcp-check send info\ replication\r\n tcp-check expect string role:master timeout client 0 timeout server 0 server overcloud-controller-0 172.16.0.13:6379 check fall 5 inter 2000 rise 2 server overcloud-controller-1 172.16.0.14:6379 check fall 5 inter
APPENDIX A. BUILDING THE RED HAT OPENSTACK PLATFORM 10 HA ENVIRONMENT
37
2000 rise 2 server overcloud-controller-2 172.16.0.15:6379 check fall 5 inter 2000 rise 2
listen swift_proxy_server bind 172.18.0.10:8080 bind 192.168.1.150:8080 option httpchk GET /info server overcloud-controller-0 172.18.0.17:8080 check fall 5 inter 2000 rise 2 server overcloud-controller-1 172.18.0.15:8080 check fall 5 inter 2000 rise 2 server overcloud-controller-2 172.18.0.16:8080 check fall 5 inter 2000 rise 2
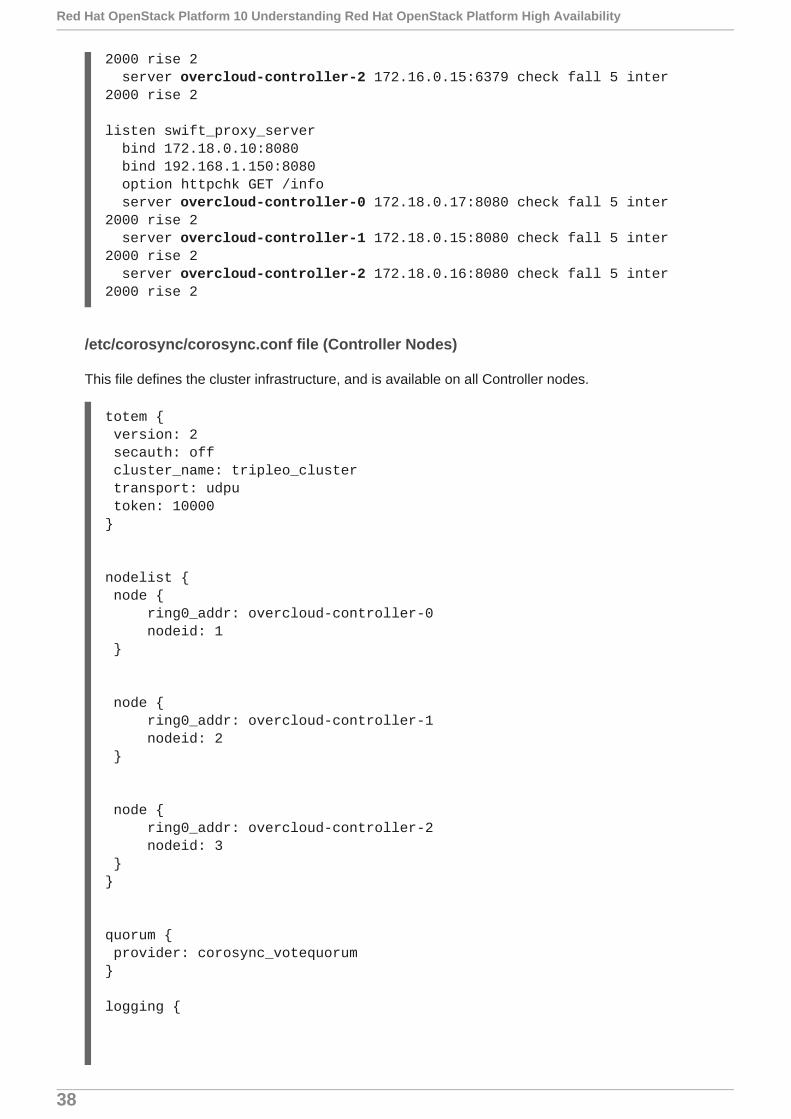
/etc/corosync/corosync.conf file (Controller Nodes)
This file defines the cluster infrastructure, and is available on all Controller nodes.
totem { version: 2 secauth: off cluster_name: tripleo_cluster transport: udpu token: 10000}
nodelist { node { ring0_addr: overcloud-controller-0 nodeid: 1 }
node { ring0_addr: overcloud-controller-1 nodeid: 2 }
node { ring0_addr: overcloud-controller-2 nodeid: 3 }}
quorum { provider: corosync_votequorum}
logging {
Red Hat OpenStack Platform 10 Understanding Red Hat OpenStack Platform High Availability
38

to_logfile: yes logfile: /var/log/cluster/corosync.log to_syslog: yes}
/etc/ceph/ceph.conf (Ceph Nodes)
This file contains Ceph high availability settings, including the hostnames and IP addresses ofmonitoring hosts.
[global]osd_pool_default_pgp_num = 128osd_pool_default_min_size = 1auth_service_required = cephxmon_initial_members = overcloud-controller-0,overcloud-controller-1,overcloud-controller-2fsid = 8c835acc-6838-11e5-bb96-2cc260178a92cluster_network = 172.19.0.11/24auth_supported = cephxauth_cluster_required = cephxmon_host = 172.18.0.17,172.18.0.15,172.18.0.16auth_client_required = cephxosd_pool_default_size = 3osd_pool_default_pg_num = 128public_network = 172.18.0.17/24
APPENDIX A. BUILDING THE RED HAT OPENSTACK PLATFORM 10 HA ENVIRONMENT
39