Understanding Pedestrian and Bicyclist Compliance and ...
51
University of South Florida Scholar Commons Graduate eses and Dissertations Graduate School January 2013 Understanding Pedestrian and Bicyclist Compliance and Safety Impacts of Different Walk Modes at Signalized Intersections for a Livable Community Jacob Allen Mirabella University of South Florida, [email protected] Follow this and additional works at: hp://scholarcommons.usf.edu/etd Part of the Engineering Commons is esis is brought to you for free and open access by the Graduate School at Scholar Commons. It has been accepted for inclusion in Graduate eses and Dissertations by an authorized administrator of Scholar Commons. For more information, please contact [email protected]. Scholar Commons Citation Mirabella, Jacob Allen, "Understanding Pedestrian and Bicyclist Compliance and Safety Impacts of Different Walk Modes at Signalized Intersections for a Livable Community" (2013). Graduate eses and Dissertations. hp://scholarcommons.usf.edu/etd/4829
Transcript of Understanding Pedestrian and Bicyclist Compliance and ...

University of South FloridaScholar Commons
Graduate Theses and Dissertations Graduate School
January 2013
Understanding Pedestrian and BicyclistCompliance and Safety Impacts of Different WalkModes at Signalized Intersections for a LivableCommunityJacob Allen MirabellaUniversity of South Florida, [email protected]
Follow this and additional works at: http://scholarcommons.usf.edu/etd
Part of the Engineering Commons
This Thesis is brought to you for free and open access by the Graduate School at Scholar Commons. It has been accepted for inclusion in GraduateTheses and Dissertations by an authorized administrator of Scholar Commons. For more information, please contact [email protected].
Scholar Commons CitationMirabella, Jacob Allen, "Understanding Pedestrian and Bicyclist Compliance and Safety Impacts of Different Walk Modes at SignalizedIntersections for a Livable Community" (2013). Graduate Theses and Dissertations.http://scholarcommons.usf.edu/etd/4829

Understanding Pedestrian and Bicyclist Compliance and Safety Impacts of Different Walk
Modes at Signalized Intersections for a Livable Community
by
Jacob A. Mirabella
A thesis submitted in partial fulfillment
of the requirements for the degree of
Master of Science in Civil Engineering
Department of Civil and Environmental Engineering
College of Engineering
University of South Florida
Co-Major Professor: Yu Zhang, Ph.D.
Co-Major Professor: Pei-Sung Lin, Ph.D.
Peter Yauch, M.S.C.E
Date of Approval:
October 24, 2013
Keywords: Logit, Signal, Crosswalk, Transportation, Traffic
Copyright © 2013, Jacob A. Mirabella

ACKNOWLEDGMENTS
The author would like to thank Albeck Gerken Inc. for providing equipment used in this
study. I would like to also acknowledge the contribution that Norman Jester, Glenn Weaver, and
Timothy Funderburk provided by supplying timing sheets and valuable technical advice.
Additionally, University of South Florida students Akbar Zanjani and Vasili Kostakis assisted in
analysis and data collection and their help was invaluable. Finally, I would like to thank
committee members Dr. Yu Zhang, Dr. Pei-Sung Lin, and Peter Yauch for guiding this study.

i
TABLE OF CONTENTS LIST OF TABLES ......................................................................................................................... iii
LIST OF FIGURES ....................................................................................................................... iv
ABSTRACT .....................................................................................................................................v
CHAPTER 1: INTRODUCTION ....................................................................................................1 1.1 Background ....................................................................................................................1 1.2 Control ...........................................................................................................................1
1.2.1 Pedestrian Recall .............................................................................................2 1.2.2 Rest in Walk ....................................................................................................3
1.3 Crash Statistics ...............................................................................................................4 1.4 Proposed Research and Approach .................................................................................5
CHAPTER 2: LITERATURE REVIEW .........................................................................................7
CHAPTER 3: METHODOLOGY ...................................................................................................9 3.1 Intersection Characteristics ............................................................................................9
3.1.1 Signal Timing................................................................................................10 3.1.2 Traffic Volumes ............................................................................................10 3.1.3 Intersection Geometry ...................................................................................10 3.1.4 Pushbuttons ...................................................................................................11 3.1.5 Crosswalk Visibility......................................................................................12 3.1.6 Land Use .......................................................................................................13 3.1.7 School Zones .................................................................................................13
3.2 Person Characteristics ..................................................................................................14 3.2.1 Gender ...........................................................................................................14 3.2.2 Age ................................................................................................................14 3.2.3 Race...............................................................................................................15 3.2.4 Travel Modes ................................................................................................15
3.3 Data Collection ............................................................................................................15 3.3.1 Equipment Used ............................................................................................15 3.3.2 Forms Used ...................................................................................................16 3.3.3 Procedure ......................................................................................................16
3.4 Modeling Technique ....................................................................................................17 3.4.1 Multinomial Logit Model .............................................................................17 3.4.2 Test Methods .................................................................................................20
CHAPTER 4: ANALYSIS ............................................................................................................22 4.1 Study Intersections .......................................................................................................22

ii
4.2 Observations ................................................................................................................23 4.3 Compliance ..................................................................................................................25 4.4 Correlation ...................................................................................................................26 4.5 Logit Model Estimation ...............................................................................................26 4.6 Estimation of the Benefit of Rest in Walk and Pedestrian Recall ...............................30
CHAPTER 5: CONCLUSIONS AND FUTURE RESEARCH ....................................................32
REFERENCES ..............................................................................................................................34
APPENDICES ...............................................................................................................................36 Appendix A Variable Correlations ....................................................................................37 Appendix B Field Note Sheets ...........................................................................................40

iii
LIST OF TABLES
Table 1 Person and intersection characteristics ............................................................................ 20
Table 2 Study intersections ........................................................................................................... 22
Table 3 Cycle lengths and splits ................................................................................................... 23
Table 4 Constant Only model estimation results .......................................................................... 26
Table 5 Pedestrian Only model estimation results ........................................................................ 27
Table 6 Bike Only model estimation results ................................................................................. 28
Table 7 All Types model estimation results ................................................................................. 29
Table 8 Average probability of compliance with existing conditions .......................................... 30
Table 9 Average probability of compliance with modified conditions ........................................ 30
Table A.1 Pedestrian Only variables in Final Model .................................................................... 37
Table A.2 Bike Only variables in Final Model ............................................................................. 38
Table A.3 All Types variables in Final Model ............................................................................. 39

iv
LIST OF FIGURES
Figure 1 Rest in Walk description .................................................................................................. 3
Figure 2 Intersection geometry sketches ...................................................................................... 11
Figure 3 High visibility crosswalk ................................................................................................ 12
Figure 4 Brick paver crosswalk with white outline ...................................................................... 13
Figure 5 Observations by intersection .......................................................................................... 24
Figure 6 Age distribution .............................................................................................................. 24
Figure 7 Compliance by intersection for all types ........................................................................ 25
Figure B.1 Field Note: Site A ....................................................................................................... 40
Figure B.2 Field Note: Site B ....................................................................................................... 41
Figure B.3 Field Note: Site C ....................................................................................................... 42
Figure B.4 Field Note: Site D ....................................................................................................... 43

v
ABSTRACT
With increasing energy costs as well as rampant congestion in major U.S. cities, the
popularity of walk and bike mode choices have increased in recent years. Thus, the obtainment
of a comprehensive knowledge of pedestrian and bicyclist behaviors is of great importance.
The National Highway Traffic Safety Administration estimates that 11.1% of pedestrian
fatalities and 18.5% of bicyclist fatalities in the U.S. occurred in Florida in 2011, which accounts
for just 6.1% of the nation’s population. Additionally, intersections are hotspots for vehicle-
pedestrian conflicts, which is confirmed by the Federal Highway Administration’s estimate that
nearly one in five pedestrian fatalities occur at intersections in the U.S. Since both signalized and
non-signalized intersections are conflict points for vehicles, pedestrians, and bicyclists, it is
essential that traffic control methods ensure that safety is not compromised.
To examine the safety effects of different walk modes at signalized intersections, four
locations in the Tampa Bay area were chosen. Two of the locations operate with Rest in Walk
and Pedestrian Recall and the other two operate without Rest in Walk and Pedestrian Recall. A
total of 26 hours of data were collected in early 2013 at the four study sites, which yielded 202
pedestrian and bicyclist observations.
Upon modeling behaviors using a multinomial Logit model, the presence of Rest in Walk
and Pedestrian Recall on minor street pedestrian phases, which operate concurrently with major
street vehicle phases, was found to encourage higher pedestrian and bicyclist compliance rates
than their absence. Additionally, the presence or absence of the combination of both Rest in
Walk and Pedestrian Recall was found to be the most influential variable examined.

1
CHAPTER 1: INTRODUCTION
1.1 Background
The U.S. surface transportation system has focused on increased vehicular capacity for
many years. Measures taken to decrease vehicular delays, congestion, and travel time have
received much attention and funding due to the significant time, fuel, and infrastructure costs
resulting from congestion. However, improvements aimed at reducing congestion are not always
in pedestrians’ best interests and in many instances have been shown to have negative effects on
safety.
To improve the walkability of communities, safety action plans have been and are
continuing to be implemented across the U.S. The National Highway Traffic Safety
Administration defines the “4 E’s” of traffic safety as Education, Enforcement, Engineering, and
Emergency Response (1). Countermeasures aimed at preventing conflicts generally fall under the
educational, enforcement, or engineering categories. While this study focuses on the engineering
aspect of pedestrian crossing control, the importance of public education, enforcement, and
emergency response cannot be overemphasized.
1.2 Control
Vehicle travel is the prevalent travel mode in the U.S. and many other developed
countries, which means that it often receives more attention and funding than the pedestrian
mode of travel. However, changes need to be made to this way of thinking, because regardless of
the primary travel mode, everyone is a pedestrian at one point or another.

2
In its earliest stages, traffic and pedestrian signals were used without significant
standardization or automation. However, as technology has developed through research and
experimentation, traffic and pedestrian signals have become effective, automated, and
standardized tools installed at intersections to regulate vehicle-vehicle and vehicle-pedestrian
right of way.
The design of pedestrian signal control follows the Manual on Uniform Traffic Control
Devices (MUTCD). There are three main segments of pedestrian signal control, which include
walk (a permissive indication), flashing don’t walk (a change interval), and steady don’t walk (a
prohibitive indication). Pedestrians are permitted to begin crossing at any point during the walk
indication and the MUTCD states that a walk indication can be as low as 4 seconds depending on
pedestrian volumes and behaviors, however in normal conditions a length of at least 7 seconds is
recommended. When flashing don’t walk begins, pedestrians that are already within crosswalks
are permitted to finish crossing, however those that haven’t begun crossing must wait until the
next cycle to do so. Flashing don’t walk is calculated based on assumed pedestrian walking
speeds and crosswalk lengths. Assumed walking speeds generally range between 3 feet per
second to 4 feet per second, with the lower half of the range primarily used near schools or in
locations with high elderly populations. The steady don’t walk indication is shown at all times
that walk and flashing don’t walk are not indicated. Steady don’t walk indicates that vehicle
movements conflicting with the pedestrian phase have the right of way and pedestrians must not
attempt to cross.
1.2.1 Pedestrian Recall
Pedestrian Recall is a walk mode that is programmed into signal controllers. The start of
pedestrian green (walk indication) coincides with the start of green for the through movement

3
parallel to the pedestrian movement and is called once per cycle. It is a popular choice because
pedestrians are not required to use pushbuttons when it is present. Without Pedestrian Recall,
pedestrians must push the pushbutton to call the walk phase, which gives them the right of way
to cross at the intersection.
1.2.2 Rest in Walk
The Rest in Walk mode, which is programmed into signal controllers as a Walk Rest
Modifier, displays a walk indication for minor street crossings from the onset of major street
green until the yield point in coordination cycles. At the yield point, a flashing don’t walk signal
begins. The flashing don’t walk is followed by a steady don’t walk, which coincides with the
start of yellow for major street vehicle movements. Additionally, for actuated signal controllers,
once a vehicle arrives at the minor street, the flashing don’t walk begins timing. Otherwise,
major street green and minor street walk remains on indefinitely.
Figure 1 graphically depicts the difference between Rest in Walk operations and non-Rest
in Walk operations for two hypothetical intersections that have all of the same characteristics
except presence of Rest in Walk. The phases depicted on the top of each horizontal line are for
major street motorist signals, and the phases at the bottom of each horizontal line are for minor
street pedestrian signals.
Figure 1 Rest in Walk description

4
When Rest in Walk is not present, don’t walk for minor streets start earlier so that the
right turn vehicles on the major streets receive the right of way for turning without being
required to yield to pedestrians. Increased intersection efficiency, especially for intersections
with a large number of right turn vehicles from major to minor streets, is one reason for the
absence of Rest in Walk.
Nevertheless, in cases where the walk mode Rest in Walk is removed from intersections,
Pinellas County Traffic Management usually receives citizen complaints (2). This is because less
right-of-way (green) time is given to pedestrians. Once accustomed to the presence of Rest in
Walk, it is difficult to adjust to its absence. Although traffic engineers have a good knowledge of
vehicular efficiency of different walk modes, there is a lack of understanding of the safety
impacts of these modes. Hence, it is valuable to quantify the safety impacts of the different
walking modes.
While searching for comparable study sites in the Tampa Bay Area, intersections with
both Rest in walk and Pedestrian Recall and intersections without both Rest in Walk and
Pedestrian Recall were found. Thus, in this study, we compare the combination of Rest in Walk
and Pedestrian Recall. For other regions with different combinations of walk modes, the
methodology proposed in this study can also be applied to analyze the safety impacts.
1.3 Crash Statistics
The World Health Organization (WHO) estimates that the U.S. experiences the fourth
most crash related fatalities, with only China, India, and Nigeria ahead. Globally, over 1.2
million people die and between 20 million and 50 million are injured on roads every year (3).
Traffic related fatality is currently ranked the #10 cause of death in the world (4). Additionally,

5
crashes due to transportation-roadway causes are predicted to be the #4 cause of disability
adjusted life-years (5).
When analyzing vehicle crashes there are three primary reportable types, which includes
property damage only (PDO), injury, and fatal. Vehicle-on-vehicle crashes often result in PDO,
due to the protection and safety features provided by automobiles. However, collisions involving
vehicles and pedestrians frequently result in injury or fatality for pedestrians since they are
unprotected. Risk of injury to pedestrians in the U.S. is 10% for vehicle speeds up to 16 mph,
25% at 23 mph, 50% at 31 mph, 75% at 39 mph, and 90% at 46 mph. Risk of pedestrian fatality
in the U.S. is 10% at vehicle speeds up to 23 mph, 25% at 32 mph, 50% at 42 mph, 75% at 50
mph, and 90% at 58 mph (6).
The National Highway Traffic Safety Administration (NHTSA) estimates that 4432
pedestrian fatalities occurred due to collisions with vehicles in 2011 (7). The top four most
dangerous large metropolitan areas for pedestrians in the U.S. are in Florida and include Orlando
- Kissimmee, Tampa - St. Petersburg - Clearwater, Jacksonville, and Miami - Ft. Lauderdale -
Pompano Beach (8).
Finally, intersections are hotspots for vehicle-pedestrian conflicts, which is confirmed by
the Federal Highway Administration’s estimate that nearly one in five pedestrian fatalities occur
at intersections in the U.S. (9).
1.4 Proposed Research and Approach
Since current knowledge of Rest in Walk and Pedestrian Recall effects on pedestrian
compliance is limited, the purpose of this study is to conduct research on pedestrians at
signalized intersections. Additionally, Florida law states that bicyclists must adhere to pedestrian

6
laws when they use sidewalks and crosswalks. Thus, bicyclists that travel on sidewalks and
crosswalks are included in this study.
This study focuses on signalized intersections operating with two specific control types.
The first type is intersections with Rest in Walk and Pedestrian Recall. The second type is
intersections with neither Rest in Walk nor Pedestrian Recall.
Onsite observational surveys and modeling using a multinomial Logit model were
conducted to allow for a better understanding of pedestrian and bicyclist behaviors.

7
CHAPTER 2: LITERATURE REVIEW
It has long been known that many variables, both behavioral and site specific are
responsible for pedestrians’ actions when crossing at intersections. Gender determined to play a
part when studied by Rosenbloom, with males being more likely to cross without right-of-way
than women, however, age did not play a significant role in the same study. Additionally, the
study concluded that groups of more than two individuals waiting on curbs are more likely to
obey traffic laws and wait for pedestrian green, while people standing alone are more likely to
cross on red (10). Possible reasons for behavioral differences between individuals and groups
have been studied and discussed in detail by Travis Hirschi (11).
A study conducted for the AAA Foundation for Traffic Safety determined that older
pedestrians are generally more compliant than younger pedestrians, where old pedestrians are
defined as 65 years and older and young pedestrians are defined as less than 65 years old (12). It
has been observed that middle-age males are more frequently involved as both drivers and
pedestrians in pedestrian-vehicle collisions (13) and that non-compliance by pedestrians is
frequently a cause of collisions (14). Tom and Granie also observed that males are over
represented in vehicle-pedestrian collisions, which they attributed to males violating traffic rules
more frequently than females (15).
Crosswalk length has been studied as a compliance factor, with mixed results (16).
Additionally, turning vehicles are most dangerous to pedestrians, because the two often share the
same phase and therefore provide significant opportunity for conflict. Research into

8
programming a Leading Pedestrian Interval into traffic controllers has shown positive results as
well as cost effectiveness (17).
Signal timing is an important factor in crossing behavior. Studies have shown that the
longer pedestrians are required to wait for a right-of-way, the more likely they are to cross
illegally (18). Thus, proper signal timing is an important variable to be considered when
encouraging a pedestrian friendly community. Sweden, Germany, and the Netherlands rely on
short cycle lengths to better accommodate pedestrians (19). The Federal Highway
Administration endorses shorter cycle lengths in the U.S., however, this is only recommended
for signalized intersections with significant pedestrian noncompliance (20).

9
CHAPTER 3: METHODOLOGY
3.1 Intersection Characteristics
Since the overall purpose of this study is to compare differences in pedestrian compliance
between different walk modes, it is necessary to either remove or account for as many factors
that could contribute to the likelihood of compliance or noncompliance as possible.
Intersections were chosen based on the following criteria: walk mode, number of lanes
(major and minor), lane types (major and minor), presence of pushbuttons, presence of
countdown timers, clearly marked crosswalks, surrounding land uses, and absence of school
zones. Due to the previously mentioned constraints, traffic volumes, signal timings, and
pedestrian types (walk, bike, wheelchair, and skate) could not be controlled. Signal timing,
vehicle volumes, lane configuration, crosswalk design, pushbutton presence, surrounding land
uses, and school zones are specifically discussed in Sections 3.1.1 through 3.1.7.
Characteristics of intersections included in this study were determined through Google
Earth and field inspections. Intersection field note sheets were filled out for each intersection for
each day of data collection. Characteristics in the field notes include: location, traffic volume,
date, time, presence or absence of Rest in Walk, miscellaneous notes, and an aerial view of each
study intersection. Camera location and direction of view are marked on the aerial view
contained in the field notes. Additionally, timing sheets downloaded from signal controllers were
used to determine basic timings, cycle lengths, recall types, coordination, splits, etc.

10
3.1.1 Signal Timing
Cycle lengths have been shown to influence pedestrian delay at signalized intersections.
The MUTCD defines cycle lengths as the time required for one complete sequence of signal
indications and splits are defined as the sum of Green, Yellow, and All Red time.
Cycle lengths operating at study intersections during dates and times data was collected
ranged from 70 seconds to 200 seconds. The ratios of walk time to cycle length, walk time to
split time, and split time to cycle length were examined and compared to compliance rates,
however, no trends were observed. Splits and cycle lengths at study intersections are discussed
further in Section 4.1.
3.1.2 Traffic Volumes
Traffic volume is an important factor in pedestrian crossing behavior. Directly related to
length and frequency of gaps, pedestrians are more unlikely to cross against signal when heavy
vehicle traffic exists (21), therefore it is important to account for this variable.
Vehicles were only counted and included in the volume variable if they crossed the
crosswalk. The reason for this is because only vehicles that have the potential for conflict with
crossing pedestrians can be expected to influence compliance. Therefore, through, left, and right
turning vehicles on the minor approach street were counted as well as relevant right turning and
left turning vehicles from the main street. Average hourly traffic volumes for each study site are
shown in Table 2.
3.1.3 Intersection Geometry
Pedestrians tend to be more comfortable choosing gaps when oncoming vehicles are
turning (21). Thus, lane configuration must be considered and controlled. Consequently, Sites A
and C were chosen such that their geometries matched with one shared through, left, and right
11
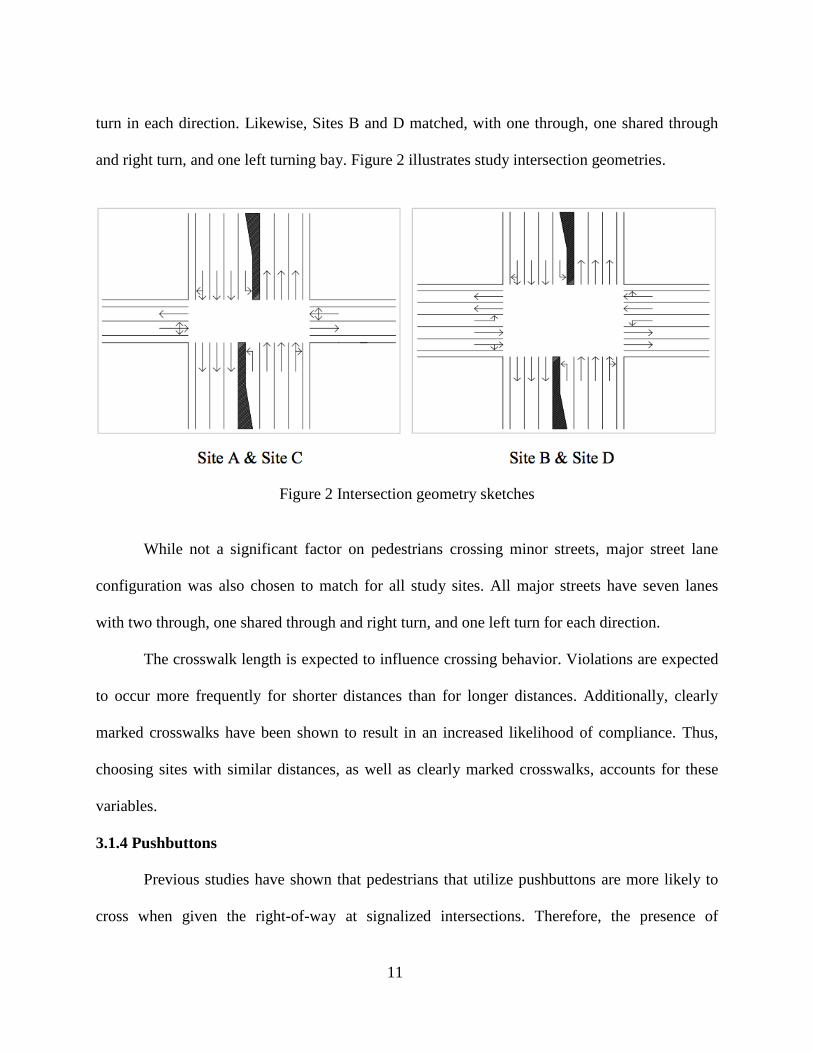
turn in each direction. Likewise, Sites B and D matched, with one through, one shared through
and right turn, and one left turning bay. Figure 2 illustrates study intersection geometries.
Figure 2 Intersection geometry sketches
While not a significant factor on pedestrians crossing minor streets, major street lane
configuration was also chosen to match for all study sites. All major streets have seven lanes
with two through, one shared through and right turn, and one left turn for each direction.
The crosswalk length is expected to influence crossing behavior. Violations are expected
to occur more frequently for shorter distances than for longer distances. Additionally, clearly
marked crosswalks have been shown to result in an increased likelihood of compliance. Thus,
choosing sites with similar distances, as well as clearly marked crosswalks, accounts for these
variables.
3.1.4 Pushbuttons
Previous studies have shown that pedestrians that utilize pushbuttons are more likely to
cross when given the right-of-way at signalized intersections. Therefore, the presence of

12
pushbuttons at all study sites is a requirement, though they do not influence operations at
intersections with Rest in Walk.
Pushbuttons are present at the study intersections that have Rest in Walk and Pedestrian
Recall, though they are unnecessary. One reason for this is because when intersections drop out
of coordination during off-peak hours, pedestrian actuation becomes necessary. The presence of
pushbuttons at each site was verified during the field review as well as the video recording
reviews.
3.1.5 Crosswalk Visibility
Study intersections with visible crosswalks were chosen. The two design types located at
sites included high visibility, which are also known as zebra crossings, and brick pavers outlined
with white striping. Examples of design types at study sites are shown in Figures 3 and 4.
Figure 3 High visibility crosswalk

13
Figure 4 Brick paver crosswalk with white outline
3.1.6 Land Use
Surrounding land use is directly related to the type of pedestrians using the facilities.
Thus, intersections with similar surrounding land uses were chosen for this study. Land use
categories considered in this study include recreational, retail, industrial, and residential. The
selected intersections are located in areas with mixed retail and industrial land use types.
3.1.7 School Zones
School zones offer unique conditions and introduce a number of additional variables that
are beyond the scope of this project. Presence of school beacons, crossing guards, and high
numbers of young children are just a few of the variables present in school zones but absent from
intersections operating under normal conditions. Thus, intersections in school zones were not
considered in this study.

14
3.2 Person Characteristics
The characteristics of each person observed using study intersections were collected for
incorporation in a multinomial Logit model, as well as to examine compliance rate differences
between genders, age groups, and races. A total of 26 hours of video recordings were collected
over 16 days in early 2013. Data was collected during midday and evening peak periods.
Additionally, data was only collected during daylight hours and good weather conditions. The
recorded data was later reviewed to extract items of interest.
While significant efforts to accurately estimate person characteristics were made, some
level of subjectivity is present in the age and race characteristic estimations since they were
obtained from observation.
3.2.1 Gender
As discussed in the introduction, gender has been found in previous studies to influence
compliance. In previous studies, men have been observed participating in more risky behaviors
than women, are more frequently non-compliant when crossing intersections, and are over-
represented in crash data. Therefore, observed pedestrians and bicyclists crossing at study
intersections were classified as either male or female, recorded on site, and verified in video
recordings.
3.2.2 Age
Ages were estimated for each pedestrian and bicyclist observed. As discussed previously,
age has been found to be a factor in compliance in some studies. Previous studies have grouped
ages in a variety of ways. For example, the study funded by AAA Foundation for Traffic Safety
separated pedestrians into two groups, 65 years and older and less than 65 years. However,

15
Rosenbloom separated pedestrians into 20-40 years old, 40-60 years old, and over 60 years old
and did not find significant difference between the behaviors of the various age groups.
3.2.3 Race
Observed pedestrians and bicyclists were classified as Group 1, 2, 3, or 4, which
corresponds to White, Black, Hispanic, or Other, respectively. The predominant race of each
person was estimated onsite and verified in video recordings.
3.2.4 Travel Modes
Individuals walking, skateboarding, or using wheelchairs are required to utilize sidewalks
and crosswalks, and are defined as pedestrians. However, bicyclists may choose to either ride on
roadways with vehicles or sidewalks with pedestrians. When cycling on roadways, bicyclists
must comply with traffic laws. If bicyclists choose to ride on sidewalks and use crosswalks, they
must comply with pedestrian laws.
3.3 Data Collection
Intersection characteristics, person characteristics, and crossing behavior were either
collected onsite and verified offsite or collected offsite and verified onsite, depending on
characteristics of interest.
A total of 26 hours of data was collected over 16 weekdays (Monday through Friday),
which resulted in a total of 202 pedestrian and bicyclist observations.
3.3.1 Equipment Used
Crosswalk photos were taken with a Canon PowerShot SD 750 Digital ELPH (7.1 MP)
and pedestrians and bicyclists were recorded using a Sony Handyman HDR-CX260 video
camera with a 55X Extended Zoom (8.9 Megapixel). Additionally, crosswalk photos and all

16
video recordings were uploaded and reviewed on a MacBook Pro Notebook Computer.
Miscellaneous items used in the field included tripods, safety vests, and stopwatches.
3.3.2 Forms Used
Intersection field notes were created prior to visiting each site. One field note form was
used for each site and day that the site was visited. Field note sheets are shown in Appendix B.
An Excel spreadsheet was designed to allow each observation to be recorded in its own
row and each characteristic of interest to be recorded in cells located in that row. The primary
goal of the spreadsheet design was to simplify the process of modeling data using open source
software, which is discussed in Section 3.4.1.
3.3.3 Procedure
Prior to each field review, the intersection of interest was researched using Google Maps
and location, lane geometry, and surrounding land use characteristics were determined.
Additionally, an aerial snapshot of each intersection was taken and included in the intersection
field note forms. Using the existing intersection field note template, a field note was created and
an aerial snapshot was inserted. Equipment batteries were then charged and loaded into vehicle.
Upon arriving at each intersection of interest, information gathered in Google, as well as
walk mode type was verified. Once all characteristics were verified, a location with a good view
of the study crosswalk was determined. The Sony Handyman camcorder was then attached to a
tripod and positioned such that the crosswalk was within view. The camcorder was then turned
on and recording was started. While recording, the field technician took pictures of crosswalk
using the Canon PowerShot and counted vehicle volumes using the manual counter. After
between one and two hours at each site, equipment was packed up and data collection was
complete (note that all recordings were conducted during daylight and good weather conditions).

17
Each recording was next downloaded to the MacBook Pro Notebook computer from the
Sony Handyman Recorder. Upon completion of the download, characteristics of each pedestrian
and bicyclist as well as crossing behavior was reviewed and entered into the excel spreadsheet
outlined in Section 3.3.2. Once data was extracted and entered into the excel spreadsheet, the
data was ready to be modeled.
3.4 Modeling Technique
Collected field data was modeled using a multinomial Logit model. The model results
were then assessed using a variety of tests. Both the model and the tests are discussed in the
following sections.
3.4.1 Multinomial Logit Model
Logit models are statistical regression models that are used to estimate the probability
that alternatives from a defined set will be chosen by decision makers. A choice set is the set of
alternatives available to decision makers and there are three required characteristics for inclusion
in the model. The first requirement is that the set must be mutually exclusive. In other words, the
decision maker may only choose one alternative. Second, the choice set must include every
possible alternative. The third and final requirement is that the number of choices available to
decision makers must be finite. When all three of these requirements are met, the set of
alternatives may be included in the Logit model discrete choice framework (22).
Logit models are widely used in a variety of fields to analyze and understand behaviors
of individuals. Logit models can be either binary or multinomial. Binary means that only two
alternatives are available and multinomial means that more than two alternatives are available.
Additionally, Logit models are discrete. The Logit model is one of many discrete choice-
modeling methods used in practice, however it is one of the most popular due to its simplicity.

18
The reason for this is that Logit models have simple, closed forms, which greatly simplifies
calculations required to estimate probabilities of choosing alternatives.
Another aspect of Logit models, which is similar to other models, is that it uses the
“Utility Maximization” decision rule. According to the Utility Maximization rule, the decision
maker selects the alternative offering the highest utility, which is a scalar value that captures the
overall attractiveness of each alternative and is therefore a function of the alternative’s attributes
as well as the decision maker’s characteristics. Total utility for a decision maker’s choice
includes a deterministic (observed) component, which is a function of the individual’s and
alternative’s characteristics.
A second part of the utility function is the random (unobserved) component. The
probability distribution function of this component determines the type of method that can be
used in the model estimation. The assumption of normal distributions for this component results
in a “Probit” model, which does not have a simple, closed form for probability calculations.
Assuming a “Type I extreme value (Gumbel)” distribution for this random error term results in a
Logit model. The deterministic term in this model includes variables corresponding to the
alternative attributes, variables related to the decision makers’ characteristics, and a constant.
Since it is impossible to quantify every attribute for the alternatives, the constant term, which
captures the average impact of unobserved characteristics, must also be included in the model.
The deterministic component can also include interactions between alternative attributes
and individual characteristics. Therefore the total utility function is
Uin = Vin + εin (1)
19
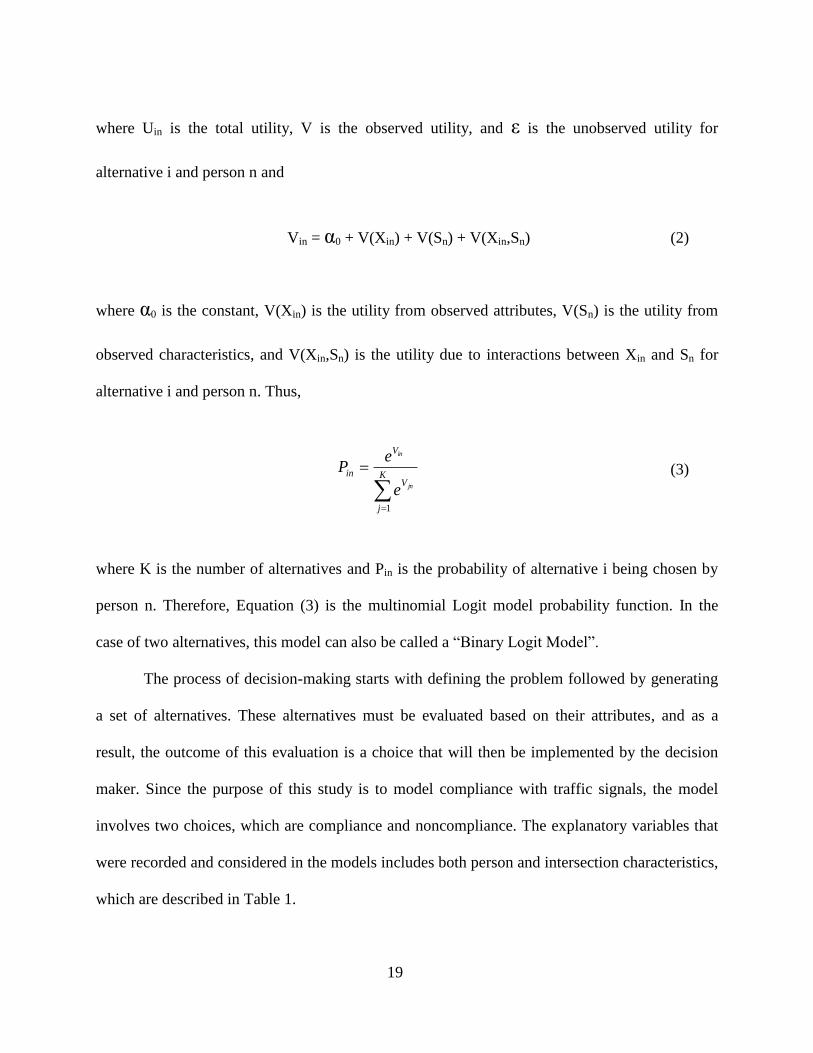
where Uin is the total utility, V is the observed utility, and ε is the unobserved utility for
alternative i and person n and
Vin = α0 + V(Xin) + V(Sn) + V(Xin,Sn) (2)
where α0 is the constant, V(Xin) is the utility from observed attributes, V(Sn) is the utility from
observed characteristics, and V(Xin,Sn) is the utility due to interactions between Xin and Sn for
alternative i and person n. Thus,
K
j
V
V
in
jn
in
e
eP
1
(3)
where K is the number of alternatives and Pin is the probability of alternative i being chosen by
person n. Therefore, Equation (3) is the multinomial Logit model probability function. In the
case of two alternatives, this model can also be called a “Binary Logit Model”.
The process of decision-making starts with defining the problem followed by generating
a set of alternatives. These alternatives must be evaluated based on their attributes, and as a
result, the outcome of this evaluation is a choice that will then be implemented by the decision
maker. Since the purpose of this study is to model compliance with traffic signals, the model
involves two choices, which are compliance and noncompliance. The explanatory variables that
were recorded and considered in the models includes both person and intersection characteristics,
which are described in Table 1.

20
Table 1 Person and intersection characteristics
Parameters Description
OBSERVATION Each person is assigned a unique number (1, 2, 3, etc.)
COMPLIANCE Person complies if he/she crosses when given lawful right-of-way
AGE Person’s age
GENDER Person’s gender
RACE Person’s race (Group 1, 2, 3, or 4)
WAIT Person’s total wait time (rounded to nearest second)
GPA Group arrival size
GPD Group departure size
PUSHBUTTON Pushbutton usage
REST&PED Rest in Walk and Pedestrian Recall presence or absence
VOLUME Traffic volume (vehicles per hour)
LANES Number of lanes person must traverse to completely cross street
CYCLE LENGTH Time required for signal to complete cycle (seconds)
For each observation, the attributes mentioned in Table 1 were recorded. Once the data
was acquired and recorded, the model estimation process was performed. BIOGEME, which is
an open source software package, was used to estimate the model.
During the estimation process it was necessary to consider some variables in categorized
patterns since the exact values for those attributes showed considerable discreteness. While
estimating the model, it appeared that the number of observations, as well as variations in some
observations, were not adequate. Therefore, once the model was estimated, some of the
explanatory variables that were initially expected to impact compliance were found to be
insignificant.
3.4.2 Test Methods
The correlation of data was tested using Cramer’s V and Pearson’s Product-Moment
methods in SPSS. These methods observe similarities between datasets to determine which sets

21
depict collinearity. The datasets that were significantly correlated were removed from the Logit
model.
The confidence interval for each parameter estimate was determined in BIOGEME using
a t-statistic. The t-statistic is the ratio of the departure of an estimated parameter from its notional
value and its standard error. The goodness of fit of the logit model was also determined by
BIOGEME using rho-square and adjusted rho-square values.
The rho-square value is the ratio of variance explained by the model to total variance.
While rho-square depicts the model’s overall goodness of fit, it does not account for the number
of parameters utilized. Thus, to compare the goodness of fit between models, the adjusted rho-
square value, which accounts for the number of estimated parameters, was used.

22
CHAPTER 4: ANALYSIS
4.1 Study Intersections
Intersections were chosen based on the criteria discussed in Section 3.1. Table 2 depicts
the intersections chosen for this study, as well as their characteristics. Sites A and B are
maintained by the City of St. Petersburg and Sites C and D are maintained by Pinellas County.
Table 2 Study intersections
Designation Site A Site B Site C Site D
Intersection 66
th St &
26th
Ave
34th
St &
Central Ave
34th
St &
58th
Ave
66th
St &
54th
Ave
Rest in Walk Present Present Not Present Not Present
Pedestrian Recall Present Present Not Present Not Present
Pushbutton Present Present Present Present
Countdown
Timer Present Present Present Present
Lanes (Minor) 2 5 2 5
Average Volume
(veh/hr) 120 932 252 1219
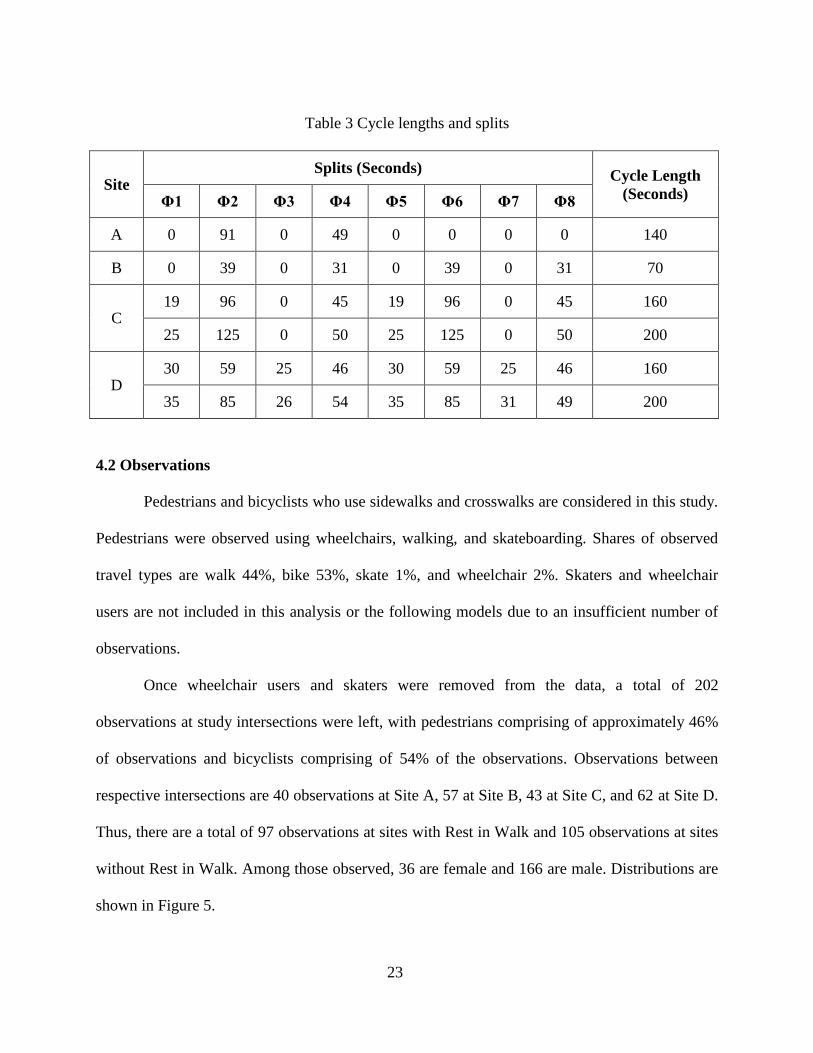
Pinellas County and the City of St. Petersburg provided timing sheets for all study
intersections. Patterns for Sites A and B are constant. However, Sites C and D run different
patterns that are dependent on the time of day. Data was only collected during the patterns shown
in Table 3, however, timing was determined to not significantly influence the models estimated
in Section 4.5.
23
Table 3 Cycle lengths and splits
Site Splits (Seconds)
Cycle Length
(Seconds) Φ1 Φ2 Φ3 Φ4 Φ5 Φ6 Φ7 Φ8
A 0 91 0 49 0 0 0 0 140
B 0 39 0 31 0 39 0 31 70
C 19 96 0 45 19 96 0 45 160
25 125 0 50 25 125 0 50 200
D 30 59 25 46 30 59 25 46 160
35 85 26 54 35 85 31 49 200
4.2 Observations
Pedestrians and bicyclists who use sidewalks and crosswalks are considered in this study.
Pedestrians were observed using wheelchairs, walking, and skateboarding. Shares of observed
travel types are walk 44%, bike 53%, skate 1%, and wheelchair 2%. Skaters and wheelchair
users are not included in this analysis or the following models due to an insufficient number of
observations.
Once wheelchair users and skaters were removed from the data, a total of 202
observations at study intersections were left, with pedestrians comprising of approximately 46%
of observations and bicyclists comprising of 54% of the observations. Observations between
respective intersections are 40 observations at Site A, 57 at Site B, 43 at Site C, and 62 at Site D.
Thus, there are a total of 97 observations at sites with Rest in Walk and 105 observations at sites
without Rest in Walk. Among those observed, 36 are female and 166 are male. Distributions are
shown in Figure 5.

24
Figure 5 Observations by intersection
Estimated ages of observed people ranged from 5 to 65 years old with the majority of
estimated ages within the range of 21 and 40 years old. Distribution of estimated ages is shown
in Figure 6.
Figure 6 Age distribution

25
4.3 Compliance
Figure 7 shows the observed compliance rates at each intersection. The compliance rates
are considerably different between intersections.
Figure 7 Compliance by intersection for all types
As previously discussed, the presence of Rest in Walk and Pedestrian Recall at Sites A
and B result in longer walk time and requires no pushbutton use. As expected, Sites A and B
were observed to have higher percentages of compliance than Sites C and D.
A comparison of Sites A and C, which have the same geometry (2 lanes in minor
approach), but different walk modes, shows that pedestrians are also more compliant at Site A
than Site C. Sites B and D, which have the same geometry (5 lanes in minor approach) show that
people are more compliant at Site B than Site D.

26
Figure 7 also shows that number of lanes contributes to the compliance. Site B is
observed to have a higher compliance rate than Site A, which is not surprising considering more
lanes must be crossed at Site B than at Site A. Additionally, Site B has heavier vehicle traffic
than Site A. The same is true between Sites C and D.
4.4 Correlation
Cramer’s V and Pearson’s Product-Moment correlation tests were performed on the
dataset using SPSS. The tests determined that there is a strong correlation between cycle length
and control type, number of lanes and traffic volume, and group arrival and departure sizes.
Thus, variables that strongly correlated are not included in the model estimation and do not
influence compliance or noncompliance predictions. Correlation values for variables included in
each respective model are shown in Appendix A.
4.5 Logit Model Estimation
The constant only model is the starting point for Logit model estimations. The constant
only model does not include any explanatory variables, thus, it is rarely a good fit for the data.
Table 4 depicts the initial model estimates.
Table 4 Constant Only model estimation results
Variables
Parameter
Estimates
PED. ONLY
Parameter
Estimates
BIKE ONLY
Parameter
Estimates
ALL TYPES
Non-Compliance Constant 0.000 0.000 0.000
Compliance Constant 0.351 -0.482 -0.099
Likelihood Ratio Test 2.797 6.204 0.495
Rho-Square 0.022 0.041 0.002
Adjusted Rho-Square 0.006 0.028 -0.005

27
As indicated by rho-square values and the likelihood ratio test results shown in Table 4,
the constant only models do not adequately explain the data. At this stage it is common practice
to verify that the modeling software is performing estimations properly. This can be easily
verified using Equation (3). Based on calculations using estimated constants, walk, bike, and all
types compliance rates are 58.7%, 38.2%, and 47.5%, respectively. These findings are consistent
with the data. The model is therefore estimating parameters correctly and more variables can be
added.
The results shown in Tables 5, 6, and 7 were obtained after estimating several models for
different combinations and variable categories. Only variables estimated within a minimum
confidence interval of 85% (using t-statistics) are included as significant variables.
As can be seen in the Pedestrian Only model depicted in Table 5, compliance is
positively influenced when Rest in Walk and Pedestrian Recall are present, pedestrians are less
than 30 years old, vehicular volumes are greater than 1000 vehicles/hour, and pushbuttons are
utilized.
Table 5 Pedestrian Only model estimation results
PEDESTRIAN ONLY Parameter
Estimates Standard Deviation
Confidence
Interval
Non-Compliance Constant 0.00 - -
Compliance Constant -3.46 0.976 0.99
REST&PED 3.55 0.916 0.99
AGEUNDER30 1.22 0.602 0.95
VOLUME1001 1.91 0.800 0.98
PUSHBUTTON 1.59 0.744 0.96
Likelihood Ratio Test 37.048
Rho-Square 0.290
Adjusted Rho-Square 0.212

28
It is surprising to see that people less than 30 years old are more compliant than people
greater than 30 years old. As discussed in the literature review, some previous research has
concluded that younger pedestrians are consistently less compliant than older pedestrians.
However, the opposite was observed in the data and consequently estimated by the proposed
model. This could be due to the subjectivity of estimating pedestrians’ ages by observation.
As previously discussed, groupings of pedestrians younger than 65 years old and older
than 65 years old showed that the older group was more compliant than the younger group in one
past study. However, another study that separated pedestrians into 20-40 years old, 40-60 years
old, and greater than 60 years old did not yield significant results. A variety of groupings were
examined in this study, however, the only groupings that showed significance in the model were
0-29 years old and 30-65 years old.
Only two data parameters are shown to be influential in the Bike Only model described in
Table 6. However, rho-square and adjusted rho-square values are appropriate and indicate a
slightly better fit to this specific dataset than the Pedestrian Only model does to its dataset.
Table 6 Bike Only model estimation results
BIKE ONLY Parameter
Estimates Standard Deviation
Confidence
Interval
Non-Compliance Constant 0.00 - -
Compliance Constant -3.33 0.720 0.99
REST&PED 4.72 0.821 0.99
PUSHBUTTON 4.03 0.945 0.99
Likelihood Ratio Test 79.784
Rho-Square 0.523
Adjusted Rho-Square 0.484

29
Rest in Walk and Pedestrian Recall as well as pushbutton usage are strong positive
indicators of compliance in the Bike Only model, with Rest in Walk and Pedestrian Recall being
more influential to compliance than pushbutton usage, as evidenced parameter estimate
magnitudes.
Finally, all pedestrians and bicyclists observed at study intersections are included in one
model and shown in Table 7.
Table 7 All Types model estimation results
ALL TYPES Parameter
Estimates Standard Deviation
Confidence
Interval
Non-Compliance Constant 0.00 - -
Compliance Constant -3.62 0.625 0.99
RESTWALK 4.34 0.630 0.99
AGEUNDER30 0.840 0.420 0.96
RACE2 -0.708 0.500 0.85
VOLUME1001 1.17 0.504 0.98
PUSHBUTTON 2.69 0.604 0.99
Likelihood Ratio Test 112.526
Rho-Square 0.402
Adjusted Rho-Square 0.359
The presence of Rest in Walk and Pedestrian Recall, people less than 30 years old, traffic
volumes greater than 1000 vehicles/hour, and pushbutton usage positively influenced compliance
for the all types model. Additionally, Race is a variable that is significant in the All Types model,
however isn’t significant in the Pedestrian Only and Bike Only models. Individuals that fall
under the criteria of being in Race Group 2 exhibited lower compliance rates than individuals
falling under the other 3 groups.

30
Only Rest in Walk and Pedestrian Recall, as well as pushbutton usage were found to
significantly influence all three models. Additionally, as is evident by the magnitude of the
estimated parameters, REST&PED is the most influential parameter modeled.
4.6 Estimation of the Benefit of Rest in Walk and Pedestrian Recall
To compare the benefit of Rest in Walk and Pedestrian Recall at study sites, the All
Types model can be used to calculate the average probability of compliance for all pedestrian
and bicyclist observations. The average probabilities of compliance for Sites A and B with
existing conditions (with Rest in Walk and Pedestrian Recall) and Sites C and D (without Rest in
Walk and Pedestrian Recall) are shown in Table 8.
Table 8 Average probability of compliance with existing conditions
Average Probability of Compliance Existing Conditions
Site A 70.8%
Site B 77.9%
Site C 5.8%
Site D 33.0%
Removing Rest in Walk and Pedestrian Recall from Sites A and B and adding Rest in
Walk and Pedestrian Recall to Sites C and D significantly changes the average probability of
compliance, as is shown in Table 9.
Table 9 Average probability of compliance with modified conditions
Average Probability of Compliance Modified Conditions
Site A 3.6%
Site B 10.8%
Site C 70.6%
Site D 92.2%

31
Thus, the removal of Rest in Walk and Pedestrian Recall from Sites A and B would result
in significantly lower probabilities of compliance. However, the addition of Rest in Walk and
Pedestrian Recall to Sites C and D would drastically increase the probabilities of compliance.

32
CHAPTER 5: CONCLUSIONS AND FUTURE RESEARCH
Four signalized intersections in the Tampa Bay area were chosen for this study, a
procedure was established to observe and collect data concerning pedestrians and bicyclists at
study intersections, and a Logit model was developed to study pedestrian and bicyclist behavior
while crossing at signalized intersections.
Though intersections without Rest in Walk and Pedestrian Recall allow for more
responsive control and higher vehicular efficiency, intersections with Rest in Walk and
Pedestrian Recall have higher compliance rates for both pedestrians and bicyclists. For
pedestrians, significant variables include Rest in Walk and Pedestrian Recall, age, traffic volume,
and pushbutton usage. For bicyclists, Rest in Walk and Pedestrian Recall, as well as pushbutton
usage are the only significant variables. Finally, for the overall model, which includes
pedestrians and bicyclists, Rest in Walk and Pedestrian Recall, age, race, traffic volume, and
pushbutton usage were determined to be significant parameters that affect compliance. For all
models estimated, Rest in Walk and Pedestrian Recall were found to be the most influential
variable examined, as evidenced by parameter magnitudes.
Pushbutton usage is positively related to higher compliance. Nevertheless, non-
compliance after pressing pushbuttons was observed. Installation of working indicators for
pushbuttons could help to alleviate this problem. Confirmation that the pushbuttons are working
would increase pedestrian confidence in the control devices and cause pedestrians to endure
longer wait times before violating the rules.

33
While this study accomplished the goals set out in the scope, there are areas that can be
improved in future research. Sample size is the most significant limitation of this study. Only
four sites in the Tampa Bay area were examined and only 202 pedestrian and bicyclist
observations were collected. Thus, expanding the number of study sites to include sites with a
variety of surrounding land uses and geometries would greatly improve this study.
In conjunction with increasing the number of study sites, additional observations would
improve the significance of the estimated models. Additionally, wheelchair users were not
included in the model. However, examining the effects that Rest in Walk and Pedestrian Recall
has on handicapped users could be a worthwhile topic for future research. Furthermore, an
assessment of the effects that Rest in Walk and Pedestrian Recall have on vehicle delays, stops,
and emissions and comparing them with safety impacts would be a good topic for future research.

34
REFERENCES
(1) National Highway Traffic Safety Administration. "Evaluation of the Miami-Dade Pedestrian
Safety Demonstration Project." Washington DC, 2008.
(2) Jester, Norman, interview by Jacob Mirabella. Rest in Walk Information (September 25,
2013).
(3) World Health Organization. Global Health Observatory (GHO). 2013.
http://www.who.int/gho/road_safety/mortality/en/index.html (accessed February 1, 2013).
(4) World Health Organization. The 10 leading causes of death by broad income group (2008).
2013. http://www.who.int/mediacentre/factsheets/fs310/en/index.html (accessed February 1,
2013).
(5) Mathers, Colin D, and Dejan Loncar. Projections of Global Mortality and Burden of
Disease from 2002 to 2030. PLos Med 3: e442, 2006.
(6) AAA Foundation for Traffic Safety. "Impact Speed and a Pedestrian’s Risk of Severe Injury
or Death." Washington DC, 2011.
(7) National Highway Traffic Safety Administration. FATALITY ANALYSIS REPORTING
SYSTEM (FARS) ENCYCLOPEDIA. 2013. http://www-
fars.nhtsa.dot.gov/Trends/TrendsGeneral.aspx (accessed February 1, 2013).
(8) Transportation for America. "Dangerous by Design: Solving the Epidemic of Preventable
Pedestrian Deaths." Washington DC, 2011.
(9) Federal Highway Administration. "Intersection Safety Issue Briefs." 2009.
http://safety.fhwa.dot.gov/intersection/resources/fhwasa10005/brief_9.cfm (accessed
October 27, 2013).
(10) Rosenbloom, Tova. "Crossing at a red light: Behaviour of individuals and groups."
Transportation Research Part F 12 (2009): 389-394.
(11) Hirschi, Travis. Causes of Delinquency. New Jersey: University of California Press, 1969.
(12) Stollof, Edward, Hugh McGee, and Kimberly Eccles. Pedestrian Signal Safety for Older
Persons. AAA Foundation for Traffic Safety, Washington DC: AAA Foundation for Traffic
Safety, 2007.

35
(13) Lee, Chris, and Mohamed Abdel-Aty. "Comprehensive analysis of vehicle–pedestrian
crashes at intersections in Florida." Accident Analysis and Prevention 37 (2005): 775-786.
(14) Stutts, Jane C., William W. Hunter, and Wayne E. Pein. "Pedestrian Crash Types: 1990s
Update." TRANSPORTATION RESEARCH RECORD 1538 (1996): 68–74.
(15) Tom, Ariane, and Marie-Axelle Granié. "Gender differences in pedestrian rule compliance
and visual search at signalized and unsignalized crossroads." Accident Analysis and
Prevention 43 (2011): 1794–1801.
(16) Ren, Gang, Zhuping Zhou, Wei Wang, Yong Zhang, and Weijie Wang. "Crossing Behaviors
of Pedestrians at Signalized Intersections: Observational Study and Survey in China."
Transportation Research Record: Journal of the Transportation Research Board 2264
(2011): 65-73.
(17) Van Houten, Ron, Richard A. Retting, Charles M. Farmer, and Joy Van Houten. "Field
Evaluation of a Leading Pedestrian Interval Signal Phase at Three Urban Intersections."
Transportation Research Board 1734 (2000): 86-92.
(18) Kothuri, Sirisha M, Peter Koonce, Christopher M Monsere, and Titus Reynolds.
"Innovations for Pedestrians at Traffic Signals - Portland, OR Case Study." Portland.
(19) Federal Highway Administration. Signalized Intersection Safety in Europe. Washington DC:
U.S. Department of Transportation, 2003.
(20) Federal Highway Administration. PEDSAFE: Pedestrian Safety Guide and Countermeasure
Selection System. Washington DC: U.S. Department of Transportation, 2004.
(21) Palamarthy, Srinivas, Hani S. Mahmassani, and Randy B. Machemehl. Models of Pedestrian
Crossing Behavior at Signalized Intersections. Austin: The University of Texas Austin,
1994.
(22) Train, Kenneth. Discrete Choice Methods with Simulation . Cambridge University Press,
2009.

36
APPENDICES

37
Appendix A Variable Correlations
Table A.1 Pedestrian Only variables in Final Model
RESTWALK AGEUNDER30 VOLUME1001 PUSHBUTTON
RESTWALK 1
AGEUNDER30 0.055 1
VOLUME1001 0.442 0.015 1
PUSHBUTTON 0.358 0.214 0.325 1

38
Appendix A (Continued)
Table A.2 Bike Only variables in Final Model
RESTWALK PUSHBUTTON
RESTWALK 1
PUSHBUTTON 0.265 1

39
Appendix A (Continued)
Table A.3 All Types variables in Final Model
RESTWALK AGEUNDER30 RACE2 VOLUME1001 PUSHBUTTON
RESTWALK 1
AGEUNDER30 0.016 1
RACE2 0.229 0.006 1
VOLUME1001 0.325 0.120 0.021 1
PUSHBUTTON 0.229 0.148 0.220 0.265 1

40
Appendix B Field Note Sheets
Figure B.1 Field Note: Site A

41
Appendix B (Continued)
Figure B.2 Field Note: Site B

42
Appendix B (Continued)
Figure B.3 Field Note: Site C

43
Appendix B (Continued)
Figure B.4 Field Note: Site D