Effect of Parental Influence on the Choice of Career Among Secondary School Students

Department of Economics University of Bristol Priory Road Complex
Bristol BS8 1TU United Kingdom
Understanding parental choices of
secondary school in England using
national administrative data
Simon Burgess
Ellen Greaves Anna Vignoles
Discussion Paper 17 / 689
25 October 2017

1
Understanding parental choices of secondary school in England using national administrative data
Simon Burgess University of Bristol Ellen Greaves University of Bristol Anna Vignoles University of Cambridge
October 2017
Abstract
We study the process of school choice in England, using a new dataset giving all the preferences of
all parents seeking a school place in state secondary schools. We set out new facts on the number of
choices made, the chance of getting an offer from the first choice, and whether the nearest school is
first choice. We use the rich data available to describe these choices by pupil characteristics, school
characteristics and neighbourhood characteristics. We show that parents do pro-actively use the
choice system, but that the admissions criteria do not work well for poorer families.
Keywords: school admissions; school choice; inequality.
JEL Code: I24, I28
We are extremely grateful to Tim Leunig and Helen Bray of the Department for Education in
facilitating our access to this data. All analysis and interpretation of this dataset is our own, as are
any errors and omissions. We thank the Department for Education for providing access to the
National Pupil Database. The Department for Education do not accept responsibility for any
inferences or conclusions derived from the National Pupil Database.

2
1. Introduction
Schools matter and schools differ: educational attainment is key to a child’s life chances, and schools
vary in their ability to raise attainment. For this reason, the process that a country uses to assign its
children to schools is important for their subsequent academic achievement and their life chances.
Since 1988, England has used a system of school choice to do this.1 Parents nominate their preferred
schools and, given school capacities, a set of codified criteria are fed into an algorithm to determine
the allocation of pupils to schools. Given the centrality of the school assignment process for
inequality and social mobility, surprisingly little is known about the operation of the school choice
process, and in particular the role of parental preferences and constraints.
In this paper, for the first time, we use a national census dataset at pupil-level, which includes all the
choices made by all parents seeking a place for their child in a state secondary school in England.2
These data are further matched to characteristics of the pupils and to characteristics of the schools.
Using these data, we set out a number of new facts about families’ choices of school. These include
the number of choices parents make – for example, whether they make just once choice or the
maximum number allowed; the chance of getting that first choice – a balance of ambition and
opportunity; and the propensity to choose the nearest school. We use the pupil-level data to
characterise how these facts vary according to pupil characteristics, school characteristics and
neighbourhood characteristics.
One focus for the paper is understanding the substantial socio-economic gap in the academic quality
of the schools attended by pupils, although we show equally important differences between other
groups. In our data, children eligible for Free School Meals (FSM) are enrolled in schools that have,
on average, 12% lower academic attainment than the schools of more affluent children.3 This could
be due to geography (where people live and so which schools are commutable), different
opportunities (for example mode of travel) or it could be due to the operation of the school choice
system (for example decreasing probability of admission further from a good school). We show it is
not simply geography. In fact, the academic quality of school that a child can reach within a
reasonable school commute varies very little across the country.4 For example, 37% of FSM-eligible
pupils can reach a high-performing school5, compared to 43% of non-FSM pupils. However, the
chances of actually attending such a school vary dramatically: 4% of FSM-eligible pupils, compared to
17% non-FSM pupils. The new data described here allow us to explore FSM differences across a
number of dimensions of school choice.6 Our results therefore inform the debate about the role of
education in inequality and social mobility, and is relevant to the growing concern in the UK about
the consequences of gross inequalities in the social and economic circumstances of children and
their families (“Britain, the great meritocracy” Prime Minister's speech, 9th September 20167).
1 The Education Reform Act of 1988. 2 We will consider differences between primary and secondary schools in a later paper. 3 We use the percentage of pupils achieving at least 5 good passes including English and Maths (%5A*C(EM)). 4 We base this on our data, taking the 80th percentile of first choice school-home distance as a measure of how far people are prepared to travel. 5 A school where at least 80% of pupils achieve 5A*-C grades. 6 We will take this analysis further in subsequent papers when we estimate causal models with this data. 7 https://www.gov.uk/government/speeches/britain-the-great-meritocracy-prime-ministers-speech accessed 24/10/2017

3
Our results also inform the debate about the effectiveness of the school choice system itself. There
are several requirements for a school choice system to operate effectively, in that school choice
improves education outcomes and that choice is meaningful for parents. The first is that parents must
make a choice. If parents make no choice at all or only one choice, this might imply that the school
choice system is either not properly understood or that parents do not have strong preferences. It
may also mean in some areas that there is only one choice that appears feasible to parents. Hence
another condition for a functioning school choice system is that parents need to have a reasonably
high probability of being admitted to a chosen school.8 If parents have little chance of securing a school
of their choice they are less likely to engage with the process. Lastly, for a school choice system to
operate effectively to raise education outcomes it is not enough for parents to make choices. Parents
must also value academic performance so that schools have an incentive to improve. If parents simply
choose their nearest school this will not provide a strong incentive for schools to try to improve pupil
attainment. In this paper, we provide empirical evidence on the extent to which these conditions hold.
The paper is structured as follows. Section 2 offers a brief summary of the school choice system in
England. Section 3 describes our framework for analysis, and provides some intuition for interpreting
the results. Section 4 describes the new dataset. Section 5 details the results and we offer an overview
of the findings and broader discussion in section 6.
2. The school choice process in England
Parents in the English education system have the right to choose their child’s school. More precisely,
they have the right to express a preference for the school that they would like their child to go to.
Parents provide a ranking of their preferred choices of school on a form that is submitted as part of a
centralised system to their Local Authority (LA). Although there are different types of state schools in
England (discussed further below), all government funded schools use this common application
system. Private schools are outside this system, although parents can apply to both private and state
schools simultaneously. On the LA form parents can provide up to 3-6 choices of school in rank
order, depending on the area they live in, and they are instructed by most Local Authorities to list up
to 3 schools. Children are then allocated to schools on the basis of parental choice and the
availability of places at the schools selected. A set of published school prioritisation criteria are used
where a school is over-subscribed. Typically these include: whether the child has a statement of
special educational need; whether the child is looked-after by the local authority; whether the child
has a sibling at the school already; the distance of the family home from a school; and less
commonly, the faith or aptitude of a child.9 Each child is allocated to their highest ranked school
where they are admitted according to the criteria of each school. If a pupil is not allocated to any
preferred school they are assigned to a school with spare capacity (which are typically lower quality).
The school choice system in England was amended in 2007 to encourage parents to choose their
truly most preferred schools rather than to make safety-first or strategic choices.10 The algorithm
8 It does not follow, however, that parents having very high chances of securing their top choice is the best outcome, as we discuss below. 9 This is explicitly intended not as a measure of general ability, but a specific aptitude such as music, sport or maths for example. 10 Prior to 2007, different Local Authorities in England used either a first preference first or an equal preference allocation mechanism. The first preference first system was outlawed in the 2007 admissions code

4
used (student optimal stable allocation, see Pathak and Sonmez, 2013) is weakly truth revealing,
meaning that parents can do no better than by reporting their true preferred schools. This may not
be fully understood by parents however, who may believe that they are more likely to be allocated
their most preferred school by only making one choice, or that they will be penalised for entry to
their second-choice school by making an “ambitious” first choice.
High-performing schools are more popular and are more likely to be over-subscribed.11 Hence the
over subscription criteria and their enforcement are an important part of the system. As well as
requiring each school to publish these criteria, there is an admissions code of practice which
determines what criteria are acceptable for schools to use.12 An interview with a parent for example,
is not an acceptable criterion. In the event that a child is refused a place at a school, there is the right
of appeal to an independent appeal panel. In 2015/16 the percentage of admissions resulting in an
appeal was 3.7%, of which around one fifth found in favour of the parent(s).13
More autonomous types of schools, which now constitute around 62% of all secondary schools,
determine their own admissions criteria, though they must still adhere to the admissions code and
parents use the same form to apply to these schools as to other school types.
3. Incentives for parents in the school choice process
The school admissions system gives some agency to parents – they make choices and those choices
matter. This section considers the incentives that parents face when making these school choices,
and how these incentives may affect the outcomes observed in the data we explore.
It is reasonable to assume that parents vary in their preferences for different school characteristics.
The most commonly cited preferred school characteristics that parents value include academic
quality (performance), distance between home and school and the social and ethnic composition of
the school, although there are myriad other factors (Burgess et al. 2015; Gibbons and Silva, 2011;
Raveaud and Van Zanten, 2007; West and Hind, 2007). Parents will therefore make different school
choices given their preferences and location (which influences the set of schools in their local area).
Perhaps the key trade-off is between quality and distance – how much further is it worth it to go to
attend a better school?
Despite the truth revealing school assignment mechanism described in the previous section, parents
may face incentives to list school choices that are not truly their most preferred. For example, listing
one “safe” school may be advantageous to avoid allocation to a school with spare capacity. The
since it prioritises students on the basis of the rank order of parents’ choices. Hence a parent making an ambitious first choice school might lose out on a place at their second-choice school simply because they did not put the latter first on their list of choices. 11 In our data, top performance quartile schools are on average over-subscribed by 60% (according to a measure of total choices where the household hasn’t already been allocated to a more preferred school, relative to offers made), while bottom quartile schools are not at all. 12 The latest admissions code (2014) is published here: https://www.gov.uk/government/uploads/system/uploads/attachment_data/file/389388/School_Admissions_Code_2014_-_19_Dec.pdf 13 Department for Education (2017) https://www.gov.uk/government/uploads/system/uploads/attachment_data/file/640212/SFR44_2017_Appeals_Text.pdf

5
possibility to list more school choices may mitigate this to some extent, and allow more “ambitious”
choices in terms of school academic quality, which we explore in our data.
Parents can also devise strategies to maximise their chances of getting into their preferred school,
for example by choosing a nearby home. Parents may therefore appear to value school proximity
highly, but in fact the distance between home and school is driven by the admissions criteria and
earlier house moves. The higher demand for homes close to popular schools has been studied
empirically and is acknowledged to increase house prices around “good” schools (Gibbons et al.
2013; Kane et al. 2006).
In this paper, we explore parents’ school choices nationally in England we focus on how many
choices parents make, what their success rate is, whether the first-choice school is the nearest, and
what happens after the offers are made.
a) Number of school choices
The number of school choices that parents can make varies across Local Authorities in England. In
most places parents are limited to nominating 3 schools, though in some (including most
prominently London) 6 schools can be nominated.
Making more choices delivers a higher chance of achieving a more preferred school. Furthermore,
not making any choices on the form is potentially damaging. It is taken by the algorithm to imply
indifference between all schools, and this will generally not be so. Parents may not all fully
understand the admissions process. One common misconception is that only naming one school
increases the chance of admission at that school. This is not the case and making only one choice
harms the chance of obtaining a place at a school that is preferred.
Making choices requires parental investment of time in understanding the rules and finding out
about schools. While the former is a fixed cost, making more choices obviously requires
discriminating between more schools and hence requires more time. There is therefore a trade-off
between the value a household attaches to making the best choice, and the value of the time spent
making that choice. The other factor entering the trade-off is whether the household has made
other decisions that make the chance of getting into the most desired school very high (for example,
through choosing a house location, or through already having an older child in the school). In this
case, the trade-off might be decisively tipped towards just making one choice. We consider this in
the results section where we look at the chances of those making just one choice of getting their
choice.
This implies that the group of people making the maximum number of choices available value the
choice outcome very highly relative to the effort of making the choice. It might suggest that the
household has made an “ambitious” first and second choice and understands the allocation
mechanism, or that the cost of making an additional choice is low. At the other end of the scale,
those making just one choice either do not value the outcome highly, or feel completely certain of
getting in to their first choice because of their previous actions. For example, the focus child may
already have an elder sibling at the school and hence is almost guaranteed admission. Taking those
previous actions of course also implies a high value placed on the choice outcome, and, in the case
of a house move, suggests some anticipation that their chosen school will be over-subscribed and
hence the need for other strategies to ensure that they secure a place at the school.

6
b) Allocation to the first-choice school
Does a high percentage of households allocated to their first-choice school indicate success – that
most people are allocated to their genuinely preferred school? Or that parents have made pragmatic
school choices based on their perceived chance of admission?
The probability of getting an offer from a first-choice school depends first on how competitive an
area is, in terms of the number of schools, and the relative attractiveness of different schools in the
area. Imagine, for example, that there are only two nearby schools in a rural area and the schools
have similar characteristics. Parents in this scenario are more likely to be able to secure a place at
their first-choice school. By contrast, in an urban area with a large number of schools with very
different characteristics, it is likely that on average parents will be less likely to secure a place at
their first-choice school. The probability of getting a first-choice school also depends on the degree
of ambition of the choices. First choices that nominate popular schools are necessarily less likely to
succeed than nominations of unpopular schools. So ambitious choices made in urban areas are least
likely to generate an offer. Parents making ambitious first choices may also make ambitious second
choices (before “playing safe” lower down the ranking) and so they may well be assigned a higher
quality school than parents who successfully got an offer in a less popular school. Of course, having a
sibling in the school or strategically moving house before the choice process can also raise the
chance of success dramatically.
What about discrimination? Might it be that some groups systematically miss out on their first
choices for other reasons? For example, might low achieving students (or more precisely students
that statistically are likely to be low achieving due to their personal characteristics) miss out on
places? In the English system, this seems less likely at the point of admission. The system is now
sufficiently centralised and regulated that schools themselves have little discretion in the allocation
of pupils to schools. The risk is perhaps higher in the case of semi-autonomous schools like
Academies, who control their own admissions. However even with these schools there is limited
scope for them to use illegal criteria to determine entry and they are likely to be subject to a lot of
parental legal appeals.
One of the key features generating differential access to popular schools is the centrality of the
proximity criterion. This is not however covert discrimination, this is explicitly permitted as an
allowable school priority criterion. In this way, there is systematic bias in the ability of pupils from
different backgrounds to attend schools that are deemed to be popular or high quality by parents.
Nationally, 85% of families were offered a place in their top choice school. Despite this high
proportion, there is often a sense in the media that “only” 85% were successful. However, as we
have argued, the fraction also reflects the degree of ambition of families’ choices. If a sizeable
fraction of families nominates less popular schools, then in principle, everyone can get their first
choice. But if everyone applies to a popular school, say a school rated as “Outstanding” in England,
then the fraction successful is simply the fraction of places in Outstanding schools (26% at time of
writing). In this case, an 85% success rate reflects the nature of the choices made, as much as the
efficacy of the system.

7
c) Choosing the nearest school
Households could have two different motives for nominating their nearest school as first choice.
First is the trade-off noted above between distance and quality: a nearby school is convenient, offers
a shorter commute and this may be highly valued. The second reason is that given the widespread
use of proximity as a school priority, there is a higher chance of getting in if the school is
oversubscribed.
For some there is no trade off, as the nearest school is also the most preferred, either by luck or by
the family having moved house in advance of the choice process. For others this is not true, and
there is a meaningful trade-off between distance and quality. There may appear to some parents to
be a trade-off between choosing a nearest school because they are very confident of securing a
place at the school and choosing a school that is further away but that they prefer. Yet the English
choice system as described above does not require parents to make this kind of trade-off.
Households can put their genuinely preferred school as their first choice and their nearest school as
a lower safety choice. The system does not penalise them for doing this. In areas where parents are
only allowed 3 choices this may however mean that the third-choice school would definitely need to
be the school with the most guarantee of admission, even if there were other schools that the
parent might prefer.
d) Outcome given the preferences and the choices made
The outcome from the school choice process is the allocation of all children to a school. So what
constitutes success in this process? Parents may secure their first choice of school or not and, as we
have noted, it is by no means clear that a large proportion of parents getting a first-choice school is
the right measure of success for the system as a whole. Parents who make ambitious choices may
end up with their second or third choice school but that might still be a better option for them than
if they simply choose their nearest school. For parents who make only one choice, getting an offer
from that school may reflect the parents’ strong desire for their child to go to that school and/or
their high confidence that they would be given an offer. Equally it may mean that parents do not
always understand the admission process and that the parent simply chose the nearest school “to be
safe”. Unpicking the outcomes from school choices and determining what constitutes a successful
outcome is therefore more complex than it first appears.
In section 5 we use this framework to discuss the empirical evidence presented below on how many
choices different parents make, the nature of those choices, the extent to which parents are
choosing their nearest school and the outcomes from parents’ choices. Before this we describe the
data.
4. Data
We use globally unique administrative data on parental preferences. Most school choice analyses
have had to rely either on partial information on choices or on data from a particular locality or city.
Unusually, our data covers the whole cohort of pupils who sought admission to any English state

8
secondary school in the school year 2014/15.14 The parental choice data contain for each pupil: the
ID of each nominated school (e.g. first, second and third choices in some areas and up to 6 choices in
others), and the identity of the school that the child was offered, which may differ from the school
that the pupil was finally enrolled in. Our dataset takes the preference data as a base (all those that
made a choice) and links from that to the National Pupil Dataset (NPD). We therefore have no pupils
in the dataset for whom we see no choices: those that made a choice but don’t enter the state-
sector are included in the data, those that enter the state-sector but did not make a choice are not.
The NPD is also a census of all pupils in the English education system.
The two datasets together provide us with: the characteristics of pupils and the detailed
characteristics of all the schools they applied to (not just the one they enrol in), and also their home
location in relation to all their preferred schools and to their allocated school.15 One of the
characteristics of schools is their academic quality, so we are able to model the choices families
make in terms of school quality. The sample is large, over 526k pupils, and this allows for very fine-
grained analysis. With only a few exceptions, we analyse the whole cohort. We exclude middle
school areas as the admissions system is very different and involves two school moves rather than
one. We include selective areas in which students must pass an examination to get into some
schools (grammar schools)16, and compare those results to the results from non-selective areas. We
also compare Local Authorities where more than three or only three school choices are allowed, and
areas with higher and lower numbers of schools in the local area as a measure of population and
school density.
For pupil characteristics, we focus on eligibility for Free School Meals (FSM), as a marker of poverty,
and aggregate ethnic groups.17 We also considered whether a pupil has English as an Additional
Language (EAL), and IDACI as a measure of neighbourhood deprivation.18 We set out our choices of
detailed definitions for variable creation in Appendix 1. Appendix Table 1 shows the sample size for
each subgroup.
There are limitations to the data. We do not know the admissions criteria for each school. While
these criteria almost always involve similar rules, as we discussed above, there will be local variation
in detail that may be decisive for some schools and pupils. We plan to investigate this
comprehensively in some case study areas for later papers on this topic.
14 We also have data for secondary school admission for 2013/14 and for primary school admission in 2013/14. We will report on these other data shortly. In particular, a comparison of primary and secondary school admissions will provide useful information. 15 The family’s postcode is taken from the NPD – at the closest point to when the choice was made. If this is not available, the postcode recorded in secondary school is used.
16 Defined as having at least 10% of pupils that attend school in the LA attend a school classified as “selective”
in Edubase. We repeated the analysis with a choice of 5%, 15% and 20% with no major changes. 17 Ethnic group is derived from the National Pupil Database, based on minor ethnic group classification. The categories used are ‘White British’, ‘White Other’ (‘White - Irish’, ‘Traveller Of Irish Heritage’, ‘Gypsy/Romany’ and ‘Any Other White Background’), ‘Asian’ (‘Bangladeshi’, Indian’, ‘Pakistani’ and ‘Any Other Asian Background’), ‘Black’ (‘African’, ‘Caribbean’, ‘Any Other Black Background’), ‘Chinese’, ‘Mixed’ (‘Mixed White and Asian’, ‘Mixed White and Black African’, ‘Mixed White and Black Caribbean’ and ‘Any Other Mixed Background’) and ‘Any Other Ethnic Group’. 18 http://standards.esd.org.uk/?uri=metricType%2F382&tab=details

9
The most important limitation is that we do not know the nature of the priority of each pupil for
each of their school choices.19 In particular, we do not know whether the child has an older sibling at
the school, or whether the child is a “Looked After Child”, both of which have high priority in over-
subscribed schools, overriding proximity. Given that there are far more siblings than Looked After
Children, this is the more major issue. In the Millennium Cohort Study, about 43% of pupils have an
older sibling of secondary school age at the time of admission to secondary school which will in
general give them a significantly higher priority at one school. For them, the key school preference
decision was made for the older child, presumably with the understanding that the choice would
hold for all subsequent siblings. Not having this information certainly complicates the analysis of
parents’ choices.20 If the incidence of “having an older sibling” was randomly distributed through the
cohort then in principle this problem should not bias our analyses of parental choice but we cannot
necessarily rely entirely on that being true. In the Millennium Cohort Study, the presence of an older
sibling of secondary school age is strongly correlated with household income: 67% of children in the
lowest income decile have an older sibling of school age at the point relevant for school admission,
compared to 33% in the highest income decile. Priority to a preferred school (which we do not
observe) may therefore be correlated with household characteristics such as eligibility for free
school meals. This point needs to be borne in mind when considering the results below.
5. Results
We present results on the number of choices made by households, whether a household received an
offer from its first choice, whether the first-choice school is the nearest, and how the school in which
the child is eventually enrolled relates to the choices made by her parents. We postpone a broad
discussion of the findings to the final section of the paper.
a) Number of choices made
Table 1 presents results for the whole cohort, some 526k pupils. Results in this and subsequent
tables are broken down by personal characteristics such as FSM, ethnicity, EAL status and
neighbourhood poverty level. We also show neighbourhood characteristics based on where the
family making the choices lives: whether the LA is selective or not, the number of choices families
can make, and population density.
The overall average number of choices made is 2.4, but there is wide dispersion. 35% of households
make only one choice, while at the other extreme, 27% make the maximum number of choices
permitted.
Being able to study the variability in behaviour between household types is one of the key
advantages of the large and rich data set. The first point to note is that there is in fact very little
19 This information was used for example by Allen, Burgess and McKenna (2013) in modelling the outcome of the Brighton and Hove school lottery. 20 We plan to use the Millennium Cohort Study, which has such data, to complement this analysis.
10
difference, on average, between the number of choices made by richer and poorer households, as
measured by the child’s Free School Meal status (FSM). Similar proportions of FSM and non-FSM
households make only 1 choice and indeed similar proportions make the maximum number of
choices. There are much bigger differences when we look at ethnicity and EAL status however. For
example, 41% of White British households only make 1 choice, compared to 17% of Asian
households and 12% of Black households. Again, 37% of these latter groups make as many choices as
they can, compared to 24% of White British households. These differences are reflected in the split
by EAL status, with a much higher fraction of those who have English as an Additional Language
making all choices possible and a higher mean number of choices.
Turning to the neighbourhood characteristics, there are some striking findings. First, the maximum
number of choices allowed does make a substantial difference.21 In LAs where more choices are
allowed, more are made, almost twice as many on average. So, despite the substantial number of
people choosing to make just 1 choice, this suggests a frustrated demand to make more choices in
places where 3 is the maximum. Second, population density makes a big difference: people make
more choices in dense neighbourhoods, with far fewer making just the one choice. We can illustrate
this looking at specific places at either end of the spectrum of density. In Hackney in central London
for example only 9% of people make just one choice, while 27% make the maximum allowable six
choices. Similarly, in Birmingham, 35% make six choices and over half make at least four choices. By
contrast, in Cornwall, 77% of parents make just one choice. Appendix Table 2 shows the number of
choices made in each LA in England.
There are also differences in the number of choices made in selective (i.e. grammar school) areas
compared to non-selective areas, though perhaps not as substantial as expected. In selective areas,
households make more choices, perhaps as a precautionary measure, and substantially fewer make
only one choice.
Finally, as with the individual poverty measure, FSM, there are relatively slight differences in the
number of choices made by neighbourhood poverty, the mean number of choices made being
slightly higher in poorer areas.
Of course, many of these factors are strongly correlated, for example urban density with
neighbourhood poverty. For this reason, we run a simple multivariate regression to control for these
factors simultaneously. The results are in Appendix Table 3. Columns 1 to 4 show the results relevant
to the number of choices made. The points made above from the raw data in Table 1 are confirmed
by regression analysis, with all of the highlighted patterns remaining.
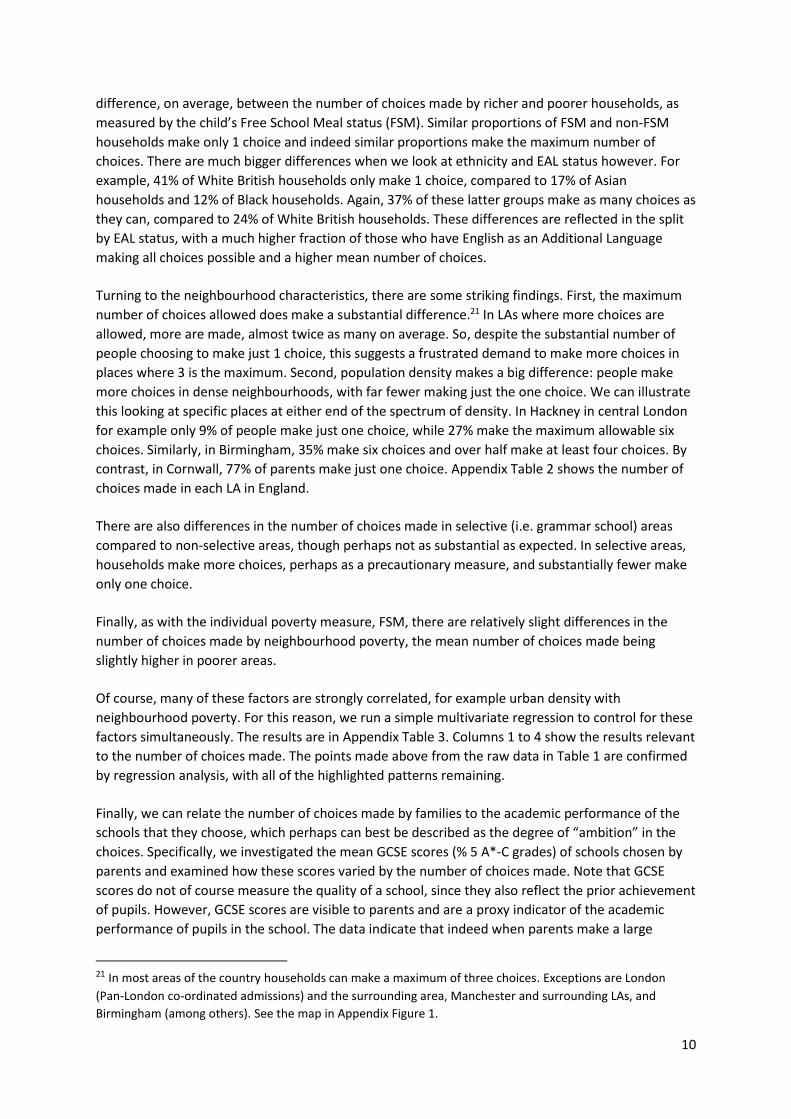
Finally, we can relate the number of choices made by families to the academic performance of the
schools that they choose, which perhaps can best be described as the degree of “ambition” in the
choices. Specifically, we investigated the mean GCSE scores (% 5 A*-C grades) of schools chosen by
parents and examined how these scores varied by the number of choices made. Note that GCSE
scores do not of course measure the quality of a school, since they also reflect the prior achievement
of pupils. However, GCSE scores are visible to parents and are a proxy indicator of the academic
performance of pupils in the school. The data indicate that indeed when parents make a large
21 In most areas of the country households can make a maximum of three choices. Exceptions are London
(Pan-London co-ordinated admissions) and the surrounding area, Manchester and surrounding LAs, and
Birmingham (among others). See the map in Appendix Figure 1.

11
number of choices, they do tend to make a more ambitious first choice. This suggests that many
parents understand the system sufficiently well to use the school choice system to access a good
school. More generally we also found that, in a summary regression (reported in Appendix Table 3,
columns 11 and 12), the quality of parents’ first choice school is higher in LAs where more choices
are permitted (this is true even when we take account of school quality being higher in London). This
too indicates that where parents are given more choice they use it to make ambitious choices.22
A related but distinct question is what impact does the number of choices potentially have on pupils’
outcomes? Do households that make more choices actually end up at higher scoring schools? Figure
1 shows the GCSE performance (percentage of pupils achieving at least 5 GCSEs at grades A*-C,
including English and maths) of the school a pupil is offered a place at, depending on the number of
choices made and the rank of the school the household is offered (for example first choice or second
choice). Figure 1 is based on the sample of households in London, where a maximum of six school
choices is permitted. For instance, the first group of bars shows the average school performance for
households that make one choice, split by those who were offered a place at this school (“1”) and
not (“0”). The final group of bars shows the average school performance for households that make
six choices, where the bars indicate the school the household was offered a place at (where “0”
denotes no offer at a chosen school, “1” denotes the child was offered their first-choice school and
“6” denotes offered a place at the sixth-choice school). This sample is chosen to focus on a group of
households with the same number of possible choices and application procedure, and a high-density
area with a lot of schools potentially available.
Figure 1 shows that regardless of how many choices parents make, the average school performance
for those not offered a place at any chosen school (those in the “0” bars) is substantially lower than
for those offered a place at any chosen school. This reflects the fact that those who were not
allocated a school were assigned to, on average, lower performing schools. This highlights the
motivation for cautious or strategic choices for some households in areas where admission to a
school or set of schools is not guaranteed.
Figure 1 also shows the potential benefit of making more choices. Those who make more choices on
average receive an offer from schools higher-performing schools. For example, those making six
choices and securing their first choice of school receive an offer from a higher performing school as
compared to those making just one choice, even if the latter do indeed get that one and only choice.
For example, comparing those who are offered a place at their first-choice school, the percentage of
pupils in the school achieving 5 A*-C is 62% for those who make one choice compared to 68% for
those who make six choices. This may be because making more choices allows the household to be
more “ambitious” with their top choices – choosing high performing schools where admission is not
guaranteed. Those who make more choices are also offered higher performing schools even if they
are allocated to one of their lower ranked school choices (for example their second or third choices).
Indeed, the average school performance of second choice schools for those who made six choices is
higher than those allocated to their first choice of school where the household made fewer than four
choices. This is relevant to the discussion in the next section: admission to first choice may not imply
admission to a higher quality school.
22 This simple regression suggests that for households eligible for free school meals there is not a significant positive relationship between the quality of first choice school and number of choices permitted. This suggests that increasing the number of choices would not necessarily reduce inequality in access to good schools, but a more comprehensive analysis is required for such a conclusion.

12
It would appear that if a parent makes more choices, they are more likely to secure a higher
performing school. This may not be a causal relationship however. It could also be that the kinds of
parents who make more choices are more focused on education or wealthier and hence may be
located in areas which have access to better schools. Equally those who make few choices could
prioritise education less highly, or prioritise a school where an older sibling is already present and
admission therefore almost guaranteed.23
b) Admission to first-choice school
Table 2 reports the fraction of households that are observed in their first-choice school in the Spring
term after school entry. As the table shows, this is slightly different to the fraction receiving an offer
from their first-choice school, suggesting some offers are not taken up, some individuals get put on
waiting lists and then secure a place at their school of choice, and some successfully appeal
decisions. Our discussion focusses on the receipt of an offer, but we note any interesting
discrepancies between the two measures.
The overall fraction of households receiving an offer from their first-choice school is high at 85%. We
again see essentially no difference in this fraction between FSM and non-FSM families, with
respectively 84% and 86% being successful. Comparing offers and attendance, for FSM pupils 81%
attend their first-choice school, compared to 84% who received an offer, whereas the change goes
the other way for non-FSM pupils - more attend their first choice than receive an initial offer. This
might indicate that such non-FSM pupils are achieving their first choice on appeal. Looking instead at
neighbourhood poverty, households in less disadvantaged neighbourhoods are somewhat more
likely to receive an offer from their first-choice school.
Again, there are bigger differences between ethnic groups and by EAL status. Black and Asian
households are less likely to have an offer from their first-choice school than White British
households; similarly, EAL households are less likely to have an offer from their first choice (73%
relative to 88%). We discussed possible interpretations of this above and return to this in the final
section of the paper.
There are also significant differences between types of area. In densely populated urban areas
(above median number of schools within 20km) applicants have a lower probability of receiving an
offer from their first-choice school. This may reflect a wider variation in school quality, more schools
within a feasible travel distance, more competition for places at popular schools and parents being
less able to predict the popularity and demand for each school.
Households in LAs where only three choices are allowed are also more likely to receive an offer from
their first choice. There are a number of potential explanations for this. It is the case that many of
the areas that only allow three choices are more rural and this lower density of schools will tend to
increase the chances of an individual securing their first choice. Equally though, it could also be that
households make more cautious choices in those areas that only allow them three options, as
discussed in the previous section.
23 Note that in this case if school quality over time is correlated then school quality for the current child should correlate with school quality for the older child.

13
Finally, households in selective LAs are slightly less likely to receive an offer from their first-choice
school (81% vs 86%), though the difference is perhaps less than might have been expected. Again, it
may be that the nomination reflects what families think are their likely outcomes.
Another feature of the data is that the number of choices made is also strongly correlated with the
percentage that receive an offer from their first choice. 97% of households that make only one
choice receive an offer from this school. This suggests that their offer was almost guaranteed,
perhaps due to proximity or the fact that the child had a sibling in the school or some other
characteristic that gave them priority status. For those making the maximum number of choices,
77% received an offer from their first-choice school. Again, there are a number of interpretations of
this: first, families who feel that they do not stand much chance of getting into their preferred school
use all their available choices to do the best they can, consistent with them having a lower chance of
securing their first-choice school. Second, it may be that these families are more sophisticated users
of the system, make all the choices they can including an ambitious nomination as first choice, and
consequently face a lower chance of securing that choice.
Overall, Table 2 shows that pupils have a lower chance of getting an offer from their first-choice
school if: they live in dense urban areas; they live in areas where more choices are permitted; they
live in poorer neighbourhoods; they apply to high performing schools; or they are from minority
ethnic backgrounds. The largest differences arise from density, school quality and the maximum
number of choices permitted.
Of course, all of these factors are correlated. Because of the importance of population density in
affecting the outcome, and because it is correlated with other factors of interest such as poverty,
ethnicity, school academic quality, and the number of choices allowed, we revisit some of the results
in Table 2 controlling for density. These results are in Figures 2 to 4.
Figure 2 shows that the similarity of outcomes for FSM and non-FSM eligible families holds across
the distribution of school density (number of schools within 20km).24 Figure 3 shows that Black or
Asian households are less likely than White British households to receive an offer from their first-
choice school throughout the range of school density, apart from in the most urban areas where
school density is very high indeed. The percentage for Black and Asian households are similar across
the distribution. Similarly, EAL households are less likely to receive an offer from their first-choice
school across the distribution of school density, again apart from in the areas with the most schools
(Appendix Figure 2). This suggests that it is not just location but another attribute of EAL households
(perhaps ambition in school choice) that contributes to the differences between EAL and non-EAL
households.
Figure 4 illustrates another key factor in the argument – that higher performing schools are harder
to get into. This shows that throughout the range of school density, families putting a top quartile
school as their first choice are much less likely to receive an offer from their top choice; by contrast
families nominating a bottom quartile school as their first choice are almost sure to get an offer from
that school. The gap in probabilities is smallest in the areas with fewest schools i.e. most rural areas,
and very substantial in the areas with the most schools. This suggests that competition for the
24 Households in less disadvantaged neighbourhoods are more likely to receive an offer from their first-choice
school across the distribution of school density, but the difference is small (Figure available).

14
highest attaining schools is higher in more dense areas, and either that the probability of admission
is harder to predict in these areas or that households are more ambitious.
Columns 5 to 8 of Appendix Table 3 report the results from the multivariate regression. Again, the
key points we make above are confirmed.
c) First-choice school is the nearest school
In Table 3 we report the fraction of households which nominate the nearest school as their first
choice. With these data, we can assess the extent to which families have a strong desire for a close-
by school for their child. We use each family’s postcode and the postcode of the schools to calculate
straight-line distances between them, and identify the nearest one.25
In fact, only 39% of households nominate their nearest school as their top choice. This is very
striking, particularly recalling that there are two different reasons why nearness might be helpful: to
raise the chances of getting an offer, and to reduce the school commute. Further, even within the
39% of families who appear to value proximity highly, some will have made an active decision in
earlier years by moving house, precisely in order to make their preferred school their nearest school.
Around 3.5% of households in the Millennium Cohort Study report moving house as a step to ensure
the child is admitted to their preferred school (whether or not there is an older sibling of secondary
school age in the household) but many more are likely to have considered local school quality in
their choice of home. Even if we widen the definition to ask “is the nominated first-choice school
within 20% distance of the nearest one”, that is still only true for less than half of all families. This
implies that most families do not prioritise distance from the school above all else.
There are important differences in this statistic by area characteristics. Unsurprisingly, households in
less dense areas, with fewer schools and longer commute times, are more likely to choose their
nearest school. Households in areas where more choices are allowed are also less likely to just pick
the nearest (though as London is the largest area with more than three choices, this fact may drive
this relationship). This would seem to confirm that there is a degree of caution being exhibited
whereby parents are more likely to put down the school that they have the greatest chance of their
child being admitted to (often their nearest) when they are only permitted 3 choices on the form.
Households in selective areas, perhaps necessarily, also nominate their nearest school less
frequently. Households living in more affluent neighbourhoods are more likely to choose their
closest school, which may reflect the overall quality of schools there, or preferences.
The differences across sub-groups of families reflect the patterns we have seen so far. There is
essentially no difference in the proportion of families choosing their nearest school by FSM-
eligibility, 38% versus 39%. By contrast, there are substantial differences by EAL-status and by
ethnicity. On the former, 42% of non-EAL pupils put the nearest school top of their list, compared to
27% of EAL pupils. These differences may simply be driven by population density which we consider
next.
There is a marked decline in the proportion nominating their closest school by the number of
choices made. Only 20% of those making at least four choices nominate the nearest, and even
among those that make one choice, only 55% nominate their closest school. This suggests that
25 While there will be cases in which straight-line distances are misleading for actual travel-time distances, in most cases, they are an accurate approximation.

15
proximity is not the most important consideration for secondary school choice, even for those that
make only one choice. This adds further evidence to the relationship shown above between the
number of choices made and the chance of getting an offer from the first choice.
In Appendix Table 4 we extend the definition further to ask whether any of the schools that families
nominated were the nearest. Even then, the overall figure is just 55% - almost half of all families do
not nominate their nearest school at all.
In Figures 5, 6 and 7 we display this relationship allowing for the number of schools within a 20km
radius (i.e. urban density), and find similar patterns to before. Again, there is essentially no
difference at all between families by FSM-eligibility at any level of school density (Figure 5). There
are significant differences by ethnicity – White British families are more likely to nominate their
nearest school than Asian or Black families (Figure 6). Similarly, non-EAL households are much more
likely to choose their nearest school across the range, except at the very highest levels of density
(Appendix Figure 3).
In Figure 7, we explore the likelihood that a family nominates their nearest school as top choice
relative to the academic quality of that school. Households whose closest school is in the lowest
quartile of attainment are least likely to choose their closest school: households are more likely to
bypass their closest school if it has unsatisfactory academic performance. A similar percentage of
parents choose their closest school in the highest attaining three quartiles. In areas with more
schools, the proportion nominating their first-choice school falls, irrespective of its performance.
Less than 15% of households in very dense urban areas whose nearest school is in the bottom
quartile of performance will nominate that school as top choice.
One key issue in deciding whether to opt for the nearest school or pick another school as top choice
is the relative academic performance of the two schools. The school choice model essentially
predicts that parents will choose the school with significantly higher performance, taking distance
and other factors into account. Table 4 shows the relative academic attainment of the first-choice
school and closest school, if these are different.26 Relative academic attainment is equal to 1 if
attainment of the first-choice school and closest school is the same, greater than one if the first-
choice school has higher attainment than the nearest, and less than one if the first-choice school has
lower attainment. There is a great deal of variation across families which reflects both parental
choice and the nature of the schools available.
On average, where households nominate a first-choice school that is not their nearest, their first
choice school has 20% higher attainment than the nearest. There is wide variation in this: 10% of
such households actually choose a school that has at least 30% lower attainment than their closest
school, and 10% of households choose a school that has dramatically higher attainment. Non-FSM
households, on average, choose a school than is 20% better than their closest school, compared with
10% better for FSM households. Asian and Black parents who choose a school other than closest are
slightly more likely to choose a higher performing school than White British parents. EAL and non-
EAL households are very similar in this respect.
Columns 9 and 10 of Appendix Table 3 report the results from the multivariate regression. Again, the
points we make above are largely confirmed.
26 Note that this is therefore a non-random sub-sample of the full population, with fewer observations.

16
d) Actual school enrolled in relative to households’ first choice
We compare the academic quality of the school the pupil is actually enrolled in and the academic
quality of the school nominated as first-choice. As we have shown, the majority do receive an offer
from their first choice. But among the remaining pupils, the school enrolled in might be academically
better than the first-choice, academically similar or worse.27 Also, both pupils who did and those
who did not receive an offer from their top choice might choose to exit the state system in favour of
a place in a private school.
We show these outcomes against a measure of neighbourhood disadvantage in Figure 8. As
indicated earlier, across all deciles of neighbourhood deprivation, at least 80% of pupils receive an
offer from the school they nominated as their first choice. The proportion of students securing their
first-choice increases slightly in more affluent neighbourhoods. What is even more striking from
Figure 8 is that the majority of pupils who do not get their first choice of school nonetheless receive
an offer from a school of similar academic quality to their first choice. However, households in the
most disadvantaged neighbourhoods are somewhat more likely to receive an offer from a lower
quality school.
The proportion of households that exit the state education sector conditional on receiving an offer
from their first choice is unsurprisingly larger for the least disadvantaged neighbourhoods. Although
a small proportion, these households demonstrate that the decision between state and private
education is not firmly made for all households, even when first choices are met. The probability of
exiting the state education sector is in fact not noticeably larger even if the first choice is not met;
that is, while for some it may be that the private school is the back up to the first-choice state
school, for others, the state is the back up to the private school.
6. Discussion and Conclusions
School quality is a key determinant of pupils’ academic performance. Understanding the school
choice process and how pupils are allocated to schools is therefore critical if we are to understand
and improve educational equality and social mobility. In this paper we use a new and comprehensive
dataset to study the school choice process in England. These data, containing all secondary school
choices in 2014, can help us determine whether school choice is working to improve outcomes in
English state schools.
Our analysis shows that a large proportion of parents use the school choice system pro-actively to
achieve a preferred school. First, significant numbers make the maximum number of school choices
they can. Second, perhaps contrary to expectations, only a minority of parents choose their nearest
school. Third, the local school is more likely to be bypassed where the quality is low. In other words,
the data suggest that parents are making active choices for schools and appear to value academic
quality.
Further, there is clear evidence of strategic choice which implies that many parents have an
understanding of the school choice system as it currently operates. For example, when parents make
27 A %5A*-C score different by no more than 10%.

17
multiple choices, their first choice tends to be more ambitious. Indeed, parents who make more
choices tend to end up with an offer from a higher performing school. Equally, people make more
cautious choices when constrained to 3 options. This suggests that they would have benefited from
having more choices, which is an important note for policy. Local Authorities could improve the
percentage of households allocated to a preferred school simply by offering the possibility of making
more choices on the common application form. This would be relatively costless and would easily
reduce the need for a strategic or “safe” school choice.
While some households clearly engage with the school choice process, which may act to improve
standards, choice is curtailed for others by the predominant current school admissions criteria.
Allocating places to over-subscribed schools by proximity means that some households have
negligible chance of admission to the best schools. Given limited choices permitted, these
households may therefore decide that making such an “ambitious” choice would be a waste.
Another aim of our research was to consider how the school choice system operates for different
families. There is concern that low income households may not be able to make the same kind of
choices as those from higher income households. Our analysis of choice shows that FSM and non-
FSM households are similar in the number of choices made, the proximity of first-choice, and
admission to first choice school. However, non-FSM households still access better schools due to
their proximity to higher performing schools. Would the choice behaviour of FSM and non-FSM
households differ if choice was not constrained by the probability of admission to good schools? This
is a central topic for our future research.
There is a striking difference between White and Black and Asian families (and relatedly between
EAL and non-EAL families). Black or Asian families (or EAL families) make far more school choices and
prefer higher performing schools. We cannot conclusively say why what drives these differences.
Perhaps these families have a greater focus on education or a better understanding of the school
choice system. It is important to note, however, that despite using the school choice system more
actively, on average such families still end up being enrolled in lower performing schools.
Our conclusion is therefore that the school choice system is being actively used, though more so in
urban areas than in rural areas and more so by Black, Asian and EAL students. Certainly, only a
minority of families make just one choice or choose their local school. Further, taken at face value
the system appears to be working well. The vast majority of parents get their first choice of school.
However, given that most schools do not have spare places, this finding may equally reflect a degree
of realism in parents’ assessments of whether their child will really be able to get into any particular
school. Our data also indicates that where the number of choices are limited, parents make safer
options. This implies that parents may benefit from being able to have more choice and hence make
more ambitious choices.
In this paper we have used the data to understand parental choices and the allocation of pupils to
schools. We have been able to describe some key features of the English school choice system and
how it is operating at secondary school level. However, whilst we have certainly been able to
document the pattern of choices that parents make, we have not been able to determine the
relative importance of parental choice and constraints (e.g. not leaving in close enough proximity to
their school of choice) in school allocation. In subsequent papers, we intend to undertake
econometric modelling to better understand these relationships.

18
References Allen, R., Burgess, S. and McKenna, L. (2013) The short-run impact of using lotteries for school
admissions: early results from Brighton and Hove’s reforms. Transactions of the Institute of British
Geographers. Vol. 38(1) , pp. 149 – 166.
Burgess, S., Greaves, E., Vignoles, A. and Wilson, D., 2015. What parents want: School preferences
and school choice. The Economic Journal, 125(587), pp.1262-1289.
Gibbons, S. and Silva, O., 2011. School quality, child wellbeing and parents’ satisfaction. Economics of
Education Review, 30(2), pp.312-331.
Gibbons, S., Machin, S. and Silva, O., 2013. Valuing school quality using boundary
discontinuities. Journal of Urban Economics, 75, pp.15-28.
Kane, T.J., Riegg, S.K. and Staiger, D.O., 2006. School quality, neighborhoods, and housing
prices. American Law and Economics Review, 8(2), pp.183-212.
Pathak, P.A. and Sönmez, T., 2013. School admissions reform in Chicago and England: Comparing
mechanisms by their vulnerability to manipulation. The American Economic Review, 103(1), pp.80-
106.
Raveaud, M. and A. Van Zanten, 2007. Choosing the local school: middle class parents’ values and
social and ethnic mix in London and Paris. Journal of Education Policy, Vol. 22 No. 1.
West, A. and Hind, A., 2007. School choice in London, England: Characteristics of students in
different types of secondary schools. Peabody journal of education, 82(2-3), pp.498-529.

19
Appendix 1: Definitions using preference data
Maximum number of choices in LA This is based on the data. From the data, we took the 95th percentile of the number of choices made
in the LA (based on LA of school attended rather than home). For any LAs where this was greater
than three, we checked the LA website to confirm the maximum possible number of choices. The
maximum number of choices possible to make on LA application form varies between 3 and 6 across
the country.
Number of choices made The number of choices made on the LA application form, based on the school IDs (LAESTABs) given
rather than the school IDs that match to other school-level data. We set “Max” is 0 if the household
makes less than maximum number of choices, and 1 otherwise.
Offer to first choice Binary variable equal to zero if the school ID of the first choice is not equal to the school ID of the
school that made an offer. Here we take school IDs from those that match to school-level data. In
the whole sample, 55 LAESTABs are presumed to be miscoded.
Attend first choice Binary variable equal to zero if school ID of first choice not equal to school ID of school attend in
following Spring. Here we take school IDs from those that match to school-level data. In the whole
sample, 55 LAESTABs are presumed to be miscoded.
Number of schools within 20km A simple count of the number of schools within 20km radius of pupil’s home postcode. Postcode is
the earliest observed postcode in the data (Spring before application or Spring after application),
which is presumed to correlate with the postcode at time of application.
School quality of first-choice school (measured by % 5A*-C) in quartiles School quality is taken from KS4 performance profiles from the latest academic year available before
choices are submitted. Quartiles are derived from all schools with this measure (rather than all
schools that were open to year 7 applications in the relevant year).
First choice is closest school Binary variable equal to 1 if the school ID of the school named as first preference is the same as the
school ID of the closest school (using straight line distance).
Any choice is closest school As above, but whether school ID of any choices is the same as the school ID of the closest school
(using straight line distance).
First choice is closest school (within 20% tolerance) The distance between home and first-choice school is within 20% of the distance between home and
closest school.
Any choice is closest school % (within 20% tolerance) As above, but for the distance of any choice.

20
First choice is closest school in LA The school ID of the first-choice school is the same as the school ID of the closest school (straight line
distance) in the same LA as home postcode
Any choice is closest school in LA As above, but for school ID of any choice.
Relative %5A*-C The %5A*-C including English and Maths for the first-choice school relative to the %5A*-C for the
closest school, where first choice was not the closest school.
Destination after national offer day Classified as “similar” if within 10% of first choice; Classified as “worse” if offer has attainment more
than 10% worse than first-choice school; Classified as “better” if offer has attainment more than
10% better than first-choice school. Attainment defined by %5A*-C

21
Tables and Figures
Table 1: Number of choices made (secondary)
1 (%) 2 (%) 3 (%) 4+ (%) Max (%) Mean
All 34.55 21.58 26.89 16.98 26.88 2.41
Pupil characteristics
FSM 36.86 20.49 25.98 16.67 24.31 2.39
Non-FSM 34.15 21.77 27.05 17.03 27.32 2.42
EAL 18.62 16.66 29.81 34.91 34.25 3.20
Non-EAL 38.15 22.69 26.23 12.93 25.22 2.24
White British 40.78 23.52 25.94 9.76 24.03 2.10
Asian 17.06 16.51 31.45 34.97 37.79 3.24
Black 11.84 13.13 26.96 48.07 37.12 3.69
Above median SES
(neighbourhood) 37.72 22.89 25.94 13.45 25.67 2.24
Below median SES
(neighbourhood) 31.49 20.28 27.81 20.43 28.04 2.58
Local area characteristics
Selective LA 24.75 20.73 23.79 30.72 27.75 2.85
Non-selective LA 36.51 21.75 27.51 14.23 26.70 2.32
Above median
number of schools
within 20km 25.55 19.93 26.67 27.85 26.88 2.85
Below median
number of schools
within 20km 43.73 23.26 27.11 5.89 26.88 1.97
3 choices allowed 44.61 23.62 31.64 0.14 31.78 1.87
More than 3 choices
allowed 23.43 19.32 21.64 35.61 21.46 3.01
Note: Overall sample size is 526,329. “FSM” denotes free school meals, a binary indicator for pupil
income disadvantage. “EAL” denotes English as an additional language. “Above median SES
(neighbourhood)” denotes neighbourhood disadvantage (defined by the Income Deprivation Affecting
Children Index) is the more affluent half in the sample.28 “Selective LA” denotes a local authority (LA)
where at least 10% of pupils attend a selective school. “Above median number of schools within
20km” denotes the number of schools within 20km above the median in the sample. “3 choices
allowed” denotes the maximum number of choices parents are able to express is 3.
Source: National Pupil Database linked to national parents’ preferences data, made available by the
Department for Education.
28 Source: https://www.gov.uk/government/statistics/english-indices-of-deprivation-2015

22
Table 2: Admission to first choice school
% with offer to first
choice
% attend first choice
All 85.36 85.21
Pupil characteristics
FSM 84.13 80.64
Non-FSM 85.57 86.01
EAL 72.80 72.97
Non-EAL 88.17 87.91
White British 90.26 89.75
Asian 72.12 73.58
Black 66.34 66.22
Above median SES
(neighbourhood) 88.68 89.36
Below median SES
(neighbourhood) 82.23 81.08
One choice 97.05 95.31
Two choices 87.31 86.42
Three choices 81.16 81.66
At least four choices 65.54 68.28
Maximum number of
choices 77.00 78.17
Local area characteristics
Selective LA 80.93 81.47
Non-selective LA 86.24 85.95
Above median number of
schools within 20km 80.07 80.55
Below median number of
schools within 20km 90.72 89.90
3 choices allowed 91.38 90.24
More than 3 choices
allowed 78.65 79.58
Note: See Table 1.
Source: National Pupil Database linked to national parents’ preferences data, made available by the
Department for Education.

23
Table 3: First choice school is closest school
% First choice is
closest school
% First choice is
closest school
(within 20%
tolerance)
% First choice is
closest school in LA
All 38.98 45.95 39.56
Pupil characteristics FSM 38.03 45.03 38.60
Non-FSM 39.15 46.11 39.73
EAL 27.28 33.47 27.57
Non-EAL 41.63 48.77 42.28
White British 43.90 51.28 44.59
Asian 27.73 34.39 27.88
Black 18.85 23.51 19.23
Above median SES
(neighbourhood) 43.73 51.07 44.47
Below median SES
(neighbourhood) 34.35 40.95 34.78
One choice 55.43 62.89 56.53
Two choices 37.59 45.25 38.09
Three choices 31.03 37.88 31.30
At least four choices 19.88 25.15 20.01
Maximum number of
choices 28.01 34.43 28.17
Local area characteristics
Selective LA 28.32 35.44 28.18
Non-selective LA 41.09 48.03 41.82
Above median number of
schools within 20km
31.66 37.98 32.36
Below median number of
schools within 20km
46.43 54.05 46.89
3 choices allowed 45.54 52.95 46.23
More than 3 choices
allowed 31.73 38.20 32.18
Note: See Table 1.
Source: National Pupil Database linked to national parents’ preferences data, made available by the
Department for Education.

24
Table 4: Relative %5A*-C at GCSE (standardised) of first-choice school and closest
school (if different)
P10 P25 P50 P75 P90
All 0.70 0.93 1.20 1.53 1.96
Pupil characteristics FSM 0.63 0.83 1.11 1.44 1.83
Non-FSM 0.72 0.95 1.21 1.55 1.97
EAL 0.71 0.92 1.20 1.54 1.96
Non-EAL 0.70 0.94 1.20 1.53 1.96
White British 0.69 0.93 1.19 1.52 1.95
Asian 0.73 0.96 1.24 1.60 2.04
Black 0.75 0.96 1.23 1.56 1.97
Above median SES
(neighbourhood) 0.75 0.97 1.20 1.52 1.92
Below median SES
(neighbourhood) 0.67 0.90 1.19 1.54 2.00
Local area characteristics Selective LA 0.53 0.79 1.20 1.75 2.36
Non-selective LA 0.76 0.96 1.20 1.49 1.85
Above median
number of schools
within 20km 0.72 0.93 1.19 1.51 1.90
Below median
number of schools
within 20km 0.68 0.94 1.21 1.57 2.05
3 choices allowed 0.73 0.94 1.19 1.51 1.94
More than 3
choices allowed 0.68 0.93 1.20 1.55 1.97
Note: See Table 1.
Source: National Pupil Database linked to national parents’ preferences data, made available by the
Department for Education.

25
Figure 1: Mean performance of schools, by rank of school choice offered and total
number of choices made. London only.

26
Figure 2: Offer from first-choice school, by number of schools within 20km (vigintiles)
and free school meal (FSM) status
Source: National Pupil Database linked to national parents’
preferences data, made available by the Department for
Education.

27
Figure 3: Offer from first-choice school, by number of schools within 2m (vigintiles)
and ethnic group
Source: National Pupil Database linked to national parents’ preferences data, made available by the
Department for Education.

28
Figure 4: Offer from first-choice school, by number of schools within 20km (vigintiles)
and school performance of first-choice school (measured by % 5A*-C) in quartiles
Source: National Pupil Database linked to national parents’
preferences data, made available by the Department for
Education.

29
Figure 5: First choice is closest school, by number of schools within 20km (vigintiles)
and free school meal (FSM) status
Source: National Pupil Database linked to national parents’
preferences data, made available by the Department for
Education.

30
Figure 6: First choice is closest school, by number of schools within 20km (vigintiles)
and ethnic group
Source: National Pupil Database linked to national parents’
preferences data, made available by the Department for
Education.

31
Figure 7: First choice is closest school, by number of schools within 20km (vigintiles)
and school quality of closest school (measured by % 5A*-C) in quartiles
Source: National Pupil Database linked to national parents’
preferences data, made available by the Department for
Education.

32
Figure 8: Destination after national offer day
Source: National Pupil Database linked to national parents’
preferences data, made available by the Department for
Education.

33
Appendix
Appendix Table 1: Sample size by pupil and local area characteristics
Number of observations
All 524,115
Pupil characteristics
FSM 77,563
Non-FSM 446,552
EAL 96,393
Non-EAL 427,722
White British 369,635
Asian 56,209
Black 29,547
Above median SES (neighbourhood) 260,260
Below median SES (neighbourhood) 260,256
Local area characteristics
Selective LA 87,320
Non-selective LA 436,640
Above median number of schools within 20km 264,598
Below median number of schools within 20km 259,517
3 choices allowed 275,225
More than 3 choices allowed 248,735
Note: Overall sample size is 526,329. “FSM” denotes free school meals, a binary indicator for pupil
income disadvantage. “EAL” denotes English as an additional language. “Above median SES
(neighbourhood)” denotes neighbourhood disadvantage (defined by the Income Deprivation Affecting
Children Index) is the more affluent half in the sample.29 “Selective LA” denotes a local authority (LA)
where at least 10% of pupils attend a selective school. “Above median number of schools within
20km” denotes the number of schools within 20km above the median in the sample. “3 choices
allowed” denotes the maximum number of choices parents are able to express is 3.
Source: National Pupil Database linked to national parents’ preferences data, made available by the
Department for Education.
29 Source: https://www.gov.uk/government/statistics/english-indices-of-deprivation-2015

34
Appendix Table 2: Number of choices by LA
Number of choices (%)
Local Authority of residence 1 2 3 4 5 6
All 34.55 21.58 26.89 7.94 3.18 5.86
Barking and Dagenham 12.33 18.85 24.40 12.48 6.45 25.49
Barnet 17.97 16.69 21.54 12.32 9.19 22.29
Barnsley 48.14 23.87 27.99
Bath and North East Somerset 46.77 33.76 19.47
Bedford 52.93 30.01 15.31 1.75
Bexley 8.39 16.90 24.99 17.13 9.89 22.69
Birmingham 16.80 12.39 18.70 9.78 6.98 35.35
Blackburn with Darwen 23.17 29.30 47.53
Blackpool 26.96 24.55 48.49
Bolton 27.94 19.17 52.86 0.03
Bournemouth 14.42 21.12 64.24 0.22
Bracknell Forest 21.48 19.84 58.61 0.08
Bradford 16.86 16.48 23.77 11.87 31.03
Brent 13.70 14.85 22.61 14.82 9.94 24.08
Brighton and Hove 14.20 14.74 71.06
Bristol City of 24.41 18.97 56.35 0.21 0.05
Bromley 16.95 18.19 23.53 15.01 8.40 17.92
Buckinghamshire 24.39 26.75 22.80 11.56 5.58 8.91
Bury 42.13 22.26 35.21 0.35 0.05
Calderdale 38.55 22.26 22.56 6.05 10.59
Cambridgeshire 55.15 23.98 20.85 0.02
Camden 12.12 19.90 28.38 17.66 8.13 13.81
Central Bedfordshire 76.81 18.40 4.69 0.09
Cheshire East 56.58 25.78 17.61 0.03
Cheshire West and Chester 43.33 26.47 30.17 0.03
City of London 22.22 16.67 11.11 16.67 33.33
Cornwall 77.23 17.71 5.07
Coventry 24.67 26.17 49.05 0.06 0.03 0.03
Croydon 13.30 14.61 17.85 15.17 10.82 28.24
Cumbria 47.02 23.38 29.61
Darlington 39.06 28.57 32.37
Derby 47.29 23.78 25.05 3.89
Derbyshire 46.56 21.82 31.61 0.01
Devon 64.97 21.17 13.83 0.01 0.01
Doncaster 65.36 17.98 16.66
Dorset 57.97 25.30 16.65 0.04 0.04
Dudley 26.04 40.33 22.68 5.96 2.68 2.31
Durham 65.25 20.42 14.31 0.02
Ealing 8.55 10.77 20.57 14.07 10.06 35.98
East Riding of Yorkshire 74.02 19.11 6.87
East Sussex 60.99 20.99 17.91 0.09 0.02
Enfield 8.69 10.30 20.22 15.27 11.63 33.90
Essex 28.36 23.78 20.23 11.18 5.82 10.63
Gateshead 46.89 27.45 25.67
Gloucestershire 43.85 23.15 18.04 8.37 6.59
Greenwich 12.71 15.52 21.04 14.06 9.50 27.17
Hackney 8.94 10.00 23.64 19.58 10.64 27.20
Halton 32.03 35.36 32.60
Hammersmith and Fulham 6.59 11.75 18.61 17.28 13.18 32.59
Hampshire 49.69 29.42 20.87 0.02
Haringey 11.09 13.06 21.74 17.40 9.73 26.97
Harrow 12.92 16.80 20.81 13.94 7.77 27.76
Hartlepool 28.97 23.05 47.98
Havering 14.94 20.09 26.78 14.68 7.73 15.78
Herefordshire 76.56 17.06 6.38
Hertfordshire 9.45 10.99 18.08 61.32 0.05 0.11
Hillingdon 10.63 12.43 21.22 15.86 10.32 29.54
Hounslow 9.96 12.45 20.44 12.20 8.90 36.04
Isle of Wight 45.48 35.53 18.81 0.09 0.09

35
Islington 13.06 17.16 25.66 15.22 8.66 20.25
Kensington and Chelsea 10.32 18.44 25.07 15.78 11.50 18.88
Kent 13.19 16.10 21.30 49.38 0.02 0.01
Kingston upon Hull City of 23.60 25.63 50.62 0.14
Kingston upon Thames 9.22 16.85 25.62 15.13 9.22 23.97
Kirklees 29.30 31.38 39.26 0.04 0.02
Knowsley 29.46 26.38 44.16
Lambeth 6.38 9.57 19.90 22.84 14.44 26.87
Lancashire 13.57 17.06 69.37 0.01
Leeds 34.22 27.18 25.74 6.00 6.85 0.01
Leicester 32.61 23.62 43.77
Leicestershire 67.58 23.08 9.34
Lewisham 9.01 11.66 17.66 15.25 13.86 32.57
Lincolnshire 42.70 31.52 25.76 0.01
Liverpool 31.45 18.61 49.92 0.02
Luton 25.19 19.63 55.11 0.07
Manchester 28.91 19.32 41.91 5.39 2.41 2.06
Medway 29.96 27.61 22.28 10.04 3.50 6.61
Merton 8.93 13.05 20.03 17.34 11.15 29.49
Middlesbrough 27.59 22.59 49.82
Milton Keynes 27.79 16.10 56.02 0.03 0.06
Newcastle upon Tyne 47.30 27.36 17.10 8.24
Newham 10.57 15.42 23.63 15.16 8.01 27.22
Norfolk 67.78 20.05 12.15 0.03
North East Lincolnshire 44.09 28.78 27.13
North Lincolnshire 59.28 25.21 15.51
North Somerset 54.75 25.92 19.33
North Tyneside 58.18 27.18 14.49 0.15
North Yorkshire 64.10 22.06 9.61 2.17 2.05
Northamptonshire 30.21 18.28 51.50 0.01
Northumberland 80.38 13.06 6.56
Nottingham 37.50 21.24 18.80 22.41 0.03
Nottinghamshire 50.90 25.29 12.61 11.21
Oldham 37.48 23.29 28.98 7.31 1.55 1.40
Oxfordshire 48.52 24.42 27.02 0.02 0.02
Peterborough 33.41 24.03 42.56
Plymouth 31.75 26.85 41.40
Poole 37.93 29.86 32.21
Portsmouth 42.56 29.16 28.28
Reading 18.32 27.57 23.20 30.85 0.06
Redbridge 11.39 16.34 21.02 14.40 9.54 27.32
Redcar and Cleveland 57.18 22.11 20.63 0.07
Richmond upon Thames 14.58 14.58 22.49 16.64 9.97 21.74
Rochdale 45.50 24.65 20.34 9.47 0.04
Rotherham 51.85 25.56 22.59
Rutland 47.77 33.12 19.11
Salford 57.79 23.15 13.16 4.09 0.84 0.97
Sandwell 37.33 22.28 20.18 8.23 4.99 6.98
Sefton 28.96 29.23 41.81
Sheffield 47.20 24.33 28.47
Shropshire 62.16 24.62 13.18 0.04
Slough 16.55 15.64 18.85 12.44 9.40 27.12
Solihull 37.12 24.26 19.31 6.63 12.33 0.35
Somerset 57.71 23.43 18.79 0.02 0.05
South Gloucestershire 37.47 27.28 35.25
South Tyneside 44.65 33.66 21.69
Southampton 22.67 22.91 54.38 0.05
Southend-on-Sea 28.74 20.49 23.85 10.99 15.49 0.44
Southwark 8.85 11.53 19.54 17.49 11.53 31.06
St Helens 35.36 24.80 39.84
Staffordshire 54.30 25.47 19.86 0.22 0.05 0.11
Stockport 45.21 24.73 19.60 6.15 1.79 2.53
Stockton-on-Tees 33.35 22.81 43.84
Stoke-on-Trent 36.57 23.60 39.80 0.04

36
Suffolk 48.95 30.33 20.68 0.02 0.02
Sunderland 48.10 24.15 27.71 0.04
Surrey 27.96 28.17 26.58 8.91 3.11 5.27
Sutton 9.62 13.29 20.02 17.44 12.20 27.43
Swindon 42.27 24.36 33.36
Tameside 27.40 23.21 35.65 6.75 2.36 4.63
Telford and Wrekin 22.61 23.33 23.95 27.78 2.17 0.16
Thurrock 34.74 18.60 19.69 7.19 7.53 12.25
Torbay 42.17 26.25 31.50 0.08
Tower Hamlets 8.57 17.80 32.11 16.66 7.71 17.14
Trafford 14.14 20.89 26.49 15.55 8.46 14.47
Wakefield 57.05 24.09 18.87
Walsall 36.01 23.78 19.76 8.15 12.17 0.14
Waltham Forest 16.48 18.55 27.87 13.67 6.69 16.73
Wandsworth 5.85 10.13 20.71 23.61 14.76 24.94
Warrington 25.22 27.92 46.73 0.09 0.04
Warwickshire 51.50 26.00 14.45 4.89 2.01 1.15
West Berkshire 56.60 24.57 18.46 0.18 0.12 0.06
West Sussex 22.53 17.32 60.12 0.01 0.01
Westminster 8.26 13.59 23.23 20.57 9.83 24.52
Wigan 32.27 23.72 44.01
Wiltshire 55.50 22.27 22.23
Windsor and Maidenhead 39.15 26.87 18.19 6.83 3.14 5.82
Wirral 23.80 26.03 50.17
Wokingham 22.45 21.55 27.38 28.62
Wolverhampton 30.31 25.86 22.38 8.35 13.10
Worcestershire 47.54 26.31 26.02 0.03 0.10
York 52.92 26.12 13.80 4.12 3.04

37
Appendix Table 3: Regression estimates
One school choice Maximum number of choices
Attend first choice school
Offer from first choice school
First-choice school is closest school
Quality of first choice school
(1) (2) (3) (4) (5) (6) (7) (8) (9) (10) (11) (12)
FSM 0.06*** 0.06*** -0.04*** -0.04*** 0.01*** 0.01** -0.02*** -0.03*** 0.03*** 0.03*** -4.68*** -4.60*** (0.00) (0.00) (0.01) (0.01) (0.00) (0.00) (0.00) (0.00) (0.00) (0.00) (0.30) (0.30) EAL -0.02*** -0.13*** 0.01 0.12*** -0.01* -0.11*** -0.02*** -0.11*** 0.00 -0.08*** -1.60*** 3.09*** (0.00) (0.01) (0.01) (0.01) (0.01) (0.01) (0.01) (0.01) (0.01) (0.01) (0.31) (0.44) Asian -0.15*** 0.17*** -0.13*** -0.10*** -0.10*** 7.13***
(0.01) (0.02) (0.01) (0.01) (0.01) (0.53)
Black -0.20*** 0.20*** -0.18*** -0.17*** -0.19*** 5.89***
(0.02) (0.02) (0.01) (0.01) (0.01) (0.59)
Below median SES (neighbourhood)
0.00 -0.01 0.00 0.02 -0.02*** -0.03*** -0.03*** -0.04*** -0.04*** -0.05*** -7.91*** -7.55***
(0.01) (0.01)
(0.01) (0.01)
(0.00) (0.00)
(0.00) (0.00)
(0.01) (0.01) (0.35) (0.34)
Selective LA -0.07* -0.07* 0.08 0.08 -0.03** -0.02* -0.03*** -0.02* -0.12*** -0.11*** 0.70 0.58 (0.04) (0.03) (0.06) (0.06) (0.01) (0.01) (0.01) (0.01) (0.02) (0.02) (0.82) (0.81) Above median number of schools within 20km
-0.09*** -0.10*** 0.05* 0.06* -0.03*** -0.04*** -0.03*** -0.03*** -0.09*** -0.10*** 1.24* 1.64***
(0.02)
(0.02)
(0.02)
(0.02)
(0.01)
(0.01)
(0.01)
(0.01)
(0.02)
(0.02) (0.48) (0.48) More than 3 choices allowed
-0.11*** -0.13*** -0.19*** -0.17*** -0.06*** -0.08*** -0.05*** -0.06*** -0.03 -0.04* 1.71** 2.20*** (0.03) (0.03) (0.04) (0.04) (0.01) (0.01) (0.01) (0.01) (0.02) (0.02) (0.64) (0.62)
School quality in local area
0.35*** 0.35***
(0.02) (0.02)
Ethnic group excluded
N Y N Y N Y N Y N Y N Y
Number of observations 520,499 520,499 520,499 520,499 516,871 516,871 504,583 504,598 515,662 515,662 458,510 458,510

38
Appendix Table 4: Any choice is closest school
% Any choice is
closest school
% Any choice is
closest school %
(within 20%
tolerance)
% Any choice is
closest school in LA
All 55.08 62.85 56.01
Pupil characteristics FSM 52.40 60.24 53.30
Non-FSM 55.54 63.31 56.47
EAL 46.85 54.79 47.72
Non-EAL 56.94 64.68 57.88
White British 58.78 66.56 59.74
Asian 48.71 57.19 49.24
Black 36.96 44.07 37.95
Above median SES
(neighbourhood) 60.22 68.09 61.32
Below median SES
(neighbourhood) 50.02 57.69 50.77
One choice 55.43 62.89 56.53
Two choices 58.26 66.02 59.23
Three choices 56.33 64.37 57.00
At least four choices 48.36 56.35 49.26
Maximum number of
choices 55.40 63.45 55.97
Local area characteristics
Selective LA 46.13 55.10 46.21
Non-selective LA 56.86 64.39 57.95
Above median number of
schools within 20km
49.39 57.03 50.63
Below median number of
schools within 20km
60.87 68.78 61.47
3 choices allowed 59.17 66.84 60.03
More than 3 choices
allowed 50.56 58.45 51.55
Note: See Table 1.
Source: National Pupil Database linked to national parents’ preferences data, made available by the
Department for Education.

39
Appendix Figure 1: Maximum number of choices possible
Note: Borders shown are local authority (LA) boundaries.
Source: National Pupil Database linked to national parents’
preferences data, made available by the Department for
Education.

40
Appendix Figure 2: Offer from first-choice school, by number of schools within 20km
(vigintiles) and English as an Additional Language (EAL) status
Source: National Pupil Database linked to national parents’
preferences data, made available by the Department for
Education.
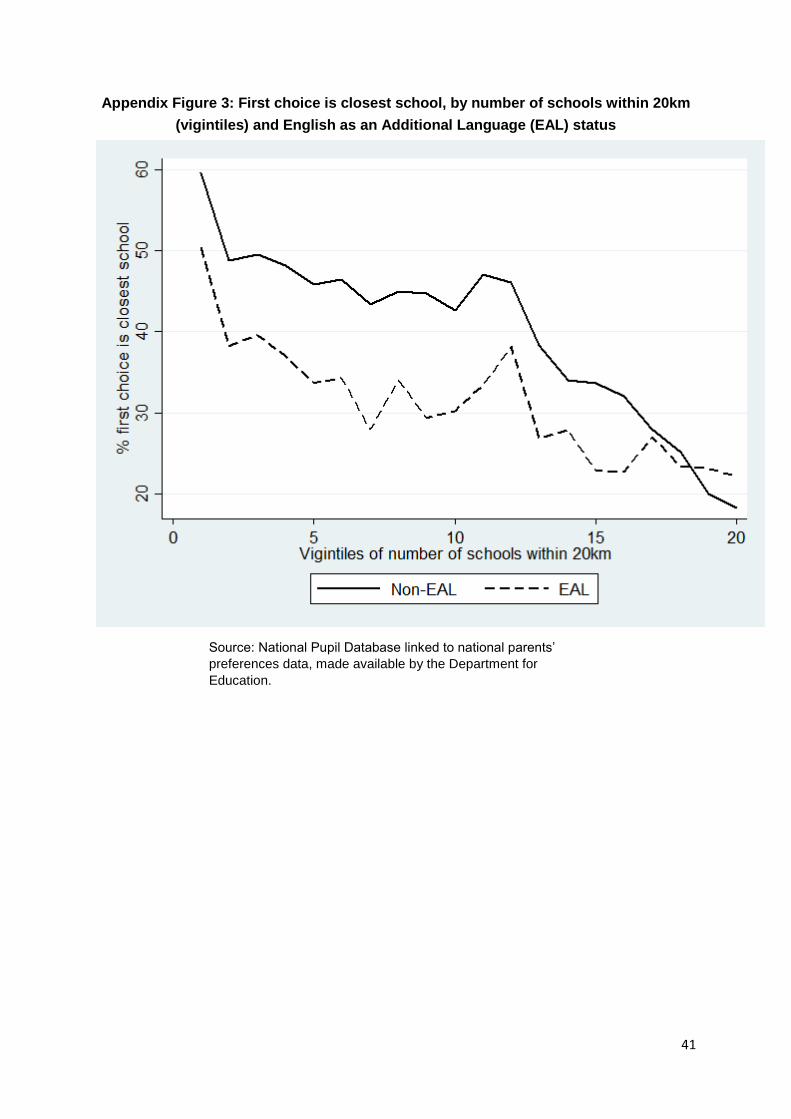
41
Appendix Figure 3: First choice is closest school, by number of schools within 20km
(vigintiles) and English as an Additional Language (EAL) status
Source: National Pupil Database linked to national parents’
preferences data, made available by the Department for
Education.