UNDERSTANDING our VISITORS
24
UNDERSTANDING our VISITORS Multi-Institutional Science Center Study JULY 2017–JUNE 2018
Transcript of UNDERSTANDING our VISITORS
1
t
UNDERSTANDING our VISITORSMulti-Institutional Science Center StudyJULY 2017ndashJUNE 2018
This project was made possible in part by the Institute of Museum and Library Services
(MG-20-14-0060-14)
Report designed by
COVES was established as a grant-funded project in
October 2014 through the generous support of the Institute
for Museum and Library Services and the project became
an independent membership-supported entity in October 2018
As of October 2018 the collaboration includes 22 science
centers in the United States and Canada
copy 2018 Collaboration for Ongoing Visitor Experience Studies
3
IN THIS REPORT
5 | WHAT IS COVES
6 | PARTICIPANTS
8 | DATA COLLECTION PILOT
9 | SAMPLE SIZE
10 | WHY ARE THE DATA INTERESTING
11 | HOW TO READ AND INTERPRET THE GRAPHS IN THIS REPORT
12 | AGGREGATE DATA OVERVIEW
12 | WHO VISITS
14 | WHY THEY VISIT
15 | HOW THEY RATE THEIR VISIT
16 | DATA DEEP DIVES
16 | MEMBERS VS NON-MEMBERS
17 | FIRST-TIME VS REPEAT VISITORS
18 | ADULT-ONLY GROUPS VS GROUPS WITH KIDS
19 | LOCAL NON-MEMBERS VS OUT-OF-TOWN NON-MEMBERS
20 | SUMMER FALL WINTER AND SPRING
21 | LARGE MEDIUM AND SMALL INSTITUTIONS
22 | GET INVOLVED WITH COVES
4
ldquoWe envision a collaborative museum community seeking to better understand and improve the visitor experiencerdquo
The COVES Governing Body represents individuals from seven museums plus the Association of Science-Technology Centers (ASTC)
5
WHAT IS COVES The Collaboration for Ongoing Visitor Experience Studies (COVES) is designed to unite science centers across the country to systematically collect analyze and report on visitor experience data
We envision a collaborative museum community seeking to better understand and improve the visitor experience We believe that studying the visitor experience in science centersmdashwho visits a particular museum why they visit what they experience during their visit and how they react to different aspects of their experiencemdashcan help organizations learn about their visitors make evidence-based decisions about services and programming and respond to challenges interests and concerns in a visitor-centered manner This report represents the first presentation of our aggregate data and findings to the science center field It contains data collected between July 2017 and June 2018 in multiple science centers in the United State and Canada
WHO ARE THEY
HOW DO THEY REACT
WHY DO THEY VISIT
WHAT DO THEY EXPERIENCE
SCIENCE CENTER VISITORS
COVES collects analyzes and reports data about science center visitors
Participating intitutions can make evidence-based
decisions
Aggregate data (shown in this report) can inform the museum
field as a whole
6
LARGE INSTITUTIONSCOSI | Columbus OH
Exploratorium | San Francisco CA
The Franklin Institute | Philadelphia PA
Museum of Science | Boston MA
Saint Louis Science Center | St Louis MO
Science Museum of Minnesota | St Paul MN
Science World British Columbia | Vancouver BC Canada
MEDIUM INSTITUTIONS The DoSeum | San Antonio TX
EcoTarium | Worcester MA
Great Lakes Science Center | Cleveland OH
Maryland Science Center | Baltimore MD
New York Hall of Science | New York NY
SMALL INSTITUTIONSAmazeum | Bentonville AR
Bradbury Science Museum | Los Alamos NM
Discovery Center of Idaho | Boise ID
Discovery Center Museum | Rockford IL
Lancaster Science Factory | Lancaster PA
Pensacola MESS Hall | Pensacola Florida
Terry Lee Wells Nevada Discovery Museum | Reno NV
JULY 2017-JUNE 2018 PARTICIPANTS Data from the following institutions are included in this report
COVES uses several factors to categorize institutional size including annual attendance total interior exhibit space and annual operating income
This report includes visitor data from 19 different institutions
7
8
DATA COLLECTION PILOTTo standardize the data collection protocol COVES used part of its first year as a pilot period Between October 1 2015 and March 21 2016 the initial eight COVES institutions piloted three data collection techniques using identical data collection instruments an onsite survey method an emailed survey method and an interview method
To ensure that the methods were feasible across sites we assigned the data collection methods across different sized institutions Two institutions (one large and one small) did all three data collection methods
As a result of the pilot testing COVES institutions collect data using an electronic onsite exit survey Groups complete the survey onsite at the completion of their time in the museum All COVES sites use this method Prior to starting COVES data collection participating sites used a variety of different data collection methods and it was critical to settle on one method
VISITOR RESPONSE RATE
TIME SPENT TO GET A COMPLETED SURVEY
At the end of the pilot the onsite survey emerged as the most efficient method with both the highest response rate and lowest amount of time spent to collect a completed response
ONSITE SURVEY ONLINE SURVEYIN-PERSON INTERVIEW
62+51+10 14+17+21 14 min62
51
10
17 min
21 min
MET
HO
DS
PILO
TED
RESU
LTS
onsite survey
in-person interview
online survey
onsite survey
in-person interview
online survey
CHOSEN METHOD
9
SURV
EY S
TATS
SAMPLE SIZEThe COVES reporting cycle follows a July to June Fiscal Year (FY) structure This report includes data from FY18 or July 2017 to June 2018 In FY18 COVES sites collected 13335 surveys much higher than the FY17 total of 5857 surveys This is for two reasons first the COVES Research Team raised sample size targets for all institutions in FY18 and second the number of participating institutions increased from 13 to 19
The COVES Research Team sets yearly sample size targets for small (about 500 responses) medium (about 850 responses) and large institutions (about 1400 responses) The Research Team then uses general public attendance data from participants to establish proportional sampling by month For example most participants collect the highest number of surveys in July when many science centers get the highest number of visitors and the lowest number in September when visitation tends to drop
In FY18 actual institutional sample sizes ranged from 145 to 1508 Differences between target and actual sample sizes are largely due to several institutions joining halfway through the year along with data collection difficulties To account for the differences in sample sizes across institutions and avoid over-representing large institutions statistical weights were applied to the data prior to analysis
THE AVERAGE RESPONSE RATE ACROSS SITES
NUMBER OF SURVEYS COLLECTED
THE AVERAGE SURVEY DURATION
FY17 FY18
Ranging from 33 and 96
13335
5857
413 minsec
61 avg rate
10
WHY ARE THE DATA INTERESTINGThese data represent a collaborative ongoing multi-institutional science center visitor study Because the data were collected using a common method and survey instrument they can be combinedmdashor aggregatedmdashtogether The resulting aggregate data can help us learn more about visitors not just at one science center but across several different science centers Although many science centers collect visitor experience data this ongoing collaboration is the first of its kind in our field
The aggregate data are not representative of any individual institution but instead represent the group as a whole This obscures individual differences between institutions but provides insight into broad trends in science center visitors Although this group is not representative of the science center field as a whole the institutions included here are diverse in size and location within North America
Pages 12ndash15 provide a comprehensive basic overview of the data while pages 16-22 describe trends and comparisons between different sub-groups such as members or first-time visitors These comparisons are descriptive in nature and do not present statistical findings from inferential analyses
AS YOU REVIEW THESE DATA CONSIDER THE FOLLOWING QUESTIONS
ɠ Are any of these findings surprising
ɠ Do any of these findings confirm assumptions or expectations
ɠ If you work at a museum that is not part of COVES how do you think your institutionrsquos data would compare to the aggregate data in this report
ɠ What do these data suggest about trends among science center visitors
ɠ What types of actions might we take as a field based on these data
ɠ What further questions arise after seeing these data
11
HOW TO READ AND INTERPRET THE GRAPHS IN THIS REPORT
OVERALL EXPERIENCE RATING (OER)
ldquoPlease rate your overall experience at [Institution Name] todayrdquo
NET PROMOTER SCORE (NPS)ldquoOn a scale from 0 to 10 how likely are you to recommend [Institution Name] to a friend or colleaguerdquo
SUPERIOR
EXCELLENT
GOOD 52
9
37
Net promoter scores from different institutions are presented on the blue pages (pages 16ndash22) on these vertical scales Each dot represents an institutionrsquos NPS
This dark gray circle represents the average NPS across institutions
Net Promoter Score is calculated by subtracting the percentage of ldquoDetractorsrdquo (ratings of 0-6) from the percentage of ldquoPromotersrdquo (ratings of 9-10) In this example 757ndash46=711 The net score has a possible range of -100
Each colored bar represents the average percentage of visitors across institutions who selected that rating (ie ldquoSuperiorrdquo)
ldquoFairrdquo and ldquoPoorrdquo are additional response options on the OER scale but are not displayed because they represent such small percentages (less than 2 combined)
The NPS scale goes from -100 to 100 but we are representing a truncated version The scale on each blue page is the same so they can be compared
40
50
60
70
80
90
100
-100
76+20+5Promoters (9-10)
Passives (7-8)
Detractors (0-6)
711-100 100
0
757
196
46
711
12
GROUP DEMOGRAPHICSThe COVES protocol involves selecting one adult from a visitor group to be the primary respondent but the survey asks for some information that describes the entire visiting group This information is summarized below
AVERAGE GROUP SIZEn=11601 (adults) n=11480 (children)
GROUP COMPOSITIONn=11601 (adults) n=11480 (children)
ADULT AGE AND GENDER BREAKDOWNS n=11786
CHILD AGE AND GENDER BREAKDOWNSn=11786
PERMANENT OR TEMPORARY DISABILITY n=11468
RESIDENCE OF GROUPn=11044
11+28+32+20+9 38+59+3+1
3150+10+104234
21+29+3011+923+38+32+8 51+471 8+87+5
55+28+18Avg number of adults
Avg number of children
1 Adult
2 Adults
3 Adults
4+ Adults
0ndash3
4ndash7
8ndash12
13ndash17
Male
Female
Prefer not to say
Another category
Yes
No
Prefer not to say
0 Children
1 Child
2 Children
3 Children
4+ Children
31
21
17
11 38
28 59
32 3
20 1
9
21
2351
47
8
87
1
lt1
5
38
32
8
55
28
18
29
30
11
9
50
10
10
18-24
25-34
35-44
45-64
65+
Male
Female
Prefer not to say
Another category
Locals-only
Out-of-towners only
Mixed group
WH
O V
ISIT
S
13 13
Some HS
HS
Some college
College
Some grad
Grad
Prefer not to say
INDIVIDUAL RESPONDENT DEMOGRAPHICSThe survey also asks for some information from the primary respondent only This information is summarized below
MEMBERSHIPn=11497
NUMBER OF VISITS IN THE LAST YEARn=10314
EDUCATIONn=11600
RACEETHNICITYn=11430
LGBT+ IDENTIFICATIONn=11471
US RESIDENCEn=11066
HOUSEHOLD INCOMEn=11431
DATE OF LAST VISITn=1154030+70
56+29+15
96+45+87+1+7
1+6+15+36+5+32+35+11+13+12+17+8+4+2+3+24
21+11+8+10+7+5+6+33+165+7+6+5+1+0+8+7+2
Members
Non-members
Within the past 3 months
3-6 months ago
6 months-1 year
1-2 years ago
2-5 years ago
5-10 years ago
10+ years ago
Never
Not sure
30
56
22
11
8
9
6
4
5
33
65
96
5
87
1
7
4
6
6
5
1
lt1
8
7
2
1
1
6
16
37
5
3
31
5
12
14
12
17
8
4
3
24
2
29
15
70
1st visit
2-4
5+
Under $25000
$25000ndash$49999
$50000ndash$74999
$75000ndash$99999
$100000ndash$149999
$150000ndash$199999
$200000ndash$249999
$250000ndash$300000
More than $300000
Prefer not to sayNot sure
White
Asian
HispanicLatinx
BlackAfrican American
Amer Indian or Alaskan Native
Native HawaiianPacific Islander
Multiple races identified
Prefer not to say
Other
Yes
No
Not sure
Prefer not to say
$
Yes
No
WH
O V
ISIT
S
14
6+27+32+19+10+4+138+25+17+14+10+10++8+8+7+6+5To spend time together as a group or family
For funentertainment for group
For an educational experience for group
Something to do while visiting the area
For funentertainment for myself
To see a specific exhibit program or show
Because thatrsquos what good parents do
To bring out of town friendsfamily
For an educational experience for myself
Wanted something to do in poor weather
Had a couponfree pass
MOTIVATIONSn=11786
LENGTH OF STAY
lt1 hour
1-2 hrs
2-3 hrs
3-4 hrs
4-5 hrs
5-6 hrs
6+ hrs
WH
Y T
HE
Y V
ISIT
38
25
17
14
10
10
8
8
7
6
5
6
27
32
19
10
4
1
Avg stay time was 2 hours and
40 minutes
240
STAY TIMEn=11455
Visitors may have several reasons for deciding to come to a science center or museum In the COVES survey they select the two most important reasons for visiting from the list below which displays in a random order
15 15
92+90+89+89+88+87+8783
76+20+5
NET PROMOTER SCORE amp EXPERIENCE RATINGSTwo commonly-used metrics in the science centers are Net Promoter Score and Overall Experience Rating Overall Experience Rating is a direct experience rating while Net Promoter Score asks how likely the respondent is to recommend the institution The COVES survey also asks respondents to rate their agreement with eight statements about specific aspects of the visit
905
894
873
874
919
888
828
882
EXPERIENCE RATINGSAverage rating scale from 0 to 10 where 10 is highest n varies
NET PROMOTER SCORE n=11631
OVERALL EXPERIENCE RATINGn=7088
NET PROMOTER SCORE RANGE ACROSS INSTITUTIONS
Promoters
Passives
Detractors
757
196
46
50
60
70
80
90
100
-100
SUPERIOR
EXCELLENT
GOOD
FAIR
POOR
53
13
537
984
42141
14
13
2
32Staff member helpfulness
Education experience
Entertainment experience
Restroom cleanliness
Gift shop experience
Exhibits in working order
Value for cost
Cafeacuterestaurant experience
Of the promoters this is the breakdown of their Overall Experience Rating (left to right good excellent superior)
Of those who rated their experience ldquosuperiorrdquo here is the breakdown of their NPS
PROMOTERPASSIVE
711-100 100
0
HO
W T
HE
Y R
AT
E T
HE
IR V
ISIT
711
0
10
20
30
40
50
60
70
80
90
100
-100
16
NPS
Museum members have strong connections with their home institution As seen below 86 of members report visiting multiple times in the last 12 months (compared with only 23 of non-members) with 43 visiting 5 or more times These visitors also rate their experience more positively across the board including NPS OER and all experience ratings
WHY IT MATTERS Members are an integral part of museum audiences They visit often and rate the museum experience highly In fact member and non-member differences are so strong that they influence the differences between other groups such as locals vs out-of-town visitors
DATE OF LAST VISITn=3404 n=7938
OVERALL EXPERIENCE RATINGn=1378 n=4811
NUMBER OF VISITS IN THE LAST YEARn=3152 n=6988
EXPERIENCE RATINGSAverage rating scale from 0 to 10 where 10 is highest
n varies59+7 19+8 8+9
92+90+ 92+89+ 91+86 89+87 93+91 90+88 84+82 90+8713+7544+2045+5lt3 months
3ndash6 months
6ndash12 months
1st
2ndash4
5+
MEMBERS
NON-MEMBERS
37
30
53
53
9
15
MEMBERS (30) VS NON-MEMBERS (70)
SUPERIOR
SUPERIOR
EXCELLENT
EXCELLENT
GOOD
GOOD
59
919
43
1375
4420
5
899
916885
906857
885868
933
895
842821
902873
884
912
7
198
89
820
668
Education experience
Entertainment experience
Value for cost
Exhibits in working order
Staff member helpfulness
Restroom cleanliness
Cafeacuterestaurant experience
Gift shop experience
0
10
20
30
40
50
60
70
80
90
100
-100
17
NPS
0
10
20
30
40
50
60
70
80
90
100
-100
17
NPS
FIRST-TIME (33) VS REPEAT VISITORS (67)
While both repeat and first-time visitors come primarily to spend time with their groups first-timers more often come as something to do while visiting the area These first-time visitors also rate lower than repeat visitors on NPS and OER
WHY IT MATTERS Museums often grapple with converting first-time visitors to repeat visitors members and donors but it is important to acknowledge that this is unlikely for out-of-town groups Distinguishing between different types of first-time visitors is critical to understanding how to encourage repeat visitation
RESIDENCE OF GROUPn=3612 n=7432
OVERALL EXPERIENCE RATING n=2309 n=3154
MOTIVATIONSn=3853 n=79322768 5315 2017
3141 287Locals-only
Out-of-towners only
Mixed group
Spend time together
Something to do while visiting the area
FIRST-TIME VISITORS
REPEAT VISITORS
33
54
12
SUPERIOR
SUPERIOR
EXCELLENT
EXCELLENT
GOOD
GOOD
52
15
31
2731
6841
5328
157
2017
641
745
0
10
20
30
40
50
60
70
80
90
100
-100
18
NPS
ADULT-ONLY GROUPS (21) VS GROUPS WITH KIDS (79)
ADULT ONLY GROUPS
GROUPS WITH KIDS
SUPERIOR
SUPERIOR
EXCELLENT
EXCELLENT
GOOD
GOOD
51
54
16
12
30
33
OVERALL EXPERIENCE RATINGn=1582 n=5505
ADULT AGEn=3660 n=12242
DATE OF LAST VISITn=2480 n=9061
INCOMEn=2434 n=8997
LGBT+n=2455 n=9015
608
740
Approximately one-fifth of visiting groups are composed solely of adults and though the phrase ldquoadult-only museum visitor groupsrdquo might make some think of older adults more than one-quarter of them are under the age of 25 Roughly half of these groups are first-time visitors and almost one-tenth identify as LGBT+
WHY IT MATTERS For institutions that donrsquot consider themselves childrenrsquos museums recognizing adult audiences is important as they bring a younger adult age group with less disposable income (24 households under $50Kyear compared with 15 for groups with kids) who come largely for personal entertainment reasons (28 compared with 5 for groups with kids) These groups however rate their experiences lower than visitors with children
28+5+28+29+9+39+21+2014+79+4 49+29
14+4+13+11+12+14+10+13+12+18+5+8+8+9+2922
18ndash24
25ndash34
35ndash44
45ndash64
65+
Yes Never visited
Under $25000
$25000ndash$49999
$50000ndash$74999
$75000ndash$99999
$100000ndash$149999
$150000ndash$199999
More than $200000
Prefer not to say not sure
285
2829
4
399
2120
147
9 49
11
1311
1214
1013
12
58
8
2922
9
18
29
4
0
10
20
30
40
50
60
70
80
90
100
-100
19
NPS
0
10
20
30
40
50
60
70
80
90
100
-100
19
NPS
7+5 67+27+6789+91 84+88 86+87 90+92 8890
LOCAL NON-MEMBERS (44)
VS OUT-OF-TOWN NON-MEMBERS (36)
LOCALS
OUT-OF-TOWNERS
SUPERIOR
SUPERIOR
EXCELLENT
EXCELLENT
GOOD
GOOD536
326
MOTIVATIONSn=3352 n=2737
EXPERIENCE RATINGSAverage rating scale from 0 to 10 where 10 is highest n varies
DATE OF LAST VISITn=3309 n=2692
OVERALL EXPERIENCE RATINGn=2055 n=1601
32
16
53
53
Education experience
Value for cost
Exhibits in working order
Staff member helpfulness
Restrooms cleanliness
lt 3 months
3-6 mos
6-12 mos
67
2767
893907
842875
863874
906920
875896
14
29
Since members are much more likely to be local members are excluded from analyses on this page to highlight differences that are unique to non-member locals and out-of-towners Almost half of all non-member visitors report coming in locals-only groups (ie not bringing out-of-town guests with them) and consistent with the overall aggregate data tend to come to spend time with their group While out-of-town-only non-member groups come instead as something to do while visiting the area these out-of-towners also rate their experiences slightly higher than the locals
WHY IT MATTERS Removing members (and their higher ratings) from the analyses shows that out-of-town-only groups rate their experience more highly than local-only groups Together with the analysis of first-time and repeat visitors this suggests that there is the most room to improve in serving local first-time visitors
659 664
4130 4+35 11+2 12+2 12+4Spend time together
Something to do while visiting the area
41 11 752
12
12
2
4
435
305-10 yrs
10+ yrs
Never
-100
NPS
20
0
10
20
30
40
50
60
70
80
90
100
-100
SUMMER (JULndashSEP) FALL (OCTndashDEC)
WINTER (JANndashMAR) AND SPRING (APRndashJUN)
SUPERIOR
SUPERIOR
SUPERIOR
EXCELLENT
EXCELLENT
EXCELLENT
GOOD
GOOD
GOOD
36
31
32
50
54
53
FALL AUDIENCES | n=898
WINTER AUDIENCES | n=3306
SPRING AUDIENCES | n=2883
OVERALL EXPERIENCE RATING EXPERIENCE RATINGSAverage rating scale from 0 to 10 where 10 is highest n varies
896897893891
873885869864
881884866867
929929910910
One advantage of the ongoing nature of COVES is the ability to compare ratings over time In this yearrsquos COVES data experience ratings appear to be highest in the Fall quarter (from Oct to Dec 2017)
WHY IT MATTERS Museum visitation varies by season with many museums busier in the summer months than the fall as school goes back into session Some museums also bring temporary exhibitions throughout the year These and other factors can influence experience ratings at any given time in the year
90+90+89+89 87+89+87+86 88+88+87+87 93+93+91+91
Entertainment experience
Value for cost
Exhibits in working order
Staff member helpfulness
Summer data not included because the question was not added until Oct 2017
20
722 718702
13
13
14
703
0
10
20
30
40
50
60
70
80
90
100
-100
21
NPS NPS
21-100
0
10
20
30
40
50
60
80
90
100
70
LARGE MEDIUM AND SMALL INSTITUTIONS
Education experience
Entertainment experience
Value for cost
Exhibits in working order
Staff member helpfulness
The 2017-18 COVES cohort contained institutions of vastly different sizes with yearly visitation ranging from under 10000 visitors to over 1 million visitors Visitors to the smallest museums tend to give higher experience ratings The trend is especially clear in ratings for staff helpfulness and the value of the experience relative to the cost
WHY IT MATTERS Small and very small museums represent a higher proportion of the Association of Science-Technology Centers (ASTC) membership than medium and large museums Though large museums are often working with more resources small museums provide high quality visitor experiences
90+90+91 90+88+89+ 85+86+90+ 87+85+89 90+91+94
SUPERIOR
SUPERIOR
SUPERIOR
EXCELLENT
EXCELLENT
EXCELLENT
GOOD
GOOD
GOOD
LARGE INSTITUTIONS | n=3069
MEDIUM INSTITUTIONS | n=1818
SMALL INSTITUTIONS | n=2201
OVERALL EXPERIENCE RATING
32
906896910
898887894
852863901
874852889
906914934
EXPERIENCE RATINGSAverage rating scale from 0 to 10 where 10 is highest n varies
713
18
14
33
53
12
53
14
32
54
686
728
22
GET INVOLVED IN COVESDo you want to see data from your institution represented in COVES We are always looking for new participants As more institutions join our field-wide dataset becomes more representative As of October 2018 we have 22 science centers participating in COVES
If you are interested in joining our collaboration or just want to learn more please contact us at infounderstandingvisitorsorg or visit our website at wwwunderstandingvisitorsorg Currently any Association of Science-Technology Centers (ASTC) member in good standing is eligible to join but we encourage people from all types of museums to contact us
Bradbury Science Museum
Center of Science and Industry (COSI)
Discovery Center Museum
Discovery Place Science
EcoTarium
Exploratorium
Great Lakes Science Center
Imagination Station
Museum of Discovery and Science
Museum of Science Boston
Natural History Museum of Utah
New York Hall of Science
Oregon Museum of Science and Industry
Orlando Science Center
Roseville Utility Exploration Center
Saint Louis Science Center
Science Center of Iowa
Science Museum of Minnesota
Science World British Columbia
Terry Lee Wells Nevada Museum of Discovery
The DoSeum
The Franklin Institute
SCIENCE CENTERS PARTICIPATING IN COVES AS OF OCTOBER 2018
understandingvisitorsorg
3
IN THIS REPORT
5 | WHAT IS COVES
6 | PARTICIPANTS
8 | DATA COLLECTION PILOT
9 | SAMPLE SIZE
10 | WHY ARE THE DATA INTERESTING
11 | HOW TO READ AND INTERPRET THE GRAPHS IN THIS REPORT
12 | AGGREGATE DATA OVERVIEW
12 | WHO VISITS
14 | WHY THEY VISIT
15 | HOW THEY RATE THEIR VISIT
16 | DATA DEEP DIVES
16 | MEMBERS VS NON-MEMBERS
17 | FIRST-TIME VS REPEAT VISITORS
18 | ADULT-ONLY GROUPS VS GROUPS WITH KIDS
19 | LOCAL NON-MEMBERS VS OUT-OF-TOWN NON-MEMBERS
20 | SUMMER FALL WINTER AND SPRING
21 | LARGE MEDIUM AND SMALL INSTITUTIONS
22 | GET INVOLVED WITH COVES
4
ldquoWe envision a collaborative museum community seeking to better understand and improve the visitor experiencerdquo
The COVES Governing Body represents individuals from seven museums plus the Association of Science-Technology Centers (ASTC)
5
WHAT IS COVES The Collaboration for Ongoing Visitor Experience Studies (COVES) is designed to unite science centers across the country to systematically collect analyze and report on visitor experience data
We envision a collaborative museum community seeking to better understand and improve the visitor experience We believe that studying the visitor experience in science centersmdashwho visits a particular museum why they visit what they experience during their visit and how they react to different aspects of their experiencemdashcan help organizations learn about their visitors make evidence-based decisions about services and programming and respond to challenges interests and concerns in a visitor-centered manner This report represents the first presentation of our aggregate data and findings to the science center field It contains data collected between July 2017 and June 2018 in multiple science centers in the United State and Canada
WHO ARE THEY
HOW DO THEY REACT
WHY DO THEY VISIT
WHAT DO THEY EXPERIENCE
SCIENCE CENTER VISITORS
COVES collects analyzes and reports data about science center visitors
Participating intitutions can make evidence-based
decisions
Aggregate data (shown in this report) can inform the museum
field as a whole
6
LARGE INSTITUTIONSCOSI | Columbus OH
Exploratorium | San Francisco CA
The Franklin Institute | Philadelphia PA
Museum of Science | Boston MA
Saint Louis Science Center | St Louis MO
Science Museum of Minnesota | St Paul MN
Science World British Columbia | Vancouver BC Canada
MEDIUM INSTITUTIONS The DoSeum | San Antonio TX
EcoTarium | Worcester MA
Great Lakes Science Center | Cleveland OH
Maryland Science Center | Baltimore MD
New York Hall of Science | New York NY
SMALL INSTITUTIONSAmazeum | Bentonville AR
Bradbury Science Museum | Los Alamos NM
Discovery Center of Idaho | Boise ID
Discovery Center Museum | Rockford IL
Lancaster Science Factory | Lancaster PA
Pensacola MESS Hall | Pensacola Florida
Terry Lee Wells Nevada Discovery Museum | Reno NV
JULY 2017-JUNE 2018 PARTICIPANTS Data from the following institutions are included in this report
COVES uses several factors to categorize institutional size including annual attendance total interior exhibit space and annual operating income
This report includes visitor data from 19 different institutions
7
8
DATA COLLECTION PILOTTo standardize the data collection protocol COVES used part of its first year as a pilot period Between October 1 2015 and March 21 2016 the initial eight COVES institutions piloted three data collection techniques using identical data collection instruments an onsite survey method an emailed survey method and an interview method
To ensure that the methods were feasible across sites we assigned the data collection methods across different sized institutions Two institutions (one large and one small) did all three data collection methods
As a result of the pilot testing COVES institutions collect data using an electronic onsite exit survey Groups complete the survey onsite at the completion of their time in the museum All COVES sites use this method Prior to starting COVES data collection participating sites used a variety of different data collection methods and it was critical to settle on one method
VISITOR RESPONSE RATE
TIME SPENT TO GET A COMPLETED SURVEY
At the end of the pilot the onsite survey emerged as the most efficient method with both the highest response rate and lowest amount of time spent to collect a completed response
ONSITE SURVEY ONLINE SURVEYIN-PERSON INTERVIEW
62+51+10 14+17+21 14 min62
51
10
17 min
21 min
MET
HO
DS
PILO
TED
RESU
LTS
onsite survey
in-person interview
online survey
onsite survey
in-person interview
online survey
CHOSEN METHOD
9
SURV
EY S
TATS
SAMPLE SIZEThe COVES reporting cycle follows a July to June Fiscal Year (FY) structure This report includes data from FY18 or July 2017 to June 2018 In FY18 COVES sites collected 13335 surveys much higher than the FY17 total of 5857 surveys This is for two reasons first the COVES Research Team raised sample size targets for all institutions in FY18 and second the number of participating institutions increased from 13 to 19
The COVES Research Team sets yearly sample size targets for small (about 500 responses) medium (about 850 responses) and large institutions (about 1400 responses) The Research Team then uses general public attendance data from participants to establish proportional sampling by month For example most participants collect the highest number of surveys in July when many science centers get the highest number of visitors and the lowest number in September when visitation tends to drop
In FY18 actual institutional sample sizes ranged from 145 to 1508 Differences between target and actual sample sizes are largely due to several institutions joining halfway through the year along with data collection difficulties To account for the differences in sample sizes across institutions and avoid over-representing large institutions statistical weights were applied to the data prior to analysis
THE AVERAGE RESPONSE RATE ACROSS SITES
NUMBER OF SURVEYS COLLECTED
THE AVERAGE SURVEY DURATION
FY17 FY18
Ranging from 33 and 96
13335
5857
413 minsec
61 avg rate
10
WHY ARE THE DATA INTERESTINGThese data represent a collaborative ongoing multi-institutional science center visitor study Because the data were collected using a common method and survey instrument they can be combinedmdashor aggregatedmdashtogether The resulting aggregate data can help us learn more about visitors not just at one science center but across several different science centers Although many science centers collect visitor experience data this ongoing collaboration is the first of its kind in our field
The aggregate data are not representative of any individual institution but instead represent the group as a whole This obscures individual differences between institutions but provides insight into broad trends in science center visitors Although this group is not representative of the science center field as a whole the institutions included here are diverse in size and location within North America
Pages 12ndash15 provide a comprehensive basic overview of the data while pages 16-22 describe trends and comparisons between different sub-groups such as members or first-time visitors These comparisons are descriptive in nature and do not present statistical findings from inferential analyses
AS YOU REVIEW THESE DATA CONSIDER THE FOLLOWING QUESTIONS
ɠ Are any of these findings surprising
ɠ Do any of these findings confirm assumptions or expectations
ɠ If you work at a museum that is not part of COVES how do you think your institutionrsquos data would compare to the aggregate data in this report
ɠ What do these data suggest about trends among science center visitors
ɠ What types of actions might we take as a field based on these data
ɠ What further questions arise after seeing these data
11
HOW TO READ AND INTERPRET THE GRAPHS IN THIS REPORT
OVERALL EXPERIENCE RATING (OER)
ldquoPlease rate your overall experience at [Institution Name] todayrdquo
NET PROMOTER SCORE (NPS)ldquoOn a scale from 0 to 10 how likely are you to recommend [Institution Name] to a friend or colleaguerdquo
SUPERIOR
EXCELLENT
GOOD 52
9
37
Net promoter scores from different institutions are presented on the blue pages (pages 16ndash22) on these vertical scales Each dot represents an institutionrsquos NPS
This dark gray circle represents the average NPS across institutions
Net Promoter Score is calculated by subtracting the percentage of ldquoDetractorsrdquo (ratings of 0-6) from the percentage of ldquoPromotersrdquo (ratings of 9-10) In this example 757ndash46=711 The net score has a possible range of -100
Each colored bar represents the average percentage of visitors across institutions who selected that rating (ie ldquoSuperiorrdquo)
ldquoFairrdquo and ldquoPoorrdquo are additional response options on the OER scale but are not displayed because they represent such small percentages (less than 2 combined)
The NPS scale goes from -100 to 100 but we are representing a truncated version The scale on each blue page is the same so they can be compared
40
50
60
70
80
90
100
-100
76+20+5Promoters (9-10)
Passives (7-8)
Detractors (0-6)
711-100 100
0
757
196
46
711
12
GROUP DEMOGRAPHICSThe COVES protocol involves selecting one adult from a visitor group to be the primary respondent but the survey asks for some information that describes the entire visiting group This information is summarized below
AVERAGE GROUP SIZEn=11601 (adults) n=11480 (children)
GROUP COMPOSITIONn=11601 (adults) n=11480 (children)
ADULT AGE AND GENDER BREAKDOWNS n=11786
CHILD AGE AND GENDER BREAKDOWNSn=11786
PERMANENT OR TEMPORARY DISABILITY n=11468
RESIDENCE OF GROUPn=11044
11+28+32+20+9 38+59+3+1
3150+10+104234
21+29+3011+923+38+32+8 51+471 8+87+5
55+28+18Avg number of adults
Avg number of children
1 Adult
2 Adults
3 Adults
4+ Adults
0ndash3
4ndash7
8ndash12
13ndash17
Male
Female
Prefer not to say
Another category
Yes
No
Prefer not to say
0 Children
1 Child
2 Children
3 Children
4+ Children
31
21
17
11 38
28 59
32 3
20 1
9
21
2351
47
8
87
1
lt1
5
38
32
8
55
28
18
29
30
11
9
50
10
10
18-24
25-34
35-44
45-64
65+
Male
Female
Prefer not to say
Another category
Locals-only
Out-of-towners only
Mixed group
WH
O V
ISIT
S
13 13
Some HS
HS
Some college
College
Some grad
Grad
Prefer not to say
INDIVIDUAL RESPONDENT DEMOGRAPHICSThe survey also asks for some information from the primary respondent only This information is summarized below
MEMBERSHIPn=11497
NUMBER OF VISITS IN THE LAST YEARn=10314
EDUCATIONn=11600
RACEETHNICITYn=11430
LGBT+ IDENTIFICATIONn=11471
US RESIDENCEn=11066
HOUSEHOLD INCOMEn=11431
DATE OF LAST VISITn=1154030+70
56+29+15
96+45+87+1+7
1+6+15+36+5+32+35+11+13+12+17+8+4+2+3+24
21+11+8+10+7+5+6+33+165+7+6+5+1+0+8+7+2
Members
Non-members
Within the past 3 months
3-6 months ago
6 months-1 year
1-2 years ago
2-5 years ago
5-10 years ago
10+ years ago
Never
Not sure
30
56
22
11
8
9
6
4
5
33
65
96
5
87
1
7
4
6
6
5
1
lt1
8
7
2
1
1
6
16
37
5
3
31
5
12
14
12
17
8
4
3
24
2
29
15
70
1st visit
2-4
5+
Under $25000
$25000ndash$49999
$50000ndash$74999
$75000ndash$99999
$100000ndash$149999
$150000ndash$199999
$200000ndash$249999
$250000ndash$300000
More than $300000
Prefer not to sayNot sure
White
Asian
HispanicLatinx
BlackAfrican American
Amer Indian or Alaskan Native
Native HawaiianPacific Islander
Multiple races identified
Prefer not to say
Other
Yes
No
Not sure
Prefer not to say
$
Yes
No
WH
O V
ISIT
S
14
6+27+32+19+10+4+138+25+17+14+10+10++8+8+7+6+5To spend time together as a group or family
For funentertainment for group
For an educational experience for group
Something to do while visiting the area
For funentertainment for myself
To see a specific exhibit program or show
Because thatrsquos what good parents do
To bring out of town friendsfamily
For an educational experience for myself
Wanted something to do in poor weather
Had a couponfree pass
MOTIVATIONSn=11786
LENGTH OF STAY
lt1 hour
1-2 hrs
2-3 hrs
3-4 hrs
4-5 hrs
5-6 hrs
6+ hrs
WH
Y T
HE
Y V
ISIT
38
25
17
14
10
10
8
8
7
6
5
6
27
32
19
10
4
1
Avg stay time was 2 hours and
40 minutes
240
STAY TIMEn=11455
Visitors may have several reasons for deciding to come to a science center or museum In the COVES survey they select the two most important reasons for visiting from the list below which displays in a random order
15 15
92+90+89+89+88+87+8783
76+20+5
NET PROMOTER SCORE amp EXPERIENCE RATINGSTwo commonly-used metrics in the science centers are Net Promoter Score and Overall Experience Rating Overall Experience Rating is a direct experience rating while Net Promoter Score asks how likely the respondent is to recommend the institution The COVES survey also asks respondents to rate their agreement with eight statements about specific aspects of the visit
905
894
873
874
919
888
828
882
EXPERIENCE RATINGSAverage rating scale from 0 to 10 where 10 is highest n varies
NET PROMOTER SCORE n=11631
OVERALL EXPERIENCE RATINGn=7088
NET PROMOTER SCORE RANGE ACROSS INSTITUTIONS
Promoters
Passives
Detractors
757
196
46
50
60
70
80
90
100
-100
SUPERIOR
EXCELLENT
GOOD
FAIR
POOR
53
13
537
984
42141
14
13
2
32Staff member helpfulness
Education experience
Entertainment experience
Restroom cleanliness
Gift shop experience
Exhibits in working order
Value for cost
Cafeacuterestaurant experience
Of the promoters this is the breakdown of their Overall Experience Rating (left to right good excellent superior)
Of those who rated their experience ldquosuperiorrdquo here is the breakdown of their NPS
PROMOTERPASSIVE
711-100 100
0
HO
W T
HE
Y R
AT
E T
HE
IR V
ISIT
711
0
10
20
30
40
50
60
70
80
90
100
-100
16
NPS
Museum members have strong connections with their home institution As seen below 86 of members report visiting multiple times in the last 12 months (compared with only 23 of non-members) with 43 visiting 5 or more times These visitors also rate their experience more positively across the board including NPS OER and all experience ratings
WHY IT MATTERS Members are an integral part of museum audiences They visit often and rate the museum experience highly In fact member and non-member differences are so strong that they influence the differences between other groups such as locals vs out-of-town visitors
DATE OF LAST VISITn=3404 n=7938
OVERALL EXPERIENCE RATINGn=1378 n=4811
NUMBER OF VISITS IN THE LAST YEARn=3152 n=6988
EXPERIENCE RATINGSAverage rating scale from 0 to 10 where 10 is highest
n varies59+7 19+8 8+9
92+90+ 92+89+ 91+86 89+87 93+91 90+88 84+82 90+8713+7544+2045+5lt3 months
3ndash6 months
6ndash12 months
1st
2ndash4
5+
MEMBERS
NON-MEMBERS
37
30
53
53
9
15
MEMBERS (30) VS NON-MEMBERS (70)
SUPERIOR
SUPERIOR
EXCELLENT
EXCELLENT
GOOD
GOOD
59
919
43
1375
4420
5
899
916885
906857
885868
933
895
842821
902873
884
912
7
198
89
820
668
Education experience
Entertainment experience
Value for cost
Exhibits in working order
Staff member helpfulness
Restroom cleanliness
Cafeacuterestaurant experience
Gift shop experience
0
10
20
30
40
50
60
70
80
90
100
-100
17
NPS
0
10
20
30
40
50
60
70
80
90
100
-100
17
NPS
FIRST-TIME (33) VS REPEAT VISITORS (67)
While both repeat and first-time visitors come primarily to spend time with their groups first-timers more often come as something to do while visiting the area These first-time visitors also rate lower than repeat visitors on NPS and OER
WHY IT MATTERS Museums often grapple with converting first-time visitors to repeat visitors members and donors but it is important to acknowledge that this is unlikely for out-of-town groups Distinguishing between different types of first-time visitors is critical to understanding how to encourage repeat visitation
RESIDENCE OF GROUPn=3612 n=7432
OVERALL EXPERIENCE RATING n=2309 n=3154
MOTIVATIONSn=3853 n=79322768 5315 2017
3141 287Locals-only
Out-of-towners only
Mixed group
Spend time together
Something to do while visiting the area
FIRST-TIME VISITORS
REPEAT VISITORS
33
54
12
SUPERIOR
SUPERIOR
EXCELLENT
EXCELLENT
GOOD
GOOD
52
15
31
2731
6841
5328
157
2017
641
745
0
10
20
30
40
50
60
70
80
90
100
-100
18
NPS
ADULT-ONLY GROUPS (21) VS GROUPS WITH KIDS (79)
ADULT ONLY GROUPS
GROUPS WITH KIDS
SUPERIOR
SUPERIOR
EXCELLENT
EXCELLENT
GOOD
GOOD
51
54
16
12
30
33
OVERALL EXPERIENCE RATINGn=1582 n=5505
ADULT AGEn=3660 n=12242
DATE OF LAST VISITn=2480 n=9061
INCOMEn=2434 n=8997
LGBT+n=2455 n=9015
608
740
Approximately one-fifth of visiting groups are composed solely of adults and though the phrase ldquoadult-only museum visitor groupsrdquo might make some think of older adults more than one-quarter of them are under the age of 25 Roughly half of these groups are first-time visitors and almost one-tenth identify as LGBT+
WHY IT MATTERS For institutions that donrsquot consider themselves childrenrsquos museums recognizing adult audiences is important as they bring a younger adult age group with less disposable income (24 households under $50Kyear compared with 15 for groups with kids) who come largely for personal entertainment reasons (28 compared with 5 for groups with kids) These groups however rate their experiences lower than visitors with children
28+5+28+29+9+39+21+2014+79+4 49+29
14+4+13+11+12+14+10+13+12+18+5+8+8+9+2922
18ndash24
25ndash34
35ndash44
45ndash64
65+
Yes Never visited
Under $25000
$25000ndash$49999
$50000ndash$74999
$75000ndash$99999
$100000ndash$149999
$150000ndash$199999
More than $200000
Prefer not to say not sure
285
2829
4
399
2120
147
9 49
11
1311
1214
1013
12
58
8
2922
9
18
29
4
0
10
20
30
40
50
60
70
80
90
100
-100
19
NPS
0
10
20
30
40
50
60
70
80
90
100
-100
19
NPS
7+5 67+27+6789+91 84+88 86+87 90+92 8890
LOCAL NON-MEMBERS (44)
VS OUT-OF-TOWN NON-MEMBERS (36)
LOCALS
OUT-OF-TOWNERS
SUPERIOR
SUPERIOR
EXCELLENT
EXCELLENT
GOOD
GOOD536
326
MOTIVATIONSn=3352 n=2737
EXPERIENCE RATINGSAverage rating scale from 0 to 10 where 10 is highest n varies
DATE OF LAST VISITn=3309 n=2692
OVERALL EXPERIENCE RATINGn=2055 n=1601
32
16
53
53
Education experience
Value for cost
Exhibits in working order
Staff member helpfulness
Restrooms cleanliness
lt 3 months
3-6 mos
6-12 mos
67
2767
893907
842875
863874
906920
875896
14
29
Since members are much more likely to be local members are excluded from analyses on this page to highlight differences that are unique to non-member locals and out-of-towners Almost half of all non-member visitors report coming in locals-only groups (ie not bringing out-of-town guests with them) and consistent with the overall aggregate data tend to come to spend time with their group While out-of-town-only non-member groups come instead as something to do while visiting the area these out-of-towners also rate their experiences slightly higher than the locals
WHY IT MATTERS Removing members (and their higher ratings) from the analyses shows that out-of-town-only groups rate their experience more highly than local-only groups Together with the analysis of first-time and repeat visitors this suggests that there is the most room to improve in serving local first-time visitors
659 664
4130 4+35 11+2 12+2 12+4Spend time together
Something to do while visiting the area
41 11 752
12
12
2
4
435
305-10 yrs
10+ yrs
Never
-100
NPS
20
0
10
20
30
40
50
60
70
80
90
100
-100
SUMMER (JULndashSEP) FALL (OCTndashDEC)
WINTER (JANndashMAR) AND SPRING (APRndashJUN)
SUPERIOR
SUPERIOR
SUPERIOR
EXCELLENT
EXCELLENT
EXCELLENT
GOOD
GOOD
GOOD
36
31
32
50
54
53
FALL AUDIENCES | n=898
WINTER AUDIENCES | n=3306
SPRING AUDIENCES | n=2883
OVERALL EXPERIENCE RATING EXPERIENCE RATINGSAverage rating scale from 0 to 10 where 10 is highest n varies
896897893891
873885869864
881884866867
929929910910
One advantage of the ongoing nature of COVES is the ability to compare ratings over time In this yearrsquos COVES data experience ratings appear to be highest in the Fall quarter (from Oct to Dec 2017)
WHY IT MATTERS Museum visitation varies by season with many museums busier in the summer months than the fall as school goes back into session Some museums also bring temporary exhibitions throughout the year These and other factors can influence experience ratings at any given time in the year
90+90+89+89 87+89+87+86 88+88+87+87 93+93+91+91
Entertainment experience
Value for cost
Exhibits in working order
Staff member helpfulness
Summer data not included because the question was not added until Oct 2017
20
722 718702
13
13
14
703
0
10
20
30
40
50
60
70
80
90
100
-100
21
NPS NPS
21-100
0
10
20
30
40
50
60
80
90
100
70
LARGE MEDIUM AND SMALL INSTITUTIONS
Education experience
Entertainment experience
Value for cost
Exhibits in working order
Staff member helpfulness
The 2017-18 COVES cohort contained institutions of vastly different sizes with yearly visitation ranging from under 10000 visitors to over 1 million visitors Visitors to the smallest museums tend to give higher experience ratings The trend is especially clear in ratings for staff helpfulness and the value of the experience relative to the cost
WHY IT MATTERS Small and very small museums represent a higher proportion of the Association of Science-Technology Centers (ASTC) membership than medium and large museums Though large museums are often working with more resources small museums provide high quality visitor experiences
90+90+91 90+88+89+ 85+86+90+ 87+85+89 90+91+94
SUPERIOR
SUPERIOR
SUPERIOR
EXCELLENT
EXCELLENT
EXCELLENT
GOOD
GOOD
GOOD
LARGE INSTITUTIONS | n=3069
MEDIUM INSTITUTIONS | n=1818
SMALL INSTITUTIONS | n=2201
OVERALL EXPERIENCE RATING
32
906896910
898887894
852863901
874852889
906914934
EXPERIENCE RATINGSAverage rating scale from 0 to 10 where 10 is highest n varies
713
18
14
33
53
12
53
14
32
54
686
728
22
GET INVOLVED IN COVESDo you want to see data from your institution represented in COVES We are always looking for new participants As more institutions join our field-wide dataset becomes more representative As of October 2018 we have 22 science centers participating in COVES
If you are interested in joining our collaboration or just want to learn more please contact us at infounderstandingvisitorsorg or visit our website at wwwunderstandingvisitorsorg Currently any Association of Science-Technology Centers (ASTC) member in good standing is eligible to join but we encourage people from all types of museums to contact us
Bradbury Science Museum
Center of Science and Industry (COSI)
Discovery Center Museum
Discovery Place Science
EcoTarium
Exploratorium
Great Lakes Science Center
Imagination Station
Museum of Discovery and Science
Museum of Science Boston
Natural History Museum of Utah
New York Hall of Science
Oregon Museum of Science and Industry
Orlando Science Center
Roseville Utility Exploration Center
Saint Louis Science Center
Science Center of Iowa
Science Museum of Minnesota
Science World British Columbia
Terry Lee Wells Nevada Museum of Discovery
The DoSeum
The Franklin Institute
SCIENCE CENTERS PARTICIPATING IN COVES AS OF OCTOBER 2018
understandingvisitorsorg
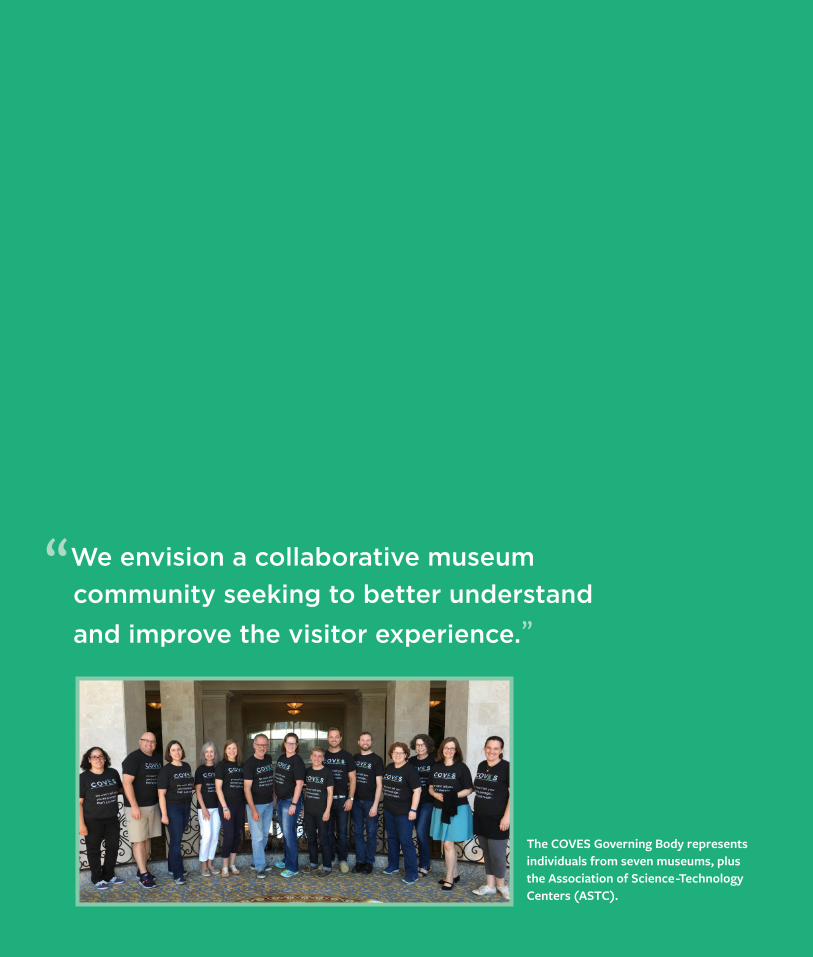
4
ldquoWe envision a collaborative museum community seeking to better understand and improve the visitor experiencerdquo
The COVES Governing Body represents individuals from seven museums plus the Association of Science-Technology Centers (ASTC)
5
WHAT IS COVES The Collaboration for Ongoing Visitor Experience Studies (COVES) is designed to unite science centers across the country to systematically collect analyze and report on visitor experience data
We envision a collaborative museum community seeking to better understand and improve the visitor experience We believe that studying the visitor experience in science centersmdashwho visits a particular museum why they visit what they experience during their visit and how they react to different aspects of their experiencemdashcan help organizations learn about their visitors make evidence-based decisions about services and programming and respond to challenges interests and concerns in a visitor-centered manner This report represents the first presentation of our aggregate data and findings to the science center field It contains data collected between July 2017 and June 2018 in multiple science centers in the United State and Canada
WHO ARE THEY
HOW DO THEY REACT
WHY DO THEY VISIT
WHAT DO THEY EXPERIENCE
SCIENCE CENTER VISITORS
COVES collects analyzes and reports data about science center visitors
Participating intitutions can make evidence-based
decisions
Aggregate data (shown in this report) can inform the museum
field as a whole
6
LARGE INSTITUTIONSCOSI | Columbus OH
Exploratorium | San Francisco CA
The Franklin Institute | Philadelphia PA
Museum of Science | Boston MA
Saint Louis Science Center | St Louis MO
Science Museum of Minnesota | St Paul MN
Science World British Columbia | Vancouver BC Canada
MEDIUM INSTITUTIONS The DoSeum | San Antonio TX
EcoTarium | Worcester MA
Great Lakes Science Center | Cleveland OH
Maryland Science Center | Baltimore MD
New York Hall of Science | New York NY
SMALL INSTITUTIONSAmazeum | Bentonville AR
Bradbury Science Museum | Los Alamos NM
Discovery Center of Idaho | Boise ID
Discovery Center Museum | Rockford IL
Lancaster Science Factory | Lancaster PA
Pensacola MESS Hall | Pensacola Florida
Terry Lee Wells Nevada Discovery Museum | Reno NV
JULY 2017-JUNE 2018 PARTICIPANTS Data from the following institutions are included in this report
COVES uses several factors to categorize institutional size including annual attendance total interior exhibit space and annual operating income
This report includes visitor data from 19 different institutions
7
8
DATA COLLECTION PILOTTo standardize the data collection protocol COVES used part of its first year as a pilot period Between October 1 2015 and March 21 2016 the initial eight COVES institutions piloted three data collection techniques using identical data collection instruments an onsite survey method an emailed survey method and an interview method
To ensure that the methods were feasible across sites we assigned the data collection methods across different sized institutions Two institutions (one large and one small) did all three data collection methods
As a result of the pilot testing COVES institutions collect data using an electronic onsite exit survey Groups complete the survey onsite at the completion of their time in the museum All COVES sites use this method Prior to starting COVES data collection participating sites used a variety of different data collection methods and it was critical to settle on one method
VISITOR RESPONSE RATE
TIME SPENT TO GET A COMPLETED SURVEY
At the end of the pilot the onsite survey emerged as the most efficient method with both the highest response rate and lowest amount of time spent to collect a completed response
ONSITE SURVEY ONLINE SURVEYIN-PERSON INTERVIEW
62+51+10 14+17+21 14 min62
51
10
17 min
21 min
MET
HO
DS
PILO
TED
RESU
LTS
onsite survey
in-person interview
online survey
onsite survey
in-person interview
online survey
CHOSEN METHOD
9
SURV
EY S
TATS
SAMPLE SIZEThe COVES reporting cycle follows a July to June Fiscal Year (FY) structure This report includes data from FY18 or July 2017 to June 2018 In FY18 COVES sites collected 13335 surveys much higher than the FY17 total of 5857 surveys This is for two reasons first the COVES Research Team raised sample size targets for all institutions in FY18 and second the number of participating institutions increased from 13 to 19
The COVES Research Team sets yearly sample size targets for small (about 500 responses) medium (about 850 responses) and large institutions (about 1400 responses) The Research Team then uses general public attendance data from participants to establish proportional sampling by month For example most participants collect the highest number of surveys in July when many science centers get the highest number of visitors and the lowest number in September when visitation tends to drop
In FY18 actual institutional sample sizes ranged from 145 to 1508 Differences between target and actual sample sizes are largely due to several institutions joining halfway through the year along with data collection difficulties To account for the differences in sample sizes across institutions and avoid over-representing large institutions statistical weights were applied to the data prior to analysis
THE AVERAGE RESPONSE RATE ACROSS SITES
NUMBER OF SURVEYS COLLECTED
THE AVERAGE SURVEY DURATION
FY17 FY18
Ranging from 33 and 96
13335
5857
413 minsec
61 avg rate
10
WHY ARE THE DATA INTERESTINGThese data represent a collaborative ongoing multi-institutional science center visitor study Because the data were collected using a common method and survey instrument they can be combinedmdashor aggregatedmdashtogether The resulting aggregate data can help us learn more about visitors not just at one science center but across several different science centers Although many science centers collect visitor experience data this ongoing collaboration is the first of its kind in our field
The aggregate data are not representative of any individual institution but instead represent the group as a whole This obscures individual differences between institutions but provides insight into broad trends in science center visitors Although this group is not representative of the science center field as a whole the institutions included here are diverse in size and location within North America
Pages 12ndash15 provide a comprehensive basic overview of the data while pages 16-22 describe trends and comparisons between different sub-groups such as members or first-time visitors These comparisons are descriptive in nature and do not present statistical findings from inferential analyses
AS YOU REVIEW THESE DATA CONSIDER THE FOLLOWING QUESTIONS
ɠ Are any of these findings surprising
ɠ Do any of these findings confirm assumptions or expectations
ɠ If you work at a museum that is not part of COVES how do you think your institutionrsquos data would compare to the aggregate data in this report
ɠ What do these data suggest about trends among science center visitors
ɠ What types of actions might we take as a field based on these data
ɠ What further questions arise after seeing these data
11
HOW TO READ AND INTERPRET THE GRAPHS IN THIS REPORT
OVERALL EXPERIENCE RATING (OER)
ldquoPlease rate your overall experience at [Institution Name] todayrdquo
NET PROMOTER SCORE (NPS)ldquoOn a scale from 0 to 10 how likely are you to recommend [Institution Name] to a friend or colleaguerdquo
SUPERIOR
EXCELLENT
GOOD 52
9
37
Net promoter scores from different institutions are presented on the blue pages (pages 16ndash22) on these vertical scales Each dot represents an institutionrsquos NPS
This dark gray circle represents the average NPS across institutions
Net Promoter Score is calculated by subtracting the percentage of ldquoDetractorsrdquo (ratings of 0-6) from the percentage of ldquoPromotersrdquo (ratings of 9-10) In this example 757ndash46=711 The net score has a possible range of -100
Each colored bar represents the average percentage of visitors across institutions who selected that rating (ie ldquoSuperiorrdquo)
ldquoFairrdquo and ldquoPoorrdquo are additional response options on the OER scale but are not displayed because they represent such small percentages (less than 2 combined)
The NPS scale goes from -100 to 100 but we are representing a truncated version The scale on each blue page is the same so they can be compared
40
50
60
70
80
90
100
-100
76+20+5Promoters (9-10)
Passives (7-8)
Detractors (0-6)
711-100 100
0
757
196
46
711
12
GROUP DEMOGRAPHICSThe COVES protocol involves selecting one adult from a visitor group to be the primary respondent but the survey asks for some information that describes the entire visiting group This information is summarized below
AVERAGE GROUP SIZEn=11601 (adults) n=11480 (children)
GROUP COMPOSITIONn=11601 (adults) n=11480 (children)
ADULT AGE AND GENDER BREAKDOWNS n=11786
CHILD AGE AND GENDER BREAKDOWNSn=11786
PERMANENT OR TEMPORARY DISABILITY n=11468
RESIDENCE OF GROUPn=11044
11+28+32+20+9 38+59+3+1
3150+10+104234
21+29+3011+923+38+32+8 51+471 8+87+5
55+28+18Avg number of adults
Avg number of children
1 Adult
2 Adults
3 Adults
4+ Adults
0ndash3
4ndash7
8ndash12
13ndash17
Male
Female
Prefer not to say
Another category
Yes
No
Prefer not to say
0 Children
1 Child
2 Children
3 Children
4+ Children
31
21
17
11 38
28 59
32 3
20 1
9
21
2351
47
8
87
1
lt1
5
38
32
8
55
28
18
29
30
11
9
50
10
10
18-24
25-34
35-44
45-64
65+
Male
Female
Prefer not to say
Another category
Locals-only
Out-of-towners only
Mixed group
WH
O V
ISIT
S
13 13
Some HS
HS
Some college
College
Some grad
Grad
Prefer not to say
INDIVIDUAL RESPONDENT DEMOGRAPHICSThe survey also asks for some information from the primary respondent only This information is summarized below
MEMBERSHIPn=11497
NUMBER OF VISITS IN THE LAST YEARn=10314
EDUCATIONn=11600
RACEETHNICITYn=11430
LGBT+ IDENTIFICATIONn=11471
US RESIDENCEn=11066
HOUSEHOLD INCOMEn=11431
DATE OF LAST VISITn=1154030+70
56+29+15
96+45+87+1+7
1+6+15+36+5+32+35+11+13+12+17+8+4+2+3+24
21+11+8+10+7+5+6+33+165+7+6+5+1+0+8+7+2
Members
Non-members
Within the past 3 months
3-6 months ago
6 months-1 year
1-2 years ago
2-5 years ago
5-10 years ago
10+ years ago
Never
Not sure
30
56
22
11
8
9
6
4
5
33
65
96
5
87
1
7
4
6
6
5
1
lt1
8
7
2
1
1
6
16
37
5
3
31
5
12
14
12
17
8
4
3
24
2
29
15
70
1st visit
2-4
5+
Under $25000
$25000ndash$49999
$50000ndash$74999
$75000ndash$99999
$100000ndash$149999
$150000ndash$199999
$200000ndash$249999
$250000ndash$300000
More than $300000
Prefer not to sayNot sure
White
Asian
HispanicLatinx
BlackAfrican American
Amer Indian or Alaskan Native
Native HawaiianPacific Islander
Multiple races identified
Prefer not to say
Other
Yes
No
Not sure
Prefer not to say
$
Yes
No
WH
O V
ISIT
S
14
6+27+32+19+10+4+138+25+17+14+10+10++8+8+7+6+5To spend time together as a group or family
For funentertainment for group
For an educational experience for group
Something to do while visiting the area
For funentertainment for myself
To see a specific exhibit program or show
Because thatrsquos what good parents do
To bring out of town friendsfamily
For an educational experience for myself
Wanted something to do in poor weather
Had a couponfree pass
MOTIVATIONSn=11786
LENGTH OF STAY
lt1 hour
1-2 hrs
2-3 hrs
3-4 hrs
4-5 hrs
5-6 hrs
6+ hrs
WH
Y T
HE
Y V
ISIT
38
25
17
14
10
10
8
8
7
6
5
6
27
32
19
10
4
1
Avg stay time was 2 hours and
40 minutes
240
STAY TIMEn=11455
Visitors may have several reasons for deciding to come to a science center or museum In the COVES survey they select the two most important reasons for visiting from the list below which displays in a random order
15 15
92+90+89+89+88+87+8783
76+20+5
NET PROMOTER SCORE amp EXPERIENCE RATINGSTwo commonly-used metrics in the science centers are Net Promoter Score and Overall Experience Rating Overall Experience Rating is a direct experience rating while Net Promoter Score asks how likely the respondent is to recommend the institution The COVES survey also asks respondents to rate their agreement with eight statements about specific aspects of the visit
905
894
873
874
919
888
828
882
EXPERIENCE RATINGSAverage rating scale from 0 to 10 where 10 is highest n varies
NET PROMOTER SCORE n=11631
OVERALL EXPERIENCE RATINGn=7088
NET PROMOTER SCORE RANGE ACROSS INSTITUTIONS
Promoters
Passives
Detractors
757
196
46
50
60
70
80
90
100
-100
SUPERIOR
EXCELLENT
GOOD
FAIR
POOR
53
13
537
984
42141
14
13
2
32Staff member helpfulness
Education experience
Entertainment experience
Restroom cleanliness
Gift shop experience
Exhibits in working order
Value for cost
Cafeacuterestaurant experience
Of the promoters this is the breakdown of their Overall Experience Rating (left to right good excellent superior)
Of those who rated their experience ldquosuperiorrdquo here is the breakdown of their NPS
PROMOTERPASSIVE
711-100 100
0
HO
W T
HE
Y R
AT
E T
HE
IR V
ISIT
711
0
10
20
30
40
50
60
70
80
90
100
-100
16
NPS
Museum members have strong connections with their home institution As seen below 86 of members report visiting multiple times in the last 12 months (compared with only 23 of non-members) with 43 visiting 5 or more times These visitors also rate their experience more positively across the board including NPS OER and all experience ratings
WHY IT MATTERS Members are an integral part of museum audiences They visit often and rate the museum experience highly In fact member and non-member differences are so strong that they influence the differences between other groups such as locals vs out-of-town visitors
DATE OF LAST VISITn=3404 n=7938
OVERALL EXPERIENCE RATINGn=1378 n=4811
NUMBER OF VISITS IN THE LAST YEARn=3152 n=6988
EXPERIENCE RATINGSAverage rating scale from 0 to 10 where 10 is highest
n varies59+7 19+8 8+9
92+90+ 92+89+ 91+86 89+87 93+91 90+88 84+82 90+8713+7544+2045+5lt3 months
3ndash6 months
6ndash12 months
1st
2ndash4
5+
MEMBERS
NON-MEMBERS
37
30
53
53
9
15
MEMBERS (30) VS NON-MEMBERS (70)
SUPERIOR
SUPERIOR
EXCELLENT
EXCELLENT
GOOD
GOOD
59
919
43
1375
4420
5
899
916885
906857
885868
933
895
842821
902873
884
912
7
198
89
820
668
Education experience
Entertainment experience
Value for cost
Exhibits in working order
Staff member helpfulness
Restroom cleanliness
Cafeacuterestaurant experience
Gift shop experience
0
10
20
30
40
50
60
70
80
90
100
-100
17
NPS
0
10
20
30
40
50
60
70
80
90
100
-100
17
NPS
FIRST-TIME (33) VS REPEAT VISITORS (67)
While both repeat and first-time visitors come primarily to spend time with their groups first-timers more often come as something to do while visiting the area These first-time visitors also rate lower than repeat visitors on NPS and OER
WHY IT MATTERS Museums often grapple with converting first-time visitors to repeat visitors members and donors but it is important to acknowledge that this is unlikely for out-of-town groups Distinguishing between different types of first-time visitors is critical to understanding how to encourage repeat visitation
RESIDENCE OF GROUPn=3612 n=7432
OVERALL EXPERIENCE RATING n=2309 n=3154
MOTIVATIONSn=3853 n=79322768 5315 2017
3141 287Locals-only
Out-of-towners only
Mixed group
Spend time together
Something to do while visiting the area
FIRST-TIME VISITORS
REPEAT VISITORS
33
54
12
SUPERIOR
SUPERIOR
EXCELLENT
EXCELLENT
GOOD
GOOD
52
15
31
2731
6841
5328
157
2017
641
745
0
10
20
30
40
50
60
70
80
90
100
-100
18
NPS
ADULT-ONLY GROUPS (21) VS GROUPS WITH KIDS (79)
ADULT ONLY GROUPS
GROUPS WITH KIDS
SUPERIOR
SUPERIOR
EXCELLENT
EXCELLENT
GOOD
GOOD
51
54
16
12
30
33
OVERALL EXPERIENCE RATINGn=1582 n=5505
ADULT AGEn=3660 n=12242
DATE OF LAST VISITn=2480 n=9061
INCOMEn=2434 n=8997
LGBT+n=2455 n=9015
608
740
Approximately one-fifth of visiting groups are composed solely of adults and though the phrase ldquoadult-only museum visitor groupsrdquo might make some think of older adults more than one-quarter of them are under the age of 25 Roughly half of these groups are first-time visitors and almost one-tenth identify as LGBT+
WHY IT MATTERS For institutions that donrsquot consider themselves childrenrsquos museums recognizing adult audiences is important as they bring a younger adult age group with less disposable income (24 households under $50Kyear compared with 15 for groups with kids) who come largely for personal entertainment reasons (28 compared with 5 for groups with kids) These groups however rate their experiences lower than visitors with children
28+5+28+29+9+39+21+2014+79+4 49+29
14+4+13+11+12+14+10+13+12+18+5+8+8+9+2922
18ndash24
25ndash34
35ndash44
45ndash64
65+
Yes Never visited
Under $25000
$25000ndash$49999
$50000ndash$74999
$75000ndash$99999
$100000ndash$149999
$150000ndash$199999
More than $200000
Prefer not to say not sure
285
2829
4
399
2120
147
9 49
11
1311
1214
1013
12
58
8
2922
9
18
29
4
0
10
20
30
40
50
60
70
80
90
100
-100
19
NPS
0
10
20
30
40
50
60
70
80
90
100
-100
19
NPS
7+5 67+27+6789+91 84+88 86+87 90+92 8890
LOCAL NON-MEMBERS (44)
VS OUT-OF-TOWN NON-MEMBERS (36)
LOCALS
OUT-OF-TOWNERS
SUPERIOR
SUPERIOR
EXCELLENT
EXCELLENT
GOOD
GOOD536
326
MOTIVATIONSn=3352 n=2737
EXPERIENCE RATINGSAverage rating scale from 0 to 10 where 10 is highest n varies
DATE OF LAST VISITn=3309 n=2692
OVERALL EXPERIENCE RATINGn=2055 n=1601
32
16
53
53
Education experience
Value for cost
Exhibits in working order
Staff member helpfulness
Restrooms cleanliness
lt 3 months
3-6 mos
6-12 mos
67
2767
893907
842875
863874
906920
875896
14
29
Since members are much more likely to be local members are excluded from analyses on this page to highlight differences that are unique to non-member locals and out-of-towners Almost half of all non-member visitors report coming in locals-only groups (ie not bringing out-of-town guests with them) and consistent with the overall aggregate data tend to come to spend time with their group While out-of-town-only non-member groups come instead as something to do while visiting the area these out-of-towners also rate their experiences slightly higher than the locals
WHY IT MATTERS Removing members (and their higher ratings) from the analyses shows that out-of-town-only groups rate their experience more highly than local-only groups Together with the analysis of first-time and repeat visitors this suggests that there is the most room to improve in serving local first-time visitors
659 664
4130 4+35 11+2 12+2 12+4Spend time together
Something to do while visiting the area
41 11 752
12
12
2
4
435
305-10 yrs
10+ yrs
Never
-100
NPS
20
0
10
20
30
40
50
60
70
80
90
100
-100
SUMMER (JULndashSEP) FALL (OCTndashDEC)
WINTER (JANndashMAR) AND SPRING (APRndashJUN)
SUPERIOR
SUPERIOR
SUPERIOR
EXCELLENT
EXCELLENT
EXCELLENT
GOOD
GOOD
GOOD
36
31
32
50
54
53
FALL AUDIENCES | n=898
WINTER AUDIENCES | n=3306
SPRING AUDIENCES | n=2883
OVERALL EXPERIENCE RATING EXPERIENCE RATINGSAverage rating scale from 0 to 10 where 10 is highest n varies
896897893891
873885869864
881884866867
929929910910
One advantage of the ongoing nature of COVES is the ability to compare ratings over time In this yearrsquos COVES data experience ratings appear to be highest in the Fall quarter (from Oct to Dec 2017)
WHY IT MATTERS Museum visitation varies by season with many museums busier in the summer months than the fall as school goes back into session Some museums also bring temporary exhibitions throughout the year These and other factors can influence experience ratings at any given time in the year
90+90+89+89 87+89+87+86 88+88+87+87 93+93+91+91
Entertainment experience
Value for cost
Exhibits in working order
Staff member helpfulness
Summer data not included because the question was not added until Oct 2017
20
722 718702
13
13
14
703
0
10
20
30
40
50
60
70
80
90
100
-100
21
NPS NPS
21-100
0
10
20
30
40
50
60
80
90
100
70
LARGE MEDIUM AND SMALL INSTITUTIONS
Education experience
Entertainment experience
Value for cost
Exhibits in working order
Staff member helpfulness
The 2017-18 COVES cohort contained institutions of vastly different sizes with yearly visitation ranging from under 10000 visitors to over 1 million visitors Visitors to the smallest museums tend to give higher experience ratings The trend is especially clear in ratings for staff helpfulness and the value of the experience relative to the cost
WHY IT MATTERS Small and very small museums represent a higher proportion of the Association of Science-Technology Centers (ASTC) membership than medium and large museums Though large museums are often working with more resources small museums provide high quality visitor experiences
90+90+91 90+88+89+ 85+86+90+ 87+85+89 90+91+94
SUPERIOR
SUPERIOR
SUPERIOR
EXCELLENT
EXCELLENT
EXCELLENT
GOOD
GOOD
GOOD
LARGE INSTITUTIONS | n=3069
MEDIUM INSTITUTIONS | n=1818
SMALL INSTITUTIONS | n=2201
OVERALL EXPERIENCE RATING
32
906896910
898887894
852863901
874852889
906914934
EXPERIENCE RATINGSAverage rating scale from 0 to 10 where 10 is highest n varies
713
18
14
33
53
12
53
14
32
54
686
728
22
GET INVOLVED IN COVESDo you want to see data from your institution represented in COVES We are always looking for new participants As more institutions join our field-wide dataset becomes more representative As of October 2018 we have 22 science centers participating in COVES
If you are interested in joining our collaboration or just want to learn more please contact us at infounderstandingvisitorsorg or visit our website at wwwunderstandingvisitorsorg Currently any Association of Science-Technology Centers (ASTC) member in good standing is eligible to join but we encourage people from all types of museums to contact us
Bradbury Science Museum
Center of Science and Industry (COSI)
Discovery Center Museum
Discovery Place Science
EcoTarium
Exploratorium
Great Lakes Science Center
Imagination Station
Museum of Discovery and Science
Museum of Science Boston
Natural History Museum of Utah
New York Hall of Science
Oregon Museum of Science and Industry
Orlando Science Center
Roseville Utility Exploration Center
Saint Louis Science Center
Science Center of Iowa
Science Museum of Minnesota
Science World British Columbia
Terry Lee Wells Nevada Museum of Discovery
The DoSeum
The Franklin Institute
SCIENCE CENTERS PARTICIPATING IN COVES AS OF OCTOBER 2018
understandingvisitorsorg
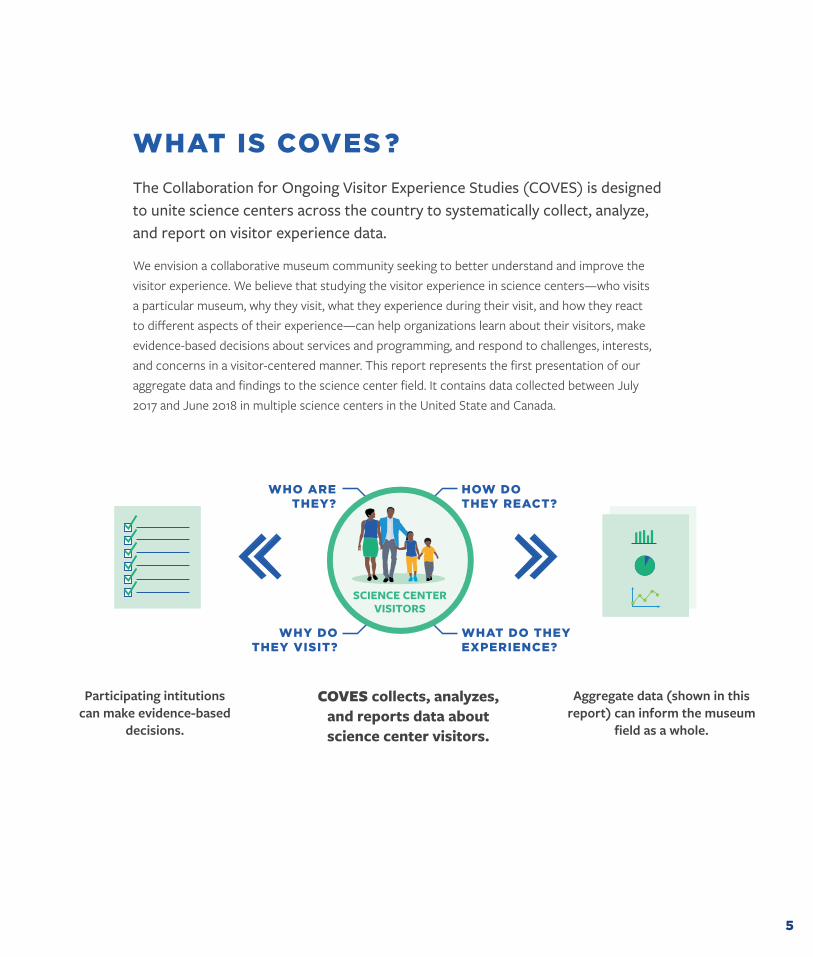
5
WHAT IS COVES The Collaboration for Ongoing Visitor Experience Studies (COVES) is designed to unite science centers across the country to systematically collect analyze and report on visitor experience data
We envision a collaborative museum community seeking to better understand and improve the visitor experience We believe that studying the visitor experience in science centersmdashwho visits a particular museum why they visit what they experience during their visit and how they react to different aspects of their experiencemdashcan help organizations learn about their visitors make evidence-based decisions about services and programming and respond to challenges interests and concerns in a visitor-centered manner This report represents the first presentation of our aggregate data and findings to the science center field It contains data collected between July 2017 and June 2018 in multiple science centers in the United State and Canada
WHO ARE THEY
HOW DO THEY REACT
WHY DO THEY VISIT
WHAT DO THEY EXPERIENCE
SCIENCE CENTER VISITORS
COVES collects analyzes and reports data about science center visitors
Participating intitutions can make evidence-based
decisions
Aggregate data (shown in this report) can inform the museum
field as a whole
6
LARGE INSTITUTIONSCOSI | Columbus OH
Exploratorium | San Francisco CA
The Franklin Institute | Philadelphia PA
Museum of Science | Boston MA
Saint Louis Science Center | St Louis MO
Science Museum of Minnesota | St Paul MN
Science World British Columbia | Vancouver BC Canada
MEDIUM INSTITUTIONS The DoSeum | San Antonio TX
EcoTarium | Worcester MA
Great Lakes Science Center | Cleveland OH
Maryland Science Center | Baltimore MD
New York Hall of Science | New York NY
SMALL INSTITUTIONSAmazeum | Bentonville AR
Bradbury Science Museum | Los Alamos NM
Discovery Center of Idaho | Boise ID
Discovery Center Museum | Rockford IL
Lancaster Science Factory | Lancaster PA
Pensacola MESS Hall | Pensacola Florida
Terry Lee Wells Nevada Discovery Museum | Reno NV
JULY 2017-JUNE 2018 PARTICIPANTS Data from the following institutions are included in this report
COVES uses several factors to categorize institutional size including annual attendance total interior exhibit space and annual operating income
This report includes visitor data from 19 different institutions
7
8
DATA COLLECTION PILOTTo standardize the data collection protocol COVES used part of its first year as a pilot period Between October 1 2015 and March 21 2016 the initial eight COVES institutions piloted three data collection techniques using identical data collection instruments an onsite survey method an emailed survey method and an interview method
To ensure that the methods were feasible across sites we assigned the data collection methods across different sized institutions Two institutions (one large and one small) did all three data collection methods
As a result of the pilot testing COVES institutions collect data using an electronic onsite exit survey Groups complete the survey onsite at the completion of their time in the museum All COVES sites use this method Prior to starting COVES data collection participating sites used a variety of different data collection methods and it was critical to settle on one method
VISITOR RESPONSE RATE
TIME SPENT TO GET A COMPLETED SURVEY
At the end of the pilot the onsite survey emerged as the most efficient method with both the highest response rate and lowest amount of time spent to collect a completed response
ONSITE SURVEY ONLINE SURVEYIN-PERSON INTERVIEW
62+51+10 14+17+21 14 min62
51
10
17 min
21 min
MET
HO
DS
PILO
TED
RESU
LTS
onsite survey
in-person interview
online survey
onsite survey
in-person interview
online survey
CHOSEN METHOD
9
SURV
EY S
TATS
SAMPLE SIZEThe COVES reporting cycle follows a July to June Fiscal Year (FY) structure This report includes data from FY18 or July 2017 to June 2018 In FY18 COVES sites collected 13335 surveys much higher than the FY17 total of 5857 surveys This is for two reasons first the COVES Research Team raised sample size targets for all institutions in FY18 and second the number of participating institutions increased from 13 to 19
The COVES Research Team sets yearly sample size targets for small (about 500 responses) medium (about 850 responses) and large institutions (about 1400 responses) The Research Team then uses general public attendance data from participants to establish proportional sampling by month For example most participants collect the highest number of surveys in July when many science centers get the highest number of visitors and the lowest number in September when visitation tends to drop
In FY18 actual institutional sample sizes ranged from 145 to 1508 Differences between target and actual sample sizes are largely due to several institutions joining halfway through the year along with data collection difficulties To account for the differences in sample sizes across institutions and avoid over-representing large institutions statistical weights were applied to the data prior to analysis
THE AVERAGE RESPONSE RATE ACROSS SITES
NUMBER OF SURVEYS COLLECTED
THE AVERAGE SURVEY DURATION
FY17 FY18
Ranging from 33 and 96
13335
5857
413 minsec
61 avg rate
10
WHY ARE THE DATA INTERESTINGThese data represent a collaborative ongoing multi-institutional science center visitor study Because the data were collected using a common method and survey instrument they can be combinedmdashor aggregatedmdashtogether The resulting aggregate data can help us learn more about visitors not just at one science center but across several different science centers Although many science centers collect visitor experience data this ongoing collaboration is the first of its kind in our field
The aggregate data are not representative of any individual institution but instead represent the group as a whole This obscures individual differences between institutions but provides insight into broad trends in science center visitors Although this group is not representative of the science center field as a whole the institutions included here are diverse in size and location within North America
Pages 12ndash15 provide a comprehensive basic overview of the data while pages 16-22 describe trends and comparisons between different sub-groups such as members or first-time visitors These comparisons are descriptive in nature and do not present statistical findings from inferential analyses
AS YOU REVIEW THESE DATA CONSIDER THE FOLLOWING QUESTIONS
ɠ Are any of these findings surprising
ɠ Do any of these findings confirm assumptions or expectations
ɠ If you work at a museum that is not part of COVES how do you think your institutionrsquos data would compare to the aggregate data in this report
ɠ What do these data suggest about trends among science center visitors
ɠ What types of actions might we take as a field based on these data
ɠ What further questions arise after seeing these data
11
HOW TO READ AND INTERPRET THE GRAPHS IN THIS REPORT
OVERALL EXPERIENCE RATING (OER)
ldquoPlease rate your overall experience at [Institution Name] todayrdquo
NET PROMOTER SCORE (NPS)ldquoOn a scale from 0 to 10 how likely are you to recommend [Institution Name] to a friend or colleaguerdquo
SUPERIOR
EXCELLENT
GOOD 52
9
37
Net promoter scores from different institutions are presented on the blue pages (pages 16ndash22) on these vertical scales Each dot represents an institutionrsquos NPS
This dark gray circle represents the average NPS across institutions
Net Promoter Score is calculated by subtracting the percentage of ldquoDetractorsrdquo (ratings of 0-6) from the percentage of ldquoPromotersrdquo (ratings of 9-10) In this example 757ndash46=711 The net score has a possible range of -100
Each colored bar represents the average percentage of visitors across institutions who selected that rating (ie ldquoSuperiorrdquo)
ldquoFairrdquo and ldquoPoorrdquo are additional response options on the OER scale but are not displayed because they represent such small percentages (less than 2 combined)
The NPS scale goes from -100 to 100 but we are representing a truncated version The scale on each blue page is the same so they can be compared
40
50
60
70
80
90
100
-100
76+20+5Promoters (9-10)
Passives (7-8)
Detractors (0-6)
711-100 100
0
757
196
46
711
12
GROUP DEMOGRAPHICSThe COVES protocol involves selecting one adult from a visitor group to be the primary respondent but the survey asks for some information that describes the entire visiting group This information is summarized below
AVERAGE GROUP SIZEn=11601 (adults) n=11480 (children)
GROUP COMPOSITIONn=11601 (adults) n=11480 (children)
ADULT AGE AND GENDER BREAKDOWNS n=11786
CHILD AGE AND GENDER BREAKDOWNSn=11786
PERMANENT OR TEMPORARY DISABILITY n=11468
RESIDENCE OF GROUPn=11044
11+28+32+20+9 38+59+3+1
3150+10+104234
21+29+3011+923+38+32+8 51+471 8+87+5
55+28+18Avg number of adults
Avg number of children
1 Adult
2 Adults
3 Adults
4+ Adults
0ndash3
4ndash7
8ndash12
13ndash17
Male
Female
Prefer not to say
Another category
Yes
No
Prefer not to say
0 Children
1 Child
2 Children
3 Children
4+ Children
31
21
17
11 38
28 59
32 3
20 1
9
21
2351
47
8
87
1
lt1
5
38
32
8
55
28
18
29
30
11
9
50
10
10
18-24
25-34
35-44
45-64
65+
Male
Female
Prefer not to say
Another category
Locals-only
Out-of-towners only
Mixed group
WH
O V
ISIT
S
13 13
Some HS
HS
Some college
College
Some grad
Grad
Prefer not to say
INDIVIDUAL RESPONDENT DEMOGRAPHICSThe survey also asks for some information from the primary respondent only This information is summarized below
MEMBERSHIPn=11497
NUMBER OF VISITS IN THE LAST YEARn=10314
EDUCATIONn=11600
RACEETHNICITYn=11430
LGBT+ IDENTIFICATIONn=11471
US RESIDENCEn=11066
HOUSEHOLD INCOMEn=11431
DATE OF LAST VISITn=1154030+70
56+29+15
96+45+87+1+7
1+6+15+36+5+32+35+11+13+12+17+8+4+2+3+24
21+11+8+10+7+5+6+33+165+7+6+5+1+0+8+7+2
Members
Non-members
Within the past 3 months
3-6 months ago
6 months-1 year
1-2 years ago
2-5 years ago
5-10 years ago
10+ years ago
Never
Not sure
30
56
22
11
8
9
6
4
5
33
65
96
5
87
1
7
4
6
6
5
1
lt1
8
7
2
1
1
6
16
37
5
3
31
5
12
14
12
17
8
4
3
24
2
29
15
70
1st visit
2-4
5+
Under $25000
$25000ndash$49999
$50000ndash$74999
$75000ndash$99999
$100000ndash$149999
$150000ndash$199999
$200000ndash$249999
$250000ndash$300000
More than $300000
Prefer not to sayNot sure
White
Asian
HispanicLatinx
BlackAfrican American
Amer Indian or Alaskan Native
Native HawaiianPacific Islander
Multiple races identified
Prefer not to say
Other
Yes
No
Not sure
Prefer not to say
$
Yes
No
WH
O V
ISIT
S
14
6+27+32+19+10+4+138+25+17+14+10+10++8+8+7+6+5To spend time together as a group or family
For funentertainment for group
For an educational experience for group
Something to do while visiting the area
For funentertainment for myself
To see a specific exhibit program or show
Because thatrsquos what good parents do
To bring out of town friendsfamily
For an educational experience for myself
Wanted something to do in poor weather
Had a couponfree pass
MOTIVATIONSn=11786
LENGTH OF STAY
lt1 hour
1-2 hrs
2-3 hrs
3-4 hrs
4-5 hrs
5-6 hrs
6+ hrs
WH
Y T
HE
Y V
ISIT
38
25
17
14
10
10
8
8
7
6
5
6
27
32
19
10
4
1
Avg stay time was 2 hours and
40 minutes
240
STAY TIMEn=11455
Visitors may have several reasons for deciding to come to a science center or museum In the COVES survey they select the two most important reasons for visiting from the list below which displays in a random order
15 15
92+90+89+89+88+87+8783
76+20+5
NET PROMOTER SCORE amp EXPERIENCE RATINGSTwo commonly-used metrics in the science centers are Net Promoter Score and Overall Experience Rating Overall Experience Rating is a direct experience rating while Net Promoter Score asks how likely the respondent is to recommend the institution The COVES survey also asks respondents to rate their agreement with eight statements about specific aspects of the visit
905
894
873
874
919
888
828
882
EXPERIENCE RATINGSAverage rating scale from 0 to 10 where 10 is highest n varies
NET PROMOTER SCORE n=11631
OVERALL EXPERIENCE RATINGn=7088
NET PROMOTER SCORE RANGE ACROSS INSTITUTIONS
Promoters
Passives
Detractors
757
196
46
50
60
70
80
90
100
-100
SUPERIOR
EXCELLENT
GOOD
FAIR
POOR
53
13
537
984
42141
14
13
2
32Staff member helpfulness
Education experience
Entertainment experience
Restroom cleanliness
Gift shop experience
Exhibits in working order
Value for cost
Cafeacuterestaurant experience
Of the promoters this is the breakdown of their Overall Experience Rating (left to right good excellent superior)
Of those who rated their experience ldquosuperiorrdquo here is the breakdown of their NPS
PROMOTERPASSIVE
711-100 100
0
HO
W T
HE
Y R
AT
E T
HE
IR V
ISIT
711
0
10
20
30
40
50
60
70
80
90
100
-100
16
NPS
Museum members have strong connections with their home institution As seen below 86 of members report visiting multiple times in the last 12 months (compared with only 23 of non-members) with 43 visiting 5 or more times These visitors also rate their experience more positively across the board including NPS OER and all experience ratings
WHY IT MATTERS Members are an integral part of museum audiences They visit often and rate the museum experience highly In fact member and non-member differences are so strong that they influence the differences between other groups such as locals vs out-of-town visitors
DATE OF LAST VISITn=3404 n=7938
OVERALL EXPERIENCE RATINGn=1378 n=4811
NUMBER OF VISITS IN THE LAST YEARn=3152 n=6988
EXPERIENCE RATINGSAverage rating scale from 0 to 10 where 10 is highest
n varies59+7 19+8 8+9
92+90+ 92+89+ 91+86 89+87 93+91 90+88 84+82 90+8713+7544+2045+5lt3 months
3ndash6 months
6ndash12 months
1st
2ndash4
5+
MEMBERS
NON-MEMBERS
37
30
53
53
9
15
MEMBERS (30) VS NON-MEMBERS (70)
SUPERIOR
SUPERIOR
EXCELLENT
EXCELLENT
GOOD
GOOD
59
919
43
1375
4420
5
899
916885
906857
885868
933
895
842821
902873
884
912
7
198
89
820
668
Education experience
Entertainment experience
Value for cost
Exhibits in working order
Staff member helpfulness
Restroom cleanliness
Cafeacuterestaurant experience
Gift shop experience
0
10
20
30
40
50
60
70
80
90
100
-100
17
NPS
0
10
20
30
40
50
60
70
80
90
100
-100
17
NPS
FIRST-TIME (33) VS REPEAT VISITORS (67)
While both repeat and first-time visitors come primarily to spend time with their groups first-timers more often come as something to do while visiting the area These first-time visitors also rate lower than repeat visitors on NPS and OER
WHY IT MATTERS Museums often grapple with converting first-time visitors to repeat visitors members and donors but it is important to acknowledge that this is unlikely for out-of-town groups Distinguishing between different types of first-time visitors is critical to understanding how to encourage repeat visitation
RESIDENCE OF GROUPn=3612 n=7432
OVERALL EXPERIENCE RATING n=2309 n=3154
MOTIVATIONSn=3853 n=79322768 5315 2017
3141 287Locals-only
Out-of-towners only
Mixed group
Spend time together
Something to do while visiting the area
FIRST-TIME VISITORS
REPEAT VISITORS
33
54
12
SUPERIOR
SUPERIOR
EXCELLENT
EXCELLENT
GOOD
GOOD
52
15
31
2731
6841
5328
157
2017
641
745
0
10
20
30
40
50
60
70
80
90
100
-100
18
NPS
ADULT-ONLY GROUPS (21) VS GROUPS WITH KIDS (79)
ADULT ONLY GROUPS
GROUPS WITH KIDS
SUPERIOR
SUPERIOR
EXCELLENT
EXCELLENT
GOOD
GOOD
51
54
16
12
30
33
OVERALL EXPERIENCE RATINGn=1582 n=5505
ADULT AGEn=3660 n=12242
DATE OF LAST VISITn=2480 n=9061
INCOMEn=2434 n=8997
LGBT+n=2455 n=9015
608
740
Approximately one-fifth of visiting groups are composed solely of adults and though the phrase ldquoadult-only museum visitor groupsrdquo might make some think of older adults more than one-quarter of them are under the age of 25 Roughly half of these groups are first-time visitors and almost one-tenth identify as LGBT+
WHY IT MATTERS For institutions that donrsquot consider themselves childrenrsquos museums recognizing adult audiences is important as they bring a younger adult age group with less disposable income (24 households under $50Kyear compared with 15 for groups with kids) who come largely for personal entertainment reasons (28 compared with 5 for groups with kids) These groups however rate their experiences lower than visitors with children
28+5+28+29+9+39+21+2014+79+4 49+29
14+4+13+11+12+14+10+13+12+18+5+8+8+9+2922
18ndash24
25ndash34
35ndash44
45ndash64
65+
Yes Never visited
Under $25000
$25000ndash$49999
$50000ndash$74999
$75000ndash$99999
$100000ndash$149999
$150000ndash$199999
More than $200000
Prefer not to say not sure
285
2829
4
399
2120
147
9 49
11
1311
1214
1013
12
58
8
2922
9
18
29
4
0
10
20
30
40
50
60
70
80
90
100
-100
19
NPS
0
10
20
30
40
50
60
70
80
90
100
-100
19
NPS
7+5 67+27+6789+91 84+88 86+87 90+92 8890
LOCAL NON-MEMBERS (44)
VS OUT-OF-TOWN NON-MEMBERS (36)
LOCALS
OUT-OF-TOWNERS
SUPERIOR
SUPERIOR
EXCELLENT
EXCELLENT
GOOD
GOOD536
326
MOTIVATIONSn=3352 n=2737
EXPERIENCE RATINGSAverage rating scale from 0 to 10 where 10 is highest n varies
DATE OF LAST VISITn=3309 n=2692
OVERALL EXPERIENCE RATINGn=2055 n=1601
32
16
53
53
Education experience
Value for cost
Exhibits in working order
Staff member helpfulness
Restrooms cleanliness
lt 3 months
3-6 mos
6-12 mos
67
2767
893907
842875
863874
906920
875896
14
29
Since members are much more likely to be local members are excluded from analyses on this page to highlight differences that are unique to non-member locals and out-of-towners Almost half of all non-member visitors report coming in locals-only groups (ie not bringing out-of-town guests with them) and consistent with the overall aggregate data tend to come to spend time with their group While out-of-town-only non-member groups come instead as something to do while visiting the area these out-of-towners also rate their experiences slightly higher than the locals
WHY IT MATTERS Removing members (and their higher ratings) from the analyses shows that out-of-town-only groups rate their experience more highly than local-only groups Together with the analysis of first-time and repeat visitors this suggests that there is the most room to improve in serving local first-time visitors
659 664
4130 4+35 11+2 12+2 12+4Spend time together
Something to do while visiting the area
41 11 752
12
12
2
4
435
305-10 yrs
10+ yrs
Never
-100
NPS
20
0
10
20
30
40
50
60
70
80
90
100
-100
SUMMER (JULndashSEP) FALL (OCTndashDEC)
WINTER (JANndashMAR) AND SPRING (APRndashJUN)
SUPERIOR
SUPERIOR
SUPERIOR
EXCELLENT
EXCELLENT
EXCELLENT
GOOD
GOOD
GOOD
36
31
32
50
54
53
FALL AUDIENCES | n=898
WINTER AUDIENCES | n=3306
SPRING AUDIENCES | n=2883
OVERALL EXPERIENCE RATING EXPERIENCE RATINGSAverage rating scale from 0 to 10 where 10 is highest n varies
896897893891
873885869864
881884866867
929929910910
One advantage of the ongoing nature of COVES is the ability to compare ratings over time In this yearrsquos COVES data experience ratings appear to be highest in the Fall quarter (from Oct to Dec 2017)
WHY IT MATTERS Museum visitation varies by season with many museums busier in the summer months than the fall as school goes back into session Some museums also bring temporary exhibitions throughout the year These and other factors can influence experience ratings at any given time in the year
90+90+89+89 87+89+87+86 88+88+87+87 93+93+91+91
Entertainment experience
Value for cost
Exhibits in working order
Staff member helpfulness
Summer data not included because the question was not added until Oct 2017
20
722 718702
13
13
14
703
0
10
20
30
40
50
60
70
80
90
100
-100
21
NPS NPS
21-100
0
10
20
30
40
50
60
80
90
100
70
LARGE MEDIUM AND SMALL INSTITUTIONS
Education experience
Entertainment experience
Value for cost
Exhibits in working order
Staff member helpfulness
The 2017-18 COVES cohort contained institutions of vastly different sizes with yearly visitation ranging from under 10000 visitors to over 1 million visitors Visitors to the smallest museums tend to give higher experience ratings The trend is especially clear in ratings for staff helpfulness and the value of the experience relative to the cost
WHY IT MATTERS Small and very small museums represent a higher proportion of the Association of Science-Technology Centers (ASTC) membership than medium and large museums Though large museums are often working with more resources small museums provide high quality visitor experiences
90+90+91 90+88+89+ 85+86+90+ 87+85+89 90+91+94
SUPERIOR
SUPERIOR
SUPERIOR
EXCELLENT
EXCELLENT
EXCELLENT
GOOD
GOOD
GOOD
LARGE INSTITUTIONS | n=3069
MEDIUM INSTITUTIONS | n=1818
SMALL INSTITUTIONS | n=2201
OVERALL EXPERIENCE RATING
32
906896910
898887894
852863901
874852889
906914934
EXPERIENCE RATINGSAverage rating scale from 0 to 10 where 10 is highest n varies
713
18
14
33
53
12
53
14
32
54
686
728
22
GET INVOLVED IN COVESDo you want to see data from your institution represented in COVES We are always looking for new participants As more institutions join our field-wide dataset becomes more representative As of October 2018 we have 22 science centers participating in COVES
If you are interested in joining our collaboration or just want to learn more please contact us at infounderstandingvisitorsorg or visit our website at wwwunderstandingvisitorsorg Currently any Association of Science-Technology Centers (ASTC) member in good standing is eligible to join but we encourage people from all types of museums to contact us
Bradbury Science Museum
Center of Science and Industry (COSI)
Discovery Center Museum
Discovery Place Science
EcoTarium
Exploratorium
Great Lakes Science Center
Imagination Station
Museum of Discovery and Science
Museum of Science Boston
Natural History Museum of Utah
New York Hall of Science
Oregon Museum of Science and Industry
Orlando Science Center
Roseville Utility Exploration Center
Saint Louis Science Center
Science Center of Iowa
Science Museum of Minnesota
Science World British Columbia
Terry Lee Wells Nevada Museum of Discovery
The DoSeum
The Franklin Institute
SCIENCE CENTERS PARTICIPATING IN COVES AS OF OCTOBER 2018
understandingvisitorsorg
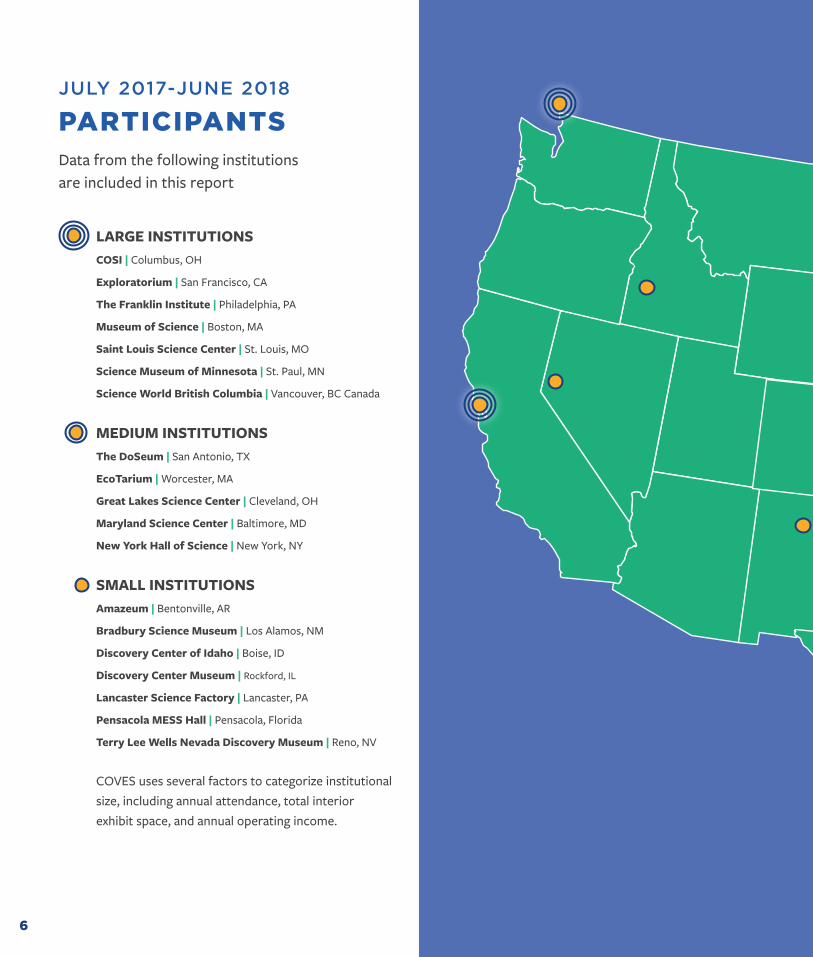
6
LARGE INSTITUTIONSCOSI | Columbus OH
Exploratorium | San Francisco CA
The Franklin Institute | Philadelphia PA
Museum of Science | Boston MA
Saint Louis Science Center | St Louis MO
Science Museum of Minnesota | St Paul MN
Science World British Columbia | Vancouver BC Canada
MEDIUM INSTITUTIONS The DoSeum | San Antonio TX
EcoTarium | Worcester MA
Great Lakes Science Center | Cleveland OH
Maryland Science Center | Baltimore MD
New York Hall of Science | New York NY
SMALL INSTITUTIONSAmazeum | Bentonville AR
Bradbury Science Museum | Los Alamos NM
Discovery Center of Idaho | Boise ID
Discovery Center Museum | Rockford IL
Lancaster Science Factory | Lancaster PA
Pensacola MESS Hall | Pensacola Florida
Terry Lee Wells Nevada Discovery Museum | Reno NV
JULY 2017-JUNE 2018 PARTICIPANTS Data from the following institutions are included in this report
COVES uses several factors to categorize institutional size including annual attendance total interior exhibit space and annual operating income
This report includes visitor data from 19 different institutions
7
8
DATA COLLECTION PILOTTo standardize the data collection protocol COVES used part of its first year as a pilot period Between October 1 2015 and March 21 2016 the initial eight COVES institutions piloted three data collection techniques using identical data collection instruments an onsite survey method an emailed survey method and an interview method
To ensure that the methods were feasible across sites we assigned the data collection methods across different sized institutions Two institutions (one large and one small) did all three data collection methods
As a result of the pilot testing COVES institutions collect data using an electronic onsite exit survey Groups complete the survey onsite at the completion of their time in the museum All COVES sites use this method Prior to starting COVES data collection participating sites used a variety of different data collection methods and it was critical to settle on one method
VISITOR RESPONSE RATE
TIME SPENT TO GET A COMPLETED SURVEY
At the end of the pilot the onsite survey emerged as the most efficient method with both the highest response rate and lowest amount of time spent to collect a completed response
ONSITE SURVEY ONLINE SURVEYIN-PERSON INTERVIEW
62+51+10 14+17+21 14 min62
51
10
17 min
21 min
MET
HO
DS
PILO
TED
RESU
LTS
onsite survey
in-person interview
online survey
onsite survey
in-person interview
online survey
CHOSEN METHOD
9
SURV
EY S
TATS
SAMPLE SIZEThe COVES reporting cycle follows a July to June Fiscal Year (FY) structure This report includes data from FY18 or July 2017 to June 2018 In FY18 COVES sites collected 13335 surveys much higher than the FY17 total of 5857 surveys This is for two reasons first the COVES Research Team raised sample size targets for all institutions in FY18 and second the number of participating institutions increased from 13 to 19
The COVES Research Team sets yearly sample size targets for small (about 500 responses) medium (about 850 responses) and large institutions (about 1400 responses) The Research Team then uses general public attendance data from participants to establish proportional sampling by month For example most participants collect the highest number of surveys in July when many science centers get the highest number of visitors and the lowest number in September when visitation tends to drop
In FY18 actual institutional sample sizes ranged from 145 to 1508 Differences between target and actual sample sizes are largely due to several institutions joining halfway through the year along with data collection difficulties To account for the differences in sample sizes across institutions and avoid over-representing large institutions statistical weights were applied to the data prior to analysis
THE AVERAGE RESPONSE RATE ACROSS SITES
NUMBER OF SURVEYS COLLECTED
THE AVERAGE SURVEY DURATION
FY17 FY18
Ranging from 33 and 96
13335
5857
413 minsec
61 avg rate
10
WHY ARE THE DATA INTERESTINGThese data represent a collaborative ongoing multi-institutional science center visitor study Because the data were collected using a common method and survey instrument they can be combinedmdashor aggregatedmdashtogether The resulting aggregate data can help us learn more about visitors not just at one science center but across several different science centers Although many science centers collect visitor experience data this ongoing collaboration is the first of its kind in our field
The aggregate data are not representative of any individual institution but instead represent the group as a whole This obscures individual differences between institutions but provides insight into broad trends in science center visitors Although this group is not representative of the science center field as a whole the institutions included here are diverse in size and location within North America
Pages 12ndash15 provide a comprehensive basic overview of the data while pages 16-22 describe trends and comparisons between different sub-groups such as members or first-time visitors These comparisons are descriptive in nature and do not present statistical findings from inferential analyses
AS YOU REVIEW THESE DATA CONSIDER THE FOLLOWING QUESTIONS
ɠ Are any of these findings surprising
ɠ Do any of these findings confirm assumptions or expectations
ɠ If you work at a museum that is not part of COVES how do you think your institutionrsquos data would compare to the aggregate data in this report
ɠ What do these data suggest about trends among science center visitors
ɠ What types of actions might we take as a field based on these data
ɠ What further questions arise after seeing these data
11
HOW TO READ AND INTERPRET THE GRAPHS IN THIS REPORT
OVERALL EXPERIENCE RATING (OER)
ldquoPlease rate your overall experience at [Institution Name] todayrdquo
NET PROMOTER SCORE (NPS)ldquoOn a scale from 0 to 10 how likely are you to recommend [Institution Name] to a friend or colleaguerdquo
SUPERIOR
EXCELLENT
GOOD 52
9
37
Net promoter scores from different institutions are presented on the blue pages (pages 16ndash22) on these vertical scales Each dot represents an institutionrsquos NPS
This dark gray circle represents the average NPS across institutions
Net Promoter Score is calculated by subtracting the percentage of ldquoDetractorsrdquo (ratings of 0-6) from the percentage of ldquoPromotersrdquo (ratings of 9-10) In this example 757ndash46=711 The net score has a possible range of -100
Each colored bar represents the average percentage of visitors across institutions who selected that rating (ie ldquoSuperiorrdquo)
ldquoFairrdquo and ldquoPoorrdquo are additional response options on the OER scale but are not displayed because they represent such small percentages (less than 2 combined)
The NPS scale goes from -100 to 100 but we are representing a truncated version The scale on each blue page is the same so they can be compared
40
50
60
70
80
90
100
-100
76+20+5Promoters (9-10)
Passives (7-8)
Detractors (0-6)
711-100 100
0
757
196
46
711
12
GROUP DEMOGRAPHICSThe COVES protocol involves selecting one adult from a visitor group to be the primary respondent but the survey asks for some information that describes the entire visiting group This information is summarized below
AVERAGE GROUP SIZEn=11601 (adults) n=11480 (children)
GROUP COMPOSITIONn=11601 (adults) n=11480 (children)
ADULT AGE AND GENDER BREAKDOWNS n=11786
CHILD AGE AND GENDER BREAKDOWNSn=11786
PERMANENT OR TEMPORARY DISABILITY n=11468
RESIDENCE OF GROUPn=11044
11+28+32+20+9 38+59+3+1
3150+10+104234
21+29+3011+923+38+32+8 51+471 8+87+5
55+28+18Avg number of adults
Avg number of children
1 Adult
2 Adults
3 Adults
4+ Adults
0ndash3
4ndash7
8ndash12
13ndash17
Male
Female
Prefer not to say
Another category
Yes
No
Prefer not to say
0 Children
1 Child
2 Children
3 Children
4+ Children
31
21
17
11 38
28 59
32 3
20 1
9
21
2351
47
8
87
1
lt1
5
38
32
8
55
28
18
29
30
11
9
50
10
10
18-24
25-34
35-44
45-64
65+
Male
Female
Prefer not to say
Another category
Locals-only
Out-of-towners only
Mixed group
WH
O V
ISIT
S
13 13
Some HS
HS
Some college
College
Some grad
Grad
Prefer not to say
INDIVIDUAL RESPONDENT DEMOGRAPHICSThe survey also asks for some information from the primary respondent only This information is summarized below
MEMBERSHIPn=11497
NUMBER OF VISITS IN THE LAST YEARn=10314
EDUCATIONn=11600
RACEETHNICITYn=11430
LGBT+ IDENTIFICATIONn=11471
US RESIDENCEn=11066
HOUSEHOLD INCOMEn=11431
DATE OF LAST VISITn=1154030+70
56+29+15
96+45+87+1+7
1+6+15+36+5+32+35+11+13+12+17+8+4+2+3+24
21+11+8+10+7+5+6+33+165+7+6+5+1+0+8+7+2
Members
Non-members
Within the past 3 months
3-6 months ago
6 months-1 year
1-2 years ago
2-5 years ago
5-10 years ago
10+ years ago
Never
Not sure
30
56
22
11
8
9
6
4
5
33
65
96
5
87
1
7
4
6
6
5
1
lt1
8
7
2
1
1
6
16
37
5
3
31
5
12
14
12
17
8
4
3
24
2
29
15
70
1st visit
2-4
5+
Under $25000
$25000ndash$49999
$50000ndash$74999
$75000ndash$99999
$100000ndash$149999
$150000ndash$199999
$200000ndash$249999
$250000ndash$300000
More than $300000
Prefer not to sayNot sure
White
Asian
HispanicLatinx
BlackAfrican American
Amer Indian or Alaskan Native
Native HawaiianPacific Islander
Multiple races identified
Prefer not to say
Other
Yes
No
Not sure
Prefer not to say
$
Yes
No
WH
O V
ISIT
S
14
6+27+32+19+10+4+138+25+17+14+10+10++8+8+7+6+5To spend time together as a group or family
For funentertainment for group
For an educational experience for group
Something to do while visiting the area
For funentertainment for myself
To see a specific exhibit program or show
Because thatrsquos what good parents do
To bring out of town friendsfamily
For an educational experience for myself
Wanted something to do in poor weather
Had a couponfree pass
MOTIVATIONSn=11786
LENGTH OF STAY
lt1 hour
1-2 hrs
2-3 hrs
3-4 hrs
4-5 hrs
5-6 hrs
6+ hrs
WH
Y T
HE
Y V
ISIT
38
25
17
14
10
10
8
8
7
6
5
6
27
32
19
10
4
1
Avg stay time was 2 hours and
40 minutes
240
STAY TIMEn=11455
Visitors may have several reasons for deciding to come to a science center or museum In the COVES survey they select the two most important reasons for visiting from the list below which displays in a random order
15 15
92+90+89+89+88+87+8783
76+20+5
NET PROMOTER SCORE amp EXPERIENCE RATINGSTwo commonly-used metrics in the science centers are Net Promoter Score and Overall Experience Rating Overall Experience Rating is a direct experience rating while Net Promoter Score asks how likely the respondent is to recommend the institution The COVES survey also asks respondents to rate their agreement with eight statements about specific aspects of the visit
905
894
873
874
919
888
828
882
EXPERIENCE RATINGSAverage rating scale from 0 to 10 where 10 is highest n varies
NET PROMOTER SCORE n=11631
OVERALL EXPERIENCE RATINGn=7088
NET PROMOTER SCORE RANGE ACROSS INSTITUTIONS
Promoters
Passives
Detractors
757
196
46
50
60
70
80
90
100
-100
SUPERIOR
EXCELLENT
GOOD
FAIR
POOR
53
13
537
984
42141
14
13
2
32Staff member helpfulness
Education experience
Entertainment experience
Restroom cleanliness
Gift shop experience
Exhibits in working order
Value for cost
Cafeacuterestaurant experience
Of the promoters this is the breakdown of their Overall Experience Rating (left to right good excellent superior)
Of those who rated their experience ldquosuperiorrdquo here is the breakdown of their NPS
PROMOTERPASSIVE
711-100 100
0
HO
W T
HE
Y R
AT
E T
HE
IR V
ISIT
711
0
10
20
30
40
50
60
70
80
90
100
-100
16
NPS
Museum members have strong connections with their home institution As seen below 86 of members report visiting multiple times in the last 12 months (compared with only 23 of non-members) with 43 visiting 5 or more times These visitors also rate their experience more positively across the board including NPS OER and all experience ratings
WHY IT MATTERS Members are an integral part of museum audiences They visit often and rate the museum experience highly In fact member and non-member differences are so strong that they influence the differences between other groups such as locals vs out-of-town visitors
DATE OF LAST VISITn=3404 n=7938
OVERALL EXPERIENCE RATINGn=1378 n=4811
NUMBER OF VISITS IN THE LAST YEARn=3152 n=6988
EXPERIENCE RATINGSAverage rating scale from 0 to 10 where 10 is highest
n varies59+7 19+8 8+9
92+90+ 92+89+ 91+86 89+87 93+91 90+88 84+82 90+8713+7544+2045+5lt3 months
3ndash6 months
6ndash12 months
1st
2ndash4
5+
MEMBERS
NON-MEMBERS
37
30
53
53
9
15
MEMBERS (30) VS NON-MEMBERS (70)
SUPERIOR
SUPERIOR
EXCELLENT
EXCELLENT
GOOD
GOOD
59
919
43
1375
4420
5
899
916885
906857
885868
933
895
842821
902873
884
912
7
198
89
820
668
Education experience
Entertainment experience
Value for cost
Exhibits in working order
Staff member helpfulness
Restroom cleanliness
Cafeacuterestaurant experience
Gift shop experience
0
10
20
30
40
50
60
70
80
90
100
-100
17
NPS
0
10
20
30
40
50
60
70
80
90
100
-100
17
NPS
FIRST-TIME (33) VS REPEAT VISITORS (67)
While both repeat and first-time visitors come primarily to spend time with their groups first-timers more often come as something to do while visiting the area These first-time visitors also rate lower than repeat visitors on NPS and OER
WHY IT MATTERS Museums often grapple with converting first-time visitors to repeat visitors members and donors but it is important to acknowledge that this is unlikely for out-of-town groups Distinguishing between different types of first-time visitors is critical to understanding how to encourage repeat visitation
RESIDENCE OF GROUPn=3612 n=7432
OVERALL EXPERIENCE RATING n=2309 n=3154
MOTIVATIONSn=3853 n=79322768 5315 2017
3141 287Locals-only
Out-of-towners only
Mixed group
Spend time together
Something to do while visiting the area
FIRST-TIME VISITORS
REPEAT VISITORS
33
54
12
SUPERIOR
SUPERIOR
EXCELLENT
EXCELLENT
GOOD
GOOD
52
15
31
2731
6841
5328
157
2017
641
745
0
10
20
30
40
50
60
70
80
90
100
-100
18
NPS
ADULT-ONLY GROUPS (21) VS GROUPS WITH KIDS (79)
ADULT ONLY GROUPS
GROUPS WITH KIDS
SUPERIOR
SUPERIOR
EXCELLENT
EXCELLENT
GOOD
GOOD
51
54
16
12
30
33
OVERALL EXPERIENCE RATINGn=1582 n=5505
ADULT AGEn=3660 n=12242
DATE OF LAST VISITn=2480 n=9061
INCOMEn=2434 n=8997
LGBT+n=2455 n=9015
608
740
Approximately one-fifth of visiting groups are composed solely of adults and though the phrase ldquoadult-only museum visitor groupsrdquo might make some think of older adults more than one-quarter of them are under the age of 25 Roughly half of these groups are first-time visitors and almost one-tenth identify as LGBT+
WHY IT MATTERS For institutions that donrsquot consider themselves childrenrsquos museums recognizing adult audiences is important as they bring a younger adult age group with less disposable income (24 households under $50Kyear compared with 15 for groups with kids) who come largely for personal entertainment reasons (28 compared with 5 for groups with kids) These groups however rate their experiences lower than visitors with children
28+5+28+29+9+39+21+2014+79+4 49+29
14+4+13+11+12+14+10+13+12+18+5+8+8+9+2922
18ndash24
25ndash34
35ndash44
45ndash64
65+
Yes Never visited
Under $25000
$25000ndash$49999
$50000ndash$74999
$75000ndash$99999
$100000ndash$149999
$150000ndash$199999
More than $200000
Prefer not to say not sure
285
2829
4
399
2120
147
9 49
11
1311
1214
1013
12
58
8
2922
9
18
29
4
0
10
20
30
40
50
60
70
80
90
100
-100
19
NPS
0
10
20
30
40
50
60
70
80
90
100
-100
19
NPS
7+5 67+27+6789+91 84+88 86+87 90+92 8890
LOCAL NON-MEMBERS (44)
VS OUT-OF-TOWN NON-MEMBERS (36)
LOCALS
OUT-OF-TOWNERS
SUPERIOR
SUPERIOR
EXCELLENT
EXCELLENT
GOOD
GOOD536
326
MOTIVATIONSn=3352 n=2737
EXPERIENCE RATINGSAverage rating scale from 0 to 10 where 10 is highest n varies
DATE OF LAST VISITn=3309 n=2692
OVERALL EXPERIENCE RATINGn=2055 n=1601
32
16
53
53
Education experience
Value for cost
Exhibits in working order
Staff member helpfulness
Restrooms cleanliness
lt 3 months
3-6 mos
6-12 mos
67
2767
893907
842875
863874
906920
875896
14
29
Since members are much more likely to be local members are excluded from analyses on this page to highlight differences that are unique to non-member locals and out-of-towners Almost half of all non-member visitors report coming in locals-only groups (ie not bringing out-of-town guests with them) and consistent with the overall aggregate data tend to come to spend time with their group While out-of-town-only non-member groups come instead as something to do while visiting the area these out-of-towners also rate their experiences slightly higher than the locals
WHY IT MATTERS Removing members (and their higher ratings) from the analyses shows that out-of-town-only groups rate their experience more highly than local-only groups Together with the analysis of first-time and repeat visitors this suggests that there is the most room to improve in serving local first-time visitors
659 664
4130 4+35 11+2 12+2 12+4Spend time together
Something to do while visiting the area
41 11 752
12
12
2
4
435
305-10 yrs
10+ yrs
Never
-100
NPS
20
0
10
20
30
40
50
60
70
80
90
100
-100
SUMMER (JULndashSEP) FALL (OCTndashDEC)
WINTER (JANndashMAR) AND SPRING (APRndashJUN)
SUPERIOR
SUPERIOR
SUPERIOR
EXCELLENT
EXCELLENT
EXCELLENT
GOOD
GOOD
GOOD
36
31
32
50
54
53
FALL AUDIENCES | n=898
WINTER AUDIENCES | n=3306
SPRING AUDIENCES | n=2883
OVERALL EXPERIENCE RATING EXPERIENCE RATINGSAverage rating scale from 0 to 10 where 10 is highest n varies
896897893891
873885869864
881884866867
929929910910
One advantage of the ongoing nature of COVES is the ability to compare ratings over time In this yearrsquos COVES data experience ratings appear to be highest in the Fall quarter (from Oct to Dec 2017)
WHY IT MATTERS Museum visitation varies by season with many museums busier in the summer months than the fall as school goes back into session Some museums also bring temporary exhibitions throughout the year These and other factors can influence experience ratings at any given time in the year
90+90+89+89 87+89+87+86 88+88+87+87 93+93+91+91
Entertainment experience
Value for cost
Exhibits in working order
Staff member helpfulness
Summer data not included because the question was not added until Oct 2017
20
722 718702
13
13
14
703
0
10
20
30
40
50
60
70
80
90
100
-100
21
NPS NPS
21-100
0
10
20
30
40
50
60
80
90
100
70
LARGE MEDIUM AND SMALL INSTITUTIONS
Education experience
Entertainment experience
Value for cost
Exhibits in working order
Staff member helpfulness
The 2017-18 COVES cohort contained institutions of vastly different sizes with yearly visitation ranging from under 10000 visitors to over 1 million visitors Visitors to the smallest museums tend to give higher experience ratings The trend is especially clear in ratings for staff helpfulness and the value of the experience relative to the cost
WHY IT MATTERS Small and very small museums represent a higher proportion of the Association of Science-Technology Centers (ASTC) membership than medium and large museums Though large museums are often working with more resources small museums provide high quality visitor experiences
90+90+91 90+88+89+ 85+86+90+ 87+85+89 90+91+94
SUPERIOR
SUPERIOR
SUPERIOR
EXCELLENT
EXCELLENT
EXCELLENT
GOOD
GOOD
GOOD
LARGE INSTITUTIONS | n=3069
MEDIUM INSTITUTIONS | n=1818
SMALL INSTITUTIONS | n=2201
OVERALL EXPERIENCE RATING
32
906896910
898887894
852863901
874852889
906914934
EXPERIENCE RATINGSAverage rating scale from 0 to 10 where 10 is highest n varies
713
18
14
33
53
12
53
14
32
54
686
728
22
GET INVOLVED IN COVESDo you want to see data from your institution represented in COVES We are always looking for new participants As more institutions join our field-wide dataset becomes more representative As of October 2018 we have 22 science centers participating in COVES
If you are interested in joining our collaboration or just want to learn more please contact us at infounderstandingvisitorsorg or visit our website at wwwunderstandingvisitorsorg Currently any Association of Science-Technology Centers (ASTC) member in good standing is eligible to join but we encourage people from all types of museums to contact us
Bradbury Science Museum
Center of Science and Industry (COSI)
Discovery Center Museum
Discovery Place Science
EcoTarium
Exploratorium
Great Lakes Science Center
Imagination Station
Museum of Discovery and Science
Museum of Science Boston
Natural History Museum of Utah
New York Hall of Science
Oregon Museum of Science and Industry
Orlando Science Center
Roseville Utility Exploration Center
Saint Louis Science Center
Science Center of Iowa
Science Museum of Minnesota
Science World British Columbia
Terry Lee Wells Nevada Museum of Discovery
The DoSeum
The Franklin Institute
SCIENCE CENTERS PARTICIPATING IN COVES AS OF OCTOBER 2018
understandingvisitorsorg
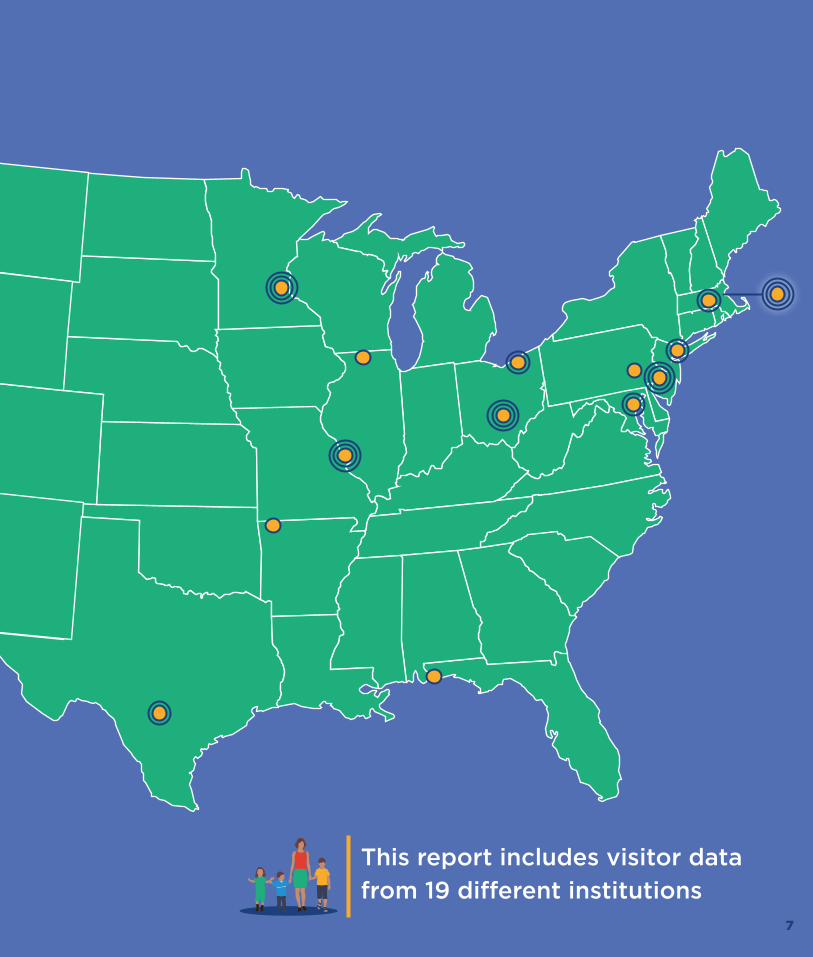
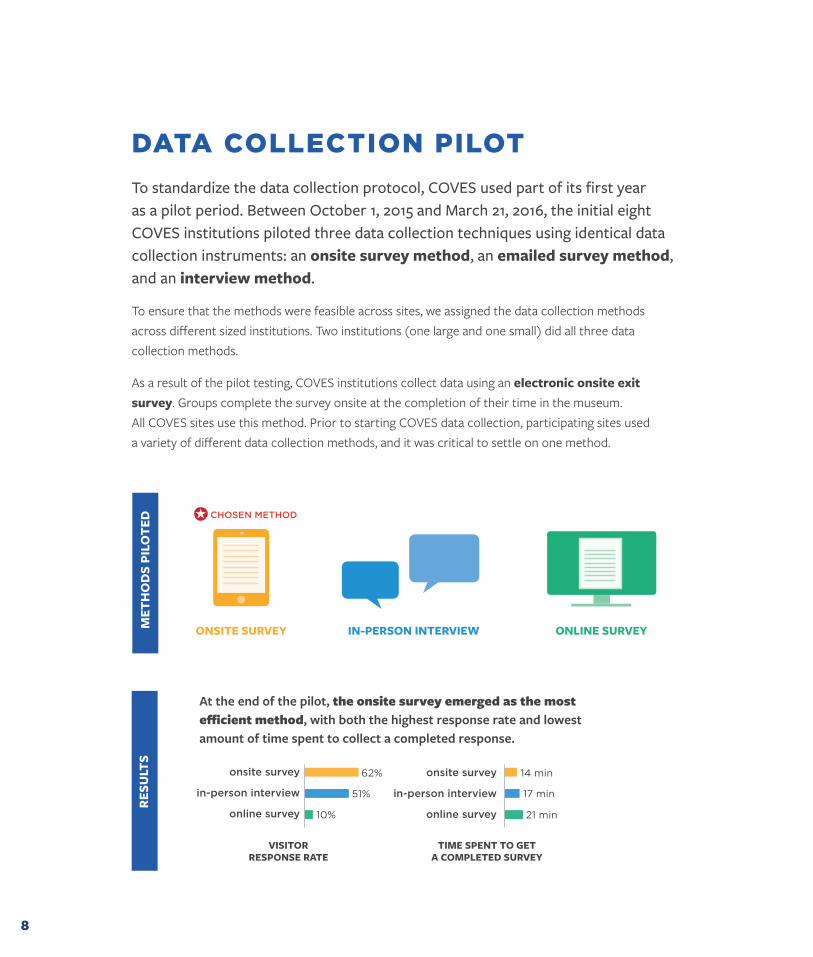
8
DATA COLLECTION PILOTTo standardize the data collection protocol COVES used part of its first year as a pilot period Between October 1 2015 and March 21 2016 the initial eight COVES institutions piloted three data collection techniques using identical data collection instruments an onsite survey method an emailed survey method and an interview method
To ensure that the methods were feasible across sites we assigned the data collection methods across different sized institutions Two institutions (one large and one small) did all three data collection methods
As a result of the pilot testing COVES institutions collect data using an electronic onsite exit survey Groups complete the survey onsite at the completion of their time in the museum All COVES sites use this method Prior to starting COVES data collection participating sites used a variety of different data collection methods and it was critical to settle on one method
VISITOR RESPONSE RATE
TIME SPENT TO GET A COMPLETED SURVEY
At the end of the pilot the onsite survey emerged as the most efficient method with both the highest response rate and lowest amount of time spent to collect a completed response
ONSITE SURVEY ONLINE SURVEYIN-PERSON INTERVIEW
62+51+10 14+17+21 14 min62
51
10
17 min
21 min
MET
HO
DS
PILO
TED
RESU
LTS
onsite survey
in-person interview
online survey
onsite survey
in-person interview
online survey
CHOSEN METHOD
9
SURV
EY S
TATS
SAMPLE SIZEThe COVES reporting cycle follows a July to June Fiscal Year (FY) structure This report includes data from FY18 or July 2017 to June 2018 In FY18 COVES sites collected 13335 surveys much higher than the FY17 total of 5857 surveys This is for two reasons first the COVES Research Team raised sample size targets for all institutions in FY18 and second the number of participating institutions increased from 13 to 19
The COVES Research Team sets yearly sample size targets for small (about 500 responses) medium (about 850 responses) and large institutions (about 1400 responses) The Research Team then uses general public attendance data from participants to establish proportional sampling by month For example most participants collect the highest number of surveys in July when many science centers get the highest number of visitors and the lowest number in September when visitation tends to drop
In FY18 actual institutional sample sizes ranged from 145 to 1508 Differences between target and actual sample sizes are largely due to several institutions joining halfway through the year along with data collection difficulties To account for the differences in sample sizes across institutions and avoid over-representing large institutions statistical weights were applied to the data prior to analysis
THE AVERAGE RESPONSE RATE ACROSS SITES
NUMBER OF SURVEYS COLLECTED
THE AVERAGE SURVEY DURATION
FY17 FY18
Ranging from 33 and 96
13335
5857
413 minsec
61 avg rate
10
WHY ARE THE DATA INTERESTINGThese data represent a collaborative ongoing multi-institutional science center visitor study Because the data were collected using a common method and survey instrument they can be combinedmdashor aggregatedmdashtogether The resulting aggregate data can help us learn more about visitors not just at one science center but across several different science centers Although many science centers collect visitor experience data this ongoing collaboration is the first of its kind in our field
The aggregate data are not representative of any individual institution but instead represent the group as a whole This obscures individual differences between institutions but provides insight into broad trends in science center visitors Although this group is not representative of the science center field as a whole the institutions included here are diverse in size and location within North America
Pages 12ndash15 provide a comprehensive basic overview of the data while pages 16-22 describe trends and comparisons between different sub-groups such as members or first-time visitors These comparisons are descriptive in nature and do not present statistical findings from inferential analyses
AS YOU REVIEW THESE DATA CONSIDER THE FOLLOWING QUESTIONS
ɠ Are any of these findings surprising
ɠ Do any of these findings confirm assumptions or expectations
ɠ If you work at a museum that is not part of COVES how do you think your institutionrsquos data would compare to the aggregate data in this report
ɠ What do these data suggest about trends among science center visitors
ɠ What types of actions might we take as a field based on these data
ɠ What further questions arise after seeing these data
11
HOW TO READ AND INTERPRET THE GRAPHS IN THIS REPORT
OVERALL EXPERIENCE RATING (OER)
ldquoPlease rate your overall experience at [Institution Name] todayrdquo
NET PROMOTER SCORE (NPS)ldquoOn a scale from 0 to 10 how likely are you to recommend [Institution Name] to a friend or colleaguerdquo
SUPERIOR
EXCELLENT
GOOD 52
9
37
Net promoter scores from different institutions are presented on the blue pages (pages 16ndash22) on these vertical scales Each dot represents an institutionrsquos NPS
This dark gray circle represents the average NPS across institutions
Net Promoter Score is calculated by subtracting the percentage of ldquoDetractorsrdquo (ratings of 0-6) from the percentage of ldquoPromotersrdquo (ratings of 9-10) In this example 757ndash46=711 The net score has a possible range of -100
Each colored bar represents the average percentage of visitors across institutions who selected that rating (ie ldquoSuperiorrdquo)
ldquoFairrdquo and ldquoPoorrdquo are additional response options on the OER scale but are not displayed because they represent such small percentages (less than 2 combined)
The NPS scale goes from -100 to 100 but we are representing a truncated version The scale on each blue page is the same so they can be compared
40
50
60
70
80
90
100
-100
76+20+5Promoters (9-10)
Passives (7-8)
Detractors (0-6)
711-100 100
0
757
196
46
711
12
GROUP DEMOGRAPHICSThe COVES protocol involves selecting one adult from a visitor group to be the primary respondent but the survey asks for some information that describes the entire visiting group This information is summarized below
AVERAGE GROUP SIZEn=11601 (adults) n=11480 (children)
GROUP COMPOSITIONn=11601 (adults) n=11480 (children)
ADULT AGE AND GENDER BREAKDOWNS n=11786
CHILD AGE AND GENDER BREAKDOWNSn=11786
PERMANENT OR TEMPORARY DISABILITY n=11468
RESIDENCE OF GROUPn=11044
11+28+32+20+9 38+59+3+1
3150+10+104234
21+29+3011+923+38+32+8 51+471 8+87+5
55+28+18Avg number of adults
Avg number of children
1 Adult
2 Adults
3 Adults
4+ Adults
0ndash3
4ndash7
8ndash12
13ndash17
Male
Female
Prefer not to say
Another category
Yes
No
Prefer not to say
0 Children
1 Child
2 Children
3 Children
4+ Children
31
21
17
11 38
28 59
32 3
20 1
9
21
2351
47
8
87
1
lt1
5
38
32
8
55
28
18
29
30
11
9
50
10
10
18-24
25-34
35-44
45-64
65+
Male
Female
Prefer not to say
Another category
Locals-only
Out-of-towners only
Mixed group
WH
O V
ISIT
S
13 13
Some HS
HS
Some college
College
Some grad
Grad
Prefer not to say
INDIVIDUAL RESPONDENT DEMOGRAPHICSThe survey also asks for some information from the primary respondent only This information is summarized below
MEMBERSHIPn=11497
NUMBER OF VISITS IN THE LAST YEARn=10314
EDUCATIONn=11600
RACEETHNICITYn=11430
LGBT+ IDENTIFICATIONn=11471
US RESIDENCEn=11066
HOUSEHOLD INCOMEn=11431
DATE OF LAST VISITn=1154030+70
56+29+15
96+45+87+1+7
1+6+15+36+5+32+35+11+13+12+17+8+4+2+3+24
21+11+8+10+7+5+6+33+165+7+6+5+1+0+8+7+2
Members
Non-members
Within the past 3 months
3-6 months ago
6 months-1 year
1-2 years ago
2-5 years ago
5-10 years ago
10+ years ago
Never
Not sure
30
56
22
11
8
9
6
4
5
33
65
96
5
87
1
7
4
6
6
5
1
lt1
8
7
2
1
1
6
16
37
5
3
31
5
12
14
12
17
8
4
3
24
2
29
15
70
1st visit
2-4
5+
Under $25000
$25000ndash$49999
$50000ndash$74999
$75000ndash$99999
$100000ndash$149999
$150000ndash$199999
$200000ndash$249999
$250000ndash$300000
More than $300000
Prefer not to sayNot sure
White
Asian
HispanicLatinx
BlackAfrican American
Amer Indian or Alaskan Native
Native HawaiianPacific Islander
Multiple races identified
Prefer not to say
Other
Yes
No
Not sure
Prefer not to say
$
Yes
No
WH
O V
ISIT
S
14
6+27+32+19+10+4+138+25+17+14+10+10++8+8+7+6+5To spend time together as a group or family
For funentertainment for group
For an educational experience for group
Something to do while visiting the area
For funentertainment for myself
To see a specific exhibit program or show
Because thatrsquos what good parents do
To bring out of town friendsfamily
For an educational experience for myself
Wanted something to do in poor weather
Had a couponfree pass
MOTIVATIONSn=11786
LENGTH OF STAY
lt1 hour
1-2 hrs
2-3 hrs
3-4 hrs
4-5 hrs
5-6 hrs
6+ hrs
WH
Y T
HE
Y V
ISIT
38
25
17
14
10
10
8
8
7
6
5
6
27
32
19
10
4
1
Avg stay time was 2 hours and
40 minutes
240
STAY TIMEn=11455
Visitors may have several reasons for deciding to come to a science center or museum In the COVES survey they select the two most important reasons for visiting from the list below which displays in a random order
15 15
92+90+89+89+88+87+8783
76+20+5
NET PROMOTER SCORE amp EXPERIENCE RATINGSTwo commonly-used metrics in the science centers are Net Promoter Score and Overall Experience Rating Overall Experience Rating is a direct experience rating while Net Promoter Score asks how likely the respondent is to recommend the institution The COVES survey also asks respondents to rate their agreement with eight statements about specific aspects of the visit
905
894
873
874
919
888
828
882
EXPERIENCE RATINGSAverage rating scale from 0 to 10 where 10 is highest n varies
NET PROMOTER SCORE n=11631
OVERALL EXPERIENCE RATINGn=7088
NET PROMOTER SCORE RANGE ACROSS INSTITUTIONS
Promoters
Passives
Detractors
757
196
46
50
60
70
80
90
100
-100
SUPERIOR
EXCELLENT
GOOD
FAIR
POOR
53
13
537
984
42141
14
13
2
32Staff member helpfulness
Education experience
Entertainment experience
Restroom cleanliness
Gift shop experience
Exhibits in working order
Value for cost
Cafeacuterestaurant experience
Of the promoters this is the breakdown of their Overall Experience Rating (left to right good excellent superior)
Of those who rated their experience ldquosuperiorrdquo here is the breakdown of their NPS
PROMOTERPASSIVE
711-100 100
0
HO
W T
HE
Y R
AT
E T
HE
IR V
ISIT
711
0
10
20
30
40
50
60
70
80
90
100
-100
16
NPS
Museum members have strong connections with their home institution As seen below 86 of members report visiting multiple times in the last 12 months (compared with only 23 of non-members) with 43 visiting 5 or more times These visitors also rate their experience more positively across the board including NPS OER and all experience ratings
WHY IT MATTERS Members are an integral part of museum audiences They visit often and rate the museum experience highly In fact member and non-member differences are so strong that they influence the differences between other groups such as locals vs out-of-town visitors
DATE OF LAST VISITn=3404 n=7938
OVERALL EXPERIENCE RATINGn=1378 n=4811
NUMBER OF VISITS IN THE LAST YEARn=3152 n=6988
EXPERIENCE RATINGSAverage rating scale from 0 to 10 where 10 is highest
n varies59+7 19+8 8+9
92+90+ 92+89+ 91+86 89+87 93+91 90+88 84+82 90+8713+7544+2045+5lt3 months
3ndash6 months
6ndash12 months
1st
2ndash4
5+
MEMBERS
NON-MEMBERS
37
30
53
53
9
15
MEMBERS (30) VS NON-MEMBERS (70)
SUPERIOR
SUPERIOR
EXCELLENT
EXCELLENT
GOOD
GOOD
59
919
43
1375
4420
5
899
916885
906857
885868
933
895
842821
902873
884
912
7
198
89
820
668
Education experience
Entertainment experience
Value for cost
Exhibits in working order
Staff member helpfulness
Restroom cleanliness
Cafeacuterestaurant experience
Gift shop experience
0
10
20
30
40
50
60
70
80
90
100
-100
17
NPS
0
10
20
30
40
50
60
70
80
90
100
-100
17
NPS
FIRST-TIME (33) VS REPEAT VISITORS (67)
While both repeat and first-time visitors come primarily to spend time with their groups first-timers more often come as something to do while visiting the area These first-time visitors also rate lower than repeat visitors on NPS and OER
WHY IT MATTERS Museums often grapple with converting first-time visitors to repeat visitors members and donors but it is important to acknowledge that this is unlikely for out-of-town groups Distinguishing between different types of first-time visitors is critical to understanding how to encourage repeat visitation
RESIDENCE OF GROUPn=3612 n=7432
OVERALL EXPERIENCE RATING n=2309 n=3154
MOTIVATIONSn=3853 n=79322768 5315 2017
3141 287Locals-only
Out-of-towners only
Mixed group
Spend time together
Something to do while visiting the area
FIRST-TIME VISITORS
REPEAT VISITORS
33
54
12
SUPERIOR
SUPERIOR
EXCELLENT
EXCELLENT
GOOD
GOOD
52
15
31
2731
6841
5328
157
2017
641
745
0
10
20
30
40
50
60
70
80
90
100
-100
18
NPS
ADULT-ONLY GROUPS (21) VS GROUPS WITH KIDS (79)
ADULT ONLY GROUPS
GROUPS WITH KIDS
SUPERIOR
SUPERIOR
EXCELLENT
EXCELLENT
GOOD
GOOD
51
54
16
12
30
33
OVERALL EXPERIENCE RATINGn=1582 n=5505
ADULT AGEn=3660 n=12242
DATE OF LAST VISITn=2480 n=9061
INCOMEn=2434 n=8997
LGBT+n=2455 n=9015
608
740
Approximately one-fifth of visiting groups are composed solely of adults and though the phrase ldquoadult-only museum visitor groupsrdquo might make some think of older adults more than one-quarter of them are under the age of 25 Roughly half of these groups are first-time visitors and almost one-tenth identify as LGBT+
WHY IT MATTERS For institutions that donrsquot consider themselves childrenrsquos museums recognizing adult audiences is important as they bring a younger adult age group with less disposable income (24 households under $50Kyear compared with 15 for groups with kids) who come largely for personal entertainment reasons (28 compared with 5 for groups with kids) These groups however rate their experiences lower than visitors with children
28+5+28+29+9+39+21+2014+79+4 49+29
14+4+13+11+12+14+10+13+12+18+5+8+8+9+2922
18ndash24
25ndash34
35ndash44
45ndash64
65+
Yes Never visited
Under $25000
$25000ndash$49999
$50000ndash$74999
$75000ndash$99999
$100000ndash$149999
$150000ndash$199999
More than $200000
Prefer not to say not sure
285
2829
4
399
2120
147
9 49
11
1311
1214
1013
12
58
8
2922
9
18
29
4
0
10
20
30
40
50
60
70
80
90
100
-100
19
NPS
0
10
20
30
40
50
60
70
80
90
100
-100
19
NPS
7+5 67+27+6789+91 84+88 86+87 90+92 8890
LOCAL NON-MEMBERS (44)
VS OUT-OF-TOWN NON-MEMBERS (36)
LOCALS
OUT-OF-TOWNERS
SUPERIOR
SUPERIOR
EXCELLENT
EXCELLENT
GOOD
GOOD536
326
MOTIVATIONSn=3352 n=2737
EXPERIENCE RATINGSAverage rating scale from 0 to 10 where 10 is highest n varies
DATE OF LAST VISITn=3309 n=2692
OVERALL EXPERIENCE RATINGn=2055 n=1601
32
16
53
53
Education experience
Value for cost
Exhibits in working order
Staff member helpfulness
Restrooms cleanliness
lt 3 months
3-6 mos
6-12 mos
67
2767
893907
842875
863874
906920
875896
14
29
Since members are much more likely to be local members are excluded from analyses on this page to highlight differences that are unique to non-member locals and out-of-towners Almost half of all non-member visitors report coming in locals-only groups (ie not bringing out-of-town guests with them) and consistent with the overall aggregate data tend to come to spend time with their group While out-of-town-only non-member groups come instead as something to do while visiting the area these out-of-towners also rate their experiences slightly higher than the locals
WHY IT MATTERS Removing members (and their higher ratings) from the analyses shows that out-of-town-only groups rate their experience more highly than local-only groups Together with the analysis of first-time and repeat visitors this suggests that there is the most room to improve in serving local first-time visitors
659 664
4130 4+35 11+2 12+2 12+4Spend time together
Something to do while visiting the area
41 11 752
12
12
2
4
435
305-10 yrs
10+ yrs
Never
-100
NPS
20
0
10
20
30
40
50
60
70
80
90
100
-100
SUMMER (JULndashSEP) FALL (OCTndashDEC)
WINTER (JANndashMAR) AND SPRING (APRndashJUN)
SUPERIOR
SUPERIOR
SUPERIOR
EXCELLENT
EXCELLENT
EXCELLENT
GOOD
GOOD
GOOD
36
31
32
50
54
53
FALL AUDIENCES | n=898
WINTER AUDIENCES | n=3306
SPRING AUDIENCES | n=2883
OVERALL EXPERIENCE RATING EXPERIENCE RATINGSAverage rating scale from 0 to 10 where 10 is highest n varies
896897893891
873885869864
881884866867
929929910910
One advantage of the ongoing nature of COVES is the ability to compare ratings over time In this yearrsquos COVES data experience ratings appear to be highest in the Fall quarter (from Oct to Dec 2017)
WHY IT MATTERS Museum visitation varies by season with many museums busier in the summer months than the fall as school goes back into session Some museums also bring temporary exhibitions throughout the year These and other factors can influence experience ratings at any given time in the year
90+90+89+89 87+89+87+86 88+88+87+87 93+93+91+91
Entertainment experience
Value for cost
Exhibits in working order
Staff member helpfulness
Summer data not included because the question was not added until Oct 2017
20
722 718702
13
13
14
703
0
10
20
30
40
50
60
70
80
90
100
-100
21
NPS NPS
21-100
0
10
20
30
40
50
60
80
90
100
70
LARGE MEDIUM AND SMALL INSTITUTIONS
Education experience
Entertainment experience
Value for cost
Exhibits in working order
Staff member helpfulness
The 2017-18 COVES cohort contained institutions of vastly different sizes with yearly visitation ranging from under 10000 visitors to over 1 million visitors Visitors to the smallest museums tend to give higher experience ratings The trend is especially clear in ratings for staff helpfulness and the value of the experience relative to the cost
WHY IT MATTERS Small and very small museums represent a higher proportion of the Association of Science-Technology Centers (ASTC) membership than medium and large museums Though large museums are often working with more resources small museums provide high quality visitor experiences
90+90+91 90+88+89+ 85+86+90+ 87+85+89 90+91+94
SUPERIOR
SUPERIOR
SUPERIOR
EXCELLENT
EXCELLENT
EXCELLENT
GOOD
GOOD
GOOD
LARGE INSTITUTIONS | n=3069
MEDIUM INSTITUTIONS | n=1818
SMALL INSTITUTIONS | n=2201
OVERALL EXPERIENCE RATING
32
906896910
898887894
852863901
874852889
906914934
EXPERIENCE RATINGSAverage rating scale from 0 to 10 where 10 is highest n varies
713
18
14
33
53
12
53
14
32
54
686
728
22
GET INVOLVED IN COVESDo you want to see data from your institution represented in COVES We are always looking for new participants As more institutions join our field-wide dataset becomes more representative As of October 2018 we have 22 science centers participating in COVES
If you are interested in joining our collaboration or just want to learn more please contact us at infounderstandingvisitorsorg or visit our website at wwwunderstandingvisitorsorg Currently any Association of Science-Technology Centers (ASTC) member in good standing is eligible to join but we encourage people from all types of museums to contact us
Bradbury Science Museum
Center of Science and Industry (COSI)
Discovery Center Museum
Discovery Place Science
EcoTarium
Exploratorium
Great Lakes Science Center
Imagination Station
Museum of Discovery and Science
Museum of Science Boston
Natural History Museum of Utah
New York Hall of Science
Oregon Museum of Science and Industry
Orlando Science Center
Roseville Utility Exploration Center
Saint Louis Science Center
Science Center of Iowa
Science Museum of Minnesota
Science World British Columbia
Terry Lee Wells Nevada Museum of Discovery
The DoSeum
The Franklin Institute
SCIENCE CENTERS PARTICIPATING IN COVES AS OF OCTOBER 2018
understandingvisitorsorg
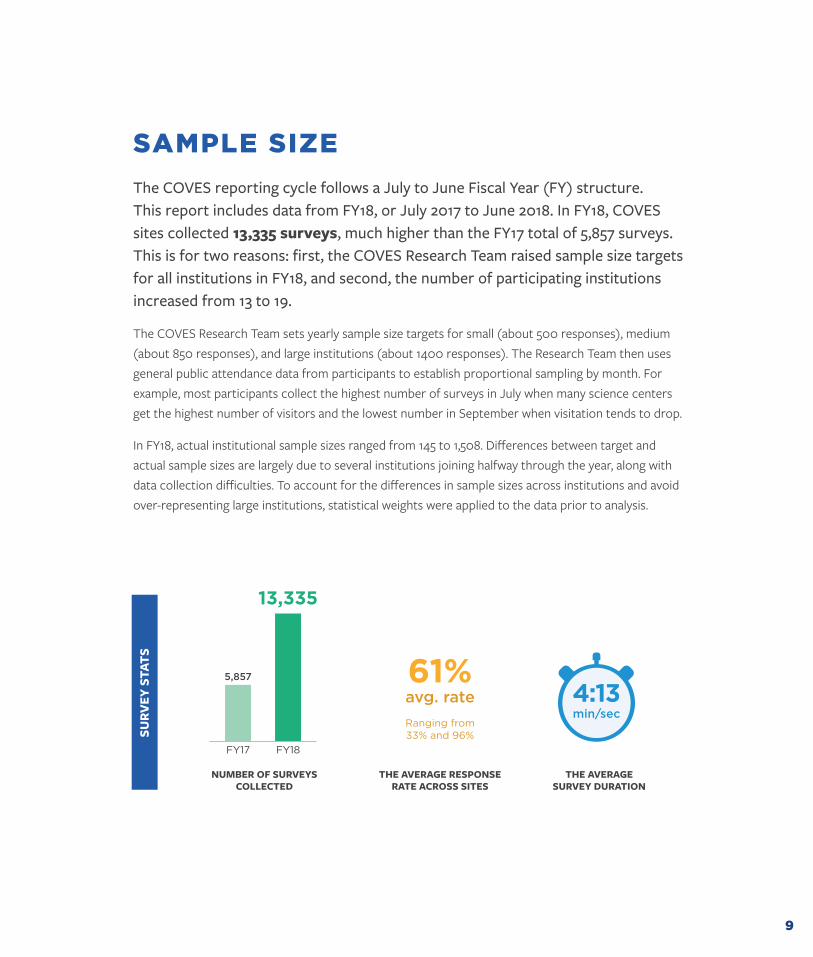
9
SURV
EY S
TATS
SAMPLE SIZEThe COVES reporting cycle follows a July to June Fiscal Year (FY) structure This report includes data from FY18 or July 2017 to June 2018 In FY18 COVES sites collected 13335 surveys much higher than the FY17 total of 5857 surveys This is for two reasons first the COVES Research Team raised sample size targets for all institutions in FY18 and second the number of participating institutions increased from 13 to 19
The COVES Research Team sets yearly sample size targets for small (about 500 responses) medium (about 850 responses) and large institutions (about 1400 responses) The Research Team then uses general public attendance data from participants to establish proportional sampling by month For example most participants collect the highest number of surveys in July when many science centers get the highest number of visitors and the lowest number in September when visitation tends to drop
In FY18 actual institutional sample sizes ranged from 145 to 1508 Differences between target and actual sample sizes are largely due to several institutions joining halfway through the year along with data collection difficulties To account for the differences in sample sizes across institutions and avoid over-representing large institutions statistical weights were applied to the data prior to analysis
THE AVERAGE RESPONSE RATE ACROSS SITES
NUMBER OF SURVEYS COLLECTED
THE AVERAGE SURVEY DURATION
FY17 FY18
Ranging from 33 and 96
13335
5857
413 minsec
61 avg rate
10
WHY ARE THE DATA INTERESTINGThese data represent a collaborative ongoing multi-institutional science center visitor study Because the data were collected using a common method and survey instrument they can be combinedmdashor aggregatedmdashtogether The resulting aggregate data can help us learn more about visitors not just at one science center but across several different science centers Although many science centers collect visitor experience data this ongoing collaboration is the first of its kind in our field
The aggregate data are not representative of any individual institution but instead represent the group as a whole This obscures individual differences between institutions but provides insight into broad trends in science center visitors Although this group is not representative of the science center field as a whole the institutions included here are diverse in size and location within North America
Pages 12ndash15 provide a comprehensive basic overview of the data while pages 16-22 describe trends and comparisons between different sub-groups such as members or first-time visitors These comparisons are descriptive in nature and do not present statistical findings from inferential analyses
AS YOU REVIEW THESE DATA CONSIDER THE FOLLOWING QUESTIONS
ɠ Are any of these findings surprising
ɠ Do any of these findings confirm assumptions or expectations
ɠ If you work at a museum that is not part of COVES how do you think your institutionrsquos data would compare to the aggregate data in this report
ɠ What do these data suggest about trends among science center visitors
ɠ What types of actions might we take as a field based on these data
ɠ What further questions arise after seeing these data
11
HOW TO READ AND INTERPRET THE GRAPHS IN THIS REPORT
OVERALL EXPERIENCE RATING (OER)
ldquoPlease rate your overall experience at [Institution Name] todayrdquo
NET PROMOTER SCORE (NPS)ldquoOn a scale from 0 to 10 how likely are you to recommend [Institution Name] to a friend or colleaguerdquo
SUPERIOR
EXCELLENT
GOOD 52
9
37
Net promoter scores from different institutions are presented on the blue pages (pages 16ndash22) on these vertical scales Each dot represents an institutionrsquos NPS
This dark gray circle represents the average NPS across institutions
Net Promoter Score is calculated by subtracting the percentage of ldquoDetractorsrdquo (ratings of 0-6) from the percentage of ldquoPromotersrdquo (ratings of 9-10) In this example 757ndash46=711 The net score has a possible range of -100
Each colored bar represents the average percentage of visitors across institutions who selected that rating (ie ldquoSuperiorrdquo)
ldquoFairrdquo and ldquoPoorrdquo are additional response options on the OER scale but are not displayed because they represent such small percentages (less than 2 combined)
The NPS scale goes from -100 to 100 but we are representing a truncated version The scale on each blue page is the same so they can be compared
40
50
60
70
80
90
100
-100
76+20+5Promoters (9-10)
Passives (7-8)
Detractors (0-6)
711-100 100
0
757
196
46
711
12
GROUP DEMOGRAPHICSThe COVES protocol involves selecting one adult from a visitor group to be the primary respondent but the survey asks for some information that describes the entire visiting group This information is summarized below
AVERAGE GROUP SIZEn=11601 (adults) n=11480 (children)
GROUP COMPOSITIONn=11601 (adults) n=11480 (children)
ADULT AGE AND GENDER BREAKDOWNS n=11786
CHILD AGE AND GENDER BREAKDOWNSn=11786
PERMANENT OR TEMPORARY DISABILITY n=11468
RESIDENCE OF GROUPn=11044
11+28+32+20+9 38+59+3+1
3150+10+104234
21+29+3011+923+38+32+8 51+471 8+87+5
55+28+18Avg number of adults
Avg number of children
1 Adult
2 Adults
3 Adults
4+ Adults
0ndash3
4ndash7
8ndash12
13ndash17
Male
Female
Prefer not to say
Another category
Yes
No
Prefer not to say
0 Children
1 Child
2 Children
3 Children
4+ Children
31
21
17
11 38
28 59
32 3
20 1
9
21
2351
47
8
87
1
lt1
5
38
32
8
55
28
18
29
30
11
9
50
10
10
18-24
25-34
35-44
45-64
65+
Male
Female
Prefer not to say
Another category
Locals-only
Out-of-towners only
Mixed group
WH
O V
ISIT
S
13 13
Some HS
HS
Some college
College
Some grad
Grad
Prefer not to say
INDIVIDUAL RESPONDENT DEMOGRAPHICSThe survey also asks for some information from the primary respondent only This information is summarized below
MEMBERSHIPn=11497
NUMBER OF VISITS IN THE LAST YEARn=10314
EDUCATIONn=11600
RACEETHNICITYn=11430
LGBT+ IDENTIFICATIONn=11471
US RESIDENCEn=11066
HOUSEHOLD INCOMEn=11431
DATE OF LAST VISITn=1154030+70
56+29+15
96+45+87+1+7
1+6+15+36+5+32+35+11+13+12+17+8+4+2+3+24
21+11+8+10+7+5+6+33+165+7+6+5+1+0+8+7+2
Members
Non-members
Within the past 3 months
3-6 months ago
6 months-1 year
1-2 years ago
2-5 years ago
5-10 years ago
10+ years ago
Never
Not sure
30
56
22
11
8
9
6
4
5
33
65
96
5
87
1
7
4
6
6
5
1
lt1
8
7
2
1
1
6
16
37
5
3
31
5
12
14
12
17
8
4
3
24
2
29
15
70
1st visit
2-4
5+
Under $25000
$25000ndash$49999
$50000ndash$74999
$75000ndash$99999
$100000ndash$149999
$150000ndash$199999
$200000ndash$249999
$250000ndash$300000
More than $300000
Prefer not to sayNot sure
White
Asian
HispanicLatinx
BlackAfrican American
Amer Indian or Alaskan Native
Native HawaiianPacific Islander
Multiple races identified
Prefer not to say
Other
Yes
No
Not sure
Prefer not to say
$
Yes
No
WH
O V
ISIT
S
14
6+27+32+19+10+4+138+25+17+14+10+10++8+8+7+6+5To spend time together as a group or family
For funentertainment for group
For an educational experience for group
Something to do while visiting the area
For funentertainment for myself
To see a specific exhibit program or show
Because thatrsquos what good parents do
To bring out of town friendsfamily
For an educational experience for myself
Wanted something to do in poor weather
Had a couponfree pass
MOTIVATIONSn=11786
LENGTH OF STAY
lt1 hour
1-2 hrs
2-3 hrs
3-4 hrs
4-5 hrs
5-6 hrs
6+ hrs
WH
Y T
HE
Y V
ISIT
38
25
17
14
10
10
8
8
7
6
5
6
27
32
19
10
4
1
Avg stay time was 2 hours and
40 minutes
240
STAY TIMEn=11455
Visitors may have several reasons for deciding to come to a science center or museum In the COVES survey they select the two most important reasons for visiting from the list below which displays in a random order
15 15
92+90+89+89+88+87+8783
76+20+5
NET PROMOTER SCORE amp EXPERIENCE RATINGSTwo commonly-used metrics in the science centers are Net Promoter Score and Overall Experience Rating Overall Experience Rating is a direct experience rating while Net Promoter Score asks how likely the respondent is to recommend the institution The COVES survey also asks respondents to rate their agreement with eight statements about specific aspects of the visit
905
894
873
874
919
888
828
882
EXPERIENCE RATINGSAverage rating scale from 0 to 10 where 10 is highest n varies
NET PROMOTER SCORE n=11631
OVERALL EXPERIENCE RATINGn=7088
NET PROMOTER SCORE RANGE ACROSS INSTITUTIONS
Promoters
Passives
Detractors
757
196
46
50
60
70
80
90
100
-100
SUPERIOR
EXCELLENT
GOOD
FAIR
POOR
53
13
537
984
42141
14
13
2
32Staff member helpfulness
Education experience
Entertainment experience
Restroom cleanliness
Gift shop experience
Exhibits in working order
Value for cost
Cafeacuterestaurant experience
Of the promoters this is the breakdown of their Overall Experience Rating (left to right good excellent superior)
Of those who rated their experience ldquosuperiorrdquo here is the breakdown of their NPS
PROMOTERPASSIVE
711-100 100
0
HO
W T
HE
Y R
AT
E T
HE
IR V
ISIT
711
0
10
20
30
40
50
60
70
80
90
100
-100
16
NPS
Museum members have strong connections with their home institution As seen below 86 of members report visiting multiple times in the last 12 months (compared with only 23 of non-members) with 43 visiting 5 or more times These visitors also rate their experience more positively across the board including NPS OER and all experience ratings
WHY IT MATTERS Members are an integral part of museum audiences They visit often and rate the museum experience highly In fact member and non-member differences are so strong that they influence the differences between other groups such as locals vs out-of-town visitors
DATE OF LAST VISITn=3404 n=7938
OVERALL EXPERIENCE RATINGn=1378 n=4811
NUMBER OF VISITS IN THE LAST YEARn=3152 n=6988
EXPERIENCE RATINGSAverage rating scale from 0 to 10 where 10 is highest
n varies59+7 19+8 8+9
92+90+ 92+89+ 91+86 89+87 93+91 90+88 84+82 90+8713+7544+2045+5lt3 months
3ndash6 months
6ndash12 months
1st
2ndash4
5+
MEMBERS
NON-MEMBERS
37
30
53
53
9
15
MEMBERS (30) VS NON-MEMBERS (70)
SUPERIOR
SUPERIOR
EXCELLENT
EXCELLENT
GOOD
GOOD
59
919
43
1375
4420
5
899
916885
906857
885868
933
895
842821
902873
884
912
7
198
89
820
668
Education experience
Entertainment experience
Value for cost
Exhibits in working order
Staff member helpfulness
Restroom cleanliness
Cafeacuterestaurant experience
Gift shop experience
0
10
20
30
40
50
60
70
80
90
100
-100
17
NPS
0
10
20
30
40
50
60
70
80
90
100
-100
17
NPS
FIRST-TIME (33) VS REPEAT VISITORS (67)
While both repeat and first-time visitors come primarily to spend time with their groups first-timers more often come as something to do while visiting the area These first-time visitors also rate lower than repeat visitors on NPS and OER
WHY IT MATTERS Museums often grapple with converting first-time visitors to repeat visitors members and donors but it is important to acknowledge that this is unlikely for out-of-town groups Distinguishing between different types of first-time visitors is critical to understanding how to encourage repeat visitation
RESIDENCE OF GROUPn=3612 n=7432
OVERALL EXPERIENCE RATING n=2309 n=3154
MOTIVATIONSn=3853 n=79322768 5315 2017
3141 287Locals-only
Out-of-towners only
Mixed group
Spend time together
Something to do while visiting the area
FIRST-TIME VISITORS
REPEAT VISITORS
33
54
12
SUPERIOR
SUPERIOR
EXCELLENT
EXCELLENT
GOOD
GOOD
52
15
31
2731
6841
5328
157
2017
641
745
0
10
20
30
40
50
60
70
80
90
100
-100
18
NPS
ADULT-ONLY GROUPS (21) VS GROUPS WITH KIDS (79)
ADULT ONLY GROUPS
GROUPS WITH KIDS
SUPERIOR
SUPERIOR
EXCELLENT
EXCELLENT
GOOD
GOOD
51
54
16
12
30
33
OVERALL EXPERIENCE RATINGn=1582 n=5505
ADULT AGEn=3660 n=12242
DATE OF LAST VISITn=2480 n=9061
INCOMEn=2434 n=8997
LGBT+n=2455 n=9015
608
740
Approximately one-fifth of visiting groups are composed solely of adults and though the phrase ldquoadult-only museum visitor groupsrdquo might make some think of older adults more than one-quarter of them are under the age of 25 Roughly half of these groups are first-time visitors and almost one-tenth identify as LGBT+
WHY IT MATTERS For institutions that donrsquot consider themselves childrenrsquos museums recognizing adult audiences is important as they bring a younger adult age group with less disposable income (24 households under $50Kyear compared with 15 for groups with kids) who come largely for personal entertainment reasons (28 compared with 5 for groups with kids) These groups however rate their experiences lower than visitors with children
28+5+28+29+9+39+21+2014+79+4 49+29
14+4+13+11+12+14+10+13+12+18+5+8+8+9+2922
18ndash24
25ndash34
35ndash44
45ndash64
65+
Yes Never visited
Under $25000
$25000ndash$49999
$50000ndash$74999
$75000ndash$99999
$100000ndash$149999
$150000ndash$199999
More than $200000
Prefer not to say not sure
285
2829
4
399
2120
147
9 49
11
1311
1214
1013
12
58
8
2922
9
18
29
4
0
10
20
30
40
50
60
70
80
90
100
-100
19
NPS
0
10
20
30
40
50
60
70
80
90
100
-100
19
NPS
7+5 67+27+6789+91 84+88 86+87 90+92 8890
LOCAL NON-MEMBERS (44)
VS OUT-OF-TOWN NON-MEMBERS (36)
LOCALS
OUT-OF-TOWNERS
SUPERIOR
SUPERIOR
EXCELLENT
EXCELLENT
GOOD
GOOD536
326
MOTIVATIONSn=3352 n=2737
EXPERIENCE RATINGSAverage rating scale from 0 to 10 where 10 is highest n varies
DATE OF LAST VISITn=3309 n=2692
OVERALL EXPERIENCE RATINGn=2055 n=1601
32
16
53
53
Education experience
Value for cost
Exhibits in working order
Staff member helpfulness
Restrooms cleanliness
lt 3 months
3-6 mos
6-12 mos
67
2767
893907
842875
863874
906920
875896
14
29
Since members are much more likely to be local members are excluded from analyses on this page to highlight differences that are unique to non-member locals and out-of-towners Almost half of all non-member visitors report coming in locals-only groups (ie not bringing out-of-town guests with them) and consistent with the overall aggregate data tend to come to spend time with their group While out-of-town-only non-member groups come instead as something to do while visiting the area these out-of-towners also rate their experiences slightly higher than the locals
WHY IT MATTERS Removing members (and their higher ratings) from the analyses shows that out-of-town-only groups rate their experience more highly than local-only groups Together with the analysis of first-time and repeat visitors this suggests that there is the most room to improve in serving local first-time visitors
659 664
4130 4+35 11+2 12+2 12+4Spend time together
Something to do while visiting the area
41 11 752
12
12
2
4
435
305-10 yrs
10+ yrs
Never
-100
NPS
20
0
10
20
30
40
50
60
70
80
90
100
-100
SUMMER (JULndashSEP) FALL (OCTndashDEC)
WINTER (JANndashMAR) AND SPRING (APRndashJUN)
SUPERIOR
SUPERIOR
SUPERIOR
EXCELLENT
EXCELLENT
EXCELLENT
GOOD
GOOD
GOOD
36
31
32
50
54
53
FALL AUDIENCES | n=898
WINTER AUDIENCES | n=3306
SPRING AUDIENCES | n=2883
OVERALL EXPERIENCE RATING EXPERIENCE RATINGSAverage rating scale from 0 to 10 where 10 is highest n varies
896897893891
873885869864
881884866867
929929910910
One advantage of the ongoing nature of COVES is the ability to compare ratings over time In this yearrsquos COVES data experience ratings appear to be highest in the Fall quarter (from Oct to Dec 2017)
WHY IT MATTERS Museum visitation varies by season with many museums busier in the summer months than the fall as school goes back into session Some museums also bring temporary exhibitions throughout the year These and other factors can influence experience ratings at any given time in the year
90+90+89+89 87+89+87+86 88+88+87+87 93+93+91+91
Entertainment experience
Value for cost
Exhibits in working order
Staff member helpfulness
Summer data not included because the question was not added until Oct 2017
20
722 718702
13
13
14
703
0
10
20
30
40
50
60
70
80
90
100
-100
21
NPS NPS
21-100
0
10
20
30
40
50
60
80
90
100
70
LARGE MEDIUM AND SMALL INSTITUTIONS
Education experience
Entertainment experience
Value for cost
Exhibits in working order
Staff member helpfulness
The 2017-18 COVES cohort contained institutions of vastly different sizes with yearly visitation ranging from under 10000 visitors to over 1 million visitors Visitors to the smallest museums tend to give higher experience ratings The trend is especially clear in ratings for staff helpfulness and the value of the experience relative to the cost
WHY IT MATTERS Small and very small museums represent a higher proportion of the Association of Science-Technology Centers (ASTC) membership than medium and large museums Though large museums are often working with more resources small museums provide high quality visitor experiences
90+90+91 90+88+89+ 85+86+90+ 87+85+89 90+91+94
SUPERIOR
SUPERIOR
SUPERIOR
EXCELLENT
EXCELLENT
EXCELLENT
GOOD
GOOD
GOOD
LARGE INSTITUTIONS | n=3069
MEDIUM INSTITUTIONS | n=1818
SMALL INSTITUTIONS | n=2201
OVERALL EXPERIENCE RATING
32
906896910
898887894
852863901
874852889
906914934
EXPERIENCE RATINGSAverage rating scale from 0 to 10 where 10 is highest n varies
713
18
14
33
53
12
53
14
32
54
686
728
22
GET INVOLVED IN COVESDo you want to see data from your institution represented in COVES We are always looking for new participants As more institutions join our field-wide dataset becomes more representative As of October 2018 we have 22 science centers participating in COVES
If you are interested in joining our collaboration or just want to learn more please contact us at infounderstandingvisitorsorg or visit our website at wwwunderstandingvisitorsorg Currently any Association of Science-Technology Centers (ASTC) member in good standing is eligible to join but we encourage people from all types of museums to contact us
Bradbury Science Museum
Center of Science and Industry (COSI)
Discovery Center Museum
Discovery Place Science
EcoTarium
Exploratorium
Great Lakes Science Center
Imagination Station
Museum of Discovery and Science
Museum of Science Boston
Natural History Museum of Utah
New York Hall of Science
Oregon Museum of Science and Industry
Orlando Science Center
Roseville Utility Exploration Center
Saint Louis Science Center
Science Center of Iowa
Science Museum of Minnesota
Science World British Columbia
Terry Lee Wells Nevada Museum of Discovery
The DoSeum
The Franklin Institute
SCIENCE CENTERS PARTICIPATING IN COVES AS OF OCTOBER 2018
understandingvisitorsorg
10
WHY ARE THE DATA INTERESTINGThese data represent a collaborative ongoing multi-institutional science center visitor study Because the data were collected using a common method and survey instrument they can be combinedmdashor aggregatedmdashtogether The resulting aggregate data can help us learn more about visitors not just at one science center but across several different science centers Although many science centers collect visitor experience data this ongoing collaboration is the first of its kind in our field
The aggregate data are not representative of any individual institution but instead represent the group as a whole This obscures individual differences between institutions but provides insight into broad trends in science center visitors Although this group is not representative of the science center field as a whole the institutions included here are diverse in size and location within North America
Pages 12ndash15 provide a comprehensive basic overview of the data while pages 16-22 describe trends and comparisons between different sub-groups such as members or first-time visitors These comparisons are descriptive in nature and do not present statistical findings from inferential analyses
AS YOU REVIEW THESE DATA CONSIDER THE FOLLOWING QUESTIONS
ɠ Are any of these findings surprising
ɠ Do any of these findings confirm assumptions or expectations
ɠ If you work at a museum that is not part of COVES how do you think your institutionrsquos data would compare to the aggregate data in this report
ɠ What do these data suggest about trends among science center visitors
ɠ What types of actions might we take as a field based on these data
ɠ What further questions arise after seeing these data
11
HOW TO READ AND INTERPRET THE GRAPHS IN THIS REPORT
OVERALL EXPERIENCE RATING (OER)
ldquoPlease rate your overall experience at [Institution Name] todayrdquo
NET PROMOTER SCORE (NPS)ldquoOn a scale from 0 to 10 how likely are you to recommend [Institution Name] to a friend or colleaguerdquo
SUPERIOR
EXCELLENT
GOOD 52
9
37
Net promoter scores from different institutions are presented on the blue pages (pages 16ndash22) on these vertical scales Each dot represents an institutionrsquos NPS
This dark gray circle represents the average NPS across institutions
Net Promoter Score is calculated by subtracting the percentage of ldquoDetractorsrdquo (ratings of 0-6) from the percentage of ldquoPromotersrdquo (ratings of 9-10) In this example 757ndash46=711 The net score has a possible range of -100
Each colored bar represents the average percentage of visitors across institutions who selected that rating (ie ldquoSuperiorrdquo)
ldquoFairrdquo and ldquoPoorrdquo are additional response options on the OER scale but are not displayed because they represent such small percentages (less than 2 combined)
The NPS scale goes from -100 to 100 but we are representing a truncated version The scale on each blue page is the same so they can be compared
40
50
60
70
80
90
100
-100
76+20+5Promoters (9-10)
Passives (7-8)
Detractors (0-6)
711-100 100
0
757
196
46
711
12
GROUP DEMOGRAPHICSThe COVES protocol involves selecting one adult from a visitor group to be the primary respondent but the survey asks for some information that describes the entire visiting group This information is summarized below
AVERAGE GROUP SIZEn=11601 (adults) n=11480 (children)
GROUP COMPOSITIONn=11601 (adults) n=11480 (children)
ADULT AGE AND GENDER BREAKDOWNS n=11786
CHILD AGE AND GENDER BREAKDOWNSn=11786
PERMANENT OR TEMPORARY DISABILITY n=11468
RESIDENCE OF GROUPn=11044
11+28+32+20+9 38+59+3+1
3150+10+104234
21+29+3011+923+38+32+8 51+471 8+87+5
55+28+18Avg number of adults
Avg number of children
1 Adult
2 Adults
3 Adults
4+ Adults
0ndash3
4ndash7
8ndash12
13ndash17
Male
Female
Prefer not to say
Another category
Yes
No
Prefer not to say
0 Children
1 Child
2 Children
3 Children
4+ Children
31
21
17
11 38
28 59
32 3
20 1
9
21
2351
47
8
87
1
lt1
5
38
32
8
55
28
18
29
30
11
9
50
10
10
18-24
25-34
35-44
45-64
65+
Male
Female
Prefer not to say
Another category
Locals-only
Out-of-towners only
Mixed group
WH
O V
ISIT
S
13 13
Some HS
HS
Some college
College
Some grad
Grad
Prefer not to say
INDIVIDUAL RESPONDENT DEMOGRAPHICSThe survey also asks for some information from the primary respondent only This information is summarized below
MEMBERSHIPn=11497
NUMBER OF VISITS IN THE LAST YEARn=10314
EDUCATIONn=11600
RACEETHNICITYn=11430
LGBT+ IDENTIFICATIONn=11471
US RESIDENCEn=11066
HOUSEHOLD INCOMEn=11431
DATE OF LAST VISITn=1154030+70
56+29+15
96+45+87+1+7
1+6+15+36+5+32+35+11+13+12+17+8+4+2+3+24
21+11+8+10+7+5+6+33+165+7+6+5+1+0+8+7+2
Members
Non-members
Within the past 3 months
3-6 months ago
6 months-1 year
1-2 years ago
2-5 years ago
5-10 years ago
10+ years ago
Never
Not sure
30
56
22
11
8
9
6
4
5
33
65
96
5
87
1
7
4
6
6
5
1
lt1
8
7
2
1
1
6
16
37
5
3
31
5
12
14
12
17
8
4
3
24
2
29
15
70
1st visit
2-4
5+
Under $25000
$25000ndash$49999
$50000ndash$74999
$75000ndash$99999
$100000ndash$149999
$150000ndash$199999
$200000ndash$249999
$250000ndash$300000
More than $300000
Prefer not to sayNot sure
White
Asian
HispanicLatinx
BlackAfrican American
Amer Indian or Alaskan Native
Native HawaiianPacific Islander
Multiple races identified
Prefer not to say
Other
Yes
No
Not sure
Prefer not to say
$
Yes
No
WH
O V
ISIT
S
14
6+27+32+19+10+4+138+25+17+14+10+10++8+8+7+6+5To spend time together as a group or family
For funentertainment for group
For an educational experience for group
Something to do while visiting the area
For funentertainment for myself
To see a specific exhibit program or show
Because thatrsquos what good parents do
To bring out of town friendsfamily
For an educational experience for myself
Wanted something to do in poor weather
Had a couponfree pass
MOTIVATIONSn=11786
LENGTH OF STAY
lt1 hour
1-2 hrs
2-3 hrs
3-4 hrs
4-5 hrs
5-6 hrs
6+ hrs
WH
Y T
HE
Y V
ISIT
38
25
17
14
10
10
8
8
7
6
5
6
27
32
19
10
4
1
Avg stay time was 2 hours and
40 minutes
240
STAY TIMEn=11455
Visitors may have several reasons for deciding to come to a science center or museum In the COVES survey they select the two most important reasons for visiting from the list below which displays in a random order
15 15
92+90+89+89+88+87+8783
76+20+5
NET PROMOTER SCORE amp EXPERIENCE RATINGSTwo commonly-used metrics in the science centers are Net Promoter Score and Overall Experience Rating Overall Experience Rating is a direct experience rating while Net Promoter Score asks how likely the respondent is to recommend the institution The COVES survey also asks respondents to rate their agreement with eight statements about specific aspects of the visit
905
894
873
874
919
888
828
882
EXPERIENCE RATINGSAverage rating scale from 0 to 10 where 10 is highest n varies
NET PROMOTER SCORE n=11631
OVERALL EXPERIENCE RATINGn=7088
NET PROMOTER SCORE RANGE ACROSS INSTITUTIONS
Promoters
Passives
Detractors
757
196
46
50
60
70
80
90
100
-100
SUPERIOR
EXCELLENT
GOOD
FAIR
POOR
53
13
537
984
42141
14
13
2
32Staff member helpfulness
Education experience
Entertainment experience
Restroom cleanliness
Gift shop experience
Exhibits in working order
Value for cost
Cafeacuterestaurant experience
Of the promoters this is the breakdown of their Overall Experience Rating (left to right good excellent superior)
Of those who rated their experience ldquosuperiorrdquo here is the breakdown of their NPS
PROMOTERPASSIVE
711-100 100
0
HO
W T
HE
Y R
AT
E T
HE
IR V
ISIT
711
0
10
20
30
40
50
60
70
80
90
100
-100
16
NPS
Museum members have strong connections with their home institution As seen below 86 of members report visiting multiple times in the last 12 months (compared with only 23 of non-members) with 43 visiting 5 or more times These visitors also rate their experience more positively across the board including NPS OER and all experience ratings
WHY IT MATTERS Members are an integral part of museum audiences They visit often and rate the museum experience highly In fact member and non-member differences are so strong that they influence the differences between other groups such as locals vs out-of-town visitors
DATE OF LAST VISITn=3404 n=7938
OVERALL EXPERIENCE RATINGn=1378 n=4811
NUMBER OF VISITS IN THE LAST YEARn=3152 n=6988
EXPERIENCE RATINGSAverage rating scale from 0 to 10 where 10 is highest
n varies59+7 19+8 8+9
92+90+ 92+89+ 91+86 89+87 93+91 90+88 84+82 90+8713+7544+2045+5lt3 months
3ndash6 months
6ndash12 months
1st
2ndash4
5+
MEMBERS
NON-MEMBERS
37
30
53
53
9
15
MEMBERS (30) VS NON-MEMBERS (70)
SUPERIOR
SUPERIOR
EXCELLENT
EXCELLENT
GOOD
GOOD
59
919
43
1375
4420
5
899
916885
906857
885868
933
895
842821
902873
884
912
7
198
89
820
668
Education experience
Entertainment experience
Value for cost
Exhibits in working order
Staff member helpfulness
Restroom cleanliness
Cafeacuterestaurant experience
Gift shop experience
0
10
20
30
40
50
60
70
80
90
100
-100
17
NPS
0
10
20
30
40
50
60
70
80
90
100
-100
17
NPS
FIRST-TIME (33) VS REPEAT VISITORS (67)
While both repeat and first-time visitors come primarily to spend time with their groups first-timers more often come as something to do while visiting the area These first-time visitors also rate lower than repeat visitors on NPS and OER
WHY IT MATTERS Museums often grapple with converting first-time visitors to repeat visitors members and donors but it is important to acknowledge that this is unlikely for out-of-town groups Distinguishing between different types of first-time visitors is critical to understanding how to encourage repeat visitation
RESIDENCE OF GROUPn=3612 n=7432
OVERALL EXPERIENCE RATING n=2309 n=3154
MOTIVATIONSn=3853 n=79322768 5315 2017
3141 287Locals-only
Out-of-towners only
Mixed group
Spend time together
Something to do while visiting the area
FIRST-TIME VISITORS
REPEAT VISITORS
33
54
12
SUPERIOR
SUPERIOR
EXCELLENT
EXCELLENT
GOOD
GOOD
52
15
31
2731
6841
5328
157
2017
641
745
0
10
20
30
40
50
60
70
80
90
100
-100
18
NPS
ADULT-ONLY GROUPS (21) VS GROUPS WITH KIDS (79)
ADULT ONLY GROUPS
GROUPS WITH KIDS
SUPERIOR
SUPERIOR
EXCELLENT
EXCELLENT
GOOD
GOOD
51
54
16
12
30
33
OVERALL EXPERIENCE RATINGn=1582 n=5505
ADULT AGEn=3660 n=12242
DATE OF LAST VISITn=2480 n=9061
INCOMEn=2434 n=8997
LGBT+n=2455 n=9015
608
740
Approximately one-fifth of visiting groups are composed solely of adults and though the phrase ldquoadult-only museum visitor groupsrdquo might make some think of older adults more than one-quarter of them are under the age of 25 Roughly half of these groups are first-time visitors and almost one-tenth identify as LGBT+
WHY IT MATTERS For institutions that donrsquot consider themselves childrenrsquos museums recognizing adult audiences is important as they bring a younger adult age group with less disposable income (24 households under $50Kyear compared with 15 for groups with kids) who come largely for personal entertainment reasons (28 compared with 5 for groups with kids) These groups however rate their experiences lower than visitors with children
28+5+28+29+9+39+21+2014+79+4 49+29
14+4+13+11+12+14+10+13+12+18+5+8+8+9+2922
18ndash24
25ndash34
35ndash44
45ndash64
65+
Yes Never visited
Under $25000
$25000ndash$49999
$50000ndash$74999
$75000ndash$99999
$100000ndash$149999
$150000ndash$199999
More than $200000
Prefer not to say not sure
285
2829
4
399
2120
147
9 49
11
1311
1214
1013
12
58
8
2922
9
18
29
4
0
10
20
30
40
50
60
70
80
90
100
-100
19
NPS
0
10
20
30
40
50
60
70
80
90
100
-100
19
NPS
7+5 67+27+6789+91 84+88 86+87 90+92 8890
LOCAL NON-MEMBERS (44)
VS OUT-OF-TOWN NON-MEMBERS (36)
LOCALS
OUT-OF-TOWNERS
SUPERIOR
SUPERIOR
EXCELLENT
EXCELLENT
GOOD
GOOD536
326
MOTIVATIONSn=3352 n=2737
EXPERIENCE RATINGSAverage rating scale from 0 to 10 where 10 is highest n varies
DATE OF LAST VISITn=3309 n=2692
OVERALL EXPERIENCE RATINGn=2055 n=1601
32
16
53
53
Education experience
Value for cost
Exhibits in working order
Staff member helpfulness
Restrooms cleanliness
lt 3 months
3-6 mos
6-12 mos
67
2767
893907
842875
863874
906920
875896
14
29
Since members are much more likely to be local members are excluded from analyses on this page to highlight differences that are unique to non-member locals and out-of-towners Almost half of all non-member visitors report coming in locals-only groups (ie not bringing out-of-town guests with them) and consistent with the overall aggregate data tend to come to spend time with their group While out-of-town-only non-member groups come instead as something to do while visiting the area these out-of-towners also rate their experiences slightly higher than the locals
WHY IT MATTERS Removing members (and their higher ratings) from the analyses shows that out-of-town-only groups rate their experience more highly than local-only groups Together with the analysis of first-time and repeat visitors this suggests that there is the most room to improve in serving local first-time visitors
659 664
4130 4+35 11+2 12+2 12+4Spend time together
Something to do while visiting the area
41 11 752
12
12
2
4
435
305-10 yrs
10+ yrs
Never
-100
NPS
20
0
10
20
30
40
50
60
70
80
90
100
-100
SUMMER (JULndashSEP) FALL (OCTndashDEC)
WINTER (JANndashMAR) AND SPRING (APRndashJUN)
SUPERIOR
SUPERIOR
SUPERIOR
EXCELLENT
EXCELLENT
EXCELLENT
GOOD
GOOD
GOOD
36
31
32
50
54
53
FALL AUDIENCES | n=898
WINTER AUDIENCES | n=3306
SPRING AUDIENCES | n=2883
OVERALL EXPERIENCE RATING EXPERIENCE RATINGSAverage rating scale from 0 to 10 where 10 is highest n varies
896897893891
873885869864
881884866867
929929910910
One advantage of the ongoing nature of COVES is the ability to compare ratings over time In this yearrsquos COVES data experience ratings appear to be highest in the Fall quarter (from Oct to Dec 2017)
WHY IT MATTERS Museum visitation varies by season with many museums busier in the summer months than the fall as school goes back into session Some museums also bring temporary exhibitions throughout the year These and other factors can influence experience ratings at any given time in the year
90+90+89+89 87+89+87+86 88+88+87+87 93+93+91+91
Entertainment experience
Value for cost
Exhibits in working order
Staff member helpfulness
Summer data not included because the question was not added until Oct 2017
20
722 718702
13
13
14
703
0
10
20
30
40
50
60
70
80
90
100
-100
21
NPS NPS
21-100
0
10
20
30
40
50
60
80
90
100
70
LARGE MEDIUM AND SMALL INSTITUTIONS
Education experience
Entertainment experience
Value for cost
Exhibits in working order
Staff member helpfulness
The 2017-18 COVES cohort contained institutions of vastly different sizes with yearly visitation ranging from under 10000 visitors to over 1 million visitors Visitors to the smallest museums tend to give higher experience ratings The trend is especially clear in ratings for staff helpfulness and the value of the experience relative to the cost
WHY IT MATTERS Small and very small museums represent a higher proportion of the Association of Science-Technology Centers (ASTC) membership than medium and large museums Though large museums are often working with more resources small museums provide high quality visitor experiences
90+90+91 90+88+89+ 85+86+90+ 87+85+89 90+91+94
SUPERIOR
SUPERIOR
SUPERIOR
EXCELLENT
EXCELLENT
EXCELLENT
GOOD
GOOD
GOOD
LARGE INSTITUTIONS | n=3069
MEDIUM INSTITUTIONS | n=1818
SMALL INSTITUTIONS | n=2201
OVERALL EXPERIENCE RATING
32
906896910
898887894
852863901
874852889
906914934
EXPERIENCE RATINGSAverage rating scale from 0 to 10 where 10 is highest n varies
713
18
14
33
53
12
53
14
32
54
686
728
22
GET INVOLVED IN COVESDo you want to see data from your institution represented in COVES We are always looking for new participants As more institutions join our field-wide dataset becomes more representative As of October 2018 we have 22 science centers participating in COVES
If you are interested in joining our collaboration or just want to learn more please contact us at infounderstandingvisitorsorg or visit our website at wwwunderstandingvisitorsorg Currently any Association of Science-Technology Centers (ASTC) member in good standing is eligible to join but we encourage people from all types of museums to contact us
Bradbury Science Museum
Center of Science and Industry (COSI)
Discovery Center Museum
Discovery Place Science
EcoTarium
Exploratorium
Great Lakes Science Center
Imagination Station
Museum of Discovery and Science
Museum of Science Boston
Natural History Museum of Utah
New York Hall of Science
Oregon Museum of Science and Industry
Orlando Science Center
Roseville Utility Exploration Center
Saint Louis Science Center
Science Center of Iowa
Science Museum of Minnesota
Science World British Columbia
Terry Lee Wells Nevada Museum of Discovery
The DoSeum
The Franklin Institute
SCIENCE CENTERS PARTICIPATING IN COVES AS OF OCTOBER 2018
understandingvisitorsorg
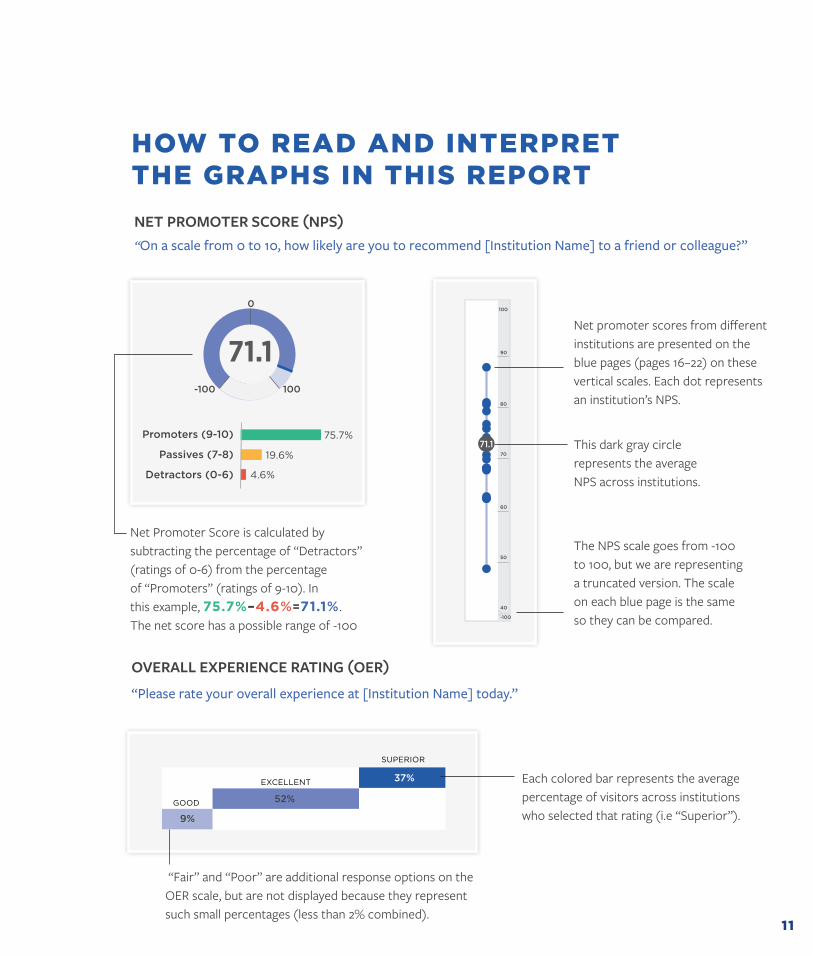
11
HOW TO READ AND INTERPRET THE GRAPHS IN THIS REPORT
OVERALL EXPERIENCE RATING (OER)
ldquoPlease rate your overall experience at [Institution Name] todayrdquo
NET PROMOTER SCORE (NPS)ldquoOn a scale from 0 to 10 how likely are you to recommend [Institution Name] to a friend or colleaguerdquo
SUPERIOR
EXCELLENT
GOOD 52
9
37
Net promoter scores from different institutions are presented on the blue pages (pages 16ndash22) on these vertical scales Each dot represents an institutionrsquos NPS
This dark gray circle represents the average NPS across institutions
Net Promoter Score is calculated by subtracting the percentage of ldquoDetractorsrdquo (ratings of 0-6) from the percentage of ldquoPromotersrdquo (ratings of 9-10) In this example 757ndash46=711 The net score has a possible range of -100
Each colored bar represents the average percentage of visitors across institutions who selected that rating (ie ldquoSuperiorrdquo)
ldquoFairrdquo and ldquoPoorrdquo are additional response options on the OER scale but are not displayed because they represent such small percentages (less than 2 combined)
The NPS scale goes from -100 to 100 but we are representing a truncated version The scale on each blue page is the same so they can be compared
40
50
60
70
80
90
100
-100
76+20+5Promoters (9-10)
Passives (7-8)
Detractors (0-6)
711-100 100
0
757
196
46
711
12
GROUP DEMOGRAPHICSThe COVES protocol involves selecting one adult from a visitor group to be the primary respondent but the survey asks for some information that describes the entire visiting group This information is summarized below
AVERAGE GROUP SIZEn=11601 (adults) n=11480 (children)
GROUP COMPOSITIONn=11601 (adults) n=11480 (children)
ADULT AGE AND GENDER BREAKDOWNS n=11786
CHILD AGE AND GENDER BREAKDOWNSn=11786
PERMANENT OR TEMPORARY DISABILITY n=11468
RESIDENCE OF GROUPn=11044
11+28+32+20+9 38+59+3+1
3150+10+104234
21+29+3011+923+38+32+8 51+471 8+87+5
55+28+18Avg number of adults
Avg number of children
1 Adult
2 Adults
3 Adults
4+ Adults
0ndash3
4ndash7
8ndash12
13ndash17
Male
Female
Prefer not to say
Another category
Yes
No
Prefer not to say
0 Children
1 Child
2 Children
3 Children
4+ Children
31
21
17
11 38
28 59
32 3
20 1
9
21
2351
47
8
87
1
lt1
5
38
32
8
55
28
18
29
30
11
9
50
10
10
18-24
25-34
35-44
45-64
65+
Male
Female
Prefer not to say
Another category
Locals-only
Out-of-towners only
Mixed group
WH
O V
ISIT
S
13 13
Some HS
HS
Some college
College
Some grad
Grad
Prefer not to say
INDIVIDUAL RESPONDENT DEMOGRAPHICSThe survey also asks for some information from the primary respondent only This information is summarized below
MEMBERSHIPn=11497
NUMBER OF VISITS IN THE LAST YEARn=10314
EDUCATIONn=11600
RACEETHNICITYn=11430
LGBT+ IDENTIFICATIONn=11471
US RESIDENCEn=11066
HOUSEHOLD INCOMEn=11431
DATE OF LAST VISITn=1154030+70
56+29+15
96+45+87+1+7
1+6+15+36+5+32+35+11+13+12+17+8+4+2+3+24
21+11+8+10+7+5+6+33+165+7+6+5+1+0+8+7+2
Members
Non-members
Within the past 3 months
3-6 months ago
6 months-1 year
1-2 years ago
2-5 years ago
5-10 years ago
10+ years ago
Never
Not sure
30
56
22
11
8
9
6
4
5
33
65
96
5
87
1
7
4
6
6
5
1
lt1
8
7
2
1
1
6
16
37
5
3
31
5
12
14
12
17
8
4
3
24
2
29
15
70
1st visit
2-4
5+
Under $25000
$25000ndash$49999
$50000ndash$74999
$75000ndash$99999
$100000ndash$149999
$150000ndash$199999
$200000ndash$249999
$250000ndash$300000
More than $300000
Prefer not to sayNot sure
White
Asian
HispanicLatinx
BlackAfrican American
Amer Indian or Alaskan Native
Native HawaiianPacific Islander
Multiple races identified
Prefer not to say
Other
Yes
No
Not sure
Prefer not to say
$
Yes
No
WH
O V
ISIT
S
14
6+27+32+19+10+4+138+25+17+14+10+10++8+8+7+6+5To spend time together as a group or family
For funentertainment for group
For an educational experience for group
Something to do while visiting the area
For funentertainment for myself
To see a specific exhibit program or show
Because thatrsquos what good parents do
To bring out of town friendsfamily
For an educational experience for myself
Wanted something to do in poor weather
Had a couponfree pass
MOTIVATIONSn=11786
LENGTH OF STAY
lt1 hour
1-2 hrs
2-3 hrs
3-4 hrs
4-5 hrs
5-6 hrs
6+ hrs
WH
Y T
HE
Y V
ISIT
38
25
17
14
10
10
8
8
7
6
5
6
27
32
19
10
4
1
Avg stay time was 2 hours and
40 minutes
240
STAY TIMEn=11455
Visitors may have several reasons for deciding to come to a science center or museum In the COVES survey they select the two most important reasons for visiting from the list below which displays in a random order
15 15
92+90+89+89+88+87+8783
76+20+5
NET PROMOTER SCORE amp EXPERIENCE RATINGSTwo commonly-used metrics in the science centers are Net Promoter Score and Overall Experience Rating Overall Experience Rating is a direct experience rating while Net Promoter Score asks how likely the respondent is to recommend the institution The COVES survey also asks respondents to rate their agreement with eight statements about specific aspects of the visit
905
894
873
874
919
888
828
882
EXPERIENCE RATINGSAverage rating scale from 0 to 10 where 10 is highest n varies
NET PROMOTER SCORE n=11631
OVERALL EXPERIENCE RATINGn=7088
NET PROMOTER SCORE RANGE ACROSS INSTITUTIONS
Promoters
Passives
Detractors
757
196
46
50
60
70
80
90
100
-100
SUPERIOR
EXCELLENT
GOOD
FAIR
POOR
53
13
537
984
42141
14
13
2
32Staff member helpfulness
Education experience
Entertainment experience
Restroom cleanliness
Gift shop experience
Exhibits in working order
Value for cost
Cafeacuterestaurant experience
Of the promoters this is the breakdown of their Overall Experience Rating (left to right good excellent superior)
Of those who rated their experience ldquosuperiorrdquo here is the breakdown of their NPS
PROMOTERPASSIVE
711-100 100
0
HO
W T
HE
Y R
AT
E T
HE
IR V
ISIT
711
0
10
20
30
40
50
60
70
80
90
100
-100
16
NPS
Museum members have strong connections with their home institution As seen below 86 of members report visiting multiple times in the last 12 months (compared with only 23 of non-members) with 43 visiting 5 or more times These visitors also rate their experience more positively across the board including NPS OER and all experience ratings
WHY IT MATTERS Members are an integral part of museum audiences They visit often and rate the museum experience highly In fact member and non-member differences are so strong that they influence the differences between other groups such as locals vs out-of-town visitors
DATE OF LAST VISITn=3404 n=7938
OVERALL EXPERIENCE RATINGn=1378 n=4811
NUMBER OF VISITS IN THE LAST YEARn=3152 n=6988
EXPERIENCE RATINGSAverage rating scale from 0 to 10 where 10 is highest
n varies59+7 19+8 8+9
92+90+ 92+89+ 91+86 89+87 93+91 90+88 84+82 90+8713+7544+2045+5lt3 months
3ndash6 months
6ndash12 months
1st
2ndash4
5+
MEMBERS
NON-MEMBERS
37
30
53
53
9
15
MEMBERS (30) VS NON-MEMBERS (70)
SUPERIOR
SUPERIOR
EXCELLENT
EXCELLENT
GOOD
GOOD
59
919
43
1375
4420
5
899
916885
906857
885868
933
895
842821
902873
884
912
7
198
89
820
668
Education experience
Entertainment experience
Value for cost
Exhibits in working order
Staff member helpfulness
Restroom cleanliness
Cafeacuterestaurant experience
Gift shop experience
0
10
20
30
40
50
60
70
80
90
100
-100
17
NPS
0
10
20
30
40
50
60
70
80
90
100
-100
17
NPS
FIRST-TIME (33) VS REPEAT VISITORS (67)
While both repeat and first-time visitors come primarily to spend time with their groups first-timers more often come as something to do while visiting the area These first-time visitors also rate lower than repeat visitors on NPS and OER
WHY IT MATTERS Museums often grapple with converting first-time visitors to repeat visitors members and donors but it is important to acknowledge that this is unlikely for out-of-town groups Distinguishing between different types of first-time visitors is critical to understanding how to encourage repeat visitation
RESIDENCE OF GROUPn=3612 n=7432
OVERALL EXPERIENCE RATING n=2309 n=3154
MOTIVATIONSn=3853 n=79322768 5315 2017
3141 287Locals-only
Out-of-towners only
Mixed group
Spend time together
Something to do while visiting the area
FIRST-TIME VISITORS
REPEAT VISITORS
33
54
12
SUPERIOR
SUPERIOR
EXCELLENT
EXCELLENT
GOOD
GOOD
52
15
31
2731
6841
5328
157
2017
641
745
0
10
20
30
40
50
60
70
80
90
100
-100
18
NPS
ADULT-ONLY GROUPS (21) VS GROUPS WITH KIDS (79)
ADULT ONLY GROUPS
GROUPS WITH KIDS
SUPERIOR
SUPERIOR
EXCELLENT
EXCELLENT
GOOD
GOOD
51
54
16
12
30
33
OVERALL EXPERIENCE RATINGn=1582 n=5505
ADULT AGEn=3660 n=12242
DATE OF LAST VISITn=2480 n=9061
INCOMEn=2434 n=8997
LGBT+n=2455 n=9015
608
740
Approximately one-fifth of visiting groups are composed solely of adults and though the phrase ldquoadult-only museum visitor groupsrdquo might make some think of older adults more than one-quarter of them are under the age of 25 Roughly half of these groups are first-time visitors and almost one-tenth identify as LGBT+
WHY IT MATTERS For institutions that donrsquot consider themselves childrenrsquos museums recognizing adult audiences is important as they bring a younger adult age group with less disposable income (24 households under $50Kyear compared with 15 for groups with kids) who come largely for personal entertainment reasons (28 compared with 5 for groups with kids) These groups however rate their experiences lower than visitors with children
28+5+28+29+9+39+21+2014+79+4 49+29
14+4+13+11+12+14+10+13+12+18+5+8+8+9+2922
18ndash24
25ndash34
35ndash44
45ndash64
65+
Yes Never visited
Under $25000
$25000ndash$49999
$50000ndash$74999
$75000ndash$99999
$100000ndash$149999
$150000ndash$199999
More than $200000
Prefer not to say not sure
285
2829
4
399
2120
147
9 49
11
1311
1214
1013
12
58
8
2922
9
18
29
4
0
10
20
30
40
50
60
70
80
90
100
-100
19
NPS
0
10
20
30
40
50
60
70
80
90
100
-100
19
NPS
7+5 67+27+6789+91 84+88 86+87 90+92 8890
LOCAL NON-MEMBERS (44)
VS OUT-OF-TOWN NON-MEMBERS (36)
LOCALS
OUT-OF-TOWNERS
SUPERIOR
SUPERIOR
EXCELLENT
EXCELLENT
GOOD
GOOD536
326
MOTIVATIONSn=3352 n=2737
EXPERIENCE RATINGSAverage rating scale from 0 to 10 where 10 is highest n varies
DATE OF LAST VISITn=3309 n=2692
OVERALL EXPERIENCE RATINGn=2055 n=1601
32
16
53
53
Education experience
Value for cost
Exhibits in working order
Staff member helpfulness
Restrooms cleanliness
lt 3 months
3-6 mos
6-12 mos
67
2767
893907
842875
863874
906920
875896
14
29
Since members are much more likely to be local members are excluded from analyses on this page to highlight differences that are unique to non-member locals and out-of-towners Almost half of all non-member visitors report coming in locals-only groups (ie not bringing out-of-town guests with them) and consistent with the overall aggregate data tend to come to spend time with their group While out-of-town-only non-member groups come instead as something to do while visiting the area these out-of-towners also rate their experiences slightly higher than the locals
WHY IT MATTERS Removing members (and their higher ratings) from the analyses shows that out-of-town-only groups rate their experience more highly than local-only groups Together with the analysis of first-time and repeat visitors this suggests that there is the most room to improve in serving local first-time visitors
659 664
4130 4+35 11+2 12+2 12+4Spend time together
Something to do while visiting the area
41 11 752
12
12
2
4
435
305-10 yrs
10+ yrs
Never
-100
NPS
20
0
10
20
30
40
50
60
70
80
90
100
-100
SUMMER (JULndashSEP) FALL (OCTndashDEC)
WINTER (JANndashMAR) AND SPRING (APRndashJUN)
SUPERIOR
SUPERIOR
SUPERIOR
EXCELLENT
EXCELLENT
EXCELLENT
GOOD
GOOD
GOOD
36
31
32
50
54
53
FALL AUDIENCES | n=898
WINTER AUDIENCES | n=3306
SPRING AUDIENCES | n=2883
OVERALL EXPERIENCE RATING EXPERIENCE RATINGSAverage rating scale from 0 to 10 where 10 is highest n varies
896897893891
873885869864
881884866867
929929910910
One advantage of the ongoing nature of COVES is the ability to compare ratings over time In this yearrsquos COVES data experience ratings appear to be highest in the Fall quarter (from Oct to Dec 2017)
WHY IT MATTERS Museum visitation varies by season with many museums busier in the summer months than the fall as school goes back into session Some museums also bring temporary exhibitions throughout the year These and other factors can influence experience ratings at any given time in the year
90+90+89+89 87+89+87+86 88+88+87+87 93+93+91+91
Entertainment experience
Value for cost
Exhibits in working order
Staff member helpfulness
Summer data not included because the question was not added until Oct 2017
20
722 718702
13
13
14
703
0
10
20
30
40
50
60
70
80
90
100
-100
21
NPS NPS
21-100
0
10
20
30
40
50
60
80
90
100
70
LARGE MEDIUM AND SMALL INSTITUTIONS
Education experience
Entertainment experience
Value for cost
Exhibits in working order
Staff member helpfulness
The 2017-18 COVES cohort contained institutions of vastly different sizes with yearly visitation ranging from under 10000 visitors to over 1 million visitors Visitors to the smallest museums tend to give higher experience ratings The trend is especially clear in ratings for staff helpfulness and the value of the experience relative to the cost
WHY IT MATTERS Small and very small museums represent a higher proportion of the Association of Science-Technology Centers (ASTC) membership than medium and large museums Though large museums are often working with more resources small museums provide high quality visitor experiences
90+90+91 90+88+89+ 85+86+90+ 87+85+89 90+91+94
SUPERIOR
SUPERIOR
SUPERIOR
EXCELLENT
EXCELLENT
EXCELLENT
GOOD
GOOD
GOOD
LARGE INSTITUTIONS | n=3069
MEDIUM INSTITUTIONS | n=1818
SMALL INSTITUTIONS | n=2201
OVERALL EXPERIENCE RATING
32
906896910
898887894
852863901
874852889
906914934
EXPERIENCE RATINGSAverage rating scale from 0 to 10 where 10 is highest n varies
713
18
14
33
53
12
53
14
32
54
686
728
22
GET INVOLVED IN COVESDo you want to see data from your institution represented in COVES We are always looking for new participants As more institutions join our field-wide dataset becomes more representative As of October 2018 we have 22 science centers participating in COVES
If you are interested in joining our collaboration or just want to learn more please contact us at infounderstandingvisitorsorg or visit our website at wwwunderstandingvisitorsorg Currently any Association of Science-Technology Centers (ASTC) member in good standing is eligible to join but we encourage people from all types of museums to contact us
Bradbury Science Museum
Center of Science and Industry (COSI)
Discovery Center Museum
Discovery Place Science
EcoTarium
Exploratorium
Great Lakes Science Center
Imagination Station
Museum of Discovery and Science
Museum of Science Boston
Natural History Museum of Utah
New York Hall of Science
Oregon Museum of Science and Industry
Orlando Science Center
Roseville Utility Exploration Center
Saint Louis Science Center
Science Center of Iowa
Science Museum of Minnesota
Science World British Columbia
Terry Lee Wells Nevada Museum of Discovery
The DoSeum
The Franklin Institute
SCIENCE CENTERS PARTICIPATING IN COVES AS OF OCTOBER 2018
understandingvisitorsorg
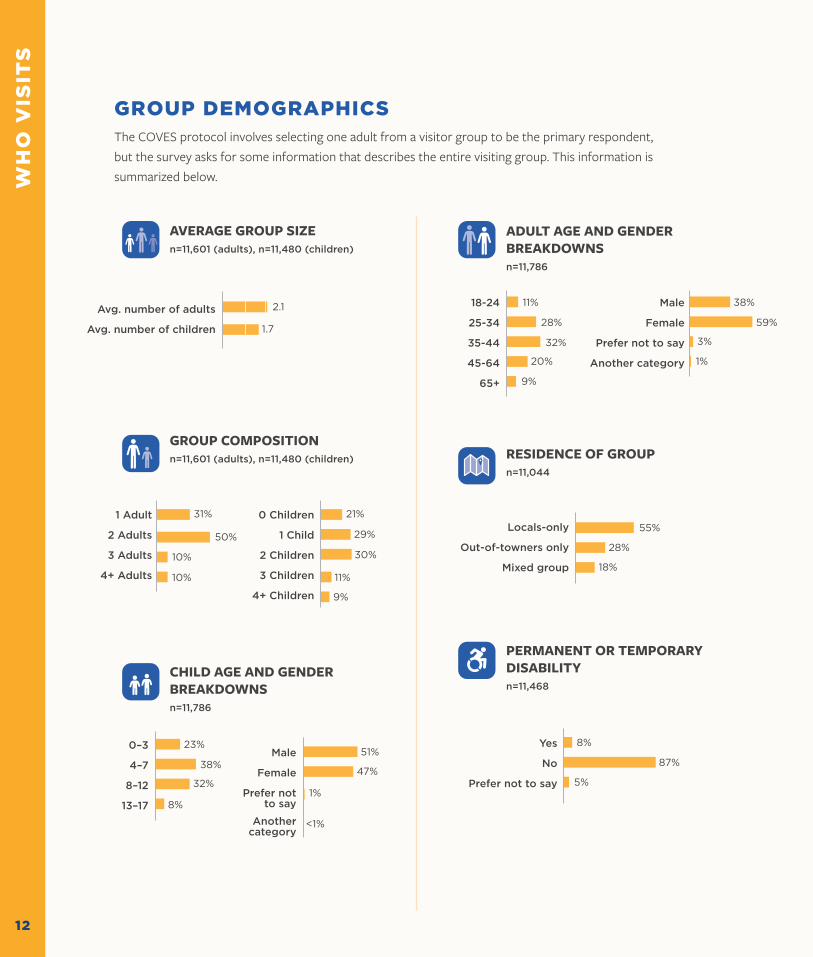
12
GROUP DEMOGRAPHICSThe COVES protocol involves selecting one adult from a visitor group to be the primary respondent but the survey asks for some information that describes the entire visiting group This information is summarized below
AVERAGE GROUP SIZEn=11601 (adults) n=11480 (children)
GROUP COMPOSITIONn=11601 (adults) n=11480 (children)
ADULT AGE AND GENDER BREAKDOWNS n=11786
CHILD AGE AND GENDER BREAKDOWNSn=11786
PERMANENT OR TEMPORARY DISABILITY n=11468
RESIDENCE OF GROUPn=11044
11+28+32+20+9 38+59+3+1
3150+10+104234
21+29+3011+923+38+32+8 51+471 8+87+5
55+28+18Avg number of adults
Avg number of children
1 Adult
2 Adults
3 Adults
4+ Adults
0ndash3
4ndash7
8ndash12
13ndash17
Male
Female
Prefer not to say
Another category
Yes
No
Prefer not to say
0 Children
1 Child
2 Children
3 Children
4+ Children
31
21
17
11 38
28 59
32 3
20 1
9
21
2351
47
8
87
1
lt1
5
38
32
8
55
28
18
29
30
11
9
50
10
10
18-24
25-34
35-44
45-64
65+
Male
Female
Prefer not to say
Another category
Locals-only
Out-of-towners only
Mixed group
WH
O V
ISIT
S
13 13
Some HS
HS
Some college
College
Some grad
Grad
Prefer not to say
INDIVIDUAL RESPONDENT DEMOGRAPHICSThe survey also asks for some information from the primary respondent only This information is summarized below
MEMBERSHIPn=11497
NUMBER OF VISITS IN THE LAST YEARn=10314
EDUCATIONn=11600
RACEETHNICITYn=11430
LGBT+ IDENTIFICATIONn=11471
US RESIDENCEn=11066
HOUSEHOLD INCOMEn=11431
DATE OF LAST VISITn=1154030+70
56+29+15
96+45+87+1+7
1+6+15+36+5+32+35+11+13+12+17+8+4+2+3+24
21+11+8+10+7+5+6+33+165+7+6+5+1+0+8+7+2
Members
Non-members
Within the past 3 months
3-6 months ago
6 months-1 year
1-2 years ago
2-5 years ago
5-10 years ago
10+ years ago
Never
Not sure
30
56
22
11
8
9
6
4
5
33
65
96
5
87
1
7
4
6
6
5
1
lt1
8
7
2
1
1
6
16
37
5
3
31
5
12
14
12
17
8
4
3
24
2
29
15
70
1st visit
2-4
5+
Under $25000
$25000ndash$49999
$50000ndash$74999
$75000ndash$99999
$100000ndash$149999
$150000ndash$199999
$200000ndash$249999
$250000ndash$300000
More than $300000
Prefer not to sayNot sure
White
Asian
HispanicLatinx
BlackAfrican American
Amer Indian or Alaskan Native
Native HawaiianPacific Islander
Multiple races identified
Prefer not to say
Other
Yes
No
Not sure
Prefer not to say
$
Yes
No
WH
O V
ISIT
S
14
6+27+32+19+10+4+138+25+17+14+10+10++8+8+7+6+5To spend time together as a group or family
For funentertainment for group
For an educational experience for group
Something to do while visiting the area
For funentertainment for myself
To see a specific exhibit program or show
Because thatrsquos what good parents do
To bring out of town friendsfamily
For an educational experience for myself
Wanted something to do in poor weather
Had a couponfree pass
MOTIVATIONSn=11786
LENGTH OF STAY
lt1 hour
1-2 hrs
2-3 hrs
3-4 hrs
4-5 hrs
5-6 hrs
6+ hrs
WH
Y T
HE
Y V
ISIT
38
25
17
14
10
10
8
8
7
6
5
6
27
32
19
10
4
1
Avg stay time was 2 hours and
40 minutes
240
STAY TIMEn=11455
Visitors may have several reasons for deciding to come to a science center or museum In the COVES survey they select the two most important reasons for visiting from the list below which displays in a random order
15 15
92+90+89+89+88+87+8783
76+20+5
NET PROMOTER SCORE amp EXPERIENCE RATINGSTwo commonly-used metrics in the science centers are Net Promoter Score and Overall Experience Rating Overall Experience Rating is a direct experience rating while Net Promoter Score asks how likely the respondent is to recommend the institution The COVES survey also asks respondents to rate their agreement with eight statements about specific aspects of the visit
905
894
873
874
919
888
828
882
EXPERIENCE RATINGSAverage rating scale from 0 to 10 where 10 is highest n varies
NET PROMOTER SCORE n=11631
OVERALL EXPERIENCE RATINGn=7088
NET PROMOTER SCORE RANGE ACROSS INSTITUTIONS
Promoters
Passives
Detractors
757
196
46
50
60
70
80
90
100
-100
SUPERIOR
EXCELLENT
GOOD
FAIR
POOR
53
13
537
984
42141
14
13
2
32Staff member helpfulness
Education experience
Entertainment experience
Restroom cleanliness
Gift shop experience
Exhibits in working order
Value for cost
Cafeacuterestaurant experience
Of the promoters this is the breakdown of their Overall Experience Rating (left to right good excellent superior)
Of those who rated their experience ldquosuperiorrdquo here is the breakdown of their NPS
PROMOTERPASSIVE
711-100 100
0
HO
W T
HE
Y R
AT
E T
HE
IR V
ISIT
711
0
10
20
30
40
50
60
70
80
90
100
-100
16
NPS
Museum members have strong connections with their home institution As seen below 86 of members report visiting multiple times in the last 12 months (compared with only 23 of non-members) with 43 visiting 5 or more times These visitors also rate their experience more positively across the board including NPS OER and all experience ratings
WHY IT MATTERS Members are an integral part of museum audiences They visit often and rate the museum experience highly In fact member and non-member differences are so strong that they influence the differences between other groups such as locals vs out-of-town visitors
DATE OF LAST VISITn=3404 n=7938
OVERALL EXPERIENCE RATINGn=1378 n=4811
NUMBER OF VISITS IN THE LAST YEARn=3152 n=6988
EXPERIENCE RATINGSAverage rating scale from 0 to 10 where 10 is highest
n varies59+7 19+8 8+9
92+90+ 92+89+ 91+86 89+87 93+91 90+88 84+82 90+8713+7544+2045+5lt3 months
3ndash6 months
6ndash12 months
1st
2ndash4
5+
MEMBERS
NON-MEMBERS
37
30
53
53
9
15
MEMBERS (30) VS NON-MEMBERS (70)
SUPERIOR
SUPERIOR
EXCELLENT
EXCELLENT
GOOD
GOOD
59
919
43
1375
4420
5
899
916885
906857
885868
933
895
842821
902873
884
912
7
198
89
820
668
Education experience
Entertainment experience
Value for cost
Exhibits in working order
Staff member helpfulness
Restroom cleanliness
Cafeacuterestaurant experience
Gift shop experience
0
10
20
30
40
50
60
70
80
90
100
-100
17
NPS
0
10
20
30
40
50
60
70
80
90
100
-100
17
NPS
FIRST-TIME (33) VS REPEAT VISITORS (67)
While both repeat and first-time visitors come primarily to spend time with their groups first-timers more often come as something to do while visiting the area These first-time visitors also rate lower than repeat visitors on NPS and OER
WHY IT MATTERS Museums often grapple with converting first-time visitors to repeat visitors members and donors but it is important to acknowledge that this is unlikely for out-of-town groups Distinguishing between different types of first-time visitors is critical to understanding how to encourage repeat visitation
RESIDENCE OF GROUPn=3612 n=7432
OVERALL EXPERIENCE RATING n=2309 n=3154
MOTIVATIONSn=3853 n=79322768 5315 2017
3141 287Locals-only
Out-of-towners only
Mixed group
Spend time together
Something to do while visiting the area
FIRST-TIME VISITORS
REPEAT VISITORS
33
54
12
SUPERIOR
SUPERIOR
EXCELLENT
EXCELLENT
GOOD
GOOD
52
15
31
2731
6841
5328
157
2017
641
745
0
10
20
30
40
50
60
70
80
90
100
-100
18
NPS
ADULT-ONLY GROUPS (21) VS GROUPS WITH KIDS (79)
ADULT ONLY GROUPS
GROUPS WITH KIDS
SUPERIOR
SUPERIOR
EXCELLENT
EXCELLENT
GOOD
GOOD
51
54
16
12
30
33
OVERALL EXPERIENCE RATINGn=1582 n=5505
ADULT AGEn=3660 n=12242
DATE OF LAST VISITn=2480 n=9061
INCOMEn=2434 n=8997
LGBT+n=2455 n=9015
608
740
Approximately one-fifth of visiting groups are composed solely of adults and though the phrase ldquoadult-only museum visitor groupsrdquo might make some think of older adults more than one-quarter of them are under the age of 25 Roughly half of these groups are first-time visitors and almost one-tenth identify as LGBT+
WHY IT MATTERS For institutions that donrsquot consider themselves childrenrsquos museums recognizing adult audiences is important as they bring a younger adult age group with less disposable income (24 households under $50Kyear compared with 15 for groups with kids) who come largely for personal entertainment reasons (28 compared with 5 for groups with kids) These groups however rate their experiences lower than visitors with children
28+5+28+29+9+39+21+2014+79+4 49+29
14+4+13+11+12+14+10+13+12+18+5+8+8+9+2922
18ndash24
25ndash34
35ndash44
45ndash64
65+
Yes Never visited
Under $25000
$25000ndash$49999
$50000ndash$74999
$75000ndash$99999
$100000ndash$149999
$150000ndash$199999
More than $200000
Prefer not to say not sure
285
2829
4
399
2120
147
9 49
11
1311
1214
1013
12
58
8
2922
9
18
29
4
0
10
20
30
40
50
60
70
80
90
100
-100
19
NPS
0
10
20
30
40
50
60
70
80
90
100
-100
19
NPS
7+5 67+27+6789+91 84+88 86+87 90+92 8890
LOCAL NON-MEMBERS (44)
VS OUT-OF-TOWN NON-MEMBERS (36)
LOCALS
OUT-OF-TOWNERS
SUPERIOR
SUPERIOR
EXCELLENT
EXCELLENT
GOOD
GOOD536
326
MOTIVATIONSn=3352 n=2737
EXPERIENCE RATINGSAverage rating scale from 0 to 10 where 10 is highest n varies
DATE OF LAST VISITn=3309 n=2692
OVERALL EXPERIENCE RATINGn=2055 n=1601
32
16
53
53
Education experience
Value for cost
Exhibits in working order
Staff member helpfulness
Restrooms cleanliness
lt 3 months
3-6 mos
6-12 mos
67
2767
893907
842875
863874
906920
875896
14
29
Since members are much more likely to be local members are excluded from analyses on this page to highlight differences that are unique to non-member locals and out-of-towners Almost half of all non-member visitors report coming in locals-only groups (ie not bringing out-of-town guests with them) and consistent with the overall aggregate data tend to come to spend time with their group While out-of-town-only non-member groups come instead as something to do while visiting the area these out-of-towners also rate their experiences slightly higher than the locals
WHY IT MATTERS Removing members (and their higher ratings) from the analyses shows that out-of-town-only groups rate their experience more highly than local-only groups Together with the analysis of first-time and repeat visitors this suggests that there is the most room to improve in serving local first-time visitors
659 664
4130 4+35 11+2 12+2 12+4Spend time together
Something to do while visiting the area
41 11 752
12
12
2
4
435
305-10 yrs
10+ yrs
Never
-100
NPS
20
0
10
20
30
40
50
60
70
80
90
100
-100
SUMMER (JULndashSEP) FALL (OCTndashDEC)
WINTER (JANndashMAR) AND SPRING (APRndashJUN)
SUPERIOR
SUPERIOR
SUPERIOR
EXCELLENT
EXCELLENT
EXCELLENT
GOOD
GOOD
GOOD
36
31
32
50
54
53
FALL AUDIENCES | n=898
WINTER AUDIENCES | n=3306
SPRING AUDIENCES | n=2883
OVERALL EXPERIENCE RATING EXPERIENCE RATINGSAverage rating scale from 0 to 10 where 10 is highest n varies
896897893891
873885869864
881884866867
929929910910
One advantage of the ongoing nature of COVES is the ability to compare ratings over time In this yearrsquos COVES data experience ratings appear to be highest in the Fall quarter (from Oct to Dec 2017)
WHY IT MATTERS Museum visitation varies by season with many museums busier in the summer months than the fall as school goes back into session Some museums also bring temporary exhibitions throughout the year These and other factors can influence experience ratings at any given time in the year
90+90+89+89 87+89+87+86 88+88+87+87 93+93+91+91
Entertainment experience
Value for cost
Exhibits in working order
Staff member helpfulness
Summer data not included because the question was not added until Oct 2017
20
722 718702
13
13
14
703
0
10
20
30
40
50
60
70
80
90
100
-100
21
NPS NPS
21-100
0
10
20
30
40
50
60
80
90
100
70
LARGE MEDIUM AND SMALL INSTITUTIONS
Education experience
Entertainment experience
Value for cost
Exhibits in working order
Staff member helpfulness
The 2017-18 COVES cohort contained institutions of vastly different sizes with yearly visitation ranging from under 10000 visitors to over 1 million visitors Visitors to the smallest museums tend to give higher experience ratings The trend is especially clear in ratings for staff helpfulness and the value of the experience relative to the cost
WHY IT MATTERS Small and very small museums represent a higher proportion of the Association of Science-Technology Centers (ASTC) membership than medium and large museums Though large museums are often working with more resources small museums provide high quality visitor experiences
90+90+91 90+88+89+ 85+86+90+ 87+85+89 90+91+94
SUPERIOR
SUPERIOR
SUPERIOR
EXCELLENT
EXCELLENT
EXCELLENT
GOOD
GOOD
GOOD
LARGE INSTITUTIONS | n=3069
MEDIUM INSTITUTIONS | n=1818
SMALL INSTITUTIONS | n=2201
OVERALL EXPERIENCE RATING
32
906896910
898887894
852863901
874852889
906914934
EXPERIENCE RATINGSAverage rating scale from 0 to 10 where 10 is highest n varies
713
18
14
33
53
12
53
14
32
54
686
728
22
GET INVOLVED IN COVESDo you want to see data from your institution represented in COVES We are always looking for new participants As more institutions join our field-wide dataset becomes more representative As of October 2018 we have 22 science centers participating in COVES
If you are interested in joining our collaboration or just want to learn more please contact us at infounderstandingvisitorsorg or visit our website at wwwunderstandingvisitorsorg Currently any Association of Science-Technology Centers (ASTC) member in good standing is eligible to join but we encourage people from all types of museums to contact us
Bradbury Science Museum
Center of Science and Industry (COSI)
Discovery Center Museum
Discovery Place Science
EcoTarium
Exploratorium
Great Lakes Science Center
Imagination Station
Museum of Discovery and Science
Museum of Science Boston
Natural History Museum of Utah
New York Hall of Science
Oregon Museum of Science and Industry
Orlando Science Center
Roseville Utility Exploration Center
Saint Louis Science Center
Science Center of Iowa
Science Museum of Minnesota
Science World British Columbia
Terry Lee Wells Nevada Museum of Discovery
The DoSeum
The Franklin Institute
SCIENCE CENTERS PARTICIPATING IN COVES AS OF OCTOBER 2018
understandingvisitorsorg
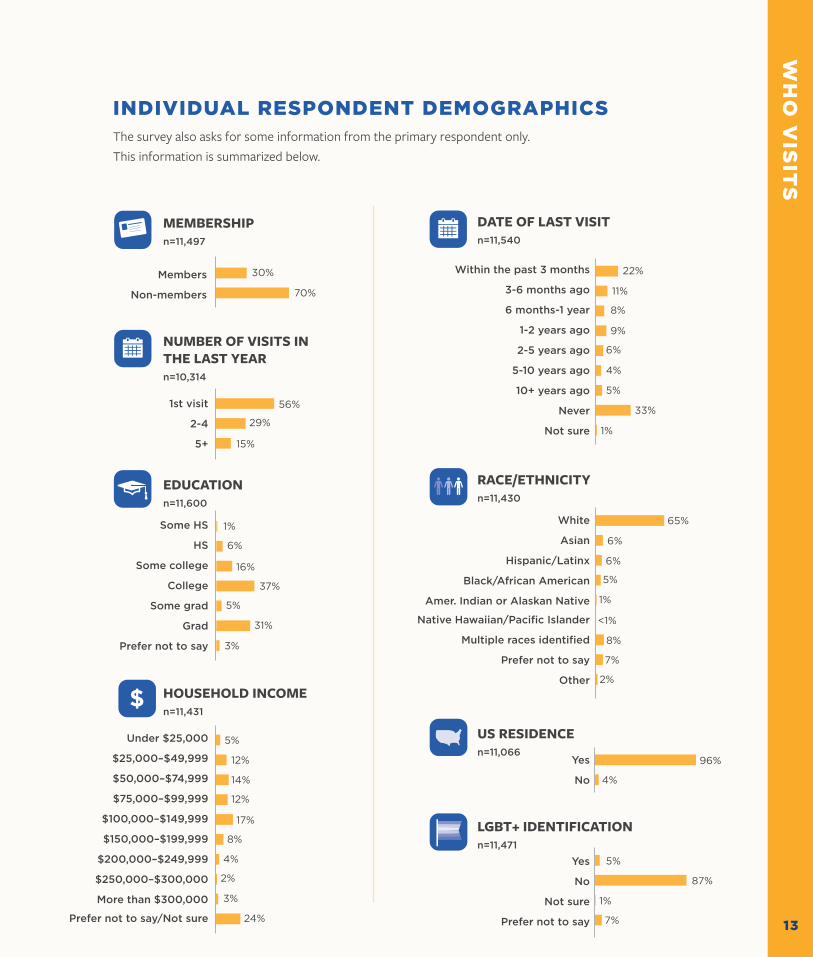
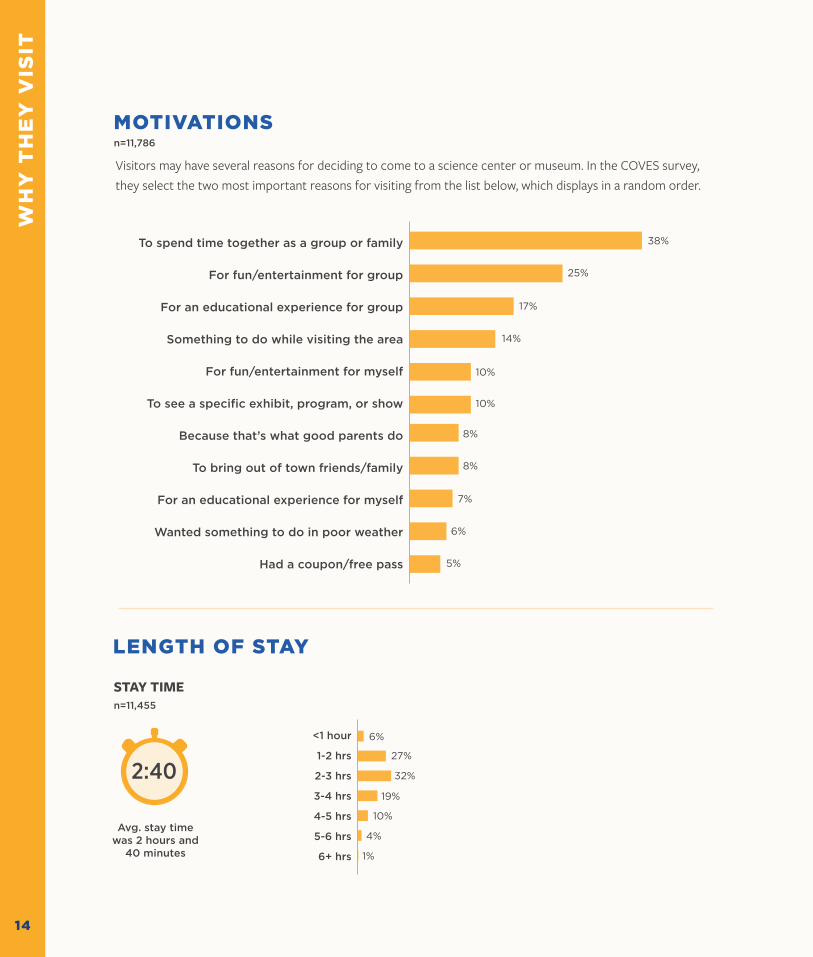
14
6+27+32+19+10+4+138+25+17+14+10+10++8+8+7+6+5To spend time together as a group or family
For funentertainment for group
For an educational experience for group
Something to do while visiting the area
For funentertainment for myself
To see a specific exhibit program or show
Because thatrsquos what good parents do
To bring out of town friendsfamily
For an educational experience for myself
Wanted something to do in poor weather
Had a couponfree pass
MOTIVATIONSn=11786
LENGTH OF STAY
lt1 hour
1-2 hrs
2-3 hrs
3-4 hrs
4-5 hrs
5-6 hrs
6+ hrs
WH
Y T
HE
Y V
ISIT
38
25
17
14
10
10
8
8
7
6
5
6
27
32
19
10
4
1
Avg stay time was 2 hours and
40 minutes
240
STAY TIMEn=11455
Visitors may have several reasons for deciding to come to a science center or museum In the COVES survey they select the two most important reasons for visiting from the list below which displays in a random order
15 15
92+90+89+89+88+87+8783
76+20+5
NET PROMOTER SCORE amp EXPERIENCE RATINGSTwo commonly-used metrics in the science centers are Net Promoter Score and Overall Experience Rating Overall Experience Rating is a direct experience rating while Net Promoter Score asks how likely the respondent is to recommend the institution The COVES survey also asks respondents to rate their agreement with eight statements about specific aspects of the visit
905
894
873
874
919
888
828
882
EXPERIENCE RATINGSAverage rating scale from 0 to 10 where 10 is highest n varies
NET PROMOTER SCORE n=11631
OVERALL EXPERIENCE RATINGn=7088
NET PROMOTER SCORE RANGE ACROSS INSTITUTIONS
Promoters
Passives
Detractors
757
196
46
50
60
70
80
90
100
-100
SUPERIOR
EXCELLENT
GOOD
FAIR
POOR
53
13
537
984
42141
14
13
2
32Staff member helpfulness
Education experience
Entertainment experience
Restroom cleanliness
Gift shop experience
Exhibits in working order
Value for cost
Cafeacuterestaurant experience
Of the promoters this is the breakdown of their Overall Experience Rating (left to right good excellent superior)
Of those who rated their experience ldquosuperiorrdquo here is the breakdown of their NPS
PROMOTERPASSIVE
711-100 100
0
HO
W T
HE
Y R
AT
E T
HE
IR V
ISIT
711
0
10
20
30
40
50
60
70
80
90
100
-100
16
NPS
Museum members have strong connections with their home institution As seen below 86 of members report visiting multiple times in the last 12 months (compared with only 23 of non-members) with 43 visiting 5 or more times These visitors also rate their experience more positively across the board including NPS OER and all experience ratings
WHY IT MATTERS Members are an integral part of museum audiences They visit often and rate the museum experience highly In fact member and non-member differences are so strong that they influence the differences between other groups such as locals vs out-of-town visitors
DATE OF LAST VISITn=3404 n=7938
OVERALL EXPERIENCE RATINGn=1378 n=4811
NUMBER OF VISITS IN THE LAST YEARn=3152 n=6988
EXPERIENCE RATINGSAverage rating scale from 0 to 10 where 10 is highest
n varies59+7 19+8 8+9
92+90+ 92+89+ 91+86 89+87 93+91 90+88 84+82 90+8713+7544+2045+5lt3 months
3ndash6 months
6ndash12 months
1st
2ndash4
5+
MEMBERS
NON-MEMBERS
37
30
53
53
9
15
MEMBERS (30) VS NON-MEMBERS (70)
SUPERIOR
SUPERIOR
EXCELLENT
EXCELLENT
GOOD
GOOD
59
919
43
1375
4420
5
899
916885
906857
885868
933
895
842821
902873
884
912
7
198
89
820
668
Education experience
Entertainment experience
Value for cost
Exhibits in working order
Staff member helpfulness
Restroom cleanliness
Cafeacuterestaurant experience
Gift shop experience
0
10
20
30
40
50
60
70
80
90
100
-100
17
NPS
0
10
20
30
40
50
60
70
80
90
100
-100
17
NPS
FIRST-TIME (33) VS REPEAT VISITORS (67)
While both repeat and first-time visitors come primarily to spend time with their groups first-timers more often come as something to do while visiting the area These first-time visitors also rate lower than repeat visitors on NPS and OER
WHY IT MATTERS Museums often grapple with converting first-time visitors to repeat visitors members and donors but it is important to acknowledge that this is unlikely for out-of-town groups Distinguishing between different types of first-time visitors is critical to understanding how to encourage repeat visitation
RESIDENCE OF GROUPn=3612 n=7432
OVERALL EXPERIENCE RATING n=2309 n=3154
MOTIVATIONSn=3853 n=79322768 5315 2017
3141 287Locals-only
Out-of-towners only
Mixed group
Spend time together
Something to do while visiting the area
FIRST-TIME VISITORS
REPEAT VISITORS
33
54
12
SUPERIOR
SUPERIOR
EXCELLENT
EXCELLENT
GOOD
GOOD
52
15
31
2731
6841
5328
157
2017
641
745
0
10
20
30
40
50
60
70
80
90
100
-100
18
NPS
ADULT-ONLY GROUPS (21) VS GROUPS WITH KIDS (79)
ADULT ONLY GROUPS
GROUPS WITH KIDS
SUPERIOR
SUPERIOR
EXCELLENT
EXCELLENT
GOOD
GOOD
51
54
16
12
30
33
OVERALL EXPERIENCE RATINGn=1582 n=5505
ADULT AGEn=3660 n=12242
DATE OF LAST VISITn=2480 n=9061
INCOMEn=2434 n=8997
LGBT+n=2455 n=9015
608
740
Approximately one-fifth of visiting groups are composed solely of adults and though the phrase ldquoadult-only museum visitor groupsrdquo might make some think of older adults more than one-quarter of them are under the age of 25 Roughly half of these groups are first-time visitors and almost one-tenth identify as LGBT+
WHY IT MATTERS For institutions that donrsquot consider themselves childrenrsquos museums recognizing adult audiences is important as they bring a younger adult age group with less disposable income (24 households under $50Kyear compared with 15 for groups with kids) who come largely for personal entertainment reasons (28 compared with 5 for groups with kids) These groups however rate their experiences lower than visitors with children
28+5+28+29+9+39+21+2014+79+4 49+29
14+4+13+11+12+14+10+13+12+18+5+8+8+9+2922
18ndash24
25ndash34
35ndash44
45ndash64
65+
Yes Never visited
Under $25000
$25000ndash$49999
$50000ndash$74999
$75000ndash$99999
$100000ndash$149999
$150000ndash$199999
More than $200000
Prefer not to say not sure
285
2829
4
399
2120
147
9 49
11
1311
1214
1013
12
58
8
2922
9
18
29
4
0
10
20
30
40
50
60
70
80
90
100
-100
19
NPS
0
10
20
30
40
50
60
70
80
90
100
-100
19
NPS
7+5 67+27+6789+91 84+88 86+87 90+92 8890
LOCAL NON-MEMBERS (44)
VS OUT-OF-TOWN NON-MEMBERS (36)
LOCALS
OUT-OF-TOWNERS
SUPERIOR
SUPERIOR
EXCELLENT
EXCELLENT
GOOD
GOOD536
326
MOTIVATIONSn=3352 n=2737
EXPERIENCE RATINGSAverage rating scale from 0 to 10 where 10 is highest n varies
DATE OF LAST VISITn=3309 n=2692
OVERALL EXPERIENCE RATINGn=2055 n=1601
32
16
53
53
Education experience
Value for cost
Exhibits in working order
Staff member helpfulness
Restrooms cleanliness
lt 3 months
3-6 mos
6-12 mos
67
2767
893907
842875
863874
906920
875896
14
29
Since members are much more likely to be local members are excluded from analyses on this page to highlight differences that are unique to non-member locals and out-of-towners Almost half of all non-member visitors report coming in locals-only groups (ie not bringing out-of-town guests with them) and consistent with the overall aggregate data tend to come to spend time with their group While out-of-town-only non-member groups come instead as something to do while visiting the area these out-of-towners also rate their experiences slightly higher than the locals
WHY IT MATTERS Removing members (and their higher ratings) from the analyses shows that out-of-town-only groups rate their experience more highly than local-only groups Together with the analysis of first-time and repeat visitors this suggests that there is the most room to improve in serving local first-time visitors
659 664
4130 4+35 11+2 12+2 12+4Spend time together
Something to do while visiting the area
41 11 752
12
12
2
4
435
305-10 yrs
10+ yrs
Never
-100
NPS
20
0
10
20
30
40
50
60
70
80
90
100
-100
SUMMER (JULndashSEP) FALL (OCTndashDEC)
WINTER (JANndashMAR) AND SPRING (APRndashJUN)
SUPERIOR
SUPERIOR
SUPERIOR
EXCELLENT
EXCELLENT
EXCELLENT
GOOD
GOOD
GOOD
36
31
32
50
54
53
FALL AUDIENCES | n=898
WINTER AUDIENCES | n=3306
SPRING AUDIENCES | n=2883
OVERALL EXPERIENCE RATING EXPERIENCE RATINGSAverage rating scale from 0 to 10 where 10 is highest n varies
896897893891
873885869864
881884866867
929929910910
One advantage of the ongoing nature of COVES is the ability to compare ratings over time In this yearrsquos COVES data experience ratings appear to be highest in the Fall quarter (from Oct to Dec 2017)
WHY IT MATTERS Museum visitation varies by season with many museums busier in the summer months than the fall as school goes back into session Some museums also bring temporary exhibitions throughout the year These and other factors can influence experience ratings at any given time in the year
90+90+89+89 87+89+87+86 88+88+87+87 93+93+91+91
Entertainment experience
Value for cost
Exhibits in working order
Staff member helpfulness
Summer data not included because the question was not added until Oct 2017
20
722 718702
13
13
14
703
0
10
20
30
40
50
60
70
80
90
100
-100
21
NPS NPS
21-100
0
10
20
30
40
50
60
80
90
100
70
LARGE MEDIUM AND SMALL INSTITUTIONS
Education experience
Entertainment experience
Value for cost
Exhibits in working order
Staff member helpfulness
The 2017-18 COVES cohort contained institutions of vastly different sizes with yearly visitation ranging from under 10000 visitors to over 1 million visitors Visitors to the smallest museums tend to give higher experience ratings The trend is especially clear in ratings for staff helpfulness and the value of the experience relative to the cost
WHY IT MATTERS Small and very small museums represent a higher proportion of the Association of Science-Technology Centers (ASTC) membership than medium and large museums Though large museums are often working with more resources small museums provide high quality visitor experiences
90+90+91 90+88+89+ 85+86+90+ 87+85+89 90+91+94
SUPERIOR
SUPERIOR
SUPERIOR
EXCELLENT
EXCELLENT
EXCELLENT
GOOD
GOOD
GOOD
LARGE INSTITUTIONS | n=3069
MEDIUM INSTITUTIONS | n=1818
SMALL INSTITUTIONS | n=2201
OVERALL EXPERIENCE RATING
32
906896910
898887894
852863901
874852889
906914934
EXPERIENCE RATINGSAverage rating scale from 0 to 10 where 10 is highest n varies
713
18
14
33
53
12
53
14
32
54
686
728
22
GET INVOLVED IN COVESDo you want to see data from your institution represented in COVES We are always looking for new participants As more institutions join our field-wide dataset becomes more representative As of October 2018 we have 22 science centers participating in COVES
If you are interested in joining our collaboration or just want to learn more please contact us at infounderstandingvisitorsorg or visit our website at wwwunderstandingvisitorsorg Currently any Association of Science-Technology Centers (ASTC) member in good standing is eligible to join but we encourage people from all types of museums to contact us
Bradbury Science Museum
Center of Science and Industry (COSI)
Discovery Center Museum
Discovery Place Science
EcoTarium
Exploratorium
Great Lakes Science Center
Imagination Station
Museum of Discovery and Science
Museum of Science Boston
Natural History Museum of Utah
New York Hall of Science
Oregon Museum of Science and Industry
Orlando Science Center
Roseville Utility Exploration Center
Saint Louis Science Center
Science Center of Iowa
Science Museum of Minnesota
Science World British Columbia
Terry Lee Wells Nevada Museum of Discovery
The DoSeum
The Franklin Institute
SCIENCE CENTERS PARTICIPATING IN COVES AS OF OCTOBER 2018
understandingvisitorsorg
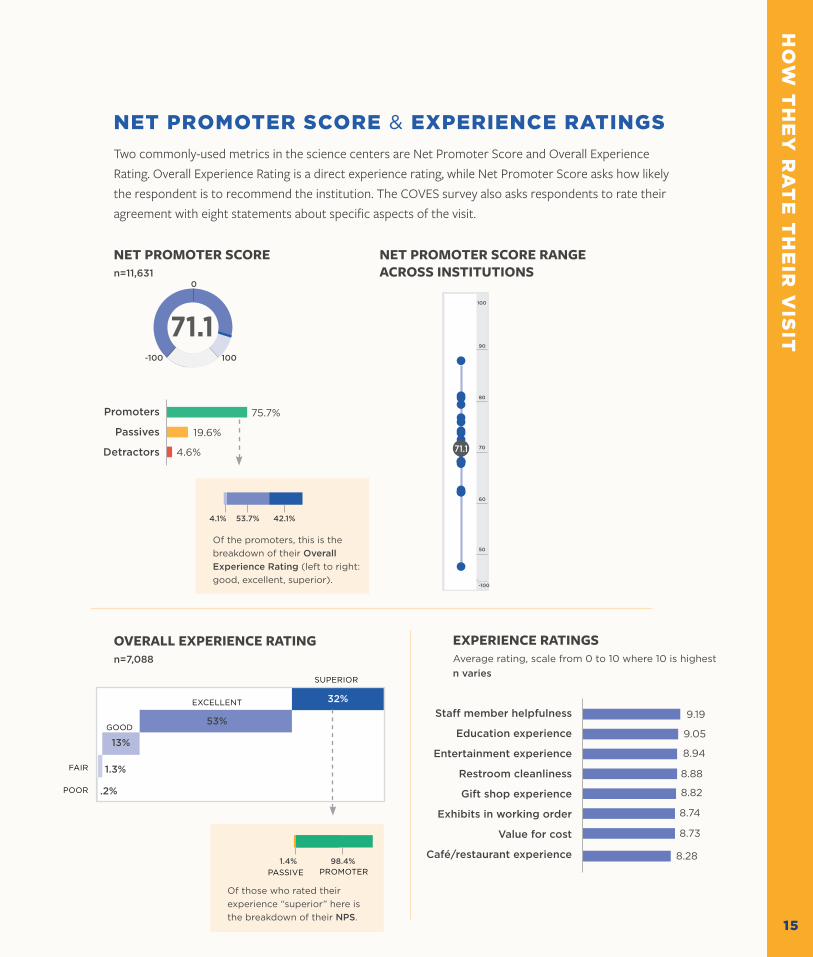
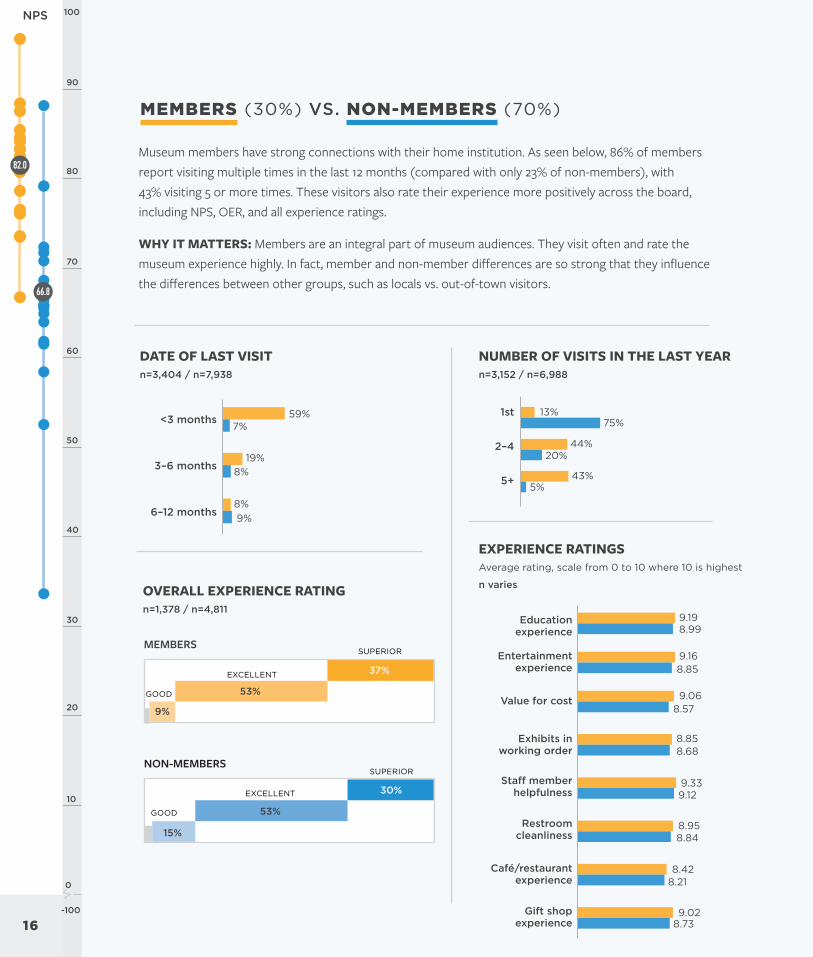
0
10
20
30
40
50
60
70
80
90
100
-100
16
NPS
Museum members have strong connections with their home institution As seen below 86 of members report visiting multiple times in the last 12 months (compared with only 23 of non-members) with 43 visiting 5 or more times These visitors also rate their experience more positively across the board including NPS OER and all experience ratings
WHY IT MATTERS Members are an integral part of museum audiences They visit often and rate the museum experience highly In fact member and non-member differences are so strong that they influence the differences between other groups such as locals vs out-of-town visitors
DATE OF LAST VISITn=3404 n=7938
OVERALL EXPERIENCE RATINGn=1378 n=4811
NUMBER OF VISITS IN THE LAST YEARn=3152 n=6988
EXPERIENCE RATINGSAverage rating scale from 0 to 10 where 10 is highest
n varies59+7 19+8 8+9
92+90+ 92+89+ 91+86 89+87 93+91 90+88 84+82 90+8713+7544+2045+5lt3 months
3ndash6 months
6ndash12 months
1st
2ndash4
5+
MEMBERS
NON-MEMBERS
37
30
53
53
9
15
MEMBERS (30) VS NON-MEMBERS (70)
SUPERIOR
SUPERIOR
EXCELLENT
EXCELLENT
GOOD
GOOD
59
919
43
1375
4420
5
899
916885
906857
885868
933
895
842821
902873
884
912
7
198
89
820
668
Education experience
Entertainment experience
Value for cost
Exhibits in working order
Staff member helpfulness
Restroom cleanliness
Cafeacuterestaurant experience
Gift shop experience
0
10
20
30
40
50
60
70
80
90
100
-100
17
NPS
0
10
20
30
40
50
60
70
80
90
100
-100
17
NPS
FIRST-TIME (33) VS REPEAT VISITORS (67)
While both repeat and first-time visitors come primarily to spend time with their groups first-timers more often come as something to do while visiting the area These first-time visitors also rate lower than repeat visitors on NPS and OER
WHY IT MATTERS Museums often grapple with converting first-time visitors to repeat visitors members and donors but it is important to acknowledge that this is unlikely for out-of-town groups Distinguishing between different types of first-time visitors is critical to understanding how to encourage repeat visitation
RESIDENCE OF GROUPn=3612 n=7432
OVERALL EXPERIENCE RATING n=2309 n=3154
MOTIVATIONSn=3853 n=79322768 5315 2017
3141 287Locals-only
Out-of-towners only
Mixed group
Spend time together
Something to do while visiting the area
FIRST-TIME VISITORS
REPEAT VISITORS
33
54
12
SUPERIOR
SUPERIOR
EXCELLENT
EXCELLENT
GOOD
GOOD
52
15
31
2731
6841
5328
157
2017
641
745
0
10
20
30
40
50
60
70
80
90
100
-100
18
NPS
ADULT-ONLY GROUPS (21) VS GROUPS WITH KIDS (79)
ADULT ONLY GROUPS
GROUPS WITH KIDS
SUPERIOR
SUPERIOR
EXCELLENT
EXCELLENT
GOOD
GOOD
51
54
16
12
30
33
OVERALL EXPERIENCE RATINGn=1582 n=5505
ADULT AGEn=3660 n=12242
DATE OF LAST VISITn=2480 n=9061
INCOMEn=2434 n=8997
LGBT+n=2455 n=9015
608
740
Approximately one-fifth of visiting groups are composed solely of adults and though the phrase ldquoadult-only museum visitor groupsrdquo might make some think of older adults more than one-quarter of them are under the age of 25 Roughly half of these groups are first-time visitors and almost one-tenth identify as LGBT+
WHY IT MATTERS For institutions that donrsquot consider themselves childrenrsquos museums recognizing adult audiences is important as they bring a younger adult age group with less disposable income (24 households under $50Kyear compared with 15 for groups with kids) who come largely for personal entertainment reasons (28 compared with 5 for groups with kids) These groups however rate their experiences lower than visitors with children
28+5+28+29+9+39+21+2014+79+4 49+29
14+4+13+11+12+14+10+13+12+18+5+8+8+9+2922
18ndash24
25ndash34
35ndash44
45ndash64
65+
Yes Never visited
Under $25000
$25000ndash$49999
$50000ndash$74999
$75000ndash$99999
$100000ndash$149999
$150000ndash$199999
More than $200000
Prefer not to say not sure
285
2829
4
399
2120
147
9 49
11
1311
1214
1013
12
58
8
2922
9
18
29
4
0
10
20
30
40
50
60
70
80
90
100
-100
19
NPS
0
10
20
30
40
50
60
70
80
90
100
-100
19
NPS
7+5 67+27+6789+91 84+88 86+87 90+92 8890
LOCAL NON-MEMBERS (44)
VS OUT-OF-TOWN NON-MEMBERS (36)
LOCALS
OUT-OF-TOWNERS
SUPERIOR
SUPERIOR
EXCELLENT
EXCELLENT
GOOD
GOOD536
326
MOTIVATIONSn=3352 n=2737
EXPERIENCE RATINGSAverage rating scale from 0 to 10 where 10 is highest n varies
DATE OF LAST VISITn=3309 n=2692
OVERALL EXPERIENCE RATINGn=2055 n=1601
32
16
53
53
Education experience
Value for cost
Exhibits in working order
Staff member helpfulness
Restrooms cleanliness
lt 3 months
3-6 mos
6-12 mos
67
2767
893907
842875
863874
906920
875896
14
29
Since members are much more likely to be local members are excluded from analyses on this page to highlight differences that are unique to non-member locals and out-of-towners Almost half of all non-member visitors report coming in locals-only groups (ie not bringing out-of-town guests with them) and consistent with the overall aggregate data tend to come to spend time with their group While out-of-town-only non-member groups come instead as something to do while visiting the area these out-of-towners also rate their experiences slightly higher than the locals
WHY IT MATTERS Removing members (and their higher ratings) from the analyses shows that out-of-town-only groups rate their experience more highly than local-only groups Together with the analysis of first-time and repeat visitors this suggests that there is the most room to improve in serving local first-time visitors
659 664
4130 4+35 11+2 12+2 12+4Spend time together
Something to do while visiting the area
41 11 752
12
12
2
4
435
305-10 yrs
10+ yrs
Never
-100
NPS
20
0
10
20
30
40
50
60
70
80
90
100
-100
SUMMER (JULndashSEP) FALL (OCTndashDEC)
WINTER (JANndashMAR) AND SPRING (APRndashJUN)
SUPERIOR
SUPERIOR
SUPERIOR
EXCELLENT
EXCELLENT
EXCELLENT
GOOD
GOOD
GOOD
36
31
32
50
54
53
FALL AUDIENCES | n=898
WINTER AUDIENCES | n=3306
SPRING AUDIENCES | n=2883
OVERALL EXPERIENCE RATING EXPERIENCE RATINGSAverage rating scale from 0 to 10 where 10 is highest n varies
896897893891
873885869864
881884866867
929929910910
One advantage of the ongoing nature of COVES is the ability to compare ratings over time In this yearrsquos COVES data experience ratings appear to be highest in the Fall quarter (from Oct to Dec 2017)
WHY IT MATTERS Museum visitation varies by season with many museums busier in the summer months than the fall as school goes back into session Some museums also bring temporary exhibitions throughout the year These and other factors can influence experience ratings at any given time in the year
90+90+89+89 87+89+87+86 88+88+87+87 93+93+91+91
Entertainment experience
Value for cost
Exhibits in working order
Staff member helpfulness
Summer data not included because the question was not added until Oct 2017
20
722 718702
13
13
14
703
0
10
20
30
40
50
60
70
80
90
100
-100
21
NPS NPS
21-100
0
10
20
30
40
50
60
80
90
100
70
LARGE MEDIUM AND SMALL INSTITUTIONS
Education experience
Entertainment experience
Value for cost
Exhibits in working order
Staff member helpfulness
The 2017-18 COVES cohort contained institutions of vastly different sizes with yearly visitation ranging from under 10000 visitors to over 1 million visitors Visitors to the smallest museums tend to give higher experience ratings The trend is especially clear in ratings for staff helpfulness and the value of the experience relative to the cost
WHY IT MATTERS Small and very small museums represent a higher proportion of the Association of Science-Technology Centers (ASTC) membership than medium and large museums Though large museums are often working with more resources small museums provide high quality visitor experiences
90+90+91 90+88+89+ 85+86+90+ 87+85+89 90+91+94
SUPERIOR
SUPERIOR
SUPERIOR
EXCELLENT
EXCELLENT
EXCELLENT
GOOD
GOOD
GOOD
LARGE INSTITUTIONS | n=3069
MEDIUM INSTITUTIONS | n=1818
SMALL INSTITUTIONS | n=2201
OVERALL EXPERIENCE RATING
32
906896910
898887894
852863901
874852889
906914934
EXPERIENCE RATINGSAverage rating scale from 0 to 10 where 10 is highest n varies
713
18
14
33
53
12
53
14
32
54
686
728
22
GET INVOLVED IN COVESDo you want to see data from your institution represented in COVES We are always looking for new participants As more institutions join our field-wide dataset becomes more representative As of October 2018 we have 22 science centers participating in COVES
If you are interested in joining our collaboration or just want to learn more please contact us at infounderstandingvisitorsorg or visit our website at wwwunderstandingvisitorsorg Currently any Association of Science-Technology Centers (ASTC) member in good standing is eligible to join but we encourage people from all types of museums to contact us
Bradbury Science Museum
Center of Science and Industry (COSI)
Discovery Center Museum
Discovery Place Science
EcoTarium
Exploratorium
Great Lakes Science Center
Imagination Station
Museum of Discovery and Science
Museum of Science Boston
Natural History Museum of Utah
New York Hall of Science
Oregon Museum of Science and Industry
Orlando Science Center
Roseville Utility Exploration Center
Saint Louis Science Center
Science Center of Iowa
Science Museum of Minnesota
Science World British Columbia
Terry Lee Wells Nevada Museum of Discovery
The DoSeum
The Franklin Institute
SCIENCE CENTERS PARTICIPATING IN COVES AS OF OCTOBER 2018
understandingvisitorsorg
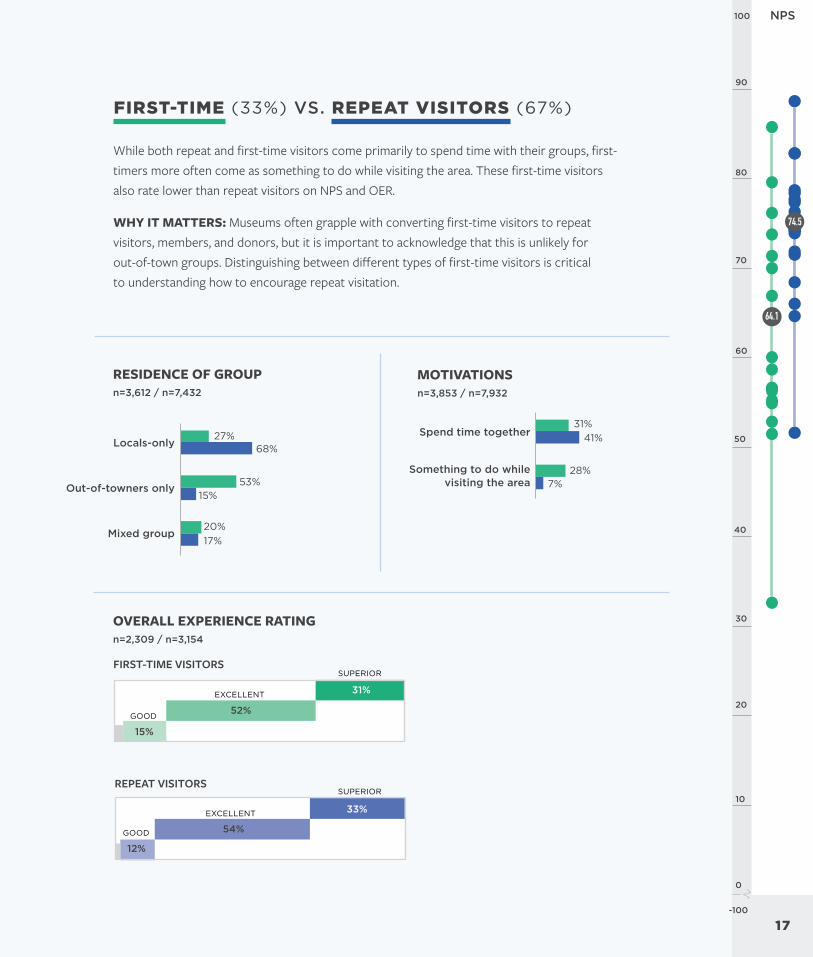
0
10
20
30
40
50
60
70
80
90
100
-100
17
NPS
0
10
20
30
40
50
60
70
80
90
100
-100
17
NPS
FIRST-TIME (33) VS REPEAT VISITORS (67)
While both repeat and first-time visitors come primarily to spend time with their groups first-timers more often come as something to do while visiting the area These first-time visitors also rate lower than repeat visitors on NPS and OER
WHY IT MATTERS Museums often grapple with converting first-time visitors to repeat visitors members and donors but it is important to acknowledge that this is unlikely for out-of-town groups Distinguishing between different types of first-time visitors is critical to understanding how to encourage repeat visitation
RESIDENCE OF GROUPn=3612 n=7432
OVERALL EXPERIENCE RATING n=2309 n=3154
MOTIVATIONSn=3853 n=79322768 5315 2017
3141 287Locals-only
Out-of-towners only
Mixed group
Spend time together
Something to do while visiting the area
FIRST-TIME VISITORS
REPEAT VISITORS
33
54
12
SUPERIOR
SUPERIOR
EXCELLENT
EXCELLENT
GOOD
GOOD
52
15
31
2731
6841
5328
157
2017
641
745
0
10
20
30
40
50
60
70
80
90
100
-100
18
NPS
ADULT-ONLY GROUPS (21) VS GROUPS WITH KIDS (79)
ADULT ONLY GROUPS
GROUPS WITH KIDS
SUPERIOR
SUPERIOR
EXCELLENT
EXCELLENT
GOOD
GOOD
51
54
16
12
30
33
OVERALL EXPERIENCE RATINGn=1582 n=5505
ADULT AGEn=3660 n=12242
DATE OF LAST VISITn=2480 n=9061
INCOMEn=2434 n=8997
LGBT+n=2455 n=9015
608
740
Approximately one-fifth of visiting groups are composed solely of adults and though the phrase ldquoadult-only museum visitor groupsrdquo might make some think of older adults more than one-quarter of them are under the age of 25 Roughly half of these groups are first-time visitors and almost one-tenth identify as LGBT+
WHY IT MATTERS For institutions that donrsquot consider themselves childrenrsquos museums recognizing adult audiences is important as they bring a younger adult age group with less disposable income (24 households under $50Kyear compared with 15 for groups with kids) who come largely for personal entertainment reasons (28 compared with 5 for groups with kids) These groups however rate their experiences lower than visitors with children
28+5+28+29+9+39+21+2014+79+4 49+29
14+4+13+11+12+14+10+13+12+18+5+8+8+9+2922
18ndash24
25ndash34
35ndash44
45ndash64
65+
Yes Never visited
Under $25000
$25000ndash$49999
$50000ndash$74999
$75000ndash$99999
$100000ndash$149999
$150000ndash$199999
More than $200000
Prefer not to say not sure
285
2829
4
399
2120
147
9 49
11
1311
1214
1013
12
58
8
2922
9
18
29
4
0
10
20
30
40
50
60
70
80
90
100
-100
19
NPS
0
10
20
30
40
50
60
70
80
90
100
-100
19
NPS
7+5 67+27+6789+91 84+88 86+87 90+92 8890
LOCAL NON-MEMBERS (44)
VS OUT-OF-TOWN NON-MEMBERS (36)
LOCALS
OUT-OF-TOWNERS
SUPERIOR
SUPERIOR
EXCELLENT
EXCELLENT
GOOD
GOOD536
326
MOTIVATIONSn=3352 n=2737
EXPERIENCE RATINGSAverage rating scale from 0 to 10 where 10 is highest n varies
DATE OF LAST VISITn=3309 n=2692
OVERALL EXPERIENCE RATINGn=2055 n=1601
32
16
53
53
Education experience
Value for cost
Exhibits in working order
Staff member helpfulness
Restrooms cleanliness
lt 3 months
3-6 mos
6-12 mos
67
2767
893907
842875
863874
906920
875896
14
29
Since members are much more likely to be local members are excluded from analyses on this page to highlight differences that are unique to non-member locals and out-of-towners Almost half of all non-member visitors report coming in locals-only groups (ie not bringing out-of-town guests with them) and consistent with the overall aggregate data tend to come to spend time with their group While out-of-town-only non-member groups come instead as something to do while visiting the area these out-of-towners also rate their experiences slightly higher than the locals
WHY IT MATTERS Removing members (and their higher ratings) from the analyses shows that out-of-town-only groups rate their experience more highly than local-only groups Together with the analysis of first-time and repeat visitors this suggests that there is the most room to improve in serving local first-time visitors
659 664
4130 4+35 11+2 12+2 12+4Spend time together
Something to do while visiting the area
41 11 752
12
12
2
4
435
305-10 yrs
10+ yrs
Never
-100
NPS
20
0
10
20
30
40
50
60
70
80
90
100
-100
SUMMER (JULndashSEP) FALL (OCTndashDEC)
WINTER (JANndashMAR) AND SPRING (APRndashJUN)
SUPERIOR
SUPERIOR
SUPERIOR
EXCELLENT
EXCELLENT
EXCELLENT
GOOD
GOOD
GOOD
36
31
32
50
54
53
FALL AUDIENCES | n=898
WINTER AUDIENCES | n=3306
SPRING AUDIENCES | n=2883
OVERALL EXPERIENCE RATING EXPERIENCE RATINGSAverage rating scale from 0 to 10 where 10 is highest n varies
896897893891
873885869864
881884866867
929929910910
One advantage of the ongoing nature of COVES is the ability to compare ratings over time In this yearrsquos COVES data experience ratings appear to be highest in the Fall quarter (from Oct to Dec 2017)
WHY IT MATTERS Museum visitation varies by season with many museums busier in the summer months than the fall as school goes back into session Some museums also bring temporary exhibitions throughout the year These and other factors can influence experience ratings at any given time in the year
90+90+89+89 87+89+87+86 88+88+87+87 93+93+91+91
Entertainment experience
Value for cost
Exhibits in working order
Staff member helpfulness
Summer data not included because the question was not added until Oct 2017
20
722 718702
13
13
14
703
0
10
20
30
40
50
60
70
80
90
100
-100
21
NPS NPS
21-100
0
10
20
30
40
50
60
80
90
100
70
LARGE MEDIUM AND SMALL INSTITUTIONS
Education experience
Entertainment experience
Value for cost
Exhibits in working order
Staff member helpfulness
The 2017-18 COVES cohort contained institutions of vastly different sizes with yearly visitation ranging from under 10000 visitors to over 1 million visitors Visitors to the smallest museums tend to give higher experience ratings The trend is especially clear in ratings for staff helpfulness and the value of the experience relative to the cost
WHY IT MATTERS Small and very small museums represent a higher proportion of the Association of Science-Technology Centers (ASTC) membership than medium and large museums Though large museums are often working with more resources small museums provide high quality visitor experiences
90+90+91 90+88+89+ 85+86+90+ 87+85+89 90+91+94
SUPERIOR
SUPERIOR
SUPERIOR
EXCELLENT
EXCELLENT
EXCELLENT
GOOD
GOOD
GOOD
LARGE INSTITUTIONS | n=3069
MEDIUM INSTITUTIONS | n=1818
SMALL INSTITUTIONS | n=2201
OVERALL EXPERIENCE RATING
32
906896910
898887894
852863901
874852889
906914934
EXPERIENCE RATINGSAverage rating scale from 0 to 10 where 10 is highest n varies
713
18
14
33
53
12
53
14
32
54
686
728
22
GET INVOLVED IN COVESDo you want to see data from your institution represented in COVES We are always looking for new participants As more institutions join our field-wide dataset becomes more representative As of October 2018 we have 22 science centers participating in COVES
If you are interested in joining our collaboration or just want to learn more please contact us at infounderstandingvisitorsorg or visit our website at wwwunderstandingvisitorsorg Currently any Association of Science-Technology Centers (ASTC) member in good standing is eligible to join but we encourage people from all types of museums to contact us
Bradbury Science Museum
Center of Science and Industry (COSI)
Discovery Center Museum
Discovery Place Science
EcoTarium
Exploratorium
Great Lakes Science Center
Imagination Station
Museum of Discovery and Science
Museum of Science Boston
Natural History Museum of Utah
New York Hall of Science
Oregon Museum of Science and Industry
Orlando Science Center
Roseville Utility Exploration Center
Saint Louis Science Center
Science Center of Iowa
Science Museum of Minnesota
Science World British Columbia
Terry Lee Wells Nevada Museum of Discovery
The DoSeum
The Franklin Institute
SCIENCE CENTERS PARTICIPATING IN COVES AS OF OCTOBER 2018
understandingvisitorsorg
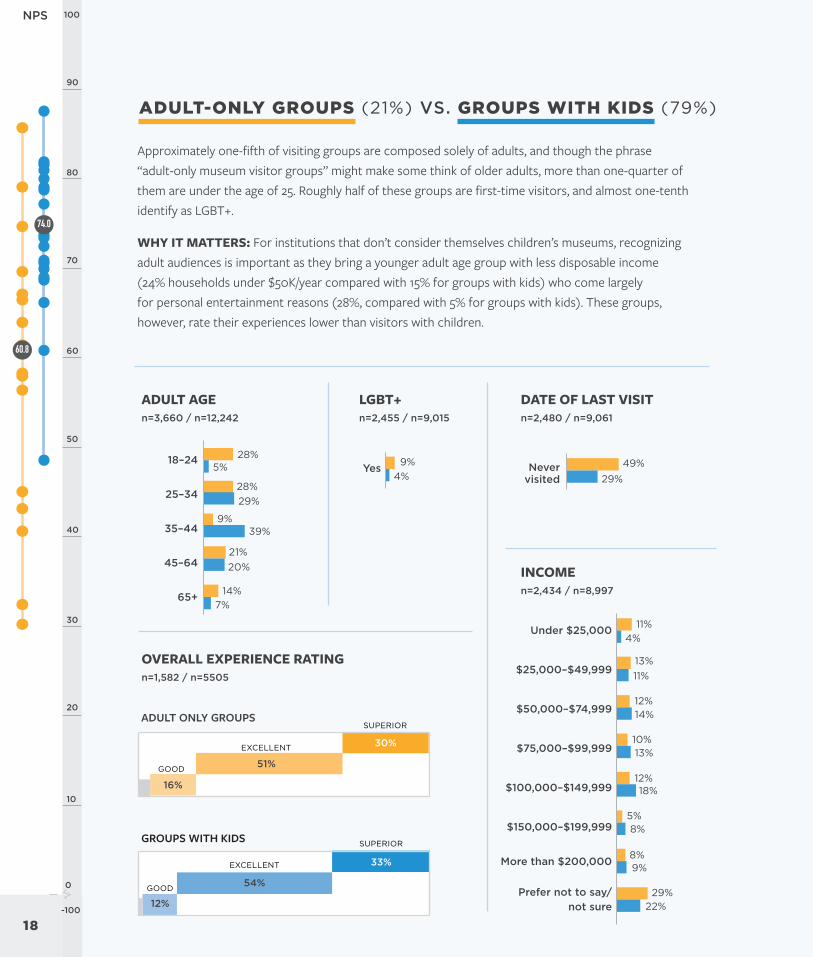
0
10
20
30
40
50
60
70
80
90
100
-100
18
NPS
ADULT-ONLY GROUPS (21) VS GROUPS WITH KIDS (79)
ADULT ONLY GROUPS
GROUPS WITH KIDS
SUPERIOR
SUPERIOR
EXCELLENT
EXCELLENT
GOOD
GOOD
51
54
16
12
30
33
OVERALL EXPERIENCE RATINGn=1582 n=5505
ADULT AGEn=3660 n=12242
DATE OF LAST VISITn=2480 n=9061
INCOMEn=2434 n=8997
LGBT+n=2455 n=9015
608
740
Approximately one-fifth of visiting groups are composed solely of adults and though the phrase ldquoadult-only museum visitor groupsrdquo might make some think of older adults more than one-quarter of them are under the age of 25 Roughly half of these groups are first-time visitors and almost one-tenth identify as LGBT+
WHY IT MATTERS For institutions that donrsquot consider themselves childrenrsquos museums recognizing adult audiences is important as they bring a younger adult age group with less disposable income (24 households under $50Kyear compared with 15 for groups with kids) who come largely for personal entertainment reasons (28 compared with 5 for groups with kids) These groups however rate their experiences lower than visitors with children
28+5+28+29+9+39+21+2014+79+4 49+29
14+4+13+11+12+14+10+13+12+18+5+8+8+9+2922
18ndash24
25ndash34
35ndash44
45ndash64
65+
Yes Never visited
Under $25000
$25000ndash$49999
$50000ndash$74999
$75000ndash$99999
$100000ndash$149999
$150000ndash$199999
More than $200000
Prefer not to say not sure
285
2829
4
399
2120
147
9 49
11
1311
1214
1013
12
58
8
2922
9
18
29
4
0
10
20
30
40
50
60
70
80
90
100
-100
19
NPS
0
10
20
30
40
50
60
70
80
90
100
-100
19
NPS
7+5 67+27+6789+91 84+88 86+87 90+92 8890
LOCAL NON-MEMBERS (44)
VS OUT-OF-TOWN NON-MEMBERS (36)
LOCALS
OUT-OF-TOWNERS
SUPERIOR
SUPERIOR
EXCELLENT
EXCELLENT
GOOD
GOOD536
326
MOTIVATIONSn=3352 n=2737
EXPERIENCE RATINGSAverage rating scale from 0 to 10 where 10 is highest n varies
DATE OF LAST VISITn=3309 n=2692
OVERALL EXPERIENCE RATINGn=2055 n=1601
32
16
53
53
Education experience
Value for cost
Exhibits in working order
Staff member helpfulness
Restrooms cleanliness
lt 3 months
3-6 mos
6-12 mos
67
2767
893907
842875
863874
906920
875896
14
29
Since members are much more likely to be local members are excluded from analyses on this page to highlight differences that are unique to non-member locals and out-of-towners Almost half of all non-member visitors report coming in locals-only groups (ie not bringing out-of-town guests with them) and consistent with the overall aggregate data tend to come to spend time with their group While out-of-town-only non-member groups come instead as something to do while visiting the area these out-of-towners also rate their experiences slightly higher than the locals
WHY IT MATTERS Removing members (and their higher ratings) from the analyses shows that out-of-town-only groups rate their experience more highly than local-only groups Together with the analysis of first-time and repeat visitors this suggests that there is the most room to improve in serving local first-time visitors
659 664
4130 4+35 11+2 12+2 12+4Spend time together
Something to do while visiting the area
41 11 752
12
12
2
4
435
305-10 yrs
10+ yrs
Never
-100
NPS
20
0
10
20
30
40
50
60
70
80
90
100
-100
SUMMER (JULndashSEP) FALL (OCTndashDEC)
WINTER (JANndashMAR) AND SPRING (APRndashJUN)
SUPERIOR
SUPERIOR
SUPERIOR
EXCELLENT
EXCELLENT
EXCELLENT
GOOD
GOOD
GOOD
36
31
32
50
54
53
FALL AUDIENCES | n=898
WINTER AUDIENCES | n=3306
SPRING AUDIENCES | n=2883
OVERALL EXPERIENCE RATING EXPERIENCE RATINGSAverage rating scale from 0 to 10 where 10 is highest n varies
896897893891
873885869864
881884866867
929929910910
One advantage of the ongoing nature of COVES is the ability to compare ratings over time In this yearrsquos COVES data experience ratings appear to be highest in the Fall quarter (from Oct to Dec 2017)
WHY IT MATTERS Museum visitation varies by season with many museums busier in the summer months than the fall as school goes back into session Some museums also bring temporary exhibitions throughout the year These and other factors can influence experience ratings at any given time in the year
90+90+89+89 87+89+87+86 88+88+87+87 93+93+91+91
Entertainment experience
Value for cost
Exhibits in working order
Staff member helpfulness
Summer data not included because the question was not added until Oct 2017
20
722 718702
13
13
14
703
0
10
20
30
40
50
60
70
80
90
100
-100
21
NPS NPS
21-100
0
10
20
30
40
50
60
80
90
100
70
LARGE MEDIUM AND SMALL INSTITUTIONS
Education experience
Entertainment experience
Value for cost
Exhibits in working order
Staff member helpfulness
The 2017-18 COVES cohort contained institutions of vastly different sizes with yearly visitation ranging from under 10000 visitors to over 1 million visitors Visitors to the smallest museums tend to give higher experience ratings The trend is especially clear in ratings for staff helpfulness and the value of the experience relative to the cost
WHY IT MATTERS Small and very small museums represent a higher proportion of the Association of Science-Technology Centers (ASTC) membership than medium and large museums Though large museums are often working with more resources small museums provide high quality visitor experiences
90+90+91 90+88+89+ 85+86+90+ 87+85+89 90+91+94
SUPERIOR
SUPERIOR
SUPERIOR
EXCELLENT
EXCELLENT
EXCELLENT
GOOD
GOOD
GOOD
LARGE INSTITUTIONS | n=3069
MEDIUM INSTITUTIONS | n=1818
SMALL INSTITUTIONS | n=2201
OVERALL EXPERIENCE RATING
32
906896910
898887894
852863901
874852889
906914934
EXPERIENCE RATINGSAverage rating scale from 0 to 10 where 10 is highest n varies
713
18
14
33
53
12
53
14
32
54
686
728
22
GET INVOLVED IN COVESDo you want to see data from your institution represented in COVES We are always looking for new participants As more institutions join our field-wide dataset becomes more representative As of October 2018 we have 22 science centers participating in COVES
If you are interested in joining our collaboration or just want to learn more please contact us at infounderstandingvisitorsorg or visit our website at wwwunderstandingvisitorsorg Currently any Association of Science-Technology Centers (ASTC) member in good standing is eligible to join but we encourage people from all types of museums to contact us
Bradbury Science Museum
Center of Science and Industry (COSI)
Discovery Center Museum
Discovery Place Science
EcoTarium
Exploratorium
Great Lakes Science Center
Imagination Station
Museum of Discovery and Science
Museum of Science Boston
Natural History Museum of Utah
New York Hall of Science
Oregon Museum of Science and Industry
Orlando Science Center
Roseville Utility Exploration Center
Saint Louis Science Center
Science Center of Iowa
Science Museum of Minnesota
Science World British Columbia
Terry Lee Wells Nevada Museum of Discovery
The DoSeum
The Franklin Institute
SCIENCE CENTERS PARTICIPATING IN COVES AS OF OCTOBER 2018
understandingvisitorsorg
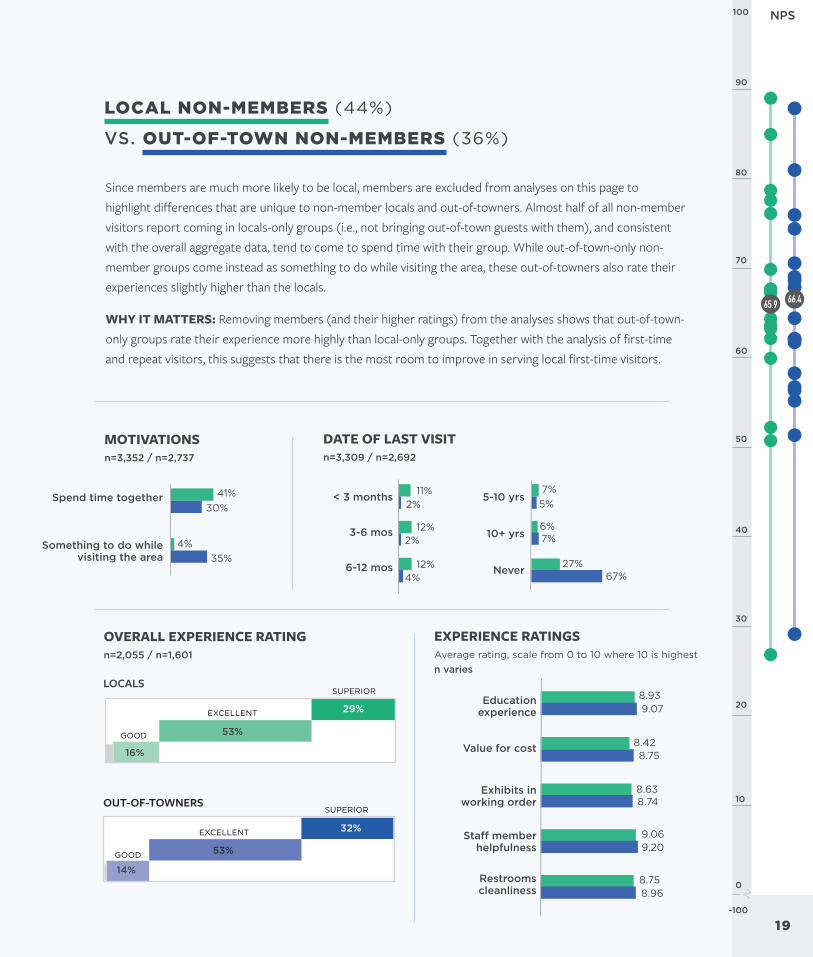
0
10
20
30
40
50
60
70
80
90
100
-100
19
NPS
0
10
20
30
40
50
60
70
80
90
100
-100
19
NPS
7+5 67+27+6789+91 84+88 86+87 90+92 8890
LOCAL NON-MEMBERS (44)
VS OUT-OF-TOWN NON-MEMBERS (36)
LOCALS
OUT-OF-TOWNERS
SUPERIOR
SUPERIOR
EXCELLENT
EXCELLENT
GOOD
GOOD536
326
MOTIVATIONSn=3352 n=2737
EXPERIENCE RATINGSAverage rating scale from 0 to 10 where 10 is highest n varies
DATE OF LAST VISITn=3309 n=2692
OVERALL EXPERIENCE RATINGn=2055 n=1601
32
16
53
53
Education experience
Value for cost
Exhibits in working order
Staff member helpfulness
Restrooms cleanliness
lt 3 months
3-6 mos
6-12 mos
67
2767
893907
842875
863874
906920
875896
14
29
Since members are much more likely to be local members are excluded from analyses on this page to highlight differences that are unique to non-member locals and out-of-towners Almost half of all non-member visitors report coming in locals-only groups (ie not bringing out-of-town guests with them) and consistent with the overall aggregate data tend to come to spend time with their group While out-of-town-only non-member groups come instead as something to do while visiting the area these out-of-towners also rate their experiences slightly higher than the locals
WHY IT MATTERS Removing members (and their higher ratings) from the analyses shows that out-of-town-only groups rate their experience more highly than local-only groups Together with the analysis of first-time and repeat visitors this suggests that there is the most room to improve in serving local first-time visitors
659 664
4130 4+35 11+2 12+2 12+4Spend time together
Something to do while visiting the area
41 11 752
12
12
2
4
435
305-10 yrs
10+ yrs
Never
-100
NPS
20
0
10
20
30
40
50
60
70
80
90
100
-100
SUMMER (JULndashSEP) FALL (OCTndashDEC)
WINTER (JANndashMAR) AND SPRING (APRndashJUN)
SUPERIOR
SUPERIOR
SUPERIOR
EXCELLENT
EXCELLENT
EXCELLENT
GOOD
GOOD
GOOD
36
31
32
50
54
53
FALL AUDIENCES | n=898
WINTER AUDIENCES | n=3306
SPRING AUDIENCES | n=2883
OVERALL EXPERIENCE RATING EXPERIENCE RATINGSAverage rating scale from 0 to 10 where 10 is highest n varies
896897893891
873885869864
881884866867
929929910910
One advantage of the ongoing nature of COVES is the ability to compare ratings over time In this yearrsquos COVES data experience ratings appear to be highest in the Fall quarter (from Oct to Dec 2017)
WHY IT MATTERS Museum visitation varies by season with many museums busier in the summer months than the fall as school goes back into session Some museums also bring temporary exhibitions throughout the year These and other factors can influence experience ratings at any given time in the year
90+90+89+89 87+89+87+86 88+88+87+87 93+93+91+91
Entertainment experience
Value for cost
Exhibits in working order
Staff member helpfulness
Summer data not included because the question was not added until Oct 2017
20
722 718702
13
13
14
703
0
10
20
30
40
50
60
70
80
90
100
-100
21
NPS NPS
21-100
0
10
20
30
40
50
60
80
90
100
70
LARGE MEDIUM AND SMALL INSTITUTIONS
Education experience
Entertainment experience
Value for cost
Exhibits in working order
Staff member helpfulness
The 2017-18 COVES cohort contained institutions of vastly different sizes with yearly visitation ranging from under 10000 visitors to over 1 million visitors Visitors to the smallest museums tend to give higher experience ratings The trend is especially clear in ratings for staff helpfulness and the value of the experience relative to the cost
WHY IT MATTERS Small and very small museums represent a higher proportion of the Association of Science-Technology Centers (ASTC) membership than medium and large museums Though large museums are often working with more resources small museums provide high quality visitor experiences
90+90+91 90+88+89+ 85+86+90+ 87+85+89 90+91+94
SUPERIOR
SUPERIOR
SUPERIOR
EXCELLENT
EXCELLENT
EXCELLENT
GOOD
GOOD
GOOD
LARGE INSTITUTIONS | n=3069
MEDIUM INSTITUTIONS | n=1818
SMALL INSTITUTIONS | n=2201
OVERALL EXPERIENCE RATING
32
906896910
898887894
852863901
874852889
906914934
EXPERIENCE RATINGSAverage rating scale from 0 to 10 where 10 is highest n varies
713
18
14
33
53
12
53
14
32
54
686
728
22
GET INVOLVED IN COVESDo you want to see data from your institution represented in COVES We are always looking for new participants As more institutions join our field-wide dataset becomes more representative As of October 2018 we have 22 science centers participating in COVES
If you are interested in joining our collaboration or just want to learn more please contact us at infounderstandingvisitorsorg or visit our website at wwwunderstandingvisitorsorg Currently any Association of Science-Technology Centers (ASTC) member in good standing is eligible to join but we encourage people from all types of museums to contact us
Bradbury Science Museum
Center of Science and Industry (COSI)
Discovery Center Museum
Discovery Place Science
EcoTarium
Exploratorium
Great Lakes Science Center
Imagination Station
Museum of Discovery and Science
Museum of Science Boston
Natural History Museum of Utah
New York Hall of Science
Oregon Museum of Science and Industry
Orlando Science Center
Roseville Utility Exploration Center
Saint Louis Science Center
Science Center of Iowa
Science Museum of Minnesota
Science World British Columbia
Terry Lee Wells Nevada Museum of Discovery
The DoSeum
The Franklin Institute
SCIENCE CENTERS PARTICIPATING IN COVES AS OF OCTOBER 2018
understandingvisitorsorg
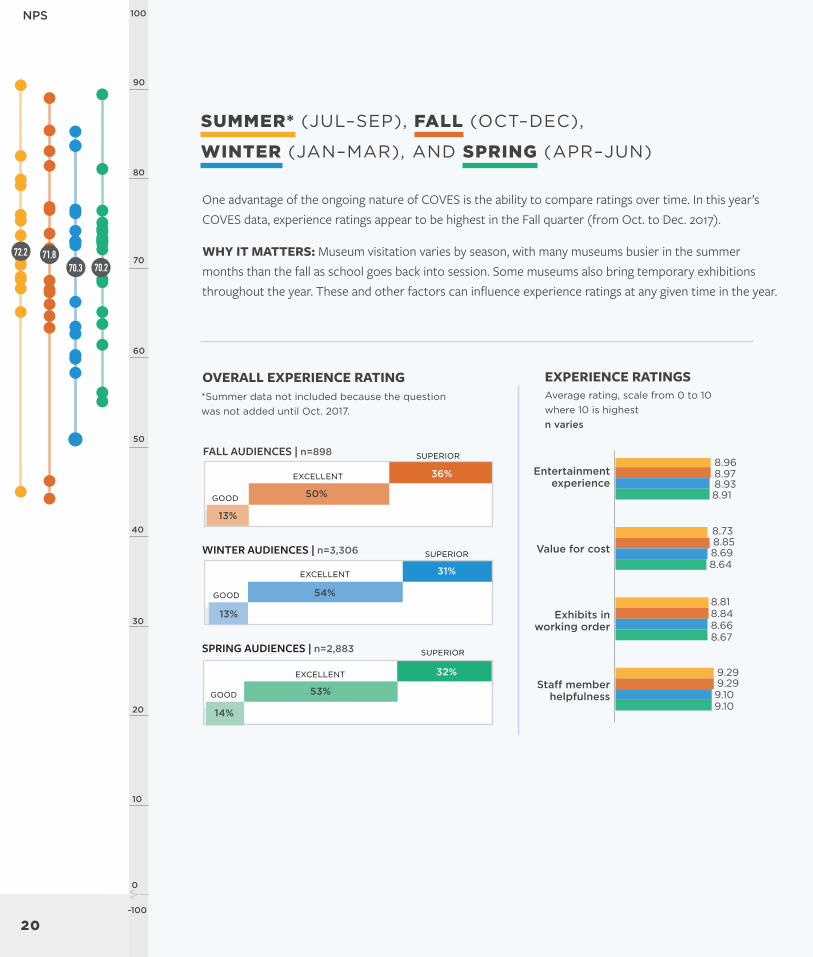
-100
NPS
20
0
10
20
30
40
50
60
70
80
90
100
-100
SUMMER (JULndashSEP) FALL (OCTndashDEC)
WINTER (JANndashMAR) AND SPRING (APRndashJUN)
SUPERIOR
SUPERIOR
SUPERIOR
EXCELLENT
EXCELLENT
EXCELLENT
GOOD
GOOD
GOOD
36
31
32
50
54
53
FALL AUDIENCES | n=898
WINTER AUDIENCES | n=3306
SPRING AUDIENCES | n=2883
OVERALL EXPERIENCE RATING EXPERIENCE RATINGSAverage rating scale from 0 to 10 where 10 is highest n varies
896897893891
873885869864
881884866867
929929910910
One advantage of the ongoing nature of COVES is the ability to compare ratings over time In this yearrsquos COVES data experience ratings appear to be highest in the Fall quarter (from Oct to Dec 2017)
WHY IT MATTERS Museum visitation varies by season with many museums busier in the summer months than the fall as school goes back into session Some museums also bring temporary exhibitions throughout the year These and other factors can influence experience ratings at any given time in the year
90+90+89+89 87+89+87+86 88+88+87+87 93+93+91+91
Entertainment experience
Value for cost
Exhibits in working order
Staff member helpfulness
Summer data not included because the question was not added until Oct 2017
20
722 718702
13
13
14
703
0
10
20
30
40
50
60
70
80
90
100
-100
21
NPS NPS
21-100
0
10
20
30
40
50
60
80
90
100
70
LARGE MEDIUM AND SMALL INSTITUTIONS
Education experience
Entertainment experience
Value for cost
Exhibits in working order
Staff member helpfulness
The 2017-18 COVES cohort contained institutions of vastly different sizes with yearly visitation ranging from under 10000 visitors to over 1 million visitors Visitors to the smallest museums tend to give higher experience ratings The trend is especially clear in ratings for staff helpfulness and the value of the experience relative to the cost
WHY IT MATTERS Small and very small museums represent a higher proportion of the Association of Science-Technology Centers (ASTC) membership than medium and large museums Though large museums are often working with more resources small museums provide high quality visitor experiences
90+90+91 90+88+89+ 85+86+90+ 87+85+89 90+91+94
SUPERIOR
SUPERIOR
SUPERIOR
EXCELLENT
EXCELLENT
EXCELLENT
GOOD
GOOD
GOOD
LARGE INSTITUTIONS | n=3069
MEDIUM INSTITUTIONS | n=1818
SMALL INSTITUTIONS | n=2201
OVERALL EXPERIENCE RATING
32
906896910
898887894
852863901
874852889
906914934
EXPERIENCE RATINGSAverage rating scale from 0 to 10 where 10 is highest n varies
713
18
14
33
53
12
53
14
32
54
686
728
22
GET INVOLVED IN COVESDo you want to see data from your institution represented in COVES We are always looking for new participants As more institutions join our field-wide dataset becomes more representative As of October 2018 we have 22 science centers participating in COVES
If you are interested in joining our collaboration or just want to learn more please contact us at infounderstandingvisitorsorg or visit our website at wwwunderstandingvisitorsorg Currently any Association of Science-Technology Centers (ASTC) member in good standing is eligible to join but we encourage people from all types of museums to contact us
Bradbury Science Museum
Center of Science and Industry (COSI)
Discovery Center Museum
Discovery Place Science
EcoTarium
Exploratorium
Great Lakes Science Center
Imagination Station
Museum of Discovery and Science
Museum of Science Boston
Natural History Museum of Utah
New York Hall of Science
Oregon Museum of Science and Industry
Orlando Science Center
Roseville Utility Exploration Center
Saint Louis Science Center
Science Center of Iowa
Science Museum of Minnesota
Science World British Columbia
Terry Lee Wells Nevada Museum of Discovery
The DoSeum
The Franklin Institute
SCIENCE CENTERS PARTICIPATING IN COVES AS OF OCTOBER 2018
understandingvisitorsorg
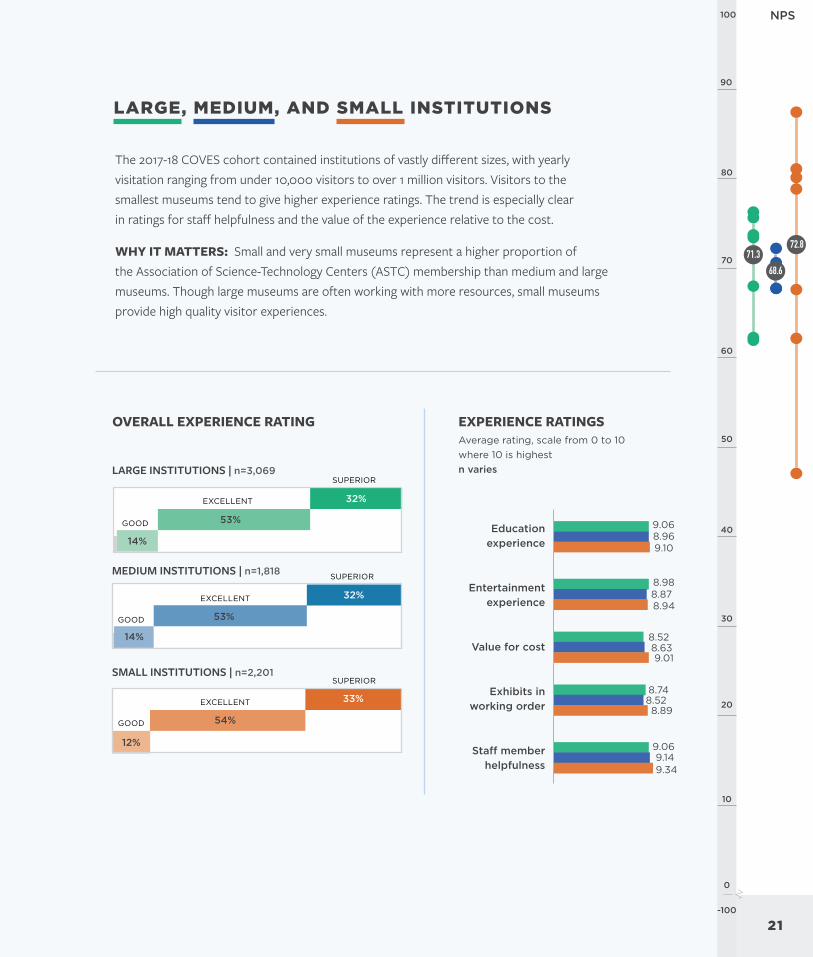
0
10
20
30
40
50
60
70
80
90
100
-100
21
NPS NPS
21-100
0
10
20
30
40
50
60
80
90
100
70
LARGE MEDIUM AND SMALL INSTITUTIONS
Education experience
Entertainment experience
Value for cost
Exhibits in working order
Staff member helpfulness
The 2017-18 COVES cohort contained institutions of vastly different sizes with yearly visitation ranging from under 10000 visitors to over 1 million visitors Visitors to the smallest museums tend to give higher experience ratings The trend is especially clear in ratings for staff helpfulness and the value of the experience relative to the cost
WHY IT MATTERS Small and very small museums represent a higher proportion of the Association of Science-Technology Centers (ASTC) membership than medium and large museums Though large museums are often working with more resources small museums provide high quality visitor experiences
90+90+91 90+88+89+ 85+86+90+ 87+85+89 90+91+94
SUPERIOR
SUPERIOR
SUPERIOR
EXCELLENT
EXCELLENT
EXCELLENT
GOOD
GOOD
GOOD
LARGE INSTITUTIONS | n=3069
MEDIUM INSTITUTIONS | n=1818
SMALL INSTITUTIONS | n=2201
OVERALL EXPERIENCE RATING
32
906896910
898887894
852863901
874852889
906914934
EXPERIENCE RATINGSAverage rating scale from 0 to 10 where 10 is highest n varies
713
18
14
33
53
12
53
14
32
54
686
728
22
GET INVOLVED IN COVESDo you want to see data from your institution represented in COVES We are always looking for new participants As more institutions join our field-wide dataset becomes more representative As of October 2018 we have 22 science centers participating in COVES
If you are interested in joining our collaboration or just want to learn more please contact us at infounderstandingvisitorsorg or visit our website at wwwunderstandingvisitorsorg Currently any Association of Science-Technology Centers (ASTC) member in good standing is eligible to join but we encourage people from all types of museums to contact us
Bradbury Science Museum
Center of Science and Industry (COSI)
Discovery Center Museum
Discovery Place Science
EcoTarium
Exploratorium
Great Lakes Science Center
Imagination Station
Museum of Discovery and Science
Museum of Science Boston
Natural History Museum of Utah
New York Hall of Science
Oregon Museum of Science and Industry
Orlando Science Center
Roseville Utility Exploration Center
Saint Louis Science Center
Science Center of Iowa
Science Museum of Minnesota
Science World British Columbia
Terry Lee Wells Nevada Museum of Discovery
The DoSeum
The Franklin Institute
SCIENCE CENTERS PARTICIPATING IN COVES AS OF OCTOBER 2018
understandingvisitorsorg
understandingvisitorsorg