Understanding nutrient landscapes for giant pandas in the...
14
195 Animal Biodiversity and Conservation 41.2 (2018) © 2018 Museu de Ciències Naturals de Barcelona ISSN: 1578–665 X eISSN: 2014–928 X Huang, Q., Liu, X., Li, Y., Kraus, J., Songer, M., 2018. Understanding nutrient landscapes for giant pandas in the Qinling Mountains, China: the relationships between bamboo mineral content and giant panda habitat selection during migration. Animal Biodiversity and Conservation, 41.2: 195–208, https://doi.org/10.32800/ abc.2018.41.0195 Abstract Understanding nutrient landscapes for giant pandas in the Qinling Mountains, China: the relationships between bamboo mineral content and giant panda habitat selection during migration. Bamboo comprises over 99 % of the diet of giant pandas (Ailuropoda melanoleuca). Giant pandas face a complex nutrient landscape. They eat more than one species of bamboo and various parts of the plant, and they move seasonally to find optimal fo- rage. Though the seasonal habitat preferences of giant pandas have long been known, the spatial and temporal nutrient gradient of bamboo between seasonal habitats remains unclear. Few studies detail the nutrient content of bamboo in relation to the seasonal habitat selection of giant pandas in the wild. In this study, we collected bamboo samples from 57 plots considering four factors (seasons, elevations, species, and plant parts). We evaluated the effect of these factors on the contents of seven bamboo mineral elements (Cu, Zn, Fe, Mn, K, Ca, and Mg) and used a non–parametric ensemble tree model to model giant pandas' presence and absence based on bamboo mineral content. Our results showed strong correlations between pairs of mineral contents (up to r = 0.69) with specific mineral elements such as Mn, consistently showing great importance in the models for differentiating the habitat selection. We also observed significant variation in mineral concentrations between seasons, bamboo species, and plant parts. Our results suggest that the studied bamboo mineral content strongly associates giant pandas' habitat preferences. Our research may be useful for the development of conservation and reserve management strategies by providing guidelines to increase giant pandas' opportunities to obtain sufficient nutrient within the Qinling region. Key words: Giant pandas, Habitat selection, Machine learning, Mineral elements, Nutrient content, Qinling Mountains Resumen Comprender la distribución de nutrientes en el territorio del panda gigante en las montañas Qinling, en China: las relaciones entre el contenido de minerales del bambú y la selección del hábitat del panda gigante durante la migración. A pesar de que el bambú constituye más del 99 % de la dieta del panda gigante (Ailuropoda melanoleuca), esta especie se enfrentan a un complejo patrón de disponibilidad de nutrientes, ya que consumen más de una especie de bambú y varias partes de la planta, y se desplazan de forma estacional para encontrar el alimento óptimo. Si bien las preferencias estacionales del hábitat del panda gigante se conocen desde hace tiempo, el gradiente espacial y temporal de los nutrientes del bambú entre los hábitats estacionales sigue siendo poco claro. Son pocos los estudios en los que se describe con detalle el contenido de nutrientes del bambú en relación con la selección estacional del hábitat del panda gigante en el medio silvestre. En este estudio, recogimos muestras de bambú de 57 parcelas teniendo en cuenta cuatro factores (estación del año, altura, especie y parte de la planta). Se evaluó el efecto de estos factores en el contenido de siete elementos minerales del bambú (Cu, Zn, Fe, Mn, K, Ca y Mg) y se utilizó un modelo de árbol no paramétrico para determinar la presencia y ausencia del panda gigante en función del contenido de minerales del bambú. Nuestros resultados mostraron que existen fuertes correlaciones entre pares de contenidos de minerales (hasta r = 0,69) y que algunos elementos minerales, como el Mn, son siempre un factor importante en la selección del hábitat. También observamos una variación significativa en las concentraciones de minerales entre estaciones, especies de bambú y partes de la planta. Understanding nutrient landscapes for giant pandas in the Qinling Mountains, China: the relationships between bamboo mineral content and giant panda habitat selection during migration Q. Huang, X. Liu, Y. Li, J. Kraus, M. Songer
Transcript of Understanding nutrient landscapes for giant pandas in the...
195Animal Biodiversity and Conservation 41.2 (2018)
© 2018 Museu de Ciències Naturals de BarcelonaISSN: 1578–665 XeISSN: 2014–928 X
Huang, Q., Liu, X., Li, Y., Kraus, J., Songer, M., 2018. Understanding nutrient landscapes for giant pandas in the Qinling Mountains, China: the relationships between bamboo mineral content and giant panda habitat selection during migration. Animal Biodiversity and Conservation, 41.2: 195–208, https://doi.org/10.32800/abc.2018.41.0195
AbstractUnderstanding nutrient landscapes for giant pandas in the Qinling Mountains, China: the relationships between bamboo mineral content and giant panda habitat selection during migration. Bamboo comprises over 99 % of the diet of giant pandas (Ailuropoda melanoleuca). Giant pandas face a complex nutrient landscape. They eat more than one species of bamboo and various parts of the plant, and they move seasonally to find optimal fo-rage. Though the seasonal habitat preferences of giant pandas have long been known, the spatial and temporal nutrient gradient of bamboo between seasonal habitats remains unclear. Few studies detail the nutrient content of bamboo in relation to the seasonal habitat selection of giant pandas in the wild. In this study, we collected bamboo samples from 57 plots considering four factors (seasons, elevations, species, and plant parts). We evaluated the effect of these factors on the contents of seven bamboo mineral elements (Cu, Zn, Fe, Mn, K, Ca, and Mg) and used a non–parametric ensemble tree model to model giant pandas' presence and absence based on bamboo mineral content. Our results showed strong correlations between pairs of mineral contents (up to r = 0.69) with specific mineral elements such as Mn, consistently showing great importance in the models for differentiating the habitat selection. We also observed significant variation in mineral concentrations between seasons, bamboo species, and plant parts. Our results suggest that the studied bamboo mineral content strongly associates giant pandas' habitat preferences. Our research may be useful for the development of conservation and reserve management strategies by providing guidelines to increase giant pandas' opportunities to obtain sufficient nutrient within the Qinling region.
Key words: Giant pandas, Habitat selection, Machine learning, Mineral elements, Nutrient content, Qinling Mountains
ResumenComprender la distribución de nutrientes en el territorio del panda gigante en las montañas Qinling, en China: las relaciones entre el contenido de minerales del bambú y la selección del hábitat del panda gigante durante la migración. A pesar de que el bambú constituye más del 99 % de la dieta del panda gigante (Ailuropoda melanoleuca), esta especie se enfrentan a un complejo patrón de disponibilidad de nutrientes, ya que consumen más de una especie de bambú y varias partes de la planta, y se desplazan de forma estacional para encontrar el alimento óptimo. Si bien las preferencias estacionales del hábitat del panda gigante se conocen desde hace tiempo, el gradiente espacial y temporal de los nutrientes del bambú entre los hábitats estacionales sigue siendo poco claro. Son pocos los estudios en los que se describe con detalle el contenido de nutrientes del bambú en relación con la selección estacional del hábitat del panda gigante en el medio silvestre. En este estudio, recogimos muestras de bambú de 57 parcelas teniendo en cuenta cuatro factores (estación del año, altura, especie y parte de la planta). Se evaluó el efecto de estos factores en el contenido de siete elementos minerales del bambú (Cu, Zn, Fe, Mn, K, Ca y Mg) y se utilizó un modelo de árbol no paramétrico para determinar la presencia y ausencia del panda gigante en función del contenido de minerales del bambú. Nuestros resultados mostraron que existen fuertes correlaciones entre pares de contenidos de minerales (hasta r = 0,69) y que algunos elementos minerales, como el Mn, son siempre un factor importante en la selección del hábitat. También observamos una variación significativa en las concentraciones de minerales entre estaciones, especies de bambú y partes de la planta.
Understanding nutrient landscapes for giant pandas in the Qinling Mountains, China: the relationships between bamboo mineral content and giant panda habitat selection during migration
Q. Huang, X. Liu, Y. Li, J. Kraus, M. Songer
196 Huang et al.
Los resultados sugieren que el contenido de minerales del bambú estudiado está fuertemente relacionado con las preferencias de hábitat de los pandas gigantes. Nuestra investigación puede ayudar a elaborar estrategias de conservación y gestión de reservas al ofrecer pautas que ayuden a aumentar la posibilidad de que el panda gigante pueda obtener los nutrientes que necesita en la región de Qinling.
Palabras clave: Pandas gigantes, Selección del hábitat, Aprendizaje automático, Elementos minerales, Contenido de nutrientes, Montañas Qinling
Received: 28 II 17; Conditional acceptance: 17 V 17; Final acceptance: 12 IX 17
Qiongyu Huang, Jacob Kraus, Melissa Songer, Conservation Ecology Center, Smithsonian Conservation Biology Institute, Front Royal, Virginia 22630, USA.– Xuehua Liu, Yajun Li, School of Environment, Tsinghua Univ., Beijing 100084, China.
Corresponding author: Xuehua Liu. E–mail: xuehua–[email protected]
Animal Biodiversity and Conservation 41.2 (2018) 197
Introduction
Bamboo comprises over 99 % of the diet of wild giant pandas (Ailuroplda melanoleuca) (Sheldon, 1937; Milton, 1979; Dierenfeld et al., 1982; Tuanmu et al., 2012). Though giant pandas forage primarily on vegetation, their gut anatomy resembles that of a carnivore, with a simple stomach and short gastroin-testinal tract that greatly limits its ability to digest fiber. The poor nutrition content of bamboo, which is low in protein and high in fiber, requires giant pandas to consume large quantities of bamboo to meet their dietary requirements (Milton, 1979; Dierenfeld et al., 1982; Tuanmu et al., 2012). Climate change and shifts in the phenology and physiological conditions of bamboo may exacerbate the challenges of finding suitable habitat to meet giant pandas dietary require-ments (Liu et al., 1999; Li and Manfred, 2001; Hunter et al., 2003; Songer et al., 2012; Hull et al., 2014).
Given the dependence of giant pandas on bamboo, a deeper understanding of the nutrient landscape faced by giant pandas is critical to conservation efforts (Mainka et al., 1989; Reid et al., 1989; Reid and Hu, 1991; Taylor et al., 1991). Previous studies highlighted a variety of factors (seasons, elevations, species, and bamboo plant parts) affecting the mineral content of bamboo (Fu et al., 1990; Liu, 2008; Sun et al., 2010; Wang et al., 2010, 2013). Most studies, however, focused on the effect of only one or two of these factors and presented only the empirical measurements of the chemical composition of bamboo (Taylor and Qin, 1993; Li et al., 2007; Wang et al., 2009; Wu et al., 2009). A comprehensive analysis of the relationship between multiple covariables and bamboo nutrients is needed (Liu, 2001; Liu et al., 2002, 2005; Finley et al., 2011; Hull et al., 2011).
Giant panda’s habitat selection in the Qinling Moun-tains has been extensively documented. Giant pandas migrate in late spring from their home range at low elevations to their summer home range at higher eleva-tions and return to their low elevation range in autumn (Schaller et al., 1989; Liu et al., 2002, Lu et al., 2007; Qi et al., 2011, 2012). It has been hypothesized that this migration pattern evolved to facilitate access to either abundant or more nutritious forage (Zhang et al., 2006, 2014; Sims et al., 2007; Viña et al., 2010; Wang et al., 2010). However, little work has been done to understand the relationships among the nutrient composition of bamboo and giant pandas habitat preferences.
In our study, we measured the nutrient content of bamboo across seasons and elevation gradients. We collected samples from three elevation strata in spring, summer and autumn. Each season, giant pandas are present in one of the strata and absent in the other two. This enabled us to examine the nutrient landscape of giant pandas at various locations and seasons and to explore the statistical association between bamboo nutrient content and giant pandas’ habitat choices. Furthermore, it allowed us to compare the relative contribution of individual mineral elements to giant pandas' habitat selection.
We first tested the correlation between seven mi-neral elements. We then examined the effect of the four factors (season, elevation, species, and plant
part) on the mean concentrations of each mineral. Finally, we modeled the presence and absence of giant pandas using the mineral element contents with a non–parametric ensemble tree model. For each season we built one model and evaluated the impor-tance of predictive variables to the model. We sought to answer the following research questions: (1) How do each of the seven mineral elements change with season, elevation, part, and species? (2) What are the relative associations between the seven mineral ele-ments across landscapes and giant pandas’ seasonal selection of habitat?
Material and methods
Foping Nature Reserve (FNR) in Shaanxi Province was founded in 1978 in the center of a giant panda reserve network in the Qinling Mountain range. FNR (32º 32' – 33º 43' N, 107º 41' – 107º 56' E) covers an area of 293 km2 and is one of earliest reserves es-tablished for giant pandas. The annual temperature at FNR was 11.5 ºC (mean min = –3 ºC in January, mean max = 28 ºC in July) with elevation ranging between 1000 m and 2900 m. FNR is home to three bam-boo species: arrow bamboo (Fargesia qinlingensis) dominating at higher elevation (1,700–2,900 m), wooden bamboo (Bashania fargesii) mostly found at lower elevation (1,000–1,900 m), and dragon–head bamboo (Fargesia racocephala) restricted to a small area in the southeast corner of the FNR (1,000–1,800 m). Arrow bamboo is the giant pandas’ only food resource in summer, while they forage primarily on wooden bamboo and dragon–head bamboo in other seasons (State Forestry Administration of the People’s Republic of China, 2006; Zhang et al., 2014).
Guanyinshan Nature Reserve (GNR) was founded in 2002 to protect additional gi-ant panda habitat. GNR (33º 35' – 33º 45' N, 107º 51' – 108º 01' E) covers an area of 135 km2, and is located on the south slope of the Qinling Mountains-directly adjacent to the eastern boundary of FNR. The average annual temperature at GNR is 11.5 ºC with elevation ranging between 1,150 to 2,574 m. Arrow bamboo (located > 1,800 m) and dragon–head bamboo (located below 1,800 m and close to water) are common in the reserve. Because the GNR area was previously part of a state–owned forest enterprise, logging ac-tivities were a common source of disturbance. After the establishment of the Natural Forest Conservation Program in 1998, logging activities were banned (Liu et al., 2008). Giant pandas were recently spotted several times in dragon–head bamboo forest during spring and autumn in this reserve (Liu et al., 2013).
Sample processing
We collected bamboo samples from 57 plots across the FNR and GNR in April, July, and October 2013 (fi g. 1). We chose these sampling periods because they are in the middle of spring (March to May), summer (June to August), and autumn (September to November). We divided the elevation into three strata: low elevation
198 Huang et al.
stratum (1,500–1,750 m) with wooden and dragon–head bamboo, transition elevation stratum (1,750–2,200 m) with arrow and wooden bamboo, and high elevation stratum (2,200–2,700 m) with only arrow bamboo. We took wooden bamboo, arrow bamboo and dragon–head bamboo samples in Sanguanmiao, Guangtoushan, and Xigou where there were large forests of the three bamboo species. Each season we sampled one transect (arrow bamboo) at high elevation, two transects (arrow and wooden bamboo) at the transitional elevation, and two transects (wooden and dragon–head bamboo) at the low elevation. Each transect contained three or four plots. In each plot (1 x 1 m) we took samples (200–300 g, wet) of shoots, leaves, branches, one–year culms, and culms older than one year. Each sample was washed with distilled water, ground to 80 g mesh by a high–speed grinder, and dried to a constant weight at 60 ºC. We analyzed seven mineral elements (Cu, Zn, Fe, Mn, K, Ca, and Mg) by the standard atomic absorption spectrophotometry procedure (Skoog and West, 1980).
Data analysis
We tested the correlation between the seven elements using Pearson correlation and the mean content difference between levels of each factor (seasons, elevations, parts, and species) by non–parametric Kruskal–Wallis test (significance level at α = 0.05).
During spring and winter, giant pandas are present only at low elevations and absent at transitional and high elevations. In late spring, giant pandas leave low eleva-tion areas and migrate rapidly through the transitional region to reach high elevation areas where they stay until the end of summer (Liu, 2001; Nie et al., 2014). To examine the relationships between mineral elements and spatial distribution of giant pandas, we summarized 35 variables based on the mean nutrient concentration in all bamboo parts (5 parts x 7 elements).
We used a Random Forest (RF) approach to model the presence and absence of giant pandas using these 35 predictive variables. We implemented the Random Forest package (Liaw and Wiener, 2002) in R software (R Development, 2008) to build the models. RF is a non–parametric ensemble tree model for classification that operates by constructing a multitude of decision trees. RF can accommodate large number of input variables without overfitting and it does not require a spe-cific distribution for predictive variables (Breiman, 2001; Svetnik et al., 2003; Prasad et al., 2006). The RF model is particularly well suited for modeling environmental co–variables which are often correlated (Breiman, 2001; Svetnik et al., 2003; Prasad et al., 2006). The algorithm of RF starts with the selection of bootstrapped samples from the original data. There are approximately 63 % of the data in each bootstrap sample. Each decision tree grows with one bootstrap sample and a randomly selected subset of variables. Observations outside the bootstrap sample, called 'out–of–bag' observations, are used as testing data to examine the prediction error. One of the advantages of the RF model is that it provides variable importance by measuring how much model performance (specifically measured by the Gini index) declines if the variable is randomly permuted. The greater the increase
of prediction error, the greater the variable importance in the model. The final prediction is obtained by aggregating over the ensemble trees (Breiman, 2001; Cutler et al., 2007; Biau, 2012).
For a small number of plots, we did not collect one–year culms or shoots because the two parts were not observed year–round. In order for RF to incorporate vari-ables with missing data, we used multiple imputation by chained equation (MICE) (Buuren and Groothuis–Oud-shoorn, 2011) to create plausible values for the missing data (Van Buuren and Oudshoorn, 1999). Compared with other methods, such as single imputation, MICE allows for the imputation of multivariate data based on the distribution of observed data, without the need to specify a joint distribution of predictor variables (White et al., 2011). It can also handle different variable types since each variable is imputed using its own imputation model, with good quality prediction and less biased estimates (Ambler et al., 2007). Normally, for a given missing data point, a multiple imputation method gener-ates 3–5 imputations and missing values are replaced by the average of the multiple imputed values (Hui et al., 2004). In our research, we generated the imputed values using the MICE package in R software.
To take into account the varying availability of bamboo shoots over different seasons, we used the realized nutrient concentration of each plant part, that is, the product of measured or imputed nutrient values and availability of the specific part over the season for the predictive variables in the RF model. For species in which bamboo shoots are only available for a short period (spring for wooden bamboo and summer for arrow and dragon–head bamboo), we set the availa-bility as 1 for the seasons when shoots were present and 0 for the other seasons. For the other species, the availability of leaves, branches, culm and one–year culm were set to 1 for all seasons. We next compared the mean difference of each mineral value between giant panda presence and absence for each predictor using the Wilcoxon rank sum test (significance level at α = 0.05). Finally, we built RF models for spring (SPR), summer (SUM), and autumn (AUT) to classify the presence and absence of giant pandas based on the nutrient concentrations determined for each element. To determine how the predictors associated with a suitable habitat for giant pandas in all three seasons, we built a combined model (COM), including all mineral data.
Results
Correlation of seven mineral elements
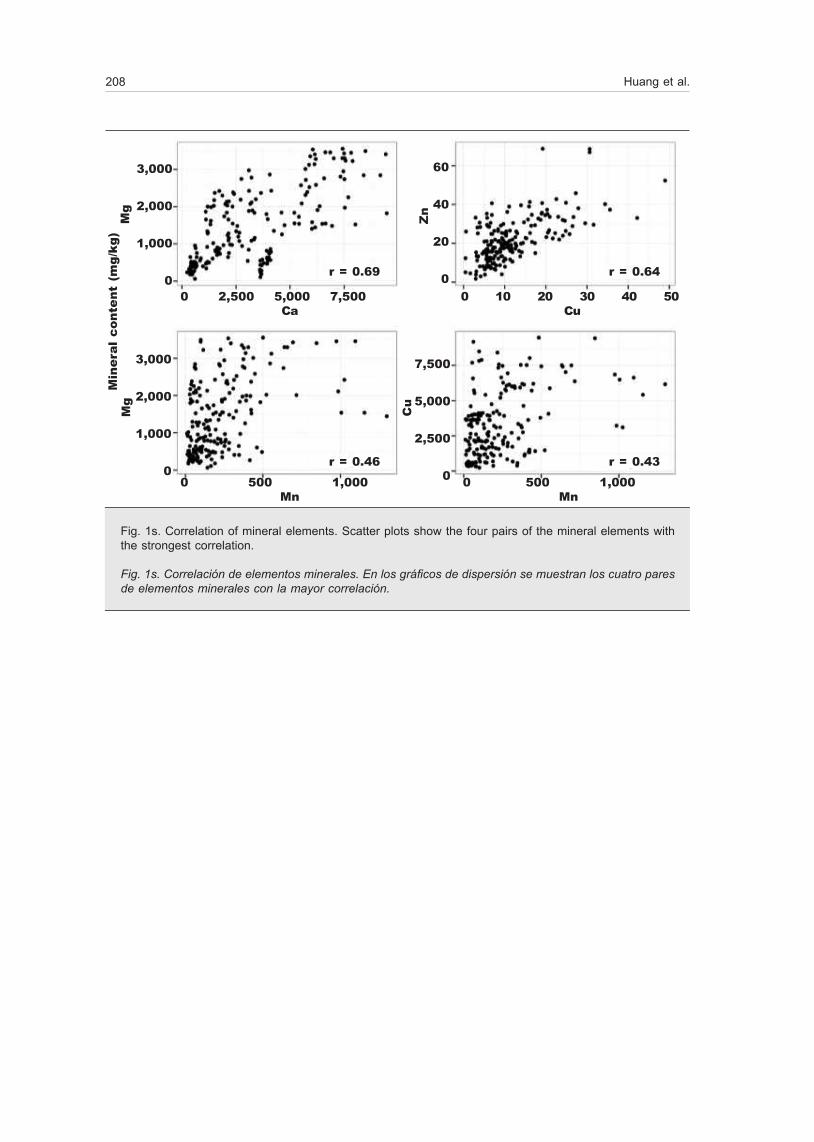
Most elements had a correlation value under 0.4 (ta-ble 1). Ca and Mg showed the strongest correlation (r = 0.69), followed by Cu:Zn (r = 0.64), Mn:Mg (r = 0.46), and Mn:Ca (r = 0.43) (fig. 1s) and lowest correlation was between Cu and Mg (r = 0.02).
Mean mineral difference test
We tested the mean difference between different le-vels for each factor (season, elevation, plant part, and
Animal Biodiversity and Conservation 41.2 (2018) 199
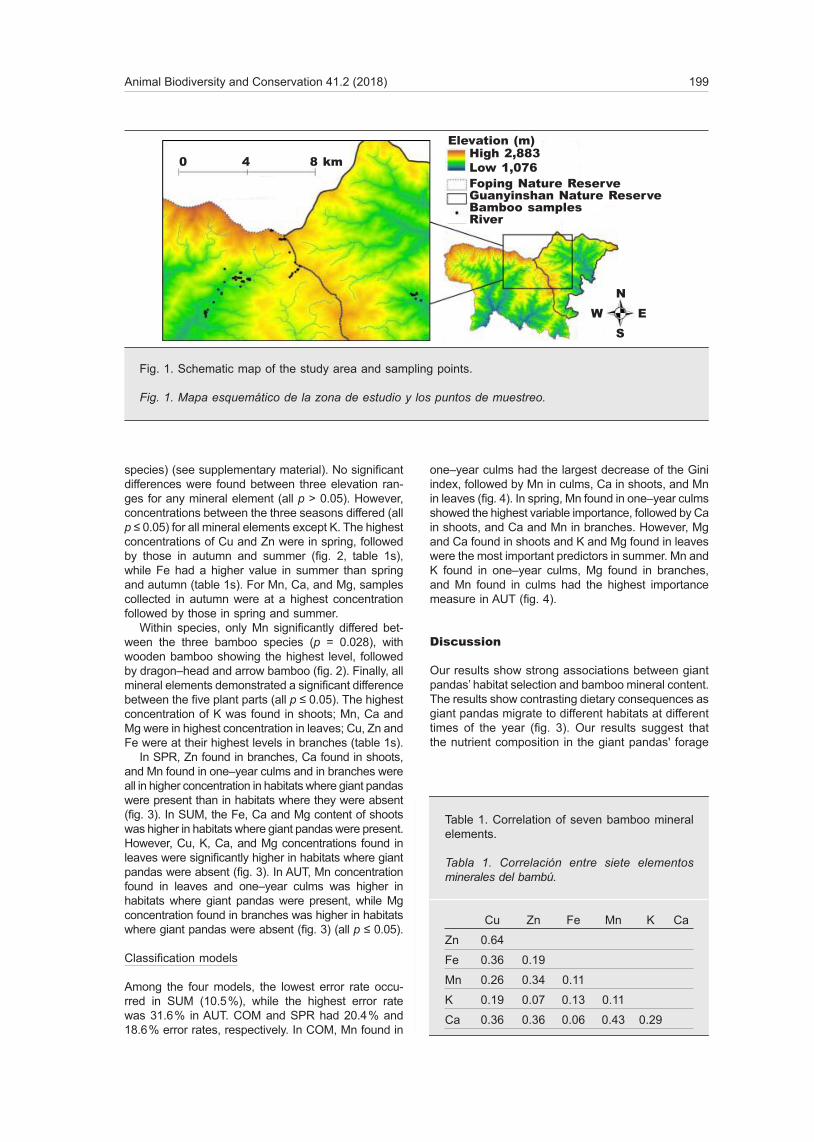
species) (see supplementary material). No significant differences were found between three elevation ran-ges for any mineral element (all p ˃ 0.05). However, concentrations between the three seasons differed (all p ≤ 0.05) for all mineral elements except K. The highest concentrations of Cu and Zn were in spring, followed by those in autumn and summer (fig. 2, table 1s), while Fe had a higher value in summer than spring and autumn (table 1s). For Mn, Ca, and Mg, samples collected in autumn were at a highest concentration followed by those in spring and summer.
Within species, only Mn significantly differed bet-ween the three bamboo species (p = 0.028), with wooden bamboo showing the highest level, followed by dragon–head and arrow bamboo (fig. 2). Finally, all mineral elements demonstrated a significant difference between the five plant parts (all p ≤ 0.05). The highest concentration of K was found in shoots; Mn, Ca and Mg were in highest concentration in leaves; Cu, Zn and Fe were at their highest levels in branches (table 1s).
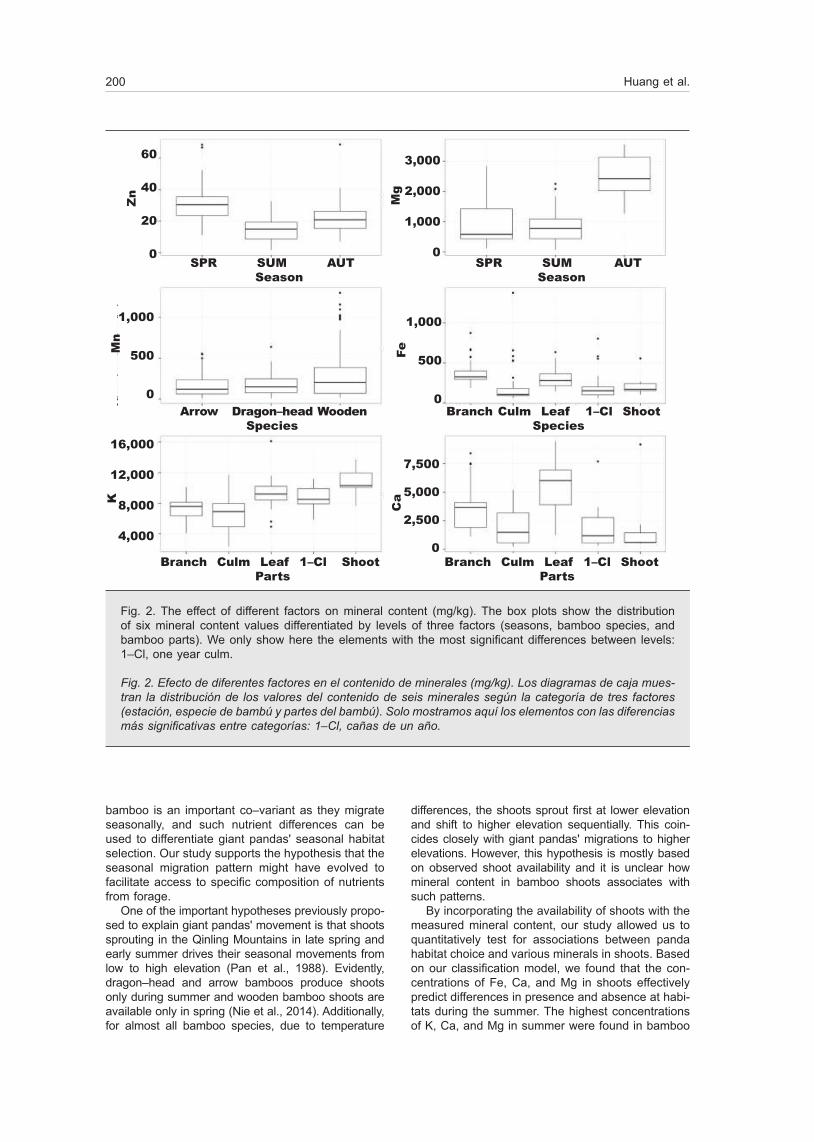
In SPR, Zn found in branches, Ca found in shoots, and Mn found in one–year culms and in branches were all in higher concentration in habitats where giant pandas were present than in habitats where they were absent (fig. 3). In SUM, the Fe, Ca and Mg content of shoots was higher in habitats where giant pandas were present. However, Cu, K, Ca, and Mg concentrations found in leaves were significantly higher in habitats where giant pandas were absent (fig. 3). In AUT, Mn concentration found in leaves and one–year culms was higher in habitats where giant pandas were present, while Mg concentration found in branches was higher in habitats where giant pandas were absent (fig. 3) (all p ≤ 0.05).
Classification models
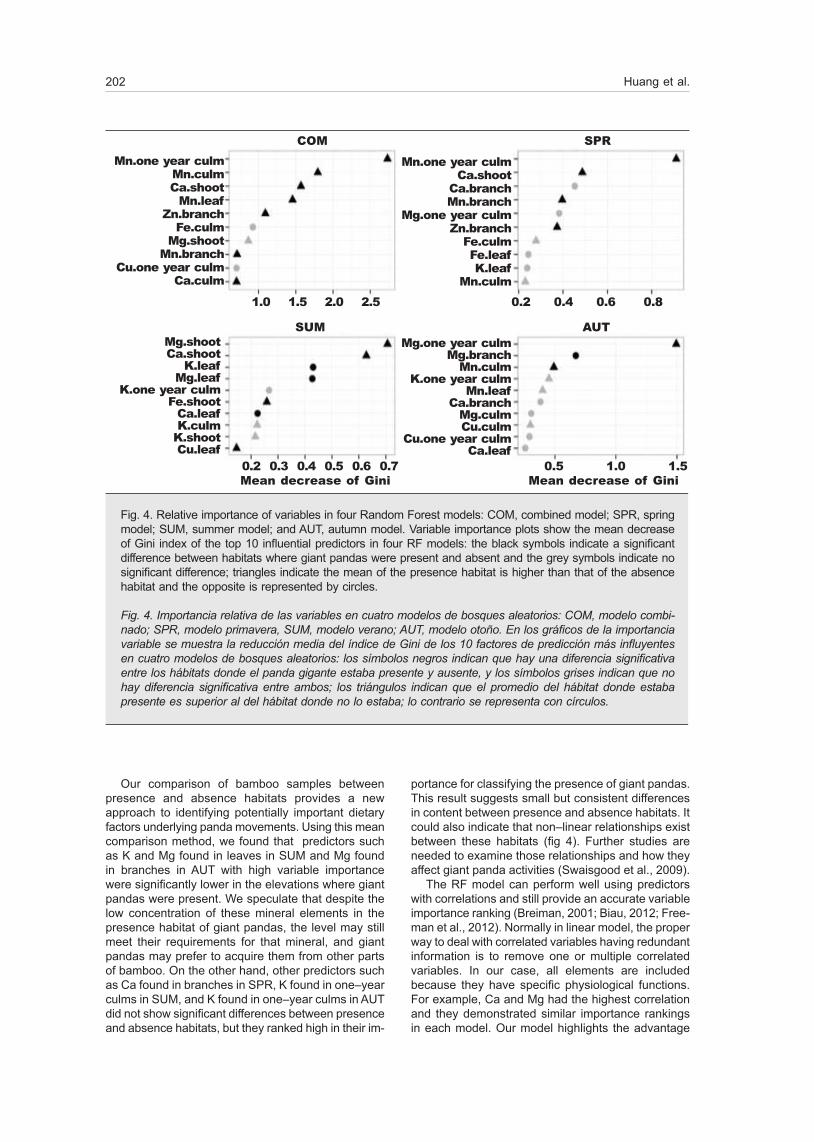
Among the four models, the lowest error rate occu-rred in SUM (10.5 %), while the highest error rate was 31.6 % in AUT. COM and SPR had 20.4 % and 18.6 % error rates, respectively. In COM, Mn found in
one–year culms had the largest decrease of the Gini index, followed by Mn in culms, Ca in shoots, and Mn in leaves (fig. 4). In spring, Mn found in one–year culms showed the highest variable importance, followed by Ca in shoots, and Ca and Mn in branches. However, Mg and Ca found in shoots and K and Mg found in leaves were the most important predictors in summer. Mn and K found in one–year culms, Mg found in branches, and Mn found in culms had the highest importance measure in AUT (fig. 4).
Discussion
Our results show strong associations between giant pandas’ habitat selection and bamboo mineral content. The results show contrasting dietary consequences as giant pandas migrate to different habitats at different times of the year (fig. 3). Our results suggest that the nutrient composition in the giant pandas' forage
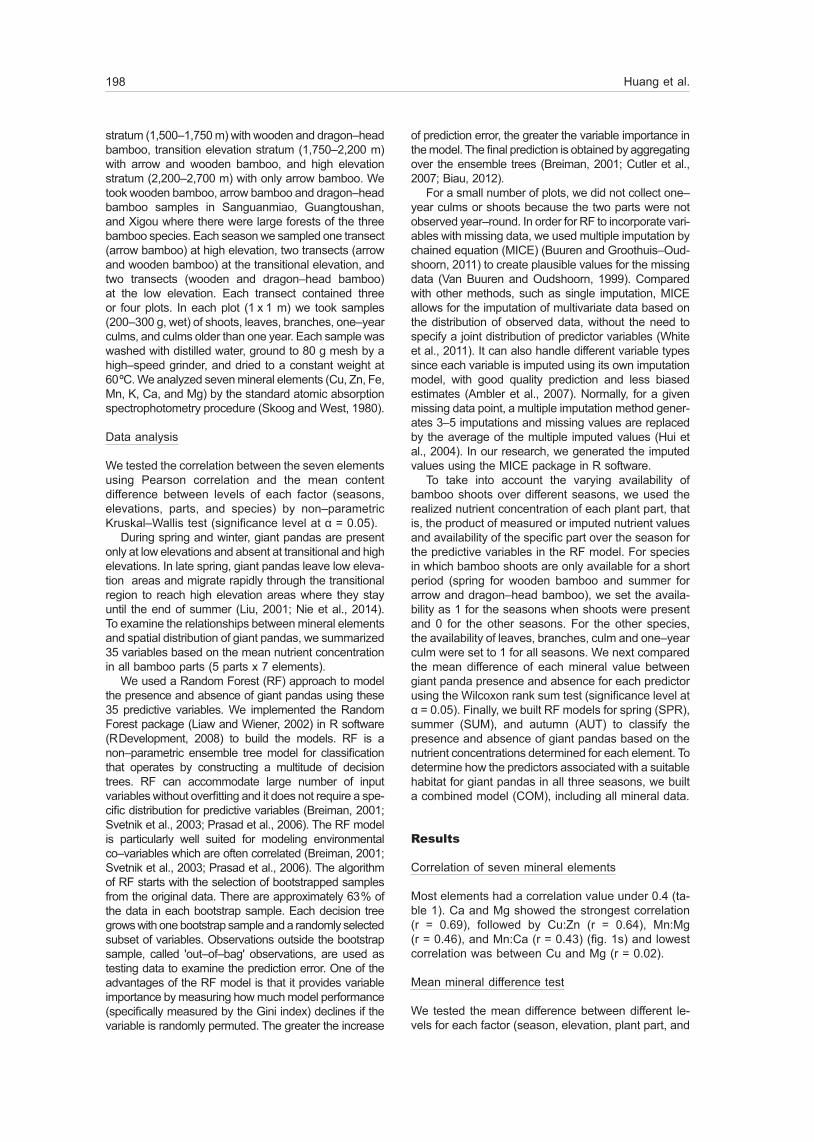
Fig. 1. Schematic map of the study area and sampling points.
Fig. 1. Mapa esquemático de la zona de estudio y los puntos de muestreo.
Table 1. Correlation of seven bamboo mineral elements.
Tabla 1. Correlación entre siete elementos minerales del bambú.
Cu Zn Fe Mn K Ca
Zn 0.64
Fe 0.36 0.19
Mn 0.26 0.34 0.11
K 0.19 0.07 0.13 0.11
Ca 0.36 0.36 0.06 0.43 0.29
0 4 8 kmHigh 2,883Low 1,076Foping Nature ReserveGuanyinshan Nature ReserveBamboo samplesRiver
Elevation (m)
NW E S
200 Huang et al.
bamboo is an important co–variant as they migrate seasonally, and such nutrient differences can be used to differentiate giant pandas' seasonal habitat selection. Our study supports the hypothesis that the seasonal migration pattern might have evolved to facilitate access to specific composition of nutrients from forage.
One of the important hypotheses previously propo-sed to explain giant pandas' movement is that shoots sprouting in the Qinling Mountains in late spring and early summer drives their seasonal movements from low to high elevation (Pan et al., 1988). Evidently, dragon–head and arrow bamboos produce shoots only during summer and wooden bamboo shoots are available only in spring (Nie et al., 2014). Additionally, for almost all bamboo species, due to temperature
differences, the shoots sprout first at lower elevation and shift to higher elevation sequentially. This coin-cides closely with giant pandas' migrations to higher elevations. However, this hypothesis is mostly based on observed shoot availability and it is unclear how mineral content in bamboo shoots associates with such patterns.
By incorporating the availability of shoots with the measured mineral content, our study allowed us to quantitatively test for associations between panda habitat choice and various minerals in shoots. Based on our classification model, we found that the con-centrations of Fe, Ca, and Mg in shoots effectively predict differences in presence and absence at habi-tats during the summer. The highest concentrations of K, Ca, and Mg in summer were found in bamboo
Fig. 2. The effect of different factors on mineral content (mg/kg). The box plots show the distribution of six mineral content values differentiated by levels of three factors (seasons, bamboo species, and bamboo parts). We only show here the elements with the most significant differences between levels: 1–Cl, one year culm.
Fig. 2. Efecto de diferentes factores en el contenido de minerales (mg/kg). Los diagramas de caja mues-tran la distribución de los valores del contenido de seis minerales según la categoría de tres factores (estación, especie de bambú y partes del bambú). Solo mostramos aquí los elementos con las diferencias más significativas entre categorías: 1–Cl, cañas de un año.
60
40
20
0
3,000
2,000
1,000
0
Mg
1,000
500
0
1,000
500
0
7,500
5,000
2,500
0
16,000
12,000
8,000
4,000
SPR SUM AUT SPR SUM AUT Season Season
Arrow Dragon–head Wooden Branch Culm Leaf 1–Cl Shoot Species Species
Branch Culm Leaf 1–Cl Shoot Branch Culm Leaf 1–Cl Shoot Parts Parts
Zn
Mn
Fe
K Ca
Animal Biodiversity and Conservation 41.2 (2018) 201
leaves in areas where giant pandas were absent (fig. 3). It is possible that shoots are preferred because they have the lowest concentration of fiber and cost less energy to obtain than other parts of the plant.
In our results, Mn was the most influential predic-tor of giant pandas' presence not only in COM but also in SPR and AUT. Lack of Mn can lead to many physiological problems in animals, e.g., decrease of sperm, fecundity decline, premature birth and lactation cessation (Kemmerer et al., 1931; Plumlee et al., 1956; Hurley and Doane, 1989). The physiological function of Mn could contribute to its importance, especially when giant pandas are in estrus in spring and pregnant in summer (Schaller et al., 1989; Zhu et al., 2001). Similarly, Ca is mainly stored in bones, and
lack of Ca could cause arrested development, bone deformities, and miscarriages or stillbirths (Hightshoe et al., 1991; Bhanderi et al., 2014). Animals will also experience face muscle twitching or convulsions if they cannot get enough Mg (Kaneko et al., 2008; Chandra et al., 2013). The physiological function of Ca and Mg might have contributed to the observations that Ca and Mg were more concentrated in the presence areas in summer and they were ranked high in our models. Ultimately, if giant panda migration is evolutionarily driven by nutrient gradients, our models suggest that Ca, Mg, and Mn play an important role in the process. Further research is required to investigate the specific biochemical interactions of the mineral elements in panda physiology.
Fig. 3. The contrast of nutrient concentration (mg/kg) between the seasonal habitat where giant pandas are present and the habitat where they are absent. The concentration of nine nutrients in spring (top row), summer (middle row), and autumn (bottom row) and from different bamboo parts are compared.
Fig. 3. Diferencia de concentración de nutrientes (mg/kg) entre el hábitat estacional en el que el panda gigante está presente y el hábitat en el que está ausente. Se compara la concentración de nueve nutrientes en primavera (fila superior), verano (fila media) y otoño (fila inferior) y en diferentes partes del bambú.
70
60
50
40
30
20
500
400
300
200
100
200
150
100
Absence Presence Absence Presence Absence Presence
Absence Presence Absence Presence Absence Presence
Absence Presence Absence Presence Absence Presence
Zn
in b
ranc
h
Fe i
n cu
lm
Mn
in b
ranc
h
K i
n le
aves
Ca
in l
eave
s
Mg
in l
eave
s
Mg
in l
eave
s
Mg
in o
ne y
ear
culm
Mg
in o
ne y
ear
culm
900
600
300
400
300
200
100
3,000
2,750
2,500
2,000
2,000
1,500
1,000
500
5,000
4,000
3,000
2,000
10,000
8,000
6,000
4,000
202 Huang et al.
Our comparison of bamboo samples between presence and absence habitats provides a new approach to identifying potentially important dietary factors underlying panda movements. Using this mean comparison method, we found that predictors such as K and Mg found in leaves in SUM and Mg found in branches in AUT with high variable importance were significantly lower in the elevations where giant pandas were present. We speculate that despite the low concentration of these mineral elements in the presence habitat of giant pandas, the level may still meet their requirements for that mineral, and giant pandas may prefer to acquire them from other parts of bamboo. On the other hand, other predictors such as Ca found in branches in SPR, K found in one–year culms in SUM, and K found in one–year culms in AUT did not show significant differences between presence and absence habitats, but they ranked high in their im-
portance for classifying the presence of giant pandas. This result suggests small but consistent differences in content between presence and absence habitats. It could also indicate that non–linear relationships exist between these habitats (fig 4). Further studies are needed to examine those relationships and how they affect giant panda activities (Swaisgood et al., 2009).
The RF model can perform well using predictors with correlations and still provide an accurate variable importance ranking (Breiman, 2001; Biau, 2012; Free-man et al., 2012). Normally in linear model, the proper way to deal with correlated variables having redundant information is to remove one or multiple correlated variables. In our case, all elements are included because they have specific physiological functions. For example, Ca and Mg had the highest correlation and they demonstrated similar importance rankings in each model. Our model highlights the advantage
Fig. 4. Relative importance of variables in four Random Forest models: COM, combined model; SPR, spring model; SUM, summer model; and AUT, autumn model. Variable importance plots show the mean decrease of Gini index of the top 10 influential predictors in four RF models: the black symbols indicate a significant difference between habitats where giant pandas were present and absent and the grey symbols indicate no significant difference; triangles indicate the mean of the presence habitat is higher than that of the absence habitat and the opposite is represented by circles.
Fig. 4. Importancia relativa de las variables en cuatro modelos de bosques aleatorios: COM, modelo combi-nado; SPR, modelo primavera, SUM, modelo verano; AUT, modelo otoño. En los gráficos de la importancia variable se muestra la reducción media del índice de Gini de los 10 factores de predicción más influyentes en cuatro modelos de bosques aleatorios: los símbolos negros indican que hay una diferencia significativa entre los hábitats donde el panda gigante estaba presente y ausente, y los símbolos grises indican que no hay diferencia significativa entre ambos; los triángulos indican que el promedio del hábitat donde estaba presente es superior al del hábitat donde no lo estaba; lo contrario se representa con círculos.
Mn.one year culmMn.culmCa.shoot
Mn.leafZn.branch
Fe.culmMg.shoot
Mn.branchCu.one year culm
Ca.culm
Mn.one year culmCa.shoot
Ca.branchMn.branch
Mg.one year culmZn.branch
Fe.culmFe.leafK.leaf
Mn.culm
Mg.shootCa.shoot
K.leafMg.leaf
K.one year culmFe.shoot
Ca.leafK.culm
K.shootCu.leaf
Mg.one year culmMg.branch
Mn.culmK.one year culm
Mn.leafCa.branch
Mg.culmCu.culm
Cu.one year culmCa.leaf
0.2 0.3 0.4 0.5 0.6 0.7 0.5 1.0 1.5 Mean decrease of Gini Mean decrease of Gini
1.0 1.5 2.0 2.5 0.2 0.4 0.6 0.8
COM SPR
SUM AUT
Animal Biodiversity and Conservation 41.2 (2018) 203
of a non–parametric RF model which often deals with a large number of correlated nutrient variables.
It is worth noting that this study examined the total concentration of key nutrients.It does not consider the fiber–bonded mineral element. As giant pandas’ digestive system has lower efficiency absorbing fiber–bonded minerals than non–fiber–bonded mi-nerals (Dierenfeld et al., 1982), the portion of fiber–bonded mineral element in bamboo is an important factor that affect the amount of nutrient utilized by giant panda (according to analysis done on leaves of Phyllostachys aureosulcata, 25 % of the total mineral are fiber bound and not available to giant pandas (unpublished data and personal communication with Dr. Michael Power). However, measurements of total mineral content are a necessary first step to understanding the patterns of giant panda habitat selection with the nutrient landscape. Knowing what minerals are concentrated where within the lands-cape and how the concentration of these elements changes both spatially and temporally improves our understanding of potential drivers of giant panda migration and habitat preferences. This knowledge also provides insights for improving conservation planning and management.
With the increasing giant panda density in FNR there has been an increasing number of observations of giant pandas dispersing from west to east across the reserve boundary into GNR to colonize unoccupied habitat (Hu et al., 2010; Liu et al., 2013). In order to create a suitable environment, local governmental and conservation organizations have been planting bamboo in GNR (World Wide Fund for Nature, 2006). Our results will help to provide guidelines for deter-mining the bamboo species and the locations for the planting practices. According to our results, wooden bamboo is recommended for giant panda habitat restoration in low elevations because of its highest concentration of nutrients. GNR does not have any large distribution of wooden bamboo due to its logging history. We recommend planting wooden bamboo in GNR, especially in low elevational areas, because it should support giant panda dispersal from FNR in the west to GNR in the east. To achieve better results, bamboo should be planted every few years to mini-mize the impact of periodic flowering on the panda population (Kawamura, 1927; Chai et al., 2006). In 2011 and 2013 our team started planting wooden bam-boo in GNR. However, bamboo contains the lowest nutrient levels in summer, and only arrow bamboo is distributed in high elevation. Ensuring adequate arrow bamboo in high elevational areas is critical to giant panda conservation because an abundant food supply can compensate for lower nutrient content. Since the establishment of the reserves, economic activities have been banned within them. However, some wild giant pandas still live in the area outside the protected areas where they have to compete with local people harvesting bamboo shoots. We strongly recommend that future conservation policies are enacted to develop a sustainable bamboo shoot harvesting plan to ensure a sufficient supply of shoots for giant pandas both inside and outside reserves.
Acknowledgements
This research received support from the National Natural Science Foundation 'Influences of Forest Landscape Pattern on Animal Diversity and Behavior Characteristics under Disturbance in the Qinling Mountains' (41271194) and David M. Rubenstein. We are grateful to all those involved in fieldwork, Pengfeng Wu, Xiaodong Jia and Hongxing Li. We also want to thank Dr. Michael Power for giving us valuable feedback on the manuscript, as well as providing data on bamboo fiber content.
References
Ambler, G., Omar, R. Z., Royston, P., 2007. A com-parison of imputation techniques for handling missing predictor values in a risk model with a binary outcome. Statistical Methods in Medical Research, 16(3): 277–298.
Bhanderi, B. M., Garg, M. R., Sherasia, P. L., 2014. Mineral status of feeds, fodder and dairy animals in Jalgaon district of Maharashtra state. Scholars Journal of Agriculture and Veterinary Sciences, 1(4A): 222–226.
Biau, G., 2012. Analysis of a random forests mo-del. The Journal of Machine Learning Research, 98888(1): 1063–1095.
Breiman, L., 2001. Random forests. Machine learning, 45(1): 5–32.
Buuren, S., Groothuis–Oudshoorn, K., 2011. MICE: Multivariate imputation by chained equations in R. Journal of Statistical Software, 45(3): 1–67.
Chai, Z., Qin, Y., Hua, X., Wang, Z., Wang, Q., 2006. Advance of studies on bamboo flowering causes. Journal of Zhejiang Forestry Science and Techno-logy, 26: 53 [In Chinese].
Chandra, A. K., Sengupta, P., Goswami, H., Sarkar, M., 2013. Effects of dietary magnesium on testi-cular histology, steroidogenesis, spermatogenesis and oxidative stress markers in adult rats. Indian Journal of Exprimental Biology, 51: 37–47.
Cutler, D. R., Edwards, T. C., Beard, K. H., Cutler, A., Hess, K. T., Gibson, J., Lawler, J. J., 2007. Ran-dom forest for classification in ecology. Ecology, 88(11): 2783–2792.
Dierenfeld, E. S., Hintz, H. F., Robertson, J. B., 1982. Utilization of bamboo by the giant panda. J. Nutr., 112: 636–641.
Finley, T. G., Sikes, R. S., Parsons, J. L., Rude, B. J., Bissell, H. A., Ouellette, J. R., 2011. Energy digestibility of giant pandas on bamboo–only and on supplemented diets. Zoo Biology, 30(2): 121–133.
Freeman, E. A., Moisen, G. G., Frescino, T. S., 2012. Evaluating effectiveness of down–sampling for stratified designs and unbalanced prevalence in Random Forest models of tree species distributions in Nevada. Ecological Modelling, 233: 1–10.
Fu, Q., Wen, Y., Wang, A., Huang, J., Peng, H., Wang, J., 1990. Study on the trace element content in bamboo in Wolong Natural Reserve. Journal of Bamboo Research, 4: 9.
Hightshoe, R. B., Cochran, R. C., Corah, L. R., Ki-
204 Huang et al.
racofe, G. H., Harmon, D. L., Perry, R. C., 1991. Effects of calcium soaps of fatty acids on postpar-tum reproductive function in beef cows. Journal of Animal Science, 69(10): 4097–4103.
Hu, Y., Zhan, X., Qi, D., Wei, F., 2010. Spatial ge-netic structure and dispersal of giant pandas on a mountain–range scale. Conservation Genetics, 11(6): 2145–2155.
Hui, D., Wan, S., Su, B., Katul, G., Monson, R., Luo, Y., 2004. Gap–filling missing data in eddy cova-riance measurements using multiple imputation (MI) for annual estimations. Agricultural and Forest Meteorology, 121(1–2): 93–111.
Hull, V., Shortridge, A., Liu, B., Bearer, S., Zhou, X., Huang, J., Zhou, S., Zhang, H., Ouyang, Z., Liu, J., 2011. The impact of giant panda foraging on bamboo dynamics in an isolated environment. Plant Ecology, 212(1): 43–54.
Hull, V., Zhang, J., Zhou, S., Huang, J., Viña, A., Liu, W., Tuanmu, M.–N., Li, R., Liu, D., Xu, W., Huang, Y., Ouyang, Z., Zhang, H., Liu, J., 2014. Impact of livestock on giant pandas and their habitat. Journal for Nature Conservation, 22(3): 256–264.
Hunter, I. R., Dierenfeld, E. S., Jinhe, F., 2003. The possible nutritional consequences for giant pan-da of establishing reserve corridors with various bamboo species. Journal of Bamboo and Rattan, 2(2): 167–178.
Hurley, W. L., Doane, R. M., 1989. Recent develop-ments in the roles of vitamins and minerals in repro-duction. Journal of Dairy Science, 72(3): 784–804.
Kaneko, J. J., Harvey, J. W., Bruss, M. L., 2008. Cli-nical biochemistry of domestic animals. Academic press, Orlando, FL, USA.
Kawamura, S., 1927. On the periodical flowering of the bamboo. Japanese Journal of Botany, 3: 335–342.
Kemmerer, A. R., Elvehjem, C. A., Hart, E. B., 1931. Studies on the relation of manganese to the nutri-tion of the mouse. Journal of Biological Chemistry, 92(3): 623–630.
Li, X. B., Shupe, T. F., Peter, G. F., Hse, C. Y., Eberhardt, T. L., others ,2007. Chemical changes with maturation of the bamboo species Phyllostachys pubescens. Journal of Tropical Forest Science, 19(1): 6.
Li, Z., Manfred, D., 2001. An approach on the survi-vorship of giant panda in wild. Journal of Forestry Research, 12(1): 59–62.
Liaw, A., Wiener, M., 2002. Classification and Re-gression by randomForest. R news, 2(3): 18–22.
Liu, B., 2008. Studies on staple food bamboo and its characteristics of giant panda in the Qinling Mou-ntains. Master's thesis, Northwest A&F University.
Liu, J., Li, S., Ouyang, Z., Tam, C., Chen, X., 2008. Ecological and socioeconomic effects of China’s policies for ecosystem services. Proceedings of the National Academy of Sciences, 105(28): 9477–9482.
Liu, J., Ouyang, Z., Taylor, W. W., Groop, R., Tan, Y., Zhang, H., 1999. A framework for evaluating the effects of human factors on wildlife habitat: the case of giant pandas. Conservation Biology, 13(6): 1360–1370.
Liu, X., 2001. Mapping and modelling the habitat of giant pandas in Foping Nature Reserve, China (ITC
dissertation num 84). PhD Thesis, Wageningen University, The Netherlands.
Liu, X., Skidmore, A. K., Wang, T., Yong, Y., Prins, H. H. T., 2002. Giant Panda Movements in Foping Nature Reserve, China. The Journal of Wildlife Management, 66(4): 1179–1188.
Liu, X., Toxopeus, A. G., Skidmore, A. K., Shao, X., Dang, G., Wang, T., Prins, H. H., 2005. Giant panda habitat selection in foping nature reserve, China. Journal of Wildlife Management, 69(4): 1623–1632.
Liu, X., Wu, P., Songer, M., Cai, Q., He, X., Zhu, Y., Shao, X., 2013. Monitoring wildlife abundance and diversity with infra–red camera traps in Guanyins-han Nature Reserve of Shaanxi Province, China. Ecological Indicators (Biodiversity Monitoring), 33: 121–128.
Lu, X., Jiang, Z., Li, C., 2007. Comparative habitat use by giant panda, Ailuropoda melanoleuca in selectively logged forests and timber plantations. Folia Zoologica–Praha, 56: 137.
Mainka, S. A., Guanlu, Z., Mao, L., 1989. Utilization of a bamboo, sugar cane, and gruel diet by two juvenile giant pandas (Ailuropoda melanoleuca). Journal of Zoo and Wildlife Medicine, 20: 39–44.
Milton, K., 1979. Factors Influencing Leaf Choice by Howler Monkeys: A Test of Some Hypotheses of Food Selection by Generalist Herbivores. The American Naturalist, 114(3): 362–378.
Nie, Y., Zhang, Z., Raubenheimer, D., Elser, J. J., Wei, W., Wei, F., 2014. Obligate herbivory in an ancestrally carnivorous lineage: the giant panda and bamboo from the perspective of nutritional geometry. Functional Ecology, 29.1: 26–34.
Pan, W., Gao, Z., Lu, Z., Xia, Z., Zhang, M., Ma, L., Meng, G., Zhe, X., Liu, X., Cui, H. and others, 1988. The giant panda’s natural refuge in the Qinling Mountains. Beijing University Press, Beijing, China.
Plumlee, M. P., Thrasher, D. M., Beeson, W. M., Andrews, F. N., Parker, H. E., 1956. The effects of a manganese deficiency upon the growth, de-velopment, and reproduction of swine. Journal of Animal Science, 15(2): 352–367.
Prasad, A. M., Iverson, L. R., Liaw, A., 2006. Newer classification and regression tree techniques: bag-ging and random forests for ecological prediction. Ecosystems, 9(2): 181–199.
Qi, D., Zhang, S., Zhang, Z., Hu, Y., Yang, X., Wang, H., Wei, F., 2011. Different habitat preferences of male and female giant pandas. Journal of Zoology, 285: 205–214.
– 2012. Measures of giant panda habitat selection across multiple spatial scales for species conser-vation. The Journal of Wildlife Management, 76: 1092–1100.
R Development, C., 2008. TEAM: R: a language and environment for statistical computing. R Foundation for Statistical Computing, Austria.
Reid, D. G., Hu, J., 1991. Giant panda selection between Bashania fangiana bamboo habitats in Wolong Reserve, Sichuan, China. Journal of Applied Ecology, 28(1): 228–243.
Reid, D. G., Jinchu, H., Sai, D., Wei, W., Yan, H., 1989. Giant panda (Ailuropoda melanoleuca) behaviour
Animal Biodiversity and Conservation 41.2 (2018) 205
and carrying capacity following a bamboo die–off. Biological Conservation, 49(2): 85–104.
Schaller, G. B., Qitao, T., Johnson, K. G., Xiaoming, W., Heming, S., Jinchu, H., 1989. The feeding ecology of giant pandas and Asiatic black bears in the Tangjiahe Reserve, China. In: Carnivore Behavior, Ecology, and Evolution: 212–241 (J. L. Gittleman, Ed.). Springer, US.
Sheldon, W. G., 1937. Notes on the giant panda. Journal of Mammalogy, 18(1): 13–19.
Sims, J. A., Parsons, J. L., Bissell, H. A., Sikes, R. S., Ouellette, J. R., Rude, B. J., 2007. Determination of bamboo–diet digestibility and fecal output by giant pandas. Ursus, 18(1): 38–45.
Skoog, D. A., West, D. M., 1980. Principles of instru-mental analysis. Saunders College, Philadelphia.
Songer, M., Delion, M., Biggs, A., Huang, Q., 2012. Modeling impacts of climate change on giant panda Habitat. International Journal of Ecology, doi: http://dx.doi.org/10.1155/2012/108752
State Forestry Administration of the People's Republic of China, 2006. Report of the third national survey report on giant panda census in China. Science Publishing House, Beijing, China.
Sun, Y., Zhang, Z., Li, L., Liu, X., Wei, F., Ma, Y., Wei, wei, Liao, F., He, S., 2010. Trace elements and nutrients of Bashania fargesii in the Qinling Mou-ntains. Acta Theriologica Sinica, 30(2): 223–228.
Svetnik, V., Liaw, A., Tong, C., Culberson, J. C., She-ridan, R. P., Feuston, B. P., 2003. Random forest: a classification and regression tool for compound classification and QSAR modeling. Journal of Chemical Information and Computer Sciences, 43(6): 1947–1958.
Swaisgood, R. R., Wei, F., Wildt, D. E., Kouba, A. J., Zhang, Z., 2009. Giant panda conservation science: how far we have come. Biology Letters, 6: 143–145.
Taylor, A. H., Qin, Z., 1993. Bamboo regeneration after flowering in the Wolong giant panda reserve, China. Biological Conservation, 63(3): 231–234.
Taylor, A. H., Reid, D. G., Zisheng, Q., Jin Chu, H., 1991. Bamboo dieback: an opportunity to resto-re panda habitat. Environmental Conservation, 18(02): 166–168.
Tuanmu, M.–N., Viña, A., Winkler, J. A., Li, Y., Xu, W., Ouyang, Z., Liu, J., 2012. Climate–change impacts on understorey bamboo species and giant pandas in China’s Qinling Mountains. Nature Climate Change, 3(3): 249–253.
Van Buuren, S., Oudshoorn, K., 1999. Flexible multi-variate imputation by MICE. The Netherlands: TNO Prevention Center, Leiden.
Viña, A., Tuanmu, M.–N., Xu, W., Li, Y., Ouyang, Z., DeFries, R., Liu, J., 2010. Range–wide analysis of wildlife habitat: Implications for conservation. Biological Conservation, 143(9): 1960–1969.
Wang, T., Skidmore, A. K., Zeng, Z., Beck, P. S., Si, Y., Song, Y., Liu, X., Prins, H. H., 2010. Migration patterns of two endangered sympatric species from a remote sensing perspective. Photogrammetric Engineering, Remote Sensing, 76(12): 1343–1352.
Wang, X., Xu, W., Ouyang, Z., 2009. Integrating population size analysis into habitat suitability assessment: implications for giant panda conser-vation in the Minshan Mountains, China. Ecological Research, 24(5): 1101–1109.
Wang, Y., Dong, W., Liu, X., others, 2013. An analysis of nutrient components of Bashania fargesii lea-ves and shoots: a staple food bamboo for giant pandas. China Forestry Science and Technology, 26(6): 47–50.
White, I. R., Royston, P., Wood, A. M., 2011. Mul-tiple imputation using chained equations: Issues and guidance for practice. Statistics in Medicine, 30(4): 377–399.
World Wide Fund for Nature, 2006. Reuniting panda populations in China. http://wwf.panda.org/?69180/Reuniting-panda-populations-in-China [Accessed on October 10th, 2017].
Wu, F., Yang, W., Wang, K., Wu, N., Lu, Y., 2009. Effect of stem density on leaf nutrient dynamics and nu-trient use efficiency of dwarf bamboo. Pedosphere, 19(4): 496–504.
Zhang, Z., Sheppard, J. K., Swaisgood, R. R., Wang, G., Nie, Y., Wei, W., Zhao, N., Wei, F., 2014. Ecological scale and seasonal heterogeneity in the spatial behaviors of giant pandas. Integrative Zoology, 9(1): 46–60.
Zhang, Z., Wei, F., Li, M., Hu, J., 2006. Winter micro-habitat separation between giant and red pandas in Bashania faberi bamboo forest in Fengtongzhai Nature Reserve. Journal of Wildlife Management, 70(1): 231–235.
Zhu, X., Lindburg, D. G., Pan, W., Forney, K. A., Wang, D., 2001. The reproductive strategy of giant pandas (Ailuropoda melanoleuca): infant growth and development and mother–infant relationships. Journal of Zoology, 253(2): 141–155.
206 Huang et al.
Supplementary material
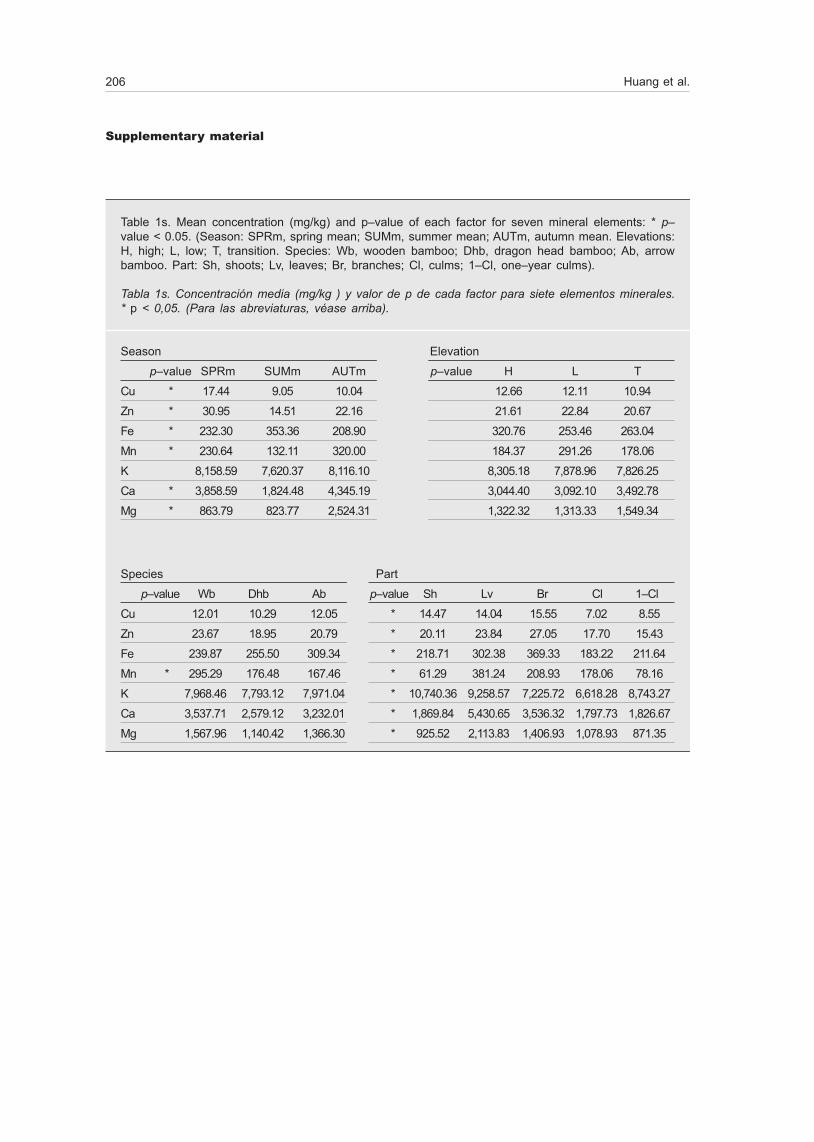
Table 1s. Mean concentration (mg/kg) and p–value of each factor for seven mineral elements: * p–value < 0.05. (Season: SPRm, spring mean; SUMm, summer mean; AUTm, autumn mean. Elevations: H, high; L, low; T, transition. Species: Wb, wooden bamboo; Dhb, dragon head bamboo; Ab, arrow bamboo. Part: Sh, shoots; Lv, leaves; Br, branches; Cl, culms; 1–Cl, one–year culms).
Tabla 1s. Concentración media (mg/kg ) y valor de p de cada factor para siete elementos minerales. * p < 0,05. (Para las abreviaturas, véase arriba).
Season Elevation
p–value SPRm SUMm AUTm p–value H L T
Cu * 17.44 9.05 10.04 12.66 12.11 10.94
Zn * 30.95 14.51 22.16 21.61 22.84 20.67
Fe * 232.30 353.36 208.90 320.76 253.46 263.04
Mn * 230.64 132.11 320.00 184.37 291.26 178.06
K 8,158.59 7,620.37 8,116.10 8,305.18 7,878.96 7,826.25
Ca * 3,858.59 1,824.48 4,345.19 3,044.40 3,092.10 3,492.78
Mg * 863.79 823.77 2,524.31 1,322.32 1,313.33 1,549.34
Species Part
p–value Wb Dhb Ab p–value Sh Lv Br Cl 1–Cl
Cu 12.01 10.29 12.05 * 14.47 14.04 15.55 7.02 8.55
Zn 23.67 18.95 20.79 * 20.11 23.84 27.05 17.70 15.43
Fe 239.87 255.50 309.34 * 218.71 302.38 369.33 183.22 211.64
Mn * 295.29 176.48 167.46 * 61.29 381.24 208.93 178.06 78.16
K 7,968.46 7,793.12 7,971.04 * 10,740.36 9,258.57 7,225.72 6,618.28 8,743.27
Ca 3,537.71 2,579.12 3,232.01 * 1,869.84 5,430.65 3,536.32 1,797.73 1,826.67
Mg 1,567.96 1,140.42 1,366.30 * 925.52 2,113.83 1,406.93 1,078.93 871.35
Animal Biodiversity and Conservation 41.2 (2018) 207
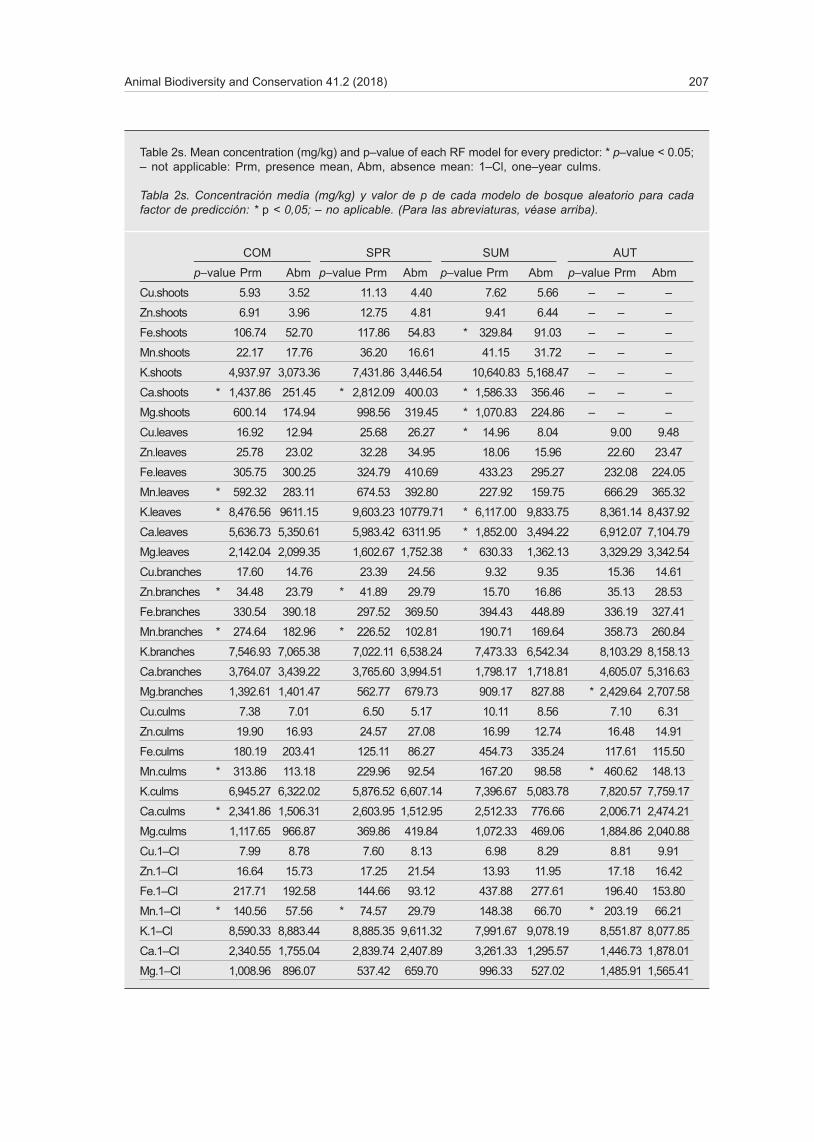
Table 2s. Mean concentration (mg/kg) and p–value of each RF model for every predictor: * p–value < 0.05; – not applicable: Prm, presence mean, Abm, absence mean: 1–Cl, one–year culms.
Tabla 2s. Concentración media (mg/kg) y valor de p de cada modelo de bosque aleatorio para cada factor de predicción: * p < 0,05; – no aplicable. (Para las abreviaturas, véase arriba).
COM SPR SUM AUT
p–value Prm Abm p–value Prm Abm p–value Prm Abm p–value Prm Abm
Cu.shoots 5.93 3.52 11.13 4.40 7.62 5.66 – – –
Zn.shoots 6.91 3.96 12.75 4.81 9.41 6.44 – – –
Fe.shoots 106.74 52.70 117.86 54.83 * 329.84 91.03 – – –
Mn.shoots 22.17 17.76 36.20 16.61 41.15 31.72 – – –
K.shoots 4,937.97 3,073.36 7,431.86 3,446.54 10,640.83 5,168.47 – – –
Ca.shoots * 1,437.86 251.45 * 2,812.09 400.03 * 1,586.33 356.46 – – –
Mg.shoots 600.14 174.94 998.56 319.45 * 1,070.83 224.86 – – –
Cu.leaves 16.92 12.94 25.68 26.27 * 14.96 8.04 9.00 9.48
Zn.leaves 25.78 23.02 32.28 34.95 18.06 15.96 22.60 23.47
Fe.leaves 305.75 300.25 324.79 410.69 433.23 295.27 232.08 224.05
Mn.leaves * 592.32 283.11 674.53 392.80 227.92 159.75 666.29 365.32
K.leaves * 8,476.56 9611.15 9,603.23 10779.71 * 6,117.00 9,833.75 8,361.14 8,437.92
Ca.leaves 5,636.73 5,350.61 5,983.42 6311.95 * 1,852.00 3,494.22 6,912.07 7,104.79
Mg.leaves 2,142.04 2,099.35 1,602.67 1,752.38 * 630.33 1,362.13 3,329.29 3,342.54
Cu.branches 17.60 14.76 23.39 24.56 9.32 9.35 15.36 14.61
Zn.branches * 34.48 23.79 * 41.89 29.79 15.70 16.86 35.13 28.53
Fe.branches 330.54 390.18 297.52 369.50 394.43 448.89 336.19 327.41
Mn.branches * 274.64 182.96 * 226.52 102.81 190.71 169.64 358.73 260.84
K.branches 7,546.93 7,065.38 7,022.11 6,538.24 7,473.33 6,542.34 8,103.29 8,158.13
Ca.branches 3,764.07 3,439.22 3,765.60 3,994.51 1,798.17 1,718.81 4,605.07 5,316.63
Mg.branches 1,392.61 1,401.47 562.77 679.73 909.17 827.88 * 2,429.64 2,707.58
Cu.culms 7.38 7.01 6.50 5.17 10.11 8.56 7.10 6.31
Zn.culms 19.90 16.93 24.57 27.08 16.99 12.74 16.48 14.91
Fe.culms 180.19 203.41 125.11 86.27 454.73 335.24 117.61 115.50
Mn.culms * 313.86 113.18 229.96 92.54 167.20 98.58 * 460.62 148.13
K.culms 6,945.27 6,322.02 5,876.52 6,607.14 7,396.67 5,083.78 7,820.57 7,759.17
Ca.culms * 2,341.86 1,506.31 2,603.95 1,512.95 2,512.33 776.66 2,006.71 2,474.21
Mg.culms 1,117.65 966.87 369.86 419.84 1,072.33 469.06 1,884.86 2,040.88
Cu.1–Cl 7.99 8.78 7.60 8.13 6.98 8.29 8.81 9.91
Zn.1–Cl 16.64 15.73 17.25 21.54 13.93 11.95 17.18 16.42
Fe.1–Cl 217.71 192.58 144.66 93.12 437.88 277.61 196.40 153.80
Mn.1–Cl * 140.56 57.56 * 74.57 29.79 148.38 66.70 * 203.19 66.21
K.1–Cl 8,590.33 8,883.44 8,885.35 9,611.32 7,991.67 9,078.19 8,551.87 8,077.85
Ca.1–Cl 2,340.55 1,755.04 2,839.74 2,407.89 3,261.33 1,295.57 1,446.73 1,878.01
Mg.1–Cl 1,008.96 896.07 537.42 659.70 996.33 527.02 1,485.91 1,565.41
208 Huang et al.
Fig. 1s. Correlation of mineral elements. Scatter plots show the four pairs of the mineral elements with the strongest correlation.
Fig. 1s. Correlación de elementos minerales. En los gráficos de dispersión se muestran los cuatro pares de elementos minerales con la mayor correlación.
3,000
2,000
1,000
0
60
40
20
0
3,000
2,000
1,000
0
7,500
5,000
2,500
0
Min
eral
con
tent
(m
g/kg
)M
gM
g
Cu
Zn
0 2,500 5,000 7,500 0 10 20 30 40 50 Ca Cu
0 500 1,000 0 500 1,000 Mn Mn
r = 0.69 r = 0.64
r = 0.46 r = 0.43


