Understanding Numerical Data. Statistics Statistics is a tool used to answer general questions on...
41
Understanding Numerical Data
-
Upload
arline-lyons -
Category
Documents
-
view
234 -
download
2
Transcript of Understanding Numerical Data. Statistics Statistics is a tool used to answer general questions on...
Understanding Numerical Data
Statistics
• Statistics is a tool used to answer general questions on the basis of a limited amount of specific data.
• Statistics allows us to make decisions about a population based on a sample of that population rather than on the entire population.
Why do we need Statistics?
• Let’s say that you want to know the lipid content of a typical corn grain.
• You could analyze one grain, but how would you know that you’d picked a “typical” grain?
• You’d get a better estimate of “typical” if you increased you sample size to a few hundred grain, or even to 10,000. Or to 1,000,000.
• Better yet….The only way to be certain your conclusions would be to measure all of the corn grains in the world.
• Since this is clearly impossible, you must choose grains that represent all of the grains in the world – that is, you must be working with a representative sample.

Statistics Terms
• Mean- The mean is the arithmetic average of a group of measurements.
Scientists often base answers to investigative questions on averages
• Thus in the earlier investigative question about the lipid content of a typical corn grain, if you took a sample of 10,000 corn, measured their lipid content,
• then calculated their average(mean) lipid content, would that average (mean) be an adequate description the lipid content of all corn in the world?
• Why? Or why not?

Other considerations - - -

Assessment Statement
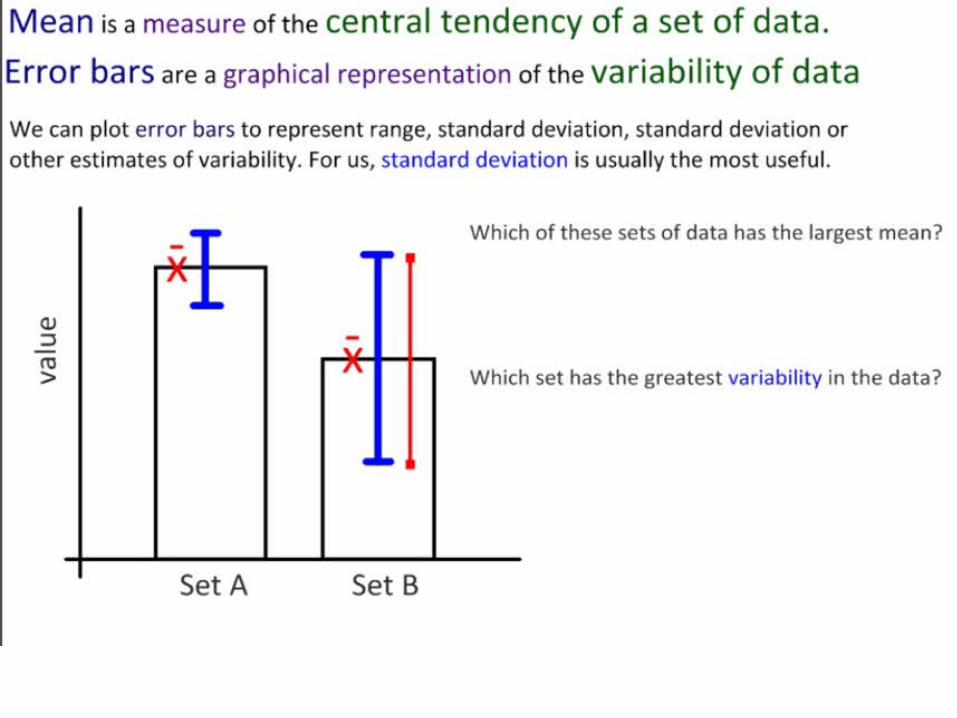
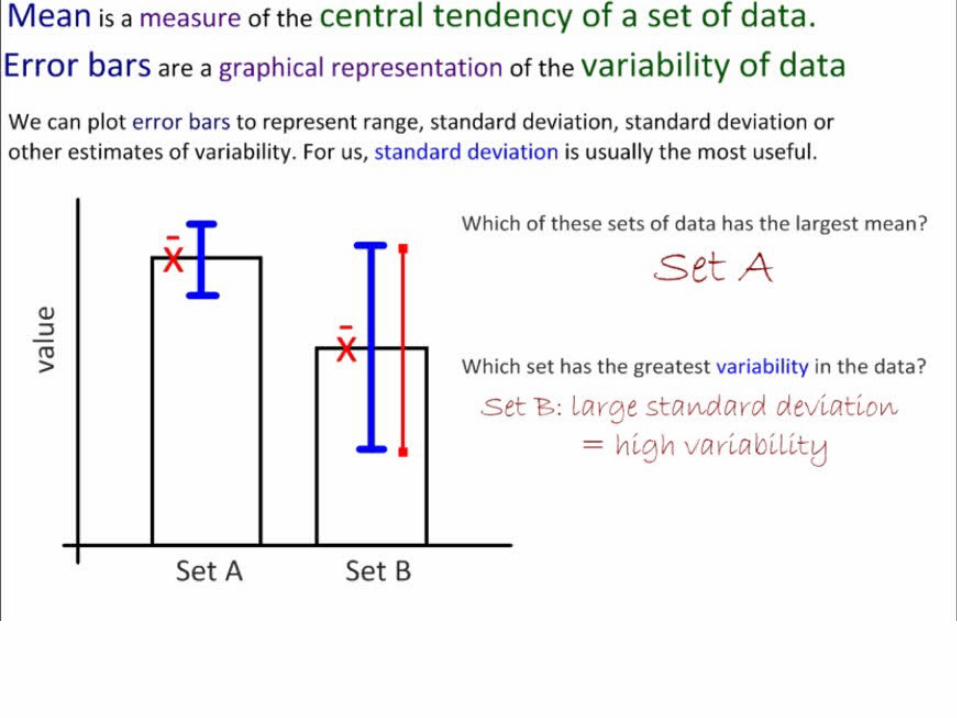
• 1.1.1 State that error bars are a graphical representation of the variability of data.
• 1.1.4 Explain how the standard deviation is useful for comparing the means and the spread of data between two or more samples.

Looking at these data sets what observations can you make?
Boys Scores Girls Scores60 9862 4268 8870 9263 3865 5665 9558 9264 5063 89

Based on data, what do you think is the average boy score and girl’s score
Boys Scores Girls Scores60 9862 4268 8870 9263 3865 5665 9558 9264 5063 89
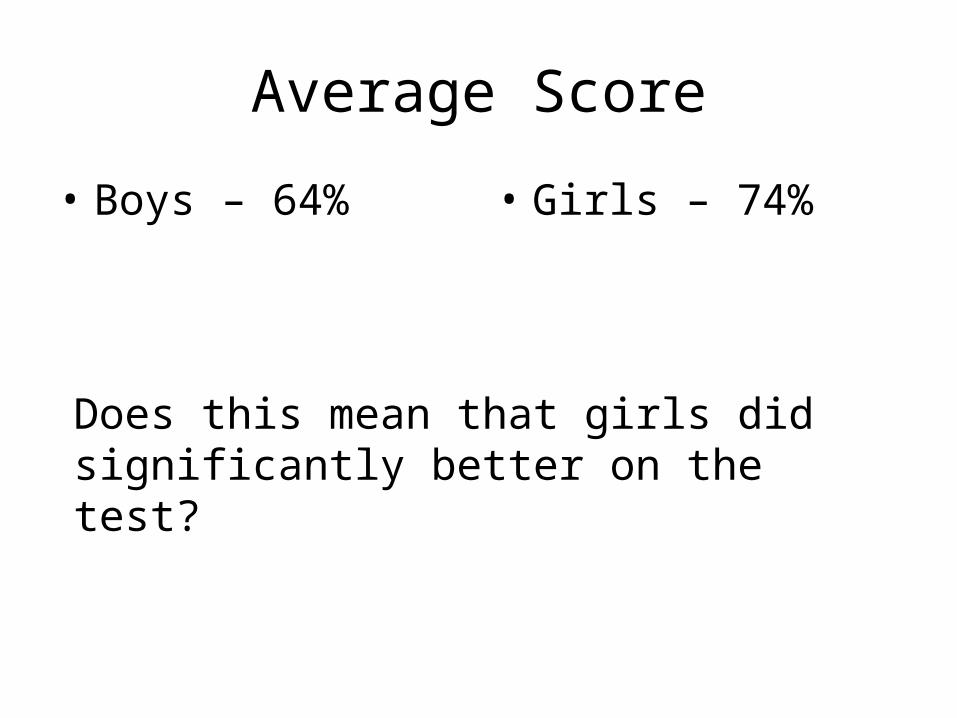
Average Score
• Boys – 64% • Girls – 74%
Does this mean that girls did significantly better on the test?
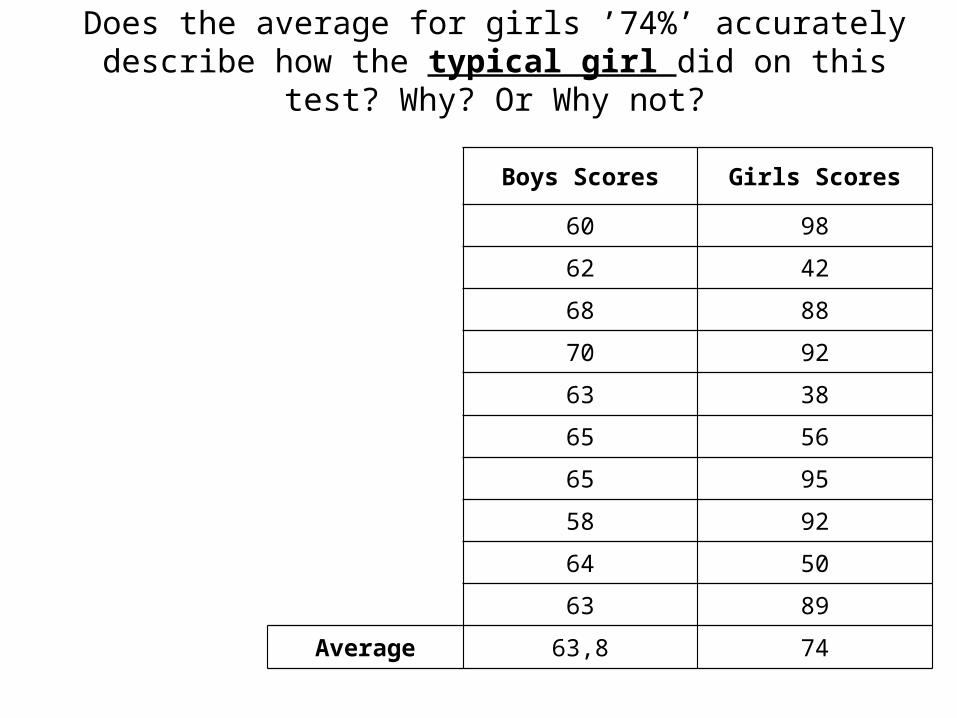
Does the average for girls ’74%’ accurately describe how the typical girl did on this test? Why? Or Why not?
Boys Scores Girls Scores
60 98
62 42
68 88
70 92
63 38
65 56
65 95
58 92
64 50
63 89
Average 63,8 74
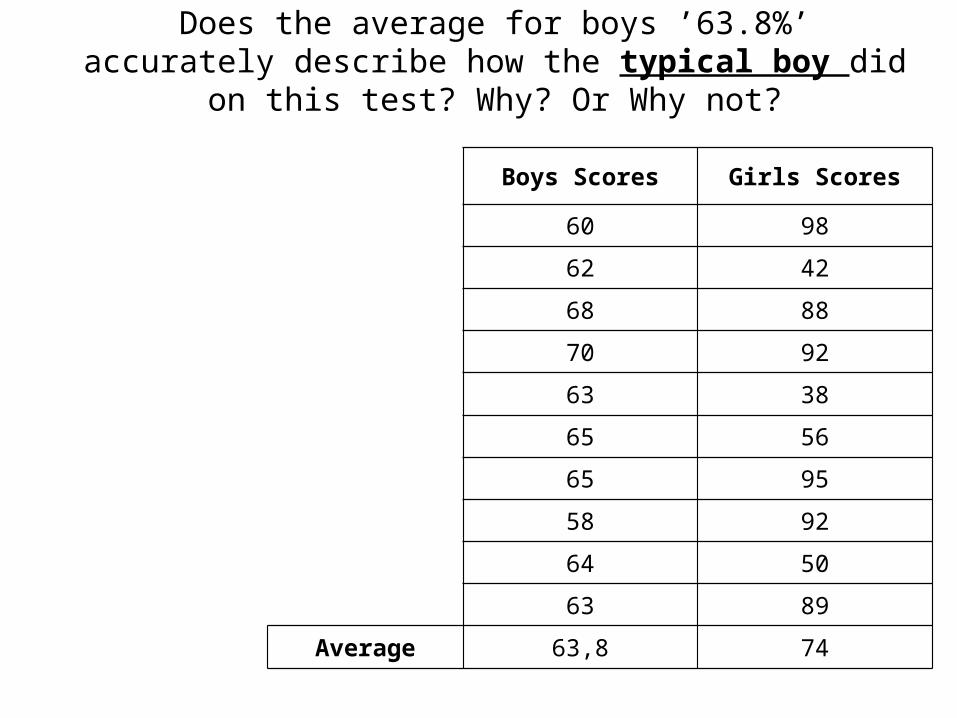
Does the average for boys ’63.8%’ accurately describe how the typical boy did on this test? Why? Or Why not?
Boys Scores Girls Scores
60 98
62 42
68 88
70 92
63 38
65 56
65 95
58 92
64 50
63 89
Average 63,8 74
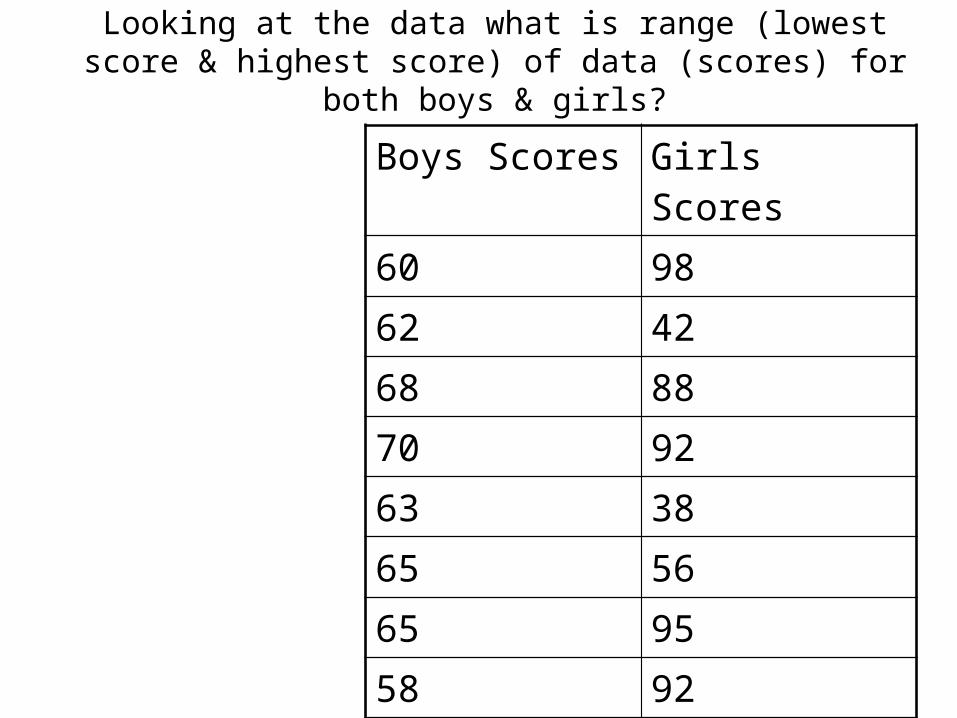
Looking at the data what is range (lowest score & highest score) of data (scores) for both boys & girls?
Boys Scores Girls Scores60 9862 4268 8870 9263 3865 5665 9558 9264 5063 89
Standard Deviation
• Show the average difference each data point has from the mean.
• Shows how big the range of a data set is.
The spread of data
• Averages do not tell us everything about a sample.
• Data can be very uniform meaning all bunched around the mean, or data can be spread out a long way from the mean.
• The statistic that measures this spread is called the standard deviation.
Standard Deviation
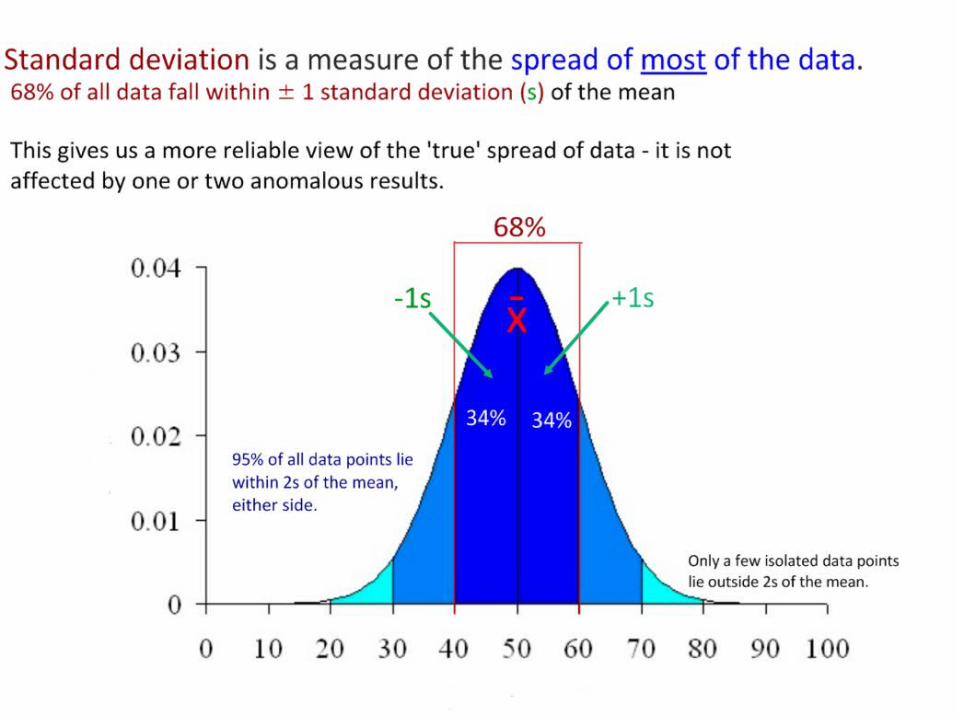
• The standard deviation is a measure of the variation of the data.
• For data that is evenly distributed each side of the mean (a normal distribution) 68% of the data lies within one standard deviation of the mean.
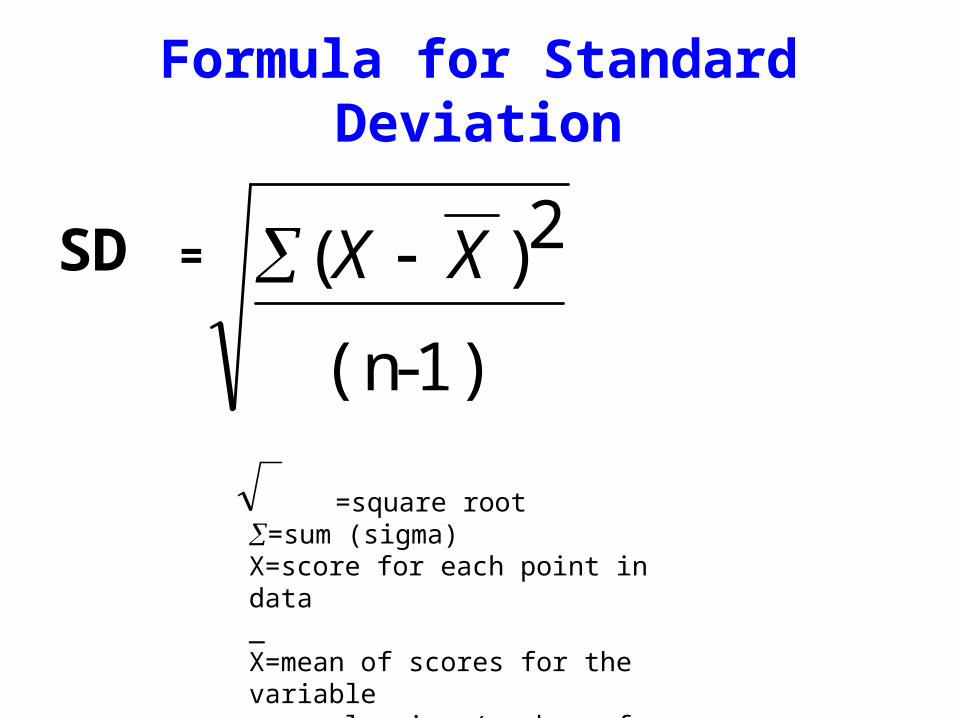
=square root=sum (sigma)X=score for each point in data_X=mean of scores for the variablen=sample size (number of observations or cases
SD =
Formula for Standard Deviation
1)-(n
2)( XX

Standard Deviation
• 68% of data falls within 1 standard deviation
• 95% of data falls within 2 standard deviation.
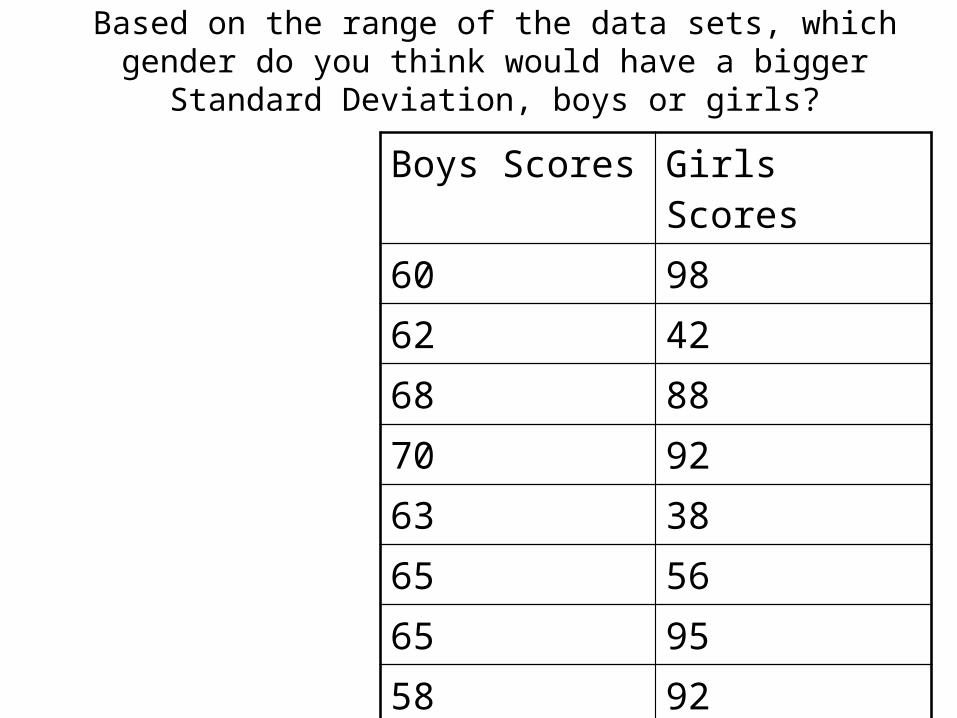
Based on the range of the data sets, which gender do you think would have a bigger Standard Deviation, boys or girls?
Boys Scores Girls Scores60 9862 4268 8870 9263 3865 5665 9558 9264 5063 89
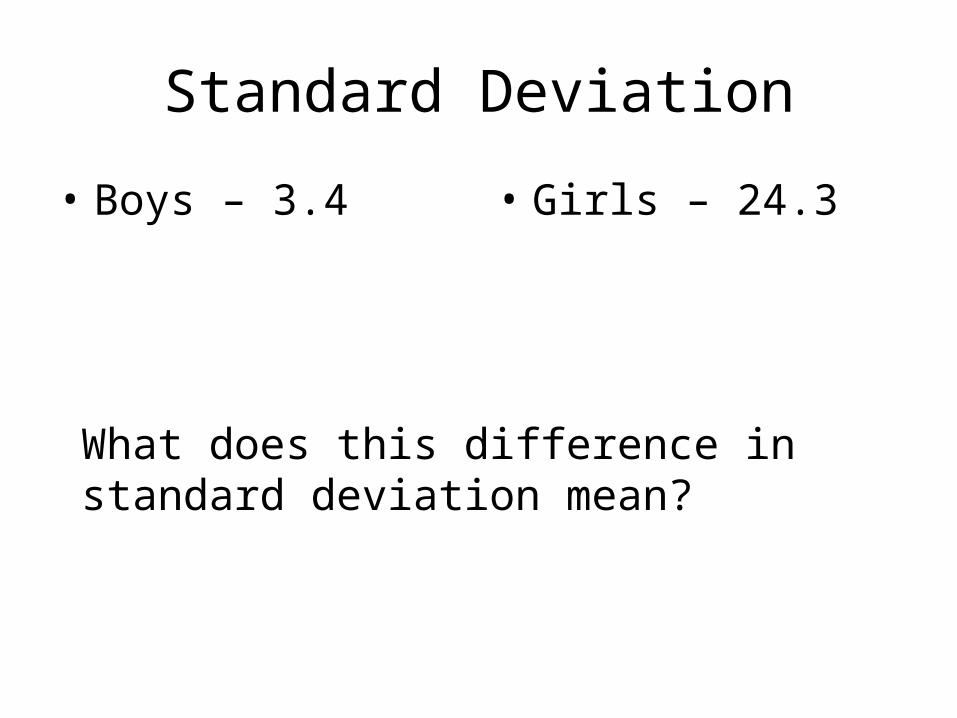
Standard Deviation
• Boys – 3.4 • Girls – 24.3
What does this difference in standard deviation mean?
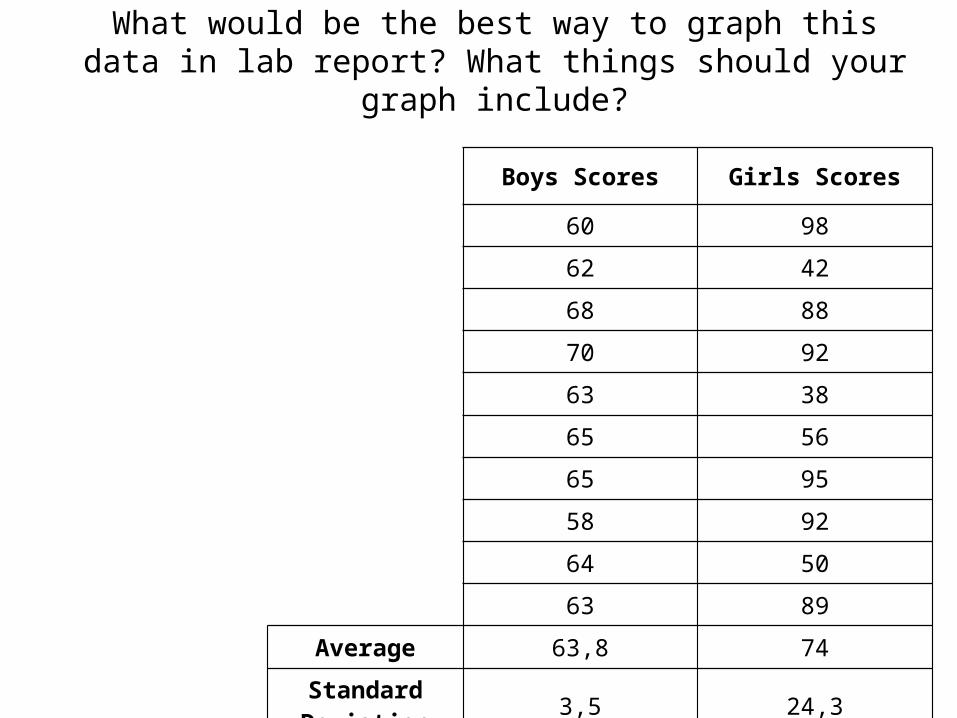
What would be the best way to graph this data in lab report? What things should your graph include?
Boys Scores Girls Scores
60 98
62 42
68 88
70 92
63 38
65 56
65 95
58 92
64 50
63 89
Average 63,8 74
Standard Deviation
3,5 24,3
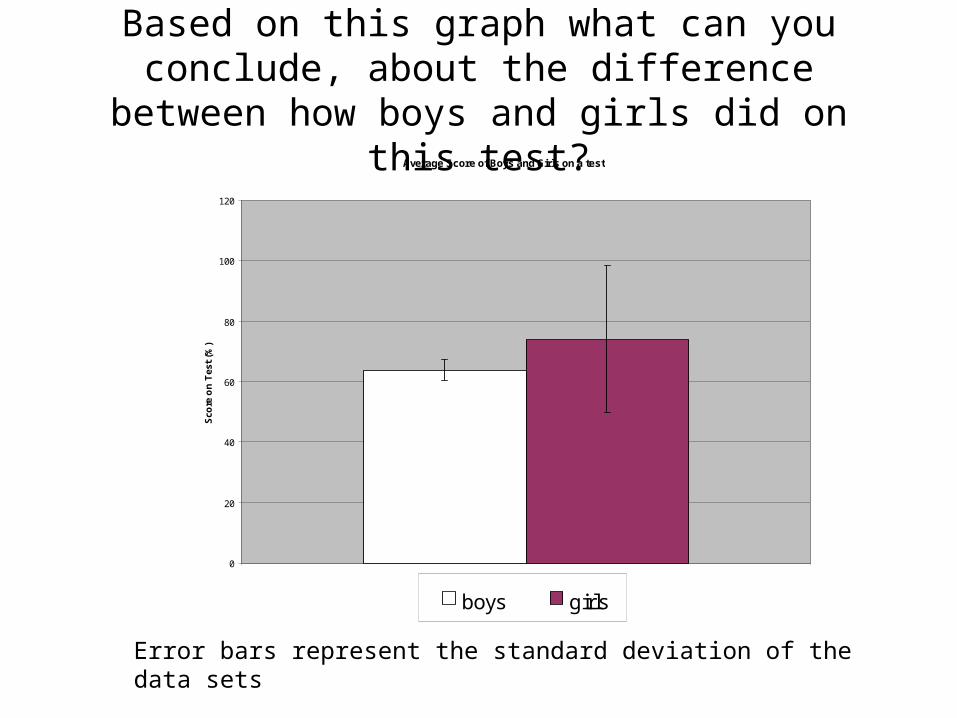
Based on this graph what can you conclude, about the difference between how boys and girls did on this test?
Average Score of Boys and Girls on a test
0
20
40
60
80
100
120
1
Sco
re o
n T
est
(%)
boys girls
Error bars represent the standard deviation of the data sets
Data Analysis Conclusions things to think about:
BIG vs. SMALL -- ERROR BARS• Big error bars means lots of variation in data
& data is less reliable to draw conclusions from
• Small error bars means less variation in data & data is more reliable to draw conclusion from
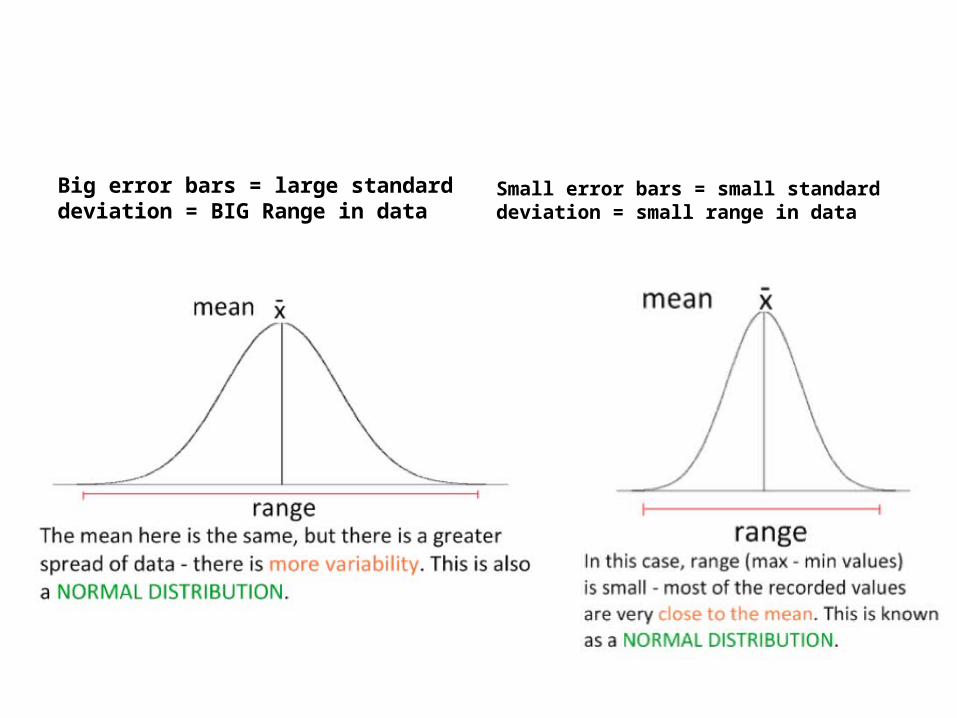
Big error bars = large standard deviation = BIG Range in data
Small error bars = small standard deviation = small range in data
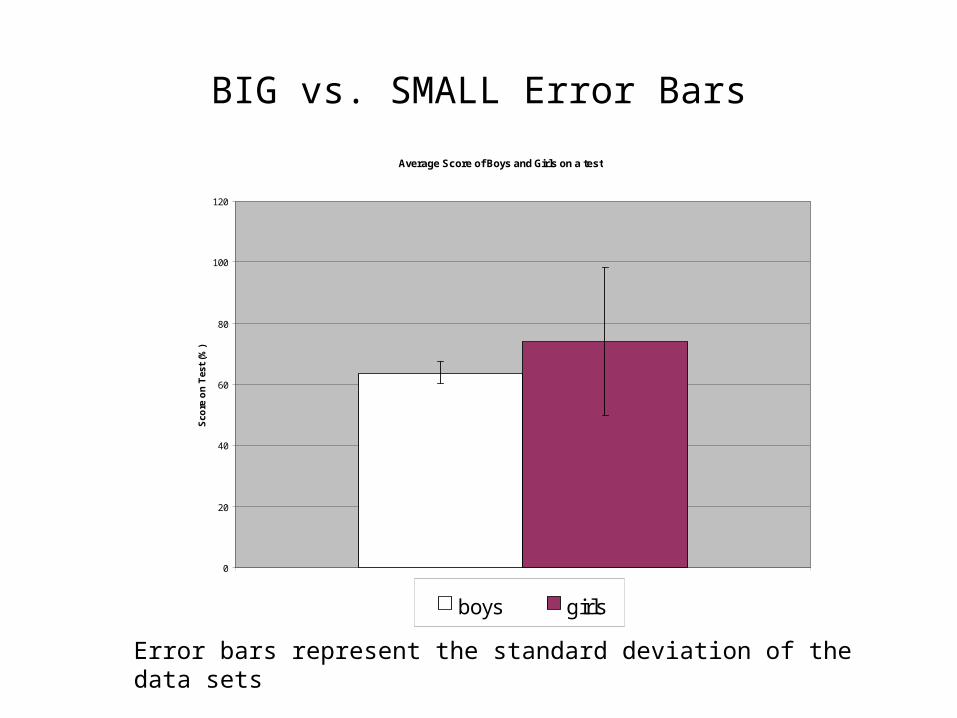
BIG vs. SMALL Error Bars
Average Score of Boys and Girls on a test
0
20
40
60
80
100
120
1
Sco
re o
n T
est
(%)
boys girls
Error bars represent the standard deviation of the data sets

Data Analysis Conclusions things to think about:
OVERLAPPING ERROR BARS– When the values of
error bars overlap on a graph it means that there is NOT a significant difference in averages and data sets.
Average Score of Boys and Girls on a test
0
20
40
60
80
100
120
1
Sco
re o
n T
est
(%)
boys girls
Error bars represent the standard deviation of the data sets
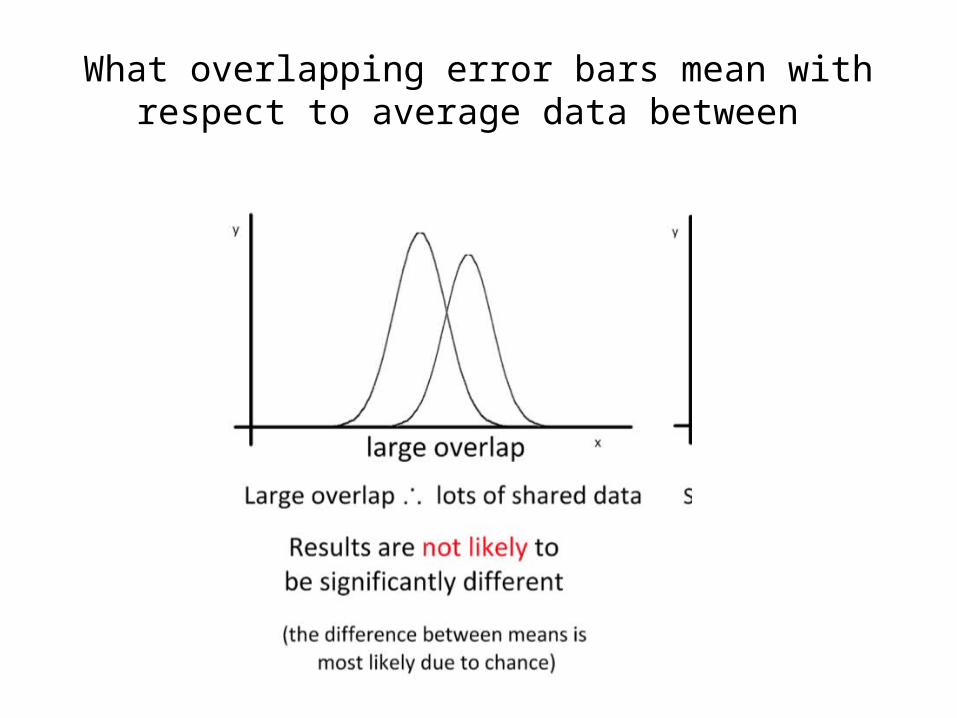
What overlapping error bars mean with respect to average data between
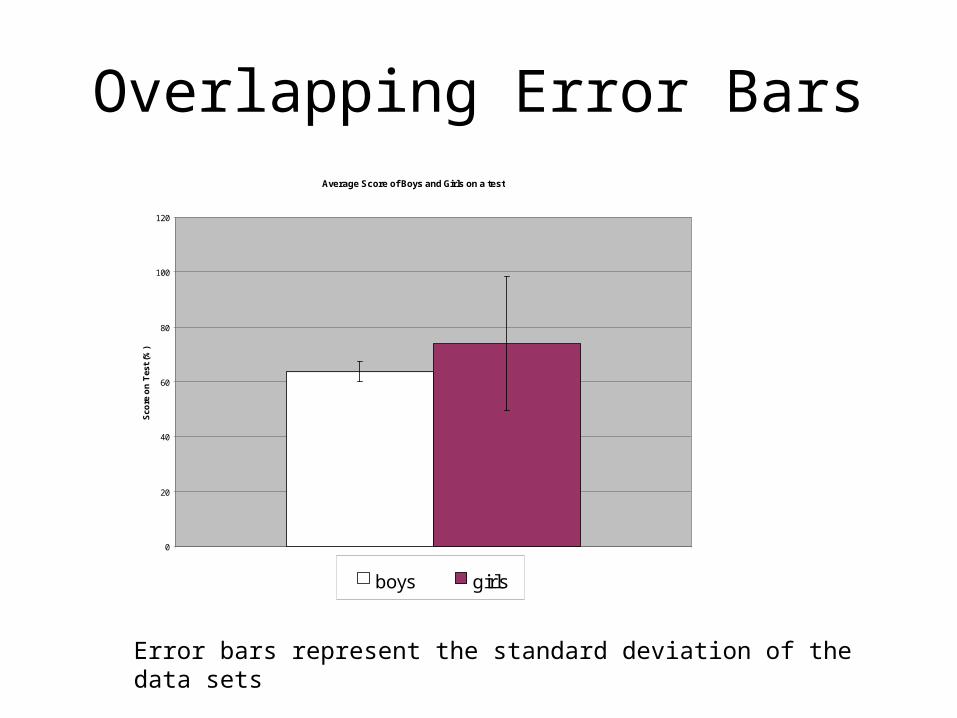
Overlapping Error BarsAverage Score of Boys and Girls on a test
0
20
40
60
80
100
120
1
Sco
re o
n T
est
(%)
boys girls
Error bars represent the standard deviation of the data sets
Data Analysis Conclusions things to think about:
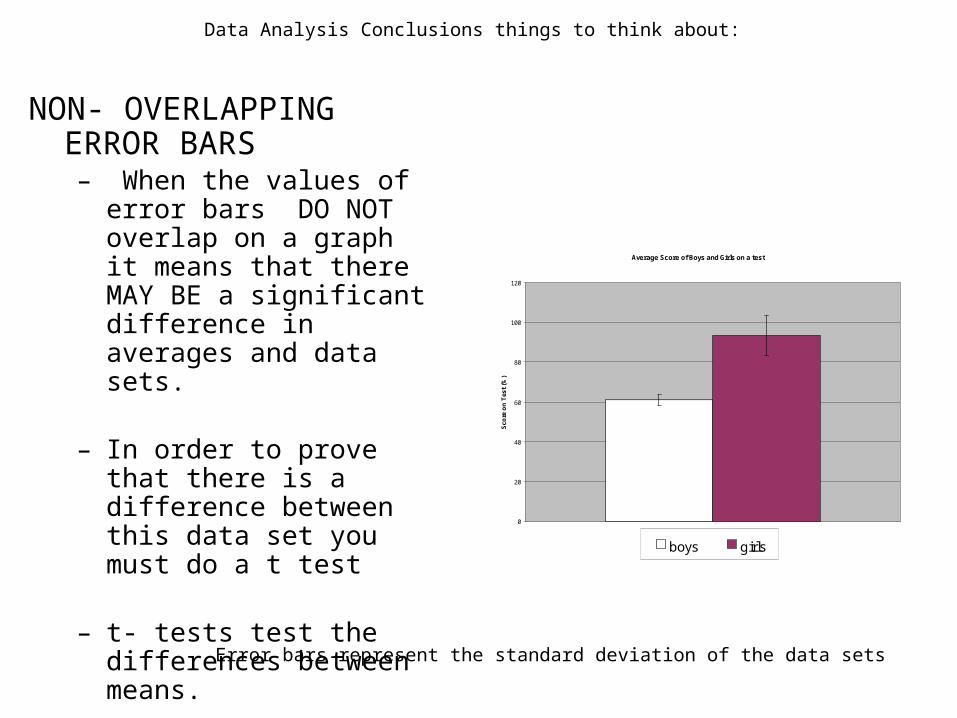
NON- OVERLAPPING ERROR BARS– When the values of error
bars DO NOT overlap on a graph it means that there MAY BE a significant difference in averages and data sets.
– In order to prove that there is a difference between this data set you must do a t test
– t- tests test the differences between means.
Average Score of Boys and Girls on a test
0
20
40
60
80
100
120
1
Sco
re o
n T
est
(%)
boys girls
Error bars represent the standard deviation of the data sets
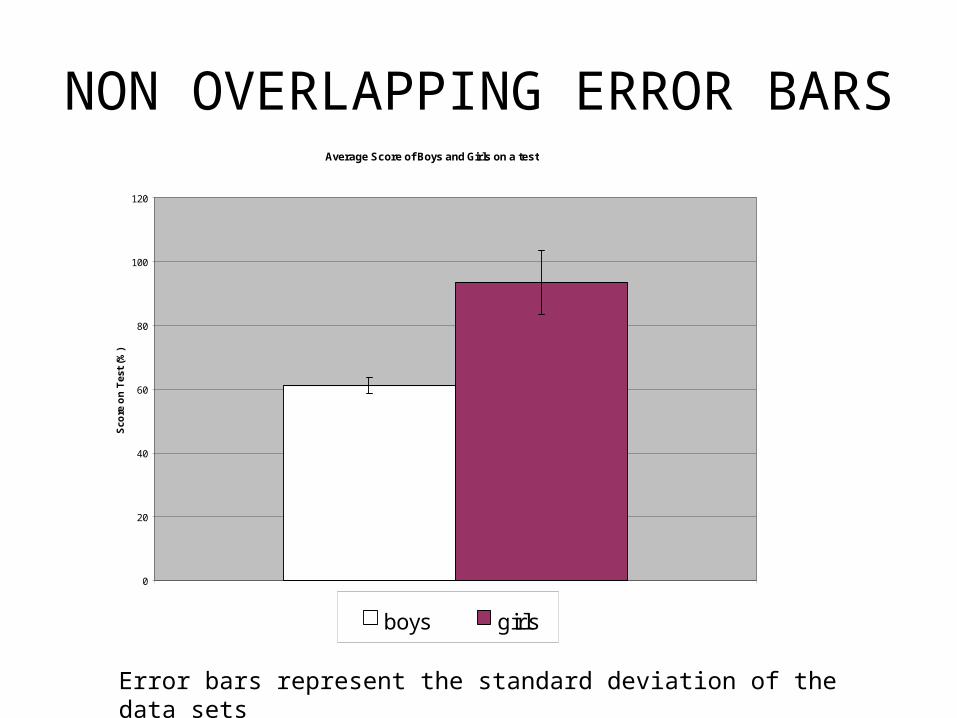
NON OVERLAPPING ERROR BARSAverage Score of Boys and Girls on a test
0
20
40
60
80
100
120
1
Sco
re o
n T
est
(%)
boys girls
Error bars represent the standard deviation of the data sets
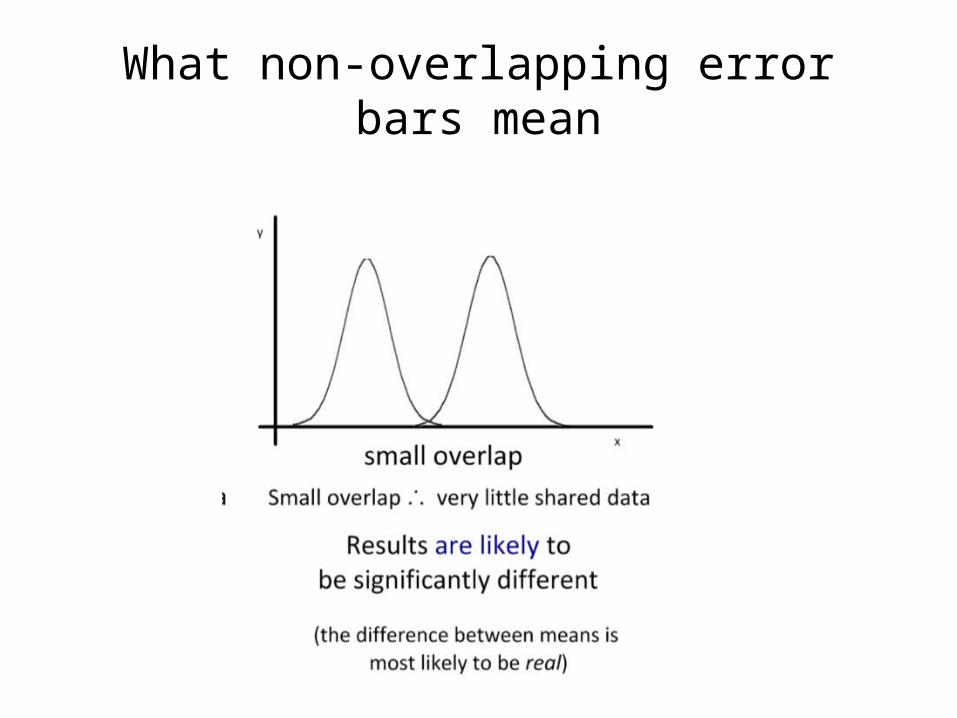
What non-overlapping error bars mean

YOUR Turn To PRACTICE.
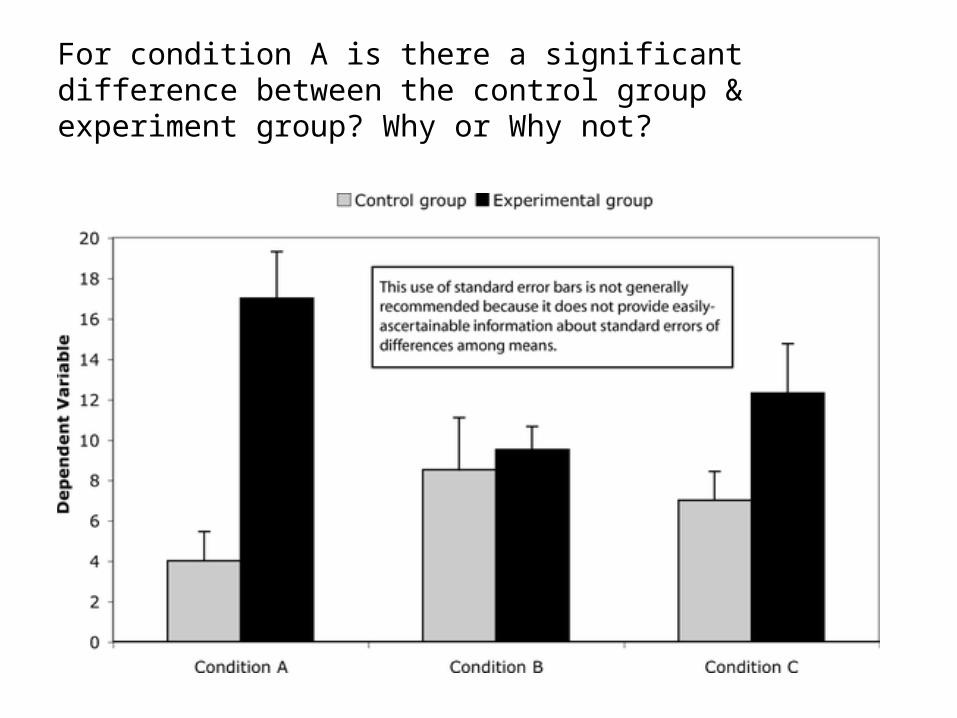
For condition A is there a significant difference between the control group & experiment group? Why or Why not?
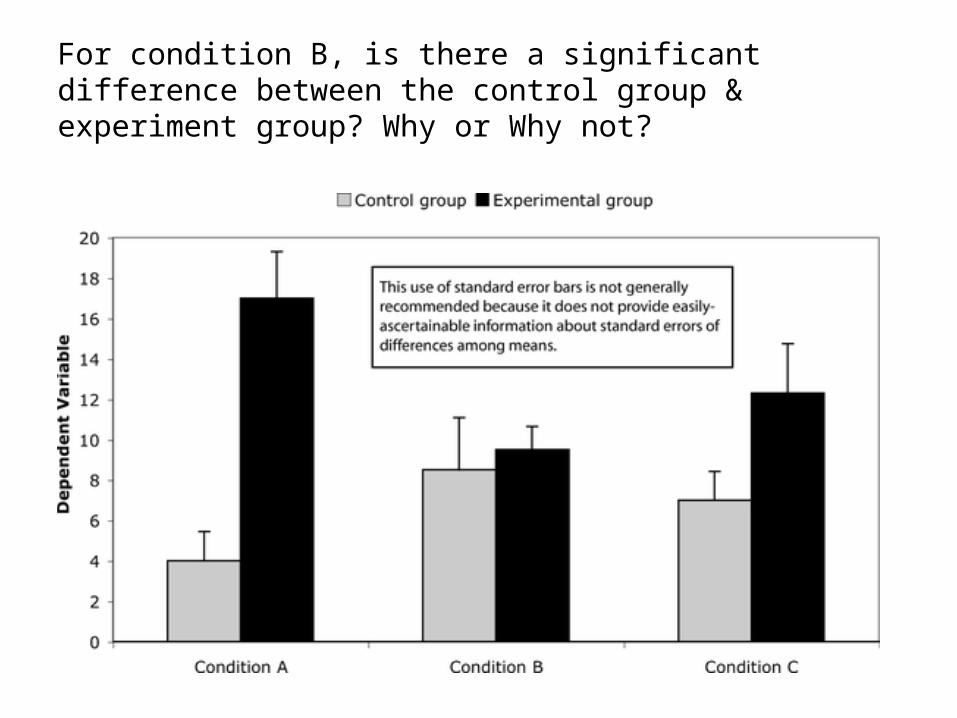
For condition B, is there a significant difference between the control group & experiment group? Why or Why not?
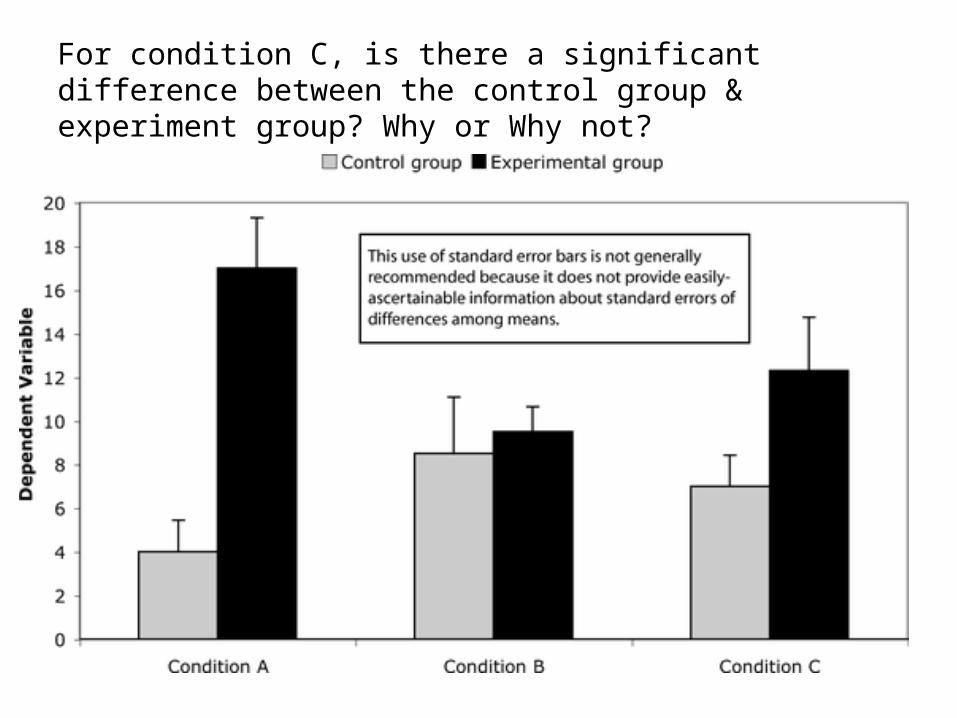
For condition C, is there a significant difference between the control group & experiment group? Why or Why not?
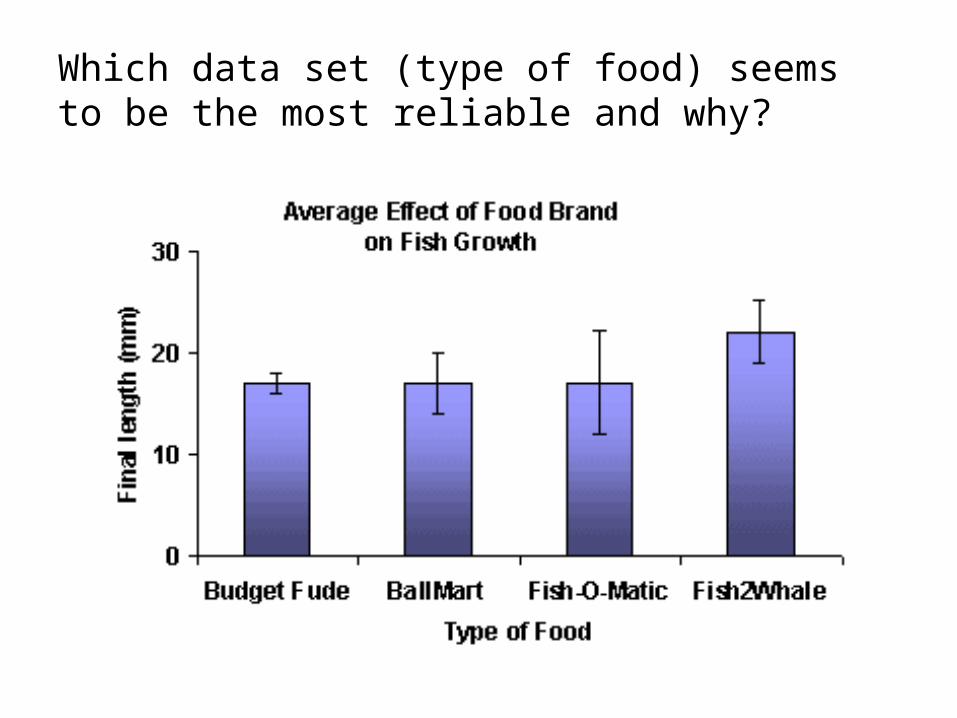
Which data set (type of food) seems to be the most reliable and why?
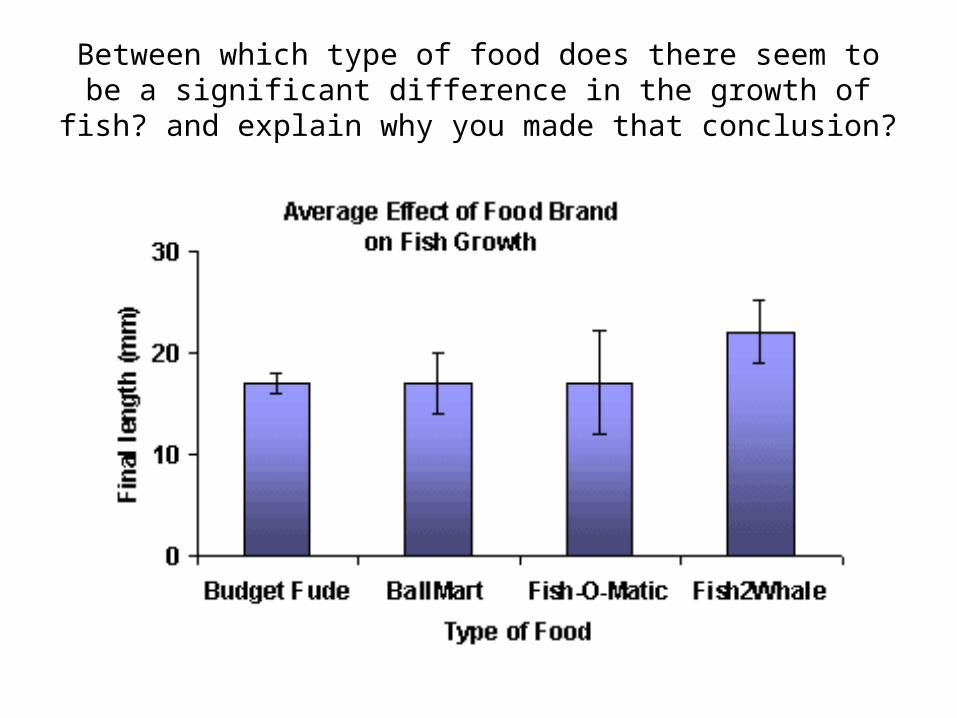
Between which type of food does there seem to be a significant difference in the growth of fish? and explain why you made that
conclusion?
Assessment Statement
• 1.1.1 State that error bars are a graphical representation of the variability of data.
• 1.1.4 Explain how the standard deviation is useful for comparing the means and the spread of data between two or more samples.