
Understanding key concepts of electric...
422
Understanding key concepts of electric circuits Students' use of mental models Joan Borg Marks B.Sc.(Hons.) M.A.(Loughborough) Dip.Educ.Admin.&Mgmt. Thesis submitted for a Ph.D. Degree University of York Department of Education December 2012
Transcript of Understanding key concepts of electric...

Understanding key concepts
of electric circuits
Students' use of mental models
Joan Borg Marks
B.Sc.(Hons.) M.A.(Loughborough) Dip.Educ.Admin.&Mgmt.
Thesis submitted for a Ph.D. Degree
University of York
Department of Education
December 2012
2
Abstract
This study presents an action research project on the teaching and learning of
fundamental ideas about electric circuits, gathering data from two cohorts. Students’ ideas
were probed using diagnostic test questions asked in pre-tests, post-tests and delayed post-
tests. Semi-structured interviews were used with students of different abilities to indicate
the mental models that students appeared to be using. Additional teaching activities were
introduced with Cohort 1. The effect of these activities was reflected upon, guiding further
additions to teaching activities used with Cohort 2. These activities addressed specific
points that seemed to pose particular difficulties for students with the aim of improving
students’ qualitative understanding through guided reflection and discussion.
The performance of Cohort 2 was significantly weaker at the pre-test stage but
Cohort 2 made better overall progress through the course of study when compared with
Cohort 1. Both cohorts made noticeable improvement in their understanding of current
conservation. However, problems with parallel circuits and with distinguishing between
potential difference (p.d.) and current remained. While p.d. was described by the high
ability students in terms of forces between negative charges and the battery terminals, no
student referred to the electric field which exists between battery terminals even in open
circuit.
In attempting to understand the behaviour of electric circuits, students appear
first to construct a mental model of electric current. The data collected suggest that
students start to understand p.d. when they ‘see’ it as some kind of difference between
points. The data also suggest that the scientific model of p.d. is more difficult to visualise
and use, putting p.d. at a higher level than current, in a logical hierarchy of ideas.
This study proposes a unified learning model for electric circuits, in terms of a
possible sequence of intermediate mental models of current, resistance and p.d. leading
towards the scientific view. This learning model can help both students and teachers.
Students can use it to gauge their level of understanding of circuits and to reflect on what
still needs to be understood. Teachers may use the learning model as a tool helping in
understanding the difficulties students experience and guiding in what next to teach to
improve students’ understanding of electric circuits.

3
List of Contents
Abstract………..................................................................................................................2
List of Contents .................................................................................................................3
List of Tables…...............................................................................................................14
List of Figures…..............................................................................................................20
Acknowledgements..........................................................................................................23
Author’s Declaration........................................................................................................24
Chapter 1 Introduction ..............................................................................................25
1.1 Learning about electric circuits .................................................................25
1.2 The origin of my interest to undertake this research...................................25
1.3 General issues which may hinder learning of electric circuits ....................27
1.4 The development of understanding in terms of mental model evolution.....28
1.5 Key ideas needed to understand how electric circuits work........................29
1.6 The context of the study ............................................................................30
1.6.1 Introduction…...........................................................................................30
1.6.2 The teaching content of electric circuits ....................................................30
1.6.3 Entry requirements to study at the post-secondary college.........................31
1.6.4 Teaching and learning practices in Malta...................................................32
1.7 A brief look at the research strategy adopted .............................................33
1.8 Overview of the thesis...............................................................................33
Chapter 2 Literature Review......................................................................................35
2.1 Introduction ..............................................................................................35
2.2 The development of ideas for understanding .............................................36
2.2.1 Mental models and modelling ...................................................................36
2.2.2 Relating mental models to analogies .........................................................37
2.2.3 Analogies and analogical reasoning for understanding ..............................38
2.3 Students’ intuitive ideas ............................................................................39
2.4 Some characteristics of studies about electric circuits................................40
2.4.1 The samples in various studies ..................................................................40
2.4.2 The aims of some studies undertaken ........................................................41
2.4.3 Different research designs and data collection methods .............................42
2.5 Literature on common misunderstandings about circuits ...........................43

4
2.5.1 Electric Current.........................................................................................43
2.5.2 The function of the battery .......................................................................47
2.5.3 Resistance and resistance combinations.....................................................47
2.5.4 Potential difference/voltage and potential..................................................50
2.5.5 The lack of a system view .........................................................................53
2.5.6 Persistence and consistency of students’ intuitive ideas .............................53
2.5.7 Retention of the learnt material .................................................................54
2.6 Why learning about the electric circuit may be difficult.............................55
2.6.1 Introduction…...........................................................................................55
2.6.2 The abstract nature of the topic .................................................................55
2.6.3 The experiential gestalt of causation..........................................................55
2.6.4 The level of students’ cognitive processing ...............................................57
2.6.5 Teaching as a cause of learning difficulties ...............................................57
2.6.6 Macro-micro relationships: the missing link..............................................59
2.7 Finding ways which may help learners’ understanding..............................60
2.7.1 Towards modifying unhelpful ideas ..........................................................60
2.7.2 Exploring learning pathways .....................................................................61
2.7.3 Focussing on the mental models of electric circuits ...................................64
2.7.4 Proposed teaching sequences.....................................................................66
2.7.5 Emphasis on the macro-micro relationship ................................................68
2.8 Summary and conclusion ..........................................................................75
Chapter 3 Methodology.............................................................................................77
3.1 Introduction ..............................................................................................77
3.2 The research questions ..............................................................................77
3.3 The type of research conducted .................................................................78
3.4 An outline of the research strategy ............................................................79
3.5 The sample................................................................................................81
3.6 Plans for data collection ............................................................................81
3.6.1 Probing students’ understanding before and after teaching ........................81
3.6.1.1 Physics diagnostic test...............................................................................81
3.6.1.2 Deciding on the question choice for the diagnostic testing.........................82
3.6.2 Probing students’ mental models as they evolve during teaching...............84
3.6.2.1 The importance of conducting interviews ..................................................84
3.6.2.2 The type of interview to choose.................................................................85

5
3.6.2.3 The use of the Predict-Observe-Explain technique through interview
sessions.....................................................................................................86
3.6.2.4 Deciding on who to interview....................................................................87
3.6.2.5 Instruments to help choose the student sub-group for interview sessions ...87
3.6.3 Qualitative and quantitative data ...............................................................88
3.6.4 Introducing additional teaching activities during the course.......................88
3.6.4.1 The aims of introducing additional teaching activities ...............................88
3.6.4.2 The teaching activities planned to be included in the course ......................88
3.7 The pilot studies........................................................................................89
3.7.1 Choosing the reasoning test to use.............................................................89
3.7.1.1 The group tests identified ..........................................................................90
3.7.1.2 The results of the tests...............................................................................92
3.7.2 Piloting of the PDT ...................................................................................93
3.7.3 Piloting of the Predict-Observe-Explain (POE) tasks used in interviews....94
3.8 Putting the plans into action ......................................................................95
3.8.1 The sample for the 1st cycle.......................................................................95
3.8.2 Administering the pre-test .........................................................................95
3.8.3 Administering the TOLT...........................................................................96
3.8.4 Conducting the interviews.........................................................................96
3.8.4.1 Choosing the students to be interviewed....................................................96
3.8.4.2 Classification of the students in the sub-group.........................................100
3.8.4.3 Choosing the interview questions ............................................................100
3.8.4.4 Conducting the interview sessions...........................................................102
3.8.5 Conducting the additional teaching activities (1st cycle) ..........................103
3.8.6 Administering the post-test with Cohort 1 ...............................................104
3.8.7 Administering the delayed post-test with Cohort 1 ..................................104
3.8.8 Summary of the time frame for covering sub-sections of the topic and
data collection (1st cycle).........................................................................104
3.9 Analysing and reflecting on the data collected with Cohort 1 ..................106
3.10 The 2nd
cycle of the research project........................................................106
3.11 Analysis and reflection on the results of the 2nd
cycle - suggestions for
further work ............................................................................................107
3.12 Addressing validity in action research .....................................................107
3.13 Conclusion..............................................................................................109
Chapter 4 The Physics Diagnostic Tests (Cohort 1) .................................................110

6
4.1 Introduction ............................................................................................110
4.2 The questions asked in the tests...............................................................110
4.3 A look at students’ overall performance in the pre-test ............................112
4.3.1 Scoring the test answers ..........................................................................112
4.3.1.1 Why scoring was important.....................................................................112
4.3.1.2 The method adopted for scoring the answers ...........................................112
4.3.2 Students’ scores on the pre-test ...............................................................112
4.3.3 Facility values.........................................................................................113
4.3.4 Item-total correlation...............................................................................113
4.4 Students’ mental models of the electric circuit at the pre-test stage..........116
4.4.1 Grouping the pre-test questions for analysis ............................................116
4.4.2 Students’ problems with microscopic views of circuit .............................117
4.4.2.1 Where do charges reside?........................................................................117
4.4.2.2 Combining the results of parts (a), (d), (c) and (f) for Qn4.......................118
4.4.2.3 Summary of problems with the microscopic ‘image’ of a circuit .............119
4.4.3 Students’ models of current.....................................................................119
4.4.3.1 Introduction ............................................................................................119
4.4.3.2 Performance on Qn 1 and Qn 2 ...............................................................119
4.4.3.3 Consistency shown in mental models used in Qn 1 and Qn 2...................123
4.4.3.4 Conservation of current in a more complicated circuit.............................124
4.4.3.5 Overall results for Qn 9(a) and consistency of answers............................125
4.4.3.6 Summary of students’ ideas about current ...............................................127
4.4.4 How resistance controls the current .........................................................127
4.4.4.1 Introduction ............................................................................................127
4.4.4.2 Resistance as a control of the battery push...............................................128
4.4.4.3 Consistency of students’ responses about resistance ................................129
4.4.4.4 The effect on current of adding an equal resistance in series....................132
4.4.4.5 Resistances connected in parallel ............................................................134
4.4.4.6 The control of current by resistors in different branches ..........................137
4.4.4.7 Summary of students’ ideas about resistance ...........................................138
4.4.5 Conceptualization of potential difference ................................................139
4.4.5.1 Introduction ............................................................................................139
4.4.5.2 Changing the driving force – changing the supply voltage.......................139
4.4.5.3 P.d. across equivalent points in the circuit ...............................................142

7
4.4.5.4 Predicting and explaining potential difference across series resistors.......144
4.4.5.5 Predicting and explaining potential difference across parallel resistors ....148
4.4.5.6 Inability to distinguish p.d. from current..................................................153
4.4.5.7 Summary of how students conceptualized p.d. ........................................155
4.4.6 Summary and conclusion to the pre-test analysis.....................................155
4.5 Students’ answers to the post-test questions ............................................157
4.5.1 The questions asked in the post-test.........................................................157
4.5.2 Grouping the post-test questions for analysis...........................................157
4.5.3 Microscopic views of circuit ...................................................................161
4.5.3.1 Electric charges and where they reside ....................................................161
4.5.3.2 Summary of results for microscopic views of the electric circuit .............163
4.5.4 Mental models of current ........................................................................163
4.5.4.1 Ideas used at the post-test stage ...............................................................163
4.5.4.2 Summary of students’ views of current....................................................165
4.5.5 How resistances control the current .........................................................165
4.5.5.1 Resistances connected in parallel ............................................................165
4.5.5.2 Evidence of a deep-seated alternative conception ....................................166
4.5.5.3 Use of the BAT model in other questions ................................................168
4.5.5.4 Consistency in the use of the BAT model................................................171
4.5.5.5 Summary of students’ views of how resistance controls the current.........171
4.5.6 Conceptualization of p.d..........................................................................172
4.5.6.1 P.d. across ideal connecting wires ...........................................................172
4.5.6.2 A voltmeter registers a difference of ‘something’ between two points .....173
4.5.6.3 Further evidence of the effect of distractors.............................................176
4.5.6.4 P.d. not distinguished from current..........................................................178
4.5.6.5 Summary of how students conceptualized p.d. ........................................182
4.5.7 Summary of post-test results ...................................................................183
4.6 Students’ performance in the delayed post-test ........................................184
4.6.1 Introduction….........................................................................................184
4.6.2 Facility value results ...............................................................................184
4.6.2.1 Comparing facility values in the post- and delayed post-test...................184
4.6.2.2 Comparing facility values for common questions in all tests....................186
4.6.3 Did students ‘see’ the invisible now?.......................................................187
4.6.3.1 Performance on microscopic views of the electric circuit ........................187

8
4.6.3.2 Summary on how students visualised charges in the electric circuit.........188
4.6.4 Models of current used in the delayed post-test .......................................189
4.6.4.1 Performance on questions probing models of current ..............................189
4.6.4.2 Summary of performance in questions probing models of current ...........191
4.6.5 Understanding resistance and current control ..........................................191
4.6.5.1 Resistances in parallel branches ..............................................................191
4.6.5.2 Battery control versus resistance control in determining the current ........192
4.6.5.3 Summary of performance in questions probing understanding of
resistance ................................................................................................194
4.6.6 Understanding p.d. ..................................................................................194
4.6.6.1 P.d. across ideal connecting wires ...........................................................194
4.6.6.2 P.d. across equivalent points....................................................................195
4.6.6.3 P.d. not distinguished from current..........................................................199
4.6.6.4 Summary of students views of p.d. ..........................................................202
4.6.7 Conclusion from the delayed post-test results..........................................202
4.7 Comparing the overall performance of Cohort 1 in all tests .....................203
4.8 Conclusion to the analyses of the PDTs (Cohort 1)..................................206
Chapter 5 Interview Study: Cohort 1 .......................................................................208
5.1 Introduction ............................................................................................208
5.2 The 1st interview – Current in a simple circuit .........................................209
5.2.1 The aims of the 1st interview ...................................................................209
5.2.2 Conducting the 1st interview....................................................................209
5.2.3 Ideas revealed about current ....................................................................210
5.2.3.1 A general mental picture of something flowing .......................................210
5.2.3.2 A cyclic sequential pattern to indicate flow .............................................211
5.2.3.3 The importance given to the connecting wires .........................................212
5.2.3.4 The role of the battery .............................................................................216
5.2.3.5 A summary of ideas about what makes current........................................217
5.2.4 A picture of resistance.............................................................................219
5.2.5 Factors affecting the current ....................................................................219
5.2.6 The Predict-Observe-Explain task ...........................................................219
5.2.6.1 The aim of this task.................................................................................219
5.2.6.2 The circuit used and questions asked.......................................................220
5.3.6.3 The results of the POE task .....................................................................220

9
5.2.6.4 Overall comments based on the POE task................................................224
5.2.7 Summary of students’ ideas exposed during the 1st interview ..................224
5.3 The 2nd
interview – Resistances in series and in parallel ..........................227
5.3.1 The aims of the 2nd
interview ..................................................................227
5.3.2 Conducting the 2nd
interview...................................................................227
5.3.3 The results of the 2nd
interview................................................................230
5.3.3.1 Reasoning difficulties with resistances connected in parallel ...................230
5.3.3.2 Predictions with reasons..........................................................................232
5.3.3.3 A qualitative reason for the observation ..................................................234
5.3.4 Summary of results dealing with resistance of series and parallel
resistors……. ..........................................................................................236
5.4 The 3rd
interview - Part 1: Probing microscopic views.............................236
5.4.1 The aim of this exercise ..........................................................................236
5.4.2 Conducting the first part of the interview ................................................236
5.4.3 The results for Qn 4 in the pre-test and the interview...............................237
5.4.3.1 Comparing students’ answers ..................................................................237
5.4.3.2 Problems related to meaning ...................................................................240
5.4.3.3 Dealing with complex situations..............................................................241
5.4.4 Summary of results for Qn 4 ...................................................................242
5.5 The 3rd
interview – Part 2: Meanings attributed to voltmeter readings .....242
5.5.1 The aim of the exercise ...........................................................................242
5.5.2 Conducting the interview ........................................................................243
5.5.3 Students’ answers for the series circuits ..................................................244
5.5.4 Students’ answers for the parallel circuits................................................246
5.5.5 Mental models of voltage ........................................................................250
5.5.6 Summary about how students imagine voltage ........................................253
5.6 The 4th
interview – Differentiating between current and voltage ..............253
5.6.1 Aim of the interview ...............................................................................253
5.6.2 Conducting the interview ........................................................................254
5.6.3 The results of the interview .....................................................................255
5.6.3.1 The main problems..................................................................................255
5.6.3.2 The reading of V2 when S was closed.....................................................257
5.6.3.3 The reading of V2 when S was open .......................................................258
5.6.4 Summary of the findings from the 4th
interview.......................................260

10
5.7 Overall summary and conclusion ............................................................261
Chapter 6 Progress in Understanding of Electric Circuits in Cohort 2......................267
6.1 Introduction ............................................................................................267
6.2 Analysis of the pre-test results.................................................................267
6.2.1 Introduction….........................................................................................267
6.2.2 The facility values of questions on the pre-test ........................................268
6.2.3 Similarities and differences of students’ answers according to concepts
being probed…. ......................................................................................269
6.2.3.1 Microscopic views ..................................................................................269
6.2.3.2 Models of current indicated.....................................................................270
6.2.3.3 How resistance controls the current .........................................................271
6.2.3.4 Further indications of unhelpful models using resistances in series and
in parallel ................................................................................................272
6.2.3.5 Problems with the conceptualization of p.d. ............................................274
6.2.3.6 P.d. across series and parallel resistors ....................................................276
6.2.4 Summary of the results in the pre-test......................................................279
6.3 Additional teaching activities used with Cohort 2....................................280
6.3.1 Introduction….........................................................................................280
6.3.2 Revising the static electricity course........................................................280
6.3.3 Circuit diagram representation ................................................................281
6.3.4 The ‘electron experience’ task.................................................................281
6.3.4.1 Setting the task........................................................................................281
6.3.4.2 The results of the task .............................................................................282
6.3.4.3 Reflections after class discussion ............................................................283
6.3.5 Differentiating between current and p.d...................................................284
6.3.6 The DVD and the PowerPoint presentation .............................................284
6.3.7 PhET simulations ....................................................................................285
6.4 The post-test results ................................................................................285
6.4.1 Introduction….........................................................................................285
6.4.2 Persistent difficulties with microscopic views .........................................286
6.4.3 Improvement on current conservation views............................................287
6.4.4 Understanding resistance.........................................................................288
6.4.4.1 Popular models used in describing resistance ..........................................288
6.4.4.2 Confirming the popular use of the BAT model ........................................289
11
6.4.5 Effect of the additional teaching activities on the understanding of p.d. ...290
6.4.5.1 P.d. across resistors connected in parallel ................................................290
6.4.5.2 P.d. when changes were made to the circuit.............................................291
6.4.5.3 Common unhelpful views of p.d..............................................................292
6.4.6 Summary of the post-test results..............................................................294
6.5 Analysis of the delayed post-test results ..................................................295
6.5.1 Introduction….........................................................................................295
6.5.2 Where do charges reside?.......................................................................295
6.5.3 Current conservation and attenuation models ..........................................297
6.5.4 Answers about resistance ........................................................................298
6.5.5 Difficulties with understanding p.d..........................................................300
6.5.6 Summary of the delayed post-test results.................................................303
6.6 An overview of the performance of Cohort 2 in the diagnostic tests ........304
6.6.1 Deductions from the diagnostic tests results ............................................304
6.6.2 Analysis and comparison of the test scores for the two cohorts................305
6.7 The interviews with Cohort 2 ..................................................................308
6.7.1 Type of interviews conducted..................................................................308
6.7.2 The sample…..........................................................................................308
6.7.3 Deciding on the questions to ask .............................................................308
6.7.4 Examining the results of the interviews with Cohort 2.............................310
6.7.4.1 Introduction ............................................................................................310
6.7.4.2 Students’ mental visualization of current.................................................310
6.7.4.3 Some comparisons that students used ......................................................311
6.7.4.4 Adding an equal resistance in series ........................................................312
6.7.4.5 Adding equal resistances in parallel.........................................................312
6.7.4.6 Conflicts between teacher–researcher......................................................313
6.7.4.7 An interview with a difference ................................................................314
6.7.5 Conclusion from the results of the interviews ..........................................317
6.8 Conclusion from the 2nd
cycle of the research..........................................318
Chapter 7 Reflections and Conclusions ...................................................................319
7.1 Introduction ............................................................................................319
7.2 Reflections on the first research question.................................................319
7.3 Reflections on the second research question ............................................320
7.3.1 Learning pathways in terms of mental models .........................................320
12
7.3.2 Reflections on researchers’ efforts to map students’ learning of electric
circuits in terms of mental model pathways .............................................322
7.3.2.1 Studies which took a central role during reflections.................................322
7.3.2.2 Shipstone’s work proposing models of current ........................................322
7.3.2.3 Causal models of electric circuits suggested by Grotzer and Sudbury ......323
7.3.2.4 Models of electric circuits reported by Borges and Gilbert ......................324
7.3.2.5 An intermediate model proposed by the present study .............................325
7.3.2.6 Splitting a mental model level into two ...................................................326
7.3.2.7 Models of p.d. proposed in a hierarchy....................................................327
7.3.2.8 A unified view of models of electric circuit.............................................328
7.4 Reflections on the third research question ...............................................331
7.5 The contribution to knowledge made by this study ..................................334
7.6 Strengths and weaknesses of the study ....................................................335
7.6.1 A general note onteaching and learning...................................................335
7.6.2 The diagnostic tests .................................................................................336
7.6.3 Proposing a unified learning model for electric circuits ...........................336
7.6.4 Validity and reliability of the research findings .......................................337
7.6.5 Gender issues ..........................................................................................339
7.6.6 The problem of interpretation of responses..............................................339
7.7 Implications for practice..........................................................................340
7.7.1 Model based teaching and learning..........................................................340
7.7.2 The Predict-Observe-Explain (POE) technique........................................341
7.7.3 Teacher guided discussions .....................................................................341
7.7.4 Analogies and analogical reasoning.........................................................342
7.8 The role of teachers.................................................................................342
7.8.1 Didactic versus student centred methods .................................................342
7.8.2 Addressing teachers’ conflicts.................................................................343
7.9 Suggestions for future work ....................................................................343
7.10 Conclusion..............................................................................................345
Appendix 1 The Secondary Education Certificate (SEC) Physics Syllabus .................346
Appendix 2 The Matriculation and Secondary Education Certificate (MATSEC)
Board Physics Syllabus at Advanced Level .............................................348
Appendix 3 Diagnostic Test Questions in the Question Bank .....................................350
Appendix 4 Reasoning Tasks .....................................................................................375
13
Appendix 5 Test of Logical Thinking (TOLT)............................................................377
Appendix 6 Pilot Study Results for TOLT and Reasoning Tasks ................................387
Appendix 7 PowerPoint Presentation..........................................................................388
Appendix 8 Interview Schedules used with Cohort 1..................................................394
Appendix 9 Interview Schedules used with Cohort 2..................................................400
Appendix 10 An Extract from Dan’s Transcript – The Interview with a Difference......403
Bibliography….. ............................................................................................................406

14
List of Tables
Table 3.1: Rearrangement of TOLT scores in relation to cognitive levels...................92
Table 3.2: Comparing the results on the three tests.....................................................93
Table 3.3: Cross-tabulation of PDT and TOLT results (Cohort 1) ..............................97
Table 3.4: Correlation between PDT and TOLT scores ..............................................98
Table 3.5: Student classification – the interview sample...........................................100
Table 4.1: Test questions related to question number in the question bank ...............111
Table 4.2: Pre-test results (Cohort 1) expressed in rank order according to facility
values......................................................................................................114
Table 4.3: Pre-test questions grouped by the concepts probed ..................................116
Table 4.4: Results to parts (a) and (d) of Qn 4..........................................................118
Table 4.5: Results to parts (c) and (f) of Qn 4 ..........................................................118
Table 4.6: Comparing answers to parts (a), (d), (c) and (f) of Qn 4 - ‘Microscopic
views’ .....................................................................................................119
Table 4.7: Number of students giving responses to Qn 1..........................................120
Table 4.8: Mental models of current used in Qn 1 – ‘Current at points a and b’........121
Table 4.9: Students’ answers to Qn 2 - ‘Current using two ammeters’......................121
Table 4.10: Mental models of current in Qn 2 - ‘Current using two ammeters’ ..........122
Table 4.11: Mental models of current in Qn 1 and Qn 2.............................................123
Table 4.12: Results to Qn 9(a) - ‘Current conservation at junctions and within a
parallel branch’ .......................................................................................124
Table 4.13: Answers for Qn 9a(iv) and Qn 9a(v) - ‘Current conservation in the
main circuit’............................................................................................125
Table 4.14: Answers to Qns 9a(ii) and 9a(iii) - ‘Current conservation within a
parallel branch’ .......................................................................................125
Table 4.15: Different response patterns for questions 9a(ii) to 9a(v)...........................126
Table 4.16: Different response patterns for Qn 9a(ii) to (v) compared to ideas
indicated in Qn 1 and Qn 2......................................................................127
Table 4.17: Results to Qn 5 - ‘Use of a larger resistance‘ ...........................................129
Table 4.18: Mental models of resistance in Qn 5........................................................129
Table 4.19: Answers to Qns 7(a) and 7(b) - ‘Increasing the variable resistance’.........131
Table 4.20: Mental models of resistance in Qn 7........................................................131
Table 4.21: Comparing answers to Qn 5(a) and Qn 7(a).............................................132

15
Table 4.22: Student’s answers to Qn 6 - ‘Adding an equal resistance in series’ ..........133
Table 4.23: Mental models in Qn 6 - ‘Adding an equal resistance in series’ ...............133
Table 4.24: Models inferred in Qn 6 and Qn 7 ...........................................................134
Table 4.25: Students’ answers to Qn 8 .......................................................................135
Table 4.26: Mental models used in Qn 8 - ‘Adding an equal resistance in parallel’ ....136
Table 4.27: Comparing models in Qn 7 and Qn 8 ......................................................137
Table 4.28: Answers to Qn 9(b) - ‘Parallel resistors’ control of current’.....................138
Table 4.29: Results for Qn 10 ....................................................................................140
Table 4.30: Results for Qn 11 ....................................................................................141
Table 4.31: Mental models in Qn 10 and Qn 11 .........................................................141
Table 4.32: Answers to Qn 12 - ‘p.d. across resistances and ideal connecting wires’..143
Table 4.33: Students’ answers for Qn 12(a) and Qn 12(b)..........................................143
Table 4.34: Answers to Qn 12(c) and Qn 12(f) - ‘p.d. across connecting wires’ .........144
Table 4.35: P.d. predictions in Qns 13(a) and 14(a)....................................................146
Table 4.36: Results for Qn 13 and Qn 14 ...................................................................147
Table 4.37: Voltmeter reading predictions Qn 15 - ‘equal resistances’ .......................149
Table 4.38: Predictions and explanations to Qn 15.....................................................150
Table 4.39: Models of p.d. in Qn 15 - ‘p.d. across equal parallel resistors’.................150
Table 4.40: Voltmeter predictions to Qn 16 - ‘p.d. across unequal parallel resistors’..152
Table 4.41: Models of p.d. in Qn 16 - ‘p.d. across unequal parallel resistors’.............152
Table 4.42: Models of voltage in Qn15 and Qn16 - ‘resistances in parallel’ ...............153
Table 4.43: Answers for Qn 17(b)..............................................................................155
Table 4.44: The questions asked in the post-test arranged in groups...........................158
Table 4.45: Post-test results expressed in rank order according to facility values .......159
Table 4.46: Comparing facility values of common questions in pre- and post-test......160
Table 4.47: Results for Qn 4(a) on the pre-test and post-test ......................................161
Table 4.48: Results for Qn 4(d) on the pre-test and post-test ......................................161
Table 4.49: Results for Qn 4(a) and Qn 4(d) during the post-test................................162
Table 4.50: Results for Qn 4(c) and Qn 4(f) on the post-test ......................................162
Table 4.51: Combination of responses to parts (a), (d), (c) and (f) of Qn 4 .................162
Table 4.52: Pre-test and post-test results for Qn 1 ......................................................163
Table 4.53: Pre-test and the post-test results for Qn 3.................................................164
Table 4.54: Post-test results for Qn 1 and Qn 3 ..........................................................165
Table 4.55: Comparing mental models of current in post-test Qn 1 and Qn 9’(a)........165
16
Table 4.56: Comparing pre-test and post-test answers to Qn 9(b)...............................166
Table 4.57: Results for Qn 6 in the post-test...............................................................166
Table 4.58: Comparing mental models in the pre-test and the post-test for Qn 6 ........167
Table 4.59: Results for Qn 7 in the post-test...............................................................168
Table 4.60: Comparing pre-test and post-test mental models in Qn 7 .........................168
Table 4.61: Results for Qn 8 in the post-test...............................................................169
Table 4.62: Models in pre-test and post-test for Qn 8 - ‘Adding an equal resistance
in parallel’...............................................................................................170
Table 4.63: Mental models in Qn 6 and Qn 8.............................................................171
Table 4.64: Results for Qn 12’(b) and Qn 12’(c)........................................................173
Table 4.65: Results for Qn 18 - ‘p.d. across a resistor, adding another resistor in
parallel’...................................................................................................175
Table 4.66: Results for Qn 19 - ‘Addition of a battery in parallel with the first:
Voltmeter reading’ ..................................................................................176
Table 4.67: Mental models in Qn 19 and Qn 20 .........................................................178
Table 4.68: Comparing pre-test and the post-test models in Qn 15 .............................179
Table 4.69: Models in Qn 15 and Qn 16 ....................................................................179
Table 4.70: Answers to Qn 17’(a) - ‘P.d. across a closed switch’ ...............................181
Table 4.71: Answers to Qn 17’(b): ‘P.d. across an open switch’.................................181
Table 4.72: Comparing facility values in the post-test and delayed post-test
questions.................................................................................................185
Table 4.73: Comparing facility values for common questions on the three tests .........186
Table 4.74: Post-test and delayed post-test results to Qn 4(a) .....................................188
Table 4.75: Mental models in the post-test and delayed post-test for Qn 1 .................189
Table 4.76: Mental models in the post-test and delayed post-test for Qn 9’(a)............190
Table 4.77: Comparing answers to Qn 9’(b) for the post- and delayed post-test .........192
Table 4.78: Mental models in the post-test and the delayed post-test for Qn 8............193
Table 4.79: Mental models in Qn 6 and Qn 8.............................................................194
Table 4.80: Results for Qn 12’(b) and (c)...................................................................195
Table 4.81: Results for Qn 12’(c) during the post-test and delayed post-test...............195
Table 4.82: Results for Qn 12’(a) in the post-test and delayed post-test......................196
Table 4.83: Comparing results for Qn 12’(a) and Qn 18.............................................197
Table 4.84: Mental models in Qn 19 and Qn 20 during the delayed post-test .............199
Table 4.85: Qn 15 (prediction) on the post-test and delayed post-test .........................199
Table 4.86: Predicting voltmeter readings in Qn 15....................................................200

17
Table 4.87: Voltmeter reading predictions in post- and delayed post-test for Qn 16 ...200
Table 4.88: Voltage predictions to Qn 15 and Qn 16..................................................201
Table 4.89: Answers to Qn 17’(a) - ‘p.d. across a closed switch’ during the delayed
post-test ..................................................................................................201
Table 4.90: Results considering the common questions asked in all tests ...................204
Table 4.91: Correlation of the students’ scores on the common questions in the pre-,
post- and delayed post-test ......................................................................204
Table 4.92: Results of t-tests between post/pre-test and delayed post/post-test (all
questions)................................................................................................205
Table 4.93: Means as a percentage for the question groups in all tests (all
questions)................................................................................................205
Table 5.1: The formation of current in a closed circuit .............................................218
Table 5.2: Mental models of current indicated by the students .................................221
Table 5.3: Summary of POE results for students’ expectations of changes on the
ammeter reading when two resistors previously connected in series are
then connected in parallel........................................................................231
Table 5.6: Combining the answers to Qn 4 in the pre-test and the interview.............238
Table 5.7: Comparing ideas from the 1st interview to those held upon reviewing
Qn 4........................................................................................................240
Table 5.8: Resistances connected in series: What do the voltmeters across the
resistors read? .........................................................................................245
Table 5.9: Equal and unequal resistances connected in parallel: What do the
voltmeters connected across the resistors read? .......................................247
Table 5.10: Predictions of meter readings in the circuit of Figure 5.9, when the
switch is open and closed ........................................................................256
Table 6.1: Comparing facility values for questions on the pre-test for both cohorts ..268
Table 6.2: Comparing parts (a) and (d) of Qn4 on the pre-test..................................269
Table 6.3: Results for parts (c) and (f) of Qn 4 .........................................................269
Table 6.4: Models of current in Qn 1 and Qn 2 ........................................................270
Table 6.5: Results for Qn 9a(ii) and Qn 9a(iii) - ‘Current conservation within a
parallel branch’ .......................................................................................271
Table 6.6: Results for Qn 5(a) and Qn 7(a)...............................................................271
Table 6.7: Mental models in Qn 7 - ‘Increasing the variable resistance’ ...................272
Table 6.8: Models for Qn 6: ‘Adding an equal resistance in series’ ..........................273
Table 6.9: Mental models for Qn 7 and Qn6 ............................................................273
Table 6.10: Results for Qn8 .......................................................................................274

18
Table 6.11: Comparing models for Qn 10 and Qn 11 .................................................275
Table 6.12: Results for Qn 12(a) and Qn 12(b) ..........................................................276
Table 6.13: Results for Qn 12(c) and 12(f).................................................................276
Table 6.14: Results for Qn 13 and Qn 14 ...................................................................277
Table 6.15: Voltmeter predictions to Qn 15 - ‘equal parallel resistors’ .......................278
Table 6.16: Voltmeter predictions to Qn 16 - ‘unequal parallel resistors’ ...................278
Table 6.17: Comparing models of voltage in Qn15 and Qn16 - ‘resistors in
parallel’...................................................................................................278
Table 6.18: Frequency of answers to Qn 17b(ii).........................................................279
Table 6.19: Students’ ways of explaining the ‘electron experience’............................282
Table 6.20: Results of Qn 4(a) and Qn 4(d) on the post-test .......................................286
Table 6.21: Results for Qn 4(c) and Qn 4(f) on the post-test ......................................286
Table 6.22: Results for Qn 1(a) and Qn 1(b) on the post-test......................................287
Table 6.23: Comparing models in Qn 1 and Qn 9’(a) .................................................288
Table 6.24: Results for Qn 6 ......................................................................................288
Table 6.25: Results for Qn 8 in the post-test...............................................................289
Table 6.26: Models for Qn 6 and Qn 8 in the post-test ...............................................290
Table 6.27: Models for Qn 15 and Qn 16 in the post-test ...........................................291
Table 6.28: Models for Qn 15 and Qn 16 on the pre-test ............................................291
Table 6.29: Answers to Qn 18....................................................................................292
Table 6.30: Answers to Qn 12’(b) and (c) relating to p.d. across connecting wires .....293
Table 6.31: Frequency of answers to Qn 17’b ............................................................293
Table 6.32: Performance on part Qn 17: ‘p.d. across an open switch’.........................294
Table 6.33: Answers to Qns 4(a) and 4(d) on the delayed post-test ............................296
Table 6.34: Answers to Qns 4(c) and 4(f) on the delayed post-test .............................296
Table 6.35: Comparing answers to Qn 4(a) on the post-test and delayed post-test ......297
Table 6.36: Comparing answers to Qn 4(f) on the post-test and delayed post-test.......297
Table 6.37: Comparing Qn 1 - ‘Current at points a and b’ on the post- and delayed
post-test ..................................................................................................297
Table 6.38: Qn 1 and Qn 9’a on the delayed post-test ................................................298
Table 6.39: Qn 6(a) and 6(b) on the delayed post-test ................................................298
Table 6.40: Comparing models in Qn 6 on the post- and delayed post-test .................299
Table 6.41: Answers to Qn 8 on the delayed post-test ................................................300
Table 6.42: Models in Qn 6 and Qn 8 on the delayed post-test ...................................300

19
Table 6.43: Frequency of answers to Qn 12’(a) on the delayed post-test ....................301
Table 6.44: Comparing answers for Qn 12’(c) on the post- and delayed post-test.......301
Table 6.45: Comparing models in Qn 16 on the post-test and delayed post-test..........302
Table 6.46: Frequency of predicted voltages for equal parallel resistances in Qn 15...302
Table 6.47: Frequency of predicted voltages for unequal parallel resistances in
Qn 12......................................................................................................302
Table 6.48: Comparing answers for Qn 17’(b) on the post- and delayed post-test.......303
Table 6.49: Mean scores and standard deviations for all Physics Diagnostic Tests
(PDTs) (all questions asked)....................................................................305
Table 6.50: Mean scores and standard deviations of PDTs (common questions
only) .......................................................................................................306
Table 6.51: Comparing the differences in pairs of test scores between the two
cohorts ....................................................................................................306
Table 6.52: Means as a percentage for the question groups in all tests........................307

20
List of Figures
Figure 2.1: The relation between analogy and model...................................................38
Figure 2.2: Children’s models for current in simple circuits ........................................44
Figure 2.3: Variations of popularity of some conceptual models for current ................46
Figure 2.4: Predicting the relative brightness of the bulbs............................................49
Figure 2.5: Resistance in complex circuits...................................................................49
Figure 2.6: Students’ representation of a simple electric circuit by utilizing the
GIVE-schema ...........................................................................................51
Figure 2.7: Predicting the brightness of identical bulbs when the switch is closed .......52
Figure 2.8: Students’ intuitive reasoning pattern: agent - instrument - object ...............56
Figure 2.9: Cognitive states learning route ..................................................................62
Figure 2.10: Using discrepant events and analogies to help in the evolution of a new
model........................................................................................................63
Figure 2.11: Linear and cyclical causal models of how a simple circuit works...............66
Figure 2.12: From electrostatics to electrodynamics ......................................................69
Figure 2.13: From electrodynamics to electrostatics ......................................................70
Figure 2.14: Fields inside and surrounding current carrying conductors ........................71
Figure 2.15: Building up of surface charges after connecting a complete circuit............72
Figure 2.16: Linear density distribution of surface charges on a rectilinear conductor ...73
Figure 2.17: Distribution of surface charges for curvilinear conductors .........................73
Figure 2.18: Surface charges on a circuit with one resistor ............................................74
Figure 3.1: An outline of the research strategy used in this study.................................80
Figure 3.2: The time frame for instruction and data collection (1st cycle)...................105
Figure 4.1: Students’ pre-test marks ..........................................................................113
Figure 4.2: Qn 4 - ‘Microscopic views of circuit’ ......................................................117
Figure 4.3: Qn 1 - ‘Current at points (a) and (b)’ .......................................................120
Figure 4.4: Qn 2 - ‘Current using two ammeters’ ......................................................122
Figure 4.5: Qn 9 - ‘Current conservation at junctions and within a parallel branch’ ...124
Figure 4.6: Qn 5 - ‘Use of a larger resistance’ ...........................................................128
Figure 4.7: Qn 7 - ‘Increasing the variable resistance’ ...............................................130
Figure 4.8: Qn 6 - ‘Adding an equal resistance in series’...........................................132
Figure 4.9: Qn 8 - ‘Adding an equal resistance in parallel’ ........................................135
Figure 4.10: Qn 10 - ‘Increase of the supply voltage indicated numerically’................139

21
Figure 4.11: Qn 11 - ‘Connecting another battery in series’.........................................140
Figure 4.12: Qn 12 - ‘p.d. across resistances and ideal connecting wires’ ....................142
Figure 4.13: Qn 13 - ‘p.d. across equal resistances in series’ .......................................145
Figure 4.14: Qn 14 - ‘p.d. across unequal resistances in series’ ...................................145
Figure 4.15: Qn 15 - ‘p.d. across equal parallel resistors’ ............................................148
Figure 4.16: Qn 16 - ‘p.d. across unequal parallel resistors’ ........................................151
Figure 4.17: Qn 17 - ‘p.d. across an open and closed switch’ ......................................154
Figure 4.18: Qn 3 - ‘Picture of battery and bulb’ .........................................................164
Figure 4.19: Mental models in pre-test and post-test for Qn 6 - ‘Adding an equal
resistance in series’ .................................................................................167
Figure 4.20: Mental models in pre-test and post-test for Qn 8 - ‘Adding an equal
resistance in parallel’...............................................................................170
Figure 4.21: Qn 12’ - ‘p.d. across resistances and ideal connecting wires’...................172
Figure 4.22: Responses to Qn 12’(a) - ‘p.d. across equivalent points’..........................173
Figure 4.23: Qn 18 - ‘p.d. across a resistor, adding another resistor in parallel’ ...........174
Figure 4.24: Qn 19 - ‘Addition of a battery in parallel with the first: Voltmeter
reading’ ..................................................................................................175
Figure 4.25: Qn 20 - ‘Addition of a battery in parallel with the first: Ammeter
reading’ ..................................................................................................177
Figure 4.26: Qn 17’ - ‘p.d. across an open and closed switch’ .....................................180
Figure 4.27: Comparison of performance in part Qns 4(a) and 4(d) (all tests)..............187
Figure 4.28: Comparison of performance in part Qns 4(c) and 4(f) (all tests) ..............188
Figure 4.29: Mental models of current in Qn 1 - ‘Currents at points (a) and (b)’
(all tests) .................................................................................................189
Figure 4.30: Mental models of current in Qn 3 (all tests).............................................190
Figure 4.31: Comparing performance to Qn 9’(a) in post-test and delayed post-test ....191
Figure 4.32: Mental models in Qn 6 (all tests).............................................................192
Figure 4.33: Mental models in Qn 8 (all tests).............................................................193
Figure 4.34: Performance on Qn 18 – ‘p.d. across a resistor, adding another resistor
in parallel’...............................................................................................196
Figure 4.35: Qn 19 - ‘Addition of a battery in parallel with the first: Voltmeter
reading’ ..................................................................................................197
Figure 4.36: Qn 20 - ‘Addition of a battery in parallel with the first: Ammeter
reading’ ..................................................................................................198
Figure 4.37: Answers to Qn 17(b) – ‘p.d. across a closed switch’................................202
Figure 5.1: A simple circuit diagram .........................................................................210
22
Figure 5.2: Students’ ideas of how current forms in a closed circuit ..........................227
Figure 5.3: Circuit diagram showing resistances connected in series .........................229
Figure 5.4: Circuit diagram showing resistances connected in parallel.......................229
Figure 5.5: Two models of parallel circuits leading to two methods of tackling
parallel circuit problems..........................................................................235
Figure 5.6: Circuit diagram showing voltmeters connected across series resistors .....244
Figure 5.7: Circuit diagram showing voltmeters connected across parallel resistors...244
Figure 5.8: Circuit diagram showing voltmeters connected across the battery and
the switch................................................................................................254
Figure 5.9: Circuit drawing .......................................................................................262
Figure 6.1: Electron flow in an electric circuit...........................................................281
Figure 6.2: R-C circuit question used to help differentiate p.d. from current ..............284
Figure 6.3: The simple circuit diagram shown to students .........................................310
Figure 6.4: The circuit diagram shown to students adding a resistance in series.........312
Figure 6.5: The circuit diagram for an added resistance in parallel ............................312
Figure 6.6: Circuit with switch closed .......................................................................316
Figure 6.7: Circuit with switch open………………………………………….............316
Figure 7.1: Shipstone’s models of current in a hierarchy ...........................................322
Figure 7.2: Causal models of electric circuits suggested by Grotzer and Sudbury
(2000) .....................................................................................................324
Figure 7.3: A progression of models of electric circuits reported by Borges and
Gilbert (1999) .........................................................................................324
Figure 7.4: Introducing an intermediate model – ‘The symptoms of field
phenomenon’ ..........................................................................................326
Figure 7.5: A hierarchy of mental models of p.d........................................................330

23
Acknowledgements
This study would not have been possible without the encouragement of a
number of people to whom I would like to show my gratitude:
Prof. Robin Millar, my supervisor, for his continuous support, encouragement, guidance
and advice;
Prof. Judith Bennett, member of my Thesis Advisory Group for her advice, support and
comments;
Prof. Anton Buhagiar and Dr. Liberato Camilleri from the Faculty of Science at the
University of Malta, long time friends and colleagues, for their support when I needed it;
the technical staff at the College where I teach for helping to supply the required apparatus
during the time when I was conducting the interviews with students; and
the students of A Level Physics at the Sixth Form College involved in this study who
willingly participated in the various stages of this research and without whom this study
would not have been possible.
Last but not least, I would like to thank my close family members for their
continuous support, encouragement and understanding. Special thanks go to my children
who urged me to carry on with my thesis writing even when my health was not at its best.
I dedicate this work to my family including my mother and the memory of my
father.

24
Author’s Declaration
This thesis is an original unpublished study carried out by the undersigned,
which is being presented to the University of York for a Ph.D. degree.
Joan Borg Marks
B.Sc. (Hons.) M.A. (Loughborough) Dip.Ed.Adm.Mgmt.
December 2012
25
Chapter 1 Introduction
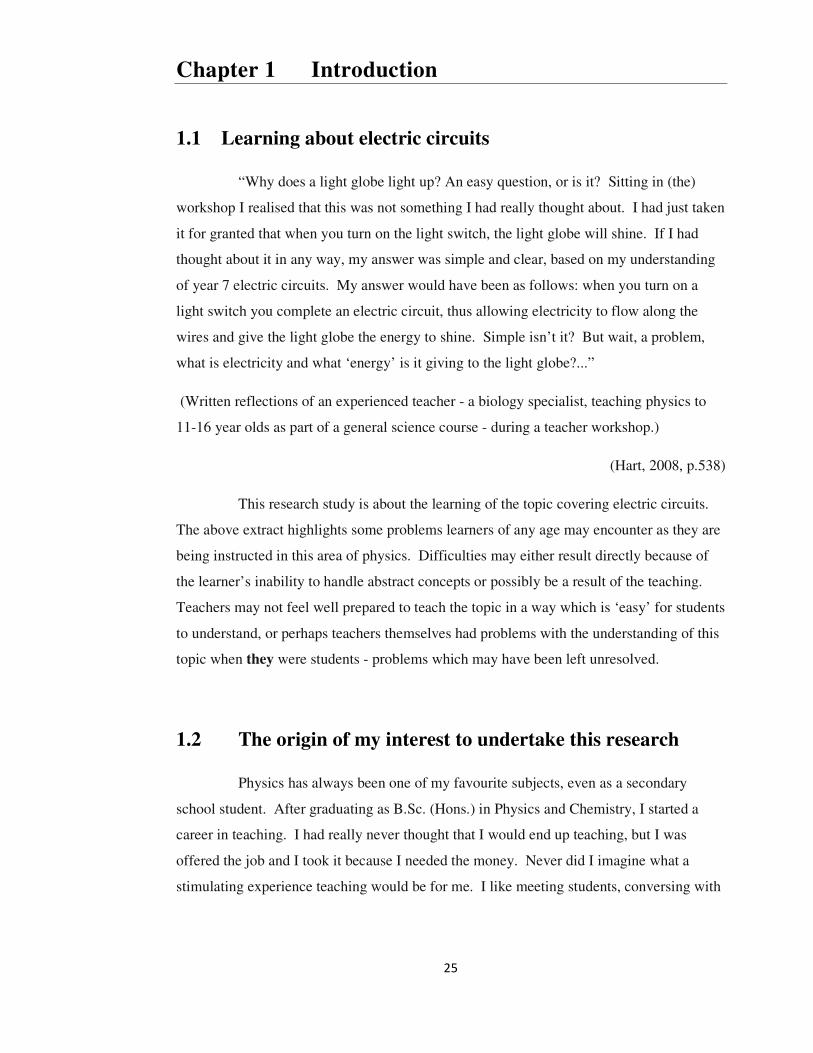
1.1 Learning about electric circuits
“Why does a light globe light up? An easy question, or is it? Sitting in (the)
workshop I realised that this was not something I had really thought about. I had just taken
it for granted that when you turn on the light switch, the light globe will shine. If I had
thought about it in any way, my answer was simple and clear, based on my understanding
of year 7 electric circuits. My answer would have been as follows: when you turn on a
light switch you complete an electric circuit, thus allowing electricity to flow along the
wires and give the light globe the energy to shine. Simple isn’t it? But wait, a problem,
what is electricity and what ‘energy’ is it giving to the light globe?...”
(Written reflections of an experienced teacher - a biology specialist, teaching physics to
11-16 year olds as part of a general science course - during a teacher workshop.)
(Hart, 2008, p.538)
This research study is about the learning of the topic covering electric circuits.
The above extract highlights some problems learners of any age may encounter as they are
being instructed in this area of physics. Difficulties may either result directly because of
the learner’s inability to handle abstract concepts or possibly be a result of the teaching.
Teachers may not feel well prepared to teach the topic in a way which is ‘easy’ for students
to understand, or perhaps teachers themselves had problems with the understanding of this
topic when they were students - problems which may have been left unresolved.
1.2 The origin of my interest to undertake this research
Physics has always been one of my favourite subjects, even as a secondary
school student. After graduating as B.Sc. (Hons.) in Physics and Chemistry, I started a
career in teaching. I had really never thought that I would end up teaching, but I was
offered the job and I took it because I needed the money. Never did I imagine what a
stimulating experience teaching would be for me. I like meeting students, conversing with
26
them and helping them with ideas which impede their understanding. At the same time, I
feel that I have learned so much from my students as well.
My interest in science education came much later when I started attending a
course in educational administration and management. This opened for me, many more
interesting aspects of teaching and the psychology of education. I became interested in
how students learn and I was intrigued with what could be done to help students in their
journey towards scientific views.
Reading and researching for my M.A. in education studies gave me the
possibility to back up the views, gained from my teaching experience, about how all
students need to be motivated to learn. The importance of the teacher’s role as a catalyst
for students’ progress towards achieving meaningful learning became one of my strongest
beliefs. As much as possible, I tried to involve my students in hands-on and minds-on
activities that would improve their meta-cognitive awareness of what they knew and what
they were failing at. Moreover, my M.A. thesis about gifted education strengthened my
feeling that by observing all students, one could gauge the understanding of students’
specific learning problems on the one hand, while recognising the levels students may
attain when properly guided and motivated to learn, on the other.
The years have rolled by, and I now find that I have been teaching Physics at
various levels, except at primary level, for the last 38 years. I have taught advanced level
Physics for these last 29 years. At the college where I teach, the syllabus is divided into
sections and teachers are asked to teach a particular section by the co-ordinator, as the need
arises. Teachers may also opt to ask for a particular topic to teach, but it is always the co-
ordinator who makes the final decision of who teaches what. It was some time before I
started my Ph.D. work that I realised that I was being given the electricity section of the
syllabus to teach, year in, year out, when in previous years topics had been assigned to
members of the department on a rotation basis. It was the same story for another three
members of staff. It seemed that none of the other teachers were interested in teaching this
topic. I started to get the feeling that some teachers, like some of the students I teach, may
not particularly like electricity enough to want to teach it to others. At the same time the
co-ordinator thought that the job was being done effectively by the teachers, including
myself, already teaching electric circuits. My opinion was slightly different. Each year
new students exposed the same unscientific ideas through class discussions, showing they
experienced the same difficulties in learning the topic. Even if I put all my effort to try and

27
teach circuits effectively, these difficulties seemed to trouble the students more than
difficulties they encountered as they learned other sections of the physics syllabus. Some
students declared this explicitly, complaining until the end of the scholastic year about
problems with grasping the meaning of key concepts related to circuits.
Until this time, I had never read books or journal articles related to students’
alternative ideas about electric circuits. Even if I had gathered a store of insights into
students’ ‘misconceptions’, I was not yet aware that those about electricity were so
widespread. These lifetime experiences made me realise that I should do something to
learn more about why so many people perceive electricity as a difficult topic even after
instruction, even if I myself could not recall that I had ever experienced the same problems
with learning this topic. I thus embarked on this research study with the aim of
understanding how students think about electric circuits, by probing the ideas students use
when asked to explain or predict the behaviour of a circuit. This would help to identify
specific points that many students find difficult, and hence to think about how I might
modify my teaching to help more students get over these difficulties. I thought that by
trying out some simple teaching activities which are not what I usually do with students, I
would perhaps see how effective these would be in helping more students make learning
more meaningful.
1.3 General issues which may hinder learning of electric
circuits
A lot of research has been conducted in this area, over the last 30 years, showing
researchers’ interests to improve the teaching and learning of electric circuits. This
research corroborates my professional knowledge that this is a difficult topic for many
students. The research has identified some specific learning challenges for students, and
has suggested some teaching approaches that might help to overcome them. Yet, in spite
of this, many people still readily admit that their understanding of circuits is not deep, even
after instruction. If students are just trained to use equations to solve numerical examples,
and to recall information to get them through an examination, then providing qualitative
explanations to questions dealing with circuits becomes difficult (see Mazur, 1997). Often,
retention of the learnt material is poor (Fleer, 1994), even if students manage to pass
examinations. Such occurrences should make all educators think about whether we are
28
actually teaching students to counterfeit understanding. While this may be said with
reference to all topics, it seems even more relevant when abstract concepts are involved,
and when learners do not easily relate with scientific mental representations.
Another point which cannot be ignored but which is, unfortunately, often
sidelined by teachers, perhaps due to time constraints in covering the syllabus, is that
young students come to class with pre-instruction ideas which are heavily influenced by
previous personal experience. At the same time, older students may come with partly
remembered ideas from earlier years. We know that to be meaningful, new material must
be related to existing knowledge. Ausubel (1968) claims: “The most important single
factor influencing learning is what the learner already knows. Ascertain this and teach him
accordingly” (p. vi). Halloun and Hestenes (1985a, 1985b), in referring to the learning of
mechanics, also claim that students’ initial knowledge has a large influence on students’
performance in physics. There is a clear indication, therefore, that students’ initial
knowledge has to be taken into account during instruction. This, however, can only be
done effectively when teachers are aware of the ideas students hold, and know what to do
to improve learning. Halloun and Hestenes (1985a) and Aguirre (1988) point towards the
need for teachers’ awareness of students’ alternative conceptions, to be able to design
effective instructional strategies. Yet, how far are teachers aware of students’ alternative
ideas related to circuits? Do teachers discover and tackle students’ recurring difficulties in
this area of physics, systematically? How far is research used to inform practice?
Reflecting on these questions, while knowing of the persistent problems with
students’ understanding, indicated the need for more systematic research aimed both at
helping students with their understanding in this area and at offering teachers a unified
approach which may make their teaching more effective.
1.4 The development of understanding in terms of mental
model evolution
A number of authors have claimed that models and modelling are central to
understanding key concepts in science (see for example Clement, 1989; Duit & Glynn
(1996); Gilbert & Boulter, 1998). This study looks into the difficulties students have in
understanding electric circuits, exploring whether students have ideas about circuits which
might suggest that they have mental representations, or models, of aspects of circuits

29
which underpin the predictions students make and the explanations they offer for their
predictions. Students’ understanding of electric circuits is thus viewed by this study in
terms of the students’ ability to use their mental representations in predictions and
explanations of how and why the circuit functions. As understanding develops, this
involves changes in the mental models held by the learner. The development of
understanding is seen as a matter of replacing previous mental models with ones that come
closer to the scientific model. Knowing about the mental models students may hold as
learning is in progress was used in this study as an aid to understand students’ learning
pathways during instruction about electric circuits and a way which allows for better
planning for more effective instruction.
1.5 Key ideas needed to understand how electric circuits
work
One of the most basic ideas required for the understanding of how the simple
electric circuit operates concerns what constitutes an electric current in a closed loop.
Understanding how current is generated in the circuit is also important. Resistance and
how it controls the current together with the battery must be understood. Furthermore,
students are expected to be able to grasp the meaning of p.d./voltage. They must
acknowledge that, while there can be no current without having a p.d. across the battery
terminals, it is when the current flows that a p.d. is established across resistors in the
circuit.
On top of all this, these separate ideas have to be amalgamated, so that the
circuit can be viewed as a system, where all the parts are working together, with changes
made to one part of the circuit affecting the system as a whole.
These key ideas are expected to develop as teaching progresses and as students
reflect about what they are taught and what they may observe during demonstrations,
practical sessions, and indeed even during everyday life experiences.

30
1.6 The context of the study
1.6.1 Introduction
This study was carried out with students attending a post-secondary college in
Malta. It is therefore appropriate to first look at the teaching content regarding electric
circuits used at the various levels of schooling in Malta. Some details will then be
presented about the entry requirements to study at the college where this research was
conducted, and about learning practices in Malta, with particular reference to science
learning.
1.6.2 The teaching content of electric circuits
A look at the Physics syllabi at various levels shows that at present, in Malta, the
study of electricity is formally introduced at primary level (Directorate for Quality and
Standards in Education (Malta), 2012). Young students are expected to understand, at
least, that many things need a source of electrical p.d. in order to work, that a complete
circuit is required to make a bulb light, that electricity may not only be converted to light
but also to other forms of energy and that a switch can be used to start or stop a current.
At secondary level, students opting to study Physics cover a comprehensive
syllabus (see Appendix 1) which introduces them to ideas about both static and current
electricity. Students are made aware of positive and negative charges and of current
conservation in a circuit. Resistances in series and in parallel are considered and students
are taught how the sum of the potential differences across series resistors is equal to the
battery voltage, and how the p.d. across parallel resistors is equal to the p.d. across battery
terminals. The suggestion is that current and p.d. are introduced through measurements of
meter readings. A qualitative description of these terms is also expected, together with an
explanation of how p.d., current and resistance are related.
Potential difference (p.d.) seems to be covered rather superficially indicating that
curriculum developers are aware that p.d. (or voltage) is a difficult concept to understand,
which may be dealt with in more detail with older students at a higher level. Emphasis is
put on everyday life experiences, with an experimental approach being suggested by the
syllabus. Some websites aimed at promoting the use of multimedia during teaching are
also indicated.
31
At advanced level, current electricity is covered in more depth (see Appendix 2),
usually after students have been instructed in static electricity. Current is introduced as the
primary concept. Reference is now made to how freely moving charges form the current.
Electromotive force (e.m.f.) is defined and p.d. is explained in terms of work done per unit
charge. Use is made of Ohm’s law and potential division is considered. Factors affecting
resistance and how resistance changes may be made in a circuit are also included in the
study unit, together with ideas related to energy supply and consumption. At this level,
although students are expected to be able to deal with both qualitative and quantitative
problems dealing with current, p.d. and resistance, the syllabus does not indicate ways to
make ideas more concrete and clearer for the learner. It is left up to individual teachers to
devise ways of presenting key concepts to students in ways that help learning to progress.
1.6.3 Entry requirements to study at the post-secondary college
This research study was conducted with students in their second year of study,
attending a post-secondary college in Malta. Since I teach Physics at this college, all data
were collected with the help of students attending my classes at advanced level during the
years of the research. I was thus teacher/researcher for my groups.
To study at the college, students require good passes at Secondary Education
Certificate (SEC) level or, when applicable their equivalent, in at least 6 subjects. These
must include English, Mathematics, Maltese, Physics or Chemistry or Biology, and any
other two subjects. This means that students can study physics at advanced level without
being in possession of a certificate at SEC level, but in practice this does not often happen.
It is the policy of the college to allocate students randomly to different groups.
Students follow a two year course. They then sit national examinations to obtain the
Matriculation Certificate, allowing them to enter University. Students sit six subjects
chosen from four areas of study. The choice of subjects must include a language, a
humanities or a business subject, mathematics or a science subject, and any other two
subjects. The sixth subject is compulsory - Systems of Knowledge. This subject
introduces the students to an appreciation of different forms of art, literature and
technology. Students must study two subjects at advanced level and four subjects,
including Systems of Knowledge, at intermediate level. The intermediate level for any
subject is rated roughly a third of an advanced level.

32
1.6.4 Teaching and learning practices in Malta
It may be helpful at this stage, to also briefly describe teaching and learning
practices in Malta.
Malta has always striven to provide a quality education for its students. In
recent years the emphasis has been to try and instil creativity in our students and adopt
teaching and learning processes which move away from the traditional transmission of
knowledge to an inquiry based approach, with the learner in centre stage (see Ministry of
Education (Malta), 1999; Ministry of Education, Youth and Employment (Malta), 2005;
Ministry of Education, Employment and the Family (Malta), 2011)
This does not, however, mean that Malta can now boast of an ideal education
system. A lot still needs to be done. Indeed, in spite of a number of reforms, Vanhear
(2010), amongst others, complains that many local students have been conditioned to
become passive learners. Professor Roger Murphy from the University of Nottingham,
who has been involved in studies and recommendations about how the Maltese system of
examinations can be improved, is quoted by Chetcuti (2011) saying that he still believes
that much of the teaching in Malta imparts factual knowledge rather than improving
reasoning and thinking skills. Furthermore, the performance in Science of Maltese
students in Grade 8 (Form 3 in Malta) in the ‘Trends in International Mathematics and
Science Study’ (TIMSS) carried out in 2007 was not very encouraging. Maltese students
ranked 30th
out of 49 countries (The Times (Malta), 2008; MASE (Maltese Association of
Science Educators), 2009). MASE felt the need to comment on students’ performance and
made a number of recommendations public, amongst them one indicating the need to focus
on science syllabi which deal with current issues in science, with the aim of making
science more attractive for students. MASE also pointed to the importance of reducing
recall of information and memorization of facts, while promoting reasoning and active
student participation (MASE (Maltese Association of Science Educators), 2009).
It seems that even if in theory we seem to know what makes a good education
system, yet, looking more closely at the details, the indication is that more needs to be
done in the classroom to improve the effectiveness of the teaching.

33
1.7 A brief look at the research strategy adopted
Teaching at the same college where the research was going to be conducted
made it possible for me to make cyclic research evaluations and improvements in my
teaching methods with different groups of students, in successive school years. Action
research or ‘classroom research by teachers’ (Hopkins, 2008, p. 58) was thus seen as the
best way to undertake the research, since research plans could be revised and new plans
could be put into action upon reflection.
The plan was thus to start my research with a first group of students (Cohort 1),
reflect on the results, and re-plan for how to proceed with the teaching and research with a
second group (Cohort 2) a year later, with the aim of improving learning outcomes.
Guided by the literature review related to electric circuit studies, the idea was to
have students answer diagnostic tests questions about electric circuits, before the course of
study, after the course, and also some time later, probing the mental models of the electric
circuit which students seem to use as they learn the topic. Interviews with students were
also planned, allowing for more in-depth probing of their ideas. In the analysis of the data,
emphasis would be put on the reasons students give for their answers to diagnostic
questions, as well as what students say during discussions with the researcher and other
students in class time. Meaning would thus be given to students’ ideas in terms of mental
models implied by their answers and explanations.
1.8 Overview of the thesis
Following on from this chapter, Chapter 2 reviews the research literature on the
learning and teaching of electric circuits. Some studies which have shown students’
misunderstandings in this area are discussed and others suggesting methods of teaching to
improve understanding are also reviewed.
Chapter 3 outlines the research strategy and explains the details of methods
adopted and instruments used in the research with Cohort 1. Justification of what was
done is provided. Teaching activities used with Cohort 1, over and above what is normally
done during class-time, are indicated. These additional teaching activities were included to

34
help students reflect more on their learning, directing students towards improving their
visualization of how the electric circuit functions.
Chapter 4 analyses the performance of Cohort 1 on the physics diagnostic tests
which were developed for this study. The results of the tests are compared to see whether
students’ views moved towards scientific ideas as teaching was in progress, and to check
retention of these ideas, one month later. Specific problems which seemed responsible for
the lack of understanding of key concepts are pointed out.
Chapter 5 analyses interviews conducted with nine students of different abilities
from Cohort 1, with the aim of getting a clearer picture of students’ views and the mental
models implied by these. Ideas were probed to try to understand the difficulties students
had indicated by the pre-test responses.
Chapter 6 then describes the teaching of Cohort 2 and analyses the progress in
students’ understanding. Reflections on the results obtained with Cohort 1 brought about
changes planned in the teaching activities used with Cohort 2. Reasons for these changes
are explained. Pre-test results are compared with those from Cohort 1 and changes in
students’ understanding indicated by the post-test and delayed post-test results are analysed
to see by how far the revised teaching activities had led to improvement in students’
learning. Interviews conducted with some students from Cohort 2 are used to highlight
possible reasons for students’ persisting difficulties.
Chapter 7 reflects on how far the research questions have been answered by the
study. A discussion is presented comparing and contrasting the results from this work with
those from some previous studies, with the aim of highlighting important issues
contributing to knowledge. A model of how students’ thinking progresses as a sequence of
mental models is proposed. The strengths and weaknesses of the study are discussed and
suggestions are made for future work.
35
Chapter 2 Literature Review
2.1 Introduction
Students find the topic of current electricity difficult to learn. This is not just my
personal experience, but has been highlighted by many research studies conducted in the
area of the study of electric circuits (see, for example, Clement, 2008a; Clement &
Steinberg, 2002; Engelhardt & Beichner, 2004; Shipstone, 1985b). It is not surprising that
the literature related to this topic is vast (see, for example, Duit, 2009), showing
researchers’ interest to try to understand students’ problems, to find reasons for why these
result and to find a solution to improve learning.
Indeed, at the early stages of this work, my main idea was to find out what
makes so many students say that current electricity is a difficult topic, and why many
actually experience this difficulty, never quite grasping the meaning of the key concepts
involved or becoming able to use them in explaining observations and making predictions.
Through the teaching of the topic, I was already aware of some problems which hindered
students’ learning, but it was by reviewing the literature about electric circuits that I
realised that these problems with understanding were so common. The review of the
literature helped to show what methods other researchers had used to understand students’
specific learning problems. It also indicated ways of teaching the subject suggested by
other researchers. It exposed students’ intuitive ideas and alternative conceptions about
key concepts which other researchers had identified by their work. All this information
helped in the planning stages of this work, and while carrying out this study. At the same
time, reviewing the literature helped to indicate any gaps that might be filled by future
research.
This chapter first looks at some general issues concerning the development of
ideas for understanding. Since the literature refers to a number of studies related to circuits
which explain how students’ understanding can be gauged according to the mental models
students hold, some researchers’ views on the term ‘mental models’ are first considered.
The relation between mental models and analogies is then discussed. Further sections look
at specific issues related to the literature about the topic of electric circuits. Some studies
which focus on common misunderstandings that students develop are reviewed. This is

36
followed by a discussion about why learning in this area is perceived as difficult, and what
methods have been suggested by researchers to improve understanding.
2.2 The development of ideas for understanding
2.2.1 Mental models and modelling
Many authors have claimed that models and modelling are central to
understanding key concepts in science (Coll & Lajium, 2011; Clement, 1989; Duit &
Glynn, 1996; Gilbert & Boulter, 1998; Harrison & Treagust, 2000; Ramadas, 2009).
While the term ‘model’ is used with a variety of meanings (Duit, 1991), this study refers
specifically to mental models. Hestenes (1992) emphasizes the importance of mental
models, referring to “a promising new approach to physics instruction in which students
are taught from the beginning that in science modelling is the name of the game" (p. 732).
Whether we realise it or not, we all make use of mental representations to help
us gauge our understanding. Rouse and Morris (1986) claim that “it is a common assertion
that humans have ‘mental models’ of the systems with which they interact. In fact, it is
hard to explain many aspects of human behaviour without resorting to a construct such as
mental models” (p.349).
Johnson-Laird (1983) goes further into the details of explaining the nature of
mental models, thus:
Mental models play a central and unifying role in representing objects, state of
affairs, sequences of events, the way the world is, and the social and
psychological actions of daily life. They enable individuals to make inferences
and predictions, to understand phenomena, to decide what action to take and to
control its execution, and above all to experience events by proxy; they allow
language to be used to create representations comparable to those deriving from
direct acquaintance with the world; and they relate words to the world by way of
conception and perception (p. 397).
Mental models are psychological representations of real, hypothetical, or
imaginary situations (Johnson-Laird et al., 1998). Coll, France and Taylor (2005) define
mental models as “human cognitive constructions used to describe and explain phenomena
37
that cannot be experienced directly” (p. 184). Greca and Moreira (2000), like Duit and
Glynn (1996), also claim that mental models refer to personal knowledge each of us builds
as we perceive the world. Mental models can thus be seen as intermediate steps we create
as our understanding develops towards views accepted by the scientific community.
Not all ideas are mental models. Mental models have a function and a purpose,
namely to help the individual describe, explain and make predictions of the physical
system represented by the mental model (Rouse & Morris, 1986). Mental models help us
refine our thoughts and understanding. Lind (1980) claims that “model building has been
an attempt to understand the invisible by depicting it” (p. 17). While some mental models
help us understand the ‘what’ of a system, others help us understand and give reasons for
‘why’ a system works in a particular way. The latter have been referred to as causal
models (Grotzer & Sudbury, 2000).
2.2.2 Relating mental models to analogies
Mental models are closely related to analogies. Coll et al. (2005) claim that
analogies are “a subset of (mental) models as they involve the comparisons between two
things that are similar in some respects. They are often used by scientists to explain
abstract science concepts as well as when they are developing the complexity of their
mental models” (p. 185).
There seems, however, to be some disagreement in the literature about how
analogies are related to models. Coll and Lajium (2011), and Mozzer, Justi and Costa
(2011) seem to look at models as analogies. On the other hand, other authors like Clement
(2009), see analogy as a tool which can help model development.
Duit and Glynn (1996) claim that “analogies are at the heart of modelling”
(p. 166). Figure 2.1 shows how Duit (1991) links analogical reasoning to modelling. An
individual may already have a mental model of the analogue. By comparing elements of
the analogue to those of the target, a mental model of the target is built, helping the
development of ideas and understanding. This is how the relation between mental model
and analogy is viewed by the present study.
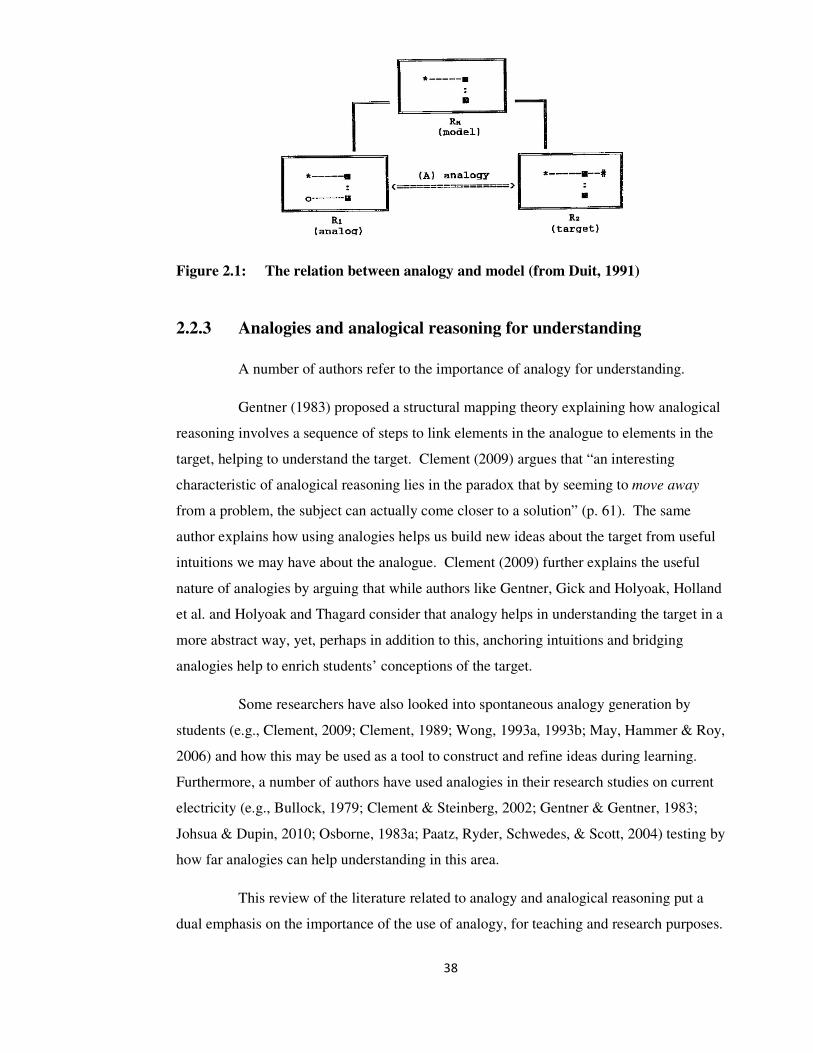
38
Figure 2.1: The relation between analogy and model (from Duit, 1991)
2.2.3 Analogies and analogical reasoning for understanding
A number of authors refer to the importance of analogy for understanding.
Gentner (1983) proposed a structural mapping theory explaining how analogical
reasoning involves a sequence of steps to link elements in the analogue to elements in the
target, helping to understand the target. Clement (2009) argues that “an interesting
characteristic of analogical reasoning lies in the paradox that by seeming to move away
from a problem, the subject can actually come closer to a solution” (p. 61). The same
author explains how using analogies helps us build new ideas about the target from useful
intuitions we may have about the analogue. Clement (2009) further explains the useful
nature of analogies by arguing that while authors like Gentner, Gick and Holyoak, Holland
et al. and Holyoak and Thagard consider that analogy helps in understanding the target in a
more abstract way, yet, perhaps in addition to this, anchoring intuitions and bridging
analogies help to enrich students’ conceptions of the target.
Some researchers have also looked into spontaneous analogy generation by
students (e.g., Clement, 2009; Clement, 1989; Wong, 1993a, 1993b; May, Hammer & Roy,
2006) and how this may be used as a tool to construct and refine ideas during learning.
Furthermore, a number of authors have used analogies in their research studies on current
electricity (e.g., Bullock, 1979; Clement & Steinberg, 2002; Gentner & Gentner, 1983;
Johsua & Dupin, 2010; Osborne, 1983a; Paatz, Ryder, Schwedes, & Scott, 2004) testing by
how far analogies can help understanding in this area.
This review of the literature related to analogy and analogical reasoning put a
dual emphasis on the importance of the use of analogy, for teaching and research purposes.

39
Using analogy during the teaching could improve students’ development of understanding.
Allowing students to generate analogies as they explain their ideas would allow the
researcher to probe further into students’ ideas and the mental models which these ideas
suggest they may hold.
2.3 Students’ intuitive ideas
It is a common experience for teachers that students come to the classroom with
pre-set ideas about any topic. This undoubtedly includes the topic about circuits. We all
tend to formulate ideas about the world around us, depending on our experiences. Such
ideas are often referred to as ‘intuitive ideas’. The problem is that we may strongly believe
in these ‘intuitive ideas’ and yet they do not necessarily agree with accepted scientific
views. While some ideas develop as a result of experience, which may include teaching,
others are found to be very resistant to change and can “remain uninfluenced or be
influenced in unanticipated ways by formal science teaching” (Osborne, 1983a, p. 73).
Problems with learning will result as a consequence.
For more than two decades, students’ ideas in science, prior to formal
instruction, have become a major concern among researchers in science education.
Numerous studies have been published about students’ pre-instruction ideas on a large
number of topics (see Carmichael et al., 1990; Duit, 2009; Tsai, Chen, Chou, & Lain,
2007; Wandersee, Mintzes, & Novak (as cited in Lee & Law, 2001).
Students’ pre-instruction conceptions/ideas have been given different labels by
various researchers. Some have simply called them preconceptions (e.g., Novak (as cited
in Lee & Law, 2001) and others (e.g., Helm, 1980; McDermott & Shaffer, 1992) have
referred to them as misconceptions, to emphasize the disparity of ideas with the scientific
views. However, Driver and Easley (1978) preferred the term alternative frameworks/
conceptions, arguing that intuitive ideas make perfect sense to the students and that the
students cannot see them as wrong within their own knowledge structures. The neutral
term, children’s science, used by Gilbert, Osborne and Fensham (1982) and Osborne
(1983b), also has its significance in explaining that the child’s conceptions in question are
a result of his/her own thinking.
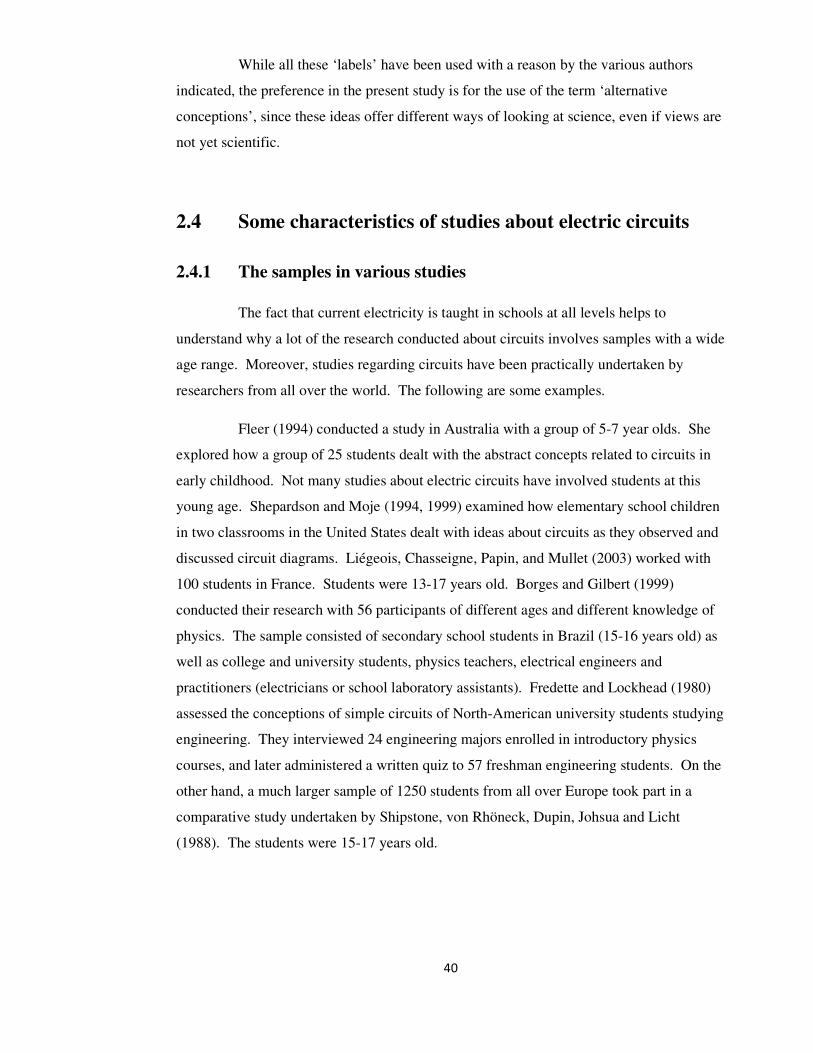
40
While all these ‘labels’ have been used with a reason by the various authors
indicated, the preference in the present study is for the use of the term ‘alternative
conceptions’, since these ideas offer different ways of looking at science, even if views are
not yet scientific.
2.4 Some characteristics of studies about electric circuits
2.4.1 The samples in various studies
The fact that current electricity is taught in schools at all levels helps to
understand why a lot of the research conducted about circuits involves samples with a wide
age range. Moreover, studies regarding circuits have been practically undertaken by
researchers from all over the world. The following are some examples.
Fleer (1994) conducted a study in Australia with a group of 5-7 year olds. She
explored how a group of 25 students dealt with the abstract concepts related to circuits in
early childhood. Not many studies about electric circuits have involved students at this
young age. Shepardson and Moje (1994, 1999) examined how elementary school children
in two classrooms in the United States dealt with ideas about circuits as they observed and
discussed circuit diagrams. Liégeois, Chasseigne, Papin, and Mullet (2003) worked with
100 students in France. Students were 13-17 years old. Borges and Gilbert (1999)
conducted their research with 56 participants of different ages and different knowledge of
physics. The sample consisted of secondary school students in Brazil (15-16 years old) as
well as college and university students, physics teachers, electrical engineers and
practitioners (electricians or school laboratory assistants). Fredette and Lockhead (1980)
assessed the conceptions of simple circuits of North-American university students studying
engineering. They interviewed 24 engineering majors enrolled in introductory physics
courses, and later administered a written quiz to 57 freshman engineering students. On the
other hand, a much larger sample of 1250 students from all over Europe took part in a
comparative study undertaken by Shipstone, von Rhöneck, Dupin, Johsua and Licht
(1988). The students were 15-17 years old.

41
2.4.2 The aims of some studies undertaken
The studies conducted on this topic have had different aims. Some of these are
outlined below.
• Some of the earlier works were directed at gaining insight into what individuals
understand by current (e.g., Psillos, Koumaras, & Valassiades, 1987; Shipstone, 1985b),
trying to put the different ideas into categories indicating the presence of different
mental models of current held.
• There were studies which aimed at establishing the meaning students give to potential
difference and voltage (e.g., Gunstone, McKittrick, Mulhall, & Case, 2001).
• Some studies were conducted with the aim of finding out more about whether intuitive
ideas depended on the age of participants in the study, also trying to establish whether
ideas about electricity are primarily dependent on development/cognitive processing or
teaching, or both (e.g., Dupin & Johsua, 1987; Monk, 1990; Asami, King & Monk,
2000).
• Deciding how and when students’ ideas could be developed and modified through the
schooling years was also an important aim (Osborne, 1983a).
• Other studies aimed at establishing students’ learning pathways, in terms of mental
models inferred when students explained their ideas (e.g., Niedderer, 2006; Niedderer &
Goldberg, 1994, 1996).
• Stocklmayer and Treagust (1996) probed images of electricity visualized by learners -
whether it is a mechanistic view of moving electrons (a view students usually hold) or a
field view (usually used by experts) - with the aim of discovering possible methods of
how the teaching of circuits could be approached.
• Some other researchers aimed at developing a more adequate curriculum in this area of
study by using the results of their research exposing students’ difficulties. Teaching
strategies were proposed to facilitate ways of developing students’ mental models,
leading students to look holistically at the electric circuit (e.g., Carlton, 1999;
McDermott & Shaffer, 1992; Shaffer & McDermott, 1992).
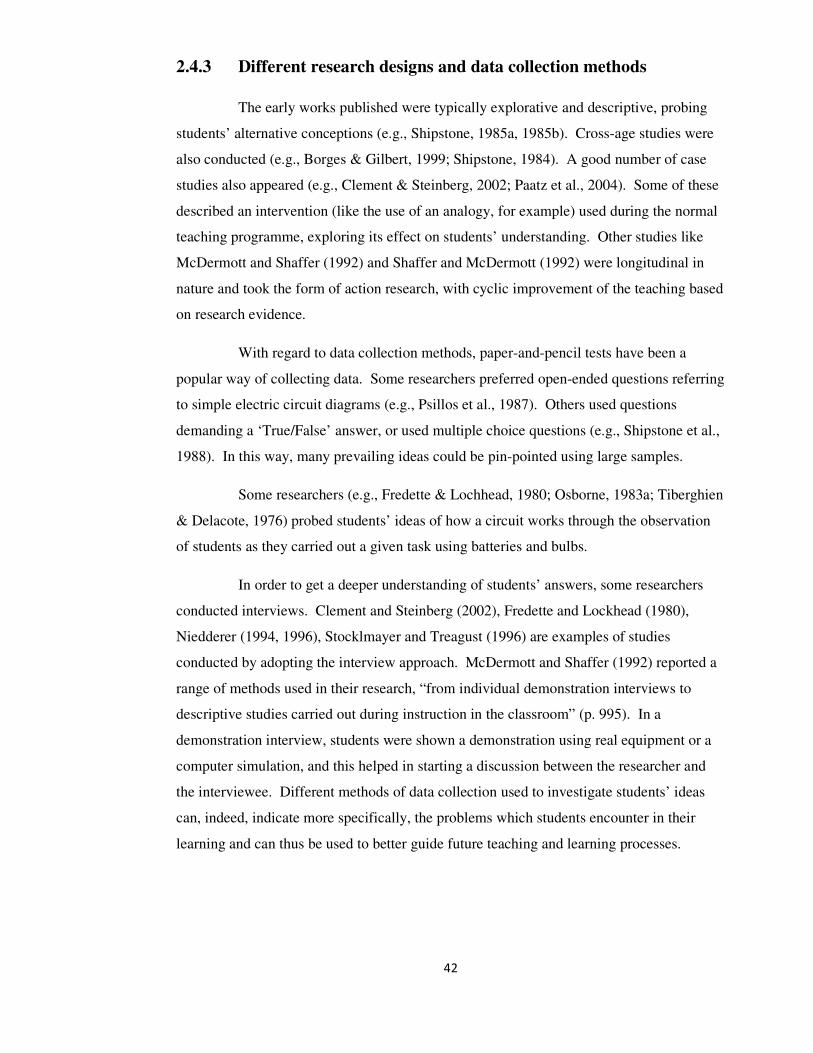
42
2.4.3 Different research designs and data collection methods
The early works published were typically explorative and descriptive, probing
students’ alternative conceptions (e.g., Shipstone, 1985a, 1985b). Cross-age studies were
also conducted (e.g., Borges & Gilbert, 1999; Shipstone, 1984). A good number of case
studies also appeared (e.g., Clement & Steinberg, 2002; Paatz et al., 2004). Some of these
described an intervention (like the use of an analogy, for example) used during the normal
teaching programme, exploring its effect on students’ understanding. Other studies like
McDermott and Shaffer (1992) and Shaffer and McDermott (1992) were longitudinal in
nature and took the form of action research, with cyclic improvement of the teaching based
on research evidence.
With regard to data collection methods, paper-and-pencil tests have been a
popular way of collecting data. Some researchers preferred open-ended questions referring
to simple electric circuit diagrams (e.g., Psillos et al., 1987). Others used questions
demanding a ‘True/False’ answer, or used multiple choice questions (e.g., Shipstone et al.,
1988). In this way, many prevailing ideas could be pin-pointed using large samples.
Some researchers (e.g., Fredette & Lochhead, 1980; Osborne, 1983a; Tiberghien
& Delacote, 1976) probed students’ ideas of how a circuit works through the observation
of students as they carried out a given task using batteries and bulbs.
In order to get a deeper understanding of students’ answers, some researchers
conducted interviews. Clement and Steinberg (2002), Fredette and Lockhead (1980),
Niedderer (1994, 1996), Stocklmayer and Treagust (1996) are examples of studies
conducted by adopting the interview approach. McDermott and Shaffer (1992) reported a
range of methods used in their research, “from individual demonstration interviews to
descriptive studies carried out during instruction in the classroom” (p. 995). In a
demonstration interview, students were shown a demonstration using real equipment or a
computer simulation, and this helped in starting a discussion between the researcher and
the interviewee. Different methods of data collection used to investigate students’ ideas
can, indeed, indicate more specifically, the problems which students encounter in their
learning and can thus be used to better guide future teaching and learning processes.

43
2.5 Literature on common misunderstandings about circuits
2.5.1 Electric Current
To the physicist, “electric current consists of a flow of charged particles”, and
“the magnitude of the current in a circuit is equal to the rate of flow of charge through the
circuit” (Muncaster, 1993, p. 534). The equation,
I = ∆Q / ∆t,
where I stands for the current in a circuit, ∆Q stands for the charge difference/transferred
and ∆t stands for the time interval during which this charge transfer occurs, offers a
mathematical explanation for what is current.
Young students, however, who have not yet had any lessons on the electricity
topic, start their schooling experience with the meaning of current which they derive from
everyday electricity talk. Duit and von Rhöneck (1998) claim that “it is possible to state
that the meanings of words for current in European languages are generally nearer to the
meanings of energy than to the current as used in Physics” (p. 50). This might be the result
of the visual experience of having a light bulb, for example, giving out light energy, when
a circuit is switched on. Such experiences make it possible to confuse current with energy.
The use of the general term ‘electricity’ may also provide the possibility of having students
thinking and talking of current without building the necessary model required for
understanding. Indeed, Shipstone (1988) warns that it is unwise to assume that when
children speak of ‘electricity’, then they have grasped the concept of current.
Shipstone’s work (1984, 1985b) was particularly instrumental in exposing
different ways in which students look at current in a simple circuit. Students may model
current using the ideas indicated by the diagrams in Figure 2.2.

44
Figure 2.2: Children’s models for current in simple circuits (from Shipstone,
1985b, p. 36)
These models of current are briefly explained below.
• The unipolar model (Figure a)
In this model, the return path may not be visualised, and if it is, then no current is seen in
it. Some students see this return path as a passive link. This model represents a source-
consumer model.
• The clashing currents model (Figure b)
In this model, current flows to the bulb from both terminals of the battery. This is an
extension of the previous model. “It represents a clear attempt to assimilate the necessity
for the second wire to a source-consumer model” (Shipstone, 1985b, p. 37).

45
• The attenuation model (Figure c)
There have been a good number of reports indicating the existence of this model.
McDermott and Shaffer (1992) report that it is common for students to think that the
current is ‘absorbed’ or ‘used up’ by the component through which it is passing and that
the direction of the current and order of the elements matter. Licht (1991), McDermott and
van Zee (1985) and Shipstone (1985b) also refer to students’ alternative conception of less
current downstream than upstream. Very much linked to this idea is the fact that students
tend to reason ‘locally’ or ‘sequentially’ about the effects of changes in an electric circuit
(Closset, 1983; Shipstone, 1984). If a variable resistor is altered, a change at one point in a
circuit is not necessarily seen as causing changes elsewhere in the circuit. Moreover, many
authors (e.g., Arnold & Millar, 1987; Engelhardt & Beichner, 2004; Fredette & Lockhead,
1980; McDermott & van Zee, 1985; Millar & King, 1993; Osborne, 1983a, 1983b;
Shipstone, 1984) have referred to how students tend to predict changes in meter readings
‘after’ the resistor but not before. Students may find it difficult to move away from the
sequential view. Shipstone (1985b) claims that:
the importance of the sequential model is underlined because of its high
incidence and persistence amongst able students who have specialised in
physics: it was found, for example, in 7 out of a group of 18 graduate physicists
and engineers who were training to be physics teachers (p. 42).
The sequential model has been referred to by Shipstone (1985b, 2002) as ‘a time
dependent model’ since students fail to see the current simultaneously everywhere in the
circuit when this is switched on, but think of the current as taking time to flow from one
component to the other.
• The sharing model (Figure d)
In a series connection made up of a number of equal components, the current is seen as
being shared equally. Two identical lamps will light up to the same brightness, for
example, but current is not regarded as conserved.

46
• The scientific model (Figure e)
Students look at the circuit like experts do and see the current in one direction being
conserved.
Shipstone (1984) reports that the popularity of the various models changes with
the pupils’ ages and experience. Figure 2.3 shows the results from his study conducted in
three 11-18 British comprehensive schools and one sixth form college.
Figure 2.3: Variations of popularity of some conceptual models for current
(Shipstone, 1985b, p. 39)
The results shown in the above graph are supported by Osborne (1983a) and
Dupin and Johsua (1987) who have shown that some students’ general understanding
improves with age and instruction. Eylon and Ganiel (1990) claim that mental models of
current “become more advanced: primitive models are abandoned in favour of more
scientific ones” (p. 79).
Millar and Beh (1993) say that to build a model of current, students need to base
their idea on two things:
• “the need for a closed loop; and
• the observation that current is the same at all points around the loop” (p.352).

47
Shepardson and Moje (1994) claim that to conceptually understand current in
simple electric circuits is a prerequisite to understanding conceptually more complex
electric circuits. This emphasizes the importance of having students grasp the meaning of
current as early as possible in their schooling, otherwise how can they be expected to learn
material related to this topic, based on a lack of conceptual understanding of fundamental
principles?
2.5.2 The function of the battery
A number of authors (e.g., Licht, 1991; McDermott & Shaffer, 1992;
McDermott & van Zee, 1985; Shipstone 1985b, 1988) have reported that many students
seem to believe that the amount of current supplied by a battery is always the same,
irrespective of the number of components there are in the circuit or the way these
components are connected. Steinberg and Wainwright (1993) refer to this as “battery
autonomy” (p. 354).
Moreover, Thacker, Ganiel and Boys (1999) also say that a common idea for
students is that “charges originate in the battery only” (p. S28). This is referred to as
‘battery origin’ (Cohen, Eylon & Ganiel, 1983; Steinberg & Wainwright, 1993). The
findings from Eylon and Ganiel (1990) and Gott (1985b) indicate that in such a case, the
wires are seen as playing no active role in current formation.
Eylon and Ganiel (1990) also claim that the battery may sometimes be seen “to
act like a ‘pump’, causing electrons already present in the wires, to circulate around the
circuit” (p. 91).
2.5.3 Resistance and resistance combinations
Psillos and Koumaras (as cited in Liégeois & Mullet, 2002) claim that “from the
physicist point of view, resistance is due to the friction of the moving electrons with the
conductor/resistor ions” (p. 553). The larger the friction, the smaller the electron flow and
therefore the smaller the current. The resistance of a resistor is constant at a constant
temperature.
Some students, however, find it hard to give a qualitative explanation of
resistance. Johnstone and Mughol (1978) say that since electrical resistance is not an
everyday topic which is usually discussed, students do not easily grasp the meaning of the

48
term. Understanding resistance can thus depend largely on teaching, which may not
emphasize enough that it is the resistance and the battery together which control the size of
the current in the circuit. In a longitudinal study conducted with 800 pupils of mixed
ability, taking students from middle secondary schools to sixth formers, Johnstone and
Mughol (1978) tested how teaching affected the understanding of resistance. The
researchers interviewed students in groups of 6, using circuit boards and other simple
apparatus through the interviews. In an effort to use a larger sample, they also set
diagnostic test questions based upon the circuit diagrams of the apparatus which was used
in the interviews. Some main conclusions from this work were that:
• the majority of students could relate large length of a wire to large resistance;
• most of the older students could relate cross-sectional area of a wire to its resistance;
• students up to age 16 seemed to say that a short, thin wire had the least resistance.
Thus, while ideas regarding length and cross-sectional area, taken separately
were shown to be well internalized by students, yet when it came to dealing with two
variables simultaneously, namely length and thickness, younger students’ intuitions were
too strongly influenced by the ‘more of A, more of B’ style of reasoning (see Andersson,
1986; Stavy & Tirosh, 1996). Students can easily become distracted when dealing with
more than one variable, falling back on their unhelpful intuitions.
Another problem some students encounter is related to the total resistance in a
circuit. The tendency is for students to focus on the number of components and not on the
circuit configuration. This was shown by McDermott and Shaffer (1992) who claim that
even ‘good’ students found it hard to correctly, predict the relevant brightness of the bulbs
in Figure 2.4, and explain their reasoning. One student - a prospective teacher - explained
that bulbs B, C, D, and E would be equally bright, but half as bright as A. With reference
to bulbs B, C, D, and E, the student referred to the battery of the same strength being used
on 2 identical bulbs. Thus reasoning was based on the number of bulbs per branch, rather
than on how they were connected, ignoring the relative resistance within each branch.
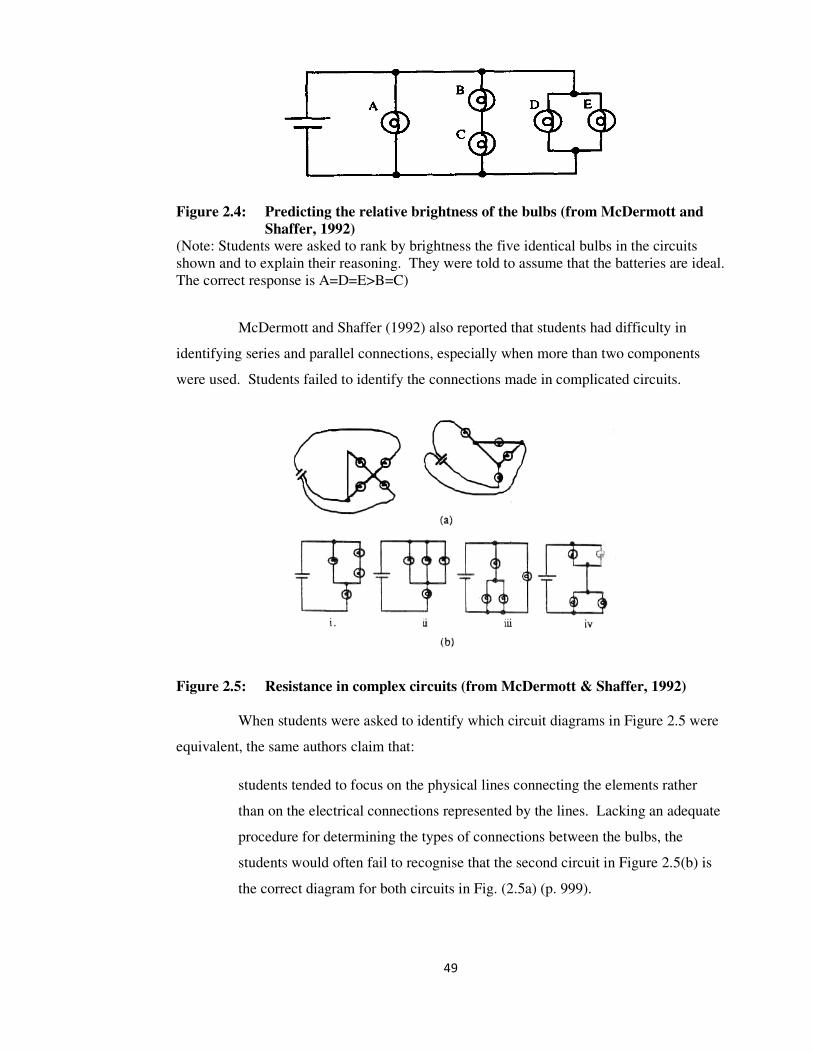
49
Figure 2.4: Predicting the relative brightness of the bulbs (from McDermott and
Shaffer, 1992)
(Note: Students were asked to rank by brightness the five identical bulbs in the circuits
shown and to explain their reasoning. They were told to assume that the batteries are ideal.
The correct response is A=D=E>B=C)
McDermott and Shaffer (1992) also reported that students had difficulty in
identifying series and parallel connections, especially when more than two components
were used. Students failed to identify the connections made in complicated circuits.
Figure 2.5: Resistance in complex circuits (from McDermott & Shaffer, 1992)
When students were asked to identify which circuit diagrams in Figure 2.5 were
equivalent, the same authors claim that:
students tended to focus on the physical lines connecting the elements rather
than on the electrical connections represented by the lines. Lacking an adequate
procedure for determining the types of connections between the bulbs, the
students would often fail to recognise that the second circuit in Figure 2.5(b) is
the correct diagram for both circuits in Fig. (2.5a) (p. 999).

50
The authors report that “some students would obtain a different answer each
time they attempted to solve the problem” (p. 999). This indicates confused ideas,
resulting in unstable reasoning related to how components are connected.
2.5.4 Potential difference/voltage and potential
Many researchers, amongst them Gunstone et al. (2001), Jung (1985a, 1985b)
and Liégeois et al. (2003) claim that the concept of potential difference is difficult to
master. Haertel (2008b) claims that the idea of potential remains rather vague and
potential difference is an extension of a vague concept. Liégeois et al. (2003) and Millar
and King (1993) claim that p.d. is not commonly dealt with in everyday life experiences
and this may be one of the reasons for the difficulty in understanding. Thus, the literature
points to a similar problem with p.d., as has already been mentioned in the case of
resistance.
Asking a student at secondary school level to explain p.d., he/she may resort to
stating the following definition: “The potential difference (p.d.) between two points in an
electric field is numerically equal to the work done in moving unit positive charge from the
point at the lower potential to that at the higher potential” (Muncaster, 1993, p. 575). But,
whether students can define p.d. or not, what meaning do they give to the term ‘potential
difference’?Duit and von Rhöneck (1998) indicate that some students relate p.d. to
‘strength of a battery’ or ‘intensity of force of the current’, before instruction. These
authors also say that, even after instruction, students use the p.d. concept in a way which
shows that they believe that it has the same properties as the current concept. Liégeois and
Mullet (2002) also claim that students and most non-professionals in the field tend “to
view electrical current as the origin of potential difference, and potential difference as a
mere measure of electric flow, more or less synonymous with intensity of current” (p.
553). Shipstone (2002) reported that 31% of the 232 students in his sample, consisting of
students from three 11-18 comprehensive schools and from a sixth form college in the
U.K., explained voltage in terms of ‘something which flows’.
Students are usually first instructed about current and this may be what makes it
easier for them to think primarily of current, rather than p.d., as they explain how circuits
work. Cohen et al. (1983) conclude that current is the primary concept used by students,
while p.d. is regarded as a consequence of current and not as its cause. McDermott and
Shaffer (1992) and Shaffer and McDermott (1992) claim that students are current minded

51
rather than voltage minded and tend to use the rules for current in series and parallel
circuits, when dealing with potential differences. Because of this emphasis on current,
students confuse cause and effect even in simple circuits (Cohen et al., 1983; Eylon &
Ganiel, 1990).
Maichle (1981) also refers to this misunderstanding related to current and
voltage, saying that “voltage is very often conceived as part, as quality or property of the
current or even as identical with the current” (p. 176). She describes how some students
think of the current as existing inside the battery and therefore the battery becomes the
‘giver’ of something - namely the current. In a study undertaken by the same author, 84%
of the secondary school children in a German Realschule, 85% of the secondary students
from the Gymnasium and 40% of the university students preparing to become physics
teachers, looked at current in this way. Students in the first two groups were 13 to 15 years
old. In what is termed as the GIVE-schema, the battery is seen as giving current to a bulb,
with the voltage becoming a property of the current. The current is thought of giving rise
to the voltage, and a ‘has’-relation is thus created, “which denotes the relation between a
concept and one of its parts or its properties” (Maichle, 1981, p.176). Figure 2.6 is a rather
crude representation of these ideas put together.
Figure 2.6: Students’ representation of a simple electric circuit by utilizing the
GIVE-schema (shown here as presented in Maichle, 1981)
Maichle’s (1981) study also shows that 59%, 71% and 40% of the respective
sample groups mentioned earlier, focused on the resistance of the bulb. They saw this as
taking off part of the current’s intensity, giving rise to the TAKE-schema.

52
These ideas from Maichle’s (1981) study highlight a very important point,
namely, that if electric current is viewed as already existing, stored in the battery (an idea
also indicated in Gott (1985b) and Eylon and Ganiel (1990)), then “voltage has lost its
function of causing the electric current” (p. 179). The importance of conceptualizing
voltage is thus not given prominence by students who have no reason to look for what
causes the current. This can make it more difficult for students to form mental
representations of voltage, which in turn creates difficulty in the understanding of more
complex circuit situations, at least before they come to terms with the meaning of voltage.
Millar and King (1993) and Tiberghien (1983) claim that students find it
difficult to discriminate between current and voltage. These researchers cite the work of
von Rhöneck who reports that many students (12 to 16 years old) incorrectly predict no
voltage across an open switch in a simple circuit carrying a battery and a bulb, and that the
closed switch has the battery voltage across it. Tiberghien (1983) makes it clear that
students think of the presence of voltage only when current is circulating.
Moreover, another difficulty for students is when they come to distinguishing
between p.d. and potential. McDermott and Shaffer (1992) report that being asked to
predict the relative brightness of the bulbs in Figure 2.7, students in their study gave
incorrect answers supported either by ideas related to sequential reasoning and current
being used up or by faulty reasoning.
Figure 2.7: Predicting the brightness of identical bulbs when the switch is closed
(from McDermott and Shaffer, 1992, p. 998)
53
These researchers report one student’s answer as follows:
“Bulb A is the brightest because the potential is highest. Bulb B and Bulb C are next
because they’re on the same potential. Bulb D is the dullest due to the lowest potential”
(p. 998). The authors rightly argue that in providing such an explanation the student
“mistakenly associated the brightness of a bulb with the value of the potential at one of its
terminals, rather than with the potential difference between the terminals” (p. 998).
2.5.5 The lack of a system view
The difficulties students encounter with the understanding of key concepts can
promote an unhelpful view of the electric circuit based on different components working
separately. Students do not manage to deal with changes made to a circuit in a holistic
manner.
Cohen et al. (1983) who conducted research with a sample of 145 students
(15-17 years old) and 21 Physics teachers, asking questions about circuits which mainly
required a qualitative answer, refer to this difficulty. The researchers report that many
students saw changes made to a circuit affecting the circuit locally, not globally. They say
that students find difficulty in dealing with functions with more than one variable, with the
difficulty increasing when variables change simultaneously. This is very similar to what
was pointed out with reference to how students deal with factors affecting resistance in
section 2.5.3.
2.5.6 Persistence and consistency of students’ intuitive ideas
It is intended that instruction helps the evolution of students’ alternative ideas
towards scientific ones. At the same time, the literature related to circuits indicates that
some students’ can hold on strongly to some alternative ideas, using these even after
instruction. Moreover, some studies have shown that students’ tend to use some
alternative ideas consistently in different contexts.
McDermott and Shaffer (1992) report that the performance of students on
several of the tasks given to the students to answer “indicated that most had not yet
synthesised the basic electrical concepts into a coherent framework” (p. 1001). Lacking a
conceptual model that students could use as a basis for predictions, “the students resorted
to formulae, relied on intuition, or attempted to do both” (p. 1001). At the same time, the
researchers claimed that some students’ intuitions were so strong that when the result of a

54
calculation contradicted expectations, students would sometimes modify the mathematics
to accommodate their intuitive ideas.
On the other hand, Licht and Thijs (as cited by Licht, 1991) have reported that
secondary school students tend to use alternative conceptions less frequently but more
coherently than younger students. It seems that the older students get, the more ingrained
their alternative conceptions become and the more students fall back on them, if required.
Licht (1991) emphasizes this, at the same time as indicating a way to identify these
conceptions. He claims that:
the construction of clusters of questions which deal with the same concepts in
several contexts has a benefit in that it contributes to the identification and fairly
precise categorization of errors and conceptual difficulties. It appears that pupils
do not make incidental mistakes, but show patterns of conceptual difficulties and
ways of reasoning (p. 272).
2.5.7 Retention of the learnt material
There seem to be conflicting reports on students’ learning about simple circuits
and the retention of ideas acquired through teaching.
Some researchers say that most students learn the scientific view, but given time,
they regress to their original non-scientific ideas. Osborne (1983b), for example, refers to
a study conducted in New Zealand, with a small group of fifteen, 11 year olds. After a
year, more than half the students did not retain the scientific view of current. Interviews
conducted with the students gave evidence that while the students were aware of the
scientific view, they still could not understand it. They thus held non-scientific views
which made more sense to them.
Gauld (1988, 1989) worked with 14 year old secondary school students from
New Zealand, using experiments that critically challenged students’ existing mental
models of circuits. He found that testing the students immediately after the course of study
showed that most students had scientific views. When the researcher tested the students 3-
4 months later, the results indicated that some students, who had held the scientific view in
the short term, had reverted to their intuitive ideas in the delayed interviews. Students had
distorted the results of the experiments they had seen, to match the alternative ideas they
had previously held before instruction.

55
Fleer (1994), on the other hand, claims that having used an interactive teaching
approach with her students, asking questions about batteries and bulbs which they could
investigate, 19 out of the 25 students in her sample showed retention of ideas, 3 months
after the course. These students were 5-7 years old.
2.6 Why learning about the electric circuit may be difficult
2.6.1 Introduction
The previous section looked at problems students find as they deal with circuits.
This section looks at opinions from different authors who have tried to find reasons for the
problems students find. The discussion presented below relates to, what the word
‘abstract’ means in relation to circuits, how students’ intuitions can hinder learning,
whether students’ cognitive ability has an effect on learning, and whether teaching can
itself create difficulties for the learner. A look is also taken at some studies which
highlight the missing link between the teaching of static and current electricity.
2.6.2 The abstract nature of the topic
A number of authors (e.g., Chabay & Sherwood, 1999; Sherwood & Chabay,
2010; Fleer, 1994; Haertel, 2010; Stocklmayer & Treagust, 1996; Taber, de Trafford &
Quail, 2006) attribute at least some of the difficulties students find in understanding current
electricity to the abstract nature of the topic. Students see the apparatus but cannot see
what goes on inside it. A number resulting on an ammeter, or a light bulb which lights up,
is only the interpretation of an indication that current is present in the circuit. While there
is evidence of the effects of the current, the moving charges in the wires have to be
imagined, along with causes for why they move. Furthermore, developing mental
visualizations of how a resistance controls the current together with the battery voltage,
and giving meaning to p.d. may prove to be difficult tasks to accomplish.
2.6.3 The experiential gestalt of causation
In trying to understand students’ reasoning more deeply, Andersson (1986)
suggests that students’ preconceptions in science have a common core. The author calls
this core the experiential gestalt of causation (EGC). According to Andersson (1986),

56
students’ intuitive reasoning pattern can be seen to consist of three elements: agent –
instrument – object (see Figure 2.8).
Figure 2.8: Students’ intuitive reasoning pattern: agent - instrument - object (from
Andersson, 1986, p.157)
Children learn from a very early age to expect this pattern. The child discovers
that the greater the effort he makes, the bigger the effect on the object. Different objects
resist to different degrees. Several agents have a greater effect than just one. The nearer
the agent is to the object, the greater the effect. The child then uses this type of reasoning
in many circumstances, applying it in more complex situations, even when EGC leads to
incorrect predictions. To give just one example, pupils reason that a larger number of
batteries should increase the light intensity from a bulb. This is correct if the batteries are
connected in series but not if they are connected in parallel.
It seems that intuitively we are prone to reason in this specific way, even in
different contexts. Andersson’s report refers to studies conducted with a number of
students (ages 12 to 15) attending a Swedish comprehensive school, as well as with
Swedish elementary school student teachers and American college students. The results
from these studies demonstrate that students use the EGC in their explanations and
predictions in different areas of Physics, such as heat, light, mechanics and electricity.
Astolfi (as cited in de Posada, 1997) agrees with Andersson (1986) and claims
that students’ alternative ideas “are not isolated, they belong to a framework in which
different elements support and reinforce one another” (p. 463). De Posada (1997) claims
that some researchers take different stands on why students’ preconceived ideas are deep-
rooted. Preece and Sebastiá (as cited in de Posada, 1997) suggest “that there are some
cognitive a priori structures that canalise (added italics) the interpretation of the reality in a
determinate way” (much like Andersson’s (1986) EGC interpretation), “conducting
students to create ‘natural’ interpretations, while students obstruct other ‘non-natural’
explanations” (p. 462). On the other hand, Castro and Fernández (as cited in de Posada,
57
1997) refer to Piaget’s stages of development (see Inhelder & Piaget, 1966). They point
out that “students’ ideas are inadequate adaptations to the reality, presumably because
students have neither formal nor post-formal operational development” (p. 463).
2.6.4 The level of students’ cognitive processing
De Posada (1997) is not alone in suggesting that students’ ideas related to
models they hold of electric circuits may depend on the level of students’ cognitive
processing. Monk (1990) carried out a meta-analysis from a Piagetian epistemological
perspective of earlier research undertaken on electrical circuits. He attributed stages to
students’ answers related to mental models of current presented in Shipstone (1985b) (see
section 2.5.1), according to the reasoning required to provide a specific answer. He looked
at the results of tests in simple electricity from Shipstone (1985b) and, compared them to
results indicating the cognitive level of students from a survey reported by Shayer and
Adey (1981). Monk found that the percentages of students in Shayer and Adey’s sample,
at the various cognitive levels, were comparable to those obtained by Shipstone for the
different models of current. This provided an indication that the mental models used by
students to understand direct current electrical circuits depend on students’ Piagetian stage
of cognitive development. Both Monk (1990) and Asami, King, and Monk (2000) claim
that students cannot understand abstract ideas which are beyond their level of cognitive
development.
2.6.5 Teaching as a cause of learning difficulties
In section 2.3, it was mentioned that science teaching might influence ideas in
‘unanticipated ways’ (Osborne, 1983a; see also Niedderer, 1994, 1996). It seems that
while this may result from poor lesson interpretation by the learner, other reasons may
include teaching methods which demotivate the learners and imprecise teacher talk. Thus
teaching itself can sometimes be a source of learning difficulties.
Ward and Wandersee (2002) explain that situations in the classroom, following
the long-established tradition of transmission of knowledge, may not motivate students to
learn. They claim that when the teacher just presents knowledge to the learner, without
leading students “to grasp the meaning of a learning task, the learners’ confidence wanes”
(p. 575). Rote learning is encouraged and this does not allow for proper knowledge

58
integration. Often, students “fill the gaps with alternative conceptions to support their
conceptual house of cards” (Novak, as cited in Ward & Wandersee, 2002, p. 575).
Shipstone (1984, 2002), and Grotzer and Sudbury (2000) claim that in current
electricity, unless teaching is conducted using carefully chosen classroom talk, it is easy to
describe current in a sequential way, starting at the battery. Furthermore, the term ‘p.d.’
and the word ‘voltage’ are used interchangeably, both often indicated as ‘V’. This may
create confusion. While von Rhöneck (1985) states specifically that “voltage in physics is
not a force, it is a potential difference” (p. 283), thus equating the two terms, other authors
criticize the interchangeable use of the words ‘voltage’ and ‘p.d.’ Gunstone et al. (2001)
claim that it is a complex matter to make inferences about student understanding, when
explanations are given in terms of ‘V’. In asking: “Does V refer to ‘voltage’, ‘voltage
drop’ or potential difference?” (p. 14), these authors imply that they see some distinction
between these terms. They rightly argue that teaching ‘V’ in different ways (e.g., ‘energy
provided per unit charge…’ or ‘energy lost per unit charge….’) makes the concept difficult
to understand, claiming that “this complexity is to a considerable extent a consequence of
physicists not having an accepted response as to the question, ‘What is ‘V’?” (Gunstone et
al., 2001, p. 14).
Shaffer and McDermott (1992) aim at reducing misunderstanding by suggesting
the use of the word ‘voltage’ at the start of a course of studies, associating it with the
voltmeter reading in a circuit. They describe how, in the same way that a bulb would show
an increase in brightness when the number of batteries connected in series is increased, a
voltmeter replacing the bulb can be used to show that the voltmeter reading indicates the
ability of the battery to ‘drive’ the current through the circuit. This would give a meaning
to the voltmeter reading to students. Later, “the term potential difference is used after the
concept of potential has been developed” (p. 1006).
Another issue which may add to students’ confusion may be the different ways
of presenting concepts in text books. Considering resistance, when Iona (1979) examined
how this was explained in various physics textbooks used from secondary school level to
university level, he found that as a general rule it was presented in a rather abstract
mathematical way by starting with some defining equation. He also described other
approaches which were used, namely the use of ‘the fluid-flow analogy’ or a model of
charges moving in an electric field, or detailed experimental investigations and related
discussions about length and cross-sectional area of wires to bulb brightness. It was

59
claimed that “in comparing the approach that different authors use in teaching the concept
of electrical resistance, one is impressed by the variety of possibilities and the fact that
there does not seem to be an obvious relation between the approach and the level for which
the various texts are intended” (p. 299). An examination of how the resistance concept in
some physics text books being currently used in Malta, from secondary to advanced level
(see Duncan, 1994; Farrell, 2004; Xuereb, 1999) shows that after a brief description of
resistance as the opposition to the flow of charge by the conductor atoms, the authors
quickly introduce equations to define R. Duncan (1994) uses R=V/I. Xuereb (1999) uses
the same equation and refers to Ohm’s law. Farrell (2004) uses the equation R=ρL/A,
where ρ refers to the resistivity of the conductor, L to its length and A to the cross sectional
area of the conductor. These approaches also indicate a variation in the way the concept is
presented, at the same time as possibly reflecting the brisk way in which the resistance
concept is sometimes taught, without resorting to tools like analogies and experiments to
aid learning.
2.6.6 Macro-micro relationships: the missing link
Research has pointed to difficulties in learning current electricity resulting from
treating the concepts learnt in static electricity as separate and perhaps different from
concepts used in current electricity. Eylon and Ganiel (1990), Licht (1991), Viennot and
Rainson (1992) have referred to this as a missing link between macro-micro relationships.
(The term ‘micro’, short for ‘microscopic’, in fact refers to sub-microscopic properties of
the circuit. These terms are used with this meaning in further sections of this thesis.)
In Israel, Eylon and Ganiel (1990) studied how a sample of 92 students (17-18
year olds) reason about mechanisms in electric circuits, during discussions involving
transients in simple circuits. They confirmed that only a minority of students, who had
already been instructed in electrostatics and electrodynamics before sitting for the
advanced level examinations, were able to tie concepts from electrostatics to their
description of phenomena occurring in electric circuits. The authors noted that the
situation did not “necessarily represent misconceptions, but rather the lack of any clear
concepts” (p. 92). The study revealed that “the concept of voltage remains vague and its
formal definitions (quoted correctly) are not utilized operationally” (p. 92). While students
performed satisfactorily in the quantitative aspect of the study, they showed superficial
generalization of rules, leading to the interpretation of rules erroneously: for example,

60
since V=IR this leads to the conclusion that V=0 when I=0 (also reported by Cohen et al.,
1983). The missing macro-micro link was described as the reason behind students’ lack of
a systemic view of the electric circuit. The authors’ plea was for students to be guided to a
better understanding by making this macro–micro link between concepts, so as to be in a
better position to visualize a functional model of the mechanism in electric circuits.
Licht (1991) supports the analysis of Eylon and Ganiel (1990) and also relates
the lack of the macro-micro link to difficulties students show in the understanding of the
topic of electric circuits. Licht (1991) suggested a sequence of instruction with an
emphasis on covering both qualitative macro and micro phenomena, before proceeding to
teaching the quantitative.
Viennot and Rainson (1992) focus on the instability of students’ reasoning
related to the electric field and argue for the need “to look for ways of unifying the
patchwork of ideas” (p. 486) with which electrostatics is linked with electrodynamics. The
authors suggest that at least at college level (with students 16-18 years old), instruction
should link the idea of field in electrostatics, with the important presence of the field in
electrodynamics - a link often not easily acknowledged by learners.
2.7 Finding ways which may help learners’ understanding
2.7.1 Towards modifying unhelpful ideas
In the same way as research studies have focussed on common
misunderstandings with electric circuits and reasons for learning difficulties, much
research has also focussed on ways which may help learners in developing their mental
models, moving towards a scientific view.
It must be stated at the onset that, nowhere in the literature regarding studies
related to electric circuits is it documented that modifying students’ unhelpful ideas is an
easy task. Studies have more often shown that students hang on to their intuitive ideas, and
even if these are modified as a result of teaching, many students revert to the original ideas,
given time (Osborne, 1983b; Shipstone & Gunstone, 1985). On the other hand all
educators expect learning as a natural outcome of teaching. It is thus only natural that we
start helping students to develop scientific ideas as early as possible. Osborne (1983a)
61
shows concern and “fear that if the children’s ideas are not modified at a relatively early
age then these children may ossify in their thinking” (p. 81).
While the modification of students’ ideas rests primarily on the way students
make use of their pre-existing knowledge and their motivation to extend and develop their
ideas, educators cannot shift all the responsibility of learning on the students. Schools, as
the professional bodies, need to look at what research has been conducted and into
problems with students’ understanding being consistently reported, such that teaching
methods and curriculum development based on the research findings may then be
considered and possibly implemented.
2.7.2 Exploring learning pathways
In the late ‘80s and into the 90’s, researchers extended the traditions on students’
alternative conceptions to investigations of learning processes. Several focussed their
attention on probing ‘learning pathways’ as teaching and learning are in progress. Scott
(1987) described pathways in learning related to the particulate nature of matter.
Niedderer (2006) claims that this work was the first learning pathway study conducted.
Niedderer and Goldberg (1994) and Clement and Steinberg (2002) probed learning
pathways followed by individual students, specifically during instruction in current
electricity. Developing learning pathways is seen as a way to help develop teaching
approaches to support learning (Scott, 1992).
Niedderer and Goldberg (1994) investigated the learning processes of a group
of three prospective elementary school teachers (age 21). While this study, based on a
small sample, cannot be considered as offering evidence of a general nature, yet it is
valuable because it highlights some basic ideas about how some students learn. Niedderer
and Goldberg (1996) described learning pathways by considering a learning route of
cognitive states, starting with the prior conception (PC) (which is referred to as Everyday
Life Current (ELC)) and going through intermediate conceptions (IC) developed during
teaching (see Figure 2.9).

62
Figure 2.9: Cognitive states learning route (from Niedderer & Goldberg, 1996, p. 3)
The authors claim that ICs become further elaborated upon, by “facets” or
“smaller pieces of knowledge that students seem to be applying in problem situations”
(p. 1). As the term used implies, ICs are ‘in between’ and ‘somewhat fragile’ and ‘may get
either higher or lower’ during the ongoing learning process. The more stable they become,
the more these conceptions affect learning. It is claimed that a learning pathway is
discovered from intermediate conceptions, which are viewed as stepping stones (Niedderer
& Goldberg, 1996). The authors report that “always in new and complex situations, Lynn
(the student whose ideas were being followed) starts with the prior conception ‘everyday
life current’ (ELC)…..” (Niedderer, 1994, p. 26). So, once again, reference is made to the
robust nature of intuitive ideas.
Through the instruction phase, Niedderer and Goldberg made use of the electron
gas pressure model to guide the ‘thinking mode’ of the learners (Niedderer & Goldberg,
1994). The same model is used by Steinberg and Wainwright (1993) in the CASTLE
Project. They defend this model, saying that “the idea of ‘electric pressure’ in a
conducting body is a highly intuitive version of electric potential in conducting matter.
Mental images of charge being compressed and the ‘pressure’ building up as a
consequence are powerful causal concepts that students can use for thinking about what is
happening in electric circuits without appealing to mathematical formulas” (p. 355). On

63
the other hand, Mosca and De Jong (1993) strongly criticize the use of the electron gas
pressure model for two reasons. In the first place, they do not agree with “raising a loose
analogy for the idea of circuit … to the status of a model” (p. 358). The second problem
they note is that while electric currents in wires are driven by electric fields which result
from surface charge distributions, according to the compressible fluid model it is the
pressure gradient resulting from a volume density and not a surface density, which drives
the current.
Clement and Steinberg (2002) followed a pathway of student learning using the
pressure in a compressible fluid analogy. This makes this research similar to that of
Niedderer and Goldberg (1994). Clement and Steinberg (2002) looked into the model
evolution of Susan, (the student participating in the case study), as she reassessed and
revised her ideas, during instruction. Once again a significant feature of this work is that it
is based on the ideas of one student, but at the same time the researchers analyse deeply
what the student says during the learning/interview sessions conducted. In this study,
comprehension was aided through the use of multiple ‘small’ discrepant events and
analogies built into the lessons (see Figure 2.10).
Figure 2.10: Using discrepant events and analogies to help in the evolution of a new
model (from Clement and Steinberg, 2002, p. 425)
Discovering possible learning pathways used by different learners can be a first
step towards better and deeper understanding of both the key concepts involved in learning
a topic and the problems that block understanding of that topic.

64
2.7.3 Focussing on the mental models of electric circuits
As has already been referred to in section 2.2.1, a number of science educators
have found the idea of ‘mental models’ useful in thinking about how students learn in
many scientific domains. Research conducted by Osborne (1983a, 1983b) and Shipstone
(1984, 1985b) had indicated the mental models of current held by the participants in their
studies. The issue of learning via model construction started to be addressed (Clement,
1989).
When in the late 90’s, Borges and Gilbert (1999) reported on a study which they
conducted with 56 participants of different ages and experience with physics learning (see
section 2.4.1), their research results suggested four models of the electric circuit. These
models indicated a progression starting from an early view held by young students and
proceeding to a sophisticated view held by scientists, thus:
• electricity as flow;
• electricity as opposing currents;
• electricity as moving charges;
• electricity as a field phenomenon.
Essentially, the first three models focus on current and its presence in a circuit.
The last model, making reference to the presence of the field, goes further, including ideas
related to p.d.
The research conducted by Grotzer and Sudbury (2000) examines the models of
current documented by Shipstone (1984, 1985) and categorises them in terms of whether
they are linear or cyclical models, describing them as follows:
• the mono-polar model is the basic idea visualised by the younger learners when they
hold a ‘linear’ or ‘sink’ model. There is a cause directly linked to an effect;
• the ‘clashing-currents model’ still indicates a model with an essentially linear structure,
even if it is two causes leading to the effect;
• the attenuation model is a definite step forward, away from the linear models. Students
now see a complete circuit with current moving in one direction and their ideas evolve

65
towards a cyclic pattern of events, but the time between cause and effect is still a
property of this model. This is a ‘cyclic sequential model’;
• the sharing model is the first model that clearly moves away from the time lag between
cause and effect. Two bulbs are seen as receiving the current simultaneously and
sharing it;
• the scientific model is a cyclic model where the effect is experienced simultaneously in
every part of the circuit.
Grotzer and Sudbury (2000) also propose their models of circuits based on
conceptual development, accompanied by causal reasoning. The models proposed are
similar to Shipstone’s models, but the authors claim that their proposed models “are
grouped by the causal assumptions that one needs to make in order to understand them and
the conceptual leaps needed in understanding causality in order to progress from one set to
the next” (p.4). This is what distinguishes them from previous models. Moreover, Grotzer
and Sudbury (2000) look at the ‘why’ (i.e. the cause) of current flow, rather than just at the
‘how’ it happens. Figure 2.11 shows diagrams to represent these causal models. The first
three are essentially the same as Shipstone’s models. The fourth model is a ‘cyclic
simultaneous model’. The time lag between cause and effect is no longer a requisite for
this model. The circuit can now be visualised as a system working together, much like the
often quoted bicycle chain effect. A ‘relational interactive’ causal model is also presented
in a fifth model. Here p.d. is understood as causing a differential effect, providing flow
because of different charge density accumulation, at different points in the circuit.
Thus the models indicated by Grotzer and Sudbury (2000) progress to
provide reasons for why current results in a circuit, directing the learner to move to more
powerful and explanatory models, not only of current but also of the abstract ideas behind
potential and potential difference.

66
a: Simple linear models
b: Double linear causal models c: Cyclic sequential causal models
d: Cyclic simultaneous causal models e: Relational interactive causal models
Figure 2.11: Linear and cyclical causal models of how a simple circuit works (from
Grotzer & Sudbury, 2000, p.5)
2.7.4 Proposed teaching sequences
The primary thought behind any lesson planning involves sequencing ideas
which can be made use of to design instructional activities aimed at improving
understanding. The literature related to circuits has shown a number of researchers
advocating the use of some teaching sequence which may have been found to be effective
in their work. Different teaching sequences have, however, been presented making it hard
to reach an agreement about which teaching sequence best serves the purpose.
Shipstone and Gunstone (1985) (also referred to in Shipstone, 1988), talked
about students’ initial idea of circuit or “embryonic concept” (p. 93) which relates more to
electrical energy than to electric current, when students use the source-consumer model at
the start of a learning programme. They thus advocated that referring to ‘electrical energy’
first, would be more effective. In their instructional sequence used with secondary school

67
students (12-13 years old), current was introduced later, as a cause of the magnetic effect
of electricity and as what moving coil ammeters measure, hoping to discriminate between
current and energy.
Licht (1991) agreed with the introduction of energy first, but argued, in addition,
that the introduction of current as the means of transportation of energy from the cell to the
bulb cannot be postponed. In this case, a sequence was proposed in 5 blocks, each being
introduced at different levels, to secondary school students. The programme was labelled
as follows:
block 1 a phenomenological orientation
block 2 a qualitative macroscopic treatment
block 3 a qualitative microscopic treatment
block 4 a quantitative macroscopic treatment
block 5 a quantitative microscopic treatment, including the theoretical
concept of an electric field
(from Licht, 1991, p. 273)
In this sequence, the initial emphasis lay on the qualitative introduction of the
topic, based on the observed behaviour of circuits as the number of bulbs or cells is
changed. Licht (1991) suggested ‘choosing the energy concept as an entrance to the
cluster of core concepts in electricity’ (p. 274). Like Shipstone and Gunstone (1985), Licht
(1991) believes that energy is more closely related to students’ intuitive ideas. Later, a
treatment of microscopic representations is included, such that students could be brought to
visualize what goes on in the circuit before being instructed to deal with the topic
quantitatively.
Contrary to the above, Osborne (1983a) stated categorically that:
electric current is the important and basic idea and a less abstract concept than
electric energy. If children are to use simple circuits to examine conductors, if
children are going to appreciate why an ammeter may be placed at any position
in series circuit, if children are going to really understand why a circuit will not
operate unless it is complete, if children are going to understand about series and

68
parallel circuits, then it is essential they first understand about electric current
(p. 80).
Shaffer and McDermott (1992) supported the view that while starting a sequence
of instruction by dealing with potential difference or energy offers other possibilities, yet
“these alternatives have disadvantages that outweigh the benefits” (p. 1007). These
authors explain how dealing with potential difference implies that students have to see both
the flow and the push which they refer to as ‘pressure’, while starting with current implies
dealing with the concept of flow alone, a concept which “is more intuitive to students” (p.
1007). Furthermore, while these authors admit that “students try to base their explanations
on energy considerations”, yet, “when they attempt to reason on the basis of energy, they
have difficulty in reconciling the dissipation of energy with the conservation of current” (p.
1007) and thus introduction of the concept of energy early in the model’s development
leads to complications. They advocate that “it is easier for students to develop a consistent
conceptual framework from a single primary concept instead of from two concepts that
they may not have fully separated” (p. 1008).
On the other hand, Haertel (1982, 1985a) proposed a different approach.
Current, voltage and resistance introduced simultaneously in a qualitative way, would
make it more possible to view the circuit as ‘a system’. The author explains that contrary
to sequential reasoning which is very dominant, the idea of systems with elements having
strong relations between each other is not so common. He suggests introducing the circuit
system by using analogies which do not reinforce sequential reasoning, referring to the use
of the idea of a stiff ring, the bicycle chain and the water analogies as a support for
understanding.
2.7.5 Emphasis on the macro-micro relationship
With respect to the macro-micro relationship, it has already been previously
pointed out in section 2.6.6, that various researchers have emphasised the importance of
having students understand and link concepts in static and current electricity. The
literature targeting this problem and how to solve it points in two directions. On the one
hand, some researchers work at producing teaching strategies emphasising this link. On
the other hand, other researchers take the stand that the link between electrostatics and
electrodynamics is missing because instruction is not exposing the students to all content
which needs to be learnt in order for the link to be made.

69
The work of Borghi, De Ambrosis and Mascheretti (2007) is an example of how
researchers work at producing teaching sequences with the aim of helping students merge
ideas developed in electrostatics with those in electrodynamics. These authors report their
on-going research testing a sequence of teaching, based on the examination of problems
which were being experienced with ideas in electrostatics by 30 Italian student teachers.
The sequence still needs to be tested with high school students. The authors believe that
poor understanding of electrostatics phenomena influences the understanding of electric
circuits. They claim that if students lack the microscopic models which scientifically
explain concepts in electrostatics, then the idea of the circuit as a system and of voltage as
the property of the circuit which drives the current cannot be understood. The teaching
sequence they have proposed emphasises electrons as the moving charges and guides
students towards an understanding of the presence of the force field which surrounds any
charge. The experiments they propose focus on the “particular role of electrons as
elementary charges both in electrostatic phenomena and in currents” (p. 154), using
transients. The innovative aspect of this work is the fact that the researchers managed to
include experiments in their teaching sequence which can take the learners ‘backwards’ in
their line of thought, in the sense of being able to experiment and obtain results associated
with static electricity, by using a battery.
Figure 2.12: From electrostatics to electrodynamics (from Borghi et al., 2007, p. 153)

70
Figure 2.13: From electrodynamics to electrostatics (from Borghi et al., 2007, p. 153)
The diagrams in Figures 2.12 and 2.13 show apparatus which can be used to
help the students to go back and forth with their ideas, merging ideas usually called upon
only in static electricity with microscopic ideas required for the understanding of electric
circuits.
Other authors and researchers choose to see the problem of the lack of macro-
micro link from a different perspective. These argue that students miss the relationship
between static and current electricity because they lack instruction on, and exposure to,
study material related to surface charges which accumulate on wires and resistors and
which thus creates the electric fields which guide the movement of charge in the circuit.
Haertel (2008b) has presented work related to the presence of surface charges on
wires and conductors making the electric circuit, yet the idea is certainly not a new one.
Rosser (1963, 1970) referred to charge distributions being “built up on the surface of the
connecting wires in an electric circuit, which serve to ‘guide’ the electric current along the
length of the connecting wire” (p. 884). He was already pointing to the fact that the topic
of electric circuits was not being covered adequately during teaching, because the idea of
the presence of surface charges was not being given the importance it deserved. Other
authors like Jefimenko (1962) and Walz (1985) also voiced the same opinion.
Heald (1984) stated further that surface charge distributions are usually “very
difficult to calculate and measure” (p. 522). This was offered as one possible reason why
the presence of surface charges on current carrying conductors has not been given the
importance it deserved in text books and in various courses of study.

71
While the electric fields are weak and the associated surface charge is very
small, Jefimenko (1962) argued that the occurrence of these electric fields in current
carrying conductors, “in the laboratory, in nature, and in industry, is at least as frequent as
that of the electrostatic fields” (p. 19). He also described how to make the electric fields
visible with the aid of printed circuit-type models (see Figure 2.14). The models consist
essentially of a printed circuit of the system on glass plates, using transparent conducting
ink. The lines of force inside and outside the elements of these models are demonstrated
with the aid of grass seeds which are strewn upon them. These seeds are neutral in their
natural state, but become polarized in the field, aligning themselves along the electrostatic
field lines (Assis, Hernandes & Lamesa, 2001). Thus, the concept of electric field need not
be just left to the imagination of the learner.
Figure 2.14: Fields inside and surrounding current carrying conductors (from
Jefimenko, 1962, p. 20)
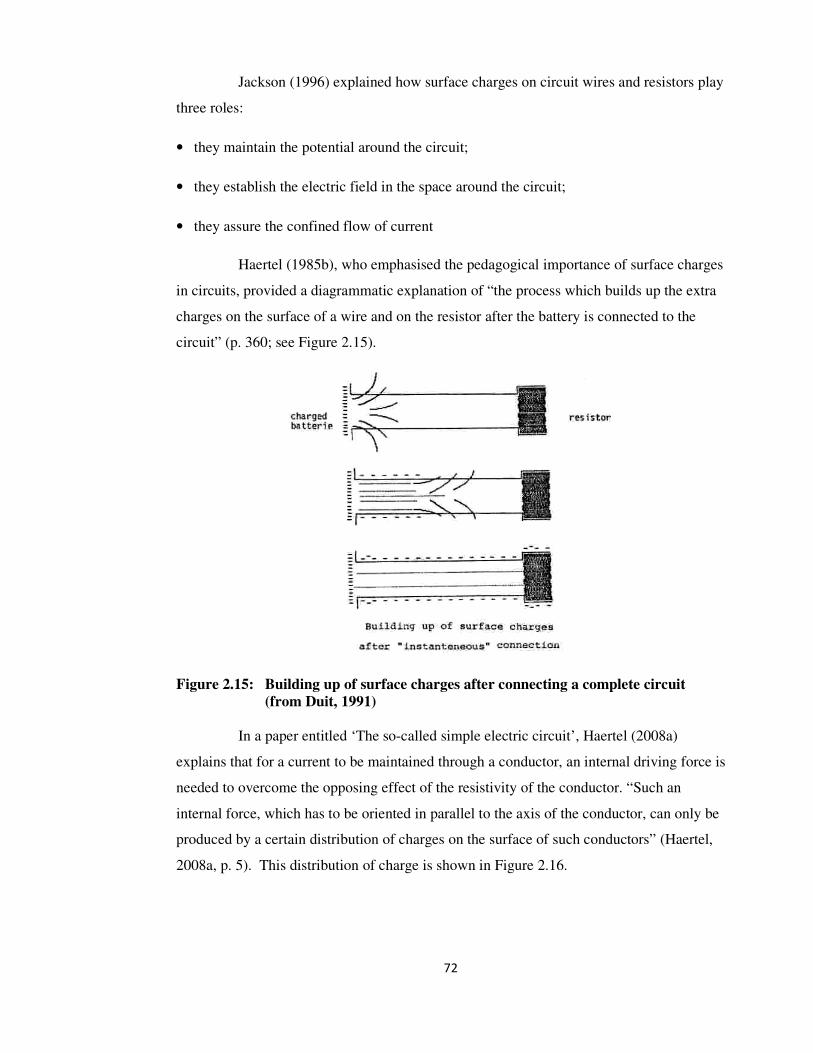
72
Jackson (1996) explained how surface charges on circuit wires and resistors play
three roles:
• they maintain the potential around the circuit;
• they establish the electric field in the space around the circuit;
• they assure the confined flow of current
Haertel (1985b), who emphasised the pedagogical importance of surface charges
in circuits, provided a diagrammatic explanation of “the process which builds up the extra
charges on the surface of a wire and on the resistor after the battery is connected to the
circuit” (p. 360; see Figure 2.15).
Figure 2.15: Building up of surface charges after connecting a complete circuit
(from Duit, 1991)
In a paper entitled ‘The so-called simple electric circuit’, Haertel (2008a)
explains that for a current to be maintained through a conductor, an internal driving force is
needed to overcome the opposing effect of the resistivity of the conductor. “Such an
internal force, which has to be oriented in parallel to the axis of the conductor, can only be
produced by a certain distribution of charges on the surface of such conductors” (Haertel,
2008a, p. 5). This distribution of charge is shown in Figure 2.16.

73
Figure 2.16: Linear density distribution of surface charges on a rectilinear
conductor (from Haertel, 2008a, p. 5)
“For the simplest case of a rectilinear homogeneous conductor, carrying a
constant current, it can be calculated that it needs a linear change in the
distribution of surface charges to produce an internal constant force oriented
parallel to the conductor. This is also called a linear gradient of the surface
charge distribution” (Haertel, 2008a, p. 5). In his work Haertel (2008a) also
explains how an internal force acts in a similar way in curved conductors.
Considering electrons as charge carriers, there is a higher surface charge density
on the outbound surface of the conductor compared to the inner side and vice
versa for positive surface charges (see Figure 2.17).
Figure 2.17: Distribution of surface charges for curvilinear conductors (from
Haertel, 2008a, p. 5)
Preyer (2000) explains that the electric field inside a conductor adjusts itself
such that it is everywhere parallel to the wires.
In wires of constant conductivity and width, the internal electric field is uniform
in magnitude. In other situations the surface charge increases the electric field in
high-resistance regions, and decreases the field in low-resistance until, by a
feedback process, the current has the same value in all segments. (p. 1006).
Thus the idea of how current is the same everywhere in the circuit may be
explained.
The idea of surface charge can also help to explain voltage. Haertel (2008a)
explains that:

74
A voltage or potential difference between two points within an electric circuit is
present whenever charges are separated, either in the form of surfaces with a
certain density of charges with opposite polarity or with a difference in surface
charge density. Such charge separation calls some Coulomb forces into
existence which try to re-install neutrality. These forces create a voltage or
potential difference. This is valid for electrostatic situations as well as for current
carrying electric circuits (p. 6).
The literature related to surface charge formation in closed electric circuits
indicates the belief of the various authors that only when the students become aware of
how the charge densities and surface charge affects the circuit, can students qualitatively
understand how an electric circuit works as a system. The belief is that when students can
deal with ideas expressed by diagrams like the ones shown in Figure 2.18 and other
diagrams similar to the ones indicated in this section, then students can make the mental
move towards visualizing what a voltmeter reading truly indicates, why the current is the
same everywhere in a circuit, and how and why current can move along the circuit, even
along the bends in connecting wires.
Figure 2.18: Surface charges on a circuit with one resistor (from Haertel, 1985b)
The idea of surface charge can thus link static to current electricity providing
clear knowledge of how scientists understand the concepts involved. Perhaps this work
may be too advanced for young students, but a brief introduction late at secondary level or
sixth form/college level may help students’ understanding of how the circuit functions.
Chabay and Sherwood (1994, 1999) and Sherwood and Chabay (2010) emphasise that the
idea of surface charge together with qualitative reasoning is a way to improve
understanding of circuits.

75
2.8 Summary and conclusion
An extensive literature exists related to learner’s understanding of key ideas in
simple electric circuits. Much of the research was undertaken to probe students’
alternative ideas in this area of physics.
Many studies have been conducted looking at students’ representations of
current and how these change with age and instruction.
Studies related to resistance are not as numerous as those probing ideas about
current, however, popular models of resistance have been identified. Students of different
ages who focussed on the load (the resistance or bulb) in a circuit were found to often
explain resistance in terms of a Take-schema – meaning that components ‘take’ the current
they need to operate correctly. Other students, who focussed more on the battery and saw
this giving ‘something’ to the resistance/bulb, reasoned in terms of a Give-schema.
Other studies on p.d. have shown that this concept is not one that students
understand easily. Some studies suggested giving a meaning to the voltmeter reading,
relating it to the ability of the battery to drive a current, rather than presenting voltage/p.d.
in some abstract way. A number of studies also showed that many students do not
discriminate between p.d./voltage and current. The literature speaks of many students
expecting zero p.d. when the current is zero, indicating students’ erroneous belief that p.d.
does not exist without current.
A number of studies pointed to how students’ alternative conceptions may be
very deep-rooted, persisting even after instruction. The consistent use of some alternative
conceptions was also indicated.
Across the numerous studies conducted, various methods have been used to
collect data. Paper-and-pencil tests are quite common, with a majority of these being
accompanied with interviews, probing students’ understanding more deeply. Sometimes,
individual demonstration interviews were used to help students in their discussion and
interaction with the researcher.
The literature indicates imprecise teacher talk, as well as the abstract nature of
the topic, amongst factors which create difficulty for understanding circuits. It is also
important to note that a few researchers linked the ideas which students seem to hold about
76
circuits to students’ level of cognitive development. This pointed to an explanation for
why some key concepts may be more demanding to understand than others. The missing
macro-micro link between the concepts used in electrostatics and in current electricity was
also indicated by researchers as a cause for the lack of understanding of circuits. Some
authors also pointed to the lack of explanations of electrical phenomena in terms of the
surface charge which results on conductors when a current is flowing. Ideas about surface
charge in relation to circuits may not be included in syllabi at secondary and post-
secondary level. However, by referring to surface charge one can explain the presence of
the electric field lines exactly following the line of the wires in the circuit. This helps to
explain why free electrons move through the wires when a p.d. is present.
The importance of mental models and analogical reasoning in their central role
for understanding is also highlighted by this literature review. Some researchers aimed at
establishing mental model pathways tracking students’ intermediate mental models during
learning. Various teaching sequences have been suggested by different researchers but it is
difficult to conclude which sequences might be more effective for improving students’
learning. Research conducted more recently has emphasised the importance of causal
reasoning and its use in refining mental models, leading towards scientific ideas. The
importance of asking the question ‘Why?’ during the teaching and learning process
becomes more pronounced.
Even though so much research has been conducted about circuits, very little has
yet tried to link students’ intermediate mental models of the key concepts, as learning is in
progress. The present study focuses primarily on this issue, with the aim of producing
more detailed evidence of how students use and link the key concepts involved, whilst
probing why some ideas are more difficult to understand than others. Whilst no blueprint
can ever exist whereby all students are guaranteed success in the learning of this abstract
topic, the indicators provided by the body of research conducted in this field nonetheless
offer insights into how to increase the likelihood of successful learning. These insights
helped in planning the research strategy which is presented in the next chapter.

77
Chapter 3 Methodology
3.1 Introduction
The literature review shows clearly that a lot of research interest has been shown
by many researchers who have looked into the various problems students encounter in the
understanding of electric circuits. This chapter elaborates on decisions made to organize a
research strategy that would help in making this study one which contributes further to the
knowledge on this topic.
In the following sections the research questions are first stated. The type of
research which was used is described and reasons are provided to indicate why this was
deemed to be the best way to answer the research questions. A brief outline of the research
strategy chosen for this work is then presented. Further sections describe more
specifically, the details of the methods adopted and instruments used in the research.
Reasons for choices made, as well as for revisions of plans and actions are given, as the
details of the research strategy adopted over the years of study is described.
3.2 The research questions
The primary aim of this study was to try to improve the effectiveness of my
teaching of the topic through the course of study. Following the claim by a number of
authors that models and modelling are central to understanding key concepts in science
(see Coll & Lajium, 2011; Clement, 1989; Duit & Glynn (1996); Gilbert & Boulter, 1998;
Harrison & Treagust, 2000; Hestenes, 1992; Ramadas, 2009) it was decided that looking
into the difficulties students have in understanding electric circuits, trying to find out what
mental models, if any, students develop and seem to use, and how these models change as
students learn the topic, was a way of achieving this aim.
The study was guided by the following research questions:
• Which models of electric circuit do Maltese students at pre-university (post-secondary)
level appear to use as they study the topic of electric circuits?

78
• What possible learning pathways can be shown to exist, in terms of mental models
which individual students own, and which can serve as a guide towards indicating a
general hierarchical structure of models of circuit?
• Is there evidence that particular approaches used during the teaching process have a
significant influence at guiding students’ thinking towards the use of scientific mental
models of the electric circuit?
3.3 The type of research conducted
Since I lecture pre-university students on current electricity, I easily fitted into
the role of teacher-researcher, probing students’ understanding before the initiation of the
course, through the course, and after teaching the topic. I had the possibility of performing
cyclic research evaluations and improvements in the teaching methods with different
groups of students, during different scholastic years. Each cycle would help refine the
previous and inform the next. Action research, or what Hopkins (2008) prefers to call
‘classroom research by teachers’ (p. 58), was thus the best way to try and answer the
research questions. Moreover, action research would allow for the possibility of the
research plan to be flexibly revised, after reflecting on the results obtained through the
cycles of the study, leading to further action-on-reflection (Cohen, Manion, & Morrison,
2001; Feldman, 1994; Hopkins, 2008).
Hopkins (2008) states that the method of action research makes ‘a twin emphasis
on committed action and reflection’ (p. 49). He explains that “action research combines a
substantive act with a research procedure; it is action disciplined by enquiry, a personal
attempt at understanding while engaged in a process of improvement and reform” (p. 47).
While Hopkins (2008) quotes a number of definitions of action research from
various works by other authors, I particularly related well with the one quoted from Mills
(2003: 1), namely:
Action research is a systematic inquiry conducted by teacher researchers to
gather information about the ways that their particular school operates, how they teach, and
how their students learn. The information is gathered with the goals of gaining insight,
developing reflective practice, effecting positive changes in the school environment and on
educational practices in general, and improving student outcomes. (p. 48)

79
This definition formed the basis of my study and took into account what I
wished to achieve together with my students. Plans had to be made such that methods
would be used that would involve students as Fielding (cited in Hopkins, 2008) described
it, that is “not only as ‘data sources’ or ‘active respondents’ but also as ‘co-researchers’
with teachers” (p. 54). Punch (2009) also refers to students acting as ‘co-researchers’
(p.137). This meant that, while as the teacher-researcher I had to try and understand
students’ difficulties through the mental models students seem to use, I also needed to
guide students in thinking about their own thinking. Even the students needed to become
aware of their problems in understanding, so that they would try and find ways of
correcting these problems, if possible.
3.4 An outline of the research strategy
In an effort to make it easier to follow the ‘circles and spirals’ which
characterise action research (see Cohen et al., 2001; Costello, 2011; Feldman, 1994;
Hopkins, 2008), a brief outline of the research strategy is shown schematically in Figure
3.1.
At the initial stage, the literature review and my teaching experience guided the
process of problem identification, in this case, namely, students’ poor understanding of
electric circuits. This led to the clarification of the research aims, before deciding what
research strategy would best be adopted to answer the research questions. Conducting
action research meant that the study included various cycles of planning, action and
reflection-on-action. In the 1st cycle plans had to be made regarding what teaching
activities would be included to help the understanding of Cohort 1 and what methods and
instruments would be used for data collection. Some pilot studies had to be conducted
early, after the planning stage, to ensure reliability of some of the instruments chosen. In
the 2nd
cycle plans had to be revised regarding teaching activities and data collection
methods, aimed at improving the effectiveness of the teaching with this second group.
Data collection and reflection on the results with Cohort 2 then followed. Due to time
constraints, a 3rd
cycle of the action research was not possible, but reflections on the results
from the 2nd
cycle helped to indicate the way forward with the next sample group, when
that will be conducted.

80
Figure 3.1: An outline of the research strategy used in this study

81
3.5 The sample
My students at a pre-university college in Malta, being taught current electricity
through the years when the study was being conducted, were asked to participate in the
study. Every year I lecture to about 30 to 70 students on this topic. The students were 17-
18 years of age and were in their second and final year at the college, before they sat for
their advanced level examination in Physics. Students at the college are randomly grouped
and each year’s group was representative of students in Malta studying Physics at pre-
university level.
At the beginning of each year, I told the students that I was conducting research
related to probing students’ understanding of electric circuits. It was explained to the
students that participation in the study meant answering some test questions, and that some
students would be asked to be interviewed as well. Students were told that some sections
of the study I was conducting were part-and-parcel of the teaching programme for my
classes. Of course, no-one could opt out of participating in the planned activities during
teaching. However, participation in other parts of the study involving piloting and data
collection through written tests and interviews was on a voluntary basis. Even so, using
Anderson’s (1998) recommendations, students were advised regarding the benefits of
participation. Students were encouraged to take part since the planned tests and interviews
would offer ways of helping students to take charge of their learning. Munn and Drever
(1990) claim that it has often been observed that it helps to make the study more reliable if
respondents see some gain from being co-operative with the researcher.
All students accepted to participate in the study. Even so, it was made clear to
students that in case any student decided to opt out of any data collection exercise, that
student would be allowed to stay in class and work on his/her own through that session.
3.6 Plans for data collection
3.6.1 Probing students’ understanding before and after teaching
3.6.1.1 Physics diagnostic test
Once the reason for conducting this research was clear, it was important to plan
the strategy that would be adopted. This included decisions to be taken on which methods
82
and instruments would best fit the purpose of the research, as well as decisions on a time
frame for data collection.
Students’ understanding of key concepts in electricity, before the beginning of
the course had to be gauged. It was thus decided that a Physics Diagnostic Pre-Test would
be prepared, based on ideas about circuits which students had already covered. This test
would be administered with my student groups at the start of the scholastic year. The idea
was that questions would be asked about very basic concepts. Moreover, as much as
possible, questions would be clearly stated, probing one idea only. This would help make
the interpretation of students’ answers easier to handle (Cohen et al., 2001).
The preparation of a post-test to be administered immediately after instruction
was also envisaged, to see by how far and in what ways students had changed their ideas, if
at all, also indicating how effective the teaching programme was in promoting learning.
Questions from the pre-test which students would find difficult would be asked again, in
addition to other questions on work which would be covered through the course which it
did not make sense to probe in a pre-test.
A delayed post-test was also planned to see by how far students retain the
knowledge gained. This would be administered about one month after the post-test and
would consist of the same questions asked in the post-test.
3.6.1.2 Deciding on the question choice for the diagnostic testing
The following question was used to guide the planning of the questions which
were deemed important to be asked in the tests:
‘What ideas should students have understood after having covered a basic course
in electricity at secondary and post-secondary level?’
Reflecting on this question, while also being guided by the syllabi that the
students cover at each level, and ideas students have been shown to hold through previous
studies mentioned in the literature review, helped in making sound decisions. The
following are items which were decided important to probe:
• the models of current which students use;
• knowing whether electric charges constituting the current are only present in the battery
or whether they are everywhere and start moving because of the presence of the battery,
in a complete circuit (This is a microscopic view which students may find difficulty
83
with but it is a very crucial point which students need to understand, if they are to
understand circuits at all);
• conservation of current at a junction;
• the division of current at a junction depending on the resistances within the respective
branches;
• knowing that it is not the battery alone which controls the current;
• knowing that the current through a larger resistance will be smaller, if the battery is
unchanged;
• the effect on the current of adding resistors in series;
• the effect on the current in the main circuit, of adding resistors in parallel;
• whether it is the potential difference (p.d.) which gives rise to the current or vice versa;
• the models held by students about p.d. in series circuits. (Is p.d. across series resistors
additive? Does p.d. exist across the resistors and/or connecting wires? Does each
resistor in a series circuit have the total p.d. of the battery across it?);
• the effect on the current of increasing the p.d. across the battery (battery p.d. shown
numerically);
• the role of batteries connected in series (This item would look at the same idea as the
previous one without stating the p.d. numerically);
• the models held of p.d. in parallel circuits. (Is the p.d. across resistors in parallel
additive and in total equal to the p.d. across the battery? Is the p.d. across equal
resistors in parallel equal to the p.d. across the battery divided by the number of
resistors? What happens to the current within a parallel branch, when resistance is
changed within other branches?);
• the role of batteries connected in parallel;
• the differentiation of current and p.d. (Is there a current in an open circuit, even if a
voltmeter reads the p.d. across the battery? Is there a p.d. across an open switch, when
84
no current is flowing? Do the rules which apply to currents in circuits, also apply to
p.d. across various points within circuits?).
Diagnostic questions from the Evidence-based Practice in Science Education
(EPSE) project (see Millar, Leach, Osborne, & Ratcliffe, 2006) based on current electricity
were deemed appropriate for the diagnostic testing envisaged. Having access to the entire
bank of questions developed in this topic made it possible to choose a set of questions to
adequately probe students’ understanding. Most of these questions are of the two-tier
multiple choice type, requesting an answer and a reason for it. The reason is either
prompted in a multiple choice set of answers or required as an open-ended response. Tsai
et al. (2007) claim that “many science educators have used two-tier instruments to
diagnose students’ alternative conceptions and reported reliable results” (p. 485).
Moreover, it was important for this study to be supported by qualitative reasons students
base their answers upon because scientifically valid causal reasoning which supports and
explains an answer is an indication of deep understanding (Lee & Law, 2001). Grotzer and
Perkins (2000) refer to and acknowledge “a paucity of causal models in students’
understanding” (p. 1) and “shallow explanations” (p. 3) which students usually offer when
understanding in science is probed. Thus, only by dealing with students’ reasons for their
answers could the probing of ideas lead to some indication of students’ ideas and their
understanding.
A vast number of questions were available to choose from. Careful examination
of the questions available and fine tuning to differentiate between key ideas which the
questions were probing was required. This was not an easy exercise. Moreover, for each
idea being tested, two questions probing that same idea in a slightly different way were
chosen. This would increase reliability of the data collected from the Physics Diagnostic
Tests (PDTs).
Once the selection was ready, the questions were put in a question bank (see
Appendix 3) to be later used during the planned tests.
3.6.2 Probing students’ mental models as they evolve during teaching
3.6.2.1 The importance of conducting interviews
While the diagnostic tests were planned to probe students’ mental models at the
start of the course and after the course was finished, I also wanted to probe students’ ideas

85
as the teaching was progressing. This would create the opportunity for getting some
insight into students’ ideas as they develop, perhaps providing evidence of mental models
students use, and maybe help to get a sense of how these models or reasoning that uses
them is changing. For this reason, interviews were planned, to be conducted with a sub-
group of the students taking part in the study. Welzel and Roth (1998) refer to the work of
Champagne et al. and Wandersee et al. when they argue that “for research purposes,
interviews are often considered among the most reliable ways for determining what a
person knows” (p. 25).
The interviews would provide the opportunity of interaction between interviewer
and interviewee. This would help collect more in-depth information about students’
thinking, providing more insight into ideas which students use as they “articulate their
reasoning…”, giving students the opportunity to “develop both reasoning ability and
conceptual clarity” (Shaffer & McDermott, 1992, p. 1008). The plan was to try to evaluate
students’ progress in understanding electric circuits by conducting these interviews weekly
with some of the student sample, as the course on electric circuits was being followed. The
interviews would focus on concepts which students would indicate as being difficult to
grasp, after having been administered the pre-test.
3.6.2.2 The type of interview to choose
Interviews can be conducted in many different ways, depending on the data one
expects to collect. Cohen et al. (2001) claim that:
Kvale (1996: 126-127) sets the several types of interview along a series of
continua, arguing that the interviews differ in their type of purpose, their degree
of structure, the extent to which they are exploratory or hypothesis testing,
whether they seek description or interpretation, whether they are largely
cognitive-focused or emotion-focused. (p. 270)
In this study, the choice fell on the use of semi-structured interviews. A semi-
structured interview moves away from the formalised set of questions that symbolise the
structured interview. An interview schedule for a semi-structured interview would include
the topics and the open-ended questions to be discussed but “the exact sequence and
wording does not have to be followed with each respondent” (Cohen et al., 2001, p. 278).
Denzin and Silverman (as cited in Cohen et al., 2001) claim that a semi-structured
interview “permits flexibility rather than fixity of sequence of discussions, and it enables

86
participants to raise and pursue issues and matters that might not have been included in a
pre-devised schedule” (p. 147).
This type of interview fitted the purpose for this study because it would allow
for more probing of ideas, when the situation required it, with the aim of having students
make an answer more elaborate and clear, better understood by the interviewer, hence
allowing for better reliability of interpretation. On the other hand, “by standardizing the
interviews to some degree”, as is allowed for by using semi-structured interviews, “the
researcher preserves a degree of comparability across interviews” (Shank, 2006, p. 50) –
another quality which was expected to be of help in the analyses of the data.
3.6.2.3 The use of the Predict-Observe-Explain technique through interview sessions
The Predict-Observe-Explain (POE) technique offers an effective way for
probing understanding (White & Gunstone, 1992). The importance of POEs in research
has been indicated by various research studies (Shipstone, 1985b; Shipstone, 1988;
Clement & Steinberg, 2002; Shaffer & McDermott, 1992). During a POE task, reasons for
predictions made are asked for, as well as reasons for any explanations given if the
prediction is incorrect and another idea is offered instead. This can bring the student to a
situation which Lawson (as cited in Westbrook and Rogers, 1994) refers to as “reasoning
to a contradiction” (p. 73). There is thus the implication of conflict which arises within the
individual and which, solved or unsolved, still leads the way to meta-cognition of the
learning process. Thus students themselves can decide what they know or don’t know,
being given the possibility to take some control of their learning.
Interviews were being planned to probe understanding and the mental models
students use. Holt (1982) suggests that we can try to get behind students’ ideas and
understanding by giving them something to do with which they can test their own
understanding, without the teacher having to tell them what is right. Moreover, Driver
(1991) argues that in making meanings and probing students’ thinking in some detail, “it is
the reasons pupils give for their answers, and not the answers themselves, that are
important” (p. 26). Studies reported by Coll et al. (2005) suggest that “in order to
successfully develop conceptual understandings in science, learners need to be able to
reflect on, and discuss their understandings of scientific concepts as they are developing
them” (p. 194). Prain and Hand (1999) and Constantinou and Papadouris (2004) also refer
to how discussions help to improve understanding, making learning meaningful. Thus,

87
using predict-observe-explain tasks through the interviews was seen as covering these
important aspects, probing understanding while also helping it to develop.
Plans were made to supply students with simple apparatus which they would use
through the sessions. This would give them a hands-on experience, which many a student
is usually enthusiastic about. It was envisaged that by making students’ thinking explicit
and encouraging self-reflection, POEs would help in pointing out existing mental models
of circuits to both student and researcher.
3.6.2.4 Deciding on who to interview
In an earlier study which I had conducted (Borg Marks, 1998) I had the
opportunity of experiencing the intensive drive exhibited by academically gifted students
in the way they approach learning. Winner (1997) calls this “the rage to master” (p. 4).
The importance of interviewing students of different ability, including the high ability
ones, could thus not be ignored.
While it was hypothesized that the lower and average ability students would help
by exposing their existing unhelpful ideas, the views of the higher ability students would
show where meaningful learning could take all students. Moreover, there was the
possibility that even the higher ability students would indicate problems in understanding
some of the key concepts. If that were the case, then this would indicate complex concepts
requiring a higher level of reasoning ability to be understood. Thus, the possibility of
gauging the level at which different mental models can exist within a hierarchy of models
would be increased.
3.6.2.5 Instruments to help choose the student sub-group for interview sessions
While the performance on the pre-test would be an indication of students’ ability
to handle questions related to content, the possibility of some students doing well in a test
through rote learning could not be ruled out. Since my aim was to probe students’ mental
models, and since these models are likely to evolve through reflection and thought, it was
decided that it would be useful to have an indication of students’ level of logical reasoning
as well. A number of tests that would help in this were identified, and a decision on the
best test to fit the purpose, in this situation, was taken after conducting pilot studies (see
section 3.7 for further discussion).

88
3.6.3 Qualitative and quantitative data
The use of diagnostic tests and interviews would generate quantitative and
qualitative data. Qualitative and quantitative approaches are two distinct ways of carrying
out research, both having their advantages and disadvantages (see Jacobs, Kawanaka, &
Stigler, 1999). These authors claim that:
Academics have begun to argue that qualitative and quantitative approaches can
serve complementary functions: qualitative research can be used to generate new
questions and theories, which can then be tested through quantitative means, and
later revised or expanded through further qualitative study, and so on. The call
is now frequently made for researchers to incorporate these two traditions, and
when possible, to draw on the strengths of both in a single-study design. (p. 718)
Thus, planning for the collection of both types of data was thought of as making
the study more thorough, approaching it using different perspectives complementing each
other. Moreover, according to Feldman (2003), qualitative and quantitative data can
support and challenge one another, helping to increase the trustworthiness of a study.
3.6.4 Introducing additional teaching activities during the course
3.6.4.1 The aims of introducing additional teaching activities
The introduction of additional teaching activities during the course was aimed at
helping students:
• reflect more deeply on key concepts related to the topic, trying to reduce the macro-
micro gap between current and static electricity;
• come to terms with the abstract nature of the topic by trying to improve their
visualization of how the electric circuit works, and in so doing, possibly understanding
why it works that way.
3.6.4.2 The teaching activities planned to be included in the course
• Revision of the static electricity course
At the college, students cover the topic of static electricity, with another lecturer, during
their first year of study. This may help in making students learn static and current
electricity in a fragmented way. Moreover, Eylon and Ganiel (1990), Licht (1991),

89
Viennot and Rainson (1992) have referred to the macro-micro gap — the missing link
between static and current electricity. These authors see the macro-micro gap as a
problem which limits the understanding of key concepts related to circuits. It was thus
planned to cover static electricity again with the students, at the beginning of the second
year (see section 3.8.5 referring to the implementation of this activity), helping students
to reflect deeper on the concepts they had already been exposed to, with the hope that
the link between concepts learned in static and current electricity would be made, thus
improving understanding.
• Preparing a DVD
I edited a DVD (Great Pacific Media Physics Essentials, 1996) related to static and
current electricity and which was available as a teaching resource at my physics
department, so that I would show it to the students through class time. A section on the
DVD focused on presenting the entire electric circuit filled with mobile charges
represented as tiny spheres. These spheres would be shown moving together as the
current flows. The aim was to help students in their mental visualization of current,
making it look less abstract and more concrete, perhaps helping in the evolution of
mental models of the electric current towards the scientific view.
• Preparing a PowerPoint presentation
A number of studies and physics books (Mee, Arnold, Crundell, & Brown, 2000;
Hewitt, 2002; Paatz et al., 2004 amongst others) dealing with current electricity refer to
analogies between electricity and other ideas in physics, like for example, water circuits
and gravitational potential energy. It was thus decided to prepare a PowerPoint
presentation, to make students aware of these analogies, hopefully setting the spark for
students’ deeper reflections and helpful visualizations aiding understanding.
3.7 The pilot studies
3.7.1 Choosing the reasoning test to use
One of the methods which aims at judging levels of development is based on the
Piagetian tradition (Kieting, 1976). In a previous research study (Borg Marks, 1998), the
cognitive level of students with whom I was working was gauged using tests of logical
90
thinking adapted from Piaget’s original experiments described in Inhelder and Piaget
(1966). These tests which had been conducted on a one-to-one basis had proved laborious
and very time consuming to conduct and analyze. In the present study, the possibility of
administering a group test was intriguing. This would allow for quicker processing of the
data, with a larger sample.
3.7.1.1 The group tests identified
Three group tests were identified:
• ‘Reasoning Tasks’ prepared by Shayer, Adey, Kuchemann & Wylam (1973/78).
These tasks are based on the experiments by Inhelder and Piaget. After careful
examination of a set of tasks, two were chosen. These were the ‘The Pendulum’ (see
Appendix 4) and ‘Equilibrium in the Balance’ (see Appendix 5) which test control of
variables and proportional reasoning, respectively. These tasks were chosen from the set
available because it was thought that the apparatus required would be readily available in
the department where I teach, the tasks were simple to administer, and they tested ideas
which students had come across in their previous physics studies.
• The TOLT (Test of Logical Thinking) created by Tobin and Capie (1981) (see
Appendix 5).
This paper-and-pencil test probes five aspects of formal reasoning, namely:
• Proportional Reasoning;
• Controlling Variables;
• Probabilistic Reasoning;
• Correlational Reasoning;
• Combinatorial Reasoning.
Tobin and Capie (1981) state that TOLT “provides a means of assessing formal
reasoning ability as a diagnostic aid for teachers or as data for researchers investigating the
nature of learning” (p. 422). Moreover, they state that “whether subjects use formal
reasoning, or not, may be ascertained from their reasons for developing or choosing a
response” (p. 414). In fact, each question in TOLT requires both an answer and a
justification for it.
91
• Lawson’s Classroom Test of Scientific Reasoning (Arizona State University, revised
August 2000)
This test looks into seven different aspects of reasoning as well as some of these
aspects combined together, namely:
• Conservation of weight;
• Conservation of displaced volume;
• Proportional thinking;
• Advanced proportional thinking;
• Identification and control of variables;
• Identification and control of variables and probabilistic thinking;
• Probabilistic thinking;
• Advanced probabilistic thinking;
• Correlational thinking (includes proportions and probability);
• Hypothetico-deductive thinking.
Comparing the Lawson test with the TOLT, I concluded that while the Lawson
Test looks into more aspects of formal reasoning, yet it is a much longer test, allowing
students less time to think before answering. The length of the test was considered to be a
disadvantage. Students were expected to finish the test during class time and TOLT, being
more concise, would allow them more time to think. Having made these considerations, it
was decided that the tests which would be pilot tested with students would be the TOLT
and the two reasoning tasks. Piloting of these tests was done to discover how students
interacted with the test questions and to check the time students needed to finish the tests.
‘The Pendulum’ task was administered first, during a one hour class, to students
I was teaching in 2005. These were taking Physics at advanced level, similar to the
students who would later form the sample for the ‘Action’ part of the study. All students
accepted to take part in the piloting of the tests. Had any of the students decided not to
participate they would have been allowed to work on their own in class.
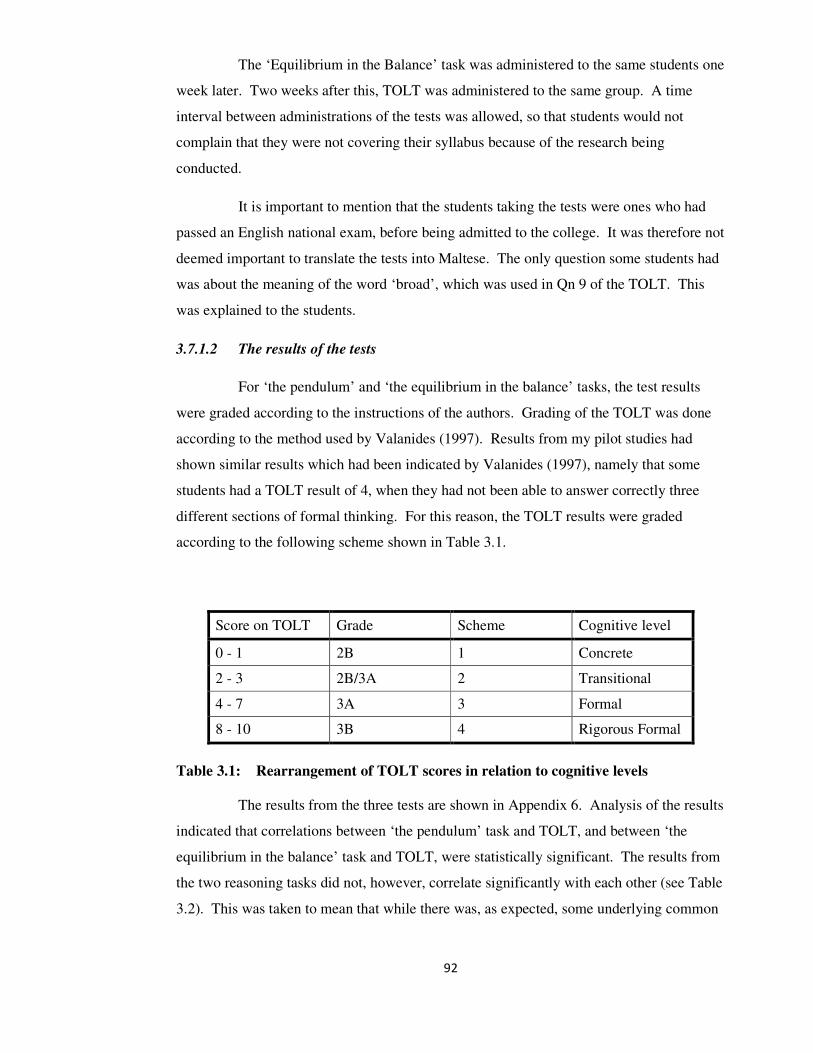
92
The ‘Equilibrium in the Balance’ task was administered to the same students one
week later. Two weeks after this, TOLT was administered to the same group. A time
interval between administrations of the tests was allowed, so that students would not
complain that they were not covering their syllabus because of the research being
conducted.
It is important to mention that the students taking the tests were ones who had
passed an English national exam, before being admitted to the college. It was therefore not
deemed important to translate the tests into Maltese. The only question some students had
was about the meaning of the word ‘broad’, which was used in Qn 9 of the TOLT. This
was explained to the students.
3.7.1.2 The results of the tests
For ‘the pendulum’ and ‘the equilibrium in the balance’ tasks, the test results
were graded according to the instructions of the authors. Grading of the TOLT was done
according to the method used by Valanides (1997). Results from my pilot studies had
shown similar results which had been indicated by Valanides (1997), namely that some
students had a TOLT result of 4, when they had not been able to answer correctly three
different sections of formal thinking. For this reason, the TOLT results were graded
according to the following scheme shown in Table 3.1.
Score on TOLT Grade Scheme Cognitive level
0 - 1 2B 1 Concrete
2 - 3 2B/3A 2 Transitional
4 - 7 3A 3 Formal
8 - 10 3B 4 Rigorous Formal
Table 3.1: Rearrangement of TOLT scores in relation to cognitive levels
The results from the three tests are shown in Appendix 6. Analysis of the results
indicated that correlations between ‘the pendulum’ task and TOLT, and between ‘the
equilibrium in the balance’ task and TOLT, were statistically significant. The results from
the two reasoning tasks did not, however, correlate significantly with each other (see Table
3.2). This was taken to mean that while there was, as expected, some underlying common

93
factor between each reasoning task and the TOLT, yet the reasoning tasks required
different reasoning abilities.
N= 37
Pair Pearson correlation Sig (2-tailed)
TOLT / Balance 0.461** 0.004
TOLT / Pendulum 0.496** 0.002
Pendulum / Balance 0.202 (not significant) 0.232
Table 3.2: Comparing the results on the three tests
Through this piloting exercise it was noted that TOLT was easier to mark, and
that it was a test which was of the type which the students were used to doing - a paper-
and-pencil test which students could answer in a quiet classroom environment. Moreover,
TOLT discriminated between students in a similar way as the other tests. The choice thus
fell on using TOLT as the instrument which would be used together with the Physics
Diagnostic pre-test, to select students to be interviewed.
3.7.2 Piloting of the PDT
Important things that were taken into account whilst finalizing the question set
before piloting were:
• the syllabus in current electricity which students were expected to have covered at
secondary level (see Appendix 1).
The questions chosen were based on ideas which students had already been exposed to,
with some questions trying to extend students’ reasoning further than others.
• the duration of the test.
I used my judgement in deciding how many questions to include in the test, keeping in
mind that students had to finish the test in a one hour lecture period.
• the wording used in the chosen questions.
Consistent wording was used in the test questions chosen. This was meant to improve
the possibility of making questions more clearly understood.
• the circuit diagram presentation.

94
Consistency in circuit diagram presentation was also adhered to, trying to make
the test set-up more uniform. A lot of thought was put into deciding where best to put the
battery symbol in the circuit. For this reason, various text books used locally were
consulted (Farrell, 2004; Johnson, 1996; Mee et al., 2000; Xuereb, 1999, 2007). It was
found that the majority of the diagrams used in these books had the battery drawn in the
centre of the top or bottom line of the circuit diagram. When reference was made to
potential difference, however, some text books quite often used the analogy of electrical
with gravitational potential. When this was done, the battery was drawn on one side line,
with the positive terminal on top to indicate a higher potential. While I believe that this
analogy is a strong and useful one, only a minority of circuit diagrams were presented this
way in the text books. The decision taken was thus to draw the battery symbol on the top
line of the circuit diagrams. This was the representation which was showing up as most
commonly used in the text books, and thus the one which students would be more familiar
with. The aim was to try to reduce students’ problems referred to by Gott (1985a),
McDermott and Shaffer (1992) and Shaffer and McDermott (1992) related to diagram
interpretation .
Seventeen questions from the question bank were chosen and administered as
class tests with my students in 2005/2006, and 2006/2007. This was done to check
whether students encountered difficulties with understanding the chosen questions, in
which case changes would be made. Moreover, it was also important to check whether
students were being given enough time to answer the test questions during the normal one
hour of class time.
No problems were in fact encountered. These questions formed the pre-test (see
section 4.2).
3.7.3 Piloting of the Predict-Observe-Explain (POE) tasks used in
interviews
As explained in section 3.6.2.3, POE tasks were planned to be used during
interview sessions. POEs may be conducted either on a one-to-one level (White &
Gunstone, 1992) or with groups of students (Thornton, 2008; Thornton, 2009; Sokoloff &
Thornton, 1997). Some questions from the question bank that students found difficult to
answer were chosen and used during POE tasks (Borg Marks, 2007, 2009a, 2009b). The
POEs were used with individual students and also with groups of students, having a

95
maximum of three students within each group. This was done to help in deciding whether
this study would benefit from POEs used on a one-to-one basis or with a group of students.
At the same time, the piloting served as practice in conducting an interview,
asking questions which do not lead students’ views, while at the same time encouraging
students to voice their thoughts. It was observed that when students participated in groups,
conflicting ideas invariably surfaced and students were discussing and learning from each
other, but there was the disadvantage that those students who did not find it easy to speak
their mind were put somewhat out of the limelight by students who wanted to speak all the
time. Thus it was sometimes difficult to follow the ideas of all the students in the group.
POEs on a one-to-one basis, on the other hand, made it more possible to hear what
individuals had to say, without there being any interfering influence of ideas from listening
to the views of others. At the same time, conflicting ideas were still given the possibility
to surface because of the nature of the POE technique itself. These still contributed to self-
reflection and revision of intuitive ideas when required, in the drive to come up with valid
reasons for why electric circuits function in the way they do. Thus, the learning pathway
followed by the student, in terms of mental models implied, could be made evident.
The piloting of the POEs helped in deciding that for the purpose of this study,
mental models could be better probed during interviews with individual students since in
such cases the student could not rely on peers for explanations proposed.
3.8 Putting the plans into action
3.8.1 The sample for the 1st cycle
Plans were put into action at the beginning of the scholastic year 2007/2008.
Sixty-one students who attended my lectures in Physics at advanced level during that
scholastic year, and who were in their second year at the college, formed the sample of the
1st cycle of the study.
3.8.2 Administering the pre-test
The pre-test (see section 4.2) was given to students at the very start of the
course, so that the ideas and reasoning that students seemed to be using before the teaching
could be gauged.

96
3.8.3 Administering the TOLT
The TOLT was administered to the same student sample one week later.
3.8.4 Conducting the interviews
3.8.4.1 Choosing the students to be interviewed
Students’ performance in the physics diagnostic pre-test and the TOLT was used
to select candidates for the sub-group to be interviewed. Once the tests were scored, the
results of the PDT and the TOLT were compared.
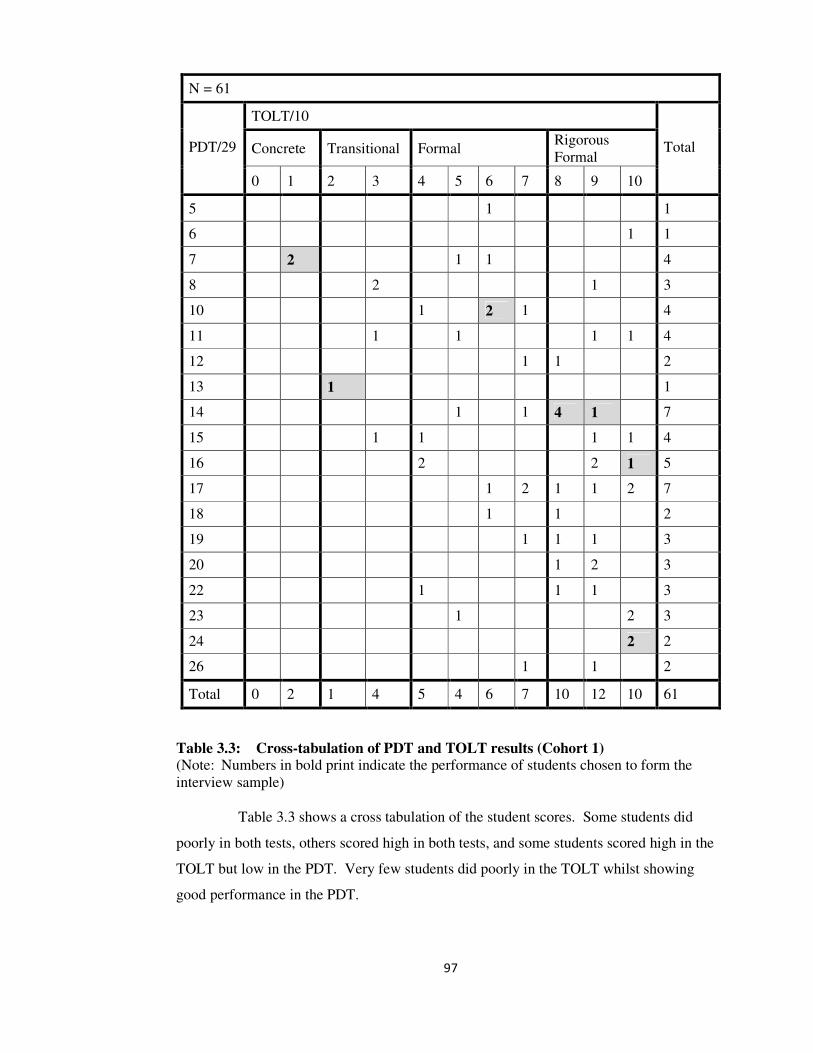
97
N = 61
TOLT/10
Concrete Transitional Formal Rigorous
Formal PDT/29
0 1 2 3 4 5 6 7 8 9 10
Total
5 1 1
6 1 1
7 2 1 1 4
8 2 1 3
10 1 2 1 4
11 1 1 1 1 4
12 1 1 2
13 1 1
14 1 1 4 1 7
15 1 1 1 1 4
16 2 2 1 5
17 1 2 1 1 2 7
18 1 1 2
19 1 1 1 3
20 1 2 3
22 1 1 1 3
23 1 2 3
24 2 2
26 1 1 2
Total 0 2 1 4 5 4 6 7 10 12 10 61
Table 3.3: Cross-tabulation of PDT and TOLT results (Cohort 1) (Note: Numbers in bold print indicate the performance of students chosen to form the
interview sample)
Table 3.3 shows a cross tabulation of the student scores. Some students did
poorly in both tests, others scored high in both tests, and some students scored high in the
TOLT but low in the PDT. Very few students did poorly in the TOLT whilst showing
good performance in the PDT.

98
Analysis also showed that there was a strong and statistically significant
correlation between the results of the two tests (see Table 3.4). There were, however, quite
a number of students with a good TOLT result but whose PDT result was not as high as
expected. These students who were categorized as formal and rigorous formal thinkers
were not showing such a good understanding of the work they had covered on circuits at
secondary school level.
N = 61
Correlation Pearson Correlation Coefficient Sig. (2-tailed)
TOLT (Cohort 1) - PDT 0.425 0.001
Table 3.4: Correlation between PDT and TOLT scores
It was thus decided to choose students to be interviewed, from the three
following categories, namely:
• students judged to be at the concrete level of cognitive development and who performed
poorly in the PDT. These were graded as showing ‘Low Performance ’ (L);
• students judged to be at the rigorous formal level of cognitive development but who
showed an average to poor performance in the PDT. These were graded as showing
‘Average Performance’ (A);
• students judged to be at the rigorous formal level of cognitive development and who
also showed good performance in the PDT. These were graded as showing ‘High
Performance’ (H).
Interviewing students of low performance might help to clarify the problems that
they were encountering in the understanding of circuits. It was also deemed important to
find out what was causing the students with apparently good reasoning ability to perform
poorly in the PDT. Interviews with students scoring high on the TOLT and PDT were
intended to elicit the type of reasoning offered by such students and at the same time, to
demonstrate what one could expect from the other students at the same level of schooling.
A number of students in each of the three categories above were identified.
Observation of how students reacted in class interactions helped in finalizing a group of
students who would be asked to take part in the interviews. It was important to choose
students who would not find difficulty in talking about their ideas with the researcher.

99
Students selected in this way were then asked if they were willing to take part in
interviews (see Cohen et al., 2001; AAAS (American Association for the Advancement of
Science), 2008) in which they would be asked to elaborate on their views on key issues in
the topic of current electricity. The fact that the interviews were part of a research project
was explained. Students were advised that through their participation they themselves
could benefit in the better understanding of simple key ideas related to the topic, but they
were still told that it was up to them to decide whether they wanted to accept to participate
in the interview exercise or not. All the students who were contacted expressed their
willingness to participate in the proposed exercise. However, in some cases, it was
impossible to find a common free slot in the time-table for both interviewer and
interviewee. This factor had a strong influence on the final choice of the interview sample.
Appointments were fixed with nine students who could make themselves
available during school hours.
The criteria for the choice of students who participated in the interview sessions
may therefore be summarized as follows:
• student performance in the TOLT and PDT (Low, Average and High Performance
students were chosen);
• voluntary acceptance to participate in the interviews;
• the availability of students during the time when the lecturer/researcher would also be
available, during school hours;
• a fair knowledge of the students’ starting ideas regarding the topic in question and their
personal characteristics (for example the student finds it easy to express his/her views)
through class time interactions.
It is important to point out that the students were to be interviewed a number of
times. The process would be time consuming for both students and researcher, over and
above a normal school day. While the temptation, on the side of the researcher, was to
interview as many students as possible, it was important to be realistic and accept the
constraints of the situation. Other studies dealing with the analysis of thinking processes
and students’ reasoning have also interviewed small groups of students. Indeed, in the
research studies conducted by Clement and Steinberg (2002) and Niedderer (1994), only
one student’s line of thought and understanding was followed. In terms of the interview

100
sample size, this study therefore collected a stronger data base for analysis than some
previous published studies.
3.8.4.2 Classification of the students in the sub-group
Table 3.5 lists the nine students who participated in the interview sessions,
indicating their scores for the PDT and the TOLT. For ethical reasons, the names shown in
Table 3.7 are pseudonyms.
Name PDT/29 TOLT/10 Performance
Andi 7 1 Low (L)
(Concrete and poor performance in PDT)
John 7 1 Low (L)
(Concrete and poor performance in PDT)
James 13 2 Low (L)
(Transitional and poor performance in PDT)
Mari 10 6 Low (L)
(Formal but poor performance in PDT)
Kyle 14 8 Average (A)
(Rigorous formal but average performance in PDT)
Theri 14 9 Average (A)
(Rigorous formal but average performance in PDT)
Chris 16 10 Average (A)
(Rigorous formal but average performance in PDT)
Mitch 24 10 High (H)
(Rigorous formal and good performance in PDT)
Robi 24 10 High (H)
(Rigorous formal and good performance in PDT)
Table 3.5: Student classification – the interview sample
3.8.4.3 Choosing the interview questions
Clement and Steinberg (2002) claim that:
physicists and engineers are generally agreed that effective reasoning about
electric circuits requires a robust conception of electric potential. However,
research in the 1980s found that electric potential typically remains unlearned
after instruction (Closset, 1983; Cohen, Eylon, & Ganiel, 1983; Duit, Jung, &
von Rhoneck, 1985). Students reason exclusively with current and resistance
when possible, and when asked explicit questions about potential difference
many confuse the concept with current (p. 393).

101
Rosenthal and Henderson (2006) also argue that “introductory physics students
often fail to develop a coherent conceptual model of electric circuits. In part, this failure
occurs because the students did not develop a good understanding of the concept of electric
potential” (p. 324).
The above extracts place a clear emphasis on the importance of the
understanding of electric potential for effective reasoning about electric circuits. This was
a point which was kept in mind during the preparation of the tasks for the interviews. On
the other hand, the same ideas which guided the questions in the PDT had to be considered
also, because it was these same ideas which were to be consolidated and refined through
the interviews. Mental models of current, resistance and potential difference all needed to
be probed, with particular attention being given to students’ understanding of the concept
of potential difference.
Priority was thus given to probing ideas related to the following key points:
• how current flow is mentally visualized – the mental models of current;
• the idea of whether charges come out of the battery into an empty wire or whether
charges everywhere are made to circulate together;
• the role of the resistance and how it is pictured;
• whether it is just the number of resistances in the circuit which counts, or the way in
which they are connected in series and parallel circuits;
• the role of the battery and resistance in determining the current;
• what sense is given to a voltmeter reading, leading to ‘voltage’ or potential difference
and the way in which students imagine this physical quantity;
• how the p.d across the battery is related to the p.d. across resistors connected in series;
• how the p.d across the battery is related to the p.d. across resistors connected in parallel
with the battery;
• the differentiation of current and p.d.
Interview questions and schedules were planned carefully around these themes,
so that students’ ideas could be studied systematically. The aim was to get some insights

102
into mental models inferred by students. It was envisaged that through the interviews one
could catch that phrase or sentence which could guide the researcher towards the students’
mode of thinking, as this progressed and evolved, hopefully towards the scientific view. In
cases where progress was blocked, then the causes for this were of interest.
3.8.4.4 Conducting the interview sessions
The planned questions and interview schedules were used during POE tasks.
“Being interviewed is an uncommon, sometimes anxiety provoking experience for many
respondents” (Rizk, 2003), but using POEs was found to help students in realizing that
they could take charge of their learning by “automatically sieving out what does not fit
with what they have seen” (Cosgrove, 1995, p. 307). Students soon got used to what
Cosgrove (1995) calls “science-in-the-making” (p. 295), as opposed to having to ask for
what was right or wrong. During the POE, in predicting the result of an experiment giving
reasons for the prediction, and immediately getting feedback about their ideas by doing the
experiment, students were encouraged to reflect on their original prediction, possibly
correcting it, giving reasons. This helped in creating the space for mental model evolution.
Moreover, while the main objective was to use the interviews as a tool to probe
students’ mental models, the interviews were also serving as tutorial sessions, with the
students refining their own knowledge. Cohen et al. (2001) emphasize that “it is crucial to
keep uppermost in one’s mind the fact that the interview is a social, interpersonal
encounter, not merely a data collection exercise” (p. 279). This idea is also referred to by
Rizk (2003) and Welzel and Roth (1998), with the latter authors also emphasizing that
“interviews do not simply assess, but actually scaffold (or interfere with) the cognitive
activities of the interviewees” (p. 40). Welzel and Roth (1998) also point out the need for
interviewers to act expertly and be sensitive to the average level of complexity at which
interviewees’ engage, avoiding possible communication breakdown. Using interviews as
tools in this way, while adopting the recommendations from these studies, made the
interviewing exercise more effective for both interviewer and interviewees. Indeed, the
latter became intrinsically motivated, showing their will to wholeheartedly participate in
forthcoming interviews, knowing that they were getting something back in return for
voicing their thoughts.
Having said all this in favour of interviews, it is however worth mentioning that
the researcher was also aware of the possible errors that may result from data collected

103
during interviews. Interview data cannot be considered unproblematic as a source of data
on what students think. Inevitably, there is an interaction between the interviewer and the
interviewee which may result in the interviewee being influenced by what the interviewer
may say and do. Care was thus taken during interviews to build a good rapport with the
interviewees, trying to remain detached and professional, but at the same time relaxed and
friendly (Oppenheim, 1992).
The interviews were conducted in the physics laboratory so that the necessary
apparatus was available. Rizk (2003) refer to “the need for contextual naturalness of
response and setting” (p. 978) during interviews. Care was taken to allow time for
“participants to generate responses with little or no influence from the questions” asked
(Rizk, 2003, p. 978). Allowing students to handle the apparatus themselves helped in
making the interview more exciting and something students admitted they looked forward
to.
All interviews were audio-taped and transcribed before analysis was undertaken.
3.8.5 Conducting the additional teaching activities (1st cycle)
• The revision of the work on static electricity was done through the first tutorial sessions
conducted through the scholastic year. This revision emphasized the qualitative
reasoning involved in understanding the topic, especially with work related to potential
and potential difference.
• At the end of the course, the students were shown the DVD and the PowerPoint
presentation. The DVD was mainly shown to try and link the theory which had been
covered with the use of electricity in our everyday life, and to improve students’
visualization of how an electric circuit works as a system, indicating charge flow
through the circuit in all parts of the system at the same time, when current flows. The
PowerPoint aimed at using common analogies, relating other topics with electricity, to
help understand the electric circuit at work. Students were given time to discuss what
they had seen, and a number of them expressed the view that this had now helped them
to clear some of the doubts they had held through the course. The DVD and
PowerPoint presentation helped to summarize and conclude the study unit.
104
3.8.6 Administering the post-test with Cohort 1
At the end of the course, students sat for an assessment test based on the material
covered through the course. This was normal practice and students had prepared for the
test. A week later, students were given the diagnostic post-test (see section 4.2). This
consisted of 17 questions picked out of the question bank. Some questions were the same
as those on the pre-test. These were questions which a good number of students had found
difficult to answer. New questions were also added, mainly based on ideas dealing with
p.d. and current in parallel branches when changes are made to the circuit.
3.8.7 Administering the delayed post-test with Cohort 1
One month later, the students were given the delayed post-test. This consisted of
the same questions as the post-test.
3.8.8 Summary of the time frame for covering sub-sections of the topic
and data collection (1st cycle)
It is normal practice for advanced level students doing physics to be allotted two
lecture periods and a tutorial, each of a one hour’s duration, together with a two-hour
practical session, weekly. During a tutorial, students are usually working numerical
problems and discussing any difficulties they may have with qualitative answers to
questions. Through a practical session, students handle the apparatus assigned to them,
using it to devise an experiment to answer questions asked. In their write-up for the
experiment, students explain ideas which lead them to their conclusions.
The schematic drawing in Figure 3.2 shows a time frame which gives a general
indication of what students were being instructed in, during the lectures which were
conducted alongside the data collection exercise, as the project was gaining rhythm.
It is important to note that, inevitably, not all students could be interviewed on
the same day and that one can never know exactly what material students had covered on
their own. The good use students could make of their knowledge, through more elaborate
thinking, was the main objective of the interviews.

105
1st October 2007
Revision of static
electricity. LECTURES
TUTORIALS
Current as the rate of flow of charge.
Current as the slope of a current-time graph.
Intrinsic and extrinsic semiconductors.
The simple band theory of conduction.
The p-n junction diode.
LABORATORY
WORK
25th October 2007
Derivation of I=nave.
Resistances in series and in parallel with
related equations.
Reference to p.d. across resistors and current
through the resistors.
Ohm’s Law and V/I characteristics.
End October 2007
Pre-test
Introduction to circuits.
Resistivity, temperature coefficient of
resistance, conductivity and the related
equations plus numerical examples worked out.
Problems related to current
electricity from past
examination questions.
1st Interview
Kirchhoff’s Laws The characteristics of a fixed resistor
and a filament lamp.
2nd Interview
The charging and discharging of a
capacitor.
Energy and power in dc circuits.
The maximum power theorem.
The kilowatt hour as a unit of energy.
Started work on the potential divider and the
potentiometer.
The characteristics of
semiconductors.
3
rd Interview
The potential divider and the potentiometer.
4th Interview
The meter bridge circuit – measurement of
resistance including internal resistance.
End November 2007
The maximum power theorem.
The characteristics of a thermistor.
Resistance and resistivity.
End December 2007
Mid-January 2008 Post-test
Mid-February 2008 Delayed Post-test
Figure 3.2: The time frame for instruction and data collection (1st cycle)

106
3.9 Analysing and reflecting on the data collected with
Cohort 1
An analysis of the data that was collected in the 1st cycle is discussed in Chapters
4 and 5.
The 2nd
cycle of the action research had to reflect the outcomes of the study so
far. An examination of the results obtained with the Cohort 1 suggested that some changes
could be made concerning the additional teaching activities that would be used with the
Cohort 2. These changes will be described in detail in Chapter 6, once the analysis of the
data and the results obtained with the Cohort 1 have been exposed. The next section
briefly outlines the methods of data collection used with Cohort 2. Similarities and
differences between what was done during the two cycles of the action research will be
indicated.
3.10 The 2nd
cycle of the research project
The 2nd
cycle of the action research was conducted with my students taking
advanced level physics during the scholastic year 2008-2009. The sample now consisted
of 49 students. The same pre-test and the TOLT, used in the previous year with Cohort 1,
were administered to the Cohort 2 at the start of the course.
The same post-test was used a week after an assessment test had been conducted
with the students at the end of the course, similarly to what had been done during the
previous year.
Interviews with Cohort 2 were also conducted with some students of different
ability. In this case, however, the interviews were scheduled for after the post-test, with
the aim of exposing reasons for why certain problems in understanding were still
persisting, in spite of having used teaching activities which were meant to enhance
meaningful learning. Each interviewee was met on one occasion only.
The same delayed post-test, as used with Cohort 1, was also administered with
Cohort 2, one month after doing the post-test.
107
3.11 Analysis and reflection on the results of the 2nd
cycle -
suggestions for further work
The data collected during the 2nd
cycle of this work was analysed in a similar
way as data from the 1st cycle of the research. The findings are reported and discussed in
Chapter 6.
This study does not describe a 3rd
cycle of the research. This has not yet been
conducted because of time constraints in writing this thesis and also because the research
questions could still be answered using the results from the two cycles conducted.
Suggestions for further research are made in Chapter 7.
3.12 Addressing validity in action research
Validity refers to by how far an instrument or method measures what the
researcher has set out to measure. Different authors often refer to threats to validity
(Watkins, 1991), and how easy it is to slip into invalidity at any stage of a piece of research
(Cohen et al., 2001; Robson, 2002). The claim is that it is impossible for research to be
100% valid and that “at best we strive to minimize invalidity and maximize validity”
(Cohen et al., 2001, p.105). In this study, the question was how to maximize validity in
action research.
The literature regarding action research acknowledges the different
characteristics of action research which distinguish it from other forms of research.
Reason and Bradbury (2006) claim that the difference is not only in the method. They
specify that in action research “the distinction between researchers and subjects may
become quite blurred in the course of what is usually a lengthy, collaborative relationship.
Additionally, there is a different relative emphasis on the importance of action and its
relationship to conceptual insight” (p. xxiv). Another key characteristic of action research
is pointed out by Newman (1999) who refers to the work of Schon which describes the
situations reported in action research as being “unique from moment to moment”.
A problem arises due to the specific nature of action research. Robson (2002)
claims that this problem is due to the fact that the terms ‘reliable’ and ‘valid’ have “been
operationalized so rigidly in fixed design quantitative research” (p. 170). Kvale (as cited in
Reason and Bradbury, 2006) “questioned the validity of the very question of validity, that

108
is to say, raised a question as to whether we are foolishly trying to fit the qualities of action
research into a traditional discourse about validity whose concerns have little to do with
those of action research” (p. 343). Authors and researchers thus started to look for terms or
criteria better suited for action research.
Pioneers like Lincoln and Guba (1985), whose work is also cited in Bassey
(1999), Feldman (2003) and Robson (2002), suggested terms other than ‘reliability’ and
‘validity’ (which apply to surveys and experiments) that can be more useful to use when
discussing the outcome of a flexible research study. Lincoln and Guba (1985) used the
terms: credibility, transferability, dependability, and confirmability, when talking about the
‘trustworthiness’ of a finding or claim.
Reason and Bradbury (2006) argued in terms of “broadening the ‘bandwidth’ of
concerns associated with the question of what constitutes good knowledge
research/practice” (p. 343). These authors claim that in action research we need to shift
our concern towards “engagement, dialogue, pragmatic outcomes and an emergent,
reflexive sense of what is important” (p. 343). Feldman (2003) also shares this idea.
On the other hand, Newman (1999) points out that what is important is to see
that the research questions are answered and that the method by which this is done is
described with enough detail so as to make it possible for other readers to ‘resonate’ with
the work produced, trying to improve their practice (Newman 1999). This view which is
shared by other authors, including Reason and Bradbury (2006), emphasizes the clarity and
quality expected of the work produced, while at the same time, putting the reader in charge
of deciding whether a finding might be applied to other situations and thus whether it can
be considered generalizable.
All the issues outlined above were considered through all stages of this study,
with the aim of trying to make the work more trustworthy. Moreover, the point made by
Springer (as cited in Punch, 2009), that in action research “collaborative participation
becomes central” (p. 137), could not be ignored. In this study, such participation was not
only encouraged between the student and the researcher. As much as possible, it also
involved members of the thesis advisory group, including my supervisor, with whom
interpretations of the data collected could be shared, and with whom further plans and
actions could be decided upon. This helped in guarding against researcher bias, reducing
threats to validity (Robson, 2002). Furthermore, opportunity was taken to present sections

109
of the project at local and international conferences (Borg Marks, 2007, 2008, 2009a,
2009b) thus getting important feedback from the professional audience.
3.13 Conclusion
The research strategy described above focused on using different data collection
instruments to probe students’ understanding, with the aim of answering the research
questions.
Diagnostic test questions (mostly two-tier) and semi-structured interviews using
POE sessions were used in both cycles of the research, aimed at probing students’ ideas
and causal reasoning. Data was collected at different stages through the course of study.
Both qualitative and quantitative data were collected and measures to improve
the reliability and validity of the study were adopted.
Different teaching activities were organised through each cycle of the data
collection, aimed at trying to improve students’ qualitative understanding of the topic,
through guided reflection and discussion.
Moreover, in designing the research strategy the need to work with students of
different ability was acknowledged. Feedback was required about mental models which
different ability groups tend to use. The aim was to try and link all these mental models,
framing them into one picture, as learning pathways could be drafted. Students’ guided
reflection on the topic was directed at helping the academically weak so that these could
‘see’ the scientific models, while at the same time the academically able were helped in
clarifying their doubts. Thus, the research strategy described above, aimed not only at
collecting the data and analyzing it whilst answering the research questions, but also at
bringing about improved learning outcomes for the students.

110
Chapter 4 The Physics Diagnostic Tests (Cohort 1)
4.1 Introduction
This chapter analyses students’ performance and mental models used in the three
Physics Diagnostic Tests (PDTs) conducted with Cohort 1 (see section 3.8.8 for an
indication of when these tests were performed with students). An overall look at students’
performance on the pre-test is first presented, before a detailed description of the analysis
of students’ answers in this test in terms of mental models students seemed to have been
using is exposed. A comparison is then made between student performance on the pre-test
and the post-test, focusing mainly at how students’ understanding may have changed after
the teaching. Further changes in students’ responses to the delayed post-test are then
briefly described. The analysis points to important findings corroborating previous
literature, as well as findings which are specific to this particular sample and study.
4.2 The questions asked in the tests
Appendix 3 shows a question bank including all questions used in the pre-, post-
and delayed post-tests. Table 4.1 shows which questions from the question bank were used
in these tests. A description of the type of question used is also included.

111
Ques
tio
n n
um
ber
in t
he
ques
tio
n
ban
k
Ques
tio
n n
um
ber
in t
he
pre
-tes
t
Ques
tion t
itle
Ques
tio
n t
ype
Ques
tio
n n
um
ber
in t
he
post
-/
del
ayed p
ost
-tes
t
1 PR 1 Current at points (a) and (b) Two-tier (3 x 3 options) PO 1
4 PR 2 Microscopic views of circuit True/False (6 parts) PO 2
9 PR 3a;
3b
Current conservation at
junctions and within a parallel
branch; Parallel resistors’
control of current
True/False; Yes/No with open ended
explanation
9’ Two-tier (3 options x open response);
Yes/No with open ended explanation PO 7(a); 7(b)
5 PR 4 Use of a larger resistance Two-tier (4 x 4 options)
6 PR 5 Adding an equal resistance in
series Two-tier (4 x 5 options) PO 3
8 PR 6 Adding an equal resistance in
parallel Two-tier (3 x 3 options) PO 4
3 PR 7 Picture of battery and bulb Two-tier (3 x 4 options) PO 5
7 PR 8 Increasing the variable
resistance Two-tier (4 x 4 options) PO 6
10 PR 9 Increase of supply voltage
indicated numerically Two-tier (3 x 3 options)
2 PR 10 Current using two ammeters Two-tier (4 x 3 options)
12 PR 11 p.d. across resistances and
ideal connecting wires Multiple choice (6 parts, 4 options each)
12’ Multiple choice (3 parts, 4 options each) PO 8
13 PR 12 p.d. across equal resistances
in series
Multiple choice part (a) (5 options); open
ended reason for part (b) PO 9
14 PR 13 p. d. across unequal
resistances in series
Multiple choice part (a) (4 options); open
ended reason for part (b) PO 10
11 PR 14 Connecting another battery in
series Two-tier (4 x 4 options)
15 PR 15 p.d. across equal parallel
resistors
Short answer with open ended
explanation PO 11
16 PR 16 p.d. across unequal parallel
resistors
Short answer with open ended
explanation PO 12
17 PR 17 p.d. across an open and closed
switch 3 short answers
17’ p.d. across an open and closed
switch 2 short answers with open explanations PO 13
19
Addition of a battery in
parallel with the first:
Voltmeter reading
Two-tier (4 x 4 options) PO 14
20
Addition of a battery in
parallel with the first:
Ammeter reading
Two-tier (3 x 4 options) PO 15
21
Addition of a parallel resistor:
effect on the current within a
branch; effect on the current
within the main circuit
Two-tier (3 x 4 options) each
PO 16 (a) and
(b);
PO 16 (c) and
(d)
18 p.d. across a resistor, adding
another resistor in parallel Two-tier (3 x 3 options) PO 17
Table 4.1: Test questions related to question number in the question bank
(Note: ’ represents a question which was adapted from the question with the same number
in the pre-test.)

112
For ease of reference, from here onwards, all question numbers refer to the number
of that question in the Question Bank.
4.3 A look at students’ overall performance in the pre-test
4.3.1 Scoring the test answers
4.3.1.1 Why scoring was important
Seventeen questions were asked on the pre-test. Test scores were important to
provide an overall measure of each student’s performance on the understanding each test
was assessing. Pre-test scores were also used, together with students’ performance on the
TOLT, to identify possible interview candidates.
4.3.1.2 The method adopted for scoring the answers
As indicated in Table 4.1, questions asked were of a different type. It was
decided to allocate scores as follows:
• when the question was of the two-tier multiple choice type, one mark was scored for a
correct part (a) answer in conjunction with a correct reason in part (b);
• in Qn 4 about microscopic views of circuits, which consisted of six parts, a mark was
scored when the student answered correctly and consistently to two parts of the
question, which were deemed complimentary to each other. Thus, in all, 3 marks were
allotted for Qn 4. The same approach was used in all questions of this type;
• when answers requested a prediction and an open response from the student, as in Qn
15, one mark was allotted for correct prediction with correct explanation;
• when no justification was asked for in parts of the question, as in Qn 17, one mark was
scored for each correct response.
4.3.2 Students’ scores on the pre-test
Figure 4.1 shows students’ scores out of a total of 29, on the pre-test. These
indicate a normal distribution and confirm that students in the sample were of different
ability.

113
Figure 4.1: Students’ pre-test marks
4.3.3 Facility values
A simple measure of student performance on each question is the facility value
(the fraction of the sample giving correct answers). This value was calculated for all part
questions, and for groups of questions which included reasons for students’ answers, or
indicated consistency in students’ views. Facility values for the pre-test questions are
shown in Table 4.2. Results are shown sorted in rank order according to the facility
values. Coloured data bars help to indicate the levels of difficulty experienced.
Facility values were used to judge whether a question would be asked again in
the post-test. Easy questions were omitted in the post-test, while new questions based on
course work, which could not have been asked in the pre-test as the points they probe had
not yet been taught, had to be introduced.
Moreover, facility values helped in decisions as to which questions would be
explored in interviews with students.
4.3.4 Item-total correlation
The item-total correlation coefficient (Pearson) was also calculated for each item.
These values, considered along with the facility value of the question, help to identify
questions which may provide unreliable data. The results are also included in Table 4.2.
Coloured data bars have been used to compare correlation values. Questions like 4(a+d),
Mean score = 15.2 out of 29 (52.5%)

114
4(b+e), 9a(i), 5, 6 and 17b(ii), asked in the pre-test, showed a very poor correlation with
the total mark scored, pointing to a poor discrimination between students who knew the
material and those who did not.
Table 4.2: Pre-test results (Cohort 1) expressed in rank order according to facility
values
(Note: * = significant to 5% level; ** = significant to 1% level)
(This table continues on the following page)

115
Table 4.2 (continued): Pre-test results (Cohort 1) expressed in rank order according to
facility values (Note: * = significant to 5% level; ** = significant to 1% level)
It can be seen that question Qn 17b(ii), for example, has a low correlation
coefficient and facility value. There are also questions with a low item-total correlation
coefficient, and a high facility value, such as Qn 5. Such situations are not unexpected
because, when a question is very easy, then few students answer it incorrectly, some of
these being students with high overall score who make a careless mistake on this question.
Similarly, when a question is too difficult, only a few answer it correctly and this probably
includes some weak students who happened to guess correctly.
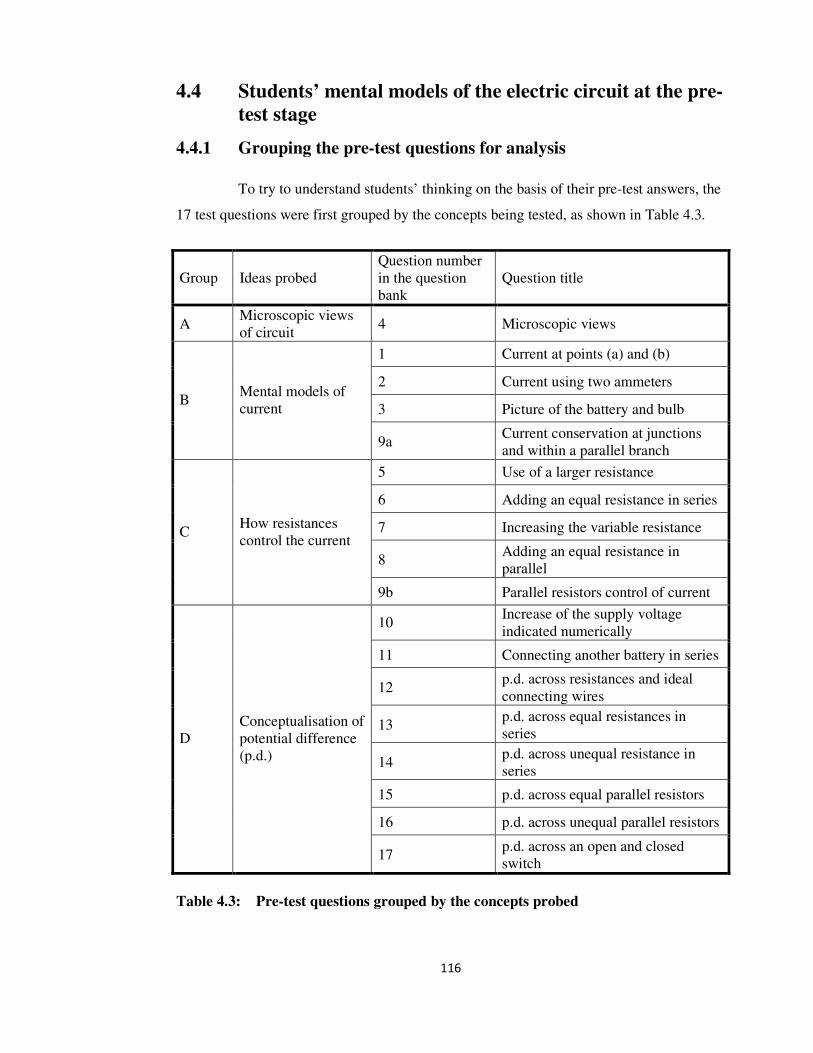
116
4.4 Students’ mental models of the electric circuit at the pre-
test stage
4.4.1 Grouping the pre-test questions for analysis
To try to understand students’ thinking on the basis of their pre-test answers, the
17 test questions were first grouped by the concepts being tested, as shown in Table 4.3.
Group Ideas probed
Question number
in the question
bank
Question title
A Microscopic views
of circuit 4 Microscopic views
1 Current at points (a) and (b)
2 Current using two ammeters
3 Picture of the battery and bulb B
Mental models of
current
9a Current conservation at junctions
and within a parallel branch
5 Use of a larger resistance
6 Adding an equal resistance in series
7 Increasing the variable resistance
8 Adding an equal resistance in
parallel
C How resistances
control the current
9b Parallel resistors control of current
10 Increase of the supply voltage
indicated numerically
11 Connecting another battery in series
12 p.d. across resistances and ideal
connecting wires
13 p.d. across equal resistances in
series
14 p.d. across unequal resistance in
series
15 p.d. across equal parallel resistors
16 p.d. across unequal parallel resistors
D
Conceptualisation of
potential difference
(p.d.)
17 p.d. across an open and closed
switch
Table 4.3: Pre-test questions grouped by the concepts probed

117
4.4.2 Students’ problems with microscopic views of circuit
Qn 4 was the only question which made direct reference to electric charges
present and moving in wires and through the battery. While this question was deemed very
important, it was not used as the first question on the test. Instead a simpler question was
placed first, to put students at ease as they start answering the test questions. Qn 4 was a
long question with six parts (see Figure 4.2). The question consisted of pairs of
complementary statements exploring three ideas, in order to be able to check responses for
consistency.
Figure 4.2: Qn 4 - ‘Microscopic views of circuit’
4.4.2.1 Where do charges reside?
Parts (a), (d), (c) and (f) of Qn 4 probed whether students visualized charges as
residing only in the battery, being pushed out of it when the circuit is connected, much
like water coming out of a pipe, or whether they saw the charges already present
everywhere and moving simultaneously when the circuit is switched on.

118
A cross-tabulation between parts (a) and (d) (see Table 4.4) shows that only 10
students out of 61 (16%), answered both these part questions correctly. Indeed, almost half
(27; 44%) believed that the free charges resided in the battery and that these only move
into the wires once the circuit is switched on. Twenty-four students, (19 +5; 39%), gave a
wrong answer to one part question, showing inconsistent views.
Qn4(d)
Correct Incorrect
Total
Correct 10* 5 15 Qn4(a)
Incorrect 19 27 46
Total 29 32 61
Table 4.4: Results to parts (a) and (d) of Qn 4
(Note: * shows the correct answer)
Similarly, in parts (c) and (f) only 13 students (31.3%) gave correct answers to
both questions (see Table 4.5). Many students thus had unscientific views about where
free charges reside in an electric circuit, before and after the circuit is connected.
Qn4(f)
Correct Incorrect
Total
Correct 13* 14 27 Qn4(c)
Incorrect 16 18 34
Total 29 32 61
Table 4.5: Results to parts (c) and (f) of Qn 4
4.4.2.2 Combining the results of parts (a), (d), (c) and (f) for Qn4
Table 4.6 shows that 53% of the students made a mistake in 2 or more part
questions. This is a high percentage, indicating inconsistent ideas which suggest weak
understanding and poor ability to visualize how charge moves and behaves in an electric
circuit.

119
Table 4.6: Comparing answers to parts (a), (d), (c) and (f) of Qn 4 - ‘Microscopic
views’
4.4.2.3 Summary of problems with the microscopic ‘image’ of a circuit
Many students saw charges as residing within the battery, moving out when the
circuit is switched on. A poor understanding of charge behavior was indicated.
4.4.3 Students’ models of current
4.4.3.1 Introduction
A number of questions were meant to probe students’ models of current (see
Table 4.3, Group B). These were aimed at indicating popular ideas amongst students as to
whether current is conserved or not, in simple circuits and within parallel branches.
4.4.3.2 Performance on Qn 1 and Qn 2
Of the questions in Group B, Qn 1 (Figure 4.3) and Qn 2 (Figure 4.4) were the
most similar in format and presentation. It was thus expected that students would be
consistent in their response if they held a specific model of current strongly in their mind.
The analysis of these responses was indeed indicative of the main mental models of current
used by the sample.
Students’ responses to Qn 1 are shown in Table 4.7. The models of current
which the students appeared to be using in this question were thus indicated, and are shown
in Table 4.8.
Combination of
responses to parts
(a), (d), (c), (f)
Number of students
with this pattern as a
response
Percentage
(N=61)
All parts correct 8 13%
3 parts correct 7 12%
2 or more parts
incorrect 32 53%
All parts incorrect 14 23%

120
Figure 4.3: Qn 1 - ‘Current at points (a) and (b)’
Qn1(b)
i ii iii
Total
i 0 17 1 18
ii 0 1 0 1 Qn1(a)
iii 40* 0 2 42
Total 40 18 3 61
Table 4.7: Number of students giving responses to Qn 1
(Note: * indicates correct responses)

121
Answer to
Qn1(a)
Answer to
Qn1(b)
Mental model
consistent with
answers
Mental model
code
Number of
students
Percentage
(N=61)
(iii) (i) Conservation of
current CC 40* 66%
(i) (ii)
Attenuation of
conventional
current
ACC 17 28%
(i) (iii)
Attenuation of
conventional
current
ACC 1 2%
(ii) (ii) Attenuation of
electron flow AEF 1 2%
(iii) (iii) Clashing
currents CL 2 3%
Table 4.8: Mental models of current used in Qn 1 – ‘Current at points a and b’
While the majority (40 students; 66%) held the scientific view of current
conservation (CC), 18 students held an attenuated conventional current view (ACC). The
latter view could be a consequence of students not being able to discriminate between
current flow and energy transfer (Shipstone, 1988; Shipstone and Gunstone, 1985). Even
though the number was small, it was rather surprising to find that two students gave
answers consistent with the clashing current (CL) model - a model which is usually
exhibited by younger students (Fleer, 1994).
In Qn 2 (Figure 4.4), 42 students (69%) answered parts (a) and (b) correctly (see
Table 4.9). The 19 students who answered part (a) incorrectly also chose an incorrect
option to part (b). Students either conserved the current or held an attenuation view.
Qn2(b)
i iii
Total
i 2 0 2
ii 0 42* 42 Qn2(a)
iii 17 0 17
Total 19 42 61
Table 4.9: Students’ answers to Qn 2 - ‘Current using two ammeters’

122
Figure 4.4: Qn 2 - ‘Current using two ammeters’
Table 4.10 shows the mental models of current consistent with students’ answers
to Qn 2.
Answer to
Qn2(a)
Answer to
Qn2(b)
Mental model
consistent with
answers
Mental model
code
Number of
students
Percentage
(N=61)
ii iii Conservation of
current* CC 42* 69%
iii i
Attenuation of
conventional
current
ACC 17 28%
i i Attenuation of
electron flow AEF 2 3%
Table 4.10: Mental models of current in Qn 2 - ‘Current using two ammeters’
These results show that no student chose the (a)(iv) / (b)(ii) option, indicating
that no-one saw ‘all’ the current being used up by the resistor. It was more common,
therefore, for these students to think in terms of ‘some’ of the current only, as being used
up. In this question, no clashing current views were evidenced.

123
4.4.3.3 Consistency shown in mental models used in Qn 1 and Qn 2
Model Qn2
CC AEF ACC
Total
CC 36* 1 3 40
ACC 4 1 13 18
AEF 0 0 1 1
Model
Qn1
CL 2 0 0 2
Total 42 2 17 61
Table 4.11: Mental models of current in Qn 1 and Qn 2
By checking students’ answers to Qn 1 and Qn 2, consistency in students’
answers could be probed. Table 4.11 indicates that in these two questions, out of the four
questions in group B, a substantial number of students were consistent in their ideas.
Thirty six students (59%) consistently conserved the current, whereas 13 students (21%)
showed ideas consistent with the ACC model. The results also show that some students
were still confused at this stage, choosing one answer based on current conservation and
another based on attenuation.

124
4.4.3.4 Conservation of current in a more complicated circuit
Figure 4.5: Qn 9 - ‘Current conservation at junctions and within a parallel branch’
Qn 9(a) (Figure 4.5) probed whether students used conservation of current at
junctions and within parallel branches.
N=61
Qn9(a) (i) (ii) (iii) (iv) (v)
Statement d+b = a b larger than c b = c a larger than e a = e
Frequency of
correct answers 58 42 40 47 46
Percentage 98% 69% 66% 77% 75%
Table 4.12: Results to Qn 9(a) - ‘Current conservation at junctions and within a
parallel branch’
The results shown in Table 4.12 indicate that almost all students (98%) saw
current as conserved at a junction. The percentage of correct answers in the other four
parts never rises as high, even though more than half of the sample answered correctly in
each part.
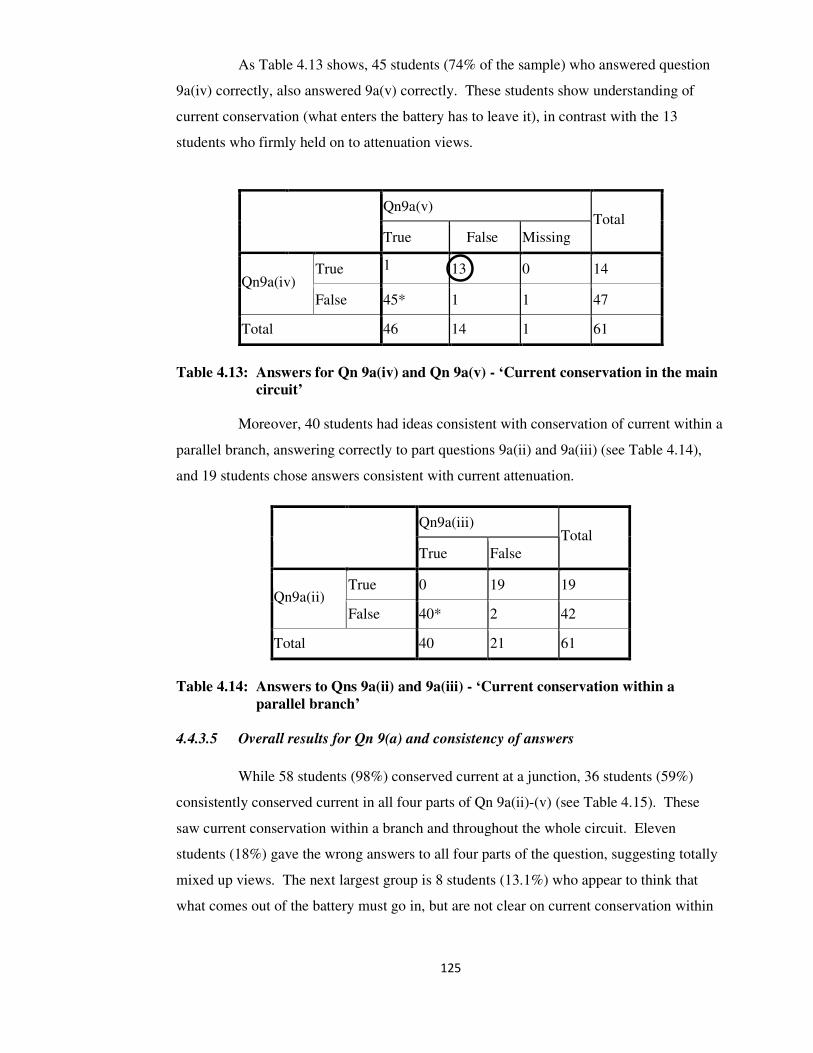
125
As Table 4.13 shows, 45 students (74% of the sample) who answered question
9a(iv) correctly, also answered 9a(v) correctly. These students show understanding of
current conservation (what enters the battery has to leave it), in contrast with the 13
students who firmly held on to attenuation views.
Qn9a(v)
True False Missing
Total
True 1 13 0 14 Qn9a(iv)
False 45* 1 1 47
Total 46 14 1 61
Table 4.13: Answers for Qn 9a(iv) and Qn 9a(v) - ‘Current conservation in the main
circuit’
Moreover, 40 students had ideas consistent with conservation of current within a
parallel branch, answering correctly to part questions 9a(ii) and 9a(iii) (see Table 4.14),
and 19 students chose answers consistent with current attenuation.
Qn9a(iii)
True False
Total
True 0 19 19 Qn9a(ii)
False 40* 2 42
Total 40 21 61
Table 4.14: Answers to Qns 9a(ii) and 9a(iii) - ‘Current conservation within a
parallel branch’
4.4.3.5 Overall results for Qn 9(a) and consistency of answers
While 58 students (98%) conserved current at a junction, 36 students (59%)
consistently conserved current in all four parts of Qn 9a(ii)-(v) (see Table 4.15). These
saw current conservation within a branch and throughout the whole circuit. Eleven
students (18%) gave the wrong answers to all four parts of the question, suggesting totally
mixed up views. The next largest group is 8 students (13.1%) who appear to think that
what comes out of the battery must go in, but are not clear on current conservation within

126
the parallel branch. This result may indicate that students find it easier to think of current
conservation to/from the battery rather than before/after a resistor.
Response patterns for the part
questions in Qn9(a)
Number of students
with indicated
response pattern
Percentage
(N=61)
(a)(ii), (a)(iii), (a)(iv), (a)(v)
X, X, X, X 11 18%
X, X, , 8 13%
, X, X, 1 2%
, , X, X 2 3%
, X, , 1 2%
, , , X 2 3%
, , , 36* 59%
Table 4.15: Different response patterns for questions 9a(ii) to 9a(v) (Key: Response for part questions to Qn 9: X = wrong answer; = correct answer)
The cross-tabulation of results in Table 4.16 for Qn 9a(ii) to 9a(v), Qn 1 and Qn
2 shows that 33 students (54%) gave answers consistent with the CC model in all
questions. Moreover, of the 11 students who gave no correct response to Qn 9a(ii) to
9a(v), none used current conservation models consistently in both Qn 1 and Qn 2. This
implies that 44 students (33+11; 72%) were indicating ideas consistent with either the
scientific conservation model or the attenuation model, in the various test questions.

127
Model Qn2 Combination
9a(ii) to 9a(v) Model Qn1
CC AEF ACC
CC 0 0 1
ACC 2 1 6
XXXX
CL 1 0 0
AEF 0 1
XX ACC 1 6
XX XX
CC 1
X X
ACC 1
CC 0 1
XX ACC 1 0
X X
CC 2
CC 33 1 1
CL 1 0 0
Table 4.16: Different response patterns for Qn 9a(ii) to (v) compared to ideas
indicated in Qn 1 and Qn 2
4.4.3.6 Summary of students’ ideas about current
Almost all students conserved current at a junction. More than half the students
consistently used current conservation in a simple circuit. About one quarter attenuated the
conventional current. No student had the view that all current would be used up by the
resistor. Moreover it seemed that current conservation to/from the battery was more easily
understood than conservation before/after a resistor.
4.4.4 How resistance controls the current
4.4.4.1 Introduction
Questions in Group C probed whether students recognized that it is the
resistance control on the battery push which decides the current in the circuit. Some
questions also probed students ideas related to the effect of resistances within parallel

128
branches. Students were expected to know that increasing the resistance in the circuit
results in a smaller current, even if, having students at this stage using ideas consistent with
models that focus only on the battery or resistances separately, was also considered a
possibility.
4.4.4.2 Resistance as a control of the battery push
In Qn 5 (Figure 4.6), 51 students (84%) gave a scientifically correct response.
These students saw that, all else being constant, the bigger the resistance, the smaller the
current (see Table 4.17).
Figure 4.6: Qn 5 - ‘Use of a larger resistance’

129
Qn5(b)
i ii iii iv
Total
i 0 1 0 0 1
ii 1 0 1 4 6
iii 0 51* 2 0 53 Qn5(a)
iv 0 1 0 0 1
Total 1 53 3 4 61
Table 4.17: Results to Qn 5 - ‘Use of a larger resistance‘
No student chose answer a(i) with b(iii), reflecting ‘the more of A, the more of
B’ model (Andersson, 1986; Stavy & Tirosh, 1996). Four students appeared to hold the
alternative conception that ‘the same battery provides the same current’, whatever the
resistance (see Chabay & Sherwood, 1999; Cohen et al., 1983; Eylon & Ganiel, 1990;
Licht, 1991; McDermott & van Zee, 1985; McDermott & Shaffer, 1992; Shipstone 1985b,
1988; Steinberg & Wainwright, 1993; Thacker, Ganiel & Boys, 1999). Only 2 students
looked locally at the increased resistance, thinking this ‘needs’/absorbs more current
(Maichle, 1981). The results are shown in Table 4.18.
Answer to
Qn5(a)
Answer to
Qn5(b)
Mental model
consistent with
answers
Mental model
code
Number of
students
Percentage
(N=61)
iii ii
Scientific
(R as a control
to the battery
push)
SCI(R) 51 84%
ii iv Same battery,
same current BAT 4 7%
iii iii
I gets smaller
because larger R
‘needs’ bigger I
R-TAKE
2 3%
Others Unclassified U 4 7%
Table 4.18: Mental models of resistance in Qn 5
4.4.4.3 Consistency of students’ responses about resistance
Qn 5 and Qn 7, ‘Increasing the variable resistance’ (Figure 4.7), were very
similar, both in question format and in the wording used.
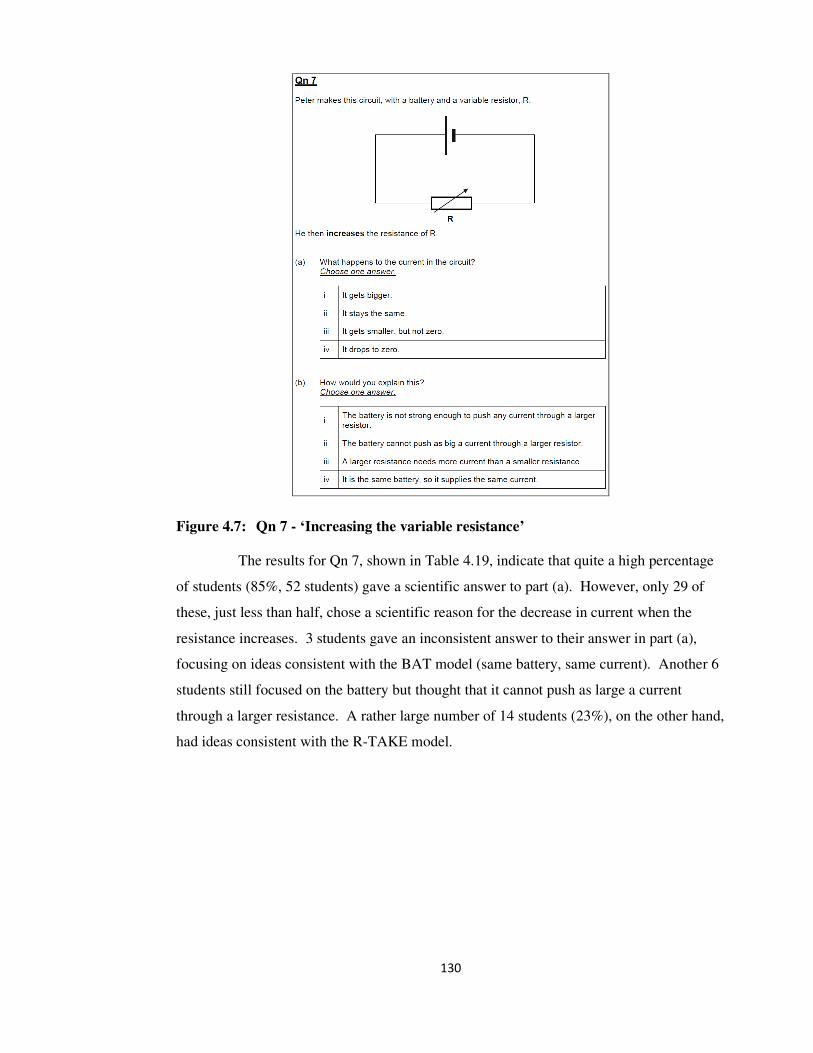
130
Figure 4.7: Qn 7 - ‘Increasing the variable resistance’
The results for Qn 7, shown in Table 4.19, indicate that quite a high percentage
of students (85%, 52 students) gave a scientific answer to part (a). However, only 29 of
these, just less than half, chose a scientific reason for the decrease in current when the
resistance increases. 3 students gave an inconsistent answer to their answer in part (a),
focusing on ideas consistent with the BAT model (same battery, same current). Another 6
students still focused on the battery but thought that it cannot push as large a current
through a larger resistance. A rather large number of 14 students (23%), on the other hand,
had ideas consistent with the R-TAKE model.

131
Qn 7(b)
i ii iii iv
Total
i 0 0 0 1 1
ii 1 0 0 7 8 Qn 7(a)
iii 6 29* 14 3 52
Total 7 29 14 11 61
Table 4.19: Answers to Qns 7(a) and 7(b) - ‘Increasing the variable resistance’
Students’ answers and the mental models of resistance these were consistent
with are shown in Table 4.20.
Answer to
Qn7(a)
Answer to
Qn7(b)
Mental model
consistent with
answers
Mental model
code
Number of
students
Percentage
(N=61)
iii ii Scientific SCI(R) 29* 48%
ii iv Same battery,
same current BAT 7 12%
iii iii
A larger
resistance
‘needs’ more
current
R-TAKE 14 23%
Others Unclassified U 11 18%
Table 4.20: Mental models of resistance in Qn 7
Considering all answers, the BAT model appeared common amongst students,
with 7 students (12%) answering in line with this model.
When answers to part (a) of Qns 5 and 7 were compared (see Table 4.21), the
results indicated that in both questions the same 50 students could recall, or perhaps even
understand that the increased resistance helps to decrease the current. Only 29 students,
however (see Table 4.20), could consistently select a scientific reason for why this
happens. This is thus strong evidence of recall of information which is not backed by
proper scientific understanding. At the same time, it was noted that more students seemed
to have been confused in choosing the correct reason for the answer to Qn 7, when the
variable resistor was shown in the circuit, than for Qn 5, when the first resistance was
changed for a larger one (Tables 4.19 and 4.17).

132
Qn7(a)
i ii iii
Total
i 0 0 1 1
ii 1 5 0 6
iii 0 3 50* 53 Qn5(a)
iv 0 0 1 1
Total 1 8 52 61
Table 4.21: Comparing answers to Qn 5(a) and Qn 7(a)
4.4.4.4 The effect on current of adding an equal resistance in series
The analysis of Qn 6 (Figure 4.8) again suggested recall of information without
appropriate scientific backing.
Figure 4.8: Qn 6 - ‘Adding an equal resistance in series’

133
Qn6b
i ii iii iv v Missing
Total
i 0 0 0 2 0 0 2
ii 1 0 4 0 7 0 12
iii 1 16* 2 9 13 1 42
iv 1 1 1 0 1 0 4
Qn6a
Missing 0 0 0 0 0 1 1
Total 3 17 7 11 21 2 61
Table 4.22: Student’s answers to Qn 6 - ‘Adding an equal resistance in series’
Table 4.22 shows that of the 42 students (69%) who gave the correct answer to
Qn 6(a), only 16 (26%) could select the correct explanation for the effect of the increased
resistance.
The mental models students appeared to use in Qn 6 are shown in Table 4.23.
Answer to
Qn6(a)
Answer to
Qn6(b)
Mental model
consistent with
answers
Mental model
code
Number of
students
Percentage
(N=61)
iii ii
Scientific
(R as a control
to the battery
push)
SCI(R) 16* 26%
i iv
More of A, more
of B; direct
proportion
More A,
More B 2 3%
iii iv
More resistors
‘need’ more
current
R-TAKE 9 15%
iii v Sharing model SHARE 13 21%
ii iii Same battery,
same current BAT 4 7%
Others Unclassified U 17 28%
Table 4.23: Mental models in Qn 6 - ‘Adding an equal resistance in series’
Nine students who chose options a(iii) and b(iv) seemed to think of resistance in
terms of the R-TAKE model. While this model puts the resistance at the focus of students’
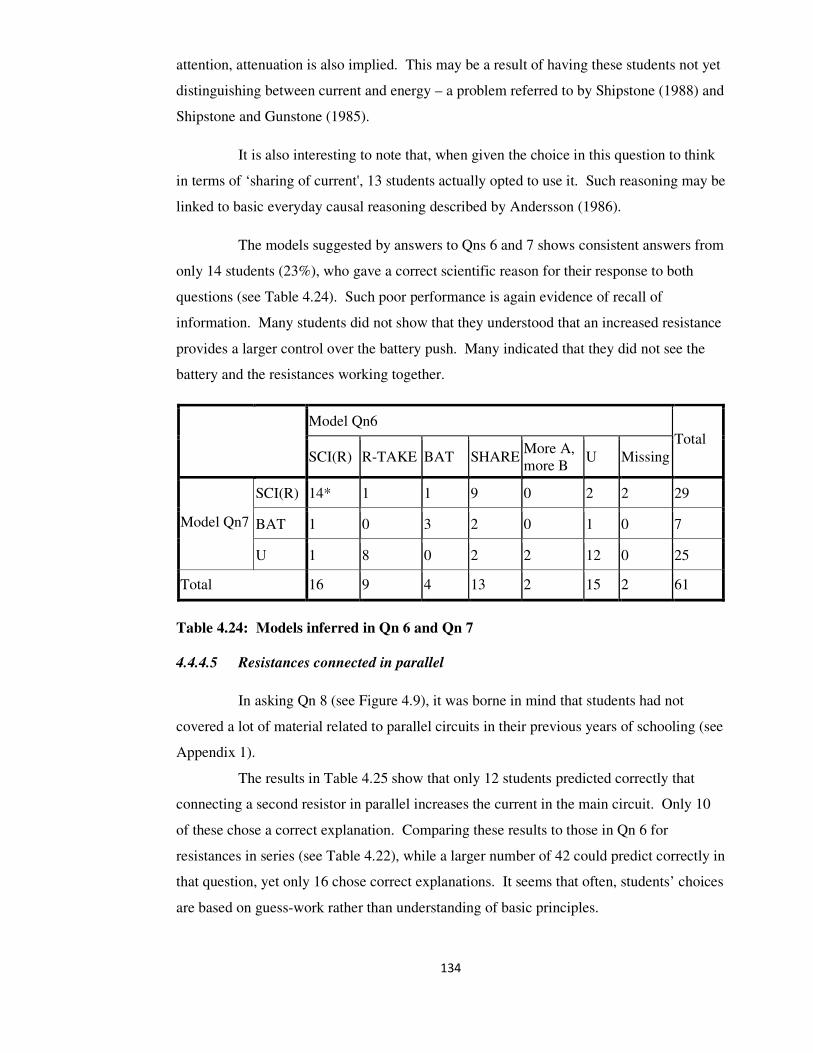
134
attention, attenuation is also implied. This may be a result of having these students not yet
distinguishing between current and energy – a problem referred to by Shipstone (1988) and
Shipstone and Gunstone (1985).
It is also interesting to note that, when given the choice in this question to think
in terms of ‘sharing of current', 13 students actually opted to use it. Such reasoning may be
linked to basic everyday causal reasoning described by Andersson (1986).
The models suggested by answers to Qns 6 and 7 shows consistent answers from
only 14 students (23%), who gave a correct scientific reason for their response to both
questions (see Table 4.24). Such poor performance is again evidence of recall of
information. Many students did not show that they understood that an increased resistance
provides a larger control over the battery push. Many indicated that they did not see the
battery and the resistances working together.
Model Qn6
SCI(R) R-TAKE BAT SHARE More A,
more B U Missing
Total
SCI(R) 14* 1 1 9 0 2 2 29
BAT 1 0 3 2 0 1 0 7 Model Qn7
U 1 8 0 2 2 12 0 25
Total 16 9 4 13 2 15 2 61
Table 4.24: Models inferred in Qn 6 and Qn 7
4.4.4.5 Resistances connected in parallel
In asking Qn 8 (see Figure 4.9), it was borne in mind that students had not
covered a lot of material related to parallel circuits in their previous years of schooling (see
Appendix 1).
The results in Table 4.25 show that only 12 students predicted correctly that
connecting a second resistor in parallel increases the current in the main circuit. Only 10
of these chose a correct explanation. Comparing these results to those in Qn 6 for
resistances in series (see Table 4.22), while a larger number of 42 could predict correctly in
that question, yet only 16 chose correct explanations. It seems that often, students’ choices
are based on guess-work rather than understanding of basic principles.

135
Figure 4.9: Qn 8 - ‘Adding an equal resistance in parallel’
Qn8(b)
i ii iii missing
Total
i 1 10* 0 1 12
ii 1 15 12 0 28 Qn8(a)
iii 5 12 3 1 21
Total 7 37 15 2 61
Table 4.25: Students’ answers to Qn 8

136
Table 4.26 shows the mental models students appear to have used in Qn 8.
Answer to
Qn8(a)
Answer to
Qn8(b)
Mental model
consistent with
answers
Mental model
code
Number of
students
Percentage
(N=61)
i ii
R in parallel
branch provides
extra path – I
increases
SCI(R) 10* 16%
ii iii Same battery,
same current BAT 12 20%
iii i
Only the number
of resistances
count, not how
they are
connected
R↑, I↓ 5 8%
Others U 34 56%
Table 4.26: Mental models used in Qn 8 - ‘Adding an equal resistance in parallel’
The large number of unclassified responses indicates that many students were
not making informed decisions. However, an important point noticed was that, out of the
34 students with an unclassified response, 27 (encircled in Table 4.25) could ‘see’ the
‘extra path’ offered by the second resistor connected in parallel, even if in part (a) the
prediction was incorrect. This may be an indication that teaching parallel circuits in terms
of added extra paths across the first resistor “may be a simpler conceptual step from mono-
circuits than progressing to circuits with several resistors in series” (Millar and Beh, 1993,
p. 353).
It was also worth noticing that once again the ‘same battery, same current’
model (BAT) resurfaced quite strongly. However, general statements must be made
carefully since a cross-tabulation with Qn 7 indicated that only 3 of the students who used
the BAT model in Qn 8, also used it in Qn 7 (see Table 4.27). On the other hand, there is
also the possibility that students’ confusion because of limited knowledge about parallel
resistors may have affected results.

137
Model Qn8
SCI(R) BAT R↑, I↓ U
Total
SCI(R) 7* 4 2 6 29
BAT 0 3 0 4 7 Model
Qn7
U 3 5 3 14 25
Total 10 12 5 34 61
Table 4.27: Comparing models in Qn 7 and Qn 8
4.4.4.6 The control of current by resistors in different branches
Analysis of Qn 9(a) in section 4.4.3.4 has already shown how a majority (98%)
of the students could conserve current at a junction. Qn 9(b), (see Figure 4.5 for Qn 9)
partly of an open-response type, probed further into how students saw the current splitting
at a junction and the effect of unequal resistors in parallel branches. Students were
expected to say that the currents through the branches were unequal since a larger
resistance in a branch would allow the passage of a smaller current.
In order to categorize responses, a method similar to that used by Millar and Gill
(1996) to analyze open ended responses, was adopted. The following examples indicate
how the analysis was conducted.
Some students gave a correct and complete answer, like the following:
‘No. This is because the resistances are not equal. Hence, the current passing
through each will be different.’
‘No. If the resistor and the bulb have the same resistance they will be equal, but
if not the currents are different.’
Other students gave a correct but incomplete answer, as in the following
example:
‘No. This is because there is the filament lamp and the resistor; they have
different resistances’.
Here, the effect on the current is implied but not specifically mentioned.
On the other hand, there were students who suggested equal splitting regardless of the
resistance values - an unscientific view.

138
‘Yes. This is so, since current is divided equally between branches of a parallel
circuit’.
The results in Table 4.28 show that only 58% of the students answered correctly,
providing scientific reasons for their answer.
Answer to
Qn9(b): ‘Yes/No’? Explanation
Number of
students
Percentage
(N=61)
Correct + complete 23* 38%
‘No’ Correct + incomplete 10* 16%
Unclassified explanation 2 3%
Correct and complete 1* 2%
‘Yes’ Equal division of current at a
junction because in parallel 17 28%
Others 7 12%
Missing ‘Yes/No’
answer
Correctly explaining that if R=L,
then the current would be equal 1* 2%
Table 4.28: Answers to Qn 9(b) - ‘Parallel resistors’ control of current’
A good number of students (17; 28%) expressed the view that current divides
equally between 2 parallel branches, thus not appreciating current control by resistances
within each branch.
4.4.4.7 Summary of students’ ideas about resistance
While many students could state that as the resistance increases the current
decreases, giving the correct reason for this was not always easy. When the resistance was
increased, many students did not see the resistances working with the battery as a system,
controlling the current. The R-TAKE model, the BAT and the SHARE models seemed to
be easily used by some students. About one quarter of the sample split the current equally
between parallel branches in a circuit. Moreover, students indicated they could easily ‘see’
the extra path for charge flow offered by a parallel branch, even if they still did not relate
this to an increase in the current before and after the branching points.

139
4.4.5 Conceptualization of potential difference
4.4.5.1 Introduction
Questions in Group D probed students’ understanding of p.d. While it was
expected that students would know that increasing the p.d. would increase the current in
the circuit, all else being kept constant, yet, knowing that students had not been exposed to
a lot of ideas about p.d. at this stage, the possibility that not many would differentiate p.d.
from current was not ruled out.
4.4.5.2 Changing the driving force – changing the supply voltage
Figure 4.10: Qn 10 - ‘Increase of the supply voltage indicated numerically’
In Qn 10 (Figure 4.10), 41 students (67%) answered scientifically, appreciating
that an increase in p.d. of the battery increases the current because the battery can now
exert a bigger push (see Table 4.29). A further 6 students appreciated the presence of a
bigger push, but did not equate this with an increase in current. Another 5 students had

140
ideas consistent with an R-TAKE model (Koumaras, Kariotoglou & Psillos, 1997;
Maichle, 1981), focusing primarily on the same resistance ‘needing’ the same current.
Qn10(b)
i ii iii
Total
i 3 2 41* 46
ii 5 0 6 11 Qn10(a)
iii 2 1 1 4
Total 10 3 48 61
Table 4.29: Results for Qn 10
Figure 4.11: Qn 11 - ‘Connecting another battery in series’
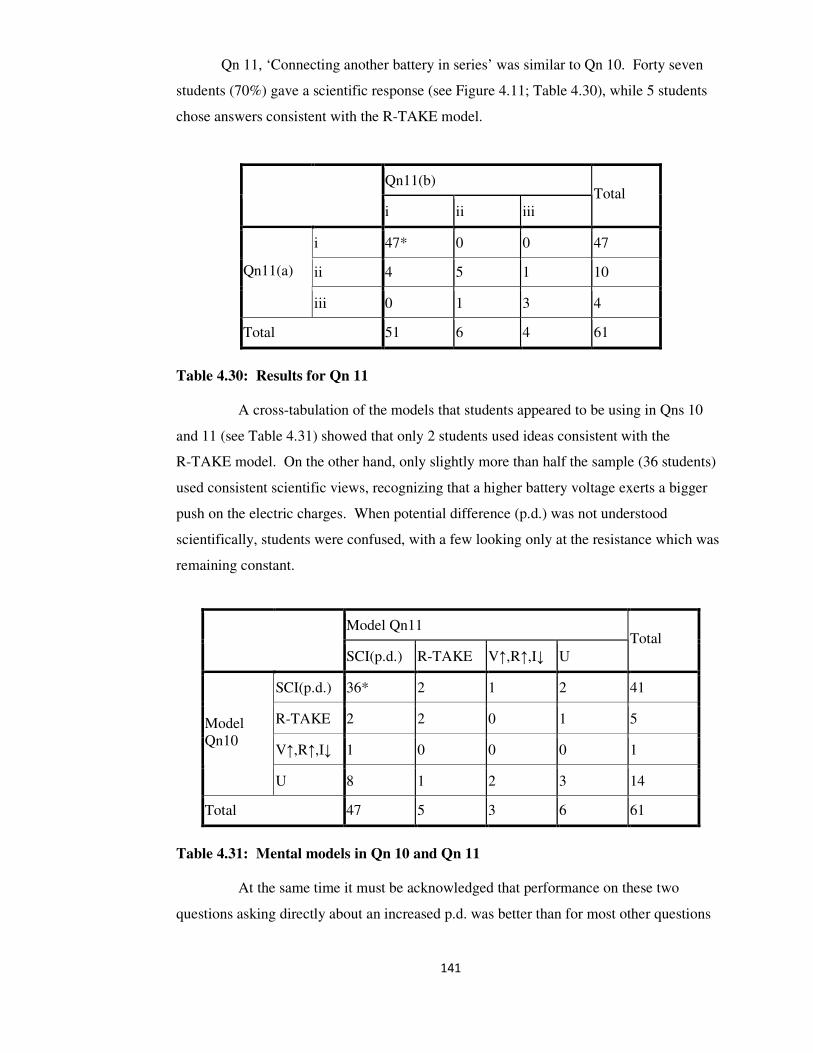
141
Qn 11, ‘Connecting another battery in series’ was similar to Qn 10. Forty seven
students (70%) gave a scientific response (see Figure 4.11; Table 4.30), while 5 students
chose answers consistent with the R-TAKE model.
Qn11(b)
i ii iii
Total
i 47* 0 0 47
ii 4 5 1 10 Qn11(a)
iii 0 1 3 4
Total 51 6 4 61
Table 4.30: Results for Qn 11
A cross-tabulation of the models that students appeared to be using in Qns 10
and 11 (see Table 4.31) showed that only 2 students used ideas consistent with the
R-TAKE model. On the other hand, only slightly more than half the sample (36 students)
used consistent scientific views, recognizing that a higher battery voltage exerts a bigger
push on the electric charges. When potential difference (p.d.) was not understood
scientifically, students were confused, with a few looking only at the resistance which was
remaining constant.
Model Qn11
SCI(p.d.) R-TAKE V↑,R↑,I↓ U
Total
SCI(p.d.) 36* 2 1 2 41
R-TAKE 2 2 0 1 5
V↑,R↑,I↓ 1 0 0 0 1
Model
Qn10
U 8 1 2 3 14
Total 47 5 3 6 61
Table 4.31: Mental models in Qn 10 and Qn 11
At the same time it must be acknowledged that performance on these two
questions asking directly about an increased p.d. was better than for most other questions

142
about resistance, shown in section 4.4.4. Clearly, many students find it easier to predict
effects on current by an increased p.d. rather than by changes made to circuit resistances.
4.4.5.3 P.d. across equivalent points in the circuit
Qn 12, ‘p.d. across resistances and ideal connecting wires’ (Figure 4.12), probed
ideas about how p.d. is distributed across series components.
Figure 4.12: Qn 12 - ‘p.d. across resistances and ideal connecting wires’
Students’ answers are shown in Table 4.32.

143
(N=61)
Number of students choosing each answer
Qn12 More than 6V 6V Less than 6V Zero
(a) 1 54* 4 2
(b) 2 40* 16 3
(c) 2 35 9 15*
(d) 1 10 49* 1
(e) 0 10 46* 5
(f) 1 30 11 19*
Table 4.32: Answers to Qn 12 - ‘p.d. across resistances and ideal connecting wires’
Parts (a), (b), (c) and (f) looked into students’ views regarding equivalent points
in a circuit. Results to Qn 12(a) show 54 students who could see that a voltmeter reading
indicates the value of the p.d. across two points in the circuit. Of these 54 students, only
38 (62%; see Table 4.33) indicated that they could transfer the knowledge from part (a) to
stating the p.d. value across equivalent points in the circuit, answering correctly to part (b).
Qn 12(b)
>6V 6V <6V Zero
Total
> 6V 0 1 0 0 1
6V 2 38* 12 2 54
<6V 0 1 3 0 4 Qn 12(a)
Zero 0 0 1 1 2
Total 2 40 16 3 61
Table 4.33: Students’ answers for Qn 12(a) and Qn 12(b)
A substantial number of students (12, encircled; 20%) answered ‘less than 6V’
in part (b), after answering part (a) correctly. This may imply that these students saw
‘something’ being wasted in the connecting wires.
Parts (c) and (f) of the question both required the knowledge that it is scientifically
accepted that there is no p.d. across an ideal connecting wire. Performance in these two

144
questions was very poor indeed (see Table 4.34). Twenty-six students consistently
answered ‘6V’ to both parts of the question, when the answer should be ‘zero’. The 5
students who chose the 6V/zero options may point toward problems with distinguishing
p.d. from potential, ‘seeing’ a potential of 6 V at one end of the battery and 0 V at the other
end.
Qn12(f)
>6V 6V <6V Zero
Total
>6V 1 1 0 0 2
6V 0 26 4 5 35
<6V 0 2 6 1 9 Qn12(c)
Zero 0 1 1 13* 15
Total 1 30 11 19 61
Table 4.34: Answers to Qn 12(c) and Qn 12(f) - ‘p.d. across connecting wires’
4.4.5.4 Predicting and explaining potential difference across series resistors
Qns 13 and 14 probed students’ ideas of potential difference across equal and
unequal resistances connected in series. Part (b) of both questions asked for an open
response (Figures 4.13 and 4.14).
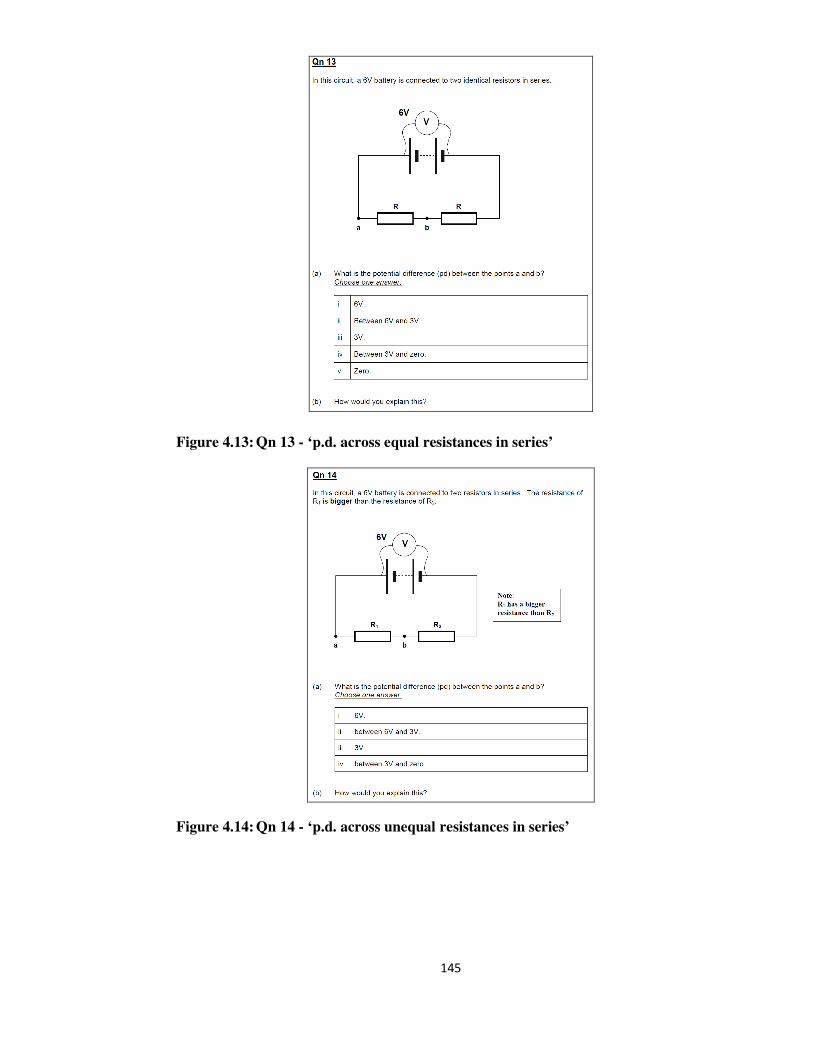
145
Figure 4.13: Qn 13 - ‘p.d. across equal resistances in series’
Figure 4.14: Qn 14 - ‘p.d. across unequal resistances in series’

146
The results of part (a) for both questions show that only about half the sample
could correctly predict the p.d. across the resistor indicated in the circuit (see Table 4.35).
Six students chose the 6V option (i) in both questions. Again, this may be an indication
that these students did not distinguish p.d. from potential. On the other hand, students may
have had a somewhat strong intuition that, perhaps based on the notion of p.d. as a measure
of battery strength, the 6V across the battery go totally across the first resistor.
Qn14(a)
6V Between 6V
and 3V 3V
Between 3V
and zero
Total
6V 6 7 0 0 13
Between
6V and 3V 1 6 1 3 11 Qn13(a)
3V 0 29* 0 8 37
Total 7 42 1 11 61
Table 4.35: P.d. predictions in Qns 13(a) and 14(a)
In explaining p.d. predictions in Qn 13, only two students from the sample could
give a correct and complete scientific explanation. This is one example:
‘3V’ ‘Since the current is the same and the resistances are identical, the p.d. is
divided into two’.
About half the students (30; 49%) (see Table 34) gave a correct but incomplete
answer with no reference made to the equal current through the two resistors thus:
‘3V’ ‘The voltmeter across both (resistances) reads according to the resistance of
the whole circuit, which is 2R. The voltage across ‘a’ and ‘b’ would be half the
amount of the voltmeter since it is only across half the resistance’.
A few explanations just restated the voltmeter prediction, thus:
‘3V’ ‘It splits’.
Some answers hinted at ideas which researchers had previously noted concerning
common alternative conceptions of this situation. Two students answered as follows:
‘6 V’ ‘The same voltage from the battery to the two same (equal) resistors’.
‘6V’ ‘The resistor only changes the current, and whatever the current, the voltage
will always be the same from the battery’.
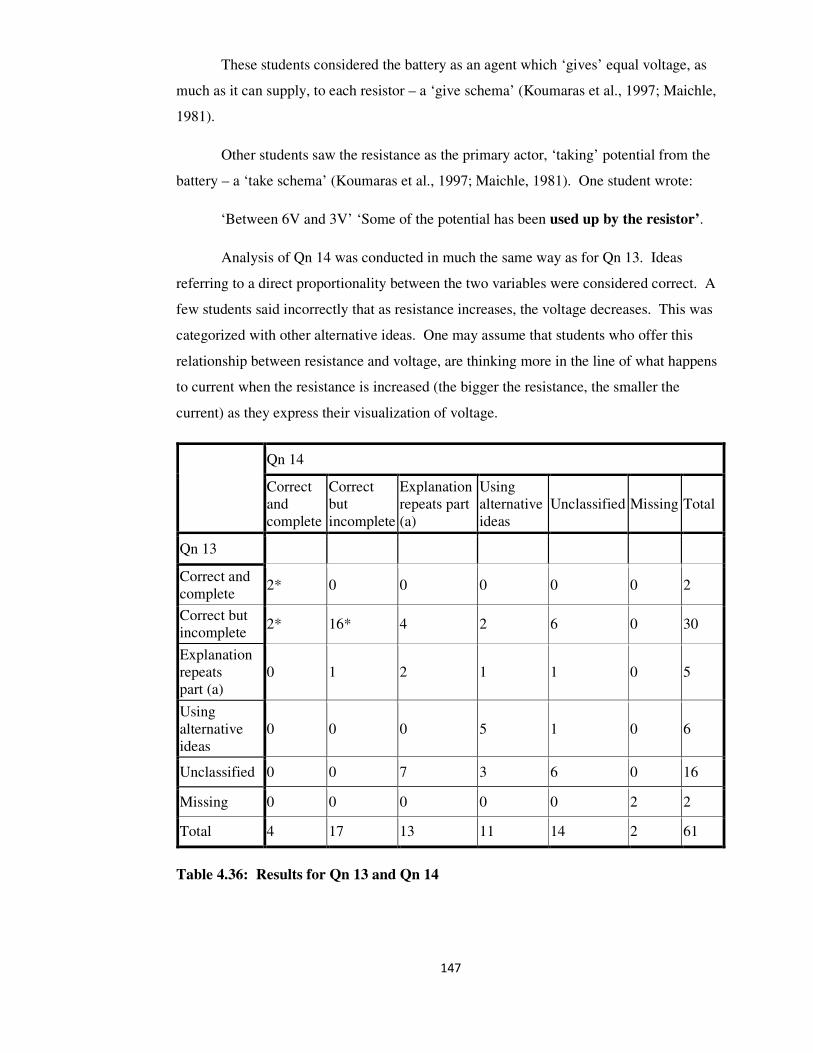
147
These students considered the battery as an agent which ‘gives’ equal voltage, as
much as it can supply, to each resistor – a ‘give schema’ (Koumaras et al., 1997; Maichle,
1981).
Other students saw the resistance as the primary actor, ‘taking’ potential from the
battery – a ‘take schema’ (Koumaras et al., 1997; Maichle, 1981). One student wrote:
‘Between 6V and 3V’ ‘Some of the potential has been used up by the resistor’.
Analysis of Qn 14 was conducted in much the same way as for Qn 13. Ideas
referring to a direct proportionality between the two variables were considered correct. A
few students said incorrectly that as resistance increases, the voltage decreases. This was
categorized with other alternative ideas. One may assume that students who offer this
relationship between resistance and voltage, are thinking more in the line of what happens
to current when the resistance is increased (the bigger the resistance, the smaller the
current) as they express their visualization of voltage.
Qn 14
Correct
and
complete
Correct
but
incomplete
Explanation
repeats part
(a)
Using
alternative
ideas
Unclassified Missing Total
Qn 13
Correct and
complete 2* 0 0 0 0 0 2
Correct but
incomplete 2* 16* 4 2 6 0 30
Explanation
repeats
part (a)
0 1 2 1 1 0 5
Using
alternative
ideas
0 0 0 5 1 0 6
Unclassified 0 0 7 3 6 0 16
Missing 0 0 0 0 0 2 2
Total 4 17 13 11 14 2 61
Table 4.36: Results for Qn 13 and Qn 14
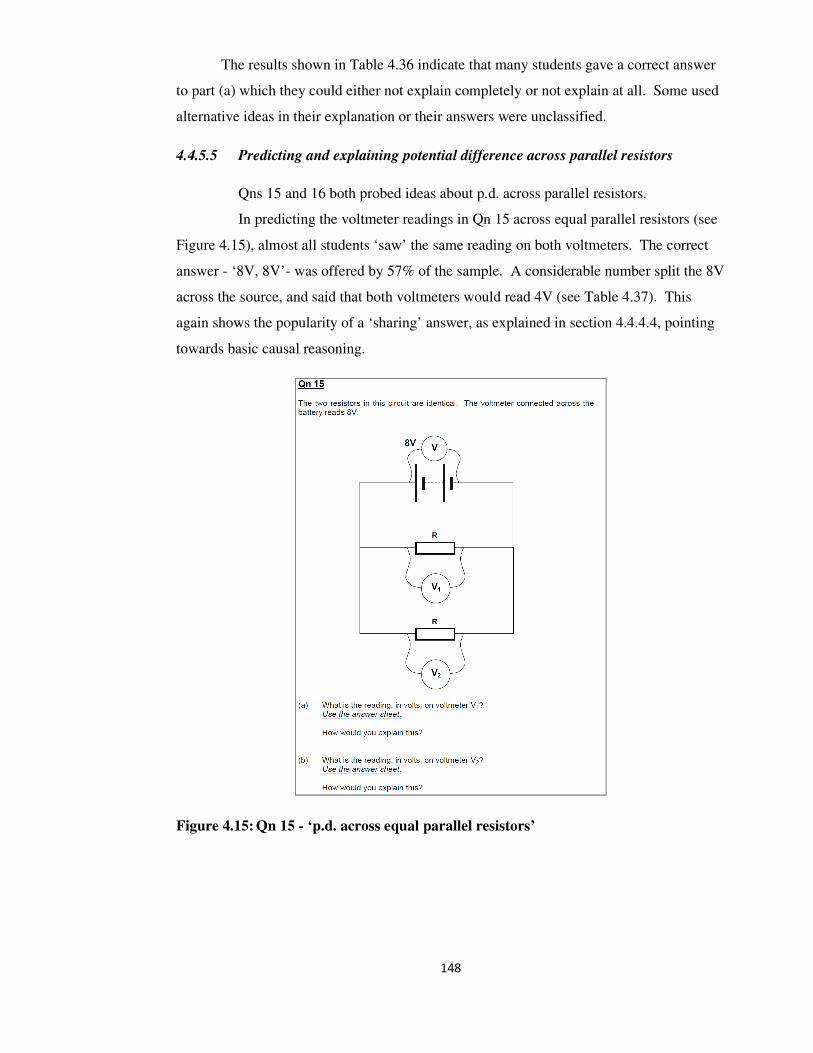
148
The results shown in Table 4.36 indicate that many students gave a correct answer
to part (a) which they could either not explain completely or not explain at all. Some used
alternative ideas in their explanation or their answers were unclassified.
4.4.5.5 Predicting and explaining potential difference across parallel resistors
Qns 15 and 16 both probed ideas about p.d. across parallel resistors.
In predicting the voltmeter readings in Qn 15 across equal parallel resistors (see
Figure 4.15), almost all students ‘saw’ the same reading on both voltmeters. The correct
answer - ‘8V, 8V’- was offered by 57% of the sample. A considerable number split the 8V
across the source, and said that both voltmeters would read 4V (see Table 4.37). This
again shows the popularity of a ‘sharing’ answer, as explained in section 4.4.4.4, pointing
towards basic causal reasoning.
Figure 4.15: Qn 15 - ‘p.d. across equal parallel resistors’

149
Student Answer
to Qn15
Number of students
predicting the answer
Percentage of sample
(N=61)
(8V, 8V) 35* 57%
(4V, 4V) 23 38%
other 2 3%
Missing 1 2%
Table 4.37: Voltmeter reading predictions Qn 15 - ‘equal resistances’
Students’ open-ended responses were analyzed, as has been described in
previous sections for other open-ended responses. One student wrote:
‘(8V, 8V)’ ‘They are in parallel. The p.d. across R is equal to that of the cell.’
This answer was coded as correct and complete, showing that the student was
seeing the voltage as a difference of ‘something’ which the voltmeter was reading across
the terminals of the battery.
Another student’s answer was as follows:
‘(8V, 8V)’ ‘When in parallel, the current is divided and not the voltage’.
Here, the student is acknowledging the parallel connection, knows that current
divides at the junction but is saying that the voltage is not divided but stays the same,
hence the 8V across each resistor. The explanation could thus be considered brief but
correct, even if incomplete.
Other answers simply offered an assertion of the correct answer without
explanation, providing no clear evidence of the student’s model of p.d, thus:
‘(8V, 8V)’ ‘Voltage is the same’.
Results in Table 4.38 show that 7 students out of 35 who predicted the voltmeter
readings correctly, suggested incorrect reasoning when it came to explaining why each
voltmeter read 8V. One example was:
‘8V, 8V’ ‘The p.d. is the same because the resistance is the same.’
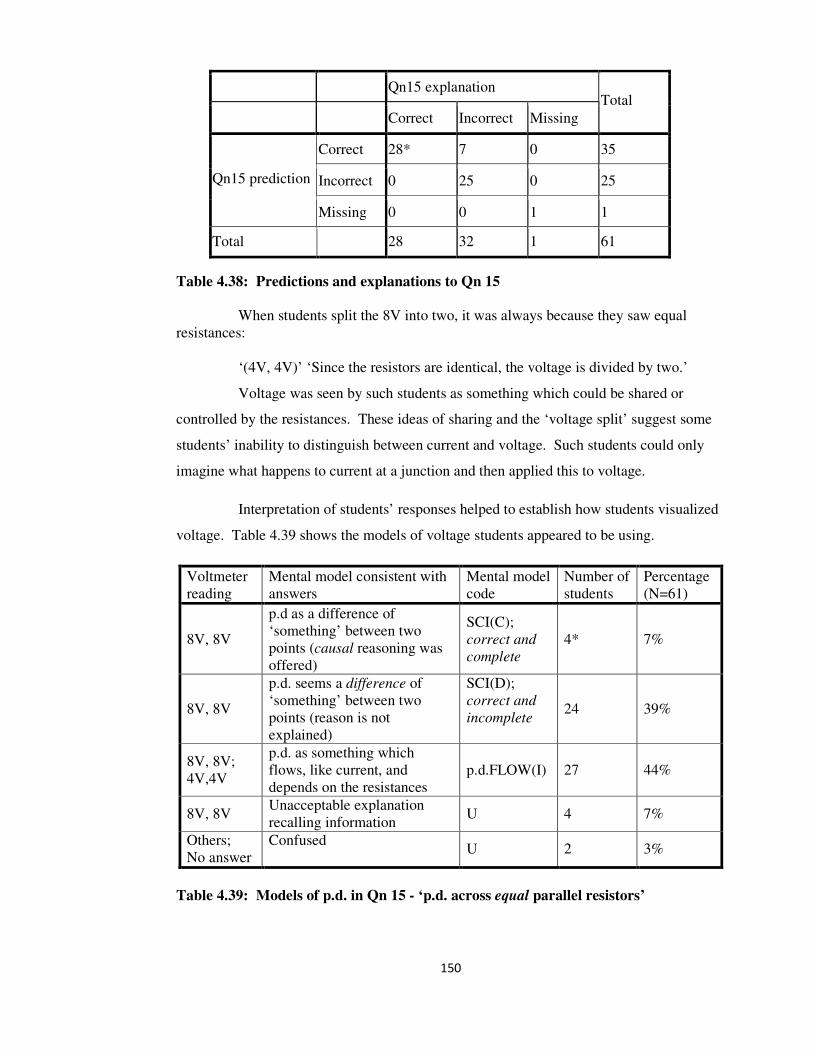
150
Qn15 explanation
Correct Incorrect Missing
Total
Correct 28* 7 0 35
Incorrect 0 25 0 25 Qn15 prediction
Missing 0 0 1 1
Total 28 32 1 61
Table 4.38: Predictions and explanations to Qn 15
When students split the 8V into two, it was always because they saw equal
resistances:
‘(4V, 4V)’ ‘Since the resistors are identical, the voltage is divided by two.’
Voltage was seen by such students as something which could be shared or
controlled by the resistances. These ideas of sharing and the ‘voltage split’ suggest some
students’ inability to distinguish between current and voltage. Such students could only
imagine what happens to current at a junction and then applied this to voltage.
Interpretation of students’ responses helped to establish how students visualized
voltage. Table 4.39 shows the models of voltage students appeared to be using.
Voltmeter
reading
Mental model consistent with
answers
Mental model
code
Number of
students
Percentage
(N=61)
8V, 8V
p.d as a difference of
‘something’ between two
points (causal reasoning was
offered)
SCI(C);
correct and
complete
4* 7%
8V, 8V
p.d. seems a difference of
‘something’ between two
points (reason is not
explained)
SCI(D);
correct and
incomplete
24 39%
8V, 8V;
4V,4V
p.d. as something which
flows, like current, and
depends on the resistances
p.d.FLOW(I) 27 44%
8V, 8V Unacceptable explanation
recalling information U 4 7%
Others;
No answer
Confused
U 2 3%
Table 4.39: Models of p.d. in Qn 15 - ‘p.d. across equal parallel resistors’

151
In Qn 16 (Figure 4.16), when unequal parallel resistances of 2Ω and 4Ω were
used, students’ voltmeter predictions were either correct or clearly indicated that the main
idea behind the response was that the sum of both voltmeter readings should be 6V.
Figure 4.16: Qn 16 - ‘p.d. across unequal parallel resistors’
The results are shown in Table 4.40.
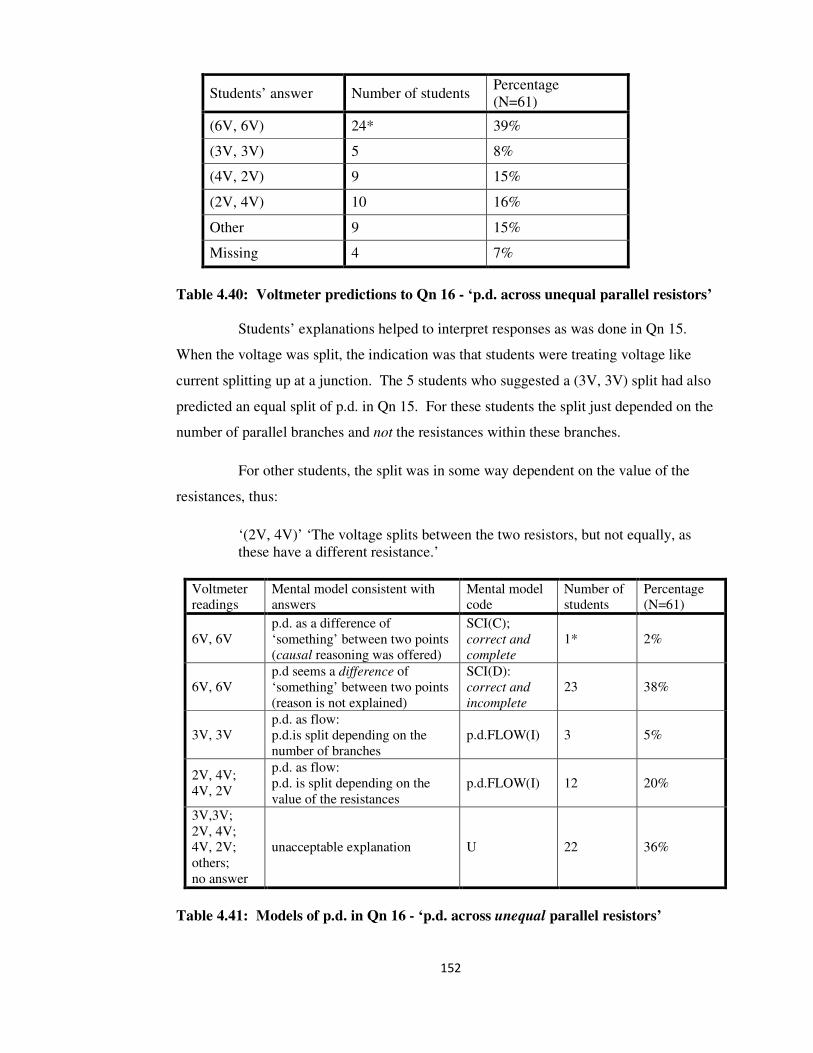
152
Students’ answer Number of students Percentage
(N=61)
(6V, 6V) 24* 39%
(3V, 3V) 5 8%
(4V, 2V) 9 15%
(2V, 4V) 10 16%
Other 9 15%
Missing 4 7%
Table 4.40: Voltmeter predictions to Qn 16 - ‘p.d. across unequal parallel resistors’
Students’ explanations helped to interpret responses as was done in Qn 15.
When the voltage was split, the indication was that students were treating voltage like
current splitting up at a junction. The 5 students who suggested a (3V, 3V) split had also
predicted an equal split of p.d. in Qn 15. For these students the split just depended on the
number of parallel branches and not the resistances within these branches.
For other students, the split was in some way dependent on the value of the
resistances, thus:
‘(2V, 4V)’ ‘The voltage splits between the two resistors, but not equally, as
these have a different resistance.’
Voltmeter
readings Mental model consistent with
answers Mental model code
Number of
students Percentage (N=61)
6V, 6V p.d. as a difference of
‘something’ between two points
(causal reasoning was offered)
SCI(C);
correct and
complete 1* 2%
6V, 6V p.d seems a difference of
‘something’ between two points
(reason is not explained)
SCI(D):
correct and
incomplete 23 38%
3V, 3V p.d. as flow: p.d.is split depending on the
number of branches p.d.FLOW(I) 3 5%
2V, 4V; 4V, 2V
p.d. as flow: p.d. is split depending on the
value of the resistances p.d.FLOW(I) 12 20%
3V,3V; 2V, 4V; 4V, 2V; others; no answer
unacceptable explanation U 22 36%
Table 4.41: Models of p.d. in Qn 16 - ‘p.d. across unequal parallel resistors’
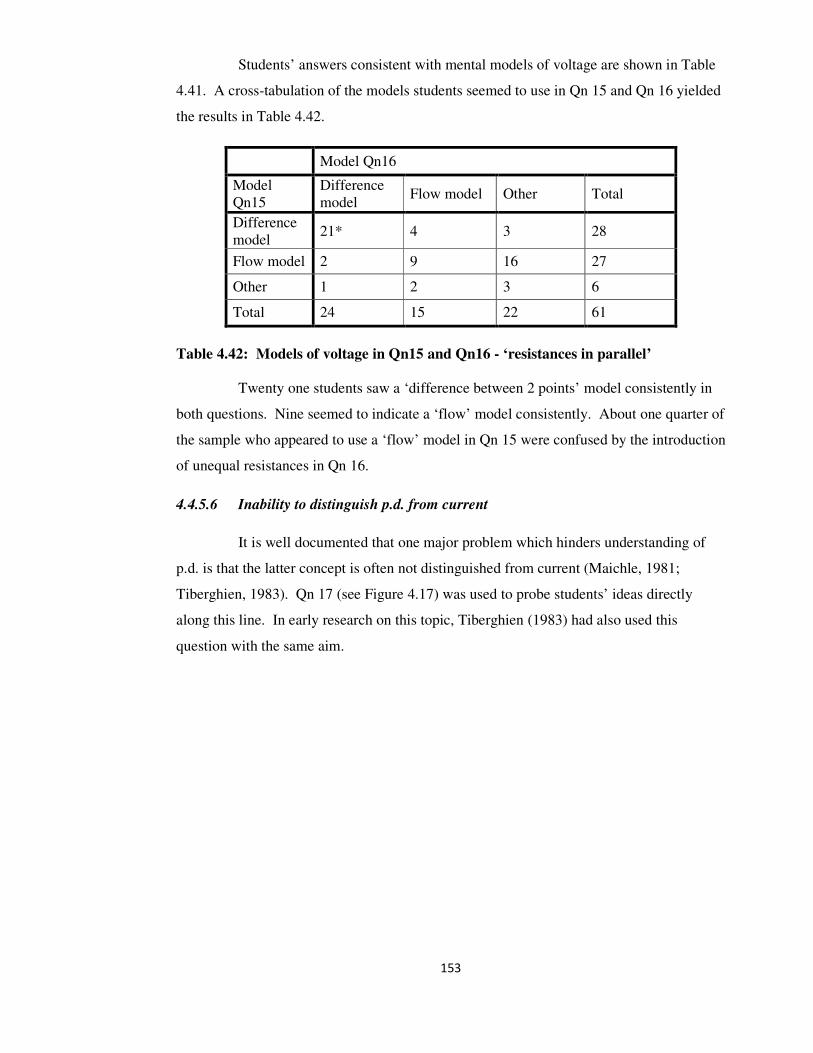
153
Students’ answers consistent with mental models of voltage are shown in Table
4.41. A cross-tabulation of the models students seemed to use in Qn 15 and Qn 16 yielded
the results in Table 4.42.
Model Qn16
Model
Qn15
Difference
model Flow model Other Total
Difference
model 21* 4 3 28
Flow model 2 9 16 27
Other 1 2 3 6
Total 24 15 22 61
Table 4.42: Models of voltage in Qn15 and Qn16 - ‘resistances in parallel’
Twenty one students saw a ‘difference between 2 points’ model consistently in
both questions. Nine seemed to indicate a ‘flow’ model consistently. About one quarter of
the sample who appeared to use a ‘flow’ model in Qn 15 were confused by the introduction
of unequal resistances in Qn 16.
4.4.5.6 Inability to distinguish p.d. from current
It is well documented that one major problem which hinders understanding of
p.d. is that the latter concept is often not distinguished from current (Maichle, 1981;
Tiberghien, 1983). Qn 17 (see Figure 4.17) was used to probe students’ ideas directly
along this line. In early research on this topic, Tiberghien (1983) had also used this
question with the same aim.
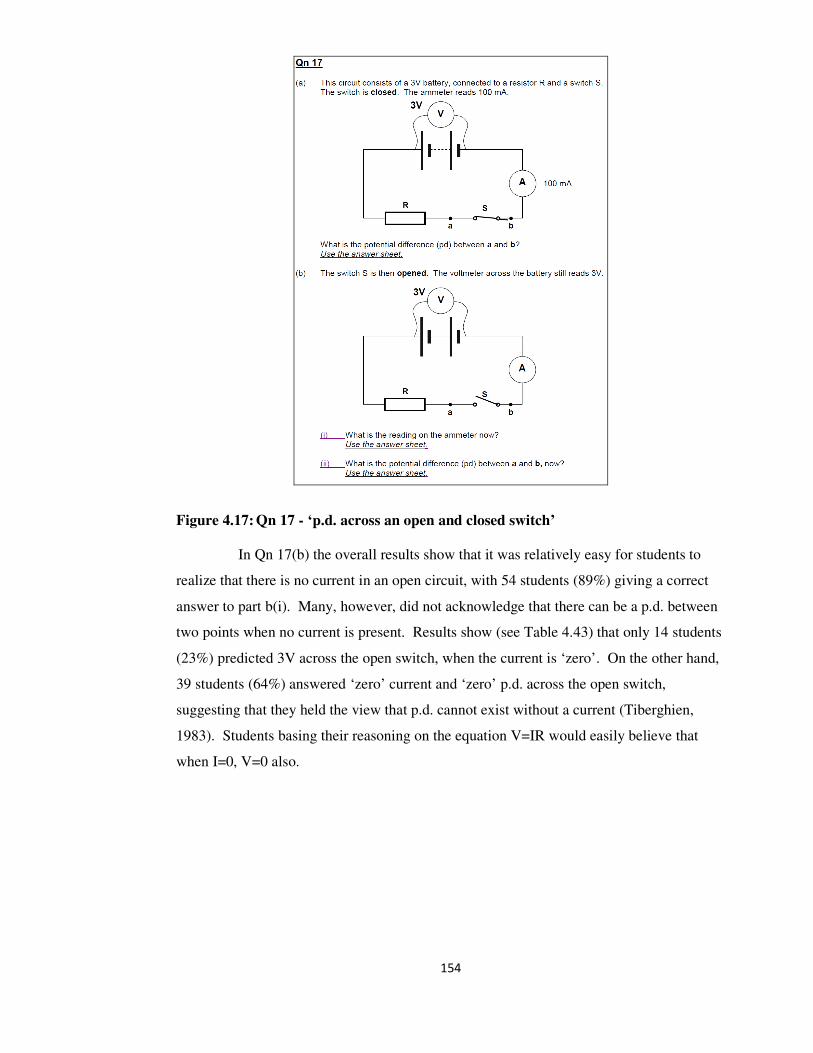
154
Figure 4.17: Qn 17 - ‘p.d. across an open and closed switch’
In Qn 17(b) the overall results show that it was relatively easy for students to
realize that there is no current in an open circuit, with 54 students (89%) giving a correct
answer to part b(i). Many, however, did not acknowledge that there can be a p.d. between
two points when no current is present. Results show (see Table 4.43) that only 14 students
(23%) predicted 3V across the open switch, when the current is ‘zero’. On the other hand,
39 students (64%) answered ‘zero’ current and ‘zero’ p.d. across the open switch,
suggesting that they held the view that p.d. cannot exist without a current (Tiberghien,
1983). Students basing their reasoning on the equation V=IR would easily believe that
when I=0, V=0 also.
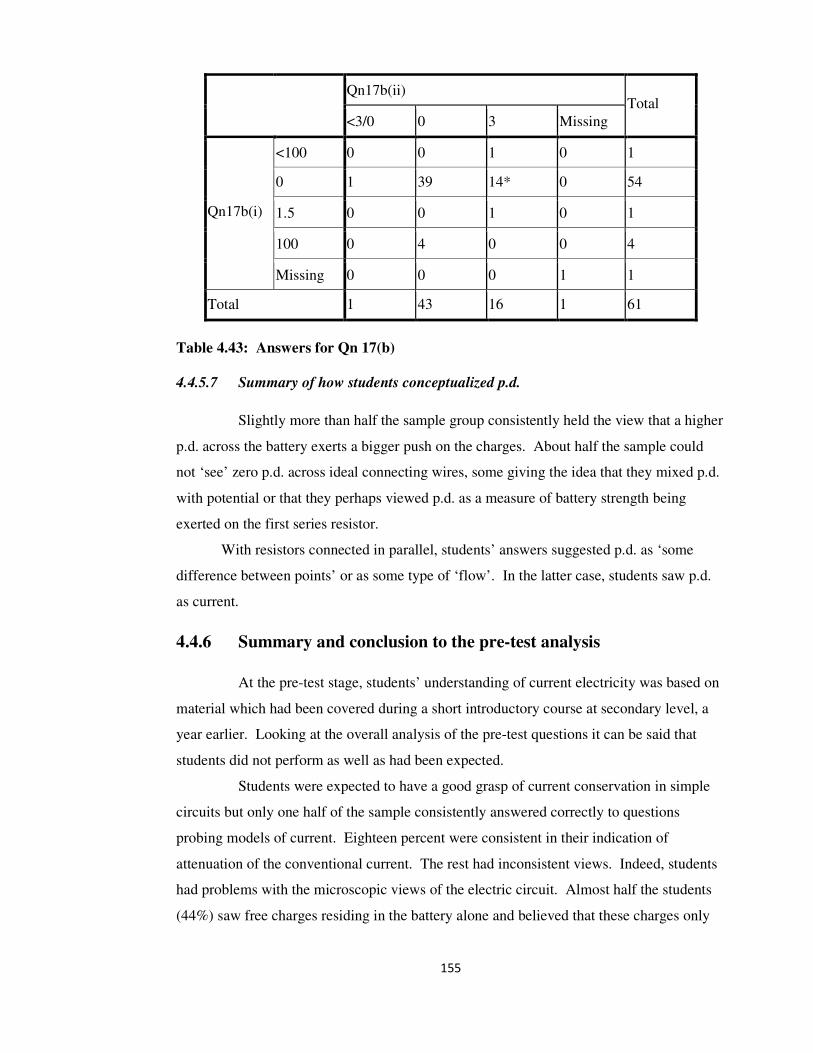
155
Qn17b(ii)
<3/0 0 3 Missing
Total
<100 0 0 1 0 1
0 1 39 14* 0 54
1.5 0 0 1 0 1
100 0 4 0 0 4
Qn17b(i)
Missing 0 0 0 1 1
Total 1 43 16 1 61
Table 4.43: Answers for Qn 17(b)
4.4.5.7 Summary of how students conceptualized p.d.
Slightly more than half the sample group consistently held the view that a higher
p.d. across the battery exerts a bigger push on the charges. About half the sample could
not ‘see’ zero p.d. across ideal connecting wires, some giving the idea that they mixed p.d.
with potential or that they perhaps viewed p.d. as a measure of battery strength being
exerted on the first series resistor.
With resistors connected in parallel, students’ answers suggested p.d. as ‘some
difference between points’ or as some type of ‘flow’. In the latter case, students saw p.d.
as current.
4.4.6 Summary and conclusion to the pre-test analysis
At the pre-test stage, students’ understanding of current electricity was based on
material which had been covered during a short introductory course at secondary level, a
year earlier. Looking at the overall analysis of the pre-test questions it can be said that
students did not perform as well as had been expected.
Students were expected to have a good grasp of current conservation in simple
circuits but only one half of the sample consistently answered correctly to questions
probing models of current. Eighteen percent were consistent in their indication of
attenuation of the conventional current. The rest had inconsistent views. Indeed, students
had problems with the microscopic views of the electric circuit. Almost half the students
(44%) saw free charges residing in the battery alone and believed that these charges only
156
move into the wires once the circuit is switched on. Such views would more likely lead to
sequential and attenuation views of current.
Students were expected to find it easy to answer direct questions related to the
effect of changing the resistance in the circuit. In fact, 82% of the students indicated that
they could easily recall that using a larger resistance reduces the current. Many students
however, could not choose a valid reason for their answer. The indication was that
students’ learning was superficial, done by rote. Moreover, students indicated a tendency
to use ideas consistent with the BAT and SHARE models. The BAT model was only used
consistently by a few students, yet it appeared in the answers to all questions related to
resistance. Even if students may use this model intermittently, the idea may be a strong
one hindering progress in learning. Sherwood and Chabay (1999) refer to the BAT model
as a “deep-seated misconception of the role of batteries in circuits” (p.12). They explain
how ‘students often think that a battery either outputs zero current (if nothing is attached to
it) or outputs a standard amount of current, independent of what is attached to the battery
(p.12).
Furthermore, understanding of p.d. was a major problem. In answers related to
the supply voltage slightly more than half the sample (36 students; 59%) were consistent in
recognizing that a higher battery voltage provides a bigger push on the electric charges.
Other results also confirmed some students’:
• difficulty to distinguish between p.d. and potential (McDermott and Shaffer, 1992);
• inability to distinguish between p.d. and current (Maichle, 1981; Tiberghien, 1983)
Voltage was often seen as something which could be shared between the
resistances, or be inversely related to the resistances. References were made to a ‘voltage
split’ between parallel branches. Students imagined that what happens to current at a
junction could also be applied to p.d. Only 14 students (23%) ‘saw’ p.d. across an open
switch when no current was flowing in the circuit. For the majority, zero current meant
zero p.d.
In open-ended questions on p.d. no student gave a deep explanation in terms of
an ‘imbalance’ across points, in the way a scientist would have perhaps been expected to
do (Grotzer & Sudbury, 2000). The answers offered were often closed replies – short
replies with limited/incomplete or no explanation. This may well back the claim made by
Gilbert, Boulter and Rutherford (1998) that “whether the expectation implied in a teacher’s
explicit question is either open or closed, it is very likely that the students will give a
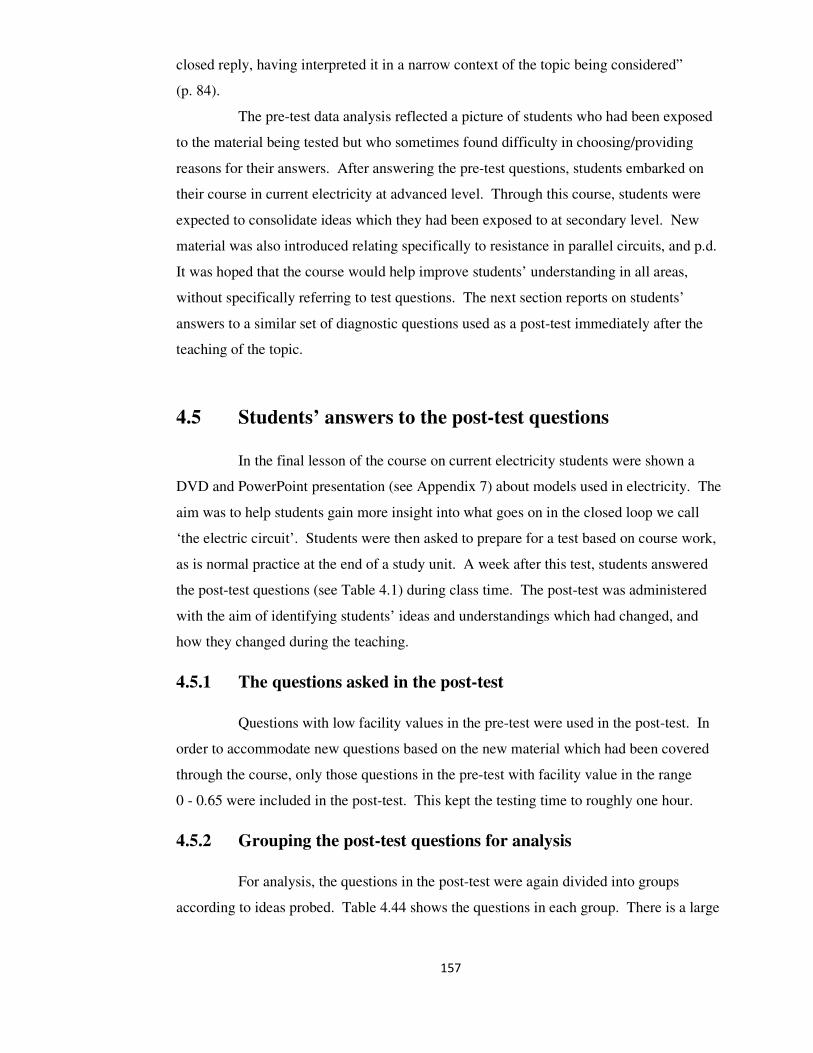
157
closed reply, having interpreted it in a narrow context of the topic being considered”
(p. 84).
The pre-test data analysis reflected a picture of students who had been exposed
to the material being tested but who sometimes found difficulty in choosing/providing
reasons for their answers. After answering the pre-test questions, students embarked on
their course in current electricity at advanced level. Through this course, students were
expected to consolidate ideas which they had been exposed to at secondary level. New
material was also introduced relating specifically to resistance in parallel circuits, and p.d.
It was hoped that the course would help improve students’ understanding in all areas,
without specifically referring to test questions. The next section reports on students’
answers to a similar set of diagnostic questions used as a post-test immediately after the
teaching of the topic.
4.5 Students’ answers to the post-test questions
In the final lesson of the course on current electricity students were shown a
DVD and PowerPoint presentation (see Appendix 7) about models used in electricity. The
aim was to help students gain more insight into what goes on in the closed loop we call
‘the electric circuit’. Students were then asked to prepare for a test based on course work,
as is normal practice at the end of a study unit. A week after this test, students answered
the post-test questions (see Table 4.1) during class time. The post-test was administered
with the aim of identifying students’ ideas and understandings which had changed, and
how they changed during the teaching.
4.5.1 The questions asked in the post-test
Questions with low facility values in the pre-test were used in the post-test. In
order to accommodate new questions based on the new material which had been covered
through the course, only those questions in the pre-test with facility value in the range
0 - 0.65 were included in the post-test. This kept the testing time to roughly one hour.
4.5.2 Grouping the post-test questions for analysis
For analysis, the questions in the post-test were again divided into groups
according to ideas probed. Table 4.44 shows the questions in each group. There is a large

158
number of questions on p.d. This reflects the amount of work covered on this sub-section
throughout the course.
Group Idea probed
Question number
in the question
bank
Question Title
A Microscopic
views of circuit 4* Microscopic views
1* Current at points (a) and (b)
3* Picture of the battery and bulb B Mental models of
current
9’(a)* Current conservation within a
parallel branch
6* Adding an equal resistance in series
7* Increasing the variable resistance
8* Adding an equal resistance in
parallel
C
How resistances
control the
current
9’(b)* Parallel resistors’ control of current
12’* p.d. across resistances and ideal
connecting wires
13*, 14* p.d. across equal and unequal
resistances in series
15*, 16* p.d. across equal and unequal
parallel resistors
17’* p.d. across an open and closed
switch
19 Addition of a battery in parallel with
the first: Voltmeter reading
20 Addition of a battery in parallel with
the first: Ammeter reading
21
Addition of a parallel resistor: effect
on the current within a branch;
effect on the current within the main
circuit
D
Conceptualisation
of potential
difference (p.d.)
18 p.d. across a resistor, adding another
resistor in parallel
Table 4.44: The questions asked in the post-test arranged in groups
(Note: * indicates questions also asked in the pre-test)
Analysis of the post-test questions was conducted along the same lines as has
been explained in detail for the pre-test. Table 4.45 shows the facility values and item-
total correlation coefficient for the post-test questions.

159
Table 4.45: Post-test results expressed in rank order according to facility values
(Note: * = significant to 5% level; ** = significant to 1% level)
Table 4.46 compares the facility values of common questions in pre- and post-
test.
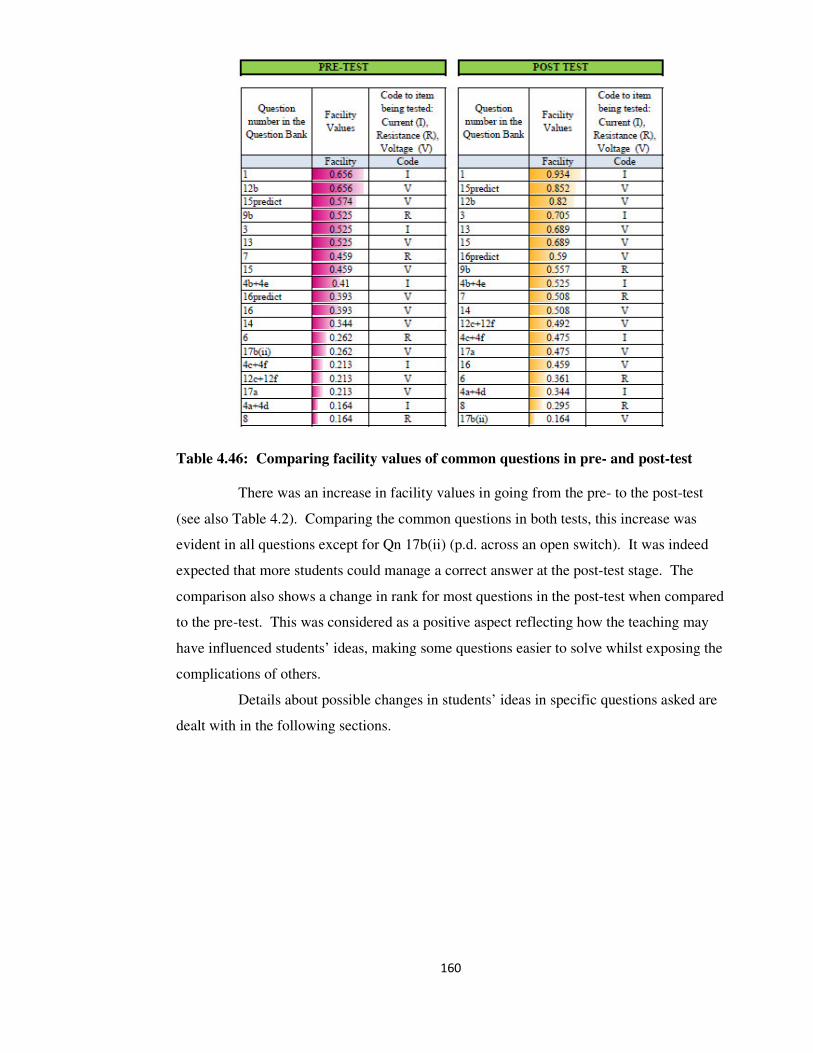
160
Table 4.46: Comparing facility values of common questions in pre- and post-test
There was an increase in facility values in going from the pre- to the post-test
(see also Table 4.2). Comparing the common questions in both tests, this increase was
evident in all questions except for Qn 17b(ii) (p.d. across an open switch). It was indeed
expected that more students could manage a correct answer at the post-test stage. The
comparison also shows a change in rank for most questions in the post-test when compared
to the pre-test. This was considered as a positive aspect reflecting how the teaching may
have influenced students’ ideas, making some questions easier to solve whilst exposing the
complications of others.
Details about possible changes in students’ ideas in specific questions asked are
dealt with in the following sections.

161
4.5.3 Microscopic views of circuit
4.5.3.1 Electric charges and where they reside
Considering Qn 4(a) and Qn 4(d) which probed students’ views regarding
electric charges and whether these reside only in the battery, the data indicated that more
students answered correctly in the post-test (see Tables 4.47 and 4.48).
Qn4(a) (post-test)
Correct Incorrect
Total
Correct 8* 7 15 Qn4(a)
(pre-test) Incorrect 14 32 46
Total 22 39 61
Table 4.47: Results for Qn 4(a) on the pre-test and post-test
Qn4(d) (post-test)
Correct Incorrect Missing
Total
Correct 23* 5 1 29 Qn4(d)
(pre-test) Incorrect 15 17 0 32
Total 38 22 1 61
Table 4.48: Results for Qn 4(d) on the pre-test and post-test
The results in Table 4.49 show that after the teaching 21 students (34%) still saw
electrons in the battery only, before the circuit is connected.

162
Qn 4(d) (post-test)
Correct Incorrect Missing
Total
Correct 21* 1 0 22 Qn 4(a)
(post-test) Incorrect 17 21 1 39
Total 38 22 1 61
Table 4.49: Results for Qn 4(a) and Qn 4(d) during the post-test
Moreover, in the answers to parts (c) and (f), more than a quarter indicated that
they did not (or at least, not fully) understand that charges move everywhere and together
around the circuit, once the circuit is closed (see Table 4.50).
Qn 4(f) (post-test)
Correct Incorrect
Total
Correct 29* 9 38 Qn 4(c)
(post-test) Incorrect 9 14 23
Total 38 23 61
Table 4.50: Results for Qn 4(c) and Qn 4(f) on the post-test
Combining the results to parts (a), (d), (c) and (f) in Table 4.51 shows that many
students still did not have a mental model of charge movement in a simple circuit, based on
the idea that all wires are ‘full’ of mobile charges which move together when a p.d. is
applied.
Combination of responses
to parts (a), (d), (c), (f)
Number of students
pre-test
Number of students
post-test
All parts correct 8 16
3 parts correct 7 13
2 or more parts incorrect 32 31
All parts incorrect 14 11
Table 4.51: Combination of responses to parts (a), (d), (c) and (f) of Qn 4

163
4.5.3.2 Summary of results for microscopic views of the electric circuit
While improvements on this item were observed, problems persisted. Many
students still viewed the battery as the source of the charges which move round the circuit
creating the current.
4.5.4 Mental models of current
4.5.4.1 Ideas used at the post-test stage
As in the pre-test, most students appeared either to use the CC (current
conservation) or ACC (attenuation conventional current) model.
In Qn 1, ‘Current at points (a) and (b)’, 19 students moved to a correct CC view
in the post-test (see Table 4.52).
Qn1 (post-test)
Correct Incorrect
Total
Correct 38* 2 40 Qn1
(pre-test) Incorrect 19 2 21
Total 57 4 61
Table 4.52: Pre-test and post-test results for Qn 1
In Qn 3, ‘Picture of the battery and bulb’ (Figure 4.18), 17 corrected their pre-
test answers and moved to the scientific model, but 6 regressed from the conservation
model to an attenuation model. Four students used attenuation in both tests (see Table
4.53).

164
Figure 4.18: Qn 3 - ‘Picture of battery and bulb’
Model Qn3 (post-test)
CC A U
Total
CC 26* 6 0 32
A 10 4 3 17 Model Qn3
(pre-test)
U 7 4 1 12
Total 43 14 4 61
Table 4.53: Pre-test and the post-test results for Qn 3
Consistency in the use of the CC model on both Qns 1 and 3 in the post-test was
shown by 42 students (69%; see Table 4.54). Eleven students, however, did not use the
conservation model in Qn 3. This was rather surprising. Reasons for this inconsistency
may perhaps be attributed to the long description of the options in Qn 3(b), perhaps
confusing the students, but this is speculative.

165
Model Qn3 (post-test)
CC A U
Total
CC 42* 11 4 57 Model Qn1
(post-test) ACC 1 3 0 4
Total 43 14 4 61
Table 4.54: Post-test results for Qn 1 and Qn 3
On the other hand, the data for Qn 9’(a), ‘Current conservation within a parallel
branch’ shows that while 40 students had conserved current in a parallel branch in the pre-
test, the number now increased to 51 in the post-test. Of the latter number, 50 students
were found to have consistently also used the CC model in Qn 1 (see Table 4.55).
Qn9’(a) (post-test)
CC ACC AEF
Total
CC 50* 6 1 57 Qn1
(post-test) ACC 1 3 0 4
Total 51 9 1 61
Table 4.55: Comparing mental models of current in post-test Qn 1 and Qn 9’(a)
4.5.4.2 Summary of students’ views of current
In the post-test questions probing models of current, including current within a
parallel branch, more students were found to have conserved the current more consistently.
There was strong evidence that many students now understood the CC model.
4.5.5 How resistances control the current
4.5.5.1 Resistances connected in parallel
Analysis of responses to questions probing ideas about resistance immediately
pointed to persistence of problems with understanding in this area. Moreover, the data
indicated more frequent use of specific mental models.
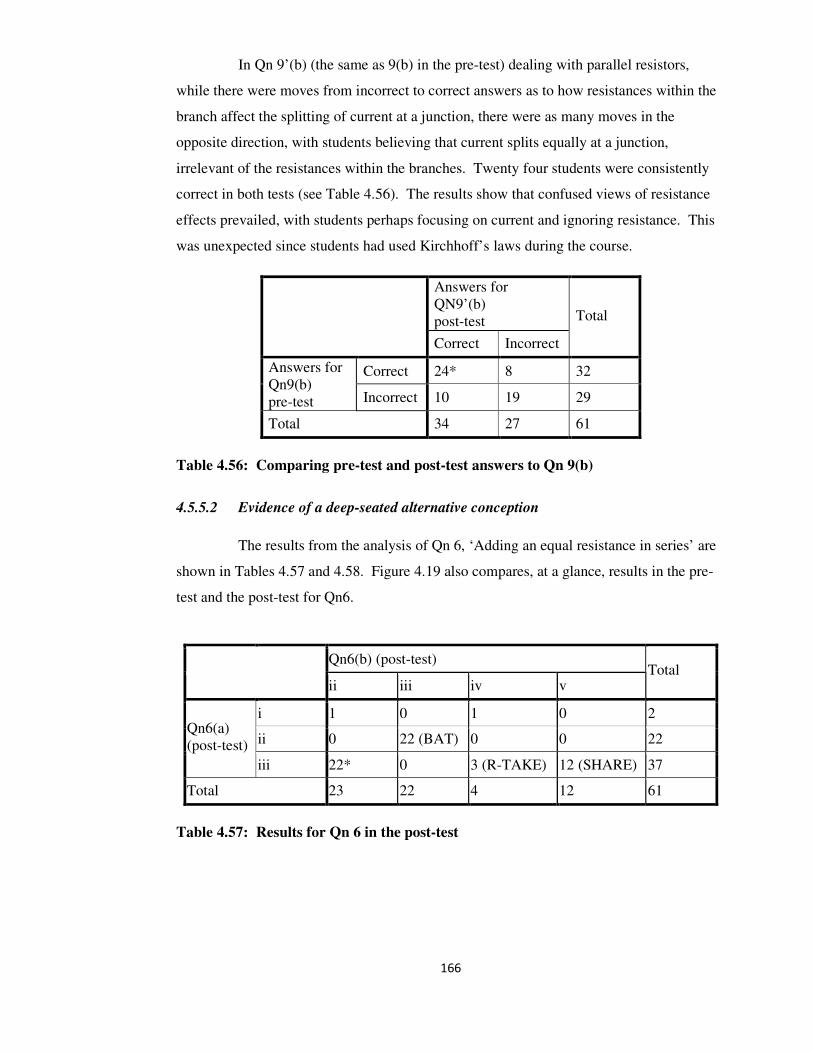
166
In Qn 9’(b) (the same as 9(b) in the pre-test) dealing with parallel resistors,
while there were moves from incorrect to correct answers as to how resistances within the
branch affect the splitting of current at a junction, there were as many moves in the
opposite direction, with students believing that current splits equally at a junction,
irrelevant of the resistances within the branches. Twenty four students were consistently
correct in both tests (see Table 4.56). The results show that confused views of resistance
effects prevailed, with students perhaps focusing on current and ignoring resistance. This
was unexpected since students had used Kirchhoff’s laws during the course.
Answers for
QN9’(b)
post-test
Correct Incorrect
Total
Correct 24* 8 32 Answers for
Qn9(b)
pre-test Incorrect 10 19 29
Total 34 27 61
Table 4.56: Comparing pre-test and post-test answers to Qn 9(b)
4.5.5.2 Evidence of a deep-seated alternative conception
The results from the analysis of Qn 6, ‘Adding an equal resistance in series’ are
shown in Tables 4.57 and 4.58. Figure 4.19 also compares, at a glance, results in the pre-
test and the post-test for Qn6.
Qn6(b) (post-test)
ii iii iv v Total
i 1 0 1 0 2
ii 0 22 (BAT) 0 0 22 Qn6(a)
(post-test)
iii 22* 0 3 (R-TAKE) 12 (SHARE) 37
Total 23 22 4 12 61
Table 4.57: Results for Qn 6 in the post-test
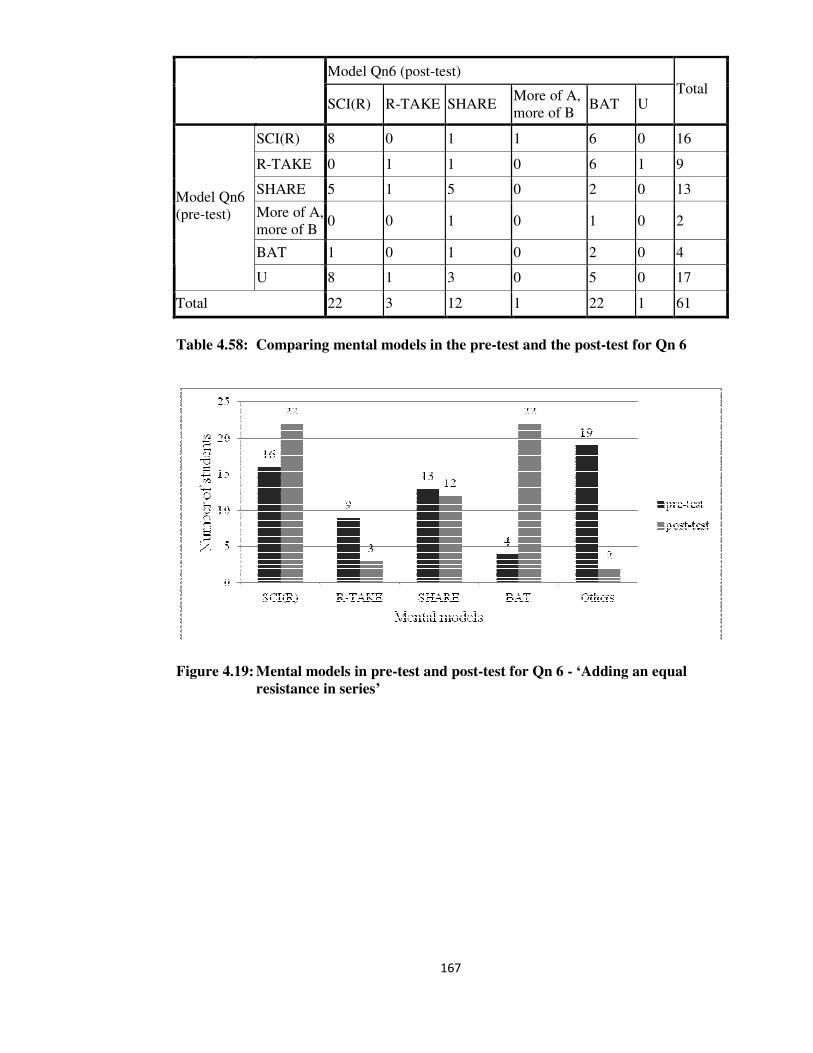
167
Model Qn6 (post-test)
SCI(R) R-TAKE SHARE More of A,
more of B BAT U
Total
SCI(R) 8 0 1 1 6 0 16
R-TAKE 0 1 1 0 6 1 9
SHARE 5 1 5 0 2 0 13
More of A,
more of B 0 0 1 0 1 0 2
BAT 1 0 1 0 2 0 4
Model Qn6
(pre-test)
U 8 1 3 0 5 0 17
Total 22 3 12 1 22 1 61
Table 4.58: Comparing mental models in the pre-test and the post-test for Qn 6
Figure 4.19: Mental models in pre-test and post-test for Qn 6 - ‘Adding an equal
resistance in series’

168
These results indicate that:
• more students now answered correctly;
• the use of the BAT model (same battery, same current) was now very pronounced.
The BAT model thus seemed reinforced with teaching – a result which was not
mentioned in previous research studies.
4.5.5.3 Use of the BAT model in other questions
• In Qn 7, ‘Increasing the variable resistance’, the BAT model was again amongst
students answers, even if it was used to a much smaller extent than in Qn 6 (see Tables
4.59 and 4.60).
Qn7(b) (post-test)
i ii iii iv Missing
Total
ii 0 0 1 5 (BAT) 0 6
iii 1 31* 17 5 0 54 Qn7(a)
(post-test)
Missing 0 0 0 0 1 1
Total 1 31 18 10 1 61
Table 4.59: Results for Qn 7 in the post-test
Model Qn7 (post-test)
SCI(R) BAT R-TAKE U
Total
SCI(R) 20* 1 6 2 29
BAT 4 2 1 0 7
R-TAKE 3 2 7 2 14
Model Qn7
(pre-test)
U 4 0 3 4 11
Total 31 5 17 8 61
Table 4.60: Comparing pre-test and post-test mental models in Qn 7
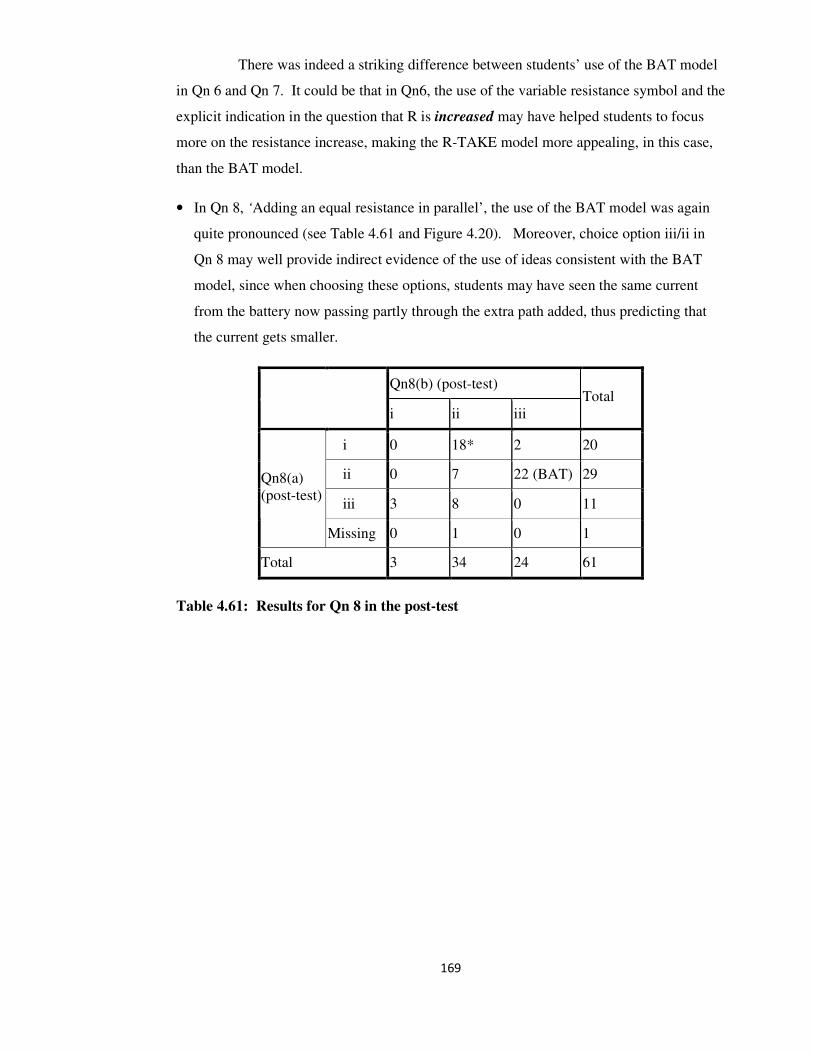
169
There was indeed a striking difference between students’ use of the BAT model
in Qn 6 and Qn 7. It could be that in Qn6, the use of the variable resistance symbol and the
explicit indication in the question that R is increased may have helped students to focus
more on the resistance increase, making the R-TAKE model more appealing, in this case,
than the BAT model.
• In Qn 8, ‘Adding an equal resistance in parallel’, the use of the BAT model was again
quite pronounced (see Table 4.61 and Figure 4.20). Moreover, choice option iii/ii in
Qn 8 may well provide indirect evidence of the use of ideas consistent with the BAT
model, since when choosing these options, students may have seen the same current
from the battery now passing partly through the extra path added, thus predicting that
the current gets smaller.
Qn8(b) (post-test)
i ii iii
Total
i 0 18* 2 20
ii 0 7 22 (BAT) 29
iii 3 8 0 11
Qn8(a)
(post-test)
Missing 0 1 0 1
Total 3 34 24 61
Table 4.61: Results for Qn 8 in the post-test
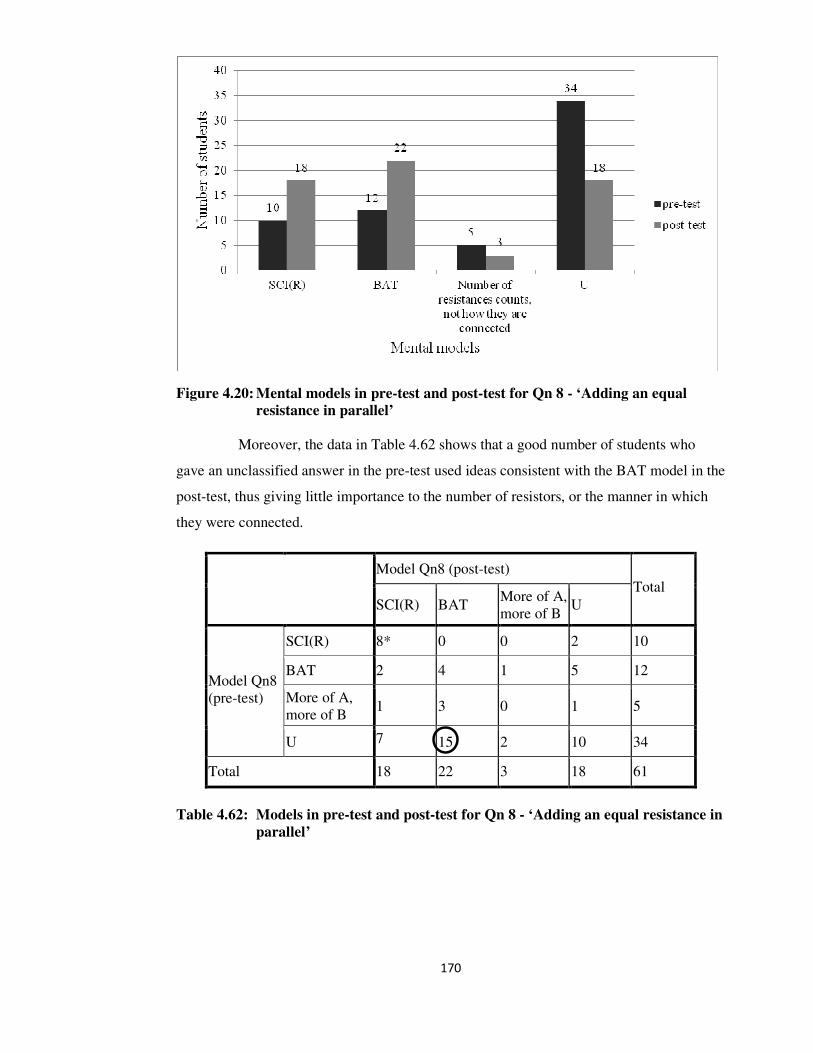
170
Figure 4.20: Mental models in pre-test and post-test for Qn 8 - ‘Adding an equal
resistance in parallel’
Moreover, the data in Table 4.62 shows that a good number of students who
gave an unclassified answer in the pre-test used ideas consistent with the BAT model in the
post-test, thus giving little importance to the number of resistors, or the manner in which
they were connected.
Model Qn8 (post-test)
SCI(R) BAT More of A,
more of B U
Total
SCI(R) 8* 0 0 2 10
BAT 2 4 1 5 12
More of A,
more of B 1 3 0 1 5
Model Qn8
(pre-test)
U 7 15 2 10 34
Total 18 22 3 18 61
Table 4.62: Models in pre-test and post-test for Qn 8 - ‘Adding an equal resistance in
parallel’
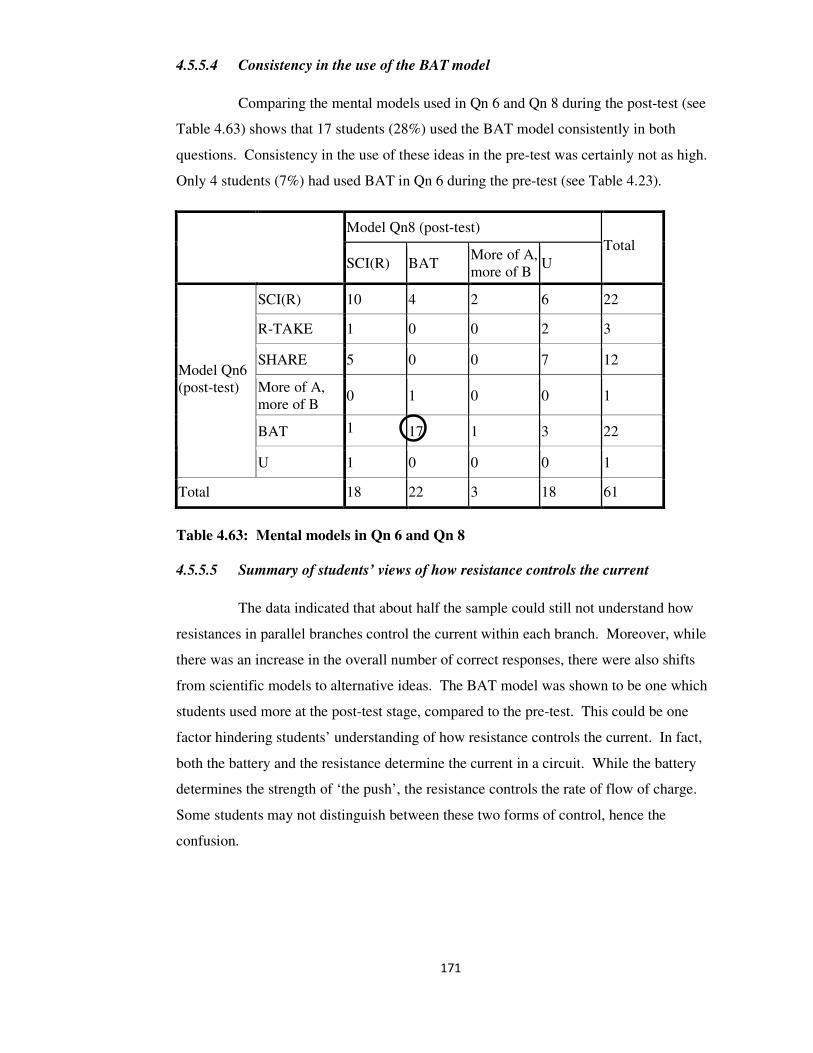
171
4.5.5.4 Consistency in the use of the BAT model
Comparing the mental models used in Qn 6 and Qn 8 during the post-test (see
Table 4.63) shows that 17 students (28%) used the BAT model consistently in both
questions. Consistency in the use of these ideas in the pre-test was certainly not as high.
Only 4 students (7%) had used BAT in Qn 6 during the pre-test (see Table 4.23).
Model Qn8 (post-test)
SCI(R) BAT More of A,
more of B U
Total
SCI(R) 10 4 2 6 22
R-TAKE 1 0 0 2 3
SHARE 5 0 0 7 12
More of A,
more of B 0 1 0 0 1
BAT 1 17 1 3 22
Model Qn6
(post-test)
U 1 0 0 0 1
Total 18 22 3 18 61
Table 4.63: Mental models in Qn 6 and Qn 8
4.5.5.5 Summary of students’ views of how resistance controls the current
The data indicated that about half the sample could still not understand how
resistances in parallel branches control the current within each branch. Moreover, while
there was an increase in the overall number of correct responses, there were also shifts
from scientific models to alternative ideas. The BAT model was shown to be one which
students used more at the post-test stage, compared to the pre-test. This could be one
factor hindering students’ understanding of how resistance controls the current. In fact,
both the battery and the resistance determine the current in a circuit. While the battery
determines the strength of ‘the push’, the resistance controls the rate of flow of charge.
Some students may not distinguish between these two forms of control, hence the
confusion.

172
4.5.6 Conceptualization of p.d.
4.5.6.1 P.d. across ideal connecting wires
Problems in Qns 12’(b) and 12’(c) (Figure 4.21) still persisted. Some students
still did not see that the p.d. across ideal connecting wires is zero.
Figure 4.21: Qn 12’ - ‘p.d. across resistances and ideal connecting wires’
Only half the sample gave a correct answer to both part questions (b) and (c)
(see Table 4.64), but this was an improvement over the pre-test results. Only 13 students
(21%) had been consistently correct at that time.

173
Qn12’c (post-test)
>6V 6V <6V Zero
Total
6V 1 13 6 4 24
<6V 0 0 6 0 6
Zero 0 0 0 30* 30
Qn12’b
(post-
test)
Missing 0 0 1 0 1
Total 1 13 13 34 61
Table 4.64: Results for Qn 12’(b) and Qn 12’(c)
4.5.6.2 A voltmeter registers a difference of ‘something’ between two points
Answers to Qn 12’(a) showed that 50 students (82%) saw points ‘a’ and ‘e’ as
equivalent points to ‘b’ and ‘d’, with the same p.d. across them. This also showed
improvement over the 40 students (66%) who had answered correctly in the pre-test (see
Figure 4.22). Looking at this part question alone, the impression was that many students
were now seeing p.d. as some difference between points, as read by a voltmeter.
Figure 4.22: Responses to Qn 12’(a) - ‘p.d. across equivalent points’
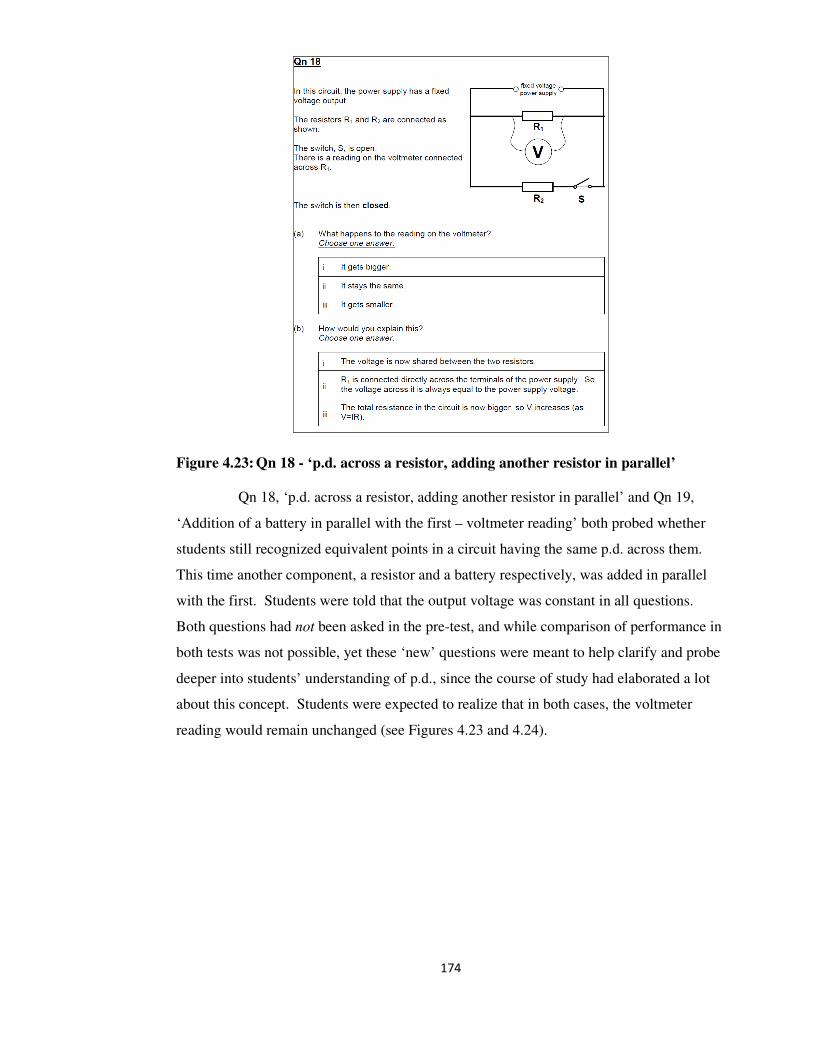
174
Figure 4.23: Qn 18 - ‘p.d. across a resistor, adding another resistor in parallel’
Qn 18, ‘p.d. across a resistor, adding another resistor in parallel’ and Qn 19,
‘Addition of a battery in parallel with the first – voltmeter reading’ both probed whether
students still recognized equivalent points in a circuit having the same p.d. across them.
This time another component, a resistor and a battery respectively, was added in parallel
with the first. Students were told that the output voltage was constant in all questions.
Both questions had not been asked in the pre-test, and while comparison of performance in
both tests was not possible, yet these ‘new’ questions were meant to help clarify and probe
deeper into students’ understanding of p.d., since the course of study had elaborated a lot
about this concept. Students were expected to realize that in both cases, the voltmeter
reading would remain unchanged (see Figures 4.23 and 4.24).

175
Figure 4.24: Qn 19 - ‘Addition of a battery in parallel with the first: Voltmeter
reading’
The results in Tables 4.65 and 4.66 indicate the ideas students were using in
these questions.
Answer to
Qn18(a) Answer to
Qn18(b) Mental model consistent
with answers Mental
model code Number of
students Percentage (N=61)
ii ii p.d. as some difference
between two points SCI(p.d.) 47* 77%
i iii Number of components
counts and not how they
are connected
MORE of A,
more of B
2 3%
ii/iii i p.d. as ‘flow’: p.d. is
shared between Rs in
parallel p.d.FLOW(I) 1/7 2%/12%
ii/iii iii Unclassified U 3/1 5%/2%
Table 4.65: Results for Qn 18 - ‘p.d. across a resistor, adding another resistor in
parallel’

176
Answer to
Qn19(a) Answer to
Qn19(b) Mental model consistent
with ideas Mental model
code Number of
students Percentage (N=61)
ii ii p.d. as some difference
between two points SCI(p.d.) 29* 48%
i i Number of components
counts and not how they
are connected
More of A,
more of B
10 16%
i iv p.d. as ‘flow’: p.d. in
terms of energy supplied
to the circuit p.d.FLOW(E) 2 3%
iv iii p.d. as ‘flow’: batteries
push against each other
(local reasoning) p.d.FLOW(B) 8 13%
Others U 12 20%
Table 4.66: Results for Qn 19 - ‘Addition of a battery in parallel with the first:
Voltmeter reading’
Looking at these results, the initial impression that many students saw p.d. as ‘a
difference of some sort’ between points now started to become less certain. When another
resistor was added in parallel with the first, some students’ ideas shifted towards sharing of
p.d. When another battery was added in parallel with the first, some students’ answer
choices were linked with either an increased p.d. or a cancellation effect of two batteries
working against each other.
These results seem to indicate that some students may have understood p.d. as
‘some’ difference between points, but that their understanding may not have been deep
enough to let them see this in all contexts. When a change is made to a circuit, this
becomes too much of a distractor, with students intuitively looking mainly at what is
changing, often giving an answer based on local reasoning. The circuit is thus not looked
at globally (see Closset (as cited in Millar and King, 1993); Shipstone, 1984; Shipstone
1985).
4.5.6.3 Further evidence of the effect of distractors
Qn 20, ‘Addition of a battery in parallel with the first: Ammeter reading’ (see
Figure 4.25) was seen as complementing Qn 19 since it extends the idea of constant p.d.
across two points when a second battery is connected in parallel with the first, while
expecting students to realize also that the current through R remains the same.

177
Figure 4.25: Qn 20 - ‘Addition of a battery in parallel with the first: Ammeter reading’
Analyzing Qn 20 in the same way as Qn 19 and comparing the data (see Table
4.67) it can be seen how much harder the students found it to transfer their idea of constant
p.d. to predict that the ammeter within the branch would show the same reading. Out of 29
students (48%) answering correctly in Qn 19, only 9 students (15%) answered correctly
and consistently in Qn 20.

178
Model Qn20 (post-test)
SCI(p.d.) More of A,
more of B p.d.FLOW(E) p.d.FLOW(B) U
Total
SCI(p.d.) 9* 12 7 1 0 29
More of A,
more of B 0 7 3 0 0 10
p.d.FLOW(E) 0 0 2 0 0 2
p.d.FLOW(B) 1 3 0 5 0 9
Model
Qn19
(post-test)
U 3 4 0 1 3 11
Total 13 26 12 7 3 61
Table 4.67: Mental models in Qn 19 and Qn 20
Rather than focusing on the constant p.d. across points, students tended to look
at the change within the circuit, that is, the extra battery added in parallel. Students moved
from scientific answers in Qn 19, to answers in Qn 20 indicating they ‘saw’ the larger
number of batteries as pushing harder, or supplying more energy, ignoring the global effect
of the circuit as a system. This may once again be seen as an extension of basic causal
reasoning, with students finding it difficult to predict that changing something results in no
change in the quantity being asked about.
4.5.6.4 P.d. not distinguished from current
Analyzing Qns 15 and 16, ‘p.d. across equal and unequal parallel resistors’ one
can see that while there was an overall improvement since the pre-test stage, in terms of
frequency of scientific answers, yet some students were still using unhelpful ideas which
they had used in the pre-test.
When students’ individual answers in the pre- and post-test were compared (see
Table 4.68), it was found that 16 students (26%) held on to their correct and incomplete
answers, while a substantial number moved to this from other views, including the
‘scientific and complete’ category. Some kept their alternative views, while others
regressed, going from a scientific incomplete answer in the pre-test, to one based on
alternative views in the post-test. Some mentioned having the same voltmeter reading
because of identical resistances, or referred to equal ‘splitting’ or ‘sharing’ of the supply
voltage between resistances.

179
Model Qn15 (post-test)
SCI(C) SCI(D) p.d.FLOW(I) U
Total
SCI(C) 0 4 0 0 4
SCI(D) 3 16 4 1 24
p.d.FLOW(I) 4 11 6 6 27
Missing
explanation 1 2 0 1 4
Model
Qn15
(pre-test)
U 0 1 0 1 2
Total 8 34 10 9 61
Table 4.68: Comparing pre-test and the post-test models in Qn 15
The results for Qn 16 were again along much the same lines as for Qn 15,
though with unequal resistances, understanding seemed, as in the pre-test, slightly worse.
It was more difficult to visualize equal p.d. across equivalent points in the circuit when the
resistances within the parallel branches were unequal (see Table 4.69). Answers based on
ideas of direct or inverse proportionality between resistance and voltage started to appear,
as in the pre-test.
Model Qn16 (post-test)
SCI(C) SCI(D) p.d.FLOW(I) U
Total
SCI(C) 4 1 1 2 8
SCI(D) 1 21 4 8 34
p.d.FLOW(I) 0 1 4 5 10
Model
Qn15
(post-test)
U 0 0 0 9 9
Total 5 23 9 24 61
Table 4.69: Models in Qn 15 and Qn 16
Globally, the answers to both of these questions pointed towards the fact that
either students could predict the voltmeter readings correctly and provide a complete/
incomplete/inadequate explanation for their prediction, or else students split the supply
voltage. This splitting of the voltage indicated that either the circuit was being treated like
a series circuit (see Millar & Beh, 1993) or more likely that the voltage was being looked
at as if it were current. Overall, it can be said that 27 students (44%) seemed to visualize
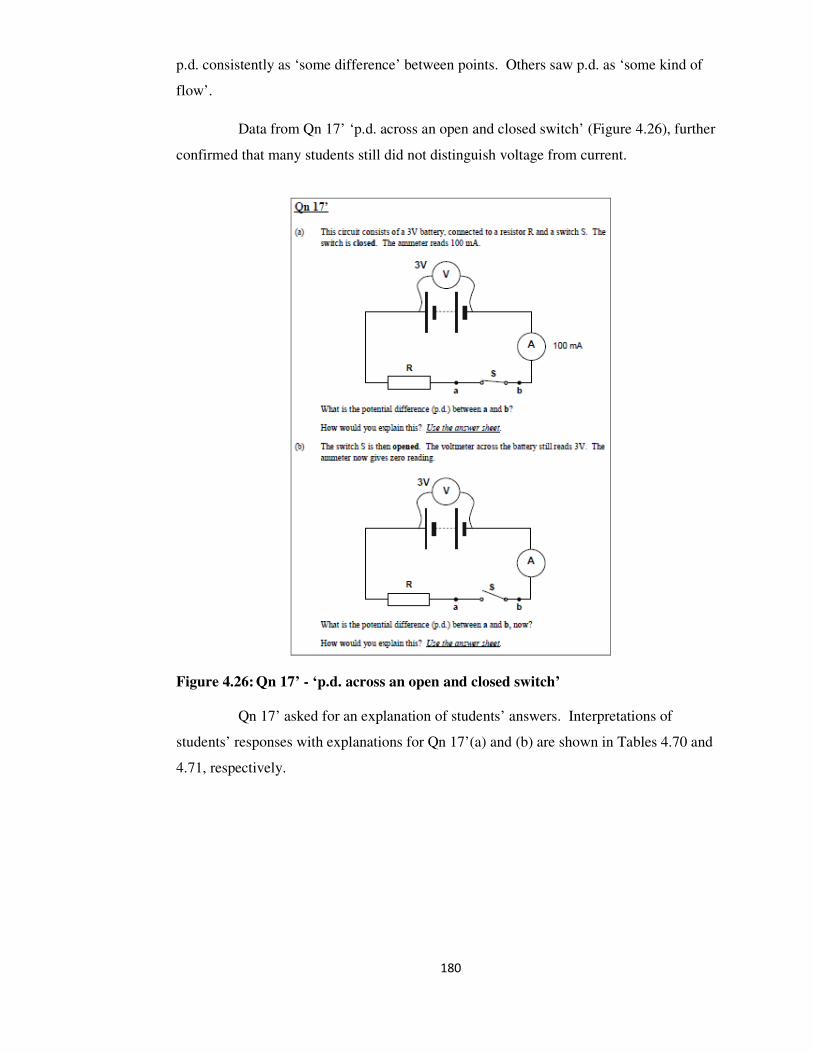
180
p.d. consistently as ‘some difference’ between points. Others saw p.d. as ‘some kind of
flow’.
Data from Qn 17’ ‘p.d. across an open and closed switch’ (Figure 4.26), further
confirmed that many students still did not distinguish voltage from current.
Figure 4.26: Qn 17’ - ‘p.d. across an open and closed switch’
Qn 17’ asked for an explanation of students’ answers. Interpretations of
students’ responses with explanations for Qn 17’(a) and (b) are shown in Tables 4.70 and
4.71, respectively.

181
(N=61)
Answers to Qn 17’(a)
Prediction Correct and
complete Correct but
incomplete Restating
answer Unclassified
Using
alternative
views
Missing
explanation
0 volts 13* 10* 4 1 1
3 volts 14 1 6
Less than 3 V
3 1
More than
3 V 1
0.1R 1
2.7 V 1
Missing
prediction 4
Table 4.70: Answers to Qn 17’(a) - ‘P.d. across a closed switch’
(N=61)
Answers to Qn 17’(b) Prediction
Explanation 0 Volts 3 Volts missing
No current flowing 34
correct and complete 1*
correct and incomplete 5*
restatement 3
Unclassified 5
with alternative framework 6
missing explanation 2 1 4
Table 4.71: Answers to Qn 17’(b): ‘P.d. across an open switch’
In the answers to part (a), some explanations revealed how language may be
looked at as a most imperfect tool (Holt, 1982). Some students used words with different
meanings interchangeably in their writing, and others did not describe their views in detail,
leaving much to the interpretation of the researcher.

182
‘(0 volts)’ ‘There is no resistance between ‘a’ and ’b’, therefore no change in
p.d.’
(Comment: The student used ‘p.d.’ when he should be referring to potential.)
‘(0 volts)’ ‘All voltage is used up by the resistor.’
(Comment: The part of the answer: ‘voltage is used up’, gives the impression that the
student saw something like ‘energy’ being used up.)
‘(Less than 3V)’ ‘R decreases the rate of flow.’
(Comment: There is a hint of current attenuation in the student’s idea - the decreased rate
of flow resulting in something ‘less than 3V’.)
Answers to part (b), for the p.d. across an open switch, show that more than half
the students (34; 56%) still stated that there can be no p.d. if no current is flowing. Some
students repeated the answer they had given in the pre-test, supporting it with their
alternative idea about when p.d. exists, thus:
‘(0 volts)’ ‘No current, therefore no p.d. across the points.’
The ability to distinguish p.d. from current was rare indeed.
Other explanations gave evidence of how students ‘saw’ or at least described
voltage as current.
‘(0 volts)’ ‘No p.d. is passing in the wire.’
‘(0 volts)’ ‘No voltage will pass, if the current is open.’
‘(0 volts)’ ‘No voltage flows in an incomplete circuit.’
Many students still related p.d. to something that flows or moves through a
circuit. Not much had changed since the pre-test stage.
4.5.6.5 Summary of how students conceptualized p.d.
In questions which may be considered simple and direct, like Qn 12’(a), 82% of
the students could easily predict the p.d. across two points by quoting the voltmeter reading
across equivalent points.
When changes in the circuit were proposed, there was evidence of students who
focused on the change rather than on how the circuit behaves as a system. Data specific to

183
Qns 18 and 19 indicated that 23% of the sample reacted in this way, proposing a view of
p.d. as something that flows, splitting up at junctions or being shared between resistances.
Ideas related to p.d. as flow of energy were also held.
Overall, p.d. was either looked at as ‘some difference between points’ or as
‘something which flows’. While some improvements were evidenced in students’ answers
since the pre-test, yet, 56% of the students still stated they saw no p.d. if there was no
current in the circuit. Many still did not distinguish p.d. from current, showing that the
evolution from a flow model to a difference model was hard to accomplish, even after
teaching.
4.5.7 Summary of post-test results
While more students answered correctly to questions about charges and where
they reside, yet 34% of the student sample still visualized electrons in the battery only,
before connecting the circuit. More than a quarter indicated their difficulty in
understanding that charges move everywhere and together around the circuit, once the
circuit is closed.
The only models of current students indicated were those of conservation (CC)
or attenuation of conventional current (ACC). Many now used the CC model, with at least
70% of the students indicating consistent use of it in different questions.
Analysis of questions about resistance gave indications that ideas consistent with
the SHARE (current being shared between the resistors) and the BAT (same battery, same
current) models were popular with students. The BAT model was used consistently by 17
students in both Qns 6 and 8 (see Table 4.61).
In Qn 8, when a resistance was added in parallel, the post-test results indicated
that a good number of students, who in the pre-test were proposing an answer that could
not be classified as indicating any specific mental model now used the BAT model, thus
giving little importance either to the number of resistors or the manner in which they were
connected. The battery was the focus of attention. If the battery was the same, the current
it pushed into the circuit was assumed the same. It seemed that the BAT model was a
popular choice option with students – a model which could have been hindering
understanding of how resistance controls the current. Moreover, for about 2% of the
students’ who still lacked understanding of how resistance affects the current, this led to

184
strong views about having equal splitting of the current along parallel branches, regardless
of the resistance within each particular branch.
With regard to p.d., many students did not appreciate that when changes are
made to a circuit, it is possible that the p.d. across two points does not change. Many
students did not see ‘a system’ at work, but focused primarily on what was changing or
being added to the circuit, basing their answers on the change and reaching incorrect
conclusions. Moreover, having a majority of students splitting the supply voltage across
parallel resistors, especially in Qn 16 with unequal resistances, suggested that many
students had not yet clearly separated the idea of p.d. from that of current. Indeed Qn 17’,
‘p.d. across an open and closed switch’, provided further evidence that, while many saw
that when a current flows it is a resistance which has a p.d. across it, just as many believed
that there can be no p.d. if no current flows.
4.6 Students’ performance in the delayed post-test
4.6.1 Introduction
The aim of administering the delayed post-test was to find out whether the
students retained the knowledge and understanding of what they had learnt through the
course. The questions used in the delayed post-test were the same ones which had been
asked in the post-test and the analysis was conducted in the same way as has been
described in detail for the pre-test and the post-test. The following sections, briefly
describe important findings.
4.6.2 Facility value results
4.6.2.1 Comparing facility values in the post- and delayed post-test
Table 4.72 shows the facility values in rank order for questions in the post- and
delayed post-test. These tests consisted of the same questions. While the rank order of
some questions, in terms of facility value, may have changed slightly from the post- to the
delayed post-test, yet, globally, the facility values increased for the majority of the
questions answered in the delayed post-test. Students thus performed better in the delayed
post-test.

185
Table 4.72: Comparing facility values in the post-test and delayed post-test questions

186
4.6.2.2 Comparing facility values for common questions in all tests
Table 4.73: Comparing facility values for common questions on the three tests
Comparing the performance on the common questions in all tests (Table 4.73) it
is evident that:
• the first seven questions which proved easy to answer in the post-test were still easy to
answer on the delayed post-test, keeping the same rank order;
• Qn 17b(ii), ‘p.d. across an open switch’, probing students’ understanding of the
presence of p.d. without the presence of a current, remained very low in facility value
and is last in rank on both post-test and delayed post-test;
• the facility value for questions relating to microscopic views remained low in all tests.
On a general note, while a good number of facility shifts occurred in going from
the pre-test to the post-test, more stability in terms of facility was evidenced when
comparing the post-test to the delayed post-test results. This implies that what was learnt
was better internalized and retained at the later stages. When questions were directly
related to ideas which could be recalled like, for example, ‘increasing the resistance
decreases the current’, or ‘adding a second battery in series increases the current’, the
facility values were high. As soon as questions started probing ideas related to resistance
and p.d. across series and parallel resistors, the facility values started to drop. This was
also evidenced in the qualitative analyses of the data, as the next sections shall continue to
show.
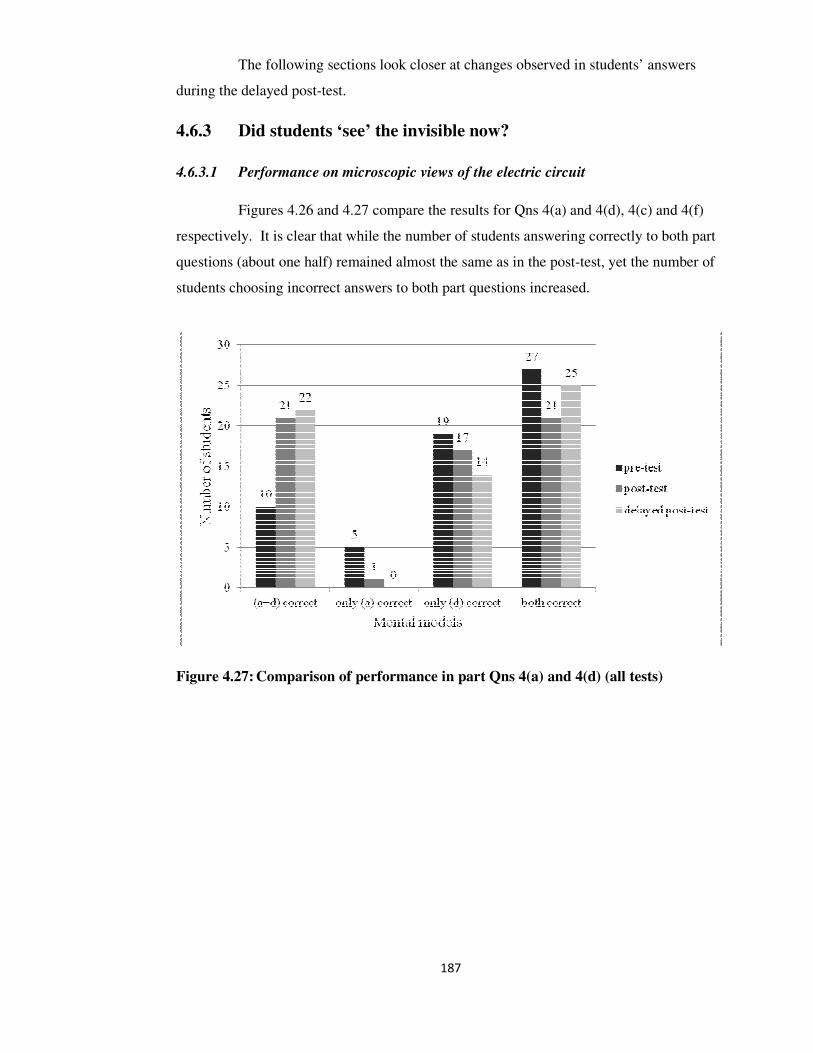
187
The following sections look closer at changes observed in students’ answers
during the delayed post-test.
4.6.3 Did students ‘see’ the invisible now?
4.6.3.1 Performance on microscopic views of the electric circuit
Figures 4.26 and 4.27 compare the results for Qns 4(a) and 4(d), 4(c) and 4(f)
respectively. It is clear that while the number of students answering correctly to both part
questions (about one half) remained almost the same as in the post-test, yet the number of
students choosing incorrect answers to both part questions increased.
Figure 4.27: Comparison of performance in part Qns 4(a) and 4(d) (all tests)

188
Figure 4.28: Comparison of performance in part Qns 4(c) and 4(f) (all tests)
Data indicated that there were as many students who progressed to a correct
answer, as students who regressed to an incorrect view. Table 4.74 shows this for Qn 4(a).
Qn4(a) (delayed post-test)
Correct Incorrect
Total
Correct 12* 10 22 Qn4(a)
(post-test) Incorrect 10 29 39
Total 22 39 61
Table 4.74: Post-test and delayed post-test results to Qn 4(a)
4.6.3.2 Summary on how students visualised charges in the electric circuit
While less than one third of the students gave evidence that they consistently
saw charges present in the battery and in the wires all the time, these moving together after
the circuit is connected, some other students regressed in their views since the post-test
was administered. Even if a few students improved in their understanding of how the
charges in the circuit behave, yet, all in all, the indication was that problems still persisted
in this area. Students found difficulty understanding what they could not see.

189
4.6.4 Models of current used in the delayed post-test
4.6.4.1 Performance on questions probing models of current
Similarly to the post-test results, the majority of students conserved the current
while only very few used attenuation.
In Qn 1, 87% of the sample retained ideas consistent with the current
conservation (CC) model. A small number of students regressed to an attenuated view but
the same number improved and conserved the current, such that 92%, in all, now used the
CC model in this question (see Table 4.75).
Model Qn1 (delayed post-test)
CC ACC AEF U
Total
CC 53* 2 1 1 57 Model Qn1
(post-test) ACC 3 1 0 0 4
Total 56 3 1 1 61
Table 4.75: Mental models in the post-test and delayed post-test for Qn 1
Figure 4.29: Mental models of current in Qn 1 - ‘Currents at points (a) and (b)’ (all
tests)
Figure 4.29 compares performance on this question in the three tests.

190
Similar performance was observed in Qn 3, ‘Picture of the battery and bulb’,
with 46 students (75%) now using ideas consistent with current conservation, compared to
43 students (70%) who had been correct in the post-test (see Figure 4.30 showing student
performance in Qn 3 over the three tests).
Figure 4.30: Mental models of current in Qn 3 (all tests)
More students now conserved current within a parallel branch. Results in Table
4.76, for Qn 9’(a), show the progress of 8 students (13%) moving from ideas consistent
with attenuation in the post-test to current conservation in the delayed post-test. A
majority of 57 students (93%) answered correctly (see also Figure 4.31).
Qn9’(a) (delayed post-test)
CC ACC AEF
Total
CC 49* 1 1 51
ACC 7 2 0 9 Qn9’(a)
(post-test)
AEF 1 0 0 1
Total 57 3 1 61
Table 4.76: Mental models in the post-test and delayed post-test for Qn 9’(a)
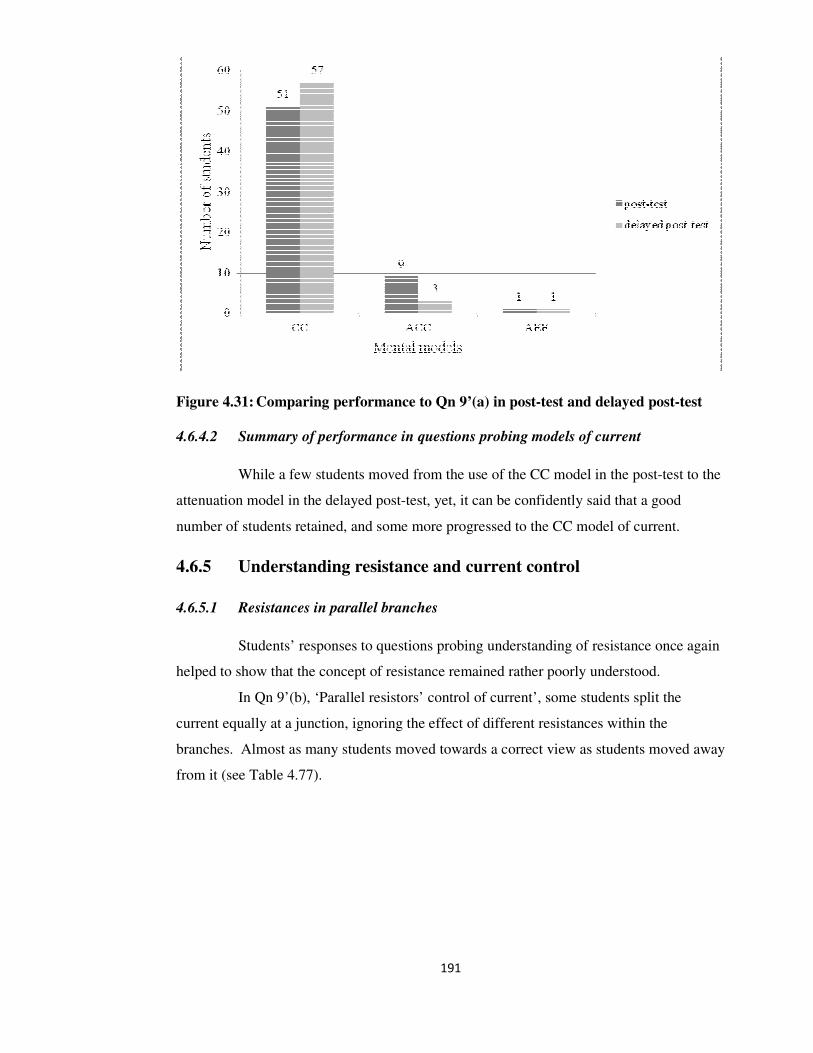
191
Figure 4.31: Comparing performance to Qn 9’(a) in post-test and delayed post-test
4.6.4.2 Summary of performance in questions probing models of current
While a few students moved from the use of the CC model in the post-test to the
attenuation model in the delayed post-test, yet, it can be confidently said that a good
number of students retained, and some more progressed to the CC model of current.
4.6.5 Understanding resistance and current control
4.6.5.1 Resistances in parallel branches
Students’ responses to questions probing understanding of resistance once again
helped to show that the concept of resistance remained rather poorly understood.
In Qn 9’(b), ‘Parallel resistors’ control of current’, some students split the
current equally at a junction, ignoring the effect of different resistances within the
branches. Almost as many students moved towards a correct view as students moved away
from it (see Table 4.77).
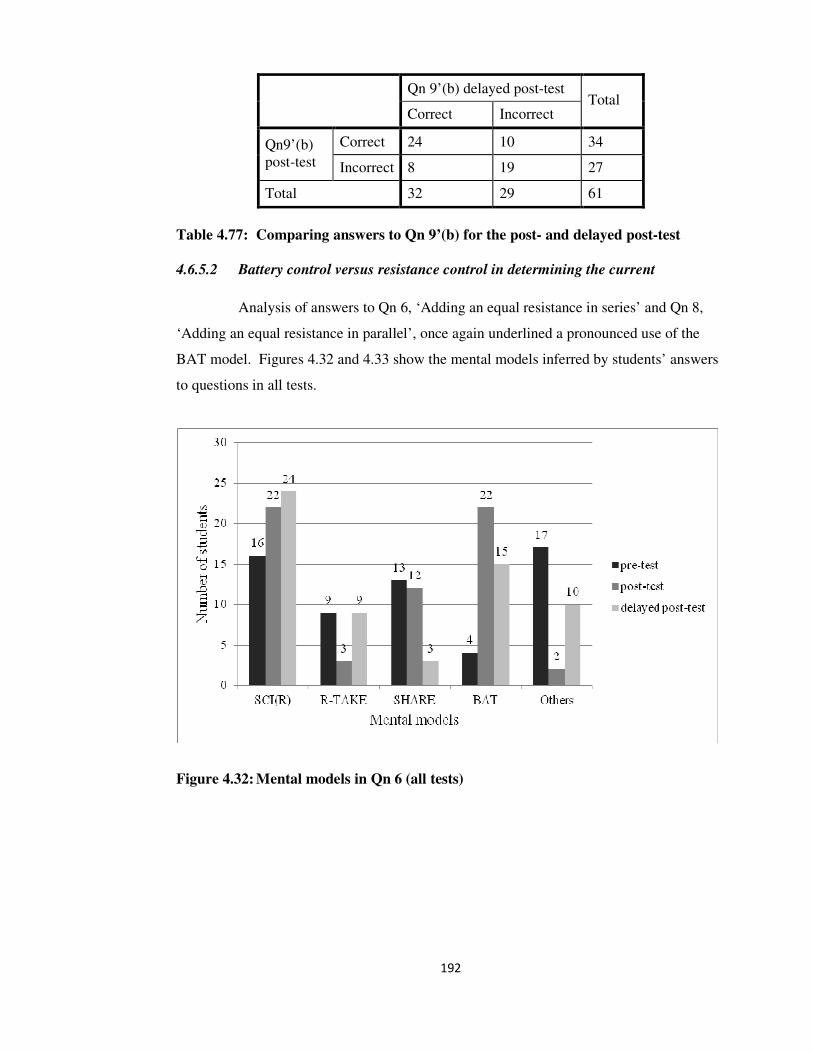
192
Qn 9’(b) delayed post-test
Correct Incorrect Total
Correct 24 10 34 Qn9’(b)
post-test Incorrect 8 19 27
Total 32 29 61
Table 4.77: Comparing answers to Qn 9’(b) for the post- and delayed post-test
4.6.5.2 Battery control versus resistance control in determining the current
Analysis of answers to Qn 6, ‘Adding an equal resistance in series’ and Qn 8,
‘Adding an equal resistance in parallel’, once again underlined a pronounced use of the
BAT model. Figures 4.32 and 4.33 show the mental models inferred by students’ answers
to questions in all tests.
Figure 4.32: Mental models in Qn 6 (all tests)
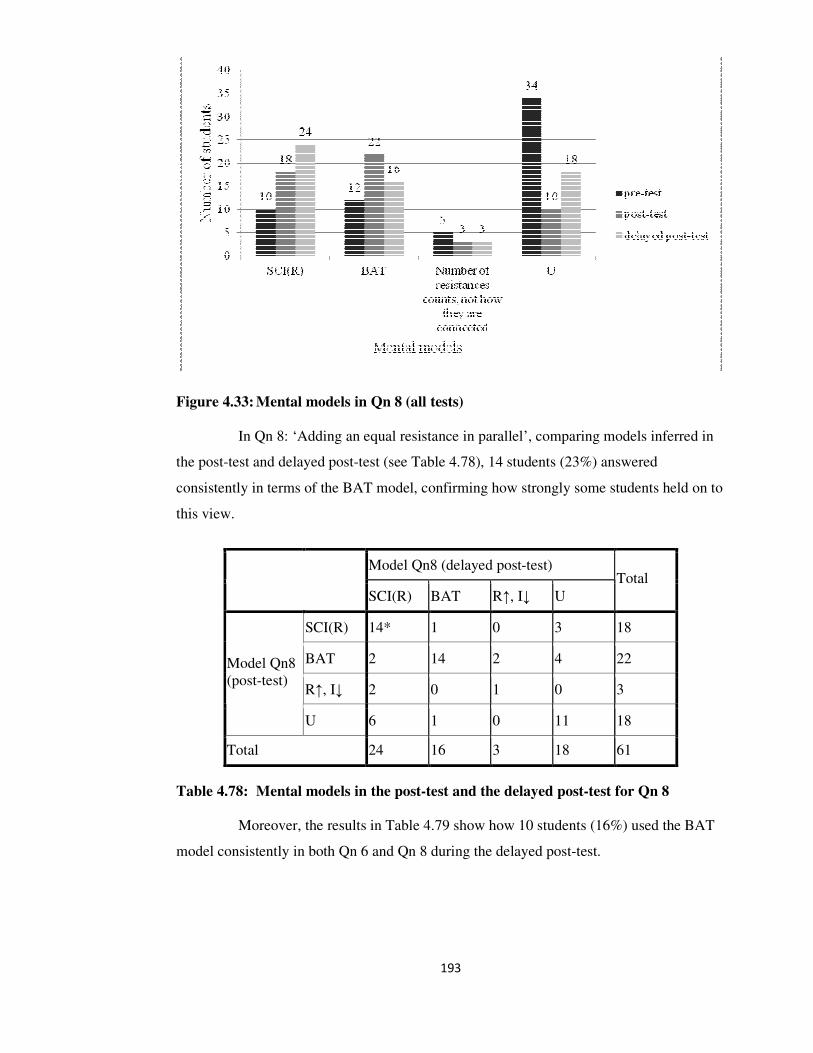
193
Figure 4.33: Mental models in Qn 8 (all tests)
In Qn 8: ‘Adding an equal resistance in parallel’, comparing models inferred in
the post-test and delayed post-test (see Table 4.78), 14 students (23%) answered
consistently in terms of the BAT model, confirming how strongly some students held on to
this view.
Model Qn8 (delayed post-test)
SCI(R) BAT R↑, I↓ U
Total
SCI(R) 14* 1 0 3 18
BAT 2 14 2 4 22
R↑, I↓ 2 0 1 0 3
Model Qn8
(post-test)
U 6 1 0 11 18
Total 24 16 3 18 61
Table 4.78: Mental models in the post-test and the delayed post-test for Qn 8
Moreover, the results in Table 4.79 show how 10 students (16%) used the BAT
model consistently in both Qn 6 and Qn 8 during the delayed post-test.

194
Model Qn8 (delayed post-test)
SCI(R) BAT R↑, I↓ U
Total
SCI(R) 16* 1 1 6 24
R-TAKE 4 1 1 3 9
SHARE 1 0 0 2 3
BAT 1 10 1 3 15
Model Qn6
(delayed post-test)
others 2 4 0 4 10
Total 24 16 3 18 61
Table 4.79: Mental models in Qn 6 and Qn 8
4.6.5.3 Summary of performance in questions probing understanding of resistance
More students could see that as resistance increases, current decreases.
However, some students still inferred ideas consistent with the BAT model. These
students focused more on the control of the current by the battery, forgetting the
fundamentally important point that the current in the circuit is determined not only by the
battery push but also by the control of this push by the resistance within the circuit.
4.6.6 Understanding p.d.
4.6.6.1 P.d. across ideal connecting wires
In the post-test the concept of p.d. was shown as being difficult to understand.
Evidence had been provided to show that students either saw p.d. as ‘some difference
between points’ or as ‘something which flows’. In the delayed post-test these ideas
prevailed.
In Qns 12’(b) and (c) only half the students gave correct answers and recognized
zero p.d. across the connecting wires (see Table 4.80).

195
Qn12’(c) (delayed post-test)
6V <6V Zero
Total
>6V 1 0 0 1
6V 12 5 5 22
< 6V 1 5 0 6
Qn12’(b)
(delayed post-test)
Zero 1 0 31* 32
Total 15 10 36 61
Table 4.80: Results for Qn 12’(b) and (c)
Comparing results for Qn 12’(c) for both post-test and delayed post-test (Table
4.81), also shows that only half the sample answered correctly in both tests. This half
seems to have retained their correct ideas. The other half could not ‘see’ zero p.d. across
ideal connecting wires.
Qn12’(c) (delayed post-test)
6V <6V Zero
Total
>6V 1 0 0 1
6V 8 3 2 13
<6V 5 3 5 13
Qn12’(c)
(post-test)
Zero 1 4 29* 34
Total 15 10 36 61
Table 4.81: Results for Qn 12’(c) during the post-test and delayed post-test
4.6.6.2 P.d. across equivalent points
In Qn 12’, ‘p.d. across resistances and ideal connecting wires’, only 45 students
(74%; see Table 4.82) in both tests, saw consistently that the voltmeter reading indicated
the p.d. across equivalent points ‘b’ and ‘d’.

196
Qn12’(a) (delayed post-test)
>6V 6V <6V
Total
>6V 0 0 1 1
6V 0 45* 5 50 Qn12’(a)
(post-test)
<6V 1 4 5 10
Total 1 49 11 61
Table 4.82: Results for Qn 12’(a) in the post-test and delayed post-test
Qn 18, ‘p.d. across a resistor, adding another resistor in parallel’ also probed
whether students could identify equivalent points and ‘see’ p.d. as a difference between
those points. The results in Figure 4.34 show that a smaller number of students answered
correctly in the delayed test, some students showing what had been pointed at in the post-
test analysis, that choices were affected and related to the change suggested in the circuit.
A slight regression of ideas towards unscientific views was detected in this question.
Figure 4.34: Performance on Qn 18 – ‘p.d. across a resistor, adding another resistor
in parallel’
Comparing the performance on Qn 18 and Qn 12’(a) in the delayed post-test, 35
students (57%, slightly more than half the sample) were consistently viewing p.d. as a
difference between two equivalent points (see Table 4.83) in these questions. This number
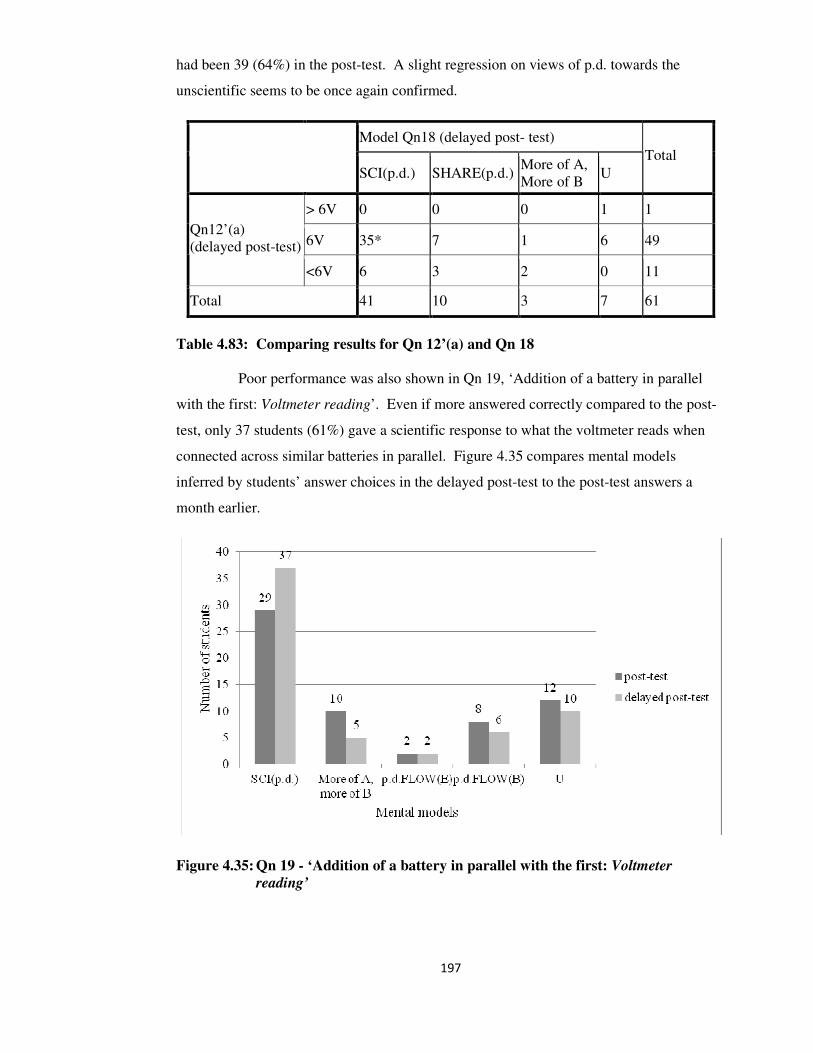
197
had been 39 (64%) in the post-test. A slight regression on views of p.d. towards the
unscientific seems to be once again confirmed.
Model Qn18 (delayed post- test)
SCI(p.d.) SHARE(p.d.) More of A,
More of B U
Total
> 6V 0 0 0 1 1
6V 35* 7 1 6 49 Qn12’(a)
(delayed post-test)
<6V 6 3 2 0 11
Total 41 10 3 7 61
Table 4.83: Comparing results for Qn 12’(a) and Qn 18
Poor performance was also shown in Qn 19, ‘Addition of a battery in parallel
with the first: Voltmeter reading’. Even if more answered correctly compared to the post-
test, only 37 students (61%) gave a scientific response to what the voltmeter reads when
connected across similar batteries in parallel. Figure 4.35 compares mental models
inferred by students’ answer choices in the delayed post-test to the post-test answers a
month earlier.
Figure 4.35: Qn 19 - ‘Addition of a battery in parallel with the first: Voltmeter
reading’
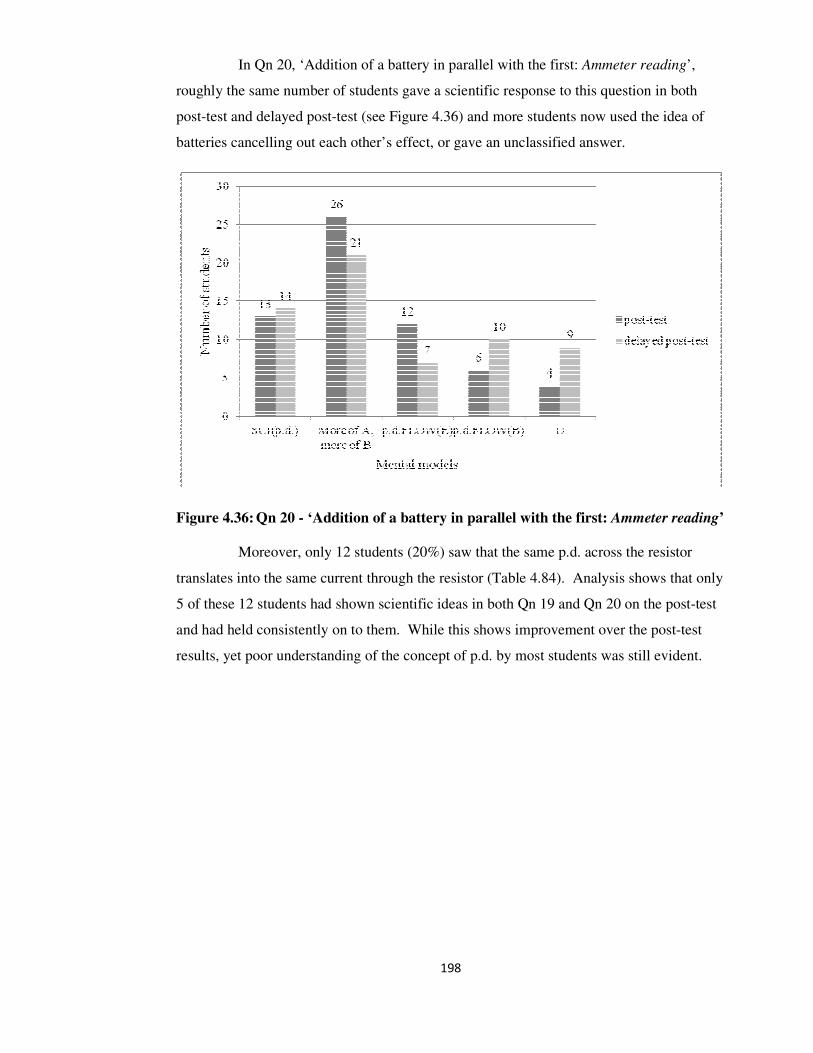
198
In Qn 20, ‘Addition of a battery in parallel with the first: Ammeter reading’,
roughly the same number of students gave a scientific response to this question in both
post-test and delayed post-test (see Figure 4.36) and more students now used the idea of
batteries cancelling out each other’s effect, or gave an unclassified answer.
Figure 4.36: Qn 20 - ‘Addition of a battery in parallel with the first: Ammeter reading’
Moreover, only 12 students (20%) saw that the same p.d. across the resistor
translates into the same current through the resistor (Table 4.84). Analysis shows that only
5 of these 12 students had shown scientific ideas in both Qn 19 and Qn 20 on the post-test
and had held consistently on to them. While this shows improvement over the post-test
results, yet poor understanding of the concept of p.d. by most students was still evident.

199
Model Qn20 (delayed post-test)
SCI (p.d.) More of A,
more of B p.d.FLOW(E) BAT U
Total
SCI(p.d.) 12* 13 4 5 3 37
More of A,
more of B 0 4 1 0 0 5
p.d FLOW(E) 0 1 1 0 0 2
BAT 1 0 0 2 3 6
Model Qn19
(delayed post-test)
U 1 3 1 2 4 11
Total 14 21 7 9 10 61
Table 4.84: Mental models in Qn 19 and Qn 20 during the delayed post-test
4.6.6.3 P.d. not distinguished from current
Approximately as many students as in the post-test could predict the voltmeter
readings correctly in Qn 15a, ‘p.d. across equal resistors connected in parallel’ (see Table
4.85).
Qn15 prediction
(delayed post-test)
4V,4V 8V,8V
Total
4V,4V 3 4 7
8V,8V 3 49* 52 Qn15 prediction
(post-test)
Missing 1 1 2
Total 7 54 61
Table 4.85: Qn 15 (prediction) on the post-test and delayed post-test
Only 8 students, however, gave a correct and complete response (see Table
4.86).
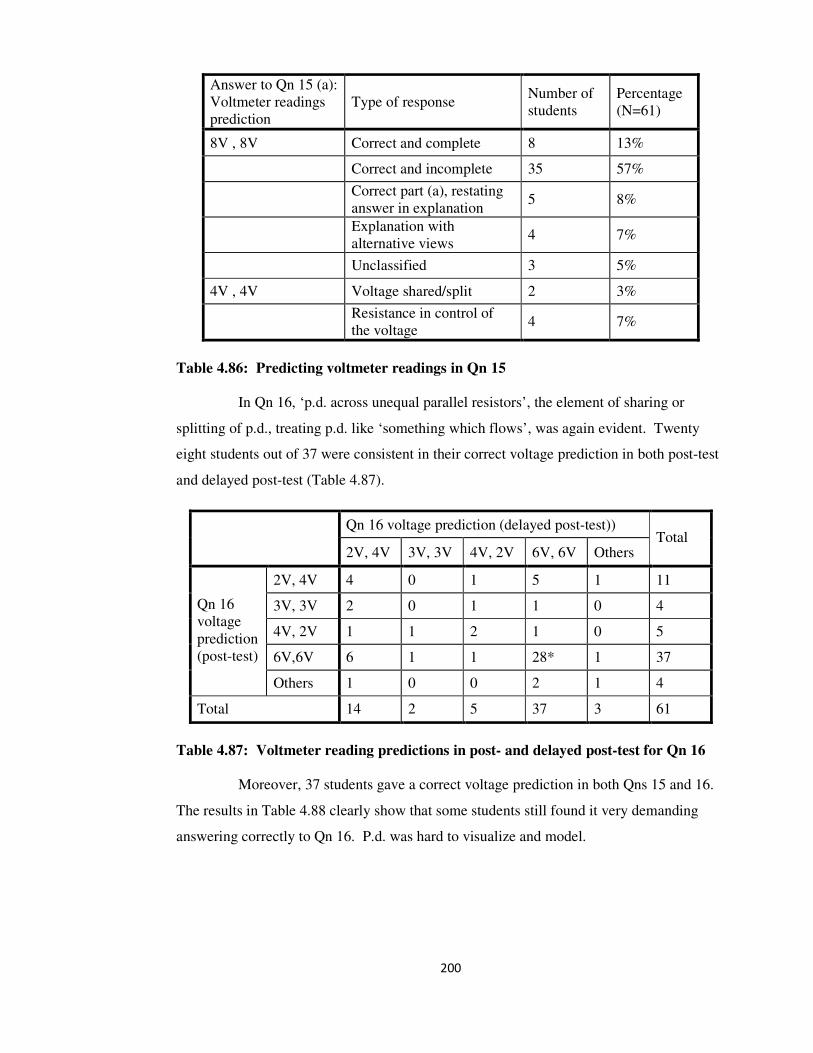
200
Answer to Qn 15 (a):
Voltmeter readings
prediction
Type of response Number of
students
Percentage
(N=61)
8V , 8V Correct and complete 8 13%
Correct and incomplete 35 57%
Correct part (a), restating
answer in explanation 5 8%
Explanation with
alternative views 4 7%
Unclassified 3 5%
4V , 4V Voltage shared/split 2 3%
Resistance in control of
the voltage 4 7%
Table 4.86: Predicting voltmeter readings in Qn 15
In Qn 16, ‘p.d. across unequal parallel resistors’, the element of sharing or
splitting of p.d., treating p.d. like ‘something which flows’, was again evident. Twenty
eight students out of 37 were consistent in their correct voltage prediction in both post-test
and delayed post-test (Table 4.87).
Qn 16 voltage prediction (delayed post-test))
2V, 4V 3V, 3V 4V, 2V 6V, 6V Others Total
2V, 4V 4 0 1 5 1 11
3V, 3V 2 0 1 1 0 4
4V, 2V 1 1 2 1 0 5
6V,6V 6 1 1 28* 1 37
Qn 16
voltage
prediction
(post-test)
Others 1 0 0 2 1 4
Total 14 2 5 37 3 61
Table 4.87: Voltmeter reading predictions in post- and delayed post-test for Qn 16
Moreover, 37 students gave a correct voltage prediction in both Qns 15 and 16.
The results in Table 4.88 clearly show that some students still found it very demanding
answering correctly to Qn 16. P.d. was hard to visualize and model.
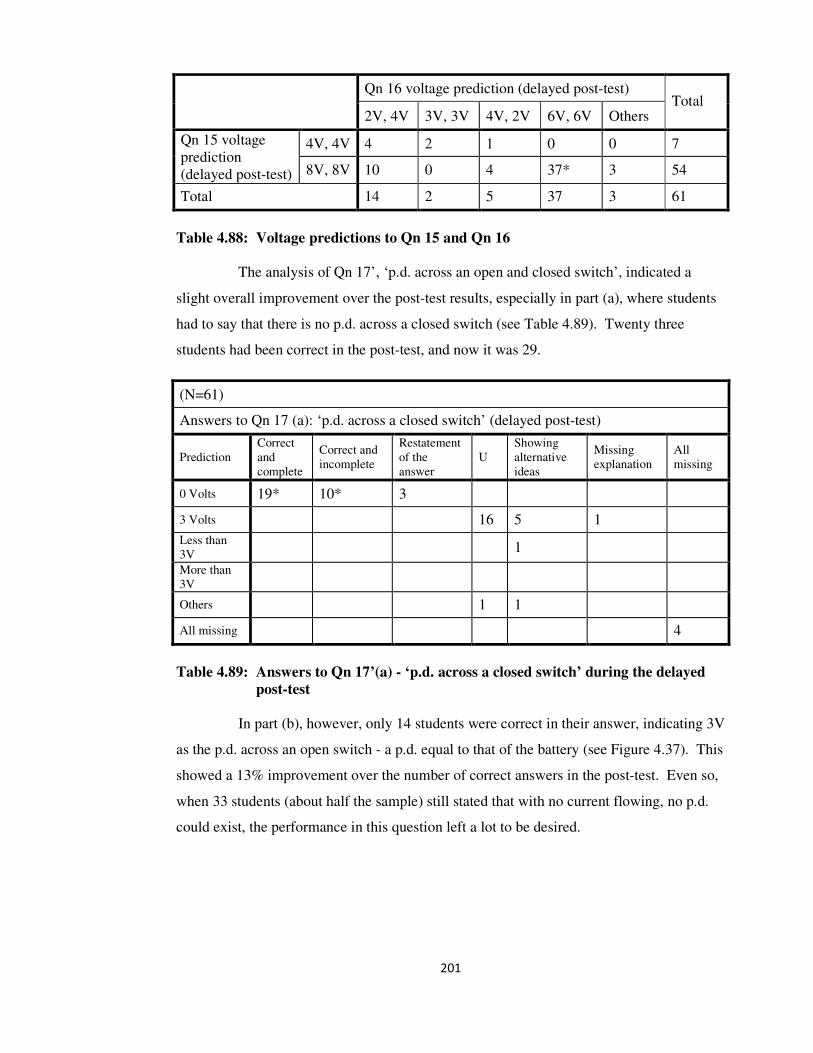
201
Qn 16 voltage prediction (delayed post-test)
2V, 4V 3V, 3V 4V, 2V 6V, 6V Others Total
4V, 4V 4 2 1 0 0 7 Qn 15 voltage
prediction
(delayed post-test) 8V, 8V 10 0 4 37* 3 54
Total 14 2 5 37 3 61
Table 4.88: Voltage predictions to Qn 15 and Qn 16
The analysis of Qn 17’, ‘p.d. across an open and closed switch’, indicated a
slight overall improvement over the post-test results, especially in part (a), where students
had to say that there is no p.d. across a closed switch (see Table 4.89). Twenty three
students had been correct in the post-test, and now it was 29.
(N=61)
Answers to Qn 17 (a): ‘p.d. across a closed switch’ (delayed post-test)
Prediction
Correct
and
complete
Correct and
incomplete
Restatement
of the
answer
U
Showing
alternative
ideas
Missing
explanation
All
missing
0 Volts 19* 10* 3
3 Volts 16 5 1
Less than
3V 1
More than
3V
Others 1 1
All missing 4
Table 4.89: Answers to Qn 17’(a) - ‘p.d. across a closed switch’ during the delayed
post-test
In part (b), however, only 14 students were correct in their answer, indicating 3V
as the p.d. across an open switch - a p.d. equal to that of the battery (see Figure 4.37). This
showed a 13% improvement over the number of correct answers in the post-test. Even so,
when 33 students (about half the sample) still stated that with no current flowing, no p.d.
could exist, the performance in this question left a lot to be desired.

202
Figure 4.37: Answers to Qn 17(b) – ‘p.d. across a closed switch’
4.6.6.4 Summary of students views of p.d.
Evidence indicated that performance on questions dealing with p.d. across
equivalent points in a circuit had, on an average either remained the same or was slightly
poorer in some questions.
More students could now answer correctly to zero p.d. across a closed switch,
but many (more than one half) still had problems acknowledging that p.d. can exist without
a current. It was difficult for a large number of students to see p.d. as an imbalance of
charge between points and to thus distinguish it and describe it differently from current.
4.6.7 Conclusion from the delayed post-test results
Looking at the results of the delayed post-test globally, one cannot say that
performance in the delayed post-test corroborated the view expressed by Fleer (1994) that
students generally regress from the scientific ideas gained during teaching, after some time
has elapsed. Indeed, in most questions the number of correct answers increased, even if by
only a small amount. It should be borne in mind that, at the time of the delayed post-test,
the students in this sample were close to sitting an important national examination in
Physics. This may explain why students performed slightly better at this stage, since they
may have been more serious about their work, as the examination was fast approaching. It
has also been shown that it was not always the same students answering correctly over the

203
two tests. While some students were consistent in their views even after one month
elapsed, the ideas of some other students shifted from or towards the scientific view.
Furthermore, evidence has shown that some students persisted with their unscientific
views.
The following is a summary of the main findings:
• most students showed they now reliably used ideas consistent with the conservation of
current (CC) model;
• less than one third of the students showed that they consistently saw charges present in
the battery and in the wires all the time, these moving together after the circuit is
connected. Problems with microscopic views persisted;
• about one third of the students could not see resistance as a control of the current,
together with the battery push;
• the BAT model seemed more popular compared to other alternative views;
• some regression was shown in dealing with p.d., with about half the sample still
believing that p.d. cannot exist without a current.
4.7 Comparing the overall performance of Cohort 1 in all
tests
The previous sections in this chapter looked in detail at students’ answers and
the mental models students appeared to be using in relation to current, resistance and p.d.
The following sections compare statistical results from the analysis of students’ test scores
in the three tests.
Students’ performance on the common questions in the tests was looked into to
check whether students improved in their overall performance related to the ideas which
were probed by these questions (see Table 4.90).
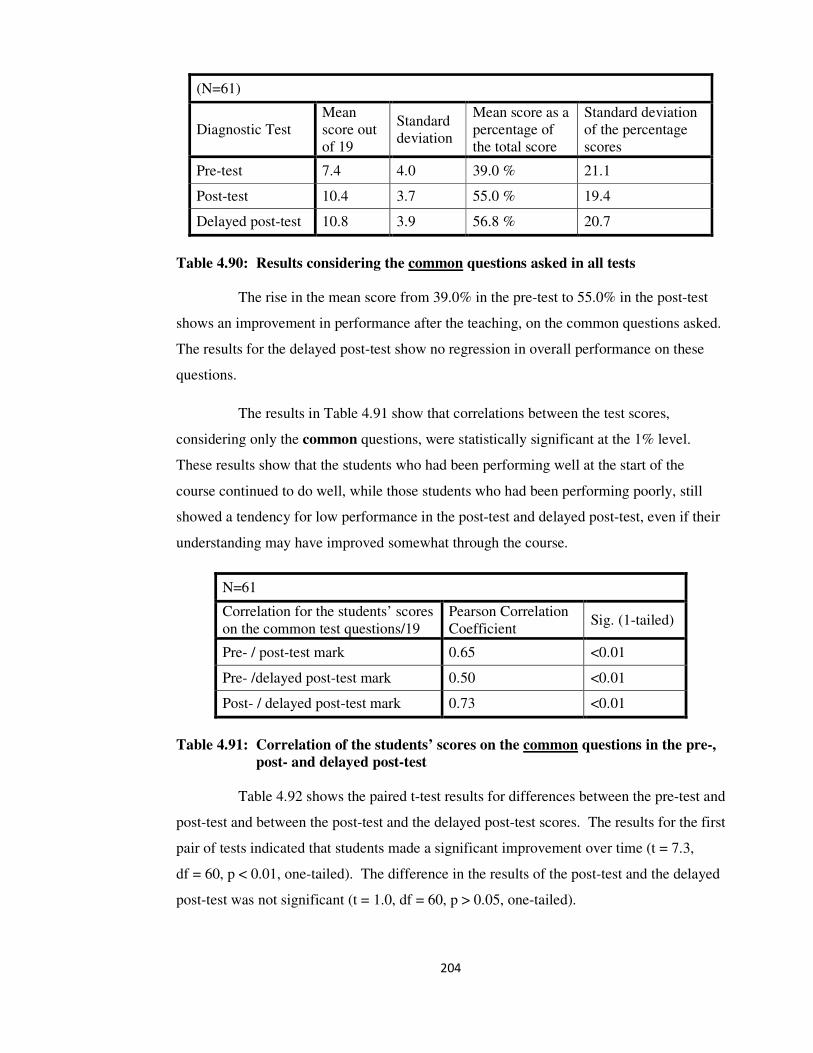
204
(N=61)
Diagnostic Test
Mean
score out
of 19
Standard
deviation
Mean score as a
percentage of
the total score
Standard deviation
of the percentage
scores
Pre-test 7.4 4.0 39.0 % 21.1
Post-test 10.4 3.7 55.0 % 19.4
Delayed post-test 10.8 3.9 56.8 % 20.7
Table 4.90: Results considering the common questions asked in all tests
The rise in the mean score from 39.0% in the pre-test to 55.0% in the post-test
shows an improvement in performance after the teaching, on the common questions asked.
The results for the delayed post-test show no regression in overall performance on these
questions.
The results in Table 4.91 show that correlations between the test scores,
considering only the common questions, were statistically significant at the 1% level.
These results show that the students who had been performing well at the start of the
course continued to do well, while those students who had been performing poorly, still
showed a tendency for low performance in the post-test and delayed post-test, even if their
understanding may have improved somewhat through the course.
N=61
Correlation for the students’ scores
on the common test questions/19
Pearson Correlation
Coefficient Sig. (1-tailed)
Pre- / post-test mark 0.65 <0.01
Pre- /delayed post-test mark 0.50 <0.01
Post- / delayed post-test mark 0.73 <0.01
Table 4.91: Correlation of the students’ scores on the common questions in the pre-,
post- and delayed post-test
Table 4.92 shows the paired t-test results for differences between the pre-test and
post-test and between the post-test and the delayed post-test scores. The results for the first
pair of tests indicated that students made a significant improvement over time (t = 7.3,
df = 60, p < 0.01, one-tailed). The difference in the results of the post-test and the delayed
post-test was not significant (t = 1.0, df = 60, p > 0.05, one-tailed).

205
Difference in score
Mean
Standard
Deviation
t df Sig. (1-tailed)
Post-test –
pre-test 3.0 3.2 7.3 60 <0.01
Delayed post-test –
post-test 0.3 2.8 1.0 60 0.17
Table 4.92: Results of t-tests between post/pre-test and delayed post/post-test (all
questions)
The t-test was used in the above analysis, treating the scores in the diagnostic
tests as interval level data (Brace, Kemp, Snelgar, 2006). Since this was slightly uncertain,
the Wilcoxon test of paired differences was also used to check for the level of significance.
This check confirmed the t-test results. In this chapter and also in later ones, whenever t-
tests were performed, they were checked using the Wilcoxon or Mann-Whitney test, as
appropriate, to compare the levels of significance. In all cases, these checks confirmed that
the results were very similar in terms of level of significance. For this reason, only the t-
test results are presented.
It was also important to examine how test scores on the different groups of
questions changed in going from one test to the next. This indicated which part of the
topic was being understood by students and which part was creating problems in students’
learning. The changes in the mean scores within each group of questions in the diagnostic
tests are shown in Table 4.93.
(N=61)
Diagnostic
test
Group A
(microscopic
views)
Group B
(Models of current)
Group C
(How resistances
control current)
Group D
(Conceptualization
of p.d.)
Mean
%
Standard
Deviation
Mean
%
Standard
Deviation
Mean
%
Standard
Deviation
Mean
%
Standard
Deviation
Pre-test 26.2 31.7 70.2 30.4 44.9 26.2 53.2 22.8
Post-test 44.8 31.0 82.5 27.6 43.0 33.6 46.8 18.9
Delayed
post-test 41.0 35.7 86.3 21.4 45.1 34.7 50.2 20.9
Table 4.93: Means as a percentage for the question groups in all tests (all questions)
These results are in clear agreement with the results from the detailed qualitative
analysis presented in the previous sections. While students still found problems with

206
microscopic views, yet they improved in the use of current conservation views. Treating
resistance as a control of the battery push can be seen to have remained difficult for
students to grasp. Moreover, in Group D, a lower percentage mean resulted for the post-
test questions, when more questions were asked probing p.d. An increase in the percentage
mean score was observed in the delayed post-test on this group, but this score was not as
high as for questions in group B, implying that the current concept was more easily
understood by students when compared to the concept of p.d.
4.8 Conclusion to the analyses of the PDTs (Cohort 1)
The analysis of the results from the 3 diagnostic tests gave some important
indications.
Students showed progress in understanding that current is conserved, with at
least 70% of the sample indicating ideas consistent with the current conservation (CC)
model in the post-test, many holding on to this view in the delayed post-test. Such
progress however, was not shown when dealing with microscopic views, resistance and
p.d.
In dealing with what happens in the battery and wires, it was shown that more
than two thirds still held the idea that the battery carries all the charges and pushes them
into the wires when the circuit is complete. These students did not find it easy ‘to see the
invisible’. Teaching had not helped enough in this regard.
In tackling questions related to resistance, some students started by indicating a
tendency to use the SHARE (current sharing between resistances) and BAT (the same
battery supplies the same current) models in the pre-test. This ‘tendency’ seemed to
evolve into a strong view for some, who showed that they put their focus mainly on what
they thought the battery alone could do to the circuit. The BAT model was in some cases
used consistently, even after teaching – a result which is not indicated in previous
literature. Students who inferred the BAT model ignored the effects of other components
in the circuit. The impression was that local reasoning rather than ‘a system' approach was
still favoured by some students, with these showing a poor ability to understand the idea of
resistance as a control of the current, together with the battery push. In students’ early
years, they learn that for an electric toy to work it needs a battery. For a car engine to start,

207
a battery is needed. Any other apparatus making use of a current requires a voltage supply.
All this helps to highlight the importance of ‘the battery’, perhaps more than it does for the
importance of other circuit components. This highlight may then be in itself an element
which promotes the use of unhelpful ideas like the BAT model.
Students certainly did not find p.d. easy to master, showing a regression of ideas
when dealing with related questions. Some indicated splitting of p.d. at junctions between
parallel branches, treating p.d. much the same as current. Apart from the view indicating a
difference between points, students showed use of ideas related to something which flows.
Some students seemed not to distinguish p.d. from potential and from current.
As can be seen, the analysis of the PDTs gave an interesting picture of ideas
consistent with mental models which were popular with students and which were not
always scientific. The interviews carried out with some of the student sample were meant
to go deeper into what students ‘see’ when they think of how the circuit works, and what
hinders progress. The next chapter describes the results of these interviews.

208
Chapter 5 Interview Study: Cohort 1
5.1 Introduction
While the analysis of the Physics Diagnostic Tests (PDTs) in Chapter 4 gave
indications of ideas students use as they learn about circuits, yet a clearer view of the
mental models students adopt was obtained when students’ ideas were backed up by more
in-depth information obtained from interviews. This chapter analyses the results of four
one-to-one interviews conducted with each of 9 students from Cohort 1 (see section 3.8.4.1
for details about the interviewees and their selection). All student names indicated are
pseudonyms. The interviews were conducted after students did the pre-test, and while the
teaching was in progress. While the interview schedules are included in Appendix 8, the
questions asked and the respective circuit diagrams used with the students are also
included in this chapter, for ease of communication.
The 1st interview probed students views of what causes current, as well as
models of current which students seem to hold. Ideas about how resistance affects the
circuit were also probed, together with views related to the battery function.
The 2nd
interview looked into how students deal with resistances in series and in
parallel and the effects on the current in the circuit resulting from the different ways of
connecting resistances.
The 3rd
interview probed microscopic views using Qn 4 answers students had
given in the PDTs, and looking at how these views may have changed after teaching.
Moreover, views about meanings given to voltmeter readings were also probed, with the
hope of finding out how students model potential and potential difference.
The fourth and last interview focused on whether students were able to separate
the idea of potential difference (p.d.) from that of current.
All interviews were based on ideas which students had shown to find problems
with in the pre-test. The timing of the interviews in relation to the teaching has already
been indicated in section 3.8.8.

209
5.2 The 1st interview – Current in a simple circuit
5.2.1 The aims of the 1st interview
The 1st interview was aimed at probing students’ ideas about how a simple
circuit works. It was important to find out how students visualize what goes on in the
electric circuit and how devices affect the current in that circuit. Details regarding what
constitutes current, the function of the battery and the resistance, were all important to
discover. Moreover, it was also important to get feedback about questions like the
following:
• is the battery the only source of electrons which flow in the circuit or is it only there to
provide the push for electrons to flow?
• what is the effect of having a resistance in the circuit? Does the resistance affect the
circuit locally or globally?
• how do students model current?
5.2.2 Conducting the 1st interview
The 1st interview in a series of interviews is always of significant importance. It
sets the path and tone for further interviews. During this interview, one of the primary
objectives was to give an idea to the students of how the interviews were designed and how
they would be conducted. In an era where students have become too used to having what
they are saying or doing as being categorized as either ‘correct’ or ‘incorrect’, it was felt
important to get the student to know and to speak to the interviewer in an informal way,
trying to clearly explain their ideas. An environment had to be created which allowed the
students to voice their thoughts, while reducing the dreaded pressure of making mistakes.
The ideas to be probed into dealt with issues which are usually covered and dealt
with at the beginning of a basic course in current electricity. Focusing on ‘simple’ key
ideas implied that there was a larger possibility that the situation dealt with would not be
new to the student. Moreover, asking about ‘simple’ key ideas was thought of as being a
better way towards reducing the complexity of the answers and their interpretation. While
James (L), for example, said: ‘I am going to find this a bit difficult!’, when asked for the
mental picture of what goes on in the circuit presented, yet what the student said was taken
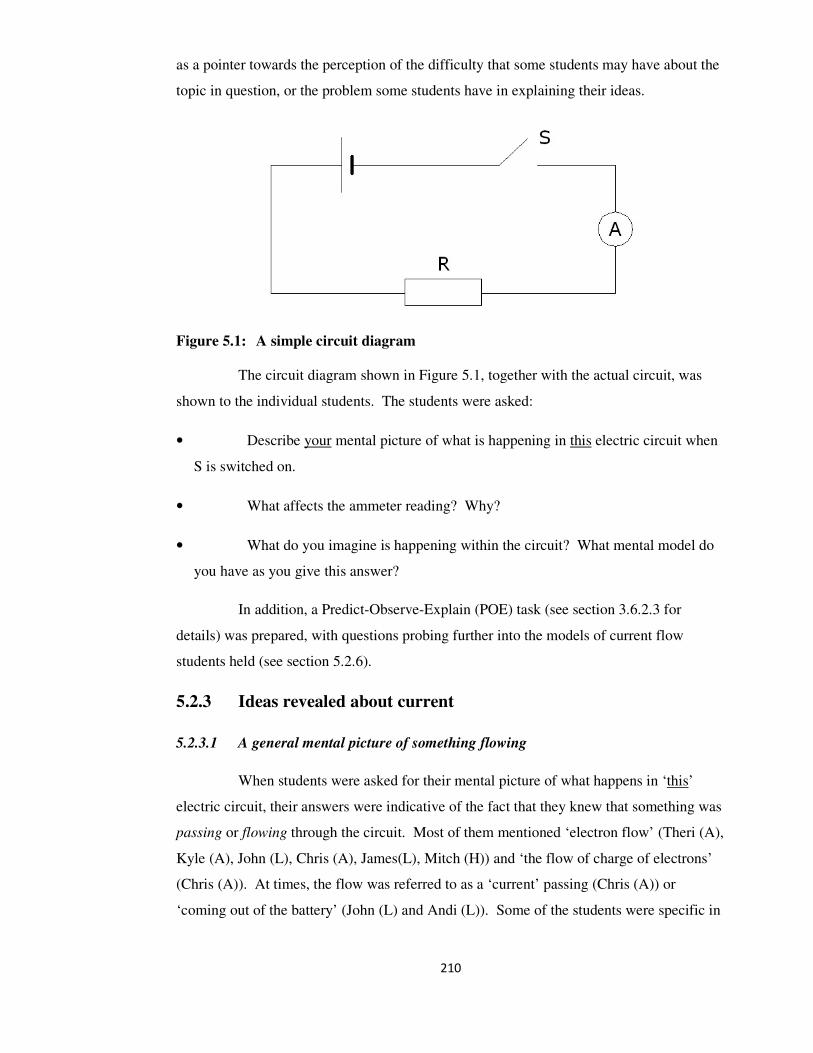
210
as a pointer towards the perception of the difficulty that some students may have about the
topic in question, or the problem some students have in explaining their ideas.
Figure 5.1: A simple circuit diagram
The circuit diagram shown in Figure 5.1, together with the actual circuit, was
shown to the individual students. The students were asked:
• Describe your mental picture of what is happening in this electric circuit when
S is switched on.
• What affects the ammeter reading? Why?
• What do you imagine is happening within the circuit? What mental model do
you have as you give this answer?
In addition, a Predict-Observe-Explain (POE) task (see section 3.6.2.3 for
details) was prepared, with questions probing further into the models of current flow
students held (see section 5.2.6).
5.2.3 Ideas revealed about current
5.2.3.1 A general mental picture of something flowing
When students were asked for their mental picture of what happens in ‘this’
electric circuit, their answers were indicative of the fact that they knew that something was
passing or flowing through the circuit. Most of them mentioned ‘electron flow’ (Theri (A),
Kyle (A), John (L), Chris (A), James(L), Mitch (H)) and ‘the flow of charge of electrons’
(Chris (A)). At times, the flow was referred to as a ‘current’ passing (Chris (A)) or
‘coming out of the battery’ (John (L) and Andi (L)). Some of the students were specific in

211
their use of words indicating a direction of flow, saying that ‘electrons pass from the
negative to the positive side of the battery’ (Kyle (A), Mitch (H)). Mari (L) said that ‘the
current passes and the voltage, together’. Robi (H) referred directly to the presence of ‘a
potential difference and because of it, a current passes’, thus indicating the cause of the
effect.
5.2.3.2 A cyclic sequential pattern to indicate flow
At the very start of the interview, as a general rule, the tendency was for the
students to describe a ‘cyclic sequential’ (see Grotzer and Sudbury, 2000, p. 7) process to
indicate flow. The description was given verbally, sometimes with gestures and pointing
towards the circuit diagram. The starting point was necessarily one end of the battery, with
a description of what was flowing as passing sequentially through each device in the circuit
and finally coming to the other end of the battery. ‘There is a beginning and ending of
sorts at the battery’ (Grotzer and Sudbury, 2000, p. 7).
The following extract is an example of the way the process was described by
Mitch (H).
M: Electrons are passing from the negative side, through the switch, then into
the ammeter and they pass through the resistance and go into the positive
side of the battery.
The above describes a sequence of events, with a specific start and a finish.
John (L), who showed evidence of this sequential process from the start, also
seemed heavily inclined towards local and attenuation reasoning, throughout the whole
interview.
J: If you use a bulb and you put it without a resistor, it shows a certain amount
of brightness. With the resistor, the bulb has a lower brightness, but near
the ammeter, a high brightness.
I: Where do you put the bulb?
J: Here after the resistor, the brightness will decrease.
I: And if you put it somewhere else?
J: Near the ammeter, for example, it would not have passed through the
resistor, so the brightness would be more.
On the other hand, the initial cyclic sequential description was not necessarily
backed up by an attenuation model by the other students. Chris (A) and Robi (H), for
example, described no specific attenuation model at all. This indicates that some students
are ready to describe the flow in the circuit in a sequential manner, even if they don’t

212
necessarily see current as being attenuated. Others use the same mode of description and
they actually believe that the effects are experienced locally at the circuit devices, holding
an attenuation view. The implication is, therefore, that the method of describing the flow
of current is not automatically equivalent to the mental model of current held. Moreover,
as expected, the analysis of the transcripts was indicating that not all the students held the
same model of current, at this initial stage.
5.2.3.3 The importance given to the connecting wires
The connecting wires are certainly a requisite in any circuit. But, how did
students regard the function of these wires in terms of current flow? Different mental
pictures were made evident by the students, as different functions were attributed to the
connecting wires.
Current results because of electrons in the connecting wires
Irrespective of their ability, some students saw the current as resulting because
of the electrons present in the connecting wires alone. Theri (A) was an example of this.
Electrons were seen in the connecting wires only and none were seen in the battery, with
the latter being there to push the electrons in the wires and thus create current flow.
I: So what picture do you see?
T: Electrons in the wire are already there. When S is switched on, the battery
gives a push, but it pushes according to what resistance there is in the
circuit.
[And later on….]
I: So what is the battery exactly producing then?
[The student takes time to think.]
T: Maybe, how much it can push? I don’t know!
Mari (L) initially only described the importance of the electrons in the wires for
current formation because of the belief that ‘the current is the free electrons already in the
wires’.
Only when prompted to explain further, did the student go on to speak about the
properties of the battery.
I: Does the battery have…?
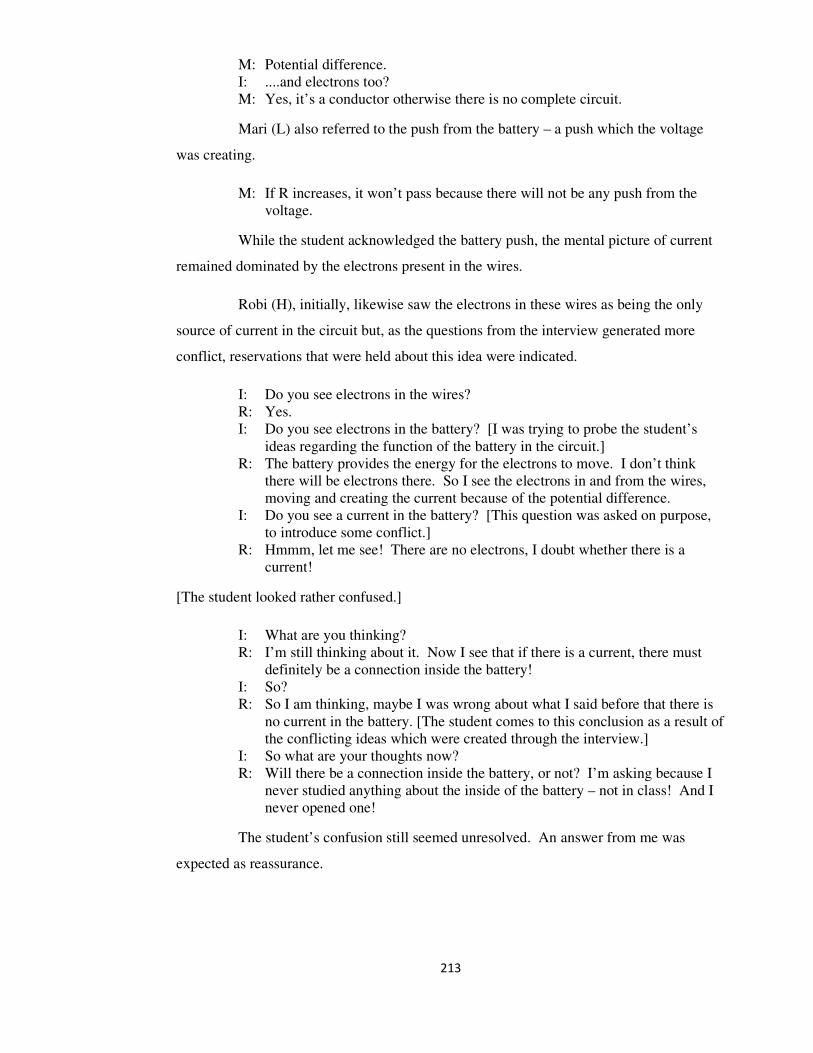
213
M: Potential difference.
I: ....and electrons too?
M: Yes, it’s a conductor otherwise there is no complete circuit.
Mari (L) also referred to the push from the battery – a push which the voltage
was creating.
M: If R increases, it won’t pass because there will not be any push from the
voltage.
While the student acknowledged the battery push, the mental picture of current
remained dominated by the electrons present in the wires.
Robi (H), initially, likewise saw the electrons in these wires as being the only
source of current in the circuit but, as the questions from the interview generated more
conflict, reservations that were held about this idea were indicated.
I: Do you see electrons in the wires?
R: Yes.
I: Do you see electrons in the battery? [I was trying to probe the student’s
ideas regarding the function of the battery in the circuit.]
R: The battery provides the energy for the electrons to move. I don’t think
there will be electrons there. So I see the electrons in and from the wires,
moving and creating the current because of the potential difference.
I: Do you see a current in the battery? [This question was asked on purpose,
to introduce some conflict.]
R: Hmmm, let me see! There are no electrons, I doubt whether there is a
current!
[The student looked rather confused.]
I: What are you thinking?
R: I’m still thinking about it. Now I see that if there is a current, there must
definitely be a connection inside the battery!
I: So?
R: So I am thinking, maybe I was wrong about what I said before that there is
no current in the battery. [The student comes to this conclusion as a result of
the conflicting ideas which were created through the interview.]
I: So what are your thoughts now?
R: Will there be a connection inside the battery, or not? I’m asking because I
never studied anything about the inside of the battery – not in class! And I
never opened one!
The student’s confusion still seemed unresolved. An answer from me was
expected as reassurance.
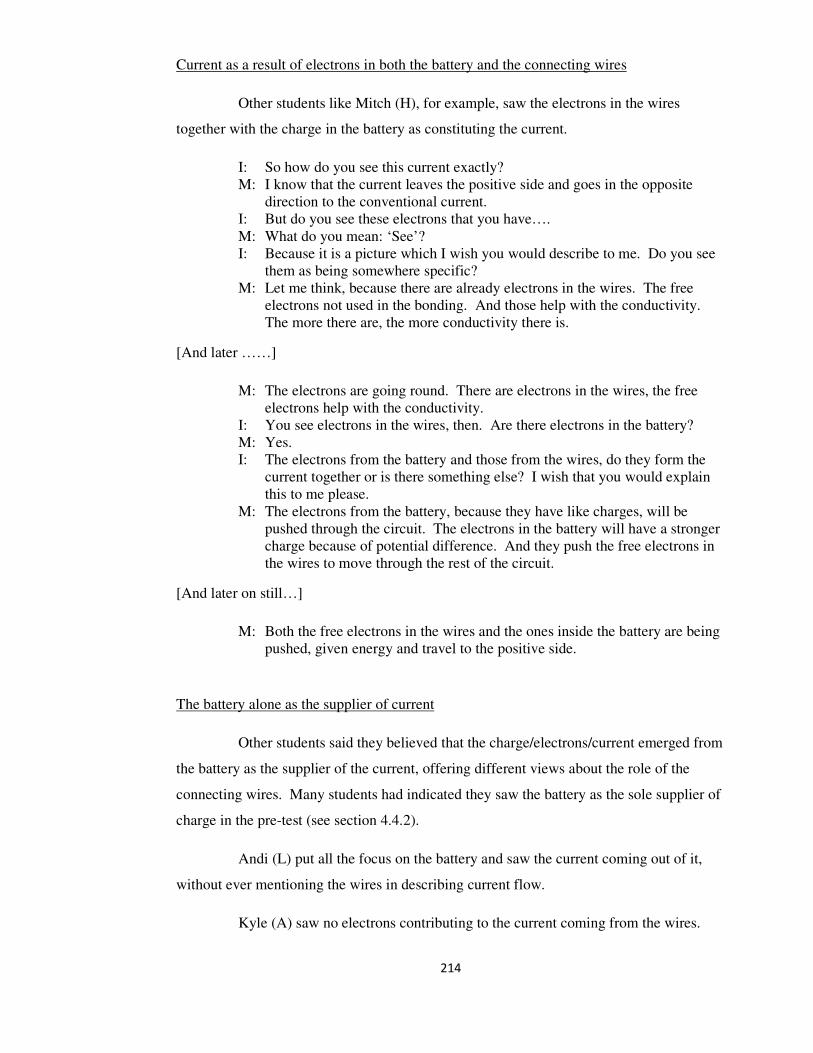
214
Current as a result of electrons in both the battery and the connecting wires
Other students like Mitch (H), for example, saw the electrons in the wires
together with the charge in the battery as constituting the current.
I: So how do you see this current exactly?
M: I know that the current leaves the positive side and goes in the opposite
direction to the conventional current.
I: But do you see these electrons that you have….
M: What do you mean: ‘See’?
I: Because it is a picture which I wish you would describe to me. Do you see
them as being somewhere specific?
M: Let me think, because there are already electrons in the wires. The free
electrons not used in the bonding. And those help with the conductivity.
The more there are, the more conductivity there is.
[And later ……]
M: The electrons are going round. There are electrons in the wires, the free
electrons help with the conductivity.
I: You see electrons in the wires, then. Are there electrons in the battery?
M: Yes.
I: The electrons from the battery and those from the wires, do they form the
current together or is there something else? I wish that you would explain
this to me please.
M: The electrons from the battery, because they have like charges, will be
pushed through the circuit. The electrons in the battery will have a stronger
charge because of potential difference. And they push the free electrons in
the wires to move through the rest of the circuit.
[And later on still…]
M: Both the free electrons in the wires and the ones inside the battery are being
pushed, given energy and travel to the positive side.
The battery alone as the supplier of current
Other students said they believed that the charge/electrons/current emerged from
the battery as the supplier of the current, offering different views about the role of the
connecting wires. Many students had indicated they saw the battery as the sole supplier of
charge in the pre-test (see section 4.4.2).
Andi (L) put all the focus on the battery and saw the current coming out of it,
without ever mentioning the wires in describing current flow.
Kyle (A) saw no electrons contributing to the current coming from the wires.

215
I: So when you switch the circuit on, mentally what do you see?
K: When you switch on, it is as if you have a bridge. You have closed the gap
and the flow begins.
The ammeter reads the current and then, the current passes through the
resistance and goes back into the battery.
I: How does this happen?
K: Once the switch is opened again, the contact is broken and the flow around
the circuit stops.
I: What more can you say about this flow?
K: The battery has all the charge in it…. Electrons etc., and as you close the
switch there is a connection to the rest of the circuit.
Chris (A) saw the wires as necessary paths for the passage of the charges
flowing out of the battery.
John (L) also saw the wires full of electrons coming from the battery alone.
I: So these electrons, did I understand you well? Do you see them as residing
in the battery?
J: They must come from somewhere.
I: Do you see them as coming from anywhere else, or is it that they come out
only from the battery?
J: From the battery only! I don’t think they are in the wires. I don’t know
whether it is true or not.
[And again, later…]
I: So in the wires, are you seeing electrons?
J: Only the ones coming from the battery….……
James (L), on the other hand, did consider the wires but it was their
resistance which was of underlying importance. The ‘free’ electrons within them were not
seen as important for current flow.
J: A flow of electrons occurs and the ammeter reads the amount of current.
I: When you say: ‘flow of electrons’, from where is this coming?
J: From the cell, from the battery.
I: Explain more about the process.
J: They come out from the negative terminal. The electrons from the negative
terminal, they do what I have just explained.
I: So where do you find these electrons?
J: They are also found in the wires, but I think [this is said with emphasis], the
electrons come out of the battery. The wires offer some resistance too, I am
sure.
I: So you said the wires have electrons too…..
J: No. I used the wrong word. The wires have ‘free’ electrons since they are
metal…, but these have nothing to do with the electrons of the battery, no?
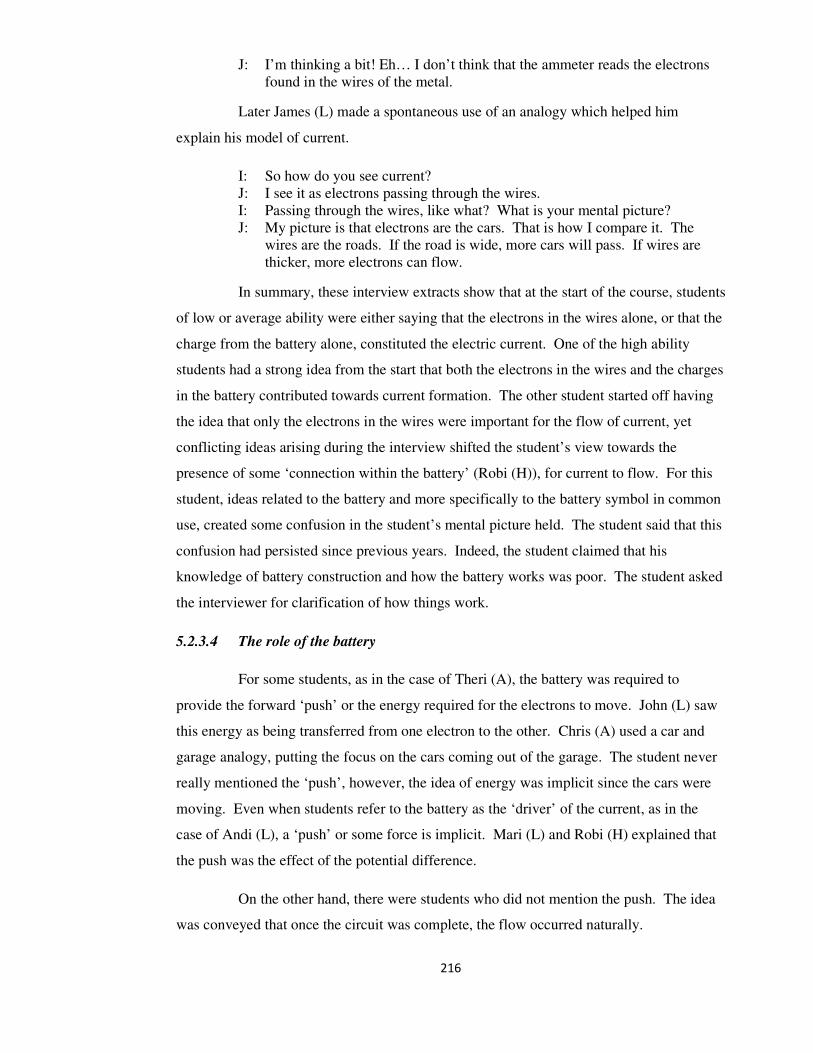
216
J: I’m thinking a bit! Eh… I don’t think that the ammeter reads the electrons
found in the wires of the metal.
Later James (L) made a spontaneous use of an analogy which helped him
explain his model of current.
I: So how do you see current?
J: I see it as electrons passing through the wires.
I: Passing through the wires, like what? What is your mental picture?
J: My picture is that electrons are the cars. That is how I compare it. The
wires are the roads. If the road is wide, more cars will pass. If wires are
thicker, more electrons can flow.
In summary, these interview extracts show that at the start of the course, students
of low or average ability were either saying that the electrons in the wires alone, or that the
charge from the battery alone, constituted the electric current. One of the high ability
students had a strong idea from the start that both the electrons in the wires and the charges
in the battery contributed towards current formation. The other student started off having
the idea that only the electrons in the wires were important for the flow of current, yet
conflicting ideas arising during the interview shifted the student’s view towards the
presence of some ‘connection within the battery’ (Robi (H)), for current to flow. For this
student, ideas related to the battery and more specifically to the battery symbol in common
use, created some confusion in the student’s mental picture held. The student said that this
confusion had persisted since previous years. Indeed, the student claimed that his
knowledge of battery construction and how the battery works was poor. The student asked
the interviewer for clarification of how things work.
5.2.3.4 The role of the battery
For some students, as in the case of Theri (A), the battery was required to
provide the forward ‘push’ or the energy required for the electrons to move. John (L) saw
this energy as being transferred from one electron to the other. Chris (A) used a car and
garage analogy, putting the focus on the cars coming out of the garage. The student never
really mentioned the ‘push’, however, the idea of energy was implicit since the cars were
moving. Even when students refer to the battery as the ‘driver’ of the current, as in the
case of Andi (L), a ‘push’ or some force is implicit. Mari (L) and Robi (H) explained that
the push was the effect of the potential difference.
On the other hand, there were students who did not mention the push. The idea
was conveyed that once the circuit was complete, the flow occurred naturally.

217
Kyle (A) saw the battery as some kind of charge storage which could supply the
current flow.
K: The charge is stored in the battery and when S is on, this means that the
circuit is complete and electrons can then flow, leave the battery, go round
the circuit and come back to the battery.
I: So there are no electrons in the wires?
K: No! The wires do not have charge in them because if you connect the
ammeter to the wire, it won’t give you a reading.
The above extract shows that Kyle (A) had the evident expectation that if the
wires had electrons in them, then connecting them to an ammeter, the latter should give a
reading. No ‘battery push’ idea was exposed. What was made implicit was the idea that
flow did not necessitate the presence of the battery push. It was rather the importance of
the complete circuit alone which was being emphasized as a requirement for current flow.
Some students could imagine and speak of the attraction between the charges.
Potential difference was also referred to but, it is important to note that the electric field
which exists between battery terminals was not mentioned, at this stage.
5.2.3.5 A summary of ideas about what makes current
In an effort to make the picture representing the student responses easier to
describe and to get an overall view, the results were compiled in Table 5.1.
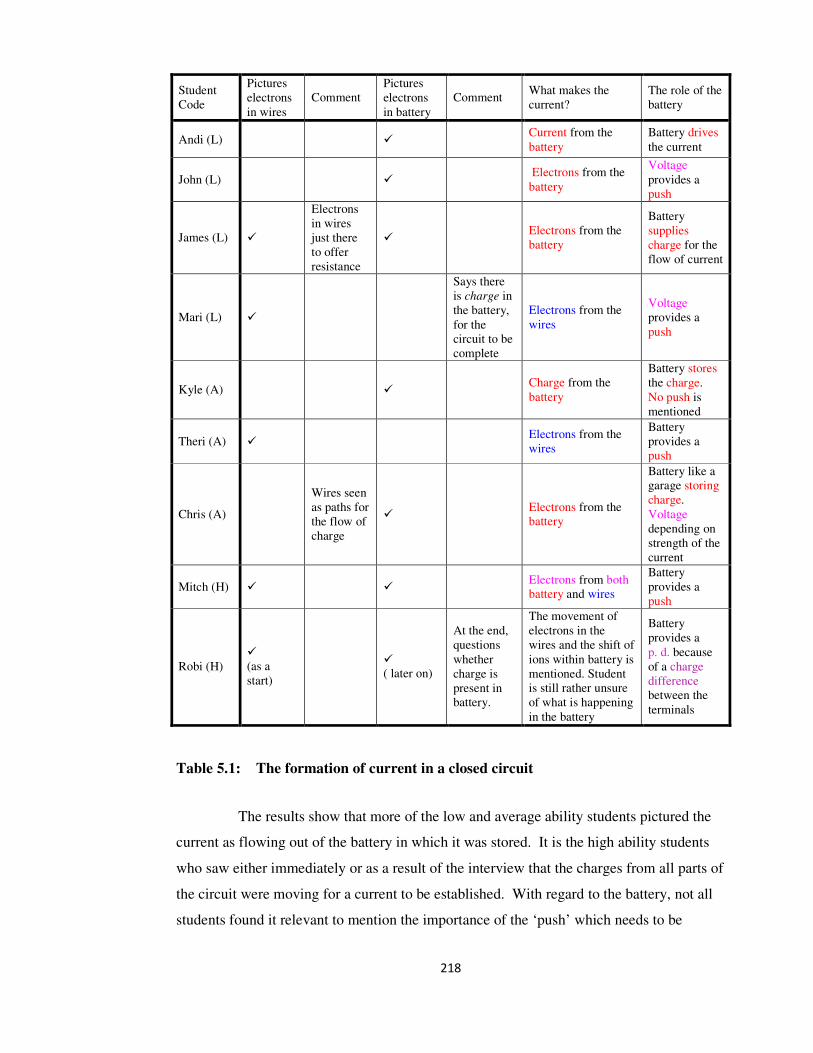
218
Student
Code
Pictures
electrons
in wires
Comment
Pictures
electrons
in battery
Comment What makes the
current?
The role of the
battery
Andi (L) Current from the
battery
Battery drives
the current
John (L) Electrons from the
battery
Voltage
provides a
push
James (L)
Electrons
in wires
just there
to offer
resistance
Electrons from the
battery
Battery
supplies
charge for the
flow of current
Mari (L)
Says there
is charge in
the battery,
for the
circuit to be
complete
Electrons from the
wires
Voltage
provides a
push
Kyle (A) Charge from the
battery
Battery stores
the charge.
No push is
mentioned
Theri (A)
Electrons from the
wires
Battery
provides a
push
Chris (A)
Wires seen
as paths for
the flow of
charge
Electrons from the
battery
Battery like a
garage storing
charge.
Voltage
depending on
strength of the
current
Mitch (H) Electrons from both
battery and wires
Battery
provides a
push
Robi (H) (as a
start)
( later on)
At the end,
questions
whether
charge is
present in
battery.
The movement of
electrons in the
wires and the shift of
ions within battery is
mentioned. Student
is still rather unsure
of what is happening
in the battery
Battery
provides a
p. d. because
of a charge
difference
between the
terminals
Table 5.1: The formation of current in a closed circuit
The results show that more of the low and average ability students pictured the
current as flowing out of the battery in which it was stored. It is the high ability students
who saw either immediately or as a result of the interview that the charges from all parts of
the circuit were moving for a current to be established. With regard to the battery, not all
students found it relevant to mention the importance of the ‘push’ which needs to be
219
supplied for current flow. At this stage, some just only looked at the importance of having
a complete circuit for current flow.
5.2.4 A picture of resistance
Students easily said that resistance controls the current flow.
Some described it as ‘friction’ stopping the electrons. Others mentioned an
opposition to the flow and referred to the presence of the resistance as reducing the
attraction of the electrons from the positive end of the battery. The word ‘blockage’ was
also used. Sometimes descriptions related to length and area of a resistance wire. Some
described the resistance as ‘taking the voltage’ or ‘taking energy from the current’. These
ideas seemed linked with the R-TAKE model of resistance referred to in Chapter 4.
Moreover, some students, independent of their overall ability in performance,
used analogies to describe the way resistance affects the current in the circuit. It may seem
that as Chris (A) put it, ‘One can better explain (resistance) this way’. Resistance was
compared to a gate or a crowd of people, or looked at as ‘narrowing the road’ or
’narrowing a gap’.
5.2.5 Factors affecting the current
All the students interviewed found it relatively easy to state that as the voltage is
increased, the current in the circuit increases. All students, except for one from the low
ability group, also found it easy to state that as the resistance increases, the current in the
circuit decreases.
5.2.6 The Predict-Observe-Explain task
5.2.6.1 The aim of this task
As already explained in section 5.2.2, this POE task was conducted with the aim
of probing into students’ mental models of current flow in a circuit.

220
5.2.6.2 The circuit used and questions asked
The circuit diagram shown in Figure 5.1 was shown to the students, who were
also supplied with the necessary apparatus to construct the circuit. The POE technique was
then used to probe students’ ideas. The students were asked the following questions:
• If you switch S on, what would you notice? Why?
• Will it make a difference to the ammeter reading if the position of the
ammeter is changed and it is placed on the other side of the resistance? Why?
5.3.6.3 The results of the POE task
Students’ responses have been summarized as shown in Table 5.2. Some
comments which were deemed relevant to students’ ideas exposed through the interview
have also been added, trying to make the picture students were indicating more complete.
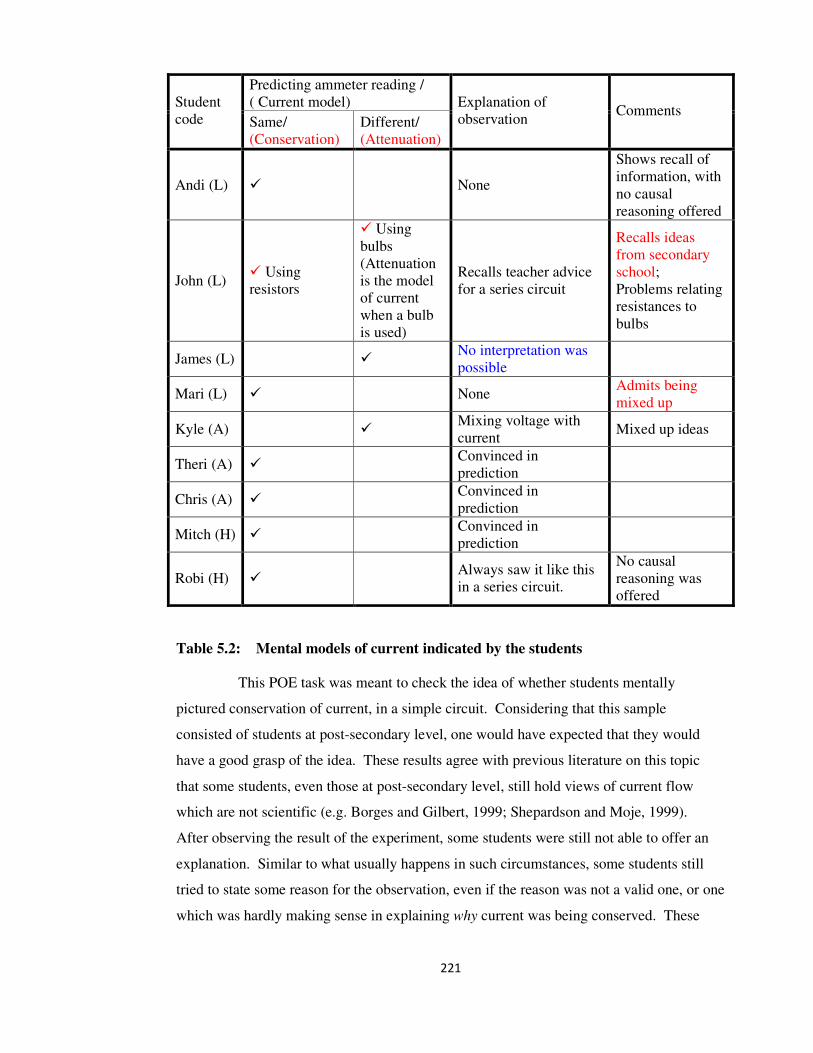
221
Predicting ammeter reading /
( Current model) Student
code Same/
(Conservation)
Different/
(Attenuation)
Explanation of
observation Comments
Andi (L) None
Shows recall of
information, with
no causal
reasoning offered
John (L) Using
resistors
Using
bulbs
(Attenuation
is the model
of current
when a bulb
is used)
Recalls teacher advice
for a series circuit
Recalls ideas
from secondary
school;
Problems relating
resistances to
bulbs
James (L) No interpretation was
possible
Mari (L) None Admits being
mixed up
Kyle (A) Mixing voltage with
current Mixed up ideas
Theri (A) Convinced in
prediction
Chris (A) Convinced in
prediction
Mitch (H) Convinced in
prediction
Robi (H) Always saw it like this
in a series circuit.
No causal
reasoning was
offered
Table 5.2: Mental models of current indicated by the students
This POE task was meant to check the idea of whether students mentally
pictured conservation of current, in a simple circuit. Considering that this sample
consisted of students at post-secondary level, one would have expected that they would
have a good grasp of the idea. These results agree with previous literature on this topic
that some students, even those at post-secondary level, still hold views of current flow
which are not scientific (e.g. Borges and Gilbert, 1999; Shepardson and Moje, 1999).
After observing the result of the experiment, some students were still not able to offer an
explanation. Similar to what usually happens in such circumstances, some students still
tried to state some reason for the observation, even if the reason was not a valid one, or one
which was hardly making sense in explaining why current was being conserved. These
222
students did not show that they could ‘see’ the circuit as a system. The following extract,
taken from one of the transcripts is an example of this.
James (L) had wrongly predicted that changing the position of the ammeter,
would give a different reading for current. Upon observing the experimental results:
J: It stays the same. So it doesn’t make a difference. The current remains the
same, no?
I: But you are saying this after we saw the experiment. Why did the result
show us this? How do you explain it?
J: Why did it happen!? Because the resistance is what varies with the voltage,
no? Since V = IR, so the more R varies, the more V varies. So if you were
to vary V in this circuit, changing the position of a voltmeter, connected
instead of the ammeter, then you would see a change in voltage.
Even if the interview was being conducted in an informal manner, it was felt that
the student was still being somewhat threatened by the questions being asked. The student
was trying to cover up not being able to offer a good explanation with valid reasons. The
equation V = IR was being referred to but what was being said did not relate to what was
being asked. Simons and Lewis (as cited in Cohen et al., 2001) “indicate that children will
tend to say anything rather than nothing at all, thereby limiting the possible reliability of
the data” (p. 279). It is felt, however, that the reliability of the data being gathered in this
case was not being limited in the way described by Cohen et al. (2001) since it was quite
evident to the researcher that what the student was saying was just being said to fill in the
gap of time. The situation would have been different if the data were given a wrong
interpretation, thus blurring the results, rather than just being understood for what it was - a
student who did not have ideas that helped in stating a valid explanation with reasons for
what was being observed.
Another observation was that while some students could recall instruction
related to current conservation from a few years earlier on, yet they could not mentally
visualize why things worked out that way. The words were pronounced and the idea
looked scientific, yet the mental model was either not there or just could not be explained.
The following extracts are evidence of this.
Andi (L):
A: It will be the same ammeter reading. All is in series. I cannot see a reason
for it, for how to explain it.
[And later…]

223
A: Maybe I say this because that is what I have been taught.
Likewise, John (L) could only say the following:
J: In Form 3 (secondary class), the teacher had said that connecting the
ammeter in whatever position it would give the same reading, as long as it
was a series circuit.
The above seems more of a recall situation, rather than one which shows the
understanding of a system at work.
The examples quoted above are in stark contrast with the following extract
which shows that the student did not only have the ability to state that current was
conserved but also to show conviction of the picture being imagined. This fact supports
the idea that deeper understanding can take students further in developing their
imagination.
In the following quote, Theri (A) was answering to the question of whether there
would be a change in the ammeter reading when its position with respect to the resistance
was changed.
T: No, I don’t think so. It still reads 3.1mA because I don’t imagine a big flow
of electrons coming to the resistance, then once at the resistance it controls
the current! I mean the current is the same all through the circuit.’
In the case of Chris (A), what was being imagined could also be well explained
using analogical reasoning.
C: There is one road. Cars are passing. R is a tunnel or a narrower road but
the same amount of cars pass through.
It is clear that in these examples, the students could visualize the model they
were using, of the same current through the circuit immediately as the switch was closed,
and not just recalling information.
Also worth noting is the case where one of the students, namely John (L), was
confused in deciding between the ideas of conservation and attenuation because of the
difficulty that was encountered in dealing with resistances and bulbs. It seemed that this
was one reason, at least, for the lack of possible scientific model appreciation. Heller and
Finley (as cited in Grotzer and Sudbury, 2000), found that sequential models in which
bulbs ‘use up’ current were the most common type of model amongst the elementary and
middle school teachers whom they studied. This might indicate that the difficulty John (L)

224
found related to bulbs could have possibly been ‘inherited’ from some earlier classroom
situation.
5.2.6.4 Overall comments based on the POE task
Students’ answers in this part of the interview were similar to previous answers
described in section 5.2.3.2. One important aspect of this POE task, which was also
evident through other POE tasks thereafter, was that it could be considered both by the
interviewer and by the interviewee as a teaching/learning session. The importance of
“regarding the interview as an interchange of views between two (or more) people, on a
topic of mutual interest, sees the centrality of human interaction for knowledge
production” (Cohen et al., 2001, p.265). The interviewer made use of this important aspect
of the POE, especially to promote the motivation for thinking aloud, on the part of the
interviewee. The interviewee seemed to be more at ease, once the experience of a tutorial
session started to unfold, as opposed to a structured interview with alternating questions
and answers.
After having experienced the POE technique, students realized how important it
is to reflect on the reasons for why things work the way they do. The reason behind what
was happening in the circuit, and why it was happening, was already there for some
students but not for others. The latter had the opportunity to realize that there was a gap in
their understanding and could thus try to think about their original views further and to
resolve any conflicts that might have arisen.
The idea probed by this POE is considered by many a scientist, including
science teachers, as a relatively simple one. Having observed the results, the possibility of
understanding the current concept increased, with students using scientific ideas when
required. Moreover, the unscientific views shown by some students in their predictions,
point towards the importance of having students deal with simple experiments of this type
earlier in their course of studies, allowing time for ideas to sink in and for mental pictures
to develop, in order to reinforce deeper understanding.
5.2.7 Summary of students’ ideas exposed during the 1st interview
When students were asked about what contributes to the formation of current,
the following ideas were indicated, namely:
• current because of movement of electrons in the wires;
225
• current because of movement of charges initially present in the battery;
• current because of the presence of charges in both the wires and in the battery.
When students were talking about what makes the charges flow, they came up
with the following ideas, namely:
• movement requiring a push, once the circuit is complete;
• movement without a push, as long as there is a complete path.
Resistance was described in different ways. Some students described it as an
object, using analogical reasoning:
• a gate or a crowd to control the rate of passing of current;
• a narrow road;
• a blockage.
When referring to the actual function of the resistance, one could not help but
describe the notion of a process - a ‘doing thing’:
• Suppressing / opposing the current flow
• Reducing the flow of electrons
• Reduction in the attraction of the electrons to the positive battery terminal – (while the
presence of an electric field might be thought to be indicated here, yet students did not
mention the field directly and therefore may not have been visualizing it.)
• Friction – a force opposing the flow

226
With regard to the models of current, it can be said that the main current models
detected were:
• Conservation, and
• Attenuation.
Attenuation views were held when students had ideas that mentally pictured
charges moving in sequence from one component to the next, and when students looked
locally at a component effect rather than seeing the system.
Finally, focusing on the microscopic views students described, it can be seen
that there were differences shown in the way students thought about what makes current.
Such thoughts from students seem to be only fairly emphasized in earlier work related to
simple circuits. On the other hand, without really wanting to, anyone dealing with
electricity and simple circuits inevitably formulates ideas of what is going on in the circuit,
as current flows. Such ideas form the basis of understanding of the topic, so they are
important to follow and explore. For this purpose, the ideas students exposed through the
interview, related to what is happening microscopically, have been put together and
summarised in the schematic diagram shown in Figure 5.2, in an attempt to indicate
possible thinking pathways students followed while describing ideas about current
formation.

227
Figure 5.2: Students’ ideas of how current forms in a closed circuit
5.3 The 2nd
interview – Resistances in series and in parallel
5.3.1 The aims of the 2nd
interview
The main aim of this interview was to see what mental picture students could
offer of how resistance changes, if at all in their opinion, when two resistors were
connected first in series and then in parallel. Is it the number of resistors connected in the
circuit which counts, or is it the way in which resistors are connected which must also be
considered? Moreover, even if students’ prediction was not correct, the idea was to
capture students’ thoughts as to why the changes observed were happening.
5.3.2 Conducting the 2nd
interview
In order to put the students at ease, short similar questions based on models of
current, as were asked in the previous interview were prepared to be asked again, at the
start of the 2nd
interview.
228
Earlier through the year, the students had attended lectures dealing with how
resistors can be connected in series and in parallel. Part of the lecture had dealt with how
to compute the total resistance in series and parallel circuits. The students had been
instructed in the use of the relevant equations, namely that:
• for resistances in series: R1 + R2 = R total; and
• for resistors in parallel: 1/R1 +
1/R2 =
1/R total, from which the total resistance may then be
calculated.
These equations had been derived by dealing with the respective circuits and
examining current flow in the circuits, and within circuit branches where applicable, as
well as discussing potential differences across resistors. Thus, at the time of the interview,
students were expected to have been adequately instructed as to how to deal with
resistances in series and in parallel and then to make conclusions regarding the current
flowing through the respective circuits.
The interview was once again conducted using the POE technique. The students
were shown the circuit diagrams shown in Figures 5.3 and 5.4 respectively, and allowed to
set up the actual circuits and observe results.
The interview started with a focus on the series circuit. The students were asked
whether changing the position of the ammeter connection shown in Figure 5.3 would have
an effect on the ammeter reading. This was done so that this interview would be linked to
what had been discussed during the last interview, a week earlier.

229
Figure 5.3: Circuit diagram showing resistances connected in series
Figure 5.4: Circuit diagram showing resistances connected in parallel
The students were asked the following questions:
• In the circuit shown in Figure 5.3, using two equal resistors, what happens when S is
switched on? Why? Would the ammeter reading change if we change its position?
• In the same circuit, if we increase one of the resistors, what happens and why?
• Using the same two equal resistors as in the first part, but now we connect them as
shown in Figure 5.4, what happens to the ammeter reading? Does it increase, stay the
same or decrease? Why?
After observing the results:

230
• Can you describe your mental picture for why this is happening?
5.3.3 The results of the 2nd
interview
5.3.3.1 Reasoning difficulties with resistances connected in parallel
Students made it evident that after the last interview, a week earlier, they had no
problems, now, in understanding current conservation. Moreover, it also seemed easy for
students to predict that once one of the resistances connected in series was increased, then,
the ammeter reading would be less.
It seems, however, that a problem was mainly encountered when the two
resistances were connected in parallel. Students’ predictions and the reasons for them,
together with alternative reasons provided after observation of the experiment, are shown
in Table 5.3. Some comments have also been included.
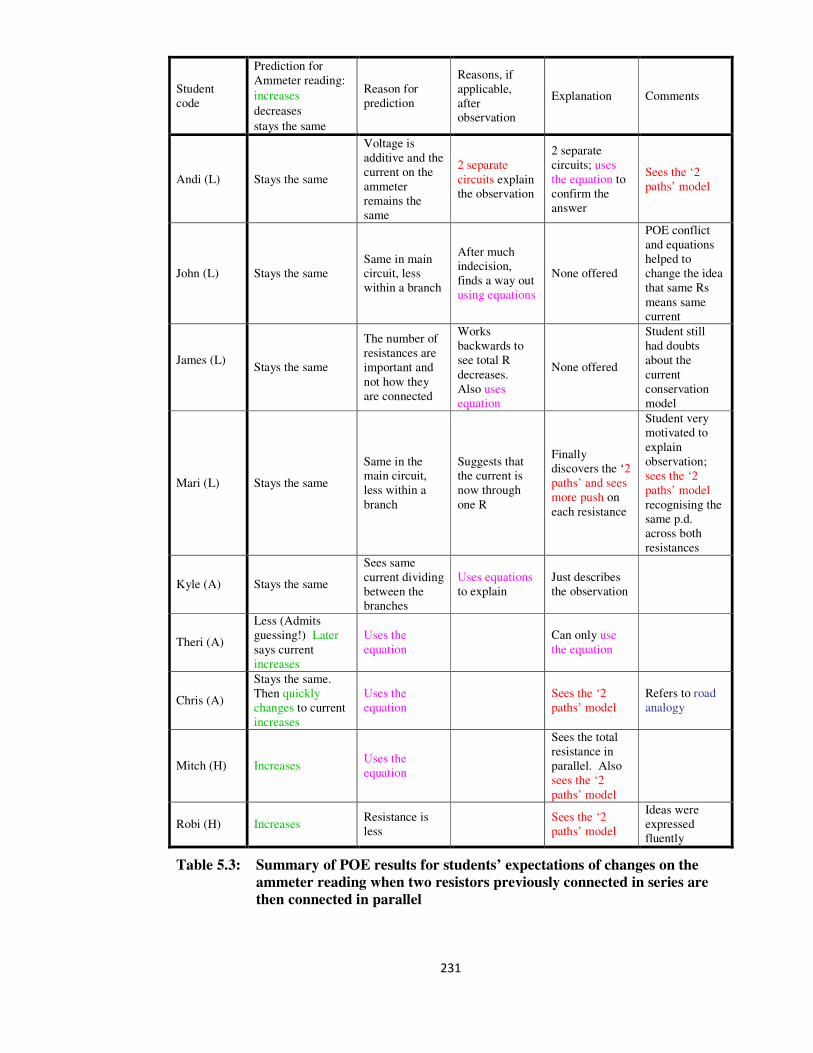
231
Student
code
Prediction for
Ammeter reading:
increases
decreases
stays the same
Reason for
prediction
Reasons, if
applicable,
after
observation
Explanation Comments
Andi (L) Stays the same
Voltage is
additive and the
current on the
ammeter
remains the
same
2 separate
circuits explain
the observation
2 separate
circuits; uses
the equation to
confirm the
answer
Sees the ‘2
paths’ model
John (L) Stays the same
Same in main
circuit, less
within a branch
After much
indecision,
finds a way out
using equations
None offered
POE conflict
and equations
helped to
change the idea
that same Rs
means same
current
James (L)
Stays the same
The number of
resistances are
important and
not how they
are connected
Works
backwards to
see total R
decreases.
Also uses
equation
None offered
Student still
had doubts
about the
current
conservation
model
Mari (L) Stays the same
Same in the
main circuit,
less within a
branch
Suggests that
the current is
now through
one R
Finally
discovers the ‘2
paths’ and sees
more push on
each resistance
Student very
motivated to
explain
observation;
sees the ‘2
paths’ model
recognising the
same p.d.
across both
resistances
Kyle (A) Stays the same
Sees same
current dividing
between the
branches
Uses equations
to explain
Just describes
the observation
Theri (A)
Less (Admits
guessing!) Later
says current
increases
Uses the
equation
Can only use
the equation
Chris (A)
Stays the same.
Then quickly
changes to current
increases
Uses the
equation
Sees the ‘2
paths’ model
Refers to road
analogy
Mitch (H) Increases Uses the
equation
Sees the total
resistance in
parallel. Also
sees the ‘2
paths’ model
Robi (H) Increases Resistance is
less
Sees the ‘2
paths’ model
Ideas were
expressed
fluently
Table 5.3: Summary of POE results for students’ expectations of changes on the
ammeter reading when two resistors previously connected in series are
then connected in parallel

232
5.3.3.2 Predictions with reasons
When the students were asked what happens to the ammeter reading once the
same resistances which were previously connected in series were now connected in
parallel, there was a distinction between the answers from the students in the 3 categories.
Students of low ability invariably said that the reading would remain the same. For these
students it was the number of resistors in the circuit which was the issue and not the way in
which the resistances were connected.
In prediction, James (L) said:
J: The ammeter reads the total amps in the circuit. As long as the resistances
are not changed the ammeter reading stays the same.
We used the apparatus provided and first we connected the equal resistors in
series. We noted 0.03A on the ammeter. We then connected the same resistors in parallel.
Before we switched the parallel circuit on, the student laughed and said:
J: I so want to see the result!
Upon observing the result, James (L) had the following comments to add:
J: Now the reading is larger. It is 0.14A.
I: So what does it mean?
J: More current. Let me think for a while! So the resistance is less? That is
how it turns out.
The student remained unconvinced for a while.
J: You did not vary the resistor. All we changed was the position of the
resistors! (From being connected in series to being connected in parallel.)
However he later admitted that, had he not seen the ammeter reading when the
changes were made to the circuit, he would not have been convinced that the total
resistance is less when the resistors are connected in parallel.
The same idea was also expressed, as a start, by two students from the average
group. One of them, Kyle (A), just like the students in the lower ability group, could only
focus on the fact that it was the same resistances in the circuit, whereas the other one, Chris
(A), immediately realized the mistake, and through numerical calculations saw that the
total resistance offered by the two resistances connected in parallel would be less, thus the
current would increase. The other average ability student, Theri, playfully guessed an

233
incorrect answer but once urged to think about the situation more seriously, referred to the
equations and gave a correct prediction.
The two high ability students, on the other hand, both gave the correct prediction
immediately, using mental numerical calculations to check their answer.
The students who had given the right prediction were pleased to observe what
they had expected, once the experiment was carried out. The other students were
astonished at the result of the experiment. One student, Mari (L), tried to hold on to the
erroneous prediction at all costs, providing supporting evidence showing that students hold
on strongly to their intuitive ideas (White and Gunstone, 1992). The following extract
shows how Mari (L) reacted:
M: So the current is only passing through one resistor and not through the 2
resistors? I don’t think that it is a good reason. I never heard of this though,
but it is the only reason I can think of!
Mari (L) was encouraged to try the experiment using one resistance only in the
circuit and when the ammeter reading was observed and found to be even different from
the two previously observed readings, the conflicting ideas and motivation for learning
were so strong that the student continued to search for an answer, until the following
conclusion was reached:
M: But here there are 4V from the source, on each R. That is what we say.
Therefore, there is more push on each R. Before (meaning in the series
connection) we had a 4 Volt push divided between the 2 resistors in series -
2 Volts on each R. Here we have more push and so this gives a larger
current. It is as if (in parallel) you have 4 people, pushing the current
through each R. So even if it is the same resistances, then there is a larger
push, in parallel.
This student thus realized that the larger the p.d. across each resistance was
providing a larger current through the resistance and, consequently, also through the whole
circuit. He could model p.d. with the help of analogical reasoning.
The other students who had predicted incorrectly could only give a justification
for the observations by numerically working out the value of the total resistance in the
parallel circuit using the appropriate equation.
234
5.3.3.3 A qualitative reason for the observation
The strong point in favour of making this exercise worth undertaking was
indicated by that part of the interview where the students were asked for a qualitative
reason to explain why the total resistance in parallel would be less, thus allowing for an
increase in the ammeter reading. While 2 students categorized as low ability could not
offer any ideas at all and one student from the average group could just relate with
numbers in providing an explanation, yet the other students, including some from the lower
and average categories, managed to visualize an increase in current because of two paths
which were now made available for the flow of current. The following is how Chris (A)
described his reasoning:
C: When in parallel, the resistance has been divided into two parts. The current
can pass from two paths. More current passes now, compared to when the
resistors were connected one after the other. If I compare this to roads, then
I say that there are two roads of different width. You may pass through any
one of them. They are not narrow roads taken one after the other. You have
a choice from where to pass.
There were other similar answers. Two separate circuits were referred to by the
students and this was a mental picture which students felt was convincing enough to
explain the observation of the increase of current when the resistors were connected in
parallel. It was an explanation which the students expressed with ease and confidence,
once the experimental results were observed and a qualitative reason was asked for. The
students were able to offer ‘the 2 paths model’ in a rather spontaneous fashion once they
were led away from the use of numbers, by the interviewer. Millar and Beh (1993) also
reported “an overwhelming preference” for their sample of 157 15-year old students, “to
use the model/method 1 approach” (see Figure 5.5), in solving the problems asked related
to resistances connected in parallel, even when “most students in” their sample were “not
able to recall basic facts about voltages in parallel circuits”(p. 360). The model/method 1
approach “results from perceiving the circuit primarily in voltage terms, the most
important feature being that both resistors have the same voltage across them” (p. 354).
The relative ease with which students tend to look at resistances connected in parallel in
terms of mono-circuits, even when their understanding of potential difference may not yet
be so clear, points towards ‘the 2 paths model’ as an important model which can be
discussed with students during the instruction of parallel circuits, with the aim of achieving
deeper understanding of electric circuits in terms of models.

235
Figure 5.5: Two models of parallel circuits leading to two methods of tackling
parallel circuit problems (Millar and Beh, 1993, p. 354)
One other point which is worth mentioning is that unless most students had been
urged to discuss and to use the apparatus further to deal with any unscientific models they
held, they would not have reached the final correct conclusions. This points towards the
importance of having students’ motivation increased as they are urged to think further
through making use of the apparatus themselves, to solve their difficulties and test their
ideas. Just using equations and instructing students in solving numerical problems is not
enough for the understanding of key ideas in the subject. Cohen et al. (1983), McDermott
and Shaffer (1992), Millar and Beh (1993) and van Aalst (1985) have referred to students
resorting to numbers while lacking the ability to explain their answer qualitatively.
“Instruction that helps students use scientific evidence to sort out their ideas, resolve
contradictions, identify overlaps and gaps in understanding and establish promising
connections leads to more enduring and generative views of scientific phenomena”
(Casperson and Linn, 2006, p. 317). Students can thus learn the skills to “develop and use
criteria to distinguish their predictions from observations, and promote ideas that meet
their criteria” (Casperson and Linn, 2006, p. 317). Chiu, Chou, and Liu (2002) specifically
claim that conceptual change can be made easier if concepts are explicitly observed from
an experiment. Thus, students need to be allowed to use apparatus or to assist to
demonstrations which urge them to clearly ‘see’ the difference, if any, between the mental
models used in prediction and those formed through observation. Memory work can thus
be reduced and understanding enhanced.

236
5.3.4 Summary of results dealing with resistance of series and parallel
resistors
Students found it easy to see that increasing a resistance connected in a series
circuit would reduce the current. Some students could not predict an increase of current
when the two resistors were connected in parallel, however, through the POE session they
were motivated to find a causal reason for their observation. While some could only resort
to numbers to find a solution, some could ‘see’ ‘the 2 paths model’ and reason in terms of
two mono-circuits, explaining the result.
5.4 The 3rd
interview - Part 1: Probing microscopic views
5.4.1 The aim of this exercise
The aim of this interview was to find out whether students’ pre-instruction
microscopic views of what constitutes current in the circuit had changed since they
answered Qn 4 in the Physics Diagnostic Pre-test (see Figure 4.2), and whether these views
had now evolved, progressing towards the scientific view. Students’ answers to Qn 4 were
seen as being of particular importance since much of the understanding about electric
circuits depends on the ideas about what happens at a microscopic level. This is what
gives the topic its abstract nature and it is also the reason for why the topic is perceived
difficult.
5.4.2 Conducting the first part of the interview
Students were shown the answers they had given to Qn 4 during the pre-test,
together with the question asked (shown in Figure 4.2), and they were asked to comment
on the answers they had given. Each student was given time to talk about why those
answers had been chosen in the test. At the same time, without having made it too
obvious, the student was being allowed to talk of the mental models of circuit which
seemed to have guided the pre-test answers and also to describe how these models might
now have changed because of the student’s learning experience.
237
5.4.3 The results for Qn 4 in the pre-test and the interview
5.4.3.1 Comparing students’ answers
Table 5.6 shows the results of how each student answered to the parts of Qn 4 in
the pre-test, and later during the interview.
The answers have been grouped to indicate pairs of questions which were
related. Parts (a) and (d) refer to a model held of free charges residing only in the battery.
Parts (b) and (e) probe whether students know that it is the energy which is required to
make the circuit components work and not the absorption of the electrons. Parts (c) and (f)
refer to charges existing everywhere in the circuit, with the battery being responsible for
their movement.
The code used in the tables is as follows:
• T = True ;
• F = False.
The colour code shows how complimentary parts of the question were answered:
• both correct: GREEN;
• only one correct: ORANGE;
• both incorrect: RED.
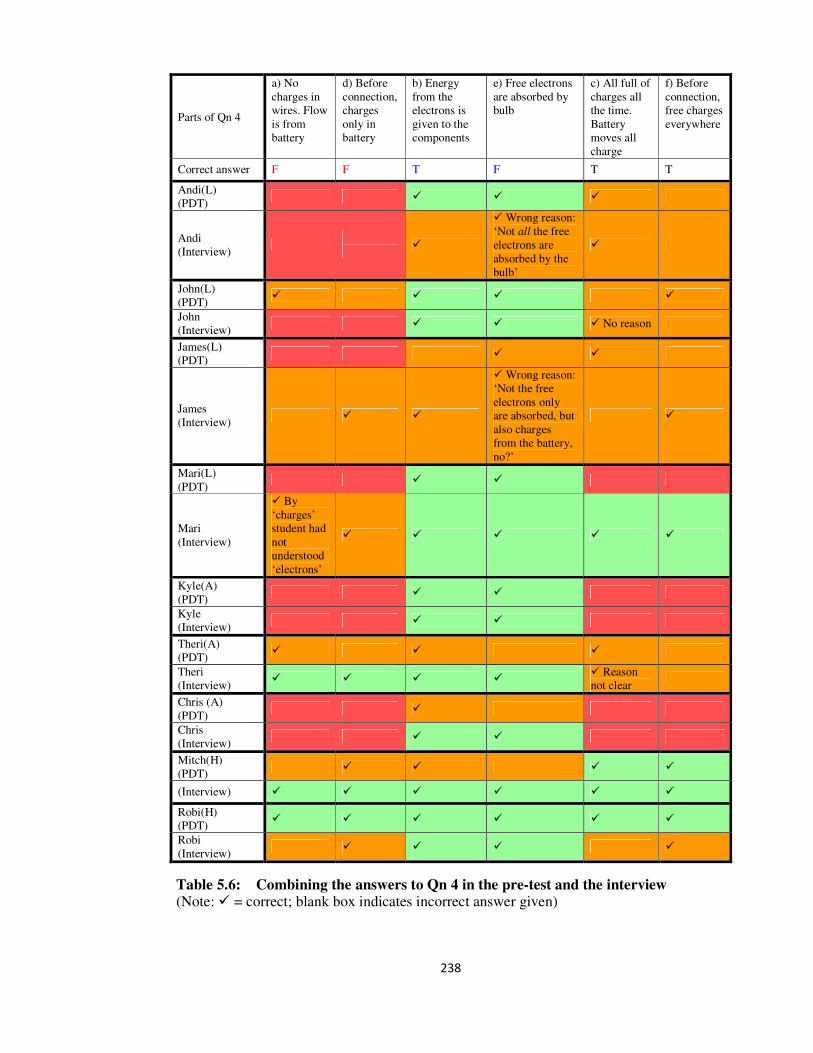
238
Parts of Qn 4
a) No
charges in
wires. Flow
is from
battery
d) Before
connection,
charges
only in
battery
b) Energy
from the
electrons is
given to the
components
e) Free electrons
are absorbed by
bulb
c) All full of
charges all
the time.
Battery
moves all
charge
f) Before
connection,
free charges
everywhere
Correct answer F F T F T T
Andi(L)
(PDT)
Andi
(Interview)
Wrong reason:
‘Not all the free
electrons are
absorbed by the
bulb’
John(L)
(PDT)
John
(Interview) No reason
James(L)
(PDT)
James
(Interview)
Wrong reason:
‘Not the free
electrons only
are absorbed, but
also charges
from the battery,
no?’
Mari(L)
(PDT)
Mari
(Interview)
By
‘charges’
student had
not
understood
‘electrons’
Kyle(A)
(PDT)
Kyle
(Interview)
Theri(A)
(PDT)
Theri
(Interview)
Reason
not clear
Chris (A)
(PDT)
Chris
(Interview)
Mitch(H)
(PDT)
(Interview)
Robi(H)
(PDT)
Robi
(Interview)
Table 5.6: Combining the answers to Qn 4 in the pre-test and the interview (Note: = correct; blank box indicates incorrect answer given)

239
The results in Table 5.6 indicate that there was some improvement shown in
students’ ideas, since the pre-test (see section 4.4.2). There were now, more correct
complementary pairs of answers, especially ones related to energy. Some students now
seemed more conscious of the fact that electrons or charges are not absorbed by the
components. It was rather worrying, however, to see that students like Kyle (A), for
example, had not changed their alternative ideas at all. It may seem that such students
were not getting all that they were meant to get from their learning experience.
Some students in the low and average ability groups, namely John (L), Andi (L),
Kyle (A) and Chris (A), held very strongly to the idea of having charges flowing out of the
battery to pass through the wires. This is clear in the results of Table 5.6. A look at Table
5.7, comparing students’ views during the 1st and 3
rd interviews, also shows that it was
these same students who, upon reviewing Qn 4 still held on to this view. To give just one
example, the following are John’s (L) answers in the interviews:
1st interview:
I: So in the wires, are you seeing electrons?
J: Only the ones coming from the battery….……
3rd
interview, reviewing Qn 4:
J: No electrons come from the wire. It is the battery that pushes them.
I: So how do you see the battery?
J: It stores charges in it and as soon as the circuit is connected, it pushes them
out.
There was indeed no change in the views held by the student.
The results in this study provide striking evidence that the view of having all the
charge stored in the battery, being released when the circuit is on, is very hard to change.
On the other hand, for Mari (L) and Theri (A) who had previously indicated they thought
about electrons residing in the wires only, it seems to have been easier to now describe
charges as residing everywhere in the circuit.

240
Student
Code
1st
interview:
Pictures
electrons
in wires
1st
interview:
Pictures
electrons
in battery
Upon Reviewing
Question 4 in the 3rd
interview
Evidence of evolution
of ideas?
Andi (L)
Charges reside only
within the battery
No Change
John (L)
Charges reside only
within the battery No Change
James (L)
(Electrons
present to
offer
resistance
only and
not to
make
current)
Still mixed up between
the ‘free electrons’ and
the ‘charges’- not clear
on whether they refer to
the same thing
Mari (L)
From electrons in the
wires only to electrons
everywhere
Change to scientific
ideas
Kyle (A)
Charges reside only
within the battery No Change
Theri (A)
There are charges within
the wires and the battery
Change to scientific
ideas
Chris (A) Charges reside only
within the battery No Change
Mitch (H) Charges are present
everywhere
No Change
but was previously
correct
Robi (H) (as a start)
( later on)
Finally agrees with
charges being present
everywhere but the idea
of how the battery
functions is still not
clear to the student
No Change.
Agrees with charges
being present
everywhere.
Was previously correct
Table 5.7: Comparing ideas from the 1st interview to those held upon reviewing
Qn 4
5.4.3.2 Problems related to meaning
Analysis of students’ talk during the interview made it possible to realize, not
surprisingly, that students sometimes give the wrong meanings to some words and/or
phrases and thus they build unhelpful mental representations of what happens in the
electric circuit.

241
Chris (A), for example, gave the wrong meaning to the word ‘neutral’.
C: Since the wires are neutral, then there are no free charges available within
them.
James (L) had shown he was rather confused when it came to dealing with the
idea of free electrons and how their presence affects the circuit. He seemed not to be able
to link the ‘free electrons in the wires’ and ‘the charges coming from the battery’. The
mental representation he seems to use, allowed a distinct separation between the two. The
following is an extract from the interview transcript:
J: ‘All the time’ means even when not connected?
I: Yes.
J: There are charges in the wires. That is true – the free electrons. But I don’t
think that the question is referring to these…….because otherwise the bulb
would always be on, even when the circuit is open. I don’t agree with what
this question says, at all.
Then, after reviewing part (e) of Qn 4:
J: It is not the free electrons only that are absorbed but also the charges from
the battery, no?
The problem students have with what some terms mean emphasize the
importance of the use of correct wording explained in detail. Unless students understand
what a word or a phrase means, students’ reasoning will not be valid. The result is then
much as Niedderer and Goldberg (1996) described it, namely that student understanding
can go in different directions from what was planned by the teacher. Garnett et al. (as cited
in Chiu et al., 2002) claim that this is in line with what the “alternative conceptions
research has established, that students develop different conceptions from those they are
expected to learn, and that these conceptions can influence subsequent learning” (p. 706).
5.4.3.3 Dealing with complex situations
Analysis of the 3rd
interview with Mari (L) helped to observe how this student
reverted back to his earlier unscientific models of current (electrons forming the current
coming only from the wires) whilst reviewing Qn 4a, before he later switched over to the
scientific picture of there being free charges everywhere. This provided evidence of how
students may start from their intuitive ideas, as they reason things out which appear
complex and then, somewhere along the line, they come to terms with the scientific views
to which they have already been exposed. Niedderer and Goldberg (1994) refer to a
student’s “conceptual ecology” (p. 26) to describe a picture of how the thinking processes

242
used by a student evolve in this way, during a learning process in electric circuits. They
claim that, “always in new and complex situations the student starts with the prior
conception (which they refer to as) ‘everyday life current’…..” (p. 26) but given time or
small hints, the student uses good scientific thinking to move to intermediate conceptions,
as learning is in progress. While Niedderer and Goldberg (1996) continue to stress that “in
a new context students typically use old cognitive tools – more accessible, confident,
reliable, powerful, with more probability to be used” (p. 14), yet it does seem that often, it
may be the perception of the complexity of the task at hand which makes the larger impact
on the student’s course of thought, taking the student at an intuitive level, as a starting
point. In a study of the dynamics of an individual’s cognitive processes Welzel (1998) also
claims that “at the beginning of subsequent situations, the complexity of ‘ideas’ frequently
returns to a lower level before regaining previously attained levels” (p. 1110).
5.4.4 Summary of results for Qn 4
These results gave evidence that the model of having all charges residing in the
battery alone, is hard to change. Students who initially thought that electrons reside only
in the wires, more easily conformed to the scientific view of how a current results. There
was also evidence that students may not have understood some words or phrases, which
then led to mistaken ideas. Moreover, it was shown how, when students perceive the
question at hand as being complex, they sometimes revert to intuitive lower level ideas and
use these as a starting point for their thinking.
5.5 The 3rd
interview – Part 2: Meanings attributed to voltmeter readings
5.5.1 The aim of the exercise
Students often find difficulty in explaining and distinguishing between potential
and potential difference (see sections 4.4.5.2 and 4.4.5.3), apart from also not
distinguishing p.d. from current (see section 4.4.5.5). Having students define these terms
would not have indicated understanding. It was thought, therefore, that if students could
focus on the reading of the voltmeter, saying what this meant to them, probing into models
of electrical potential and potential difference could be more effective. In describing an
instructional approach to the teaching of electric circuits that emphasizes electrical
potential and electric potential difference, Rosenthal and Henderson (2006) also stress that

243
“an important aspect of ‘their’ teaching of potential difference relations in circuits is an
emphasis on voltmeter readings” (p. 326).
This interview also aimed at probing what models students use to account for the
fact that the sum of the potential differences across two series resistors is equal to the
supply voltage. It was also deemed important to find out whether students believed that
the potential difference across resistors in parallel is equal to the supply voltage in an ideal
circuit, whether the resistances are equal or not.
5.5.2 Conducting the interview
This interview was once again conducted using the POE technique.
A series circuit with two equal resistors was shown to the student, together with
the circuit drawing shown in Figure 5.6. A voltmeter was connected across each resistor.
The following questions were asked:
• What do the voltmeters read when the resistors are equal? Why?
• What do the voltmeters read when one of the resistances is increased? Why?
The two resistances were then connected in parallel, as shown in Figure 5.7. A
voltmeter was again connected across each resistor. The students were allowed to re-
arrange and assemble the apparatus. The following questions were asked:
• What do the voltmeters read when the resistances are equal? Why?
• What do the voltmeters read when one of the resistances is increased? Why?
Since what students see is the reading on the voltmeter, another question which
was deemed important to ask was:
• What does the voltmeter reading mean to you? Why?
The idea was that asking a question based on something concrete would enhance
the possibility of students talking about their visualization of p.d., rather than just stating a
definition of p.d. which may sometimes be meaningless to them.

244
Figure 5.6: Circuit diagram showing voltmeters connected across series resistors
Figure 5.7: Circuit diagram showing voltmeters connected across parallel resistors
5.5.3 Students’ answers for the series circuits
Table 5.8 below summarizes students’ answers for the case of resistances
connected in series, both when the resistances were equal and when they were unequal.
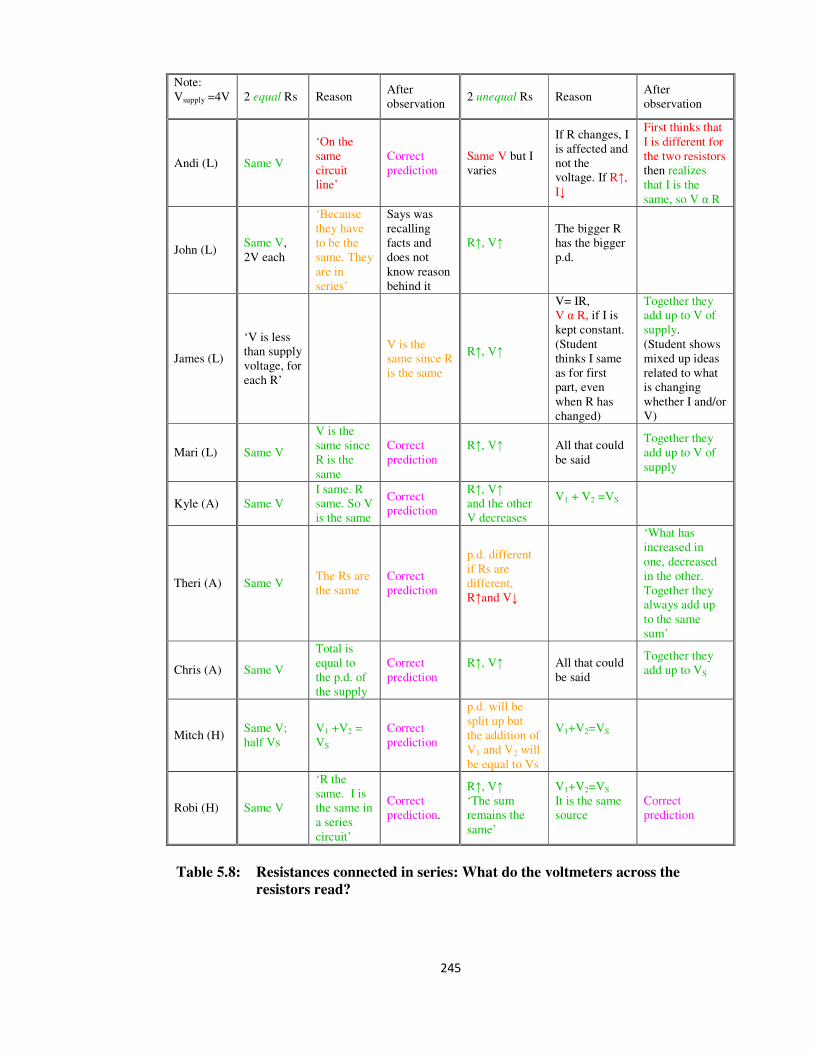
245
Note:
Vsupply =4V
2 equal Rs Reason After
observation 2 unequal Rs Reason
After
observation
Andi (L) Same V
‘On the
same
circuit
line’
Correct
prediction
Same V but I
varies
If R changes, I
is affected and
not the
voltage. If R↑,
I↓
First thinks that
I is different for
the two resistors
then realizes
that I is the
same, so V α R
John (L) Same V,
2V each
‘Because
they have
to be the
same. They
are in
series’
Says was
recalling
facts and
does not
know reason
behind it
R↑, V↑
The bigger R
has the bigger
p.d.
James (L)
‘V is less
than supply
voltage, for
each R’
V is the
same since R
is the same
R↑, V↑
V= IR,
V α R, if I is
kept constant.
(Student
thinks I same
as for first
part, even
when R has
changed)
Together they
add up to V of
supply.
(Student shows
mixed up ideas
related to what
is changing
whether I and/or
V)
Mari (L)
Same V
V is the
same since
R is the
same
Correct
prediction
R↑, V↑
All that could
be said
Together they
add up to V of
supply
Kyle (A) Same V
I same. R
same. So V
is the same
Correct
prediction
R↑, V↑
and the other
V decreases
V1 + V2 =VS
Theri (A) Same V The Rs are
the same
Correct
prediction
p.d. different
if Rs are
different,
R↑and V↓
‘What has
increased in
one, decreased
in the other.
Together they
always add up
to the same
sum’
Chris (A) Same V
Total is
equal to
the p.d. of
the supply
Correct
prediction
R↑, V↑
All that could
be said
Together they
add up to VS
Mitch (H) Same V;
half Vs
V1 +V2 =
VS
Correct
prediction
p.d. will be
split up but
the addition of
V1 and V2 will
be equal to Vs
V1+V2=VS
Robi (H) Same V
‘R the
same. I is
the same in
a series
circuit’
Correct
prediction.
R↑, V↑
‘The sum
remains the
same’
V1+V2=VS
It is the same
source
Correct
prediction
Table 5.8: Resistances connected in series: What do the voltmeters across the
resistors read?
246
These results show that most students applied the rule:
V1 + V2 = V supply,
whether the resistances were equal or unequal. Moreover, even if the predictions were
often correct, it was the reasons for them which students had problems with, implying that
the rule was recalled and the probability was that students did not have a model of p.d. in
mind. This goes to confirm that students answering correctly do not necessarily do so for
the right reason, thus supporting the idea of having asked two-tier questions in the
diagnostic tests, to probe students’ understanding.
5.5.4 Students’ answers for the parallel circuits
Students’ answers for the case of resistances connected in parallel were analyzed
in a similar manner. Results have been summarized in Table 5.9. Students predicted the
same p.d. across two equal parallel resistances, but valid reasons were scarce. Equality of
the voltmeter readings did not always imply p.d. values equal to Vsupply. It seemed that the
fact that the resistances were equal immediately prompted the necessity of having equal
voltmeter readings. This could be seen as a kind of phenomenological primitive or p-prim
(diSessa, 1988, 1993), or an aspect of ‘common reasoning’ whereby if two entities are the
same, anything linked with them should also be the same.
When students referred to the current splitting up between the branches, no-one
mentioned whether they saw the current in the main circuit was changing as well. Typical
answers which the students gave were:
Kyle (A): The current splits. R is the same.
Chris (A): The same voltage because the resistances are equal.

247
Student Equal Rs Reason After
observation Unequal Rs Reason After observation
Andi (L)
Same V
Battery V
divided by
2
Same V.
Later said:
R↑, V↑
I↓, V↑
Says best to deal with
the resistances
separately
John (L)
Same V = Vs
I divides
into 2,
same R
V changes
Currents through
the Rs are not
equal. V readings
are different
No reason
given
‘Because the current
does not affect the
voltage’
After being urged to
think further says:
’The voltage between
any 2 points in the
circuit will still
remain the same. It is
the voltage across the
battery’
James (L)
V same as
long as Rs
are the same
I
subdivides.
R same.
V=IR gives
the same V
Both same as
Vs. It did not
divide like
the case
when in
series
R↑, V↑ but
Total = Vsupply
(Seems to talk in
the same way as
for series
circuits)
‘Same way as
usual: V=IR
and so V↑ for
sure.
Vs = V1+V2
Attenuation
ideas are
expressed
Just cannot see why
the voltmeter
readings remain the
same!
Mari (L) Same V
The
resistances
are
identical.
‘In parallel,
the current
divides but
the voltage,
no!’
R↓, V↑
‘Because some
p.d. must be
used up
through the
resistor and the
smaller R, the
smaller
number of
volts are used
up’
Kyle (A) Same V
Same R
and same I.
Same V of
battery.
Doubts for
a while
whether
both same
as Vs, or
Vs divided
by 2
‘I was right!
Same R and
same I for
each’
Same V for both.
Keep the same
reading
R↑, I↓ and
V remains the
same (V=IR).
If R same, I the
same through
that branch
Theri (A)
Same V
Same
resistances
R↑, V↑
No reason can
be supplied ‘I’m blanked out!’
Chris (A)
Same V
Same
resistances
V changes for
the R which is
changed
If R changes,
V should
change
Resolves the problem
using numbers
Mitch (H)
Same V
Told this in
Form 3.
2 loops
seen.
V across
the battery
Vtotal across
battery↑ when
R↑
V=IR and I
leaving battery
kept same ,
V↑ when R↑
R only affected the
current. More R,
more opposition.
Could not explain
why same V resulted
Robi (H)
ready
Same when
in parallel.
Same Rs
and I splits
exactly into
2, so same
V
Same V, but
mixed up on
currents on
further
questioning.
Then goes
for ‘same V’
again
1) R↑, I↓, so V is
the same.
2) For R
constant, I↑ and
V↑
1) R↑, I↓
2) A larger I
flows and R is
the same , so
V↑
Now sees the system,
with I in the main
circuit changing. R
same has the same I.
V = Vs
Table 5.9: Equal and unequal resistances connected in parallel: What do the
voltmeters connected across the resistors read?

248
Once the resistances were made unequal, the difficulty was immediately
increased, with the majority of the students now saying that the value of the p.d. across the
parallel branches would not remain the same. Similar ideas were shown by Cohort 1 on
this question in the pre-test (see 4.4.5.4). It became more complicated for students to give
a reason for their prediction. Theri (A) just answered: ‘I’m blank’. The question put even
the high ability students in difficulty. The following is part of Robi’s (H) interview
transcript, showing this difficulty.
I: Now if we were to increase one resistance, what would happen to the
voltmeter readings?
R: The readings would remain the same, for then the resistance increases and
the current decreases and the voltage remains the same.
I: The same for the resistance which is constant, or the same for both? What
about the resistance which has not been changed?
[The student takes a long time to answer.]
R: It will increase.
I: Why?
R: A larger current will flow and the resistance is the same, therefore the
voltage increases.
[The student observes the results.]
R: They are reading the same! Ha!
I: And why is this, do you think?
R: Because then, even the current in the main part of the circuit, changes,
because of the total resistance for the circuit.
[The student smacks himself jokingly.]
I: And so…?
R: The current coming out of the battery changes. I think it increases…. I’m
calculating! So it decreases from the battery? What a mix up!
[The student goes to the circuit diagram and takes a long time thinking of what
is going on.]
I: Any results?
R: The current from the battery decreases.
I: I asked you about the voltmeter readings. We saw that they remain the
same. I’m asking you why this happens.
R: For the increased resistance, the current decreases. Therefore, V=IR,
therefore V remains the same. For the resistance which was kept the same,
while the overall current decreases, this resistance takes the same current as
before, and V remains the same, since R is the same and I is the same.
249
The student thinks primarily in terms of current, focusing on an increase of R
which decreases the current, but does not immediately consider that the current in the main
circuit changes. Moreover, when the change of current was finally considered, a wrong
decision was made, which negatively influenced ideas which came later.
Another interesting transcript to examine is from John’s interview. John (L) also
had mixed up ideas regarding the p.d. across unequal resistances connected directly to a
power supply. The student was urged to think further so as to clarify his ideas.
I: What happens if we increase one of the resistances?
J: Let me do some calculations. I think that they will change.
I: Why?
J: There will be more current passing through one of them and not through the
other. One will have less current and the other will have more.
I: So what about the voltmeter readings?
J: They won’t be the same.
John’s prediction just considered current. When John (L) changed one
resistance, making it larger, and observed the results, these were not what he expected.
The student seemed mixed up. I tried to motivate him to continue by repeating what he
had told me, and suggest that the student looks again at the circuit and the circuit diagram.
I: Which of these do you find more helpful?
J: The circuit gives me certain answers. You know what is happening through
the use of the circuit. The circuit is better.
[Later, looking at the voltmeter readings…..]
J: The voltage has not changed, I mean. Because here, in the circuit, you have
the voltmeter which is giving a reading because it is connected across a
resistor. It is connected between 2 points.
I: What, between 2 points?
J: The voltage between 2 points in the circuit will still remain the same. If it
were 4 volts before, it is 4 volts now, for both.
I: Sure?
J: Yes, I think so.
I: So how do you explain the part about the current – that the current through
one resistance was larger than the current through the other…?
J: The current was different, but the resistances are not the same. When the
resistance was increased, the current decreased and at the end of it, this is
not affecting the voltage coming out at the other end. This is in the sense
that the voltmeter reads the voltage between these 2 points, which is the
same as for the battery.
I: Are you sure of this?
J: Yes.
250
Even if the student described voltage as if it were current, referring to it as
‘coming out at the other end’, yet some difference between 2 points was being ‘seen’.
There was quite an improvement made on John’s part. While this can be partly attributed
to the fact that the researcher had motivated John (L) to think further and not give up, yet
the power of teaching and learning using POE tasks cannot be ignored. While not all
students seemed to have benefitted in the same way, yet it can confidently be said that
POEs can help students’ understanding. John (L) had shown an initial low level of
performance at the start of the course. Now, given more time to think and using
experimental results to support his thinking, John (L) was able to resolve uncertainties in
his reasoning. Perhaps, the more students get used to the POE technique as a tool to
promote understanding, the more students can get used to thinking at a deeper level, in
order to come up with valid reasons backing up their ideas.
5.5.5 Mental models of voltage
The previous sections indicate that problems were being encountered by all
interviewees, when it came to explaining predictions and observations of voltmeter
readings, especially in the case of parallel circuits. In an effort to try and look further into
the nature of these problems, the students were urged to talk about their mental picture of
‘voltage’ and ‘potential difference’. The problems that had surfaced earlier were even
stronger when students were asked to talk and describe what the reading on the voltmeters
meant to them. Some of the students were not able to say much, if anything at all,
regarding this quantity.
Theri (A) answered as follows:
T: The voltage across R.
I: What does this ‘voltage’ mean?
T: Hmmm! [Laughing!] I don’t know!
Some students had images of ‘voltage’ in terms of the ‘strength of the battery’
(Kyle (A), John (L)) and ‘the strength of the circuit’ (Kyle (A)).
Chris (A) referred to ‘the strength of the current’, thus:
C: Voltage as the strength of the current - how that strength varies across the
terminals. The current enters with some strength and leaves with a weaker
strength.
[And later…]:
251
I: So what is this potential difference causing exactly? Is it causing anything
in the circuit?
C: If you have a motor, say with 4V, it goes faster than when it is at 2V. So
it’s the strength of the current. It goes faster.
I: The strength of the current? What is the current doing? Are you saying the
strength of the current going faster?
C: If you increase the voltage, the strength of the current is increasing and the
result is, say in a motor, that it goes faster. Or a bulb will light up more
brightly, if it does not burn out.
A description like the one above is not much of an extension of the basic causal
model of agent-effect, indicating that linear causal reasoning is being applied at the initial
stages in understanding. Chris (A) seems to link V very closely to a property of the
battery. At the same time, the idea of V was not transferred to account for the voltmeter
reading across a passive component.
While by this stage, some of the students had shown that they knew that a
difference between current and voltage exists, they still had a problem differentiating
between the two physical quantities, as was shown by a later exercise.
Kyle (A) is one example of a student who specifically referred to this difference,
even if he stated that it was difficult to explain voltage.
I: What is your mental picture of voltage?
K: I don’t know how I am going to explain it. I don’t want to mix it up with
current. As such I think it is the output of the energy of the battery.
James (L) also ‘saw’ the difference between current and voltage, as follows:
J: Voltage as the ‘speed of the charges’, you know.
[Later on…],
J: The current is the amount of electrons in the circuit. So they are not the
same.
It was the high ability students who could imagine the flow of electrons as a
result of the forces of attraction between the battery terminals. Robi (H) spoke of this
attraction in the following way:
R: There will be different charges across the terminals of the battery and
electrons are attracted to the positive terminal, and move. Others take their
place. There will be something like a flow.
The other student, Mitch (H), makes a similar reference to the attractive force:

252
I: What does this voltmeter reading really mean to you?
M: That the potential difference in the circuit is 4.15 V.
I: What does the potential difference really mean to you?
M: The attraction between the positive and negative side of the battery.
I: Can you explain a bit more on this?
M: Cause there is a positive charge on the positive side of the battery and this
attracts negatively charged electrons on the negative side of the battery.
I: That is how you see potential difference, then.
M: Ehe! Yes.
I: So you say that something is attracting. And if they are attracted, what
happens?
M: Electrons flow through the circuit.
I: So the electron flow happens because of this attraction.
M: I think so.
Later on, the same student describes the reading on the voltmeter as a ‘voltage’
and as an indication of the charge passing through the resistor. Voltage and potential
difference are often used interchangeably. An interesting part emerged, through further
probing of ideas, when the student said that without a potential difference there would be
no current.
I: What causes what?
M: Both affect each other. But I think that the potential difference, since it is
positive and negative, and I see it as an attraction from positive to negative,
it means that current, depends on that.
The student indicates his view that potential difference can be both “a cause and
an effect” (Grotzer and Sudbury, 2000, p. 25), and at the same time gives evidence that he
sees V as the independent variable and I as the dependent one. This puts the model of
potential difference which Mitch (H) seems to hold, at a high level compared with the
models which were described by other students through these interviews.
It is important to note also, that when forces and speeds were being mentioned,
the underlying implication was that energy was, in some way, being provided. John (L)
and Kyle (A) actually mentioned the word ‘energy’, during the interview. John (L) said
that ‘voltage generates energy’, and Kyle (A) referred to the ‘energy of the battery’.
On the other hand, Theri (A), who admits having done some revision after the
last interview, regarding the meaning of voltage, tried to recall a definition, thus:
T: It is the electrical energy transferred to other forms of energy per
Coulomb….. something like that…. in one second.
I: And you understand it?
T: Yes. It made sense.
253
In the case of ‘voltage’, putting the mental picture into words may not have
proved to be an easy task. This was more so, when true understanding of ‘voltage’ had not
been achieved, because in such cases, there was no mental image to enlighten the
explanation. In such cases, therefore, a great difficulty was being encountered. The
definitions for potential difference, potential and voltage and the volt which students had
been exposed to, earlier in the course and in courses at secondary level, seemed to be
helping students too little, if at all, in building a good mental model of voltage and
potential difference.
5.5.6 Summary about how students imagine voltage
Similarly to what has been reported in other studies (e.g., Duit and von Rhoneck,
1998) voltage was mainly looked at as ‘strength of the current/circuit’ (Chris (A), Kyle
(A), John (L)). One student referred to the ‘speed of the electrons’ (James (L)). Only the
high ability students mentioned the force of attraction which exists on the electrons, acting
towards the positive terminal of the battery (Mitch (H), Robi (H)). This indicated that the
high ability students were approaching the idea of recognizing the existence of a force field
between the battery terminals, but had not yet reached the highest level of understanding of
electric circuits, in terms of what Borges and Gilbert (1999) refer to as “electricity as a
field phenomenon” (p. 107).
5.6 The 4th
interview – Differentiating between current and
voltage
5.6.1 Aim of the interview
The aim of this interview was to see whether students now distinguished voltage
from current. This interview was being conducted close to the end of the course in current
electricity and it was expected that students would know that the ammeter is a device to
measure current and that the voltmeter is a device which is used to measure potential
difference. It was also quite expected that it would be common knowledge for students,
that ammeters are connected in series and voltmeters are connected in parallel with
resistors, so that current and potential differences, respectively, can be measured. These
were issues which students had dealt with at secondary level, when these facts and rules
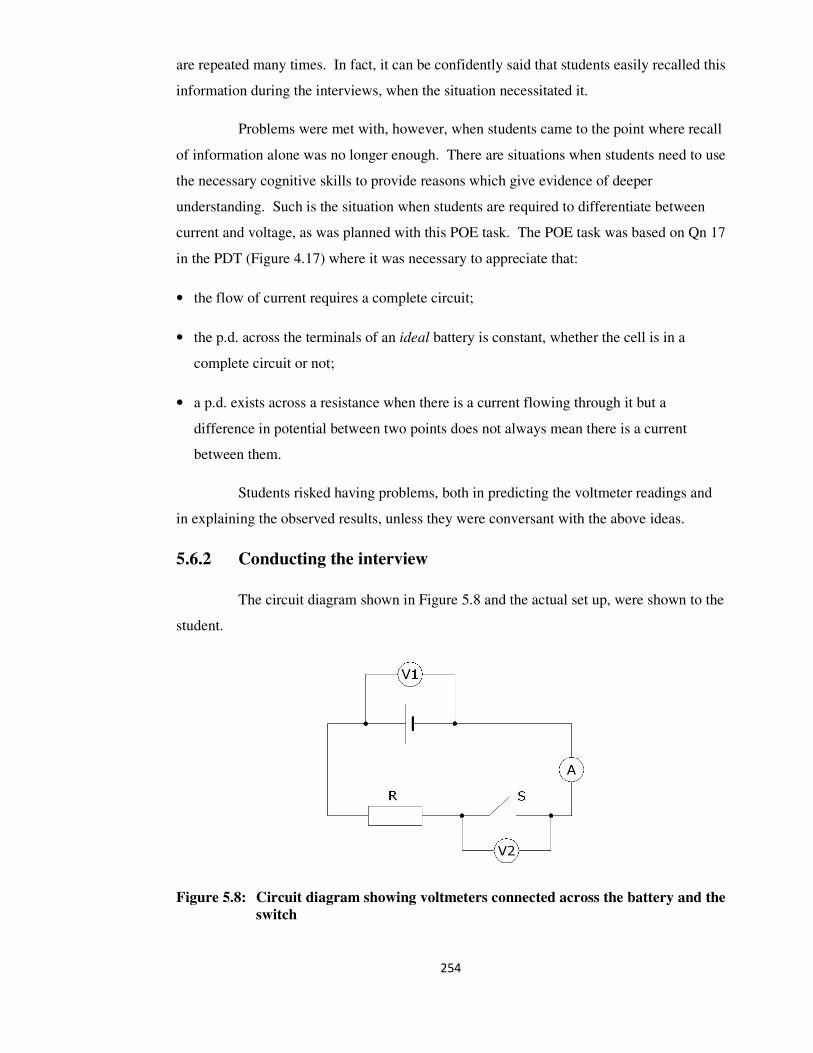
254
are repeated many times. In fact, it can be confidently said that students easily recalled this
information during the interviews, when the situation necessitated it.
Problems were met with, however, when students came to the point where recall
of information alone was no longer enough. There are situations when students need to use
the necessary cognitive skills to provide reasons which give evidence of deeper
understanding. Such is the situation when students are required to differentiate between
current and voltage, as was planned with this POE task. The POE task was based on Qn 17
in the PDT (Figure 4.17) where it was necessary to appreciate that:
• the flow of current requires a complete circuit;
• the p.d. across the terminals of an ideal battery is constant, whether the cell is in a
complete circuit or not;
• a p.d. exists across a resistance when there is a current flowing through it but a
difference in potential between two points does not always mean there is a current
between them.
Students risked having problems, both in predicting the voltmeter readings and
in explaining the observed results, unless they were conversant with the above ideas.
5.6.2 Conducting the interview
The circuit diagram shown in Figure 5.8 and the actual set up, were shown to the
student.
Figure 5.8: Circuit diagram showing voltmeters connected across the battery and the
switch
255
The student was asked the following questions:
• Comment on what happens to the readings on voltmeters V1, V2 and the ammeter A,
when S is switched ON? Give reasons for your answers.
• With S switched OFF, what can you say about the readings on V1, V2 and the ammeter
A? Give reasons for your answers.
5.6.3 The results of the interview
5.6.3.1 The main problems
The interviews have shown that it was mainly the readings of V2 across the
switch which confused students. One student, Mari (L) commented:
M: Never did I see a voltmeter across a switch!
So the situation was new, to that student at least, and was definitely one
where students had to think deeply to clearly visualize what was happening in the circuit,
possibly explaining their model in a scientific way.
Table 5.10 shows how the majority of students gave wrong predictions of what
V2 would read, both when S was closed and, especially, when S was open.

256
Qn17 Name of
student S closed S open
Correct
answers
Ammeter
shows a
reading
V1 shows a
reading V2 shows
no reading
Ammeter
shows no
reading
V1 shows a
reading V2 shows a
reading
Andi (L)
John (L)
James (L)
Mari (L)
Kyle (A)
Sees
complete
circuit
through V2
connection (non-ideal
situation)
(wrong
reason) ‘Because it
passes through
it and not
through the
switch’
Theri (A) Sees open
circuit, so
no reading
There is no R
at S (This answer
looks at p.d. as
the dependent
variable)
Chris (A)
(‘Reads the
e.m.f. of the
battery. Now a
resistance has
been created
(across S)’-
This answer
does not
convincingly
distinguish
between I and
V)
Mitch (H)
Robi (H) (Small r
at S is
mentioned)
I through V2 (Situation
not ideal)
(Student
still rather
unsure of
the answer)
Table 5.10: Predictions of meter readings in the circuit of Figure 5.9, when the switch
is open and closed
Since problems were being faced by students when dealing with the reading on
V2, it was thought appropriate to look more closely into students’ predictions and reasons
offered after observation for the answers related to V2. It was important to find out why
students were going wrong, trying to get to the roots of the problem.
257
5.6.3.2 The reading of V2 when S was closed
When S was closed, there were some students who realized that since the switch
offers no resistance, then, even if a current is flowing, V2 would read zero. The following
are extracts from some transcripts which indicate this, in prediction.
Mari (L): I don’t think that it (V2) will give a reading. There is no difference.
It is not connected to a resistor. [The student also stated that this was
just recalling what was read off a text book the day before.]
Chris (A): Zero p.d. across a wire with no resistance.
Theri (A): No reading, because before and after (the switch), the voltage
[meaning potential] is the same.
Looking at the answers from the other students, these were invariably showing
that they could not distinguish properly between current and voltage.
Andi (L) was one example. He did not only wrongly predict that V2 should
show a reading when the circuit was complete, but after observation, even the idea that
charge flows through a complete circuit was contradicted in an effort to find a reason for
why the reading on V2, which he had expected, was not there. For this student, the picture
was that voltage was only a consequence/property of current, agreeing with Maichle’s
(1981) proposition that “voltage is very often conceived as part, as quality or property of
the current or even as identical with the current” (p. 176). These were, indeed, similar
ideas to those presented in section 5.5.4. The following transcript gives evidence of the
equivalence of current and p.d. in the student’s mind. After the student observed the result
of the experiment, he then connected the voltmeter across the resistance which was already
in the circuit, trying to make sense of the situation.
(Switch ON):
A: Through the switch, I see no charges passing, otherwise the voltmeter would
give a reading, no? I see that at the same time it doesn’t make much sense,
but some charge must pass through it somehow.
In the case of James (L), the observation, after the switch was switched on,
was not enough to instil a valid reason for why V2 was not showing a reading. The student
did not show understanding of the concepts involved.
[After observation…..]
J: The voltmeters do not read the same because of the resistance?!
I: Why do you say so?
258
J: Because the resistance is stopping the speed of the electrons which are
passing through the circuit…..That is voltage.’
I: And this way, it makes sense to you?
J: Yes.
On the other hand, in the case of Mitch (H) who also gave a wrong prediction
that V2 would give a reading when the circuit is complete, the observation triggered a
quick response to correct the error.
[After observation…..]
M: There is no difference between the charge or energy of the electron passing
from one side to the other of the switch. [This is interpreted as meaning that
the student wanted to say that the potential was the same on both sides of S.]
5.6.3.3 The reading of V2 when S was open
It was this part of the POE task which gave concrete evidence for the fact that
students, even those who were categorized as able students, still found difficulty in
differentiating between current and p.d. at this late stage in the course. Indeed, all the
interviewees wrongly predicted zero reading on V2, when S was open. This poor
performance was also observed on this question in all PDTs by Cohort 1 (see Chapter 4).
Even though students had completed a course in current electricity, they could
not provide a scientific mental model of potential difference. Instead, they indicated that
they could not yet separate p.d. from its current counterpart. Students’ answers showed
what Tiberghien (1983) reported, that “actually, for students, when current is circulating,
voltage must exist, and when the current is interrupted, there cannot be any voltage” (p. 9).
Interestingly enough, in the previous interview, both Mitch (H) and Robi (H)
had described potential difference as the attraction that exists between the negative charges
and positive side of the battery. But, these students still did not ‘see’ a force field and thus
could not provide valid reasons for why voltmeter V2 gave a reading when S was open. It
was hard to see p.d. without a current.

259
Robi (H), before observation:
R: V2 reads nothing, since no current flows through the switch.
After observation, the student seemed to be in a dilemma.
R: V2 now seems to be connected in series, no, miss?....That is how it is –
connected in series! What I am saying is that it cannot be that there is no
current! Strictly speaking there is a closed circuit.
[And later…]
R: I am not understanding why this is happening.
Mitch (H), before observation:
M: Zero
I: Reason?
M: No energy transfer passing through the circuit.
In correction, after observation:
M: Wrong reason. No kinetic energy, but the free electrons will still be moving
around in the wire.
The other students also seemed to hold the same view. The following are some
examples.
James (L), before observation:
J: V2 will not read anything. If no electrons are passing, as I imagine it, the
voltmeter will not give a reading.
After observation:
J: I just don’t know what is happening!
In the case of Andi (L), what was being observed was baffling and unexpected
for the student.
A: No reading, since it did not even read when S was closed. How is it that the
circuit is OFF and V2 gives a reading, now?!’
Kyle (A) before observation, S open:
K: V2 is across S, the current passes like when there is an ammeter. It now
passes through the voltmeter and keeps going. V2 gives a reading and the
260
ammeter also. With S open, we still have a system and when S is ON,
current passes through the shorter path.
Then, after observation:
K: The ammeter is not giving a reading! [The student is confused.] So since
V2 gave a reading, there must be a current through V2.
This was a very explicit association of a voltmeter reading with a current.
Later Kyle said:
K: There is a value which is zero, since V = IR and I don’t know whether it is
V or R.
I: Where?
K: Across the ammeter.
The student was concerned because while in his mind he ‘saw’ a current through
the voltmeter, yet, the instrument which is known to indicate current – the ammeter – was
reading zero.
Difficulties like the ones indicated above, specifically based on the relation
between current and p.d., seem deeply rooted. Only about half the interviewees could,
after observation, recognize that V2 was connected to the terminals of the battery. These
interviewees were mainly from the low and average ability groups. Even then, some still
had doubts to why V2 gave zero reading with S switched ON, while giving a reading when
S was switched OFF.
5.6.4 Summary of the findings from the 4th
interview
During the 3rd
interview, Mitch (H) and Robi (H) had demonstrated they
understood what constitutes potential difference, in terms of the forces of attraction
experienced by moving charges. The results of the 4th
interview and related POE task have
shown that the same students now gave proof that they were not in complete possession of
a scientific model of p.d. in terms of some difference between points. The students of
lower ability were not able to completely separate the concept of potential difference or
voltage from that of current. For them, p.d. was still seen as an entity which was
dependent on current, in most or all situations.
The outcome of this interview puts a stronger accent on the problem being
encountered, when one considers that the students had just covered a course of study on
electric circuits and had therefore had time to discuss, in class at least, issues related to
261
potential and potential difference, both through qualitative and numerical approaches. This
was pointing towards changes that needed to be considered in the teaching of Cohort 2, to
try and help students in this line.
It is also important to note that after observing V1 and V2 both giving the same
reading when S was opened (see Figure 5.8), some students from the low and average
ability groups were then in a position to see that a valid explanation was that V2 was
connected in parallel with the battery terminals, even if doubts in some ideas were still
detected. This is again another strong point in favour of the use of POE tasks as
teaching/learning tools.
5.7 Overall summary and conclusion
The semi-structured interviews described above were undertaken to try and look
more deeply into students’ mental models of electric circuits. Students of different ability
were chosen to be interviewed with the aim of having students indicate the various ideas
they may develop during the teaching. A global picture was expected to emerge, starting
from students’ intuitive ideas inferred at the start of the course, and possibly showing how
these ideas evolve as students develop mental models which are at par with scientific
views. Thus, by looking at the work done with all the students, it was possible to start
forming a general picture of learning pathways which students’ ideas seemed to follow. A
diagram showing students’ visualizations of what makes current has already been
presented in Figure 5.2. Further reflections and conclusions about the mental models
inferred as students’ ideas were probed during the learning of the concepts involved are
elaborated upon in Chapter 7, after the results with Cohort 2 are discussed in Chapter 6.
It must be acknowledged at the onset that the global picture indicating the
mental models of circuit which emerged as a result of the interview analysis was primarily
influenced by the questions which were asked through the interviews, the order in which
they were asked, and also the ideas from previous work which had been reported on the
topic and which permeated the work done with the students through the interviews.
At the start, when students talked of current flow, it was a sequential description
that they gave. This may have been a reproduction of how some teachers describe currents
in circuits, in class time. Shipstone (2002,) claims that “perhaps we unwittingly reinforce

262
the sequence model as we talk to children” (p. 234). The author explains how, in referring
to the circuit diagram shown in Figure 5.9, a teacher might say: “The current flows out of
the positive terminal of the battery here, passes through the lamp L1, then splits up at the
junction with some going to lamp L2 and the rest to the variable R….” (p. 234). A
sequence of events is thus being described, and students easily give such descriptions
unintended meaning.
Figure 5.9: Circuit drawing (Shipstone, 2002, p. 231)
A number of students in the study conducted by Grotzer and Sudbury (2000) had
also said that “simultaneous cyclic causality is difficult to talk about without resorting to a
sequential explanation” (p. 24). These students had said that “they could picture it but that
they found it hard to explain” (p. 24). The same thing happened with the students in this
study. It may be argued that perhaps this problem is difficult to deal with, but teachers can
certainly be more careful during teaching, avoiding sequential descriptions while
emphasizing a system view of the electric circuit.
These interviews also pointed to some students’ confusion with the microscopic
ideas held of current. The impression conveyed by the interview work was that students
are often left to discover, or better, to try and imagine what might be happening, without
much guidance from the teacher. There were instances when students said: ‘The teacher
told me that, in Form 3’, but none of this was said related to the microscopic views of what
goes on in an electric circuit. How a battery works and how it is constructed is no longer
discussed with students at secondary school level and teaching seems to highlight the
macroscopic rather than the microscopic. It seems that this lack of detail causes problems
with students’ understanding, and can be unhelpful when students come to model the
circuit as a system.

263
Looking at the answers to Qn 4 from the Physics Diagnostic Test (PDT) shows
how few students changed their views from before the start of the course, to the review of
the question some weeks later. Those students, in the 1st interview, who saw the battery as
carrying all the charge inside it, allowing it to move along the wires when the circuit is
complete, held strongly to this view even on the 3rd
interview. It seems that unless direct
reference is made to microscopic ideas in order to clarify them, one cannot easily build
concrete, solid and scientific models of current.
With regard to resistors, a substantial number of the group of students believed
that the total resistance in the circuit simply depended on the number of resistors and not
on how they were connected. Moreover, when the fact that resistances in parallel have a
reduced total resistance was emphasized using the POE technique, some students found it
an almost natural explanation to talk about the 2 paths now available for current flow.
This indicates that teaching parallel circuits as a number of mono-circuits might make
students’ understanding of parallel circuits easier.
The use of the POE technique helped some students to grasp the ideas of why
circuits worked the way they did. This pointed towards the importance of having students
deal with simple experiments while being asked for predictions and reasons of what is
expected to happen, allowing time for ideas to sink in and for mental pictures to develop,
reinforcing deeper understanding. The POE tasks also helped to motivate students to
search for a valid reason for why things may not have resulted as predicted. The idea of
using these tasks in teaching, helping students to distinguish between their intuitive ideas
and the scientific ones, can be an effective way of tutoring students. Students in this study
started with their intuitive ideas and were given the space to work on these ideas, clarify
their views and develop their mental pictures. Moreover, students’ misconceptions were
being addressed, there and then. This is an important aspect of teaching and learning. It is
evident that making students just recall the facts is not enough to motivate them to learn
and understand. Students may be externally motivated to recall facts, relying on memory
work even if they find that the material has not been understood. Students may find that
they still pass exams this way, but once the exam is over, all is easily forgotten. Rosenthal
and Henderson (2006) likewise stress that “as usual, only telling students has limited
effect; they (the students) must struggle with…. problems on their own or in small groups”
(p. 324). True educators should look for ways which make learning last.

264
Looking globally at the interview work, it can be said that most students started
with quite a number of misconceptions. Some problems seemed easily resolved, like for
example, the idea of current conservation. It was the difficulty students found when
dealing with potential difference that was quite pronounced. This was not unexpected
since previous studies have emphasized this difficulty (see Gunstone et al., 2001; Jung,
1985a, 1985b; Liégeois et al., 2003). Potential and potential difference are difficult to
describe and to imagine, not just by students but sometimes also by practitioners. The idea
of potential difference in terms of forces of attraction and repulsion which cause the
charges to move was described by the students of high ability. Students of lower ability
did not refer to these charges and forces. The idea of the electric field between the battery
terminals seems one which is ignored by students. Perhaps, not many teachers refer to it,
at the same time as very few books look into and explain this detail. Students therefore,
even the intrinsically motivated ones, have limited access to information about this fact
which some authors, amongst them Haertel (2008a), claim is useful for the understanding
of p.d.
Furthermore, the problem students had of being unable to separate potential
difference from current, was also evident. Shipstone (1984, 2002) refers to this difficulty,
citing the works of Maichle (1981) and von Rhöneck (1981) which also highlight this
issue. The POE task which was used to probe this difference, acted as a strong indicator of
this major difficulty. This task used in ‘Interview 4’, using the circuit diagram shown in
Figure 5.8, can be used as a possible tool in the teaching of this differentiation between the
two physical quantities. Students need to realise that current and potential difference
differ, and that potential difference can exist without current. Moreover, the relationship
between potential difference and current should also be discussed with students
enphasising causes and their effects. The aim is to have students reach a stage proving that
“the understanding is in performance, and not simply evidenced by it” (Millar & Beh,
1993, p. 360).
In addition, the fact that both high ability students interviewed fell short of
explaining why a voltmeter such as V2 in Figure 5.8 gives a reading which is not zero
when the switch is open, can be taken as a pointer towards the fact that the existence of
potential difference without the presence of a current may be a hierarchically more
difficult idea to grasp than the idea of p.d. when a current flows. This work gave evidence
that students can be visualizing the attraction of electrons to the positive terminal of the

265
battery, but need not be ‘seeing’ the force field between the battery terminals at the same
time. Even if students described the forces of attraction between differently charged
entities – a predisposition students have of thinking about mechanistic effects, making
understanding easier for them (White, 1993) – it was not enough to say that they had a
complete understanding of potential difference. For this understanding of p.d. to be
complete, this study shows that two models must be clear to the students, namely:
• the model whereby students understand that the forces of attraction and repulsion exist
on the moving charges when the current is flowing i.e. when the circuit is complete;
• the model whereby students understand further that the cause of the force of attraction is
the presence of the force field, which exists even when the current is not flowing i.e.
when the circuit is open.
These are two models of potential difference. One model relates to the
mechanistic view of having forces of attraction between the moving negative charges and
the positive battery terminal. The other causal model relates to the force field which exists
between the battery terminals, even in open circuit – a model which is being shown by this
study as being at a higher conceptual level than the first, since even the higher ability
students found it more difficult to relate with.
All that has been said above, points towards implications for teaching which
result from this work and which can be summarized thus:
• teachers need to be careful in their explanations to avoid sequential descriptions of
current flow;
• teachers may find that the ‘2 paths model’ may make it easier for students to understand
parallel circuits;
• using POE tasks may help students to improve their reasoning abilities;
• helping students distinguish between current and p.d. by making students aware of the
force field which exists between battery terminals, even when no current is flowing,
may make it easier for students to visualize p.d.

266
The next chapter will now look into how the work with Cohort 1, including the
above implications for teaching, influenced the teaching of Cohort 2, a year later. The
analysis of the results with Cohort 2 is also discussed.
267
Chapter 6 Progress in Understanding of Electric
Circuits in Cohort 2
6.1 Introduction
In Sections 3.9 and 3.10 of the methodology chapter, it was indicated that as part
of the action research project, the plan was to administer the same physics diagnostic tests
and the TOLT with Cohort 2, one year later, within the same time-frame of the course of
study. Analysis of the results was done using similar methods as described with Cohort 1.
Conducting one-to-one interviews with some of the students in Cohort 2 had also been
planned. It must be emphasised that the purpose of conducting the research with Cohort 2
was not to simply repeat the work which had been done with Cohort 1, but to try and
establish whether student understanding of electric circuits would improve when some
changes in the additional teaching activities were made. Research with Cohort 2 was
meant to help in pointing more clearly to possible reasons for poor understanding in
specific areas, evident even after teaching.
This chapter first looks at the results of the pre-test with Cohort 2, checking
whether students were finding the same difficulties at the start of the course, as Cohort 1.
Additional teaching activities used with Cohort 2 are then described. Analysis of the post-
test and delayed post-test results follows, checking whether students’ progress was evident
in particular areas of the topic. Moreover, the results from the interviews with students in
Cohort 2 are also discussed, underlining some reasons for students’ persisting difficulties.
6.2 Analysis of the pre-test results
6.2.1 Introduction
The sample in Cohort 2 consisted of 49 students in their second year of study at
the college, covering the course of electric circuits with me, like the students in Cohort 1.
Students’ performance on the pre-test before the teaching indicated that students in Cohort
2 had similar difficulties as indicated at this stage by Cohort 1, with some problems being
significantly worse for Cohort 2.

268
6.2.2 The facility values of questions on the pre-test
The facility values for the pre-test questions (see Table 6.1) clearly indicate that
those questions which were chosen to be asked again in the post-test with Cohort 1 because
of low facility value were also found difficult to answer by Cohort 2. These questions are
marked in green making it easier to compare the similarity in performance of Cohort 1 and
Cohort 2, prior to the teaching.
Question number Facility Value in rank order
(Cohort 2)
Facility Value
(Cohort 1)
17b(i) 0.959 0.885
5 0.878 0.836
12a 0.755 0.885
12d+12e 0.755 0.738
9a(i) 0.714 0.951
10 0.694 0.672
11 0.653 0.770
15predict 0.592 0.574
1 0.571 0.656
9a(iv)+9a(v) 0.551 0.738
3 0.551 0.525
12b 0.449 0.656
15 0.449 0.459
9a(ii)+9a(iii) 0.429 0.656
4b+4e 0.408 0.410
2 0.408 0.689
16predict 0.367 0.393
9b 0.327 0.525
14 0.327 0.344
13 0.306 0.525
7 0.286 0.459
4c+4f 0.245 0.213
16 0.204 0.393
17a 0.204 0.213
6 0.163 0.262
12c+12f 0.163 0.213
17b(ii) 0.122 0.262
4a+4d 0.102 0.164
8 0.061 0.164
Table 6.1: Comparing facility values for questions on the pre-test for both cohorts
The facility value was high, for both cohorts, when questions related to scientific
ideas which can be described as almost intuitive, like for example, no current when the
circuit is open or less current when the resistance is larger.

269
6.2.3 Similarities and differences of students’ answers according to
concepts being probed
6.2.3.1 Microscopic views
As with Cohort 1, students in Cohort 2 did not find it easy to answer questions
related to microscopic views of the electric circuit. Qn 4(a) and 4(d) probing ideas about
whether charges reside only in the battery, confused many students. Table 6.2 shows that
25 students (51%) consistently saw charges flowing out of the battery and 18 students
(37%) were confused.
Qn4(d)
Correct Incorrect
Total
Correct 5* 1 6 Qn4(a)
Incorrect 18 25 43
Total 23 26 49
Table 6.2: Comparing parts (a) and (d) of Qn4 on the pre-test
Moreover, only 12 students (25%) answered correctly to both part questions 4(c)
and 4(f) (see Table 6.3), probing the idea that charges exist everywhere in the circuit even
before closing it.
Qn4(f)
Correct Incorrect Missing
Total
Correct 12* 11 1 24 Qn4(c)
Incorrect 13 12 0 25
Total 25 23 1 49
Table 6.3: Results for parts (c) and (f) of Qn 4
There is no significant difference in proportions between these results and those
indicated in section 4.4.2.1, for Cohort 1 (p-value = 0.48 for (a) and (d); p-value = 0.69 for
(c) and (f)). These p-values were estimated by using the chi-square test of differences
between independent groups. All p-values presented in this chapter were computed by
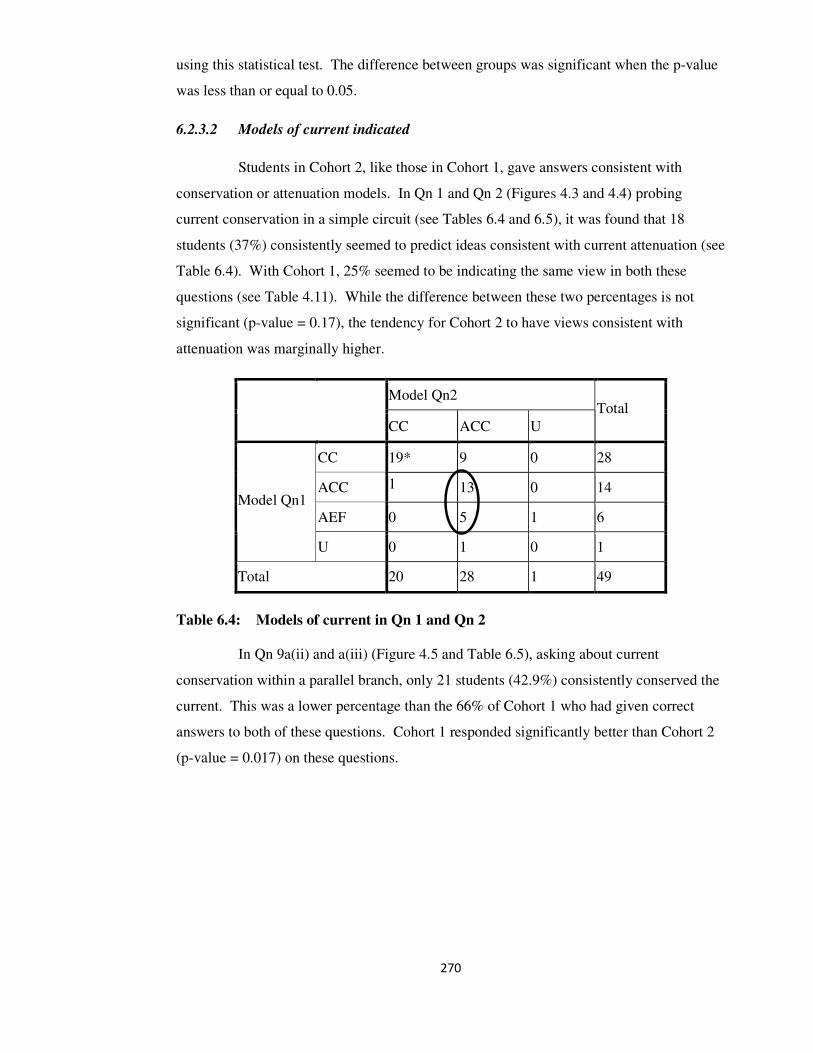
270
using this statistical test. The difference between groups was significant when the p-value
was less than or equal to 0.05.
6.2.3.2 Models of current indicated
Students in Cohort 2, like those in Cohort 1, gave answers consistent with
conservation or attenuation models. In Qn 1 and Qn 2 (Figures 4.3 and 4.4) probing
current conservation in a simple circuit (see Tables 6.4 and 6.5), it was found that 18
students (37%) consistently seemed to predict ideas consistent with current attenuation (see
Table 6.4). With Cohort 1, 25% seemed to be indicating the same view in both these
questions (see Table 4.11). While the difference between these two percentages is not
significant (p-value = 0.17), the tendency for Cohort 2 to have views consistent with
attenuation was marginally higher.
Model Qn2
CC ACC U
Total
CC 19* 9 0 28
ACC 1 13 0 14
AEF 0 5 1 6
Model Qn1
U 0 1 0 1
Total 20 28 1 49
Table 6.4: Models of current in Qn 1 and Qn 2
In Qn 9a(ii) and a(iii) (Figure 4.5 and Table 6.5), asking about current
conservation within a parallel branch, only 21 students (42.9%) consistently conserved the
current. This was a lower percentage than the 66% of Cohort 1 who had given correct
answers to both of these questions. Cohort 1 responded significantly better than Cohort 2
(p-value = 0.017) on these questions.

271
Qn9a(iii)
True False
Total
True 0 25 25 Qn9a(ii)
False 21* 3 24
Total 21 28 49
Table 6.5: Results for Qn 9a(ii) and Qn 9a(iii) - ‘Current conservation within a
parallel branch’
6.2.3.3 How resistance controls the current
In both Qn 5, ‘Use of a larger resistance’ and Qn 7, ‘Increasing the variable
resistance’ (Figures 4.6 and 4.7), the majority of students stated correctly that an increase
in resistance reduces the current. Forty students (82%) answered part (a) of both questions
correctly (see Table 6.6).
Qn7(a)
i ii iii iv Missing
Total
i 1 0 0 0 1 2
ii 0 3 1 0 0 4 Qn5(a)
iii 0 2 40* 1 0 43
Total 1 5 41 1 1 49
Table 6.6: Results for Qn 5(a) and Qn 7(a)
However, only 14 students (29%) substantiated this answer with a scientific
explanation in Qn 7(b) (see Table 6.7). With Cohort 1, 48% of the group chose scientific
answers (see section 4.4.4.3). Cohort 1 gave significantly better answers regarding
resistance (p-value = 0.04).

272
N=49
Answer to
Qn7(a)
Answer to
Qn7(b)
Mental model
consistent with
answers
Mental model
code
Number of
students Percentage
iii ii
Scientific (battery
cannot push as
big a current
through larger R)
SCI(R) 14* 29%
ii iv Same battery,
same current BAT 4 8%
iii iii
A larger R
‘needs’ more
current
R-TAKE 19 39%
Others Unclassified U 12 25%
Table 6.7: Mental models in Qn 7 - ‘Increasing the variable resistance’
Table 6.7 shows 19 students (39%) making the iii/iii option choice: ‘It gets
smaller but not zero; a larger resistance needs more current than a smaller resistance’.
These students may have possibly been showing ideas consistent with the attenuation
model of current. Students may have combined the ‘same battery, same current’ view (the
BAT model) with the fact that a bigger R allows a smaller current to flow attributing this to
a higher amount of attenuation by a larger resistance and describing the situation in terms
of an R-TAKE model. The number of students in this set was quite high. With Cohort 1
there were 14 students (23%) who also made this choice. This indicates similar results for
both cohorts since the percentage differences were not statistically significant (p-value =
0.07).
6.2.3.4 Further indications of unhelpful models using resistances in series and in
parallel
Qn 6, ‘Adding an equal resistance in series’ (Figure 4.8) showed how many
students failed to choose the correct qualitative explanation for their otherwise correct,
even if possibly recalled, answer to Qn 6(a). The results in Table 6.8 show that the
R-TAKE model, the SHARE (current sharing between resistors resulting in a lower
current) and the BAT models were chosen by 25%, 29% and 14% respectively. The same
models that were common with Cohort 1 seemed common also with Cohort 2.

273
N= 49
Answer to
Qn6(a)
Answer to
Qn6(b)
Mental model
consistent with
answers
Mental
model code
Number of
students Percentage
iii ii
Scientific (R as a
control to the
battery push)
SCI(R) 8* 16%
i iv
More of A, more
of B; direct
proportion
More A,
more B 2 4%
iii iv
More resistors
‘need’ more
current
R-TAKE 12 25%
iii v Sharing model SHARE 14 29%
ii iii Same battery,
same current BAT 7 14%
Others U 6 12%
Table 6.8: Models for Qn 6: ‘Adding an equal resistance in series’
Model Qn6
SCI(R) R-TAKE BAT SHARE More A,
more B U
Total
SCI(R) 5* 3 3 2 1 0 14
R-TAKE 3 4 0 7 0 5 19
BAT 0 0 3 0 0 1 4
Model Qn7
U 0 5 1 5 1 0 12
Total 8 12 7 14 2 6 49
Table 6.9: Mental models for Qn 7 and Qn6
A cross-tabulation of the models in Qn7, ‘Increasing the variable resistance’ and
Qn 6, shown in Table 6.9, indicated a very poor understanding of resistance, with only 5
students (10%) consistently confirming a scientific answer. Most of the students who gave
unclassified answers to Qn 7, confirmed their confusion in Qn 6 (see numbers encircled in
Table 6.9), choosing answers consistent with either the R-TAKE or SHARE model. The
BAT model was consistently used by 3 students (6%) in both these questions.

274
In Qn 8, ‘Adding an equal resistance in parallel’ (Figure 4.9), while it was
evident that many could not answer scientifically for lack of knowledge about parallel
resistors at this stage of the course, yet the answers still helped to indicate intuitive ideas
about the effect of resistances connected in parallel. Answers consistent with the BAT
model appealed to 9 students (18%). Five students (10%) chose option iii/i, indicating that
they just considered the number of resistors and not how they were connected (see Table
6.10). On the other hand, (15+14) students (59%; see numbers encircled) who were
incorrect about what happens to the current, were conscious of the two paths introduced
because of the parallel branches. With Cohort 1 (see section 4.4.4.5), 44% of the students
showed the same views. This difference, however, was not significant (p-value = 0.12).
Qn8(b)
i ii iii
Total
i 0 3* 0 3
ii 1 15 9(BAT) 25 Qn8(a)
iii 5(I↓, R↑) 14 2 21
Total 6 32 11 49
Table 6.10: Results for Qn8
6.2.3.5 Problems with the conceptualization of p.d.
In Qn 10 and Qn 11 (Figures 4.10 and 4.11) only 24 students (49%) from Cohort
2 (see Table 6.11), as compared to 59% of Cohort 1(see section 4.4.5.2), answered
correctly to both questions probing whether students visualized p.d. as some sort of push,
increasing with increased battery voltage. While this difference between cohorts was not
significant (p-value = 0.48), yet Cohort 1 performed marginally better than Cohort 2.

275
Model Qn11
SCI(p.d.) R-TAKE V↑,R↑,I↓ U
Total
SCI(p.d.) 24* 2 3 1 30
R-TAKE 2 3 0 1 6
V↑,R↑,I↓ 2 0 4 0 6
Model Qn10
U 2 2 0 3 7
Total 30 7 7 5 49
Table 6.11: Comparing models for Qn 10 and Qn 11
Thirty seven students (76%) predicted the correct voltmeter reading in Qn 12 (a)
(Figure 4.12) where the voltmeter was directly connected across the two points in question.
However, only 21 students (43%) transferred the idea to having the same voltmeter reading
across equivalent points in Qn 12(b) (see Table 6.12). With Cohort 1, the percentage
answering correctly to Qn 12(a) was 89% – the difference between cohorts was not
significant (p–value = 0.07). However, 66% of Cohort 1 had answered correctly to Qn
12(b). Here Cohort 1 had answered significantly better than Cohort 2 (p-value = 0.02).
In these part questions, the problem of students seeing a loss of p.d. across
connecting wires reappeared with Cohort 2. A substantial number of 14 students (29%),
encircled, saw this loss of p.d. and thus did not recognise equivalent points in an ideal
circuit. The difference between this and the 20% of Cohort 1 who gave the same answer to
this question is not statistically significant (p-value = 0.27). Thus, students in both cohorts
may have been linking p.d. with current or energy. Students may believe that p.d. is
‘attenuated’ in the same way that they think current is, or ‘lost’ like energy, when current
flows.
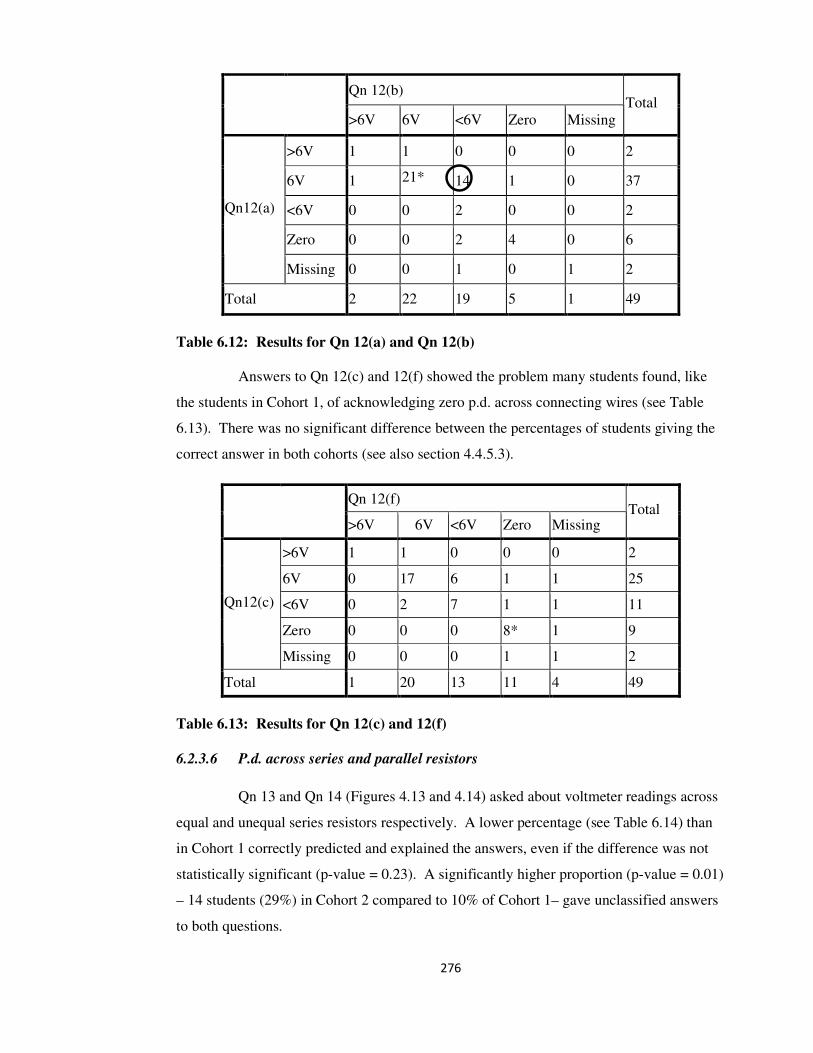
276
Qn 12(b)
>6V 6V <6V Zero Missing
Total
>6V 1 1 0 0 0 2
6V 1 21* 14 1 0 37
<6V 0 0 2 0 0 2
Zero 0 0 2 4 0 6
Qn12(a)
Missing 0 0 1 0 1 2
Total 2 22 19 5 1 49
Table 6.12: Results for Qn 12(a) and Qn 12(b)
Answers to Qn 12(c) and 12(f) showed the problem many students found, like
the students in Cohort 1, of acknowledging zero p.d. across connecting wires (see Table
6.13). There was no significant difference between the percentages of students giving the
correct answer in both cohorts (see also section 4.4.5.3).
Qn 12(f)
>6V 6V <6V Zero Missing Total
>6V 1 1 0 0 0 2
6V 0 17 6 1 1 25
<6V 0 2 7 1 1 11
Zero 0 0 0 8* 1 9
Qn12(c)
Missing 0 0 0 1 1 2
Total 1 20 13 11 4 49
Table 6.13: Results for Qn 12(c) and 12(f)
6.2.3.6 P.d. across series and parallel resistors
Qn 13 and Qn 14 (Figures 4.13 and 4.14) asked about voltmeter readings across
equal and unequal series resistors respectively. A lower percentage (see Table 6.14) than
in Cohort 1 correctly predicted and explained the answers, even if the difference was not
statistically significant (p-value = 0.23). A significantly higher proportion (p-value = 0.01)
– 14 students (29%) in Cohort 2 compared to 10% of Cohort 1– gave unclassified answers
to both questions.

277
Qn14
Correct,
complete
Correct,
incomplete
Repeats
part (a)
Alternative
ideas Unclassified
Total
Correct,
complete 2* 3* 0 2 0 7
Correct,
incomplete 0 6* 0 2 0 8
Repeats part
(a) 0 1 0 0 0 1
Alternative
ideas 0 0 1 9 1 11
Qn13
Unclassified 0 4 0 4 14 22
Total 2 14 1 17 15 49
Table 6.14: Results for Qn 13 and Qn 14
Some students’ answers were consistent with attenuation and at times the
reasons provided mentioned only current. These students’ viewed p.d. as something
similar to current. One answer for the p.d. across the larger of two resistances connected in
series with a 6V supply as asked in Qn 14 was as follows:
‘Between 6V and 3V’; ‘Some current is used by the resistance. Since the
resistance is bigger, more current is used up.’
This answer shows that the student is thinking in terms of current and seeing this
as being attenuated. It also suggests that the student seems to look at the resistor in
question only, rather than treating the whole circuit as a system. Answers like this one can
be taken to indicate the complexity of the problem which students demonstrate in
understanding electric circuits. Schwedes and Dudeck (1996) also acknowledge this when
they refer to alternative ideas which “do not exist separately and independently from each
other but normally are part of an inner conceptual relationship and are interrelated to each
other” (p. 51).
In the case of parallel resistors, once again as with Cohort 1, the splitting of p.d.
was indicated by many students as they answered Qn 15, ‘p.d. across equal parallel
resistors’ and Qn 16, ‘p.d. across unequal parallel resistors’ (Figures 4.15 and 4.16; Tables
6.15 and 6.16). Some students split the p.d. equally whether the resistances were equal or
not. Others used unequal splitting in Qn 16, with more students thinking that it was 4V
which would result across the smaller resistance of 2Ω. This was further evidence of
students considering p.d. as current, using general rules like, ‘less resistance, more

278
current’, as they reason about p.d. There was no significant difference between the
answers from both groups.
Answer
to Qn15
Number giving
this answer in
Cohort 2
Percentage
Cohort 2
(N=49)
Percentage
Cohort 1
(N=61)
(8V , 8V) 30 61% 57%
(4V , 4V) 14 29% 38%
Other 4 8% 3%
Missing 1 2% 2%
Table 6.15: Voltmeter predictions to Qn 15 - ‘equal parallel resistors’
Answer
to Qn16
Number giving
this answer in
Cohort 2
Percentage
Cohort 2
(N=49)
Percentage
Cohort 1
(N=61)
(6V , 6V) 23 47% 39%
(3V , 3V) 5 10% 8%
(4V , 2V) 11 23% 15%
(2V , 4V) 4 8% 16%
Other 5 10% 15%
Missing 1 2% 7%
Table 6.16: Voltmeter predictions to Qn 16 - ‘unequal parallel resistors’
Moreover, like Cohort 1, most students saw p.d. either as some kind of
difference between points, or as some kind of flow (see Table 6.17).
Model Qn16
Model Qn15 Difference
model
Flow
model Other Total
Difference
model 10 4 8 22
Flow model 0 9 6 15
Other 0 4 8 12
Total 10 17 22 49
Table 6.17: Comparing models of voltage in Qn15 and Qn16 - ‘resistors in parallel’
In Qn 17: ‘p.d. across an open and closed switch’ (Figure 4.17), students’
answers gave further evidence that p.d. was treated like current. Only 6 students (12%)

279
saw that the p.d. across the switch in open circuit was 3V, equal to the battery voltage (see
Table 6.18). With Cohort 1, 26% had answered correctly - a difference which while not
significant (p-value = 0.07) still shows Cohort 2 being more confused than Cohort 1. A
majority of students in both cohorts expected a p.d. when a current was flowing, but no
p.d. when the current was zero.
Prediction Frequency Percentage
0 43 88%
3V 6 12%
Total 49 100.0%
Table 6.18: Frequency of answers to Qn 17b(ii)
6.2.4 Summary of the results in the pre-test
The performance of Cohort 2 on the pre-test was very similar to that shown by
Cohort 1. There was evidence that questions which were difficult to answer by Cohort 1,
were also found difficult by Cohort 2. Moreover, when the results were examined in
detail, similarities between cohorts were seen in the following aspects:
• Cohort 2 showed similar confused views as Cohort 1 regarding whether charges are
present only within the battery, coming out when the circuit is complete, or whether
charges reside everywhere in the circuit even before closing it;
• students in both cohorts had views consistent with either conservation or attenuation of
current. There was a marginal difference noted between cohorts, with more of Cohort 2
tending to use attenuation;
• in dealing with resistance, models common with Cohort 1 were also common with
Cohort 2. Students had views consistent with the R-TAKE, SHARE and BAT models;
• a similar proportion of students in both cohorts had problems with attributing the same
p.d. to equivalent points. Similar problems were shown when students did not
acknowledge zero p.d. across ideal connecting wires;
• a similar percentage of both cohorts treated p.d. like current, splitting it at junctions;
• similarity was also shown in the percentage of students expecting no p.d. when no
current was flowing, with the performance of Cohort 2 being marginally worse.

280
Significant differences, with Cohort 2 resulting as the weaker group, were
observed in:
• the percentage of students conserving current within a parallel branch (p-value = 0.02);
• the percentage of students answering to ‘increasing R , reduces the current’ in Qn5 and
Qn7 (p-value = 0.04);
• the percentage of students giving unclassified explanations to questions related to the
p.d. across equal and unequal series resistors.
The evidence shows that Cohort 2 performed slightly worse than Cohort 1 at the
pre-test stage. Much work was evidently needed through the course to help students
understand key concepts. Revised, as well as new teaching activities were thus used as
tools to promote learning. This is further discussed in the next sub-section.
6.3 Additional teaching activities used with Cohort 2
6.3.1 Introduction
While the additional teaching activities used with Cohort 1 were deemed
beneficial for student understanding, yet responses in tests and interviews, as well as in
class discussions with Cohort 1 had shown that more could be done. Reflections on results
with Cohort 1 helped in deciding what activities to use with Cohort 2. Some activities
used in the previous year were kept, others were slightly revised and new ones were
introduced. The aim was of helping students to become more meta-cognitively aware of
their doubts, improving their understanding through deeper reflection.
6.3.2 Revising the static electricity course
It was important to give students in Cohort 2, like Cohort 1, the opportunity of
making the macro-micro link (Eylon & Ganiel, 1990; Licht, 1991; Viennot & Rainson,
1992) by revising the static electricity course. This had been covered by students in their
first year at the college. Lessons were conducted once a week during tutorials (see section
3.8.8) running in parallel with 2 other lesson periods per week covering course work.

281
6.3.3 Circuit diagram representation
During all lessons, especially at the start of the teaching unit, I was careful not to
introduce an arrow next to the battery, on any circuit diagram. Students in Cohort 1 had
made it evident that an arrow drawn near the battery gave them the impression that current
comes out of the battery, like water from a tap. To indicate electron flow, the circuit was
drawn as shown in Figure 6.1. Conventional current was drawn with the arrow reversed.
Figure 6.1: Electron flow in an electric circuit
This measure was taken to encourage students not to think along the very
common idea of having the electrons only in the battery at the start, moving out of it when
the circuit is switched on. I was careful to reduce the chance of having teaching become a
source of unhelpful models. (Niedderer, 1994, 1996; Duit et al., 1985).
6.3.4 The ‘electron experience’ task
6.3.4.1 Setting the task
Chronologically, this task was set for students to tackle, early through the
course, about two weeks after the pre-test had been administered and just before the idea of
current conservation was introduced. Students were shown a diagram of a simple electric
circuit and asked to “describe the way a circuit works in terms of the experience of a
specific electron” (Taber et al., 2006, p. 158). The aim of this exercise was to make
students “reflect on their own thinking in more depth” (Prain & Hand, 1999, p.156), as
they put their ideas in writing, before they could be influenced and possibly just accept
without thinking, any ideas presented by others.
After collecting students’ written material, some of the writing was read out to
the class, emphasizing the different ideas which had been exposed. A class discussion then
electrons

282
followed, so that students’ mental models of the electric circuit at work could be reflected
upon, creating the possibility for students who did not hold the scientific view, to hear it
from their peers. This discussion also made it possible for students to become aware of the
existence of models of the electric circuit other than their own (Coll et al., 2005).
6.3.4.2 The results of the task
Table 6.19 shows details which students used or referred to in their writing
which, together with the pre-test results, indicate how students viewed the mechanism of
the electric circuit at work.
Details / expressions used in explanations Number of
students
Used an arrow to indicate electron movement correctly 4
Used an arrow to indicate a current from negative to positive 3
Used an arrow on the diagram to show the conventional current 28
‘The electron moves/ leaves/ comes from the negative to the positive terminal’ 25
‘The electron leaves the battery’ 5
‘There is an electron flow from positive to negative’ 10
‘The electron opposes the current’ 2
‘The electron needs energy to leave the battery’ 4
‘The closed circuit charges the electron’ 3
‘The battery provides a push’ 3
‘Arriving near R, the electron velocity is reduced/slows down’ 14
‘The electron flow decreases because of R, and the current is less’ 5
‘The flow stops if R is too big’ 3
‘The electron loses charge in passing through R’ 3
‘The electron loses energy in passing through R’ 16
‘R reduces the power of the electron’ 1
‘The electron moves from a point at one potential to one at a different
potential’ 4
‘The electron moves due to the p.d. experienced’ 2
‘The electron is repelled from the negative terminal and attracted to the
positive terminal’ (a description in terms of an electric field with the
possibility of students not necessarily ‘seeing’ the field)
5
Table 6.19: Students’ ways of explaining the ‘electron experience’

283
The results show that there was a strong tendency for students to look at the
electron as starting at the battery. Only 3 students mentioned the battery push experienced
by the electron. There was also a tendency to describe a decrease in electron flow after the
current passes through R, indicating sequential reasoning (Licht, 1991; McDermott &
Shaffer, 1992; McDermott & van Zee, 1985; Millar & King, 1993; Shipstone, 1984,
1985b). Three students said that the electron loses charge, perhaps implying electron
absorption by the resistor. A good number of 16 students referred to the energy lost by the
electron in passing through R. Only 6 students mentioned potential and p.d. in their
explanations, and 5 students mentioned the repulsive and attractive forces experienced by
the electron. This description implies the presence of an electric field guiding electron
flow, but as has been explained in section 5.7, one cannot be sure of whether the students
were ‘seeing’ this field or just recalling a reason which they had heard of or used before,
for the electron movement. Much of students’ views described in this task had also been
indicated during the interviews with Cohort 1.
6.3.4.3 Reflections after class discussion
Students’ discussions and the written descriptions made it clear that at secondary
level students had been indoctrinated with the phrase: ‘the current is the same everywhere
in a simple circuit’. Some students recalled and used this phrase, but still imagined that
either a smaller number of electrons come out of the resistor, or that charge is absorbed or
lost within the resistor. Students’ recall was not equivalent to students’ understanding.
On the other hand there were some students who not only spoke of current
conservation, but who gave reasons for it, describing it using analogies. One student
compared current flow to traffic flow, thus:
‘If you have electrons flowing, it is just like traffic. If you stop at the front, all
the traffic is affected, not just the part at one end. The velocity of the electrons
is reduced, but not because it is reduced within the resistor. It is reduced at
switch on, at the start, choosing any electron at any point.’
The discussion was guided by the teacher/researcher. Conflicts arose, urging
further discussion. Students were given a chance to realize that their ideas were not always
compatible with the scientific view.
This exercise was not expected to immediately change students’ views towards
what is scientific. However, some common unhelpful ideas had been exposed and students
were thus given a possibility of becoming meta-cognitively aware of their understanding,

284
or the lack of it. Students may have been encouraged to think in terms of current
conservation. Moreover, the exercise may have been instrumental in helping to counteract
the common use of the BAT model (same battery, same current), shown to be popular with
both cohorts.
6.3.5 Differentiating between current and p.d.
The data collected in the previous year had supported findings from other studies
in the literature that many students think that p.d. cannot exist without current flow. This
was also supported by the results of the pre-test with Cohort 2. An example relating to
current flow and the establishment of a p.d. across components in an R-C circuit was thus
worked out with the student sample (see Figure 6.2). Students were directed to ponder on
how the p.d. across the resistor and the capacitor change, as the capacitor is being charged.
The example was clear in pointing out that p.d. exists across the fully charged capacitor,
even though no current flows through the circuit at that time. It was thought that this might
help students to differentiate p.d. from current.
(i) Calculate the value of the current within the circuit when S is just switched ON.
(ii) Explain how the p.d. across the resistor and the capacitor change as the capacitor is
being charged.
(iii) After a very long time, what will be the value of the current within the circuit?
Figure 6.2: R-C circuit question used to help differentiate p.d. from current
6.3.6 The DVD and the PowerPoint presentation
The DVD material (see section 3.6.4.1) referring to static and current electricity
used with Cohort 1 was also used with Cohort 2. The PowerPoint presentation was also
shown to the students in a slightly revised form with more slides added (see Appendix 7
R
2V
S
C
285
for the final revised version of the PowerPoint presentation). The aim of this presentation
was to help the students link concepts in current electricity to other topics in physics,
through the use of analogies. More models and analogies were introduced to help
students’ understanding and class discussion was encouraged.
The DVD and PowerPoint presentation were now used mid-way through the
course, rather than at the end of it as had been done with Cohort 1, thus allowing more time
till the end of the course, for students to reflect on what they had seen and discussed as the
teaching was in progress.
6.3.7 PhET simulations
Simulations from the website of the PhET project (Physics Education
Technology, 2008) of the University of Colorado were used in class, throughout the
course, to help clarify students’ ideas. The Circuit Construction Kit (CCK) was used to
provide an animated view of the electrons flowing through different closed circuits. Such
representations are seen as useful (Urban-Woldron, 2008) in trying to reduce students’
misconceptions due to abstract concepts. These simulations are freely available and the
students were encouraged to use them further during their study, as they reflected about
their work and to help solve their qualitative reasoning doubts, if and when these arose.
6.4 The post-test results
6.4.1 Introduction
After the teaching of current electricity with Cohort 2, including the additional
teaching activities, it was hoped that an improvement would be shown in students’
performance on the post-test. Students’ mental models were expected to have improved
since the pre-test stage. In general, Cohort 2 was expected to perform at least at a similar
level compared to Cohort 1 at this stage, even if with the help from the new teaching
activities used, more was expected of this group.
More specifically, more students were expected to have a clearer idea of the
electric circuit working as a system, comparing current flow to a bicycle chain effect.
Moreover, students were expected to have moved on from their intuitive view of ‘same
battery, same current’ model (the BAT model). A better visualization was expected from
students of how resistance controls the battery push, and of the meaning of p.d. This

286
should have been helped by the analogies that were introduced and discussed during the
PowerPoint presentation.
The following sections focus on providing evidence which shows that while
Cohort 2 improved in some aspects, yet more had been expected.
6.4.2 Persistent difficulties with microscopic views
The results in Table 6.20 were compared with those of Cohort 1 (see Table
4.49). The difference was insignificant (p-value = 0.64), between the 19 students (39%) of
Cohort 2, and the 34% of Cohort 1,who still incorrectly but consistently saw electrons in
the battery only, before the circuit is connected.
Qn4(d)
Correct Incorrect
Total
Correct 15* 5 20
Incorrect 9 19 28 Qn4(a)
missing 0 1 1
Total 24 25 49
Table 6.20: Results of Qn 4(a) and Qn 4(d) on the post-test
The difference was again not significant (p-value = 0.62) in Qns 4(c) and 4(f)
(see Table 6.21), between the 21 students (43%) in Cohort 2 and the 48% in Cohort 1 (see
Table 4.50) who ‘saw’ the circuit as one system with charges moving everywhere and
together in the post-test.
Qn4(f)
Correct Incorrect
Total
Correct 21* 16 37 Qn4(c)
Incorrect 2 10 12
Total 23 26 49
Table 6.21: Results for Qn 4(c) and Qn 4(f) on the post-test
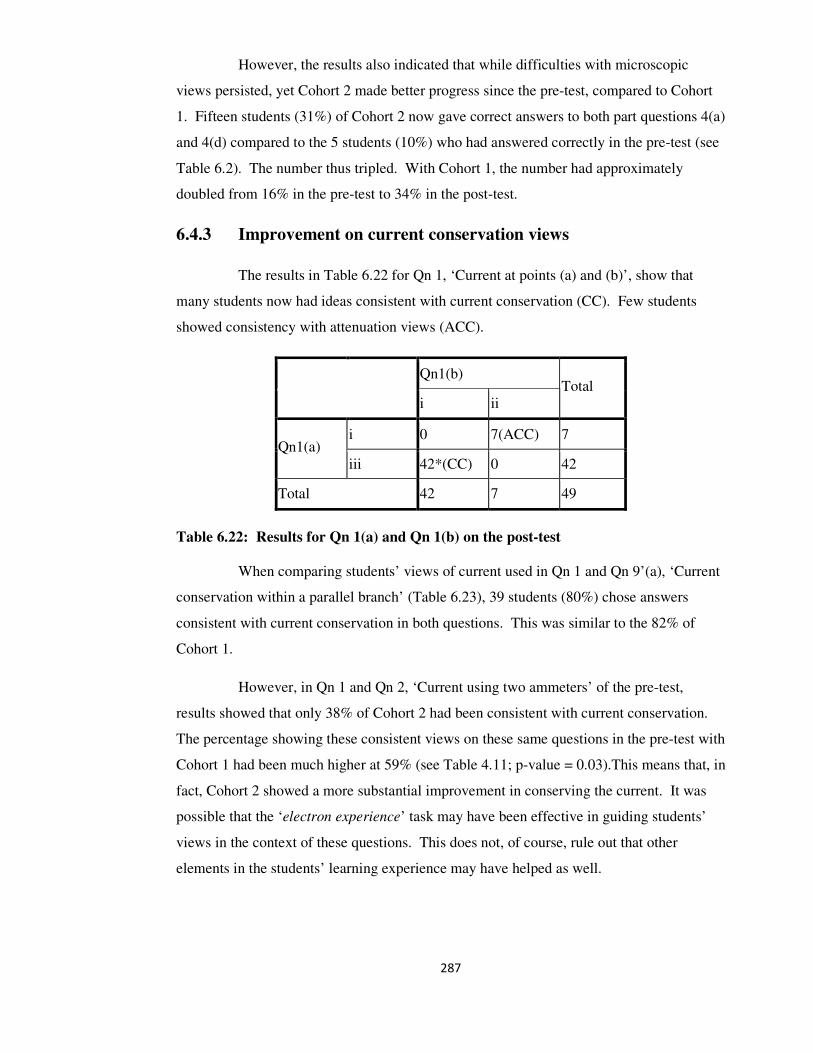
287
However, the results also indicated that while difficulties with microscopic
views persisted, yet Cohort 2 made better progress since the pre-test, compared to Cohort
1. Fifteen students (31%) of Cohort 2 now gave correct answers to both part questions 4(a)
and 4(d) compared to the 5 students (10%) who had answered correctly in the pre-test (see
Table 6.2). The number thus tripled. With Cohort 1, the number had approximately
doubled from 16% in the pre-test to 34% in the post-test.
6.4.3 Improvement on current conservation views
The results in Table 6.22 for Qn 1, ‘Current at points (a) and (b)’, show that
many students now had ideas consistent with current conservation (CC). Few students
showed consistency with attenuation views (ACC).
Qn1(b)
i ii
Total
i 0 7(ACC) 7 Qn1(a)
iii 42*(CC) 0 42
Total 42 7 49
Table 6.22: Results for Qn 1(a) and Qn 1(b) on the post-test
When comparing students’ views of current used in Qn 1 and Qn 9’(a), ‘Current
conservation within a parallel branch’ (Table 6.23), 39 students (80%) chose answers
consistent with current conservation in both questions. This was similar to the 82% of
Cohort 1.
However, in Qn 1 and Qn 2, ‘Current using two ammeters’ of the pre-test,
results showed that only 38% of Cohort 2 had been consistent with current conservation.
The percentage showing these consistent views on these same questions in the pre-test with
Cohort 1 had been much higher at 59% (see Table 4.11; p-value = 0.03).This means that, in
fact, Cohort 2 showed a more substantial improvement in conserving the current. It was
possible that the ‘electron experience’ task may have been effective in guiding students’
views in the context of these questions. This does not, of course, rule out that other
elements in the students’ learning experience may have helped as well.
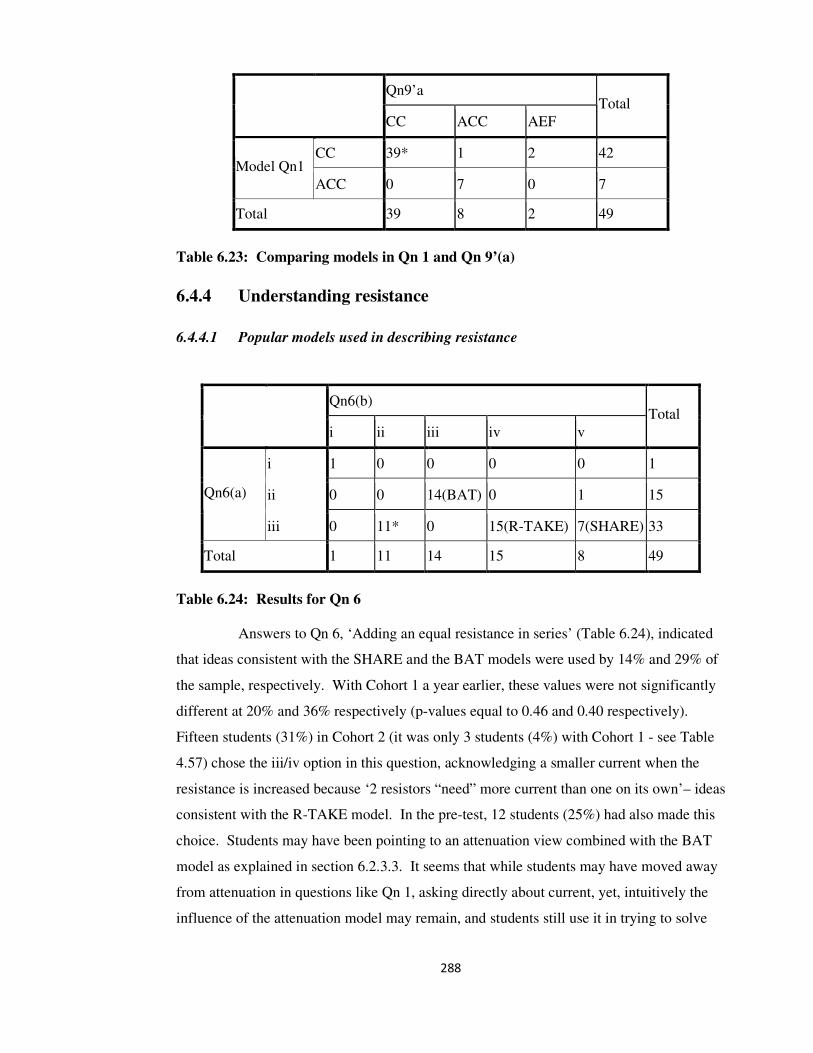
288
Qn9’a
CC ACC AEF
Total
CC 39* 1 2 42 Model Qn1
ACC 0 7 0 7
Total 39 8 2 49
Table 6.23: Comparing models in Qn 1 and Qn 9’(a)
6.4.4 Understanding resistance
6.4.4.1 Popular models used in describing resistance
Qn6(b)
i ii iii iv v
Total
i 1 0 0 0 0 1
ii 0 0 14(BAT) 0 1 15 Qn6(a)
iii 0 11* 0 15(R-TAKE) 7(SHARE) 33
Total 1 11 14 15 8 49
Table 6.24: Results for Qn 6
Answers to Qn 6, ‘Adding an equal resistance in series’ (Table 6.24), indicated
that ideas consistent with the SHARE and the BAT models were used by 14% and 29% of
the sample, respectively. With Cohort 1 a year earlier, these values were not significantly
different at 20% and 36% respectively (p-values equal to 0.46 and 0.40 respectively).
Fifteen students (31%) in Cohort 2 (it was only 3 students (4%) with Cohort 1 - see Table
4.57) chose the iii/iv option in this question, acknowledging a smaller current when the
resistance is increased because ‘2 resistors “need” more current than one on its own’– ideas
consistent with the R-TAKE model. In the pre-test, 12 students (25%) had also made this
choice. Students may have been pointing to an attenuation view combined with the BAT
model as explained in section 6.2.3.3. It seems that while students may have moved away
from attenuation in questions like Qn 1, asking directly about current, yet, intuitively the
influence of the attenuation model may remain, and students still use it in trying to solve

289
problems related to other concepts. This idea may be linked with the fact that
understanding does not develop linearly in all areas in a topic like this, where some
concepts are hierarchically more difficult than others. Sometimes students start from a
lower base-line again before they can accommodate a new concept (Welzel, 1997, 1998).
6.4.4.2 Confirming the popular use of the BAT model
In the post-test with Cohort 1, the BAT model had been proposed as one of the
possibilities which may hinder students’ learning about resistance. With Cohort 1, 22
students (36%; see Table 4.61) had ideas consistent with the BAT model on the post-test in
Qn 8, ‘Adding an equal resistance in parallel’. With Cohort 2, 14 students (29%) had the
same ideas (Table 6.25).This difference between cohorts was not significant (p-value =
0.40) indicating that, in spite of having dealt with the ‘electron experience’ task which also
touched ideas related to this unhelpful model, the BAT model remained popular with
students of Cohort 2.
Qn8(b)
i ii iii
Total
i 0 17* 1 18
ii 0 8 14 (BAT) 22 Qn8(a)
iii 2 6 1 9
Total 2 31 16 49
Table 6.25: Results for Qn 8 in the post-test
Moreover, 13 students (27%) used views which were consistent with the BAT
model in both Qn 6, ‘Adding an equal resistance in series’ and Qn8, ‘Adding a resistance
in parallel’. This confirms the popular use of this model by students, manifesting the
difficulty students find to move away from it (see Table 6.26).

290
Model Qn8 (post-test)
SCI(R) BAT
I↓ the more
resistive
components
U
Total
SCI(R) 6* 0 1 4 11
ACC 6 4 0 5 15
SHARE 5 1 1 0 7
BAT 0 13 0 1 14
Model Qn6
(post-test)
U 0 2 0 0 2
Total 17 20 2 10 49
Table 6.26: Models for Qn 6 and Qn 8 in the post-test
6.4.5 Effect of the additional teaching activities on the understanding
of p.d.
As has been explained earlier in this chapter, teaching activities especially
geared to help students understand p.d. had been conducted with Cohort 2 during the
course (see section 6.3). After making the extra effort, students did not show the expected
progress in all questions probing this concept.
6.4.5.1 P.d. across resistors connected in parallel
When students dealt with equal or unequal resistances connected in parallel with
the battery, in Qns 15 and 16, slightly more than half the sample, 53%, (see Table 6.27),
answered correctly to both questions. With Cohort 1, 44% of the sample (see Table 4.69)
had done the same at this stage. These percentages only show a marginal difference
between cohorts (p-value = 0.34), with Cohort 2 performing slightly better. However, with
only 10 students (20%; see Table 6.28) in Cohort 2 having answered both questions
correctly in the pre-test, compared to 21 students (34%) from Cohort 1 (see Table 4.42),
the progress of Cohort 2 was evidently better.

291
Model Qn16 (post-test)
SCI(C) SCI(D) p.d.FLOW(I) Missing
explanation U
Total
SCI(C)
(scientific:
causal)
3* 3* 1 0 0 7
SCI(D)
(scientific:
difference)
1* 19* 2 1 1 24
p.d.FLOW(I)
p.d. viewed
as current
0 2 9 1 3 15
Missing
explanation 0 0 0 1 1 2
Model
Qn15
(post-test)
U 0 0 0 0 1 1
Total 4 24 12 3 6 49
Table 6.27: Models for Qn 15 and Qn 16 in the post-test
Model Qn16 (pre-test)
Correct Incorrect
Total
Correct 10* 12 22 Model Qn15
(pre-test) Incorrect 0 27 27
Total 10 39 49
Table 6.28: Models for Qn 15 and Qn 16 on the pre-test
It must be emphasised that both these questions did not suggest any change to
the circuit presented. Students had to just ‘see’ equivalent points with the same p.d. across
them. Indeed, as soon as the question suggested a change being made to the original
circuit, the change acted as a distractor and the performance dropped.
6.4.5.2 P.d. when changes were made to the circuit
In Qn 18, ‘p.d. across a resistor, adding another resistor in parallel’ (Figure
4.23), the change distracted the students. Many focussed mainly on the change and not on
the constant p.d. across equivalent points. Ten students (20%) seemed to treat p.d. like
current, choosing options related to sharing of p.d. between parallel branches (Table 6.29).
Cohort 1 results were similar – 12% of the cohort indicated the same idea. The difference

292
in percentages was not significant (p-value = 0.20), with Cohort 2 performing marginally
worse than Cohort 1.
Qn18(b)
i ii iii
Total
i 2 0 2 4
ii 1 32* 2 35 Qn18(a)
iii 10 0 0 10
Total 13 32 4 49
Table 6.29: Answers to Qn 18
6.4.5.3 Common unhelpful views of p.d.
In spite of the teaching, the problems which Cohort 2 had with understanding
p.d. were made evident at the post-test stage when a surprising level of confusion was
shown in Qn 12’ (Figure 4.21). Only 14 students (29%) answered correctly to zero p.d.
across connecting wires (see Table 6.30). Moreover, in part (a), predicting p.d. across
equivalent points to voltmeter terminals, only 37% gave correct answers. This was
significantly different (p-value < 0.0002) from the 82% correct answers with Cohort 1 (see
section 4.5.6.2). Furthermore, Cohort 2 showed a slight regression on the pre-test
performance, when 43% had answered correctly at that time. It seems that the p.d. concept
was still not understood by the majority of students in Cohort 2. It is always tough
covering the course work in a limited time and students may have shown that they needed
more time to reflect on the work done.
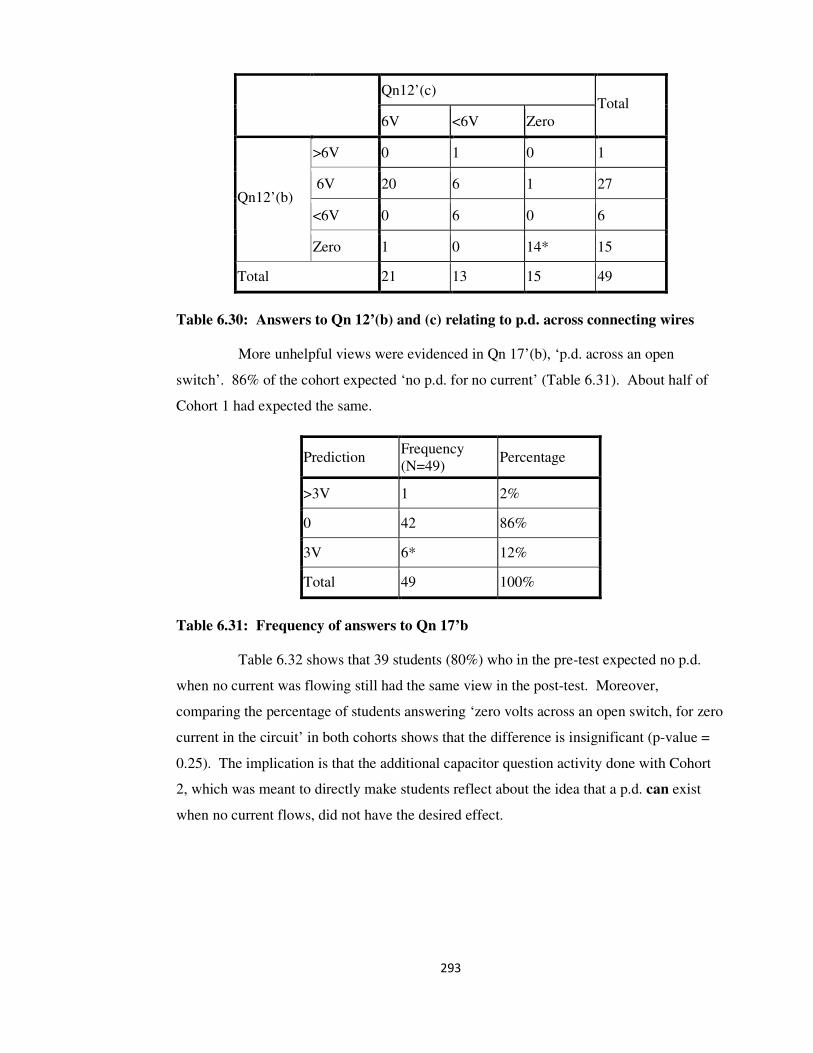
293
Qn12’(c)
6V <6V Zero
Total
>6V 0 1 0 1
6V 20 6 1 27
<6V 0 6 0 6
Qn12’(b)
Zero 1 0 14* 15
Total 21 13 15 49
Table 6.30: Answers to Qn 12’(b) and (c) relating to p.d. across connecting wires
More unhelpful views were evidenced in Qn 17’(b), ‘p.d. across an open
switch’. 86% of the cohort expected ‘no p.d. for no current’ (Table 6.31). About half of
Cohort 1 had expected the same.
Prediction Frequency
(N=49) Percentage
>3V 1 2%
0 42 86%
3V 6* 12%
Total 49 100%
Table 6.31: Frequency of answers to Qn 17’b
Table 6.32 shows that 39 students (80%) who in the pre-test expected no p.d.
when no current was flowing still had the same view in the post-test. Moreover,
comparing the percentage of students answering ‘zero volts across an open switch, for zero
current in the circuit’ in both cohorts shows that the difference is insignificant (p-value =
0.25). The implication is that the additional capacitor question activity done with Cohort
2, which was meant to directly make students reflect about the idea that a p.d. can exist
when no current flows, did not have the desired effect.

294
Qn17b(ii) (pre-test)
0 3V*
Total
>3V 0 1 1
0 39 3 42 Qn17’(b)
(post-test)
3V* 4 2 6
Total 43 6 49
Table 6.32: Performance on part Qn 17: ‘p.d. across an open switch’
6.4.6 Summary of the post-test results
In dealing with microscopic views, while better progress since the pre-test was
detected with Cohort 2 when compared to Cohort 1, yet only less than half of Cohort 2
consistently saw the current as the movement of charges present in all parts of the circuit.
No significant difference was found in the number of students in both cohorts
using ideas consistent with current conservation at the post-test stage. However,
comparing results to the pre-test showed a more substantial improvement by Cohort 2, in
the shift students made towards current conservation.
In questions about resistance, there were no significant differences between
cohorts, in students’ use of ideas consistent with the SHARE, BAT and R-TAKE models.
This was in spite of the additional teaching activities conducted with Cohort 2. It was
interesting to observe that some students, who had moved to conservation from the
attenuation view in questions asking directly about current, still seemed to apply
attenuation within the R-TAKE model when answering questions about resistance.
Students did not show the expected progress in all questions probing p.d. While
progress was noted in answers directly predicting p.d. across parallel resistors, when no
changes were made to the circuit in question, yet, some students still split the p.d. between
branches, applying ideas about current at junctions, to p.d.
In Qn 18, for 20% of the students, the changes within a parallel branch took
priority over the idea of p.d. remaining the same across equivalent points. A regression in
performance was noted in Qn12’(a), predicting the voltmeter reading across equivalent
points, thus showing students confusion with the concept of p.d. even after teaching.

295
Only 12% of Cohort 2 saw p.d. without the presence of a current in Qn 17’(b).
Many students in both cohorts kept the mistaken idea of ‘no current, no p.d.’, with no
significant difference in performance between cohorts. Moreover, no progress was shown
on this question by Cohort 2 since the pre-test. Even when the capacitor question task had
been used specifically to try and correct this difficulty, it seems that using the activity once
was not enough to provide the desired effect.
These results indicated that students’ ideas had neither advanced at the same
pace in all areas, nor within the same area in different contexts. This is somewhat what is
expected while learning is taking place.
6.5 Analysis of the delayed post-test results
6.5.1 Introduction
The delayed post-test was answered by students a month after the post-test, as
with Cohort 1. Cohort 2 not only indicated good knowledge retention since the post-test
stage, but also showed progress in understanding related to ideas about current and
resistance. There was also some improvement related to p.d. but this was not linear in all
questions. The sub-sections below refer to details which show changes in students’
progress since the post-test. Like the result with Cohort 1, students seemed to show more
progress in understanding now, rather than at the post-test stage. Students were close to
sitting for a national exam in physics and were thus more conscious of the need for them to
study.
6.5.2 Where do charges reside?
Dealing with microscopic views, while more students answered correctly in Qn
4 at this stage (see Tables 6.33 and 6.34 and Tables 6.20 and 6.21 to compare), there was
evidence of confusion shown from a good number of students. These students did not
move away from the model of charge flowing out of the battery on connecting the circuit.
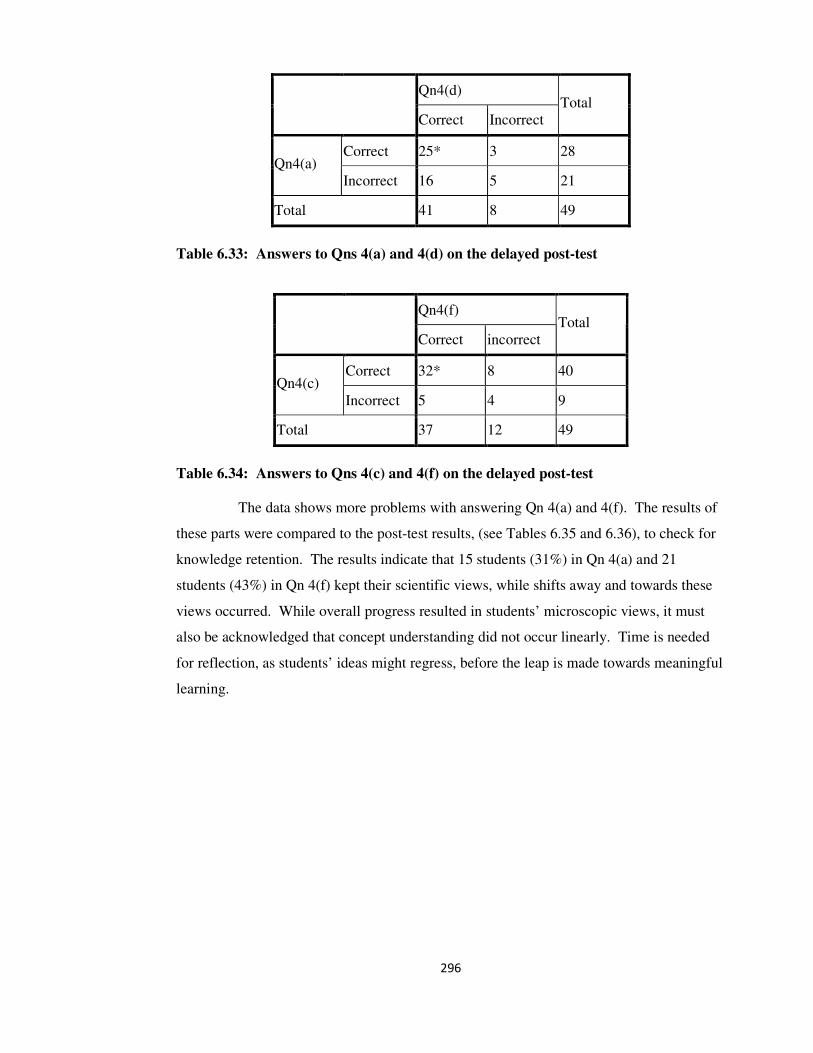
296
Qn4(d)
Correct Incorrect
Total
Correct 25* 3 28 Qn4(a)
Incorrect 16 5 21
Total 41 8 49
Table 6.33: Answers to Qns 4(a) and 4(d) on the delayed post-test
Qn4(f)
Correct incorrect
Total
Correct 32* 8 40 Qn4(c)
Incorrect 5 4 9
Total 37 12 49
Table 6.34: Answers to Qns 4(c) and 4(f) on the delayed post-test
The data shows more problems with answering Qn 4(a) and 4(f). The results of
these parts were compared to the post-test results, (see Tables 6.35 and 6.36), to check for
knowledge retention. The results indicate that 15 students (31%) in Qn 4(a) and 21
students (43%) in Qn 4(f) kept their scientific views, while shifts away and towards these
views occurred. While overall progress resulted in students’ microscopic views, it must
also be acknowledged that concept understanding did not occur linearly. Time is needed
for reflection, as students’ ideas might regress, before the leap is made towards meaningful
learning.

297
Qn4(a)
(delayed post-test)
Correct Incorrect
Total
Correct 15* 5 20
Incorrect 12 16 28 Qn4(a)
(post-test)
missing 1 0 1
Total 28 21 49
Table 6.35: Comparing answers to Qn 4(a) on the post-test and delayed post-test
Qn4(f)
(delayed post-test)
Correct Incorrect
Total
Correct 21* 2 23 Qn4(f)
(post-test) Incorrect 16 10 26
Total 37 12 49
Table 6.36: Comparing answers to Qn 4(f) on the post-test and delayed post-test
6.5.3 Current conservation and attenuation models
More students than in the post-test now conserved the current in a simple circuit
(see Table 6.37).
Qn1
(delayed post-test)
CC ACC
Total
CC 42* 0 42 Qn1
(post-test) ACC 3 4 7
Total 45 4 49
Table 6.37: Comparing Qn 1 - ‘Current at points a and b’ on the post- and delayed
post-test
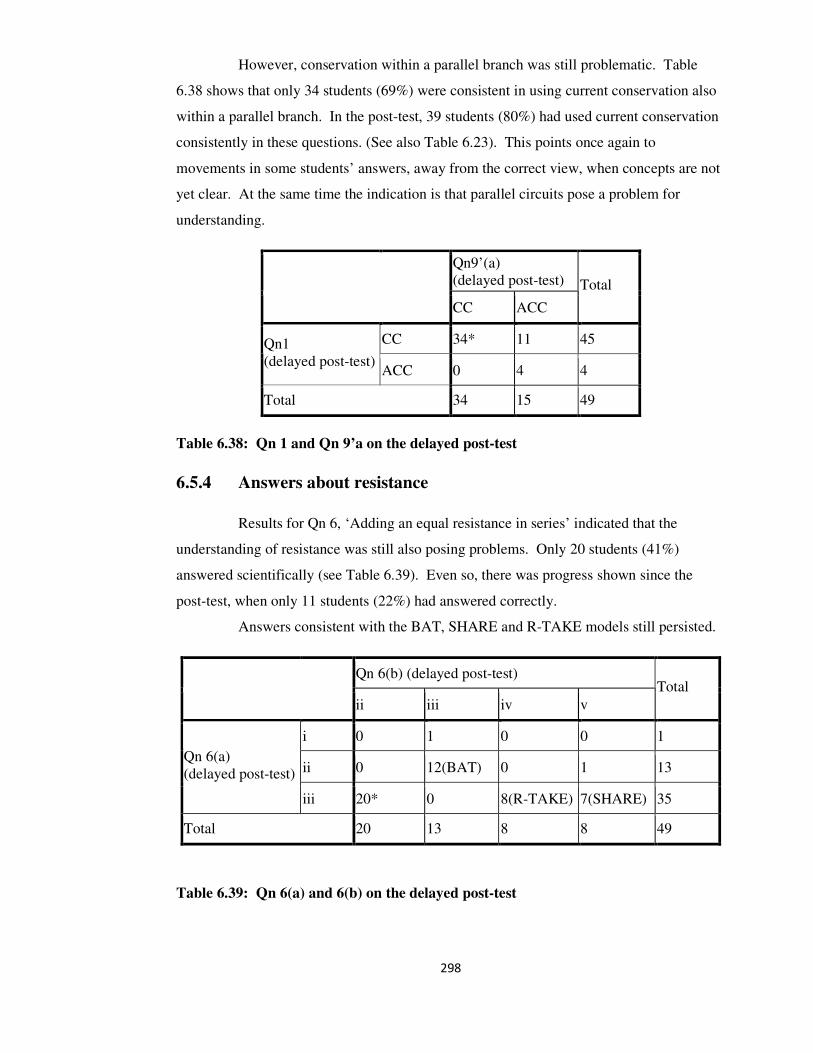
298
However, conservation within a parallel branch was still problematic. Table
6.38 shows that only 34 students (69%) were consistent in using current conservation also
within a parallel branch. In the post-test, 39 students (80%) had used current conservation
consistently in these questions. (See also Table 6.23). This points once again to
movements in some students’ answers, away from the correct view, when concepts are not
yet clear. At the same time the indication is that parallel circuits pose a problem for
understanding.
Qn9’(a)
(delayed post-test)
CC ACC
Total
CC 34* 11 45 Qn1
(delayed post-test) ACC 0 4 4
Total 34 15 49
Table 6.38: Qn 1 and Qn 9’a on the delayed post-test
6.5.4 Answers about resistance
Results for Qn 6, ‘Adding an equal resistance in series’ indicated that the
understanding of resistance was still also posing problems. Only 20 students (41%)
answered scientifically (see Table 6.39). Even so, there was progress shown since the
post-test, when only 11 students (22%) had answered correctly.
Answers consistent with the BAT, SHARE and R-TAKE models still persisted.
Qn 6(b) (delayed post-test)
ii iii iv v
Total
i 0 1 0 0 1
ii 0 12(BAT) 0 1 13 Qn 6(a)
(delayed post-test)
iii 20* 0 8(R-TAKE) 7(SHARE) 35
Total 20 13 8 8 49
Table 6.39: Qn 6(a) and 6(b) on the delayed post-test

299
When the models consistent with students’ answer choice in the post- and
delayed post-test were compared (see Table 6.40), one could see that only 7 students had
kept both the resistance and the battery in mind, working together (the SCI(R) model), as
they answered:
‘The battery cannot push as big a current through two resistors.’
There was a bigger shift towards the scientific model than away from it. Of the
20 students who now answered correctly, 13 had changed from their previous alternative
views of R-TAKE, SHARE and BAT. The BAT model was held on to by 7 students
(14%), who confirmed the difficulty some students find in moving away from this model,
having a strong conviction of the ‘same battery, same current’ view.
Model Qn6 (delayed post-test)
SCI(R) R-TAKE SHARE BAT U
Total
SCI(R) 7* 1 0 2 1 11
R-TAKE 6 2 5 1 1 15
SHARE 4 2 1 0 0 7
BAT 3 3 1 7 0 14
Model
Qn6
(post-test)
U 0 0 0 2 0 2
Total 20 8 7 12 2 49
Table 6.40: Comparing models in Qn 6 on the post- and delayed post-test
Further proof of this was Qn 8, ‘Connecting an equal R in parallel’.
Approximately 1/3 of the sample (13 students; 27%) gave answers consistent with the BAT
model (Table 6.41).
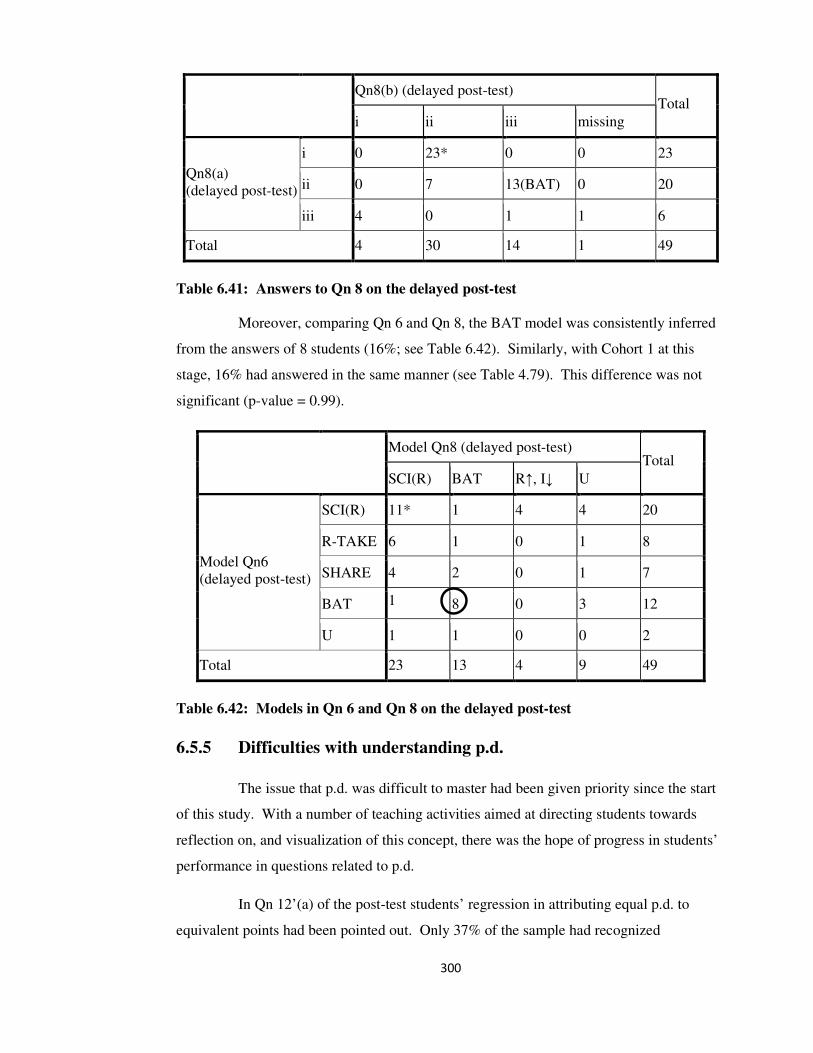
300
Qn8(b) (delayed post-test)
i ii iii missing
Total
i 0 23* 0 0 23
ii 0 7 13(BAT) 0 20 Qn8(a)
(delayed post-test)
iii 4 0 1 1 6
Total 4 30 14 1 49
Table 6.41: Answers to Qn 8 on the delayed post-test
Moreover, comparing Qn 6 and Qn 8, the BAT model was consistently inferred
from the answers of 8 students (16%; see Table 6.42). Similarly, with Cohort 1 at this
stage, 16% had answered in the same manner (see Table 4.79). This difference was not
significant (p-value = 0.99).
Model Qn8 (delayed post-test)
SCI(R) BAT R↑, I↓ U
Total
SCI(R) 11* 1 4 4 20
R-TAKE 6 1 0 1 8
SHARE 4 2 0 1 7
BAT 1 8 0 3 12
Model Qn6
(delayed post-test)
U 1 1 0 0 2
Total 23 13 4 9 49
Table 6.42: Models in Qn 6 and Qn 8 on the delayed post-test
6.5.5 Difficulties with understanding p.d.
The issue that p.d. was difficult to master had been given priority since the start
of this study. With a number of teaching activities aimed at directing students towards
reflection on, and visualization of this concept, there was the hope of progress in students’
performance in questions related to p.d.
In Qn 12’(a) of the post-test students’ regression in attributing equal p.d. to
equivalent points had been pointed out. Only 37% of the sample had recognized
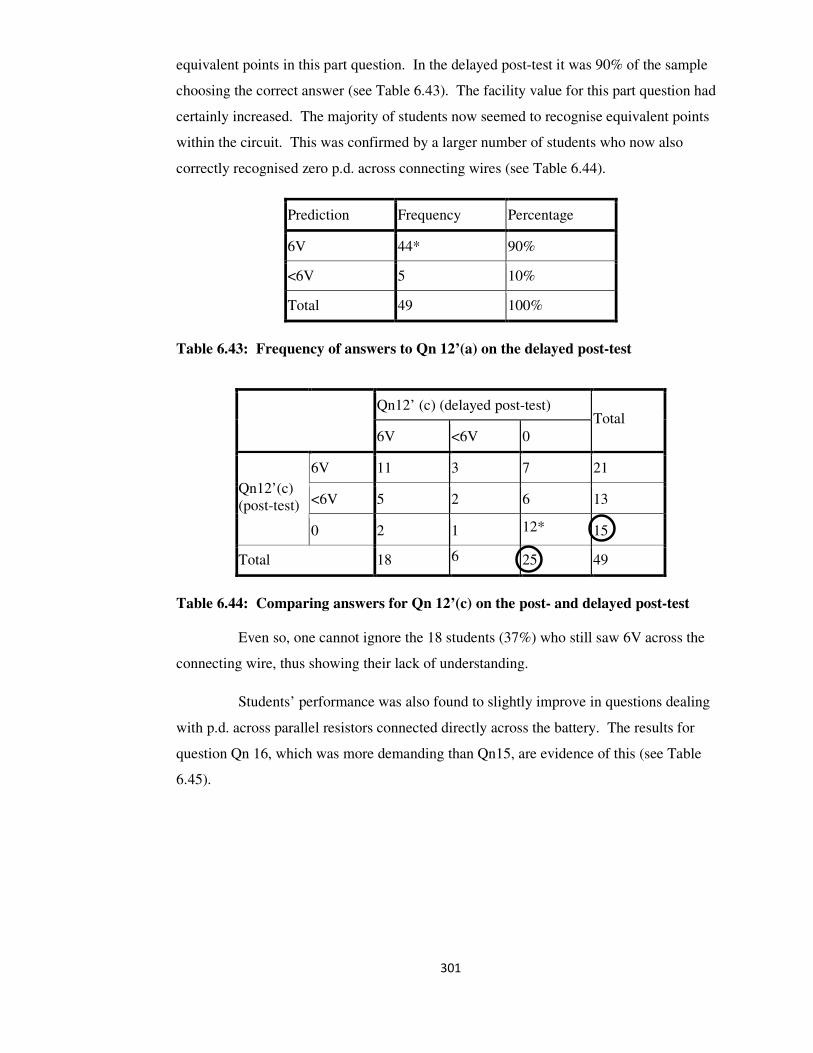
301
equivalent points in this part question. In the delayed post-test it was 90% of the sample
choosing the correct answer (see Table 6.43). The facility value for this part question had
certainly increased. The majority of students now seemed to recognise equivalent points
within the circuit. This was confirmed by a larger number of students who now also
correctly recognised zero p.d. across connecting wires (see Table 6.44).
Prediction Frequency Percentage
6V 44* 90%
<6V 5 10%
Total 49 100%
Table 6.43: Frequency of answers to Qn 12’(a) on the delayed post-test
Qn12’ (c) (delayed post-test)
6V <6V 0
Total
6V 11 3 7 21
<6V 5 2 6 13 Qn12’(c)
(post-test)
0 2 1 12* 15
Total 18 6 25 49
Table 6.44: Comparing answers for Qn 12’(c) on the post- and delayed post-test
Even so, one cannot ignore the 18 students (37%) who still saw 6V across the
connecting wire, thus showing their lack of understanding.
Students’ performance was also found to slightly improve in questions dealing
with p.d. across parallel resistors connected directly across the battery. The results for
question Qn 16, which was more demanding than Qn15, are evidence of this (see Table
6.45).
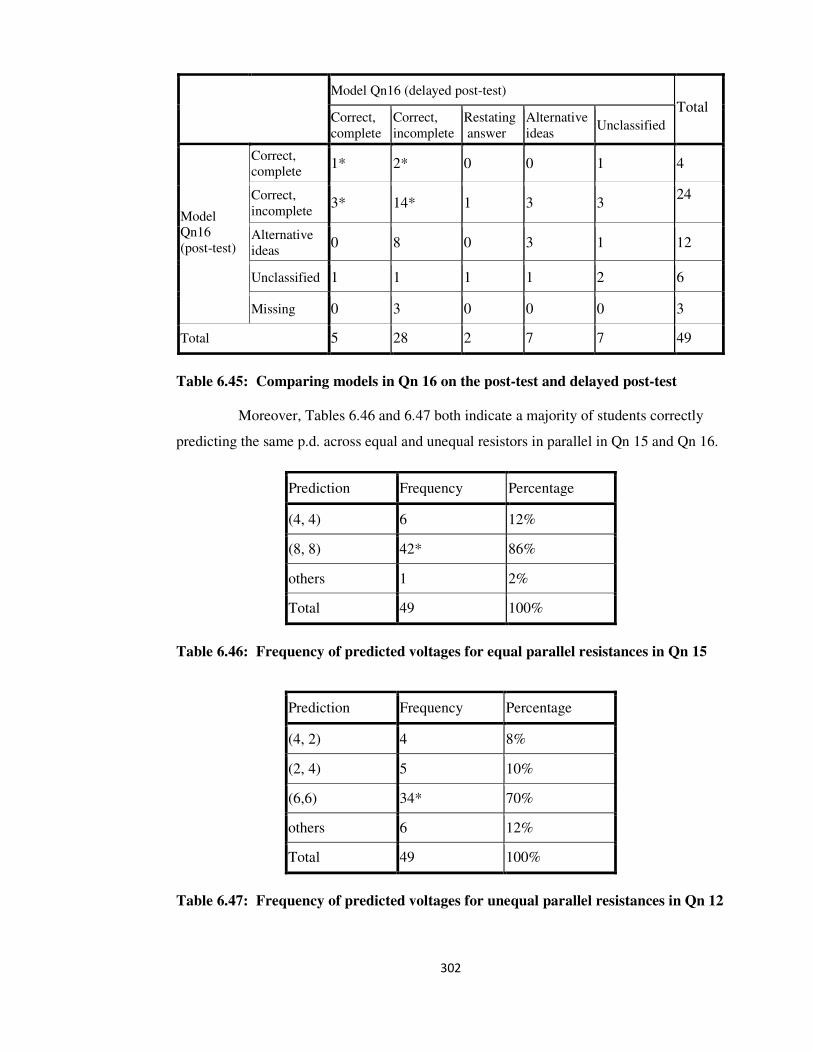
302
Model Qn16 (delayed post-test)
Correct, complete
Correct, incomplete
Restating answer
Alternative ideas
Unclassified
Total
Correct,
complete 1* 2* 0 0 1 4
Correct,
incomplete 3* 14* 1 3 3
24
Alternative
ideas 0 8 0 3 1 12
Unclassified 1 1 1 1 2 6
Model
Qn16 (post-test)
Missing 0 3 0 0 0 3
Total 5 28 2 7 7 49
Table 6.45: Comparing models in Qn 16 on the post-test and delayed post-test
Moreover, Tables 6.46 and 6.47 both indicate a majority of students correctly
predicting the same p.d. across equal and unequal resistors in parallel in Qn 15 and Qn 16.
Prediction Frequency Percentage
(4, 4) 6 12%
(8, 8) 42* 86%
others 1 2%
Total 49 100%
Table 6.46: Frequency of predicted voltages for equal parallel resistances in Qn 15
Prediction Frequency Percentage
(4, 2) 4 8%
(2, 4) 5 10%
(6,6) 34* 70%
others 6 12%
Total 49 100%
Table 6.47: Frequency of predicted voltages for unequal parallel resistances in Qn 12

303
These results also indicate that some students still held on to the view of
voltage/p.d. being split, like current. This unhelpful view of treating p.d. like current
became more evident when students answered Qn17’(b), ‘p.d. across a closed switch’.
Many students (80%) still expected a p.d. only when a current flows. Many of these
students had held the same view at the post-test stage (Table 6.48). Students’ performance
dropped drastically in this question implying major problems related to p.d. in this context.
Qn17’ (b)
(delayed post-test)
0 3V*
Total
>3V 0 1 1
0 36 6 42 Qn17’(b)
(post-test)
3V* 3 3 6
Total 39 10 49
Table 6.48: Comparing answers for Qn 17’(b) on the post- and delayed post-test
6.5.6 Summary of the delayed post-test results
Most students retained the knowledge they had gained regarding microscopic
views. Moreover, more students now saw charges moving everywhere and together.
Most students conserved the current in Qn 1, but regression was evidenced for
current conservation within a parallel branch.
When the effect of increasing a resistance in series was probed in Qn 6, more
students (41%) than in the post-test (22%) now answered correctly. Ideas consistent with
the BAT, SHARE and R-TAKE models were still used, with the BAT model being
predominantly inferred from the answers. Only 7 students had consistently held on to the
scientific meaning of resistance, since the post-test.
A majority of students (90%) now gave correct predictions of the voltmeter
reading across equivalent points. Progress was shown on p.d. predictions across
connecting wires.
Improvement was shown also when dealing with p.d. across parallel resistors,
but about ¼ of the sample still split the p.d. There was proof that a majority of students

304
expected p.d. only in the presence of the current. This seemed a major stumbling block in
students’ understanding of p.d.
6.6 An overview of the performance of Cohort 2 in the
diagnostic tests
6.6.1 Deductions from the diagnostic tests results
The analysis of the answers to the pre-test with Cohort 2 showed that much of
what had been indicated by Cohort 1 was indeed being replicated by Cohort 2. At the
same time, more students from Cohort 2 showed evidence of misconceptions at this stage.
A significantly larger proportion of students in Cohort 2 appeared to hold ideas consistent
with unhelpful models in questions dealing with conservation of current within a parallel
branch, the effect of the resistance in the circuit, and the p.d. across series resistors.
Looking globally at the post-test results it was noted that while the additional
teaching activities used through the course may have helped students’ learning in some
areas, problems still persisted in others. Students progressed more noticeably in questions
probing current. With questions probing resistance, the BAT model (same battery, same
current) remained consistently used by a good number of Cohort 2. Moreover, even if
students had been expected to show progress with problems probing p.d., the failure to
differentiate p.d. from current remained.
The results of the delayed post-test, once again as with Cohort 1, indicated the
improvement made by the students in all areas being probed in their effort to prepare
themselves for the forthcoming fast approaching national exams. However, the problem of
using the same rules that apply to current when thinking of p.d. remained. The problem of
expecting p.d. to be present only when current is present was still very pronounced. The
indication was that p.d. is a harder concept to deal with and understand, especially when a
p.d. exists without current flow, as in Qn 17(b) - the open switch question. Students did
not show awareness of the idea of a field within the circuit. Had they visualised the field,
something which had been brought to students’ attention in the PowerPoint presentation,
the problems experienced with the open switch question may have been overcome.
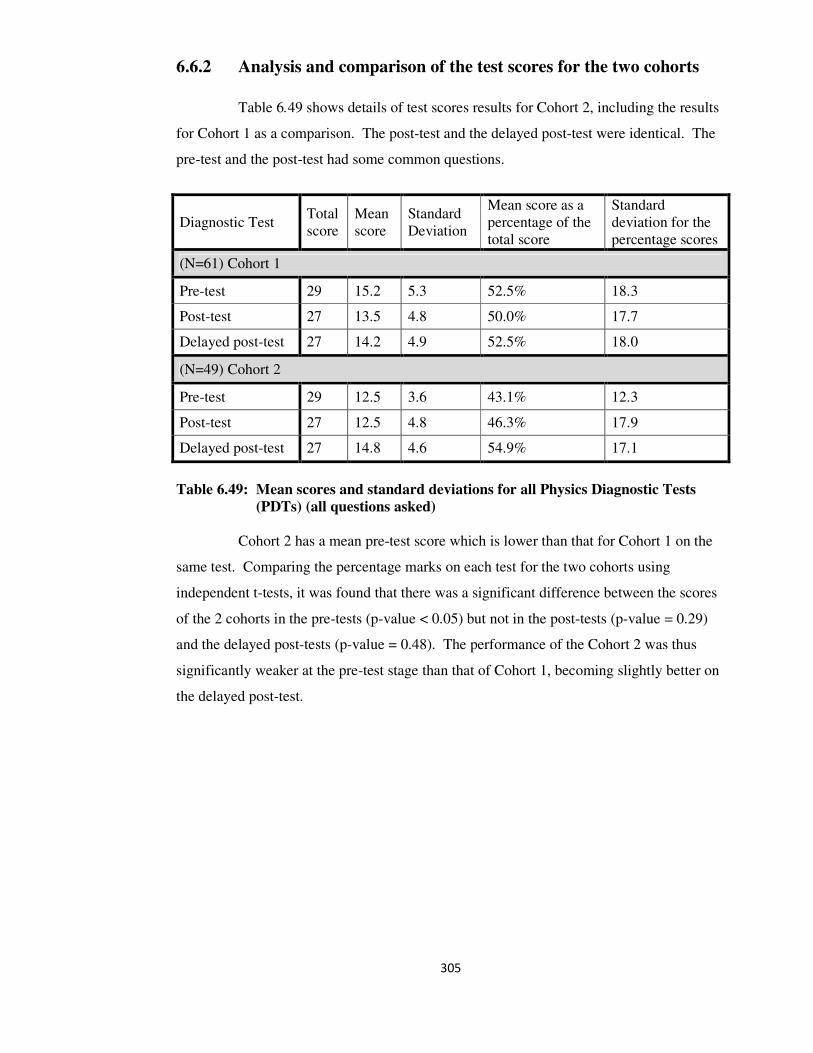
305
6.6.2 Analysis and comparison of the test scores for the two cohorts
Table 6.49 shows details of test scores results for Cohort 2, including the results
for Cohort 1 as a comparison. The post-test and the delayed post-test were identical. The
pre-test and the post-test had some common questions.
Diagnostic Test Total
score
Mean
score
Standard
Deviation
Mean score as a
percentage of the
total score
Standard
deviation for the
percentage scores
(N=61) Cohort 1
Pre-test 29 15.2 5.3 52.5% 18.3
Post-test 27 13.5 4.8 50.0% 17.7
Delayed post-test 27 14.2 4.9 52.5% 18.0
(N=49) Cohort 2
Pre-test 29 12.5 3.6 43.1% 12.3
Post-test 27 12.5 4.8 46.3% 17.9
Delayed post-test 27 14.8 4.6 54.9% 17.1
Table 6.49: Mean scores and standard deviations for all Physics Diagnostic Tests
(PDTs) (all questions asked)
Cohort 2 has a mean pre-test score which is lower than that for Cohort 1 on the
same test. Comparing the percentage marks on each test for the two cohorts using
independent t-tests, it was found that there was a significant difference between the scores
of the 2 cohorts in the pre-tests (p-value < 0.05) but not in the post-tests (p-value = 0.29)
and the delayed post-tests (p-value = 0.48). The performance of the Cohort 2 was thus
significantly weaker at the pre-test stage than that of Cohort 1, becoming slightly better on
the delayed post-test.

306
(N=49) Cohort 2
Diagnostic Test
Mean score
out of a total
of 19
Standard
deviation
Mean score as a
percentage of
the total score
Standard deviation
for percentage
scores
Pre-test 5.9 2.5 31.0% 13.3
Post-test 9.7 4.1 51.0% 21.7
Delayed post-test 11.7 3.9 61.6% 20.3
Table 6.50: Mean scores and standard deviations of PDTs (common questions only)
Considering only the common questions on the tests (see Table 6.50 and Table
4.90), there was once again a significant difference between the percentage marks for the
two cohorts in the pre-test (p-value = 0.02), but no significant difference in the post-test
and delayed post-test marks (p-values equal to 0.32 and 0.23 respectively).
Difference between tests
Mean difference
between percentage
scores
Standard deviation of
the difference between
percentage scores
(N=61) Cohort 1
Post-test score – Pre-test score
(All questions asked) -2.6 14.7
Delayed post-test – Post-test score
(All questions asked) 2.5 12.0
Post-test score – Pre-test score
(Common questions asked) 16.0 17.0
Delayed post-test – Post-test score
(Common questions asked) 1.8 14.7
(N=49) Cohort 2
Post-test score – Pre-test score
(All questions asked) 3.3 15.5
Delayed post-test – Post-test score
(All questions asked) 8.5 15.1
Post-test score – Pre-test score
(Common questions asked) 20.0 17.5
Delayed post-test – Post-test score
(Common questions asked) 10.5 17.4
Table 6.51: Comparing the differences in pairs of test scores between the two cohorts
Table 6.51 shows that there were significant differences between cohorts,
considering the difference between the post-test and pre-test percentage marks
(p-value < 0.05 ), the difference between the delayed post-test and the post-test percentage
marks (p-value = 0.02), all questions considered. When the common questions only were

307
analysed the difference was significant between the delayed post-test and the post-test
percentage scores (p-value = 0.01), but not significant between the post and the pre-test
scores (p-value = 0.23). Students in Cohort 2 showed more progress going from start to
finish. This supports the analyses of the diagnostic tests results presented earlier in this
chapter.
The scores in Table 6.52 show changes in the mean scores within each group of
questions in the diagnostic tests (compare the results for Cohort 1 in Table 4.93).
(N=49) Cohort 2
Diagnostic
test Group A
(Microscopic views) Group B
(Models of current)
Group C
(How resistances
control current)
Group D
(conceptualization
of p.d.)
Mean % Standard
Deviation Mean %
Standard
Deviation Mean %
Standard
Deviation Mean %
Standard
Deviation
Pre-test 25.2 27.7 53.7 31.0 32.7 21.1 45.9 16.0
Post-test 40.8 34.9 70.8 29.4 42.9 31.0 43.8 20.5
Delayed
post-test 57.1 34.7 78.2 29.3 46.9 34.9 52.2 18.2
Table 6.52: Means as a percentage for the question groups in all tests
The following are some observations on these results:
• the mean became consistently larger for Group questions A, B and C, going from pre- to
post- to delayed post-test, but it dropped from pre- to post-test in Group D. There was a
similar trend with Cohort 1 for questions in Group D. This may be a result of having
asked more questions probing p.d. in the post-test, making problems with understanding
p.d. more visible;
• questions probing models of current have the largest mean values, possibly implying
that current is the easiest concept to understand;
• surprisingly, the means for questions about resistance are always less than for p.d.
related questions - also evidenced with the Cohort 1. This may be a consequence of the
questions asked probing resistance;
• there was a sharp increase in the mean marks for all groups of questions going from
post- to delayed post-tests. This indicates knowledge retention for Cohort 2 as well as
progress with learning and understanding. It is important to note that this increase was
larger for Cohort 2 partly because Cohort 2 started from a lower baseline, indicating that
Cohort 2 made a more substantial improvement than Cohort 1.
308
6.7 The interviews with Cohort 2
6.7.1 Type of interviews conducted
As explained in section 3.10, interviews with a sample of students in Cohort 2
were planned and conducted after students had answered the post-test questions. These
interviews were planned with a different aim than those conducted with Cohort 1. It was
now important to see why students still found some ideas difficult to grasp, even after
having revised the additional teaching activities. Semi-structured interviews were again
used at a one-to-one level. Each student was presented with circuit drawings and asked to
explain how the circuits would work, in terms of the students’ visualizations of how the
circuit components function. The interview schedule is shown in Appendix 9, but through
the following sections, relevant circuit diagrams are presented for ease of communication.
6.7.2 The sample
Nine students of different ability were interviewed. They were chosen in a
similar manner as described for Cohort 1, considering performance on the TOLT and
diagnostic tests. Each interview lasted approximately one hour, and was conducted during
school hours during a ‘free lesson’ for both student and researcher. All students showed
enthusiasm for having been chosen to participate and were curious about what questions
they would be asked.
6.7.3 Deciding on the questions to ask
The electricity course had been conducted in such a way as to introduce ideas to
students, in ways which would help students to discuss, reflect upon and visualise complex
concepts. The revised PowerPoint presentation (Appendix 7) referred to different models
and analogies, trying to improve students’ understanding of circuits through various
diagrammatic representations. Class discussions about the representations were
encouraged amongst the group, to allow space for students’ different mental models to
surface (Coll et al., 2005).
The interview questions were meant to probe by how far students were using the
ideas which had been introduced through the course. Since many of the problems
indicated by Cohort 2 had also been indicated by Cohort 1, the decision was made to use
the questions which had been used in interviews with Cohort 1, to guide interview

309
questions with Cohort 2. In fact, the same circuit diagrams were now used, without
including ammeters and voltmeters, and considering equal resistances only, trying to keep
diagrams and ideas presented as simple as possible, avoiding distractors.
Through the study, the underlying hypothesis had been that if students hold a
scientific model of the electric circuit rather than just remembering what they had learned
by rote, then they would perform well in tests and more importantly, understand and give
better qualitative explanations of how circuits work. A number of researchers have
claimed the usefulness of analogy in model generation or modification (Clement, 2011;
Duit, 1991; Duit & Glynn, 1996; Gentner & Gentner, 1983; Wong, 1993a, 1993b). So it
was decided to present the circuit diagrams mentioned above to the students, asking
questions probing students’ visualizations of how each circuit works. Students were urged
to explain what they thought was happening, focussing on comparisons/analogies.
Students were first shown a simple circuit diagram and asked to describe
qualitatively what goes on in the wires and components. They were then asked to describe
changes, if any, when a second identical resistor is connected, first in series and then in
parallel with the first.
Whether students had proposed any analogy or not in the previous answers,
when it came to explain about resistors connected in parallel - an area where problems are
usually experienced as supported by evidence from the tests - students were prompted to
compare the situation to a similarly connected water circuit. The water analogy is one of
the most commonly used by authors/researchers, in relation to electricity (Gentner &
Gentner, 1983; Hewitt, 2002; Paatz et al., 2004; Schwedes & Dudeck, 1996). In this
interview, the prompt used suggested water flow rate as an analogy for current in the first
resistor. Ideas were then probed for what current/water flow rate one expects through the
second resistor connected in parallel (see Figure 6.5). Students’ ideas were then further
probed regarding p.d. across the resistors, asking for their views on what happens to the
flow rate through each branch, in an analogical water circuit. In this part, expressing the
view of an increased water flow rate supplied by the source was crucial to show students’
understanding of the concepts.
While some previous research work had made use of analogue feeding target
(see Gentner & Gentner, 1983; Gick & Holyoak, 1980; Gick & Holyoak, 1983; Harrison &
Treagust, 1993; Treagust, Harrison, Venville & Dagher, 1996), in this study, the situation

310
was reversed. Students had not been coached on the water analogy in depth, so it was
hypothesised that if they could explain the water circuit to fit with the electrical ideas, this
would be proof of meaningful learning, through the students’ ability to construct mental
models.
6.7.4 Examining the results of the interviews with Cohort 2
6.7.4.1 Introduction
Analysis of interview transcripts was conducted in the same way as for Cohort 1.
The following sections describe results which led to conclusions about students’ ways of
learning, as well as possible reasons for difficulties encountered.
6.7.4.2 Students’ mental visualization of current
Figure 6.3: The simple circuit diagram shown to students
When students were asked for their mental picture of how a simple circuit works
almost all mentioned the movement of electrons from the negative to positive side of the
battery. When the conventional current was referred to, students knew that this is indicated
opposite to the electron flow. However, in explaining current, a few students seemed
confused as they dealt with the two opposite directions used. The following is an extract
from an interview transcript. Names in all the following extracts are pseudonyms.
Phil: For the electrons to move there is repulsion from the negative terminal, but
ultimately, for current to flow there is the movement of the conventional
current.
This statement seems to suggest that it was two separate ‘movements’ that were
being imagined and that even if electrons flow in the circuit, it is the conventional current
which has the final responsibility for the flow. Such ideas can be instrumental in giving
rise to unhelpful models of current, like the clashing currents model, for example. This is
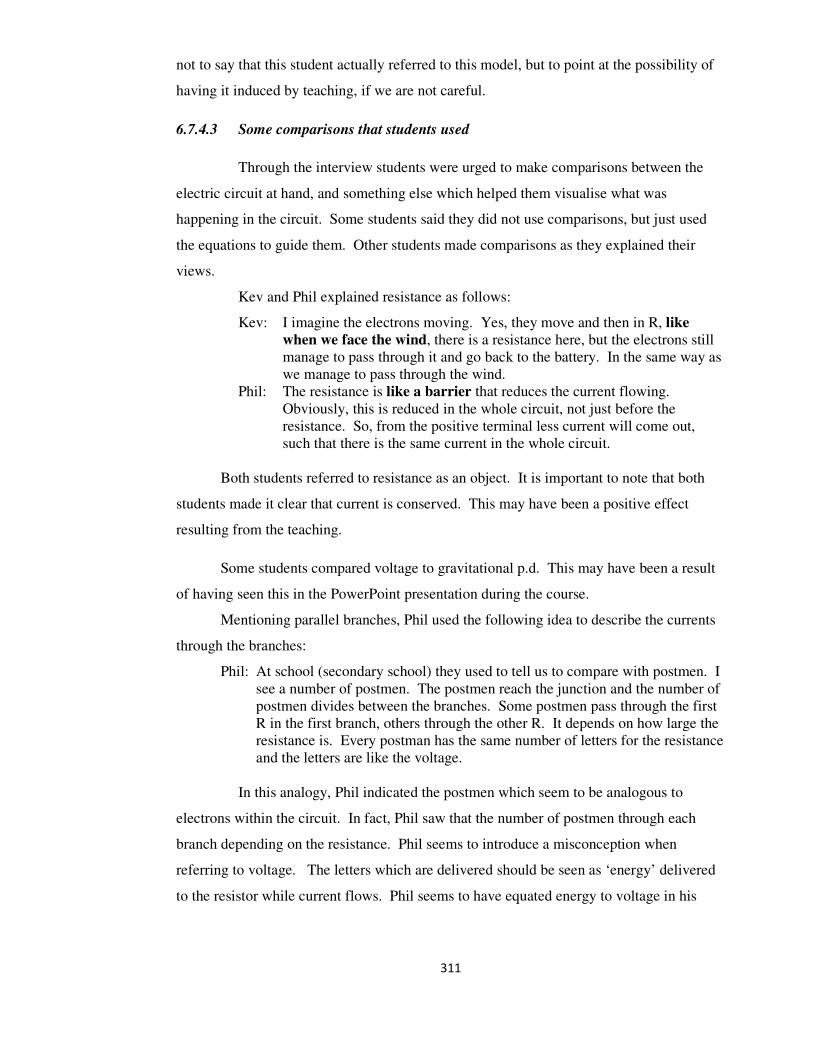
311
not to say that this student actually referred to this model, but to point at the possibility of
having it induced by teaching, if we are not careful.
6.7.4.3 Some comparisons that students used
Through the interview students were urged to make comparisons between the
electric circuit at hand, and something else which helped them visualise what was
happening in the circuit. Some students said they did not use comparisons, but just used
the equations to guide them. Other students made comparisons as they explained their
views.
Kev and Phil explained resistance as follows:
Kev: I imagine the electrons moving. Yes, they move and then in R, like
when we face the wind, there is a resistance here, but the electrons still
manage to pass through it and go back to the battery. In the same way as
we manage to pass through the wind.
Phil: The resistance is like a barrier that reduces the current flowing.
Obviously, this is reduced in the whole circuit, not just before the
resistance. So, from the positive terminal less current will come out,
such that there is the same current in the whole circuit.
Both students referred to resistance as an object. It is important to note that both
students made it clear that current is conserved. This may have been a positive effect
resulting from the teaching.
Some students compared voltage to gravitational p.d. This may have been a result
of having seen this in the PowerPoint presentation during the course.
Mentioning parallel branches, Phil used the following idea to describe the currents
through the branches:
Phil: At school (secondary school) they used to tell us to compare with postmen. I
see a number of postmen. The postmen reach the junction and the number of
postmen divides between the branches. Some postmen pass through the first
R in the first branch, others through the other R. It depends on how large the
resistance is. Every postman has the same number of letters for the resistance
and the letters are like the voltage.
In this analogy, Phil indicated the postmen which seem to be analogous to
electrons within the circuit. In fact, Phil saw that the number of postmen through each
branch depending on the resistance. Phil seems to introduce a misconception when
referring to voltage. The letters which are delivered should be seen as ‘energy’ delivered
to the resistor while current flows. Phil seems to have equated energy to voltage in his
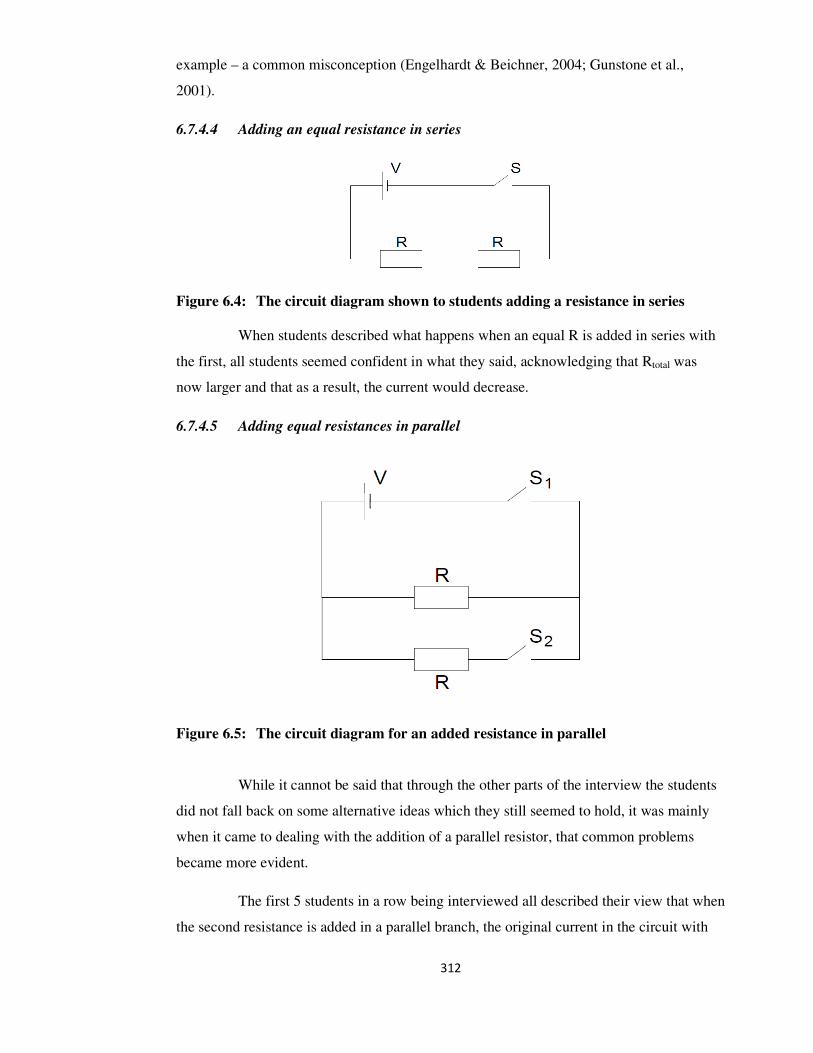
312
example – a common misconception (Engelhardt & Beichner, 2004; Gunstone et al.,
2001).
6.7.4.4 Adding an equal resistance in series
Figure 6.4: The circuit diagram shown to students adding a resistance in series
When students described what happens when an equal R is added in series with
the first, all students seemed confident in what they said, acknowledging that Rtotal was
now larger and that as a result, the current would decrease.
6.7.4.5 Adding equal resistances in parallel
Figure 6.5: The circuit diagram for an added resistance in parallel
While it cannot be said that through the other parts of the interview the students
did not fall back on some alternative ideas which they still seemed to hold, it was mainly
when it came to dealing with the addition of a parallel resistor, that common problems
became more evident.
The first 5 students in a row being interviewed all described their view that when
the second resistance is added in a parallel branch, the original current in the circuit with
313
one resistor would be divided into two halves, each half passing through each resistor. As
has been already indicated, if students did not come up with a comparison on their own,
they were prompted to compare the situation with the water analogy, considering water
flow rate. These 5 students said the same thing as what they had described in the electrical
situation. Students were assuming the BAT model in electricity (same battery, same
current) whilst confirming the claims of Schwedes, Schwedes and Dudeck, and Schwedes
and Schilling (as cited in Schwedes & Dudeck, 1996) that similar alternative ideas as in
electricity exist when using the water analogy, including the BAT model. These students
had all referred to the battery as the pump, pushing the same amount of water into any
circuit. Similar responses were also offered by some other students who were interviewed
later.
One other student, Stef, had the correct answer for the p.d. across parallel
resistances remaining the same but went wrong when it came to using the water analogy.
Stef could not offer any causal reasoning to back up the correct answers in electricity. This
suggested lack of understanding and probably, rote learning. It may have been that Stef
did not have a mental model in mind when answering the question. Stef compared the
battery to a motor and used ideas consistent with the BAT model in the water analogy.
This did not help the student resolve the confusion in the comparisons made.
6.7.4.6 Conflicts between teacher–researcher
After having interviewed the first 5 students, I started reflecting deeply and
questioning myself about what was happening. Students’ answers, at least from those
interviewed up till now were incorrect with reference to parallel resistors. In my capacity
as the teacher I had expected some incorrect results but not for all 5 students interviewed
till now to be confused about how the circuit works, adding another resistor in parallel with
the first. But, when I put on the researcher’s hat, I realised that these interviews were
indeed being conducted in the spirit of finding reasons for why students in Cohort 2 were
still finding problems in the topic, sometimes similar to those which Cohort 1 had shown,
even if Cohort 2 had been presented with teaching activities to guide students’
understanding. Moreover, this study was geared at answering the research questions
outlined in section 3.2. It was possible that these interviews could provide evidence of
specific approaches to the learning of the subject, as highlighted by the third research
question.

314
6.7.4.7 An interview with a difference
Once the aims of conducting these interviews were again put in focus, more
students were interviewed according to previous appointments which had been made. By
coincidence, the next on the list to be interviewed was one of the high ability students in
the group - Dan. Dan’s interview was labelled ‘the interview with a difference’ because it
made a direct link to one of the research aims of the study. It explained at least one way of
how the water analogy can be used successfully helping in providing a specific approach to
understand key concepts regarding circuits. Moreover, it provided an answer to why the
previously interviewed students had gone wrong in using this analogy. Parts from an
extract of Dan’s interview shown in Appendix 10 are used below to highlight important
points indicated by this student.
Dan was one of the few students who started using the water analogy without
being prompted to do so. When a parallel branch was introduced on the circuit drawing,
Dan easily recognised the extra path now available for current. He immediately saw a
lower resistance resulting in a bigger current.
I: So can you try and visualize the situation in terms of some comparison
within another context?
Dan: Now there are 2 paths for the electrons and these have a better chance to
pass… They pass more easily. More of them pass.
I: More of them move?
Dan: In fact, the battery gets drained more easily. In fact, when the resistance is
less, more electrons flow……. Here there is a lower resistance, the battery
is used up quicker and the electrons move and separate out more easily.
Dan used the water analogy together with the gravitational field concept to
understand voltage and p.d. He linked water height to pressure and imagined potential and
p.d. as some kind of electrical pressure. Other students had also linked p.d. with
gravitational potential difference, perhaps recalling slides in the PowerPoint presentation
they had seen through the course. The difference lay in that these students all then
compared the battery to a pump. Dan used the idea of a tank with different pipes
connected to it, representing different branches.

315
Dan: You can consider the battery as a tank which is placed high up so that you
can create the p.d. You put the tank high up and a pipe lower down. In
this case you are using 2 pipes since there are 2 resistances in parallel. The
2 pipes are in parallel. The water comes out of the tank more quickly from
2 pipes instead of 1. More water comes out, because if there is just 1 pipe,
a certain amount of water is released, but if you open another outlet there
will be two pipes. The pipes have to be the same width if the resistances
are the same and more water comes out.
The problem which other students had was that using the pump idea, they did
not see a variable supply of water from it. Using a tank and a variable amount of pipes,
Dan did not have this problem.
Moreover, through the interview, Dan interchanged ideas about analogue and
target with ease, showing deep understanding.
I: And if you were to imagine a certain amount of water flowing, say
100 cm3/s, flowing when you only had one resistor?
Dan: This is the ‘current’ in terms of water flow. Now with electrons the
current is electrons per second. In fact current is charge transfer per unit
time.
I: So now, how would you imagine the situation when switch 2 is switched
on?
Dan: Now the rate will be increased. It will be doubled. Double what it was
before, since a new path has been introduced. They both have the same
pressure, these pipes, since the voltage remains the same. The two
pipes will have the same pressure of water through them, because the
pressure is the same and you’ve opened a larger flow of water. So now
you have an extra 100 cm3/s. Now you have 200 cm
3/s.
Dan thus showed his ability to think, reflect, compare and refine his thoughts.
The student used a cyclic refinement of thought, going from analogue to target and vice
versa, appreciating that each example can be used creatively to help understand the other
(Gick & Holyoak, 1980, 1983). Bauer and Richter, and Steiner (as cited in Duit, 1991)
refer to this as “a ‘two way’ process involving developing both analogue and target” (p.
653). The student admitted that through the use of the analogy he could ‘see’ and solve a
complicated system more easily.
Dan: You can imagine new pathways, extra pipes for water to pass through. You
have a complicated system and you can see it better with this comparison.
It depends though. If you have four or five resistors, then you have to
imagine different widths, lengths…. But in terms of the concept, it is
always the same.
These extracts reveal how Dan explained the concepts involved elegantly and
correctly. The student also explained what helped in making him reach the stage where

316
ideas were more meaningful and clearer to him. Interestingly, he had met the right people
at school who had used analogies which were appealing to him e.g. his teacher of
‘Electrostatics’, and myself when I presented the PowerPoint presentation to the class.
One cannot but note the motivation and curiosity with which the student confronted
learning, his need to discover what was happening in the electric circuit, since a young age,
never giving up and using different instances in his student life to improve his knowledge,
nurturing his imagination and clarifying his doubts. The student had already been noticed
to be one of the more able students and had since a long time learnt to exercise his
‘intellectual wings’ (see Freeman, 1995; Span, 1995).
Figure 6.6: Circuit with switch closed Figure 6.7: Circuit with switch open
Moving on to another part of the interview when the circuit diagrams in Figures
6.6 and 6.7 were shown to Dan, he used his analogy further giving a correct answer backed
with causal reasoning. All the other students interviewed had opted to predict zero p.d.
across an open switch in a simple circuit with no current. Dan answered as follows:
Dan: The voltmeter reads V. There isn’t the same pressure here. The pipe is
split. On one side there is more pressure than on the other side. At the
negative plate (the negative end of the battery) there are more electrons,
and at the other end there is less and you see a potential difference.
Dan’s interview was one out of the nine interviews conducted with Cohort 2. It
can be argued that basing conclusions on what just one student said, may not necessarily
help our teaching and learning methods. Yet, previous work by Niedderer (1994, 1996)
and Clement and Steinberg (2002) also present important research with one student.
Furthermore, Dan’s answers during the interview cannot be ignored. The evidence of
Dan’s understanding of the topic was very convincing. Admittedly, more research is
317
needed in this area, looking into the effectiveness of the teaching approach using the water
analogy as explained by Dan. For now, this analogy using a water tank and pipes, can still
be considered as a tool to help understanding of the topic, especially p.d., thus offering an
answer to the third research question of this study.
6.7.5 Conclusion from the results of the interviews
These interviews helped to show that problems in student learning could be a
result of students not being able to link their ideas to useful visualizations of what goes on
in the electric circuit. Alternative ideas also offer mental visualisations, but these mislead
the learner and thus understanding does not progress. In this case, comparing the battery to
a high level water tank and pipes leading to a lower level made it easier to understand the
system with resistances connected in parallel. When students compared the battery to a
pump, alternative views were at the forefront in both analogue and target and this impeded
the possibility of getting at a correct interpretation of the facts. Using analogies in teaching
may help if the correct ones are used or indicated to the students. Some students may find
their own way and their own solutions, as has been shown above, while others need clear
guidance from the teacher. This links well with results from a study by Sutala and Krajcik
(as cited in Duit, 1991) when it was found “that students with high cognitive abilities
benefited more from creating their own analogical connections, whereas students with low
abilities benefitted more from having the teacher help them make the analogical
connection” (p. 657).
Glynn et al. (as cited in Duit, 1991) describe analogies as “double edged swords”
(p. 666). This was evident from these interviews. Reference has been made to how the
water analogy was used by interviewees who focussed on the misconceptions of it,
supporting misconceptions related to the electric circuit (like the BAT model: same battery
same current). Dan, on the other hand, used the analogy fruitfully in a different way,
benefitting from understanding and meaningful learning. The implication is that care is
required in the choice of which analogy to use and how to use it as a useful tool helping
learning to progress.
The interviews also showed how important it is to motivate and instil curiosity in
our students. “Curiosity, at its core, is all about noticing and being drawn to things we find
interesting. It’s about recognizing and seizing the pleasures that novel experiences offer us,
and finding novelty and meaning even in experiences that are familiar” (Kashdan, 2010).

318
There was evidence shown that when the motivation to learn exists, then there is room and
time for reflection, for comparisons, and for refinement of thought, even if scientific ideas
do not develop immediately.
6.8 Conclusion from the 2nd
cycle of the research
The performance of students in Cohort 2 was significantly weaker at the pre-test
stage, when compared to that of Cohort 1, however, the analysis of the results gave
evidence that students’ performance improved in the post-test. Not only did students show
retention of knowledge gained but they showed further overall improvement in the delayed
post-test. Compared with Cohort 1, Cohort 2 made better progress.
The teaching activities used with the Cohort 2 were shown to have helped some
students’ understanding but this did not happen in all areas and to the same extent. Current
conservation became more noticeable, as was the idea of how resistances work, even if
persistent reference to ideas consistent with the BAT model remained. Problems were still
evident with parallel circuits, especially with p.d. across branches carrying unequal
resistances. Problems with p.d. in the context of no current flow were also found difficult
to deal with. Learning did not progress at the same pace, in all directions. Areas which
students found easier to deal with were distinguished from other areas which proved more
demanding or hierarchically more difficult.
The interviews with the Cohort 2 helped in supporting the researcher’s
hypothesis that when students have useful visualizations of how a circuit works, then
causal reasoning can be managed and used fruitfully to develop knowledge with
understanding. The indication was that possible use of analogies and analogical reasoning
in teaching may help guide students away from rote learning, through the formulation of
meaningful ideas because of increased curiosity and motivation. Using analogy as a two-
way process, analogue feeding target, and vice versa, can help refine ideas related to
complex concepts, as well as developing scientific ones.
Having analysed the results of the research with Cohort 2, linking it with that
from Cohort 1, the next step was to reflect on the results while looking back at the research
questions to decide how this study helped in answering them. This is dealt with in the next
chapter.

319
Chapter 7 Reflections and Conclusions
7.1 Introduction
This chapter reflects on the results from the diagnostic tests, interviews, teaching
activities and class discussions with both cohorts. The aim is not to repeat what has been
discussed in detail in the previous chapters but to explore how far the research questions
have been answered, and at the same time help to elaborate and highlight innovative
material which results from this work. Strengths and weaknesses of the study, as well as
suggestions for future work are also indicated.
7.2 Reflections on the first research question
The research questions which guided this study were stated in section 3.2. The
reader is reminded of each question in respective sections of this chapter, at the same time
as answers to the questions, as revealed by this study, are outlined.
The first question was aimed at probing which mental models post-secondary
students appear to useas they learn about electric circuits. It can be said that the detailed
analyses of the results of the tests, interviews and discussions with both cohorts described
in Chapters 4, 5 and 6 amply indicated students’ ideas consistent with different models of
current, resistance and p.d. With regard to current, there was evidence that students at this
level and in this context seemed to use either conservation or attenuation models. Progress
from attenuation to current conservation, in questions probing current models, seemed
easily managed by the majority of students. This did not necessarily imply that students
did not use attenuation in problems probing the meaning of resistance.
The model depicting the battery as the source of charges which move into the
circuit when this is closed was also widely evidenced. With both cohorts, about one half of
the sample held on to this view, even after teaching.
Some students put a focus on the battery once again when they used ideas
consistent with the BAT model (same battery, same current) in questions probing the
320
meaning of resistance. Views consistent with the R-TAKE model (a larger resistance
‘needs’ more current than a smaller one) and the SHARE model (current is shared between
resistances) appeared as well. The BAT model seemed to become more popular with
students after teaching.
Moreover, apart from the scientific view of p.d. as some difference between
points, with a few students acknowledging movement of charge due to attractive and
repulsive forces from battery terminals, the view of p.d. as a property of current or as
equivalent to current was also observed. Many split p.d. at junctions and could only see
p.d. in the presence of a current. The modelling of p.d. as some kind of flow was quite
pronounced.
Links between these mental models shall be further elaborated upon as
reflections about this research and its analysis are outlined in the next sections.
7.3 Reflections on the second research question
7.3.1 Learning pathways in terms of mental models
The second question related to whether learning pathways can be shown to exist,
in terms of the mental models students seem to develop as they learn the topic. It must be
admitted that this question was not easy to answer because ideas change as they are
developing and probing for what can sometimes be a momentary best account of an idea is
difficult. Norman (as cited inBorges &Gilbert, 1999) claims that mental models are
“unstable, naturally evolving and incomplete” (p. 96). However, the study design helped
in getting information about students’ ideas using different research instruments at
different stages during the teaching, as has been described in previous chapters. Moreover,
persistence on the part of the researcher in probing students’ ideas during interviews and
discussions, trying not to miss opportunities to get to the bottom of students’ difficulties
whenever possible, also helped. Students’ talk was guided by careful questioning, making
students’ ideas clearer to both students themselves, as well as to the researcher. This made
it possible for students to become more meta-cognitively aware of their views and mental
visualisations, helping their understanding to develop. At the same time, the researcher
had the possibility of depicting a global picture of how ideas from different students
seemed to evolve along learning pathways.

321
Earlier research studies (e.g., Clement & Steinberg, 2002; Niedderer &
Goldberg, 1994, 1996; Scott, 1992) exposed learning pathways as tools to help develop
learning and understanding. In this study, the researcher followed the development of
students’ ideas by carefully examining:
• how ideas consistent with specific mental models changed through the course of study
by analysing the results of the PDTs;
• the similarities and differences between ideas of students of different ability by
analysing interview transcripts.
To give an example, when interviewees were asked to describe their mental
picture of what happens when a circuit is switched on, each response was examined and
students’ ideas were followed until some meaning was expressed which described current
flow and what causes it. Students’ views were then put together constructing the global
picture shown in Figure 5.2. Thus learning pathways were identified.
Learning pathways inevitably put ideas and concepts in a hierarchy, providing
possible intermediate steps progressing from intuitive ideas to scientific ones. A list of
ideas/models which were inferred during this research was drawn up based on the level of
difficulty students indicated while explaining their answers in questionnaires and
interviews. Moreover, careful analysis of mental models related to electric circuits, as
proposed by earlier works, were also put in a hierarchical list which logically explains the
progression of ideas. It was reasonable to expect that cognitive development affects
students’ understanding. Thus, in this study with students at post-secondary level, it was
not necessarily expected that all students would start by using ideas at the very bottom end
of any hierarchical list of mental models proposed. On the other hand, similar to what
happens in the classroom situation, not all students were expected to necessarily manage a
complete scientific understanding of all concepts introduced through the course.
Comparing the mental models inferred bystudents in the present study with
models from previous works, some differences became evident. By linking the results
from this research with that proposed in earlier works, a learning model in terms of mental
model pathways was designed, showing how students’ ideas seem to evolve during the
study of electric circuits.

322
The following section describes the details of reflections which guided the
design of this learning model in terms of mental model pathways leading to the
understanding of current, resistance and p.d.
7.3.2 Reflections on researchers’ efforts to map students’ learning of
electric circuits in terms of mental model pathways
7.3.2.1 Studies which took a central role during reflections
The early works of Shipstone (1984, 1985b) presenting possible mental models
of current, were of particular importance in these reflections. More recent work by Grotzer
and Sudbury (2000) and also by Borges and Gilbert (1999) also played an important role
and had a big influence on the conclusions from the reflections. The latter works go
further than just looking at models of how current flows, but look for causal models to
explain why a circuit functions the way it does, as a system.
7.3.2.2 Shipstone’s work proposing models of current
Shipstone’s work (1984, 1985b) already indicated a learning pathway for models
of current. This pathway starts at young students’ intuition of the unipolar model. Students
may use other models as ideas develop depending on age and experience (Shipstone,
1985b), leading the way to current conservation. This progression of ideas is shown in
Figure 7.1 indicating how Shipstone’s models of current (see also Figure 2.2) can be
presented as a logical hierarchy of models, starting at an intuitive level held at an early age,
progressing towards the scientific view.
Scientific model
Sharing model (a move away from the sequential view)
Attenuation model
Clashing currents model
Unipolar model
Figure 7.1: Shipstone’s models of current in a hierarchy
323
The unipolar model stands at the lowest end of the hierarchy since individuals
holding this model do not yet visualize a complete loop for current to flow. The clashing
currents view takes us a step up along the hierarchy because it exists when intuitions
require the presence of a closed loop. The attenuation model is the first model which
considers flow of current in one direction, but it is the sharing model which moves away
from a sequential view of what goes on in the circuit (Grotzer & Sudbury, 2000). The
scientific view of current conservation stands at the highest level.
As has been explained above, an individual’s view may not necessarily start at
the lowest level in the hierarchy. It can start at any level depending on age, personal
experience and cognitive ability. Students in this study at post-secondary level indicated
ideas which were consistent with the attenuation and scientific models. When the sharing
option was presented, many indicated a tendency to use this idea.
7.3.2.3 Causal models of electric circuits suggested by Grotzer and Sudbury
The causal models suggested by Grotzer and Sudbury (2000) follow a logical
evolution similar to Shipstone’s models, but move on further to models explaining the
reason for current flow in terms of p.d. as some kind of difference between points. These
models have also been put in a hierarchy, shown in Figure 7.2. The latter summarises the
explanation and diagrams included in section 2.7.3.
The ‘simple linear causal model’ is at the lowest level in the hierarchy, leading
on to models at a higher conceptual level, finally reaching the scientific view providing
reasons for why there is a current in a closed circuit, viewing a system at work.
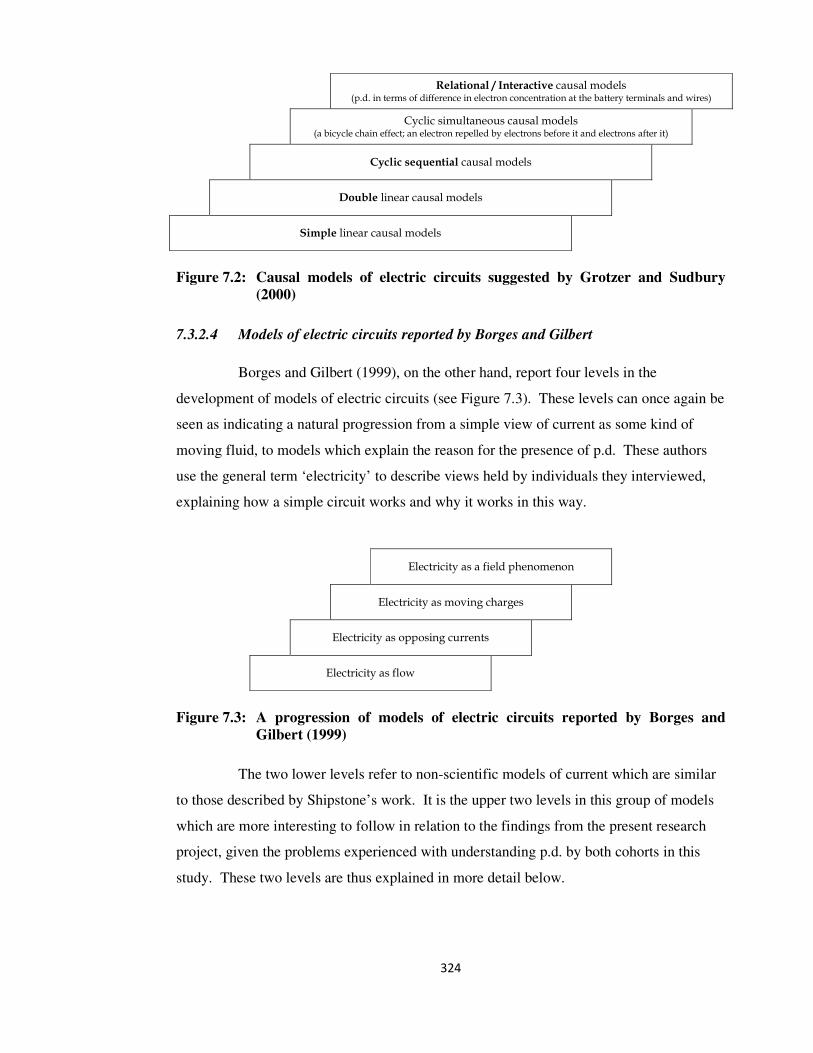
324
Relational / Interactive causal models (p.d. in terms of difference in electron concentration at the battery terminals and wires)
Cyclic simultaneous causal models (a bicycle chain effect; an electron repelled by electrons before it and electrons after it)
Cyclic sequential causal models
Double linear causal models
Simple linear causal models
Figure 7.2: Causal models of electric circuits suggested by Grotzer and Sudbury
(2000)
7.3.2.4 Models of electric circuits reported by Borges and Gilbert
Borges and Gilbert (1999), on the other hand, report four levels in the
development of models of electric circuits (see Figure 7.3). These levels can once again be
seen as indicating a natural progression from a simple view of current as some kind of
moving fluid, to models which explain the reason for the presence of p.d. These authors
use the general term ‘electricity’ to describe views held by individuals they interviewed,
explaining how a simple circuit works and why it works in this way.
Electricity as a field phenomenon
Electricity as moving charges
Electricity as opposing currents
Electricity as flow
Figure 7.3: A progression of models of electric circuits reported by Borges and
Gilbert (1999)
The two lower levels refer to non-scientific models of current which are similar
to those described by Shipstone’s work. It is the upper two levels in this group of models
which are more interesting to follow in relation to the findings from the present research
project, given the problems experienced with understanding p.d. by both cohorts in this
study. These two levels are thus explained in more detail below.
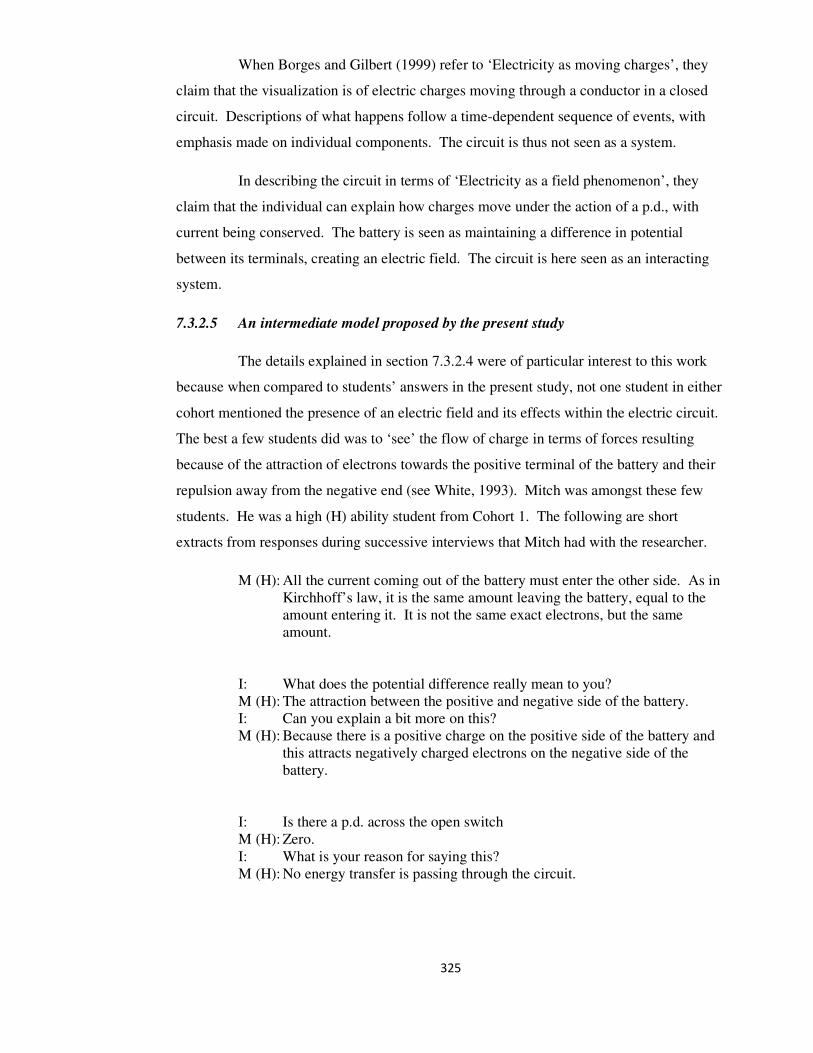
325
When Borges and Gilbert (1999) refer to ‘Electricity as moving charges’, they
claim that the visualization is of electric charges moving through a conductor in a closed
circuit. Descriptions of what happens follow a time-dependent sequence of events, with
emphasis made on individual components. The circuit is thus not seen as a system.
In describing the circuit in terms of ‘Electricity as a field phenomenon’, they
claim that the individual can explain how charges move under the action of a p.d., with
current being conserved. The battery is seen as maintaining a difference in potential
between its terminals, creating an electric field. The circuit is here seen as an interacting
system.
7.3.2.5 An intermediate model proposed by the present study
The details explained in section 7.3.2.4 were of particular interest to this work
because when compared to students’ answers in the present study, not one student in either
cohort mentioned the presence of an electric field and its effects within the electric circuit.
The best a few students did was to ‘see’ the flow of charge in terms of forces resulting
because of the attraction of electrons towards the positive terminal of the battery and their
repulsion away from the negative end (see White, 1993). Mitch was amongst these few
students. He was a high (H) ability student from Cohort 1. The following are short
extracts from responses during successive interviews that Mitch had with the researcher.
M (H): All the current coming out of the battery must enter the other side. As in
Kirchhoff’s law, it is the same amount leaving the battery, equal to the
amount entering it. It is not the same exact electrons, but the same
amount.
I: What does the potential difference really mean to you?
M (H): The attraction between the positive and negative side of the battery.
I: Can you explain a bit more on this?
M (H): Because there is a positive charge on the positive side of the battery and
this attracts negatively charged electrons on the negative side of the
battery.
I: Is there a p.d. across the open switch
M (H): Zero.
I: What is your reason for saying this?
M (H): No energy transfer is passing through the circuit.
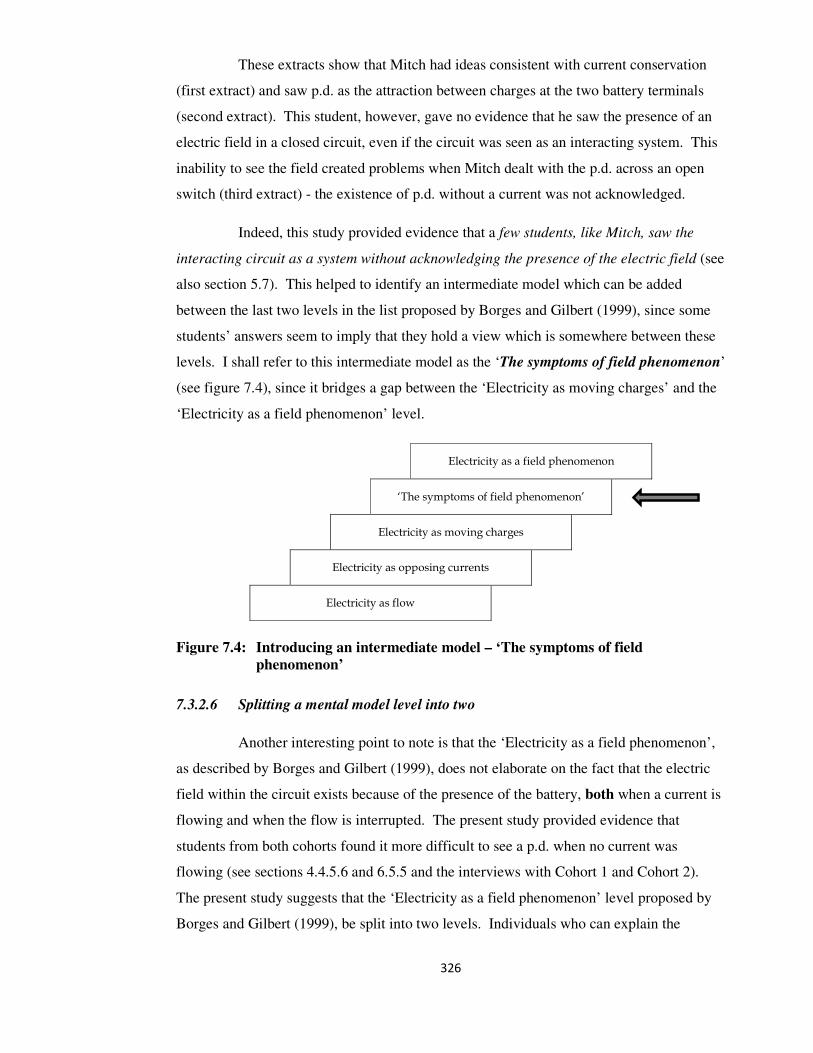
326
These extracts show that Mitch had ideas consistent with current conservation
(first extract) and saw p.d. as the attraction between charges at the two battery terminals
(second extract). This student, however, gave no evidence that he saw the presence of an
electric field in a closed circuit, even if the circuit was seen as an interacting system. This
inability to see the field created problems when Mitch dealt with the p.d. across an open
switch (third extract) - the existence of p.d. without a current was not acknowledged.
Indeed, this study provided evidence that a few students, like Mitch, saw the
interacting circuit as a system without acknowledging the presence of the electric field (see
also section 5.7). This helped to identify an intermediate model which can be added
between the last two levels in the list proposed by Borges and Gilbert (1999), since some
students’ answers seem to imply that they hold a view which is somewhere between these
levels. I shall refer to this intermediate model as the ‘The symptoms of field phenomenon’
(see figure 7.4), since it bridges a gap between the ‘Electricity as moving charges’ and the
‘Electricity as a field phenomenon’ level.
Electricity as a field phenomenon
‘The symptoms of field phenomenon’
Electricity as moving charges
Electricity as opposing currents
Electricity as flow
Figure 7.4: Introducing an intermediate model – ‘The symptoms of field
phenomenon’
7.3.2.6 Splitting a mental model level into two
Another interesting point to note is that the ‘Electricity as a field phenomenon’,
as described by Borges and Gilbert (1999), does not elaborate on the fact that the electric
field within the circuit exists because of the presence of the battery, both when a current is
flowing and when the flow is interrupted. The present study provided evidence that
students from both cohorts found it more difficult to see a p.d. when no current was
flowing (see sections 4.4.5.6 and 6.5.5 and the interviews with Cohort 1 and Cohort 2).
The present study suggests that the ‘Electricity as a field phenomenon’ level proposed by
Borges and Gilbert (1999), be split into two levels. Individuals who can explain the

327
presence of a p.d. across an open switch can be said to have moved towards a more
‘complete’ understanding of p.d. than those who can model p.d. and acknowledge its
presence only when a current flows. This finding helped the researcher to see more clearly
how models of p.d. which students seemed to use in this study can be linked with those
suggested by previous works.
7.3.2.7 Models of p.d. proposed in a hierarchy
The reflections elaborated upon in the previous sections, together with students’
responses during this study, made it possible to put models of p.d. together in a hierarchy
indicating logical progress towards the scientific view. This is shown in Figure 7.5.
p.d. exists even when no current flows - Electricity as a field phenomenon (II)
p.d. exists when a current flows - Electricity as a field phenomenon (I)
p.d. in an interacting system, no field acknowledged – the symptoms of field
phenomenon
p.d. causes charges to move but sequential and local reasoning is used – Electricity as
moving charges
p.d. as what provides the ‘velocity of electrons’(students in interviews)
p.d. as ‘strength of current/circuit/battery’ – a basic causal model used by students in interviews; also indicated in the literature
Figure 7.5: A hierarchy of mental models of p.d.
At the lowest level, p.d. is viewed as ‘strength of the current’. Chris (A), an
average student from Cohort 1, for example, saw ‘voltage as the strength of the current –
how that strength varies across the terminals’. This is a basic causal model referred to by
some students during interviews, as well as one referred to in the literature (see Duit & von
Rhöneck, 1998).
In the interviews students also referred to p.d. as what provides ‘velocity to the
electrons’. The indication of something moving as a result of p.d. puts this model at a
slightly higher level than the previous. The four other levels use Borges and Gilbert’s
(1999) models with the adjustments/additions suggested in the previous sections, leading to

328
levels where p.d. is understood in terms of the presence of the field, even when no current
flows.
7.3.2.8 A unified view of models of electric circuit
Once a view of possible mental models of current and p.d. in a hierarchy was
clear, reflection turned on how these models could be linked.
Students had indicated their microscopic mental models of current, especially
Cohort 1, who were not just questioned about these ideas in the Physics Diagnostic Tests
but also interviewed (see Chapter 5 and also section 7.3.1). Some had seen charges in the
battery only, or in connecting wires only, or in both, before the circuit was connected.
Some students visualised the battery push when the circuit was switched on, while others
had not. These visualizations led to an understanding of how something was flowing.
Only when these microscopic models of current could be linked with models of how
resistance affects the current in the circuit could the models of current suggested by
Shipstone (1984, 1985b) start having any significance within a unified learning model for
electric circuits.
When students viewed resistance as ‘a blockage’/‘a gate’/‘a crowd of people’,
described resistance as ‘taking energy from the current’ and had ideas consistent with
sequential reasoning and attenuation, students saw more current before the resistance than
after it. Resistance was seen as ‘absorbing’ something flowing through it, which was
coming from the battery, or the connecting wires or both. When students’ microscopic
views were linked with answers in the PDTs like ‘the current is shared between the two
resistors, so each gets half’, the SHARE model of current (see section 4.4.4.4) was
inferred. Thus, ideas about what makes current, linked to how resistance affects current
lead to mental models of current. Shipstone’s (1984, 1985b) models of current can then be
seen to result from this link.
Furthermore, models of current must be also linked in some way with those
proposed for p.d. in Figure 7.5. This is suggested by the fact that p.d. is treated like current
by many individuals, as this study has shown clearly. When one student said: ‘If you have
a motor, say with 4V, it goes faster than when it is at 2V. So it is the strength of the
current. It goes faster’, a clear distinction between p.d. and current was not provided.
When students applied the rule V1 + V2 = Vsupply (see section 5.5.3) without providing valid

329
reasons for why this was so, they seemed to have had a mental model of p.d. equating it
with current.
Moreover, many students only saw p.d. in the presence of a current. One student
said: ‘I see no charges passing through the switch, otherwise the voltmeter would give a
reading’. Another student said: ‘V2 will not read anything. If no electrons are passing, as
I imagine it, the voltmeter will not give a reading’. And yet another said: ‘V2 gave a
reading. There must be a current through V2’, thus explicitly associating the voltmeter
reading with current.
Furthermore, until ideas move on from the treatment of p.d. as current,
individuals cannot understand how the circuit works and provide valid reasons for their
views. This level of reasoning can only be said to be complete when p.d. is linked to the
presence of the electric field within the circuit, the circuit being treated as an interacting
system. Reasoning and understanding can only be assumed complete and scientific when
p.d. is seen as “a relationship of imbalance” (Grotzer & Sudbury, 2000, p.10) which exists
even in an open circuit.
This learning model for electric circuits in terms of an evolving sequence of
mental models is shown in Figure 7.6. It is a unifying model which helps to give a holistic
picture of how individuals’ views of how a simple circuit works may develop along
learning pathways, as understanding progresses.

33
0
Figure 7.6: A learning model for electric circuits in terms of mental models placed in a hierarchical structure

331
Looking closely at this learning model and at p.d. in particular, it can be seen
that what is being proposed is that, before one can completely understand p.d., one has to
know about and be able to visualize the electric field. This is quite acceptable, even if it
must be acknowledged that both p.d. and the electric field concepts are difficult to grasp.
P.d. seems, however, the more abstract of the two concepts since visualizing the field can
be made more concrete using experiments like the ones suggested by Jefimenko (1962)
(see section 2.7.5).
7.4 Reflections on the third research question
The third research question asked for evidence of whether particular approaches
used during the teaching process can influence students’ thinking, guiding them towards
the use of scientific mental models of the electric circuit. Through this action research
project a number of teaching activities were used with the aim of improving students’
understanding. Not all activities helped to the same extent.
A teaching activity which had helped to improve students’ understanding of
current included the use of the PhET (Physics Education Technology, 2008) simulations.
These were used with Cohort 2 after some students from Cohort 1 had remarked that by
seeing the charges move round the circuit while viewing sections of the DVD, they could
mentally visualize the charge flow occurring simultaneously in all parts of the circuit (see
section 3.8.5). The PhET simulations helped students ‘see’ the abstract. With Cohort 2,
these simulations were not used alone. They were complemented by the ‘electron
experience task’ (see section 6.3.4) with students being asked to write in their own words
how they visualized the movement of an electron within a circuit. Students were thus
made to concentrate on what happens to charges within the circuit. Writing about their
ideas and discussing them with their peers and the teacher, students became aware of their
alternative views. Similarly to what is claimed by Duschl, Schweingruber and Shouse
(2006), this introduced students to views, other than their own, and directed students to
evaluate their ideas. When this was done, results indicated progress. In fact, Cohort 2
made noticeable improvement as regards ideas about current conservation, as has been
documented in Chapter 6.

332
The PowerPoint presentation shown to students (see Appendix 7) and discussed
with them was also helpful. The presentation exposed students to different analogies
related to current, resistances connected in series and in parallel, and p.d. Thus students
could ponder upon the meaning of important concepts, comparing ideas from other
contexts with what goes on in the electric circuit. While some studies claim that analogies
can confuse students (see for example, Duit, 1991; Glynn, 1991; Harrison, 2001), authors
like Else, Clement and Rea-Ramirez (2008) refer to articles by Brown and Clement,
Clement, and Spiro, Coulson and Anderson claiming “that using multiple analogies was
helpful in overcoming the shortcomings of individual analogies” (p. 216). Moreover, a
student may benefit from being allowed to choose the analogy which appeals most to
him/her, as long as it suits the understanding of the target in question.
When Cohort 1 had seen this presentation at the end of the course, students said
that the ideas had clarified their doubts. The following was the reaction from a Cohort 1
student, at the end of the PowerPoint presentation:
‘These slides answered those questions which I have been asking myself and
struggling with through the course. To have seen this presentation early would have been
beneficial’.
Since this was not the only student who reacted this way, it was decided that the
presentation would be used with Cohort 2 earlier in the course. The results of this study
did not show that students’ understanding progressed immediately with regard to current,
resistance and p.d. However, Cohort 2 made a significantly larger improvement than
Cohort 1 between the pre-test stage and the delayed post-test stage (see section 6.6.2).
Evidence has also been presented in Chapter 6 pointing to how analogies used during the
PowerPoint presentation could help. When Dan, a high ability student, linked his views of
electric circuits to the water analogy using tanks and pipes (see section 6.7.4.7),
meaningful learning was an outcome. The student easily ‘saw’ how the p.d. across parallel
resistors could be explained. This was an important piece of evidence even if it came from
one student only because this student had reflected deeply about his mental visualization of
the circuit and had outlined a way of comparing the behavior of water to the flow of
current in circuits in an easy way which can be effective if used with other students. Other
students did not interact with knowledge in the same way. Clement (2009) acknowledges
that ‘it is difficult to capture multiple instances of unusually creative behavior’ (p. 505).
333
As a general comment, from a teacher’s perspective, the PowerPoint
presentation was seen as a means of engaging the students, guiding them to a minds-on
activity, as they could analyze their thoughts.
With reference to the Predict-Observe-Explain (POE) tasks, these proved
“strikingly effective” as Millar (2004, p. 10) has described them. Students were motivated
because they got immediate feedback for their answers – correct or incorrect. When
incorrect answers were predicted, conflicts arose between students’ unhelpful
visualizations/mental representations and the results obtained, urging students to try and
resolve their difficulties, if that could be helped. Reference to this was made in Chapter 4
using extracts from students’ transcripts. The POEs helped students become accustomed
to asking a very important question in science: ‘Why?’. During this study, having noticed
how students can be urged to give more meaning to knowledge acquired by complimenting
their answer with reasons for it, I started to ask this question to students more frequently
throughout my teaching. Students thus realized the importance of supporting their answers
with causal reasoning.
While this study gave evidence of students’ progress, yet it also pointed towards
the need of helping students more in their understanding of parallel circuits, in overcoming
the strong inclination of using ideas consistent with the BAT model and in not treating p.d.
like current. Teaching activities directed at improving these areas of study, had not been
very effective.
On the other hand evidence was provided showing that when students were
given an opportunity, through various activities, to interact with their teacher/researcher
and their peers, this was translated into learning with understanding. To summarise, the
activities that made a difference included:
• having students talk about their writings in teacher guided class discussions;
• ‘seeing’the abstract and being guided to discover mental pictures and to speak about
them, using simulations like the PhET;
• discussing the PowerPoint presentation introducing different analogies, improving
mental pictures to aid learning;
• using POE tasks, complementing predictions/answers with reasons for them.

334
7.5 The contribution to knowledge made by this study
The reflections on each research question in the previous sections of this chapter
indicate key elements of the contribution to knowledge made by this study.
It was found that while the course work helped students make considerable
improvement in moving on from alternative ideas of current like attenuation, some
students still used these ideas when other concepts were involved like, for example, when
dealing with resistance.
This study also showed that the BAT model (same battery, same current) could
be reinforced by teaching. This has not been referred to by any previous work and it
happened in spite of the researcher’s attention to avoid descriptions of the electric circuit
which may reinforce misconceptions, as well as the introduction of teaching activities to
promote scientific reasoning.
Interpretations of students’ answers during interviews made it possible to
augment Borges and Gilbert’s (1999) models of electricity. An intermediate model of p.d.
(‘the symptoms of field model’ in Figure 7.4) was included and the ‘Electricity as field
phenomenon’ was split into two levels (see Figure 7.5). These adjustments made it
possible to better understand how students’ ideas may develop as understanding of p.d.
develops.
The main contribution to knowledge which this study makes, however, is the
development of a more integrated model that links the ideas students have of current,
resistance and p.d. (see Figure 7.6). Such links have not been elaborated upon by previous
work. Figure 7.6 was constructed by putting together ideas from previous literature and
adding the results and interpretations from this study. The mental models of electric
circuits are shown as an evolving sequence of ideas put in a logical hierarchical order.
Students’ development of ideas cannot be expected to necessarily start at the lowest level
of any hierarchy, moving step by step to higher levels until ideas become scientific. Much
depends on students’ cognitive development, their experience prior to the course of study
and students’ interest in meaningful learning, as opposed to just recalling material needed
to pass an exam. It should also be made clear that students’ ideas of current, as shown in
Figure 7.6, are not necessarily expected to develop in line with those of p.d., as shown in
the same diagram. Indeed, this study showed that most students first managed to relate to
335
the scientific view of current, before they grasped the meaning of p.d. Moreover,
depending on students’ retention of ideas or the lack of it, the possibility exists of having
ideas either developing or regressing along the levels shown in the hierarchy. The ideas
proposed in Figure 7.6 can indeed be used by teachers as a guide to help decide students’
level of understanding of the concepts related to electric circuits. Thus lesson preparation
can be better focused on helping students develop their understanding, moving towards the
scientific view.
7.6 Strengths and weaknesses of the study
7.6.1 A general note onteaching and learning
Duschl et al. (2006) claim that “the power of schooling is its potential to make
available other people, including adults and peers, to learn with; thought-provoking tasks;
tools that both boost and shape thinking; and activity structures that encapsulate learning-
supportive norms and processes” (p.2.13). A strength of this study was that this power of
schooling was made use of in this action research study, using research techniques which
probed students’ ideas, while at the same time making students think. Students’
participation in the research gave them an incentive to improve their understanding of the
topic, the latter being part of a course leading to an important examination which would
decide the students’ future academically. This contrasts with research studies of students’
ideas, involving subjects who may have a low commitment to understanding.
Students’ views were exposed as the learning of how the electric circuit works
was in progress, using tools which challenged and engaged the students, as students
became meta-cognitively aware of their understanding or their problems with it. This
research has provided substantial evidence of how students’ learning evolved during
instruction of the topic. It showed ideas which students easily understood, as opposed to
those which students found difficulty to relate with. It showed the difference which exists
between students of low, average and high ability in the way they use ideas to promote
their understanding of this topic. Putting mental models in hierarchical order showing how
individuals can move to ideas which are still abstract but more complex, like p.d. for
example, is one of the strengths of this work. Indicating levels of complexity linking
abstract concepts can help learners as they make sense of what more needs to be learnt. It
336
can also help teachers during lesson preparation and lesson delivery. This is much in line
with what advocates of formative assessment propose (see for example, Boston, 2002; Bell
& Cowie, 2001).
On the other hand, the research methods used offer guidance for other
researchers who wish to follow up similar work in this particular area. The study
emphasizes the importance of knowing what students’ ideas are and the reasons behind
these ideas, at the same time as indicating instruments and methods which can help in
gaining this knowledge. This can form a base for future research. Moreover, adopting
similar research methods that emphasize causal reasoning may also be useful in helping to
understand how learning progresses in other areas in physics, dealing with complex and
abstract ideas.
7.6.2 The diagnostic tests
Students’ mental models were probed using pre- and post-tests, together with a
delayed post-test. These tests indicated ideas that students were using more frequently.
The quality of the questions used in these tests is a strength of this study. While the two-
tier questions used in these tests are not themselves new, they may well be used as
assessment tools designed to identify students’ misconceptions, thus answering DeBoer’s
(2011) call for the need of a new approach to science assessment. This approach
emphasizes tests as sharp tools to improve teaching and learning, rather than to check
learning by rote.
7.6.3 Proposing a unified learning model for electric circuits
The results from the diagnostic tests were analysed quantitatively. Moreover,
qualitative analyses were also used with intervening data gathered during class discussions
and interviews. Using quantitative and qualitative analyses in this way has been described
by Clement (2000) as having “the potential to generate new insights about learning
mechanisms” (p.1047). This was indeed a main feature and a strength of this study.
Insights gained from the analyses of the data were used to generate ideas about a learning
model of circuits in terms of mental models, as described in section 7.3.2.8. This learning
model for electric circuits can be said to be an important result from this work. Previous
research studies had probed mental models of current (e.g., Psillos et al., 1987; Shipstone,
1985b), resistance (e.g., Johnstone & Mughol, 1978) and p.d. (e.g., Gunstone et al., 2001)
337
separately, even if they also stressed the idea of the circuit as a system. This study gives a
unified picture of the mental models of current, resistance and p.d., as they evolve and
affect each other, putting the models in a hierarchy. If used well, this unified picture can
offer a powerful means by which teachers and students use their transformation potential
(Sassi & Feiner-Valkier, 2010) to change teaching methods and learning practices
respectively, bringing about meaningful learning.
7.6.4 Validity and reliability of the research findings
In section 3.12, reference was made to how validity of the methods used in data
collecting and its interpretation was addressed in this action research study. It was
explained how, due to the specific nature of action research, efforts were concentrated
towards improving the trustworthiness of the study. Methods used to answer the research
questions were described in detail. Moreover, collaborative participation was encouraged
throughout the research study period, between researcher and students in both cohorts, and
between researcher and the thesis advisory group. This helped in making careful decisions
about how to take the study further, providing the necessary means to answer the research
questions in detail.
Indeed, measures were taken, at various stages of the research, to ensure the
validity of the research findings as recommended by Cohen et al. (2001).
At the design stage, plans were made to use tests and interviews to help probe
deeper into students’ ideas as these evolved through the course. Both tests and interviews
were used to bring out reasons behind students’ ideas, and questions asked were always
based on items which had been covered in class. Moreover, a time-frame was set for the
administration of the tests and interviews. Setting a test before the start of the course was
important to show where students were. Having a test at the end of the course was
important to see whether students had progressed. The delayed test, a month later, helped
to check the retention of ideas.
At the data gathering stage, students were encouraged to participate and make an
effort to answer questions carefully and completely. It was emphasized with them that the
research would help them in their understanding, apart from being useful to the researcher.
As students were sitting for a high stakes exam in a few months’ time, understanding was a
priority for them and thus students participated in the project wholeheartedly with
motivation.

338
Data reporting was done carefully and in detail, with claims made being backed
up by relevant data. The need to use the data to answer the research questions was always
kept in mind. Moreover, at the data analysis stage, all data was processed and subjective
interpretation of it was avoided. As much as possible, coding of the answers and their
interpretation was previously prepared and abided by.
At the same time as considering the validity of this study, it was important to
ensure that the method adopted for the research, the instruments used, as well as the
interpretation of the results were reliable. “Reliability is essentially a synonym for
consistency and replicability over time, over instruments and over groups of respondents”
(Cohen et al., 2001, p. 117). While reliability is considered as a pre-condition for validity
(Cohen et al., 2001; Lincoln & Guba, 1985), yet it is stronger, in principle, to deal with
reliability separately (Lincoln & Guba, 1985). In flexible research, like the action research
undertaken in this work, Lincoln and Guba (1985) interpret reliability as dependability.
This results from the fact that in action research replication as proof of reliability is not
always possible.
Considering the present study, different teaching activities were being conducted
with different cohorts, so students’ overall performance throughout the course was
expected to be somewhat different. Replication was expected, however, in the pre-test
results with the two cohorts when students were still starting the course and had not yet
been instructed differently. Indeed, even if the facility values of the questions asked were
different, evidence was provided showing that questions which were chosen to be asked
again in the post-test with Cohort 1 because of low facility value were also found difficult
to answer by Cohort 2 (see section 6.2.2). Thus the pre-test can be taken to be a
reliable/dependable instrument which can be used to show students’ knowledge before
they start a course about electric circuits at advanced level.
At the same time it must be added that for this work to be trustworthy and
dependable, measures that make research instruments and methods of data collection, as
well as research findings, dependable in any study, were adopted as much as possible in
this research. Reliability of test answers and their interpretation was controlled by asking
clear questions probing one idea only, using consistent wording and consistent circuit
diagrams. For each idea tested, two questions were set, asking the same question in a
slightly different way. Thus students’ consistency in answering could be checked,
increasing reliability of the data collected.
339
In order to understand the depth of students’ knowledge and understanding,
probing into student difficulties as well as the reasons behind answers provided had to be
done (McDermott & Redish, 1999). Semi-structured interviews were an effective way in
helping to understand students’ talk. Space was allowed for the interviewer to ask the
required questions such that students’ answers could be understood, improving reliability
of data interpretation. During interviews, the researcher controlled the wording used,
avoiding leading questions. The interviewer was also empathic, steering and observant,
linking and relating what was said throughout the interview while trying to make the best
of the interview session. Moreover, pilot studies had been conducted prior to the start of
the actual data collection phase for this project, with the aim of getting some training on
how to best conduct interviews (Oppenheim, 1992).
It can also be said that analysis of all data was done in a systematic manner, with
procedures used being described in detail, safeguarding the reliability/dependability of the
results.
7.6.5 Gender issues
A possible weakness of this study is that gender issues have not been addressed.
It would have been interesting to compare responses to physics diagnostic tests questions
and interviews with girls and boys. This was not done because the existence of strong
gender differences was not expected and also because it would have made the study too
long.
7.6.6 The problem of interpretation of responses
In this study, emphasis was made throughout on students’ voice, through class
discussions, the answering of questions in diagnostic tests, one-to-one interviews, predict-
observe-explain tasks and expressions of individual ideas in writing. The analyses of the
data from such research necessitated the sound interpretation of responses. This was
certainly not an easy chore. Klaassen and Lijnse (1996) claim that “it is often difficult to
interpret classroom discourse, let alone interpret it unambiguously” (p.115). They explain
how the language which students use is meaningful to the students, yet often may be
different from that used by teachers. Viennot (1985) and Klaassen (1995) emphasise the
same view.
Efforts were thus put into trying, as much as possible, to avoid communication
breakdown between student and researcher. Being a teacher-researcher helped in this

340
matter since I am used to students’ everyday classroom talk. Also, whenever there were
students’ ideas which were not clearly explained, I rephrased the question, pushing for a
clearer answer. However, admittedly, there were limits to having the problem of
interpretation completely eliminated. Addressing this issue using peer-validation of a
sample of the data collected would have helped. Unfortunately this was not possible, given
the demands of the teaching timetable.
7.7 Implications for practice
7.7.1 Model based teaching and learning
This study has highlighted data collection of students’ ideas based on mental
models. It also made use of additional teaching activities which were directed at making
students meta-cognitively aware of what and how mental models can help understanding.
The implication for practice is to promote the use of mental models in teaching and
learning current electricity, to help improve understanding of this abstract topic. This
study has exposed how students’ understanding of circuits progresses in terms of mental
models students seem to use as their ideas evolve towards the scientific view. Teachers
can thus centre their teaching around these mental models, using discussions to help
students become aware of their intuitive/alternative ideas and to build upon them.
Teaching centred around mental models of current, resistance and p.d., as shown in
Figure 7.6, empowers the teacher with the potential for forward thinking, helping teachers
to recognize what comes next in lesson preparation, and in searching for ideas which need
to be discussed with students, to support learning in progress.
The use of teaching activities like the ones used in this research is thus
suggested. While students are guided by the teacher in their knowledge construction,
teachers learn more about students’ ideas as the teaching progresses. The traditional
lecture presentation needs to be adjusted to start to involve class time which is more
student-centred. Clement (2008b) refers to class environments where “the knowledge
developed is largely student generated but at the same time the agenda is largely teacher
directed” (p.15). Thus learning can become more meaningful. The following sections
describe how teaching activities which can complement model based learning can be used
with students during class time, promoting guided inquiry techniques.
341
7.7.2 The Predict-Observe-Explain (POE) technique
This work has put POEs in a very prominent position as a teaching and learning
aid. The POE technique was instrumental in bringing students’ ideas and related mental
models to the forefront. This is not something which just helps the teacher to know where
students are. It also helps to indicate to the learner his/her level of understanding. In other
words, POEs are powerful tools during instruction. Klaassen and Lijnse (1996) claim that
“in general students do not have much to subtract from what they already believe” (p. 128).
Even if students have more incorrect ideas than these authors seem to claim, subtracting
these incorrect ideas just for the sake of memorising new material, is not as important as
having students recognize through first-hand experiences (by, for example, doing an
experiment or seeing a demonstration and discussing results) that what they are suggesting
or predicting does not work. When students have proof of wrong predictions, they may
become internally motivated to think more deeply, constructing new knowledge, and
moving forward. Moreover, making students give reasons behind predictions made and
behind changes in answers suggested after observation, helps to emphasize to the learner
the importance of causal reasoning, which is fundamental for understanding. After
students in both cohorts, especially the ones who had been interviewed, became used to the
fact that they had to answer to the question ‘Why?’ they started to ask this question
automatically by themselves. Using POEs can help students make a qualitative leap in the
understanding of electric circuits through predictions made, careful observation of the
results and reflections on them.
7.7.3 Teacher guided discussions
This study has also highlighted the importance of class discussions. Hammer
(1995) claims that “as students listen and respond to each other’s propositions, they
become more aware of alternative perspectives and the need to support their views with
reasons and evidence” (p. 424). This helps understanding.
Studies by Prain and Hand (1999) and Constantinou and Papadouris (2004) also
support the idea that discussion can help to improve development and understanding.
These authors refer to how discussions bring about ‘conceptual negotiation’ between
participants as they interact with each other, making it “probable for meaning evolution to
become a gradual and explicit process, in the sense of new knowledge emerging”
(Constantinou & Papadouris, 2004, p. 24).
342
The teacher’s role during discussions becomes fundamental. As an expert,
she/he needs to involve all students in what makes them responsible for their learning.
Students need to be encouraged to speak about their ideas when required, and also to
actively listen to their peers and learn from the views of others. Moreover, teachers need to
see the importance of drilling students in asking the question‘Why?’. This question is key
to promoting higher level discussion based on abstract thinking (Rabow, Charness,
Kipperman & Radcliffe-Vasile, 1994).
7.7.4 Analogies and analogical reasoning
The use of analogies has also been explored in this research, by using a
PowerPoint presentation providing a visual as well as a verbal communication channel
fostering discussion about abstract ideas, linking them to previous experiences. This
helped students improve their mental representation of how a circuit works, by comparing
concepts of electric circuits to ideas in other contexts (see also section 7.4). Teaching
activities including analogies compliment model based learning. Using analogies to guide
mental model evolution is suggested, emphasizing those parts of the analogue which are
helpful in understanding the target. The use of the water analogy using the gravitational
model with tanks and pipes is specifically suggested, since this has been shown in this
study to help depict a clearer picture of p.d. – an otherwise difficult concept to grasp (see
section 6.7.4.7).
7.8 The role of teachers
7.8.1 Didactic versus student centred methods
While student centred environments offer ideal situations, yet some teachers
may find a traditional didactic environment easier to handle. Valanides (1997) has
criticized educational institutions which use didactic methods of knowledge transmission,
saying that reasoning development “seems to be hindered by intellectually restrictive
educational environments and teaching approaches which demand coverage of the
curriculum and put emphasis on extensive factual knowledge” (p. 182).
For learning to be student centred, the role of the teacher becomes of particular
importance. In their professional role, teachers have to look for strategies like the teaching
activities referred to in this work, which can enable students to do what is so difficult for
them – THINK. When students were asked to write down what they thought an electron
343
does when the circuit is switched on, they were being made to think about their mental
model of current. Some students said they didn’t have a model of current, but still
managed to write about their mental picture after giving it some thought. When students
were urged to discuss their views with their peers – defending or changing their ideas –
they were being given the opportunity to think, clear their doubts, and understand.
Guiding students’ thinking can help their understanding, as opposed to the training some
students get for memory recall of pieces of information.
7.8.2 Addressing teachers’ conflicts
With teachers’ claim that they cannot keep adding more to what they have to do
in class, over and above an already overloaded curriculum (see Hammer,1995;
Clement,2008a, amongst others), teachers may perhaps oppose the idea of introducing
additional teaching activities like the ones indicated in the previous sections, as aids to
learning. Such activities may at first appear as an extra burden to carry. Yet, conducted
with the spirit of making learning enjoyable, these teaching activities only pose a small
change to a usual lesson plan. Even so, sometimes, as Viennot (1999) claims, the “so-
called ‘small’ changes can do more than commonly expected” (p. 15).
7.9 Suggestions for future work
In view of the results of this study, the following suggestions are made for future
work:
• It is suggested that a 3rd
cycle of research be carried out to try and resolve problems
which Cohort 2 still experienced, even after teaching.
Those teaching activities which helped Cohort 2 would obviously be repeated. The
static electricity course would again be revised with students. The electron experience
task accompanied byclass discussions would again be conducted to help with current
conservation views. PhET simulations shall also be used with the same aim. Moreover,
the use of the PowerPoint presentation used with Cohort 2 is suggested, promoting
analogical reasoning for understanding.
Cohort 2 still experienced difficulty with parallel circuits, especially when using
unequal resistances. It is suggested therefore, that the teaching of parallel circuits be

344
explained in terms of mono-circuits. Some students had seen parallel circuits in this
way, so perhaps this may have some impact on students’ understanding.
Moreover, to help with understanding p.d., the use of the POE technique during whole
class teaching is suggested. PhET simulations, used as class demonstrations
accompanied by discussions, can promote students’ active participation. Emphasis
would be made on circuits carrying parallel resistors, R-C circuits, and simple circuits
carrying a closed/open switch, with a voltmeter connected across it. Thus students
would be guided to see that p.d. can exist without a current. Students would be asked to
write their predictions and explanations, as well as discuss their writing with their peers,
bringing their ideas to the forefront, before observations and related discussions are
further undertaken.
Experiments like the ones suggested by Borghi et al. (2007) can be demonstrated (see
section 2.7.5) in an effort to better link current electricity concepts to those used in
electrostatics.
Explanations regarding surface charge cannot be dealt with very deeply with students at
post-secondary level, but emphasizing the presence of field lines between the battery
terminals and along connecting wires and circuit components would be beneficial.
The impact of these whole class activities would then be evaluated to see whether
Cohort 3 would have benefitted significantly from them, when compared with progress
shown by Cohort 2.
• This study has indicated the popular use of the BAT model (same battery, same
current), regardless of changes made to the electric circuit. Moreover, evidence was
provided showing that more students from both cohorts seemed to use the BAT model
after instruction (see sections 6.4.4.2 and 4.5.5.2). Reasons for why this was happening
were not addressed by this work. Other researchers had not mentioned this problem and
it was thought necessary to first check whether the result would be confirmed by Cohort
2. In view of the confirmation, future work is suggested to try and find reasons for this
problem.
• Gender issues have also not been addressed by the present work, mainly due to time
constraints. It is suggested, therefore, that future work may probe differences, if any,
which may exist in the way boys and girls reason about electric circuits.
345
7.10 Conclusion
The teaching activities promoting discussion and analogical reasoning which
have been suggested by this work and further highlighted in this chapter are not difficult to
adopt. No problems were encountered during the course with my students, because of
these added activities. On the contrary, students were more engaged and motivated to
understand rather than just recall pieces of information. By involving students in relevant
discussions and analogical reasoning, teachers can give a slight twist to their teaching,
making it more effective. Students are thus directedtowards taking “active steps to manage
their learning processes to facilitate knowledge acquisition and comprehension”
(Weinstein &Underwood, 1985, p. 243). This is, indeed, when true learning takes place.
I would like to end by saying that this study has dealt with the important issue of
learning for understanding. It has focused on model based learning – an area described by
Clement (2000) as a key research area in science education. Teaching activities which
offer the key to a powerful and qualitatively enriched learning experience have been
highlighted. Moreover, the study has contributed to knowledge by identifying a unified set
of learning pathways, guiding us as to how understanding progresses in the area of electric
circuits. As Scott (1992) puts it, “once we begin to better understand how children’s ideas
are likely to progress in a particular science domain, then we shall be better placed to
develop teaching approaches to support that progression” (p. 223).
This study has looked at ways of how students’ ideas develop during the
teaching of this topic. It is augured that this work be used and built upon, in the future, by
students, teachers and researchers, with the aim of making the study of electric circuits
appear less complex and abstract.

346
Appendix 1 The Secondary Education Certificate
(SEC) Physics Syllabus
The Physics syllabus at SEC level can be retrieved from
https://www.um.edu.mt/__data/assets/pdf_file/0016/66400/SEC24.pdf
Only theme 5 dealing with electric circuits is shown here.
Theme 5: Electricity in the Home
Describing the unit
Our homes provide comforts that frequently we take for granted. At home you can turn on
the light or a heater at the flick of a switch. You may easily take a snack from the fridge
and cook it in the microwave as you watch your favourite TV serial. Without electricity
most of these appliances would not work and our lives would be completely different.
In this topic we shall explore how electricity was discovered when the effect of rubbing
materials together was noticed. An understanding of the static electricity formed in these
instances may give students a better insight about certain phenomena that take place
around our homes but also enable them to consider particular applications.
This topic provides the opportunity to discuss what electricity is and how it can be
measured through different circuits. It gives students the opportunity to explore different
sources of electricity and investigate the relationship between voltage and current in
resistors and filament lamps. Students shall also be given the opportunity to investigate
components that are influenced by changes in light and temperature. This topic enables the
students to appreciate how electrical energy is generated, how this is used in our houses
and how its cost can be calculated. The topic also considers why electricity can be
dangerous and ways to use it in a safe way.
Have you ever thought about the following?
1. Why do television screens and computer monitors become so dusty?
2. Why when after combing your hair, placing the plastic comb near a very thin
stream of water will make the stream bend to the side?
3. How is a spark produced?

347
4. Which is the safest place to seek shelter in a thunderstorm?
5. Why is it better to use a vacuum cleaner rather than a broom to clean a carpet?
6. Why do you get an electric shock when you touch the body of a car when you come
out of the car?
7. Why are many contacts in high quality electronic systems gold-plated?
8. Why does an electrician have to wear shoes with thick rubber soles at work?
9. How do the lights in street lighting remain on when one bulb is broken?
10. How do you wire up a three pin plug?
11. What happens when you blow a fuse?
12. How much does it cost to charge a mobile phone in one year?
Learning Programme:
• Measuring charge.
• There are forces acting between charged objects.
• Difference between conductors and insulators.
• Measuring and describing current and potential difference.
• Ways of producing electricity.
• The resistance of materials depends on particular factors.
• The change of resistance of electrical devices is used in a variety of applications.
• The potential difference, current and resistance in a circuit are related.
• The behaviour of potential difference, current and resistance differs through
different circuits.
• House wiring.
• Risks and hazards associated with electricity. Safety measures.
Internet Links
Balloons and static electricity - Charging by rubbing and forces between charges.
http://phet-web.colorado.edu/web-pages/simulations-base.html
Current construction kit- Constructing series and parallel circuits
http://phet-web.colorado.edu/web-pages/simulations-base.html
Ohm’s Law
http://www.walter-fendt.de/ph14e/ohmslaw.htm
Series and parallel circuit simulations
http://www.walter-fendt.de/ph14e/combres.htm
A.C. circuit
http://www.walter-fendt.de/ph14e/accircuit.htm
348
Appendix 2 The Matriculation and Secondary
Education Certificate (MATSEC) Board
Physics Syllabus at Advanced Level
The Physics syllabus at advanced level was retrieved from
https://www.um.edu.mt/__data/assets/pdf_file/0013/101821/AM26.pdf
Only section 5 dealing with electric circuits is shown below.
5 ELECTRIC CURRENTS
5.1 Charge and current:
Current as the rate of flow of charge. Current = slope of charge-time graph = dQ/dt.
Current model. Derivation of I = nAve is expected. Distinction
between conductors, semiconductors and
insulators using the equation.
Intrinsic and extrinsic semiconductors. Crystal structure of silicon. Effect of impurities
and temperature on conduction.
Simple band theory. To explain differences between conductors,
intrinsic and extrinsic semiconductors, and
insulators.
Electrical potential difference. Potential difference = work done/charge.
E.m.f. of a cell. Definition of e.m.f.
Kirchoff’s laws. Simple circuit calculations.
Emphasis on conservation of charge and
energy.
5.2 Resistance:
Current-voltage characteristics for a
metal wire at constant temperature,
filament lamp and diode.
Experimental investigations are expected.
Resistivity and conductivity.
Temperature dependence of resistance
of metals and thermistors.
Experimental investigation included.
Determination of the temperature coefficient of
resistance.
Internal resistance of a cell and its Practical importance of internal resistance in

349
measurement. car battery and extra high-tension supplies.
Resistors in series and in parallel. Simple circuit problems, including the use of
Kirchoff’s laws.
The potential divider. The potential divider equation. Use of light-
dependent resistor or thermistor to control
voltage.
Balance of potentials and the principle
of null methods.
Circuit principles are expected. Only simple
numerical problems based on simple circuits
can be set. Reference to terms such as
‘potentiometer’, ‘Wheatstone Bridge’, etc., are
to be avoided.
Energy and power in d.c. circuits. Including the kilowatt-hour.
Use of ammeters, voltmeters and
multimeters.
Extension of range of electrical meters.
Internal structure of meters is not included.

350
Appendix 3 Diagnostic Test Questions in the Question
Bank
Qn 1
In this circuit, a battery is connected to a resistor, R.
(a) What can you say about the electric current at points a and b?
Choose one answer.
i The electric current at a is bigger than at b.
ii The electric current at b is bigger than at a.
iii The electric current is the same size at a and b.
(b) How would you explain this?
Choose one answer.
i The current is the same all round the circuit.
ii Some of the current is used up by the resistor.
iii All of the current is used up by the resistor.
a b
R

351
Qn2
The figure shows a battery connected to a resistor. Two ammeters measure the electric
current at different points in the circuit. The reading on ammeter A1 is 0.5 A.
(a) What will the reading on ammeter A2 be?
Choose one answer.
i More than 0.5 A.
ii Exactly 0.5 A.
iii Less than 0.5 A, but not zero.
iv Zero.
(b) How would you explain this?
Choose one answer.
i Some of the current is used up by the resistor.
ii All of the current is used up by the resistor.
iii The current is the same all round the circuit.
R
A2 A1 0.5 A

352
Qn3
A battery is connected to a bulb. The bulb is lit.
There is an electric current in wire A from the battery to the bulb.
(a) What can you say about the electric current in wire B?
Choose one answer.
i There is an electric current in wire B from the battery to the bulb.
ii There is an electric current in wire B from the bulb to the battery.
iii There is no electric current in wire B.
(b) How can you explain this?
Choose one answer.
i There is an electric current through one wire to the bulb. It is all used up
in the bulb, so there is no current in the other wire.
ii There are two electric currents from the battery to the bulb. They meet at
the bulb and this is what makes it light.
iii There is an electric current through one wire to the bulb. Some of it is
used up in the bulb, so there is a smaller current going from the bulb to
iv There is an electric current through one wire to the bulb. It all passes
through the bulb and back to the battery through the other wire.
current
wire
wire
Battery
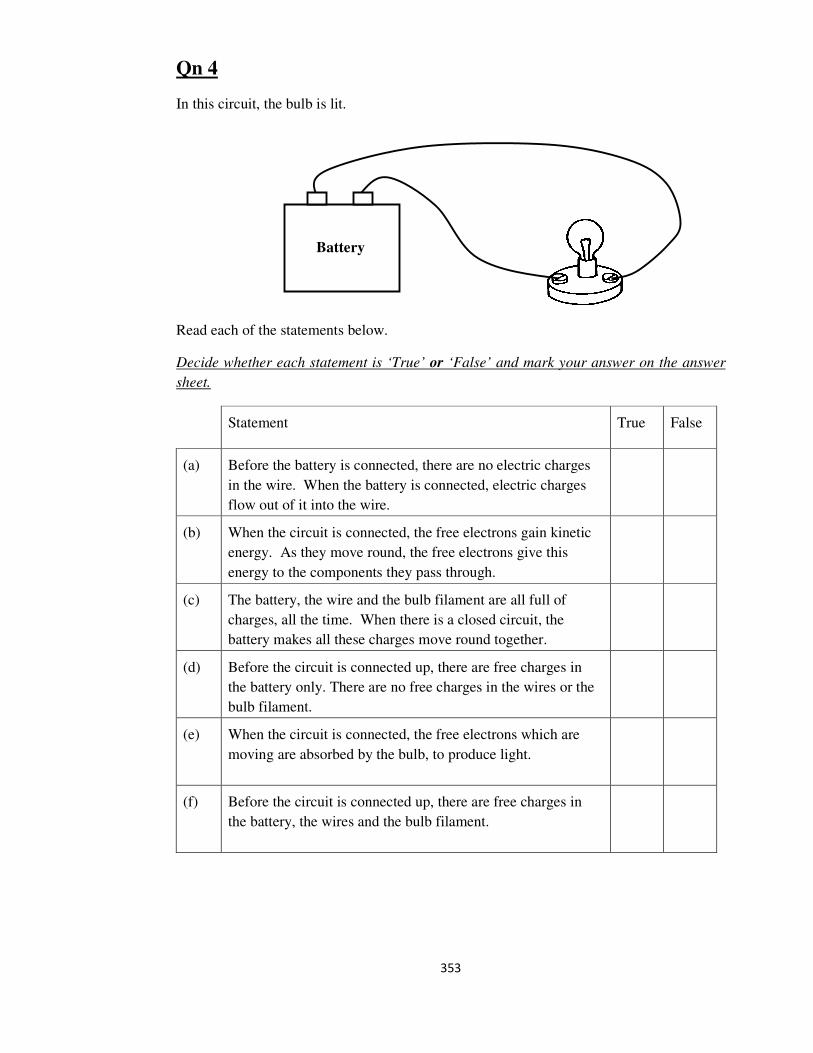
353
Qn 4
In this circuit, the bulb is lit.
Read each of the statements below.
Decide whether each statement is ‘True’ or ‘False’ and mark your answer on the answer
sheet.
Statement True False
(a) Before the battery is connected, there are no electric charges
in the wire. When the battery is connected, electric charges
flow out of it into the wire.
(b) When the circuit is connected, the free electrons gain kinetic
energy. As they move round, the free electrons give this
energy to the components they pass through.
(c) The battery, the wire and the bulb filament are all full of
charges, all the time. When there is a closed circuit, the
battery makes all these charges move round together.
(d) Before the circuit is connected up, there are free charges in
the battery only. There are no free charges in the wires or the
bulb filament.
(e) When the circuit is connected, the free electrons which are
moving are absorbed by the bulb, to produce light.
(f) Before the circuit is connected up, there are free charges in
the battery, the wires and the bulb filament.
Battery

354
Qn 5
The resistor in this circuit, R1, has a small resistance.
It is replaced by R2, which has a large resistance.
(a) What happens to the current in the circuit?
Choose one answer.
i It gets bigger.
ii It stays the same.
iii It gets smaller, but not zero.
iv It drops to zero.
(b) How would you explain this?
Choose one answer.
i The battery is not strong enough to push any current through a larger
resistor.
ii The resistor controls the size of the current that the battery can push
around the circuit. The bigger the resistance, the smaller the current.
iii A large resistance needs more current than a small resistance. The
bigger the resistance, the bigger the current.
iv It is the same battery, so it always supplies the same current.
R2 - large resistance
R1 - small resistance

355
Qn 6
Sam makes this circuit.
He then adds a second identical resistor.
(a) What happens to the current in the circuit at point x?
Choose one answer. Use the answer sheet.
i It gets bigger.
ii It stays the same.
iii It gets smaller, but not zero.
iv It drops to zero.
(b) How would you explain this?
Choose one answer. Use the answer sheet.
i The battery is not strong enough to push any current through two resistors.
ii The battery cannot push as big a current through two resistors.
iii It is the same battery, so it supplies the same current.
iv Two resistors need more current than one on its own.
v The current is shared between the two resistors, so each gets half.
R
x
R
x
R

356
Qn 7
Peter makes this circuit, with a battery and a variable resistor, R.
He then increases the resistance of R.
(a) What happens to the current in the circuit?
Choose one answer.
i It gets bigger.
ii It stays the same.
iii It gets smaller, but not zero.
iv It drops to zero.
(b) How would you explain this?
Choose one answer.
i The battery is not strong enough to push any current through a larger
resistor.
ii The battery cannot push as big a current through a larger resistor.
iii A larger resistance needs more current than a smaller resistance.
iv It is the same battery, so it supplies the same current.
R
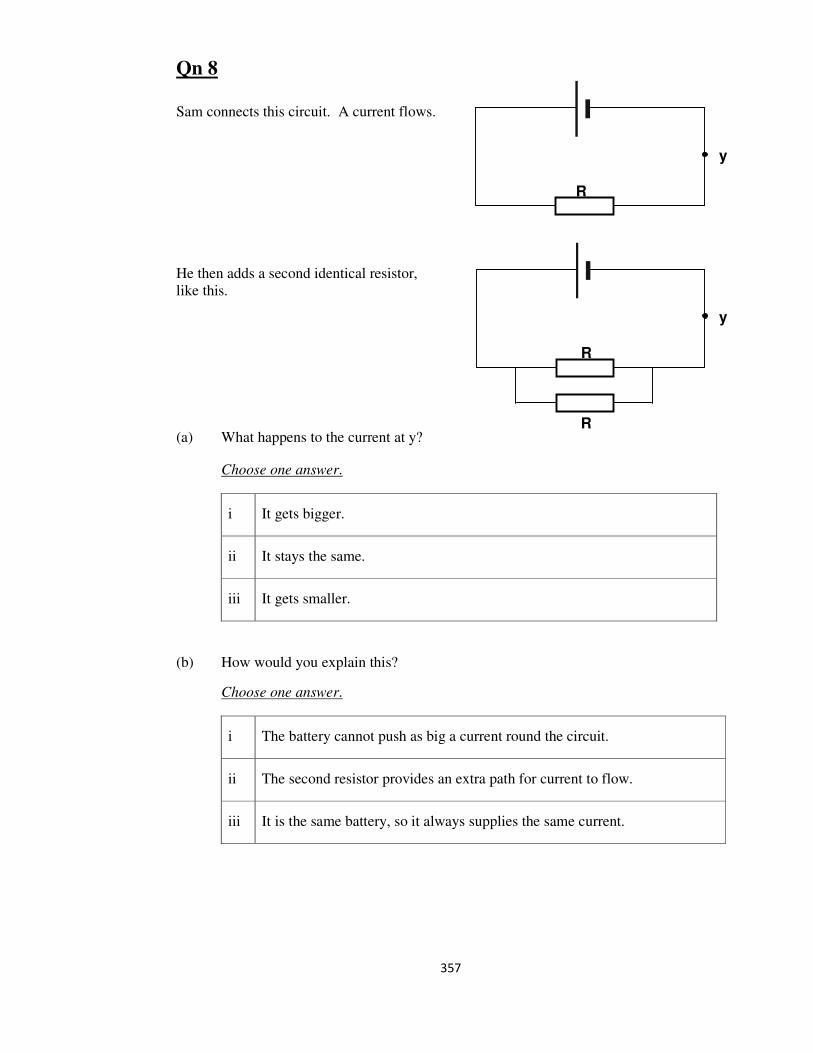
357
Qn 8
Sam connects this circuit. A current flows.
He then adds a second identical resistor,
like this.
(a) What happens to the current at y?
Choose one answer.
i It gets bigger.
ii It stays the same.
iii It gets smaller.
(b) How would you explain this?
Choose one answer.
i The battery cannot push as big a current round the circuit.
ii The second resistor provides an extra path for current to flow.
iii It is the same battery, so it always supplies the same current.
R
y
R
y
R
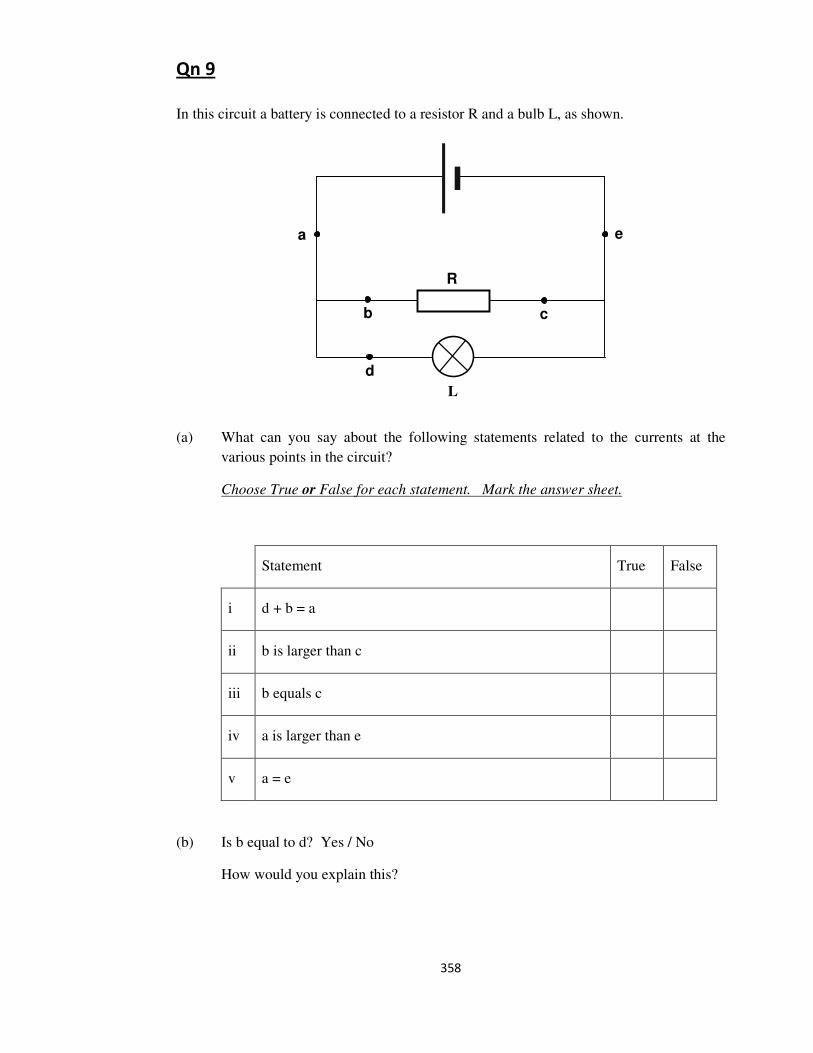
358
Qn 9
In this circuit a battery is connected to a resistor R and a bulb L, as shown.
(a) What can you say about the following statements related to the currents at the
various points in the circuit?
Choose True or False for each statement. Mark the answer sheet.
Statement True False
i d + b = a
ii b is larger than c
iii b equals c
iv a is larger than e
v a = e
(b) Is b equal to d? Yes / No
How would you explain this?
b c
R
d
a e
L
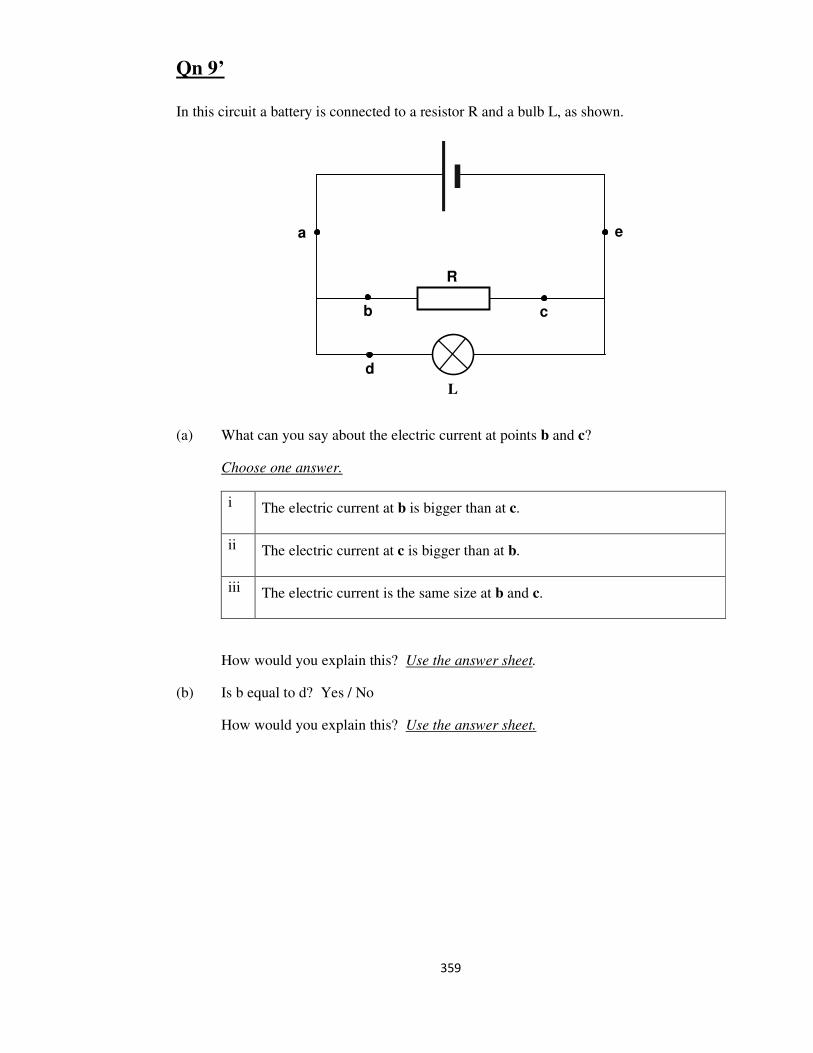
359
Qn 9’
In this circuit a battery is connected to a resistor R and a bulb L, as shown.
(a) What can you say about the electric current at points b and c?
Choose one answer.
i The electric current at b is bigger than at c.
ii The electric current at c is bigger than at b.
iii The electric current is the same size at b and c.
How would you explain this? Use the answer sheet.
(b) Is b equal to d? Yes / No
How would you explain this? Use the answer sheet.
b c
R
d
a e
L
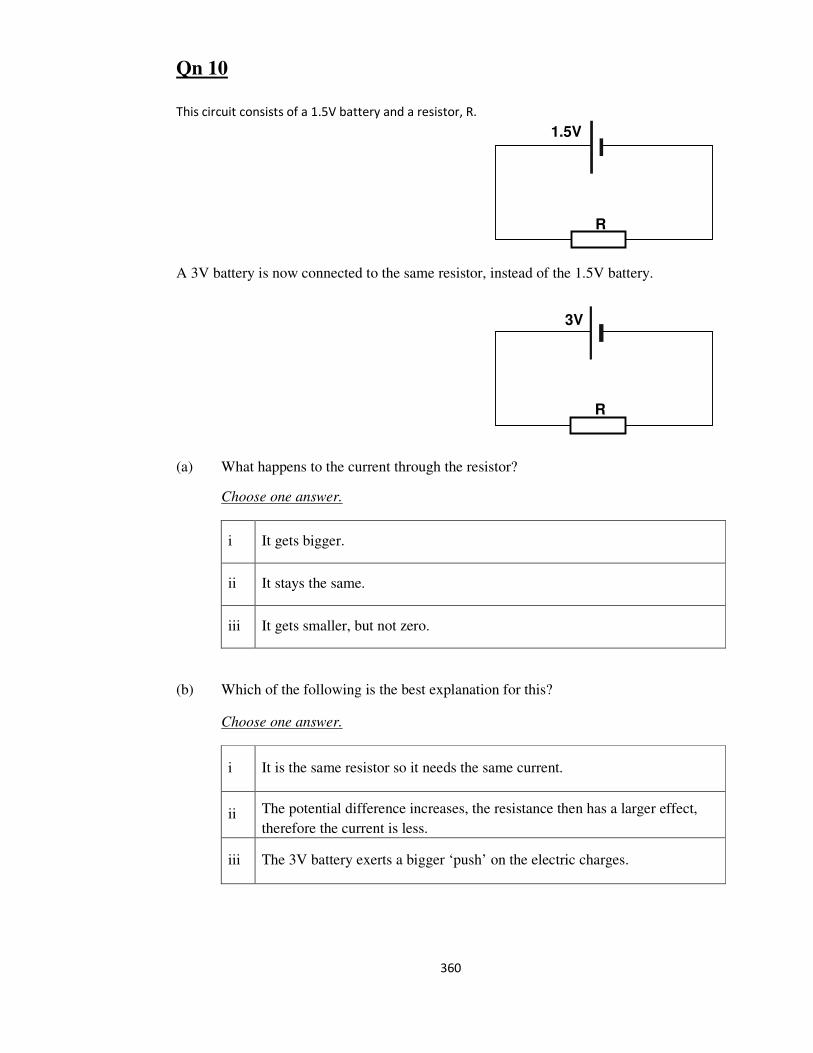
360
Qn 10
This circuit consists of a 1.5V battery and a resistor, R.
A 3V battery is now connected to the same resistor, instead of the 1.5V battery.
(a) What happens to the current through the resistor?
Choose one answer.
i It gets bigger.
ii It stays the same.
iii It gets smaller, but not zero.
(b) Which of the following is the best explanation for this?
Choose one answer.
i It is the same resistor so it needs the same current.
ii The potential difference increases, the resistance then has a larger effect,
therefore the current is less.
iii The 3V battery exerts a bigger ‘push’ on the electric charges.
R
3V
R
1.5V

361
Qn 11
This circuit consists of a battery and a resistor, R.
A second identical battery is added.
(a) What happens to the current through the resistor?
Choose one answer.
i It gets bigger.
ii It stays the same.
iii It gets smaller, but not zero.
iv It drops to zero.
(b) Which of the following is the best explanation for this?
Choose one answer.
i Two batteries exert a bigger ‘push’ on the electric charges.
ii It is the same resistor so it needs the same current.
iii The potential difference increases, the resistance then has a larger effect,
therefore the current is less.
iv The two batteries push in opposite directions and cancel each other out.
R
R

362
Qn 12
The circuit consists of some batteries connected to two resistors R1 and R2.
A voltmeter connected across a and e reads 6V.
For each question, choose one answer. Mark your answer on the answer sheet.
More
than 6V 6V
Less than
6V Zero
(a) What is the potential difference (p.d.)
between points a and e?
(b) What is the potential difference (p.d.)
between points b and d?
(c) What is the p.d. between points a and b?
(d) What is the p.d. between points b and c?
(e) What is the p.d. between points c and d?
(f) What is the p.d. between points d and e?
6V
V
d
R1 R2
b
a e
c

363
Qn 12’
The circuit consists of some batteries connected to two resistors R1 and R2.
A voltmeter connected across a and e reads 6V.
For each question, choose one answer. Mark your answer on the answer sheet.
More
than 6V 6V
Less than
6V Zero
(a) What is the potential difference (p.d.)
between points b and d?
(b) What is the p.d. between points a
and b?
(c) What is the p.d. between points d
and e?
6V
V
d
R1 R2
b
a e
c

364
Qn 13
In this circuit, a 6V battery is connected to two identical resistors in series.
(a) What is the potential difference (p.d.) between the points a and b?
Choose one answer.
i 6V.
ii Between 6V and 3V.
iii 3V.
iv Between 3V and zero.
v Zero.
(b) How would you explain this?
R R
V 6V
b a
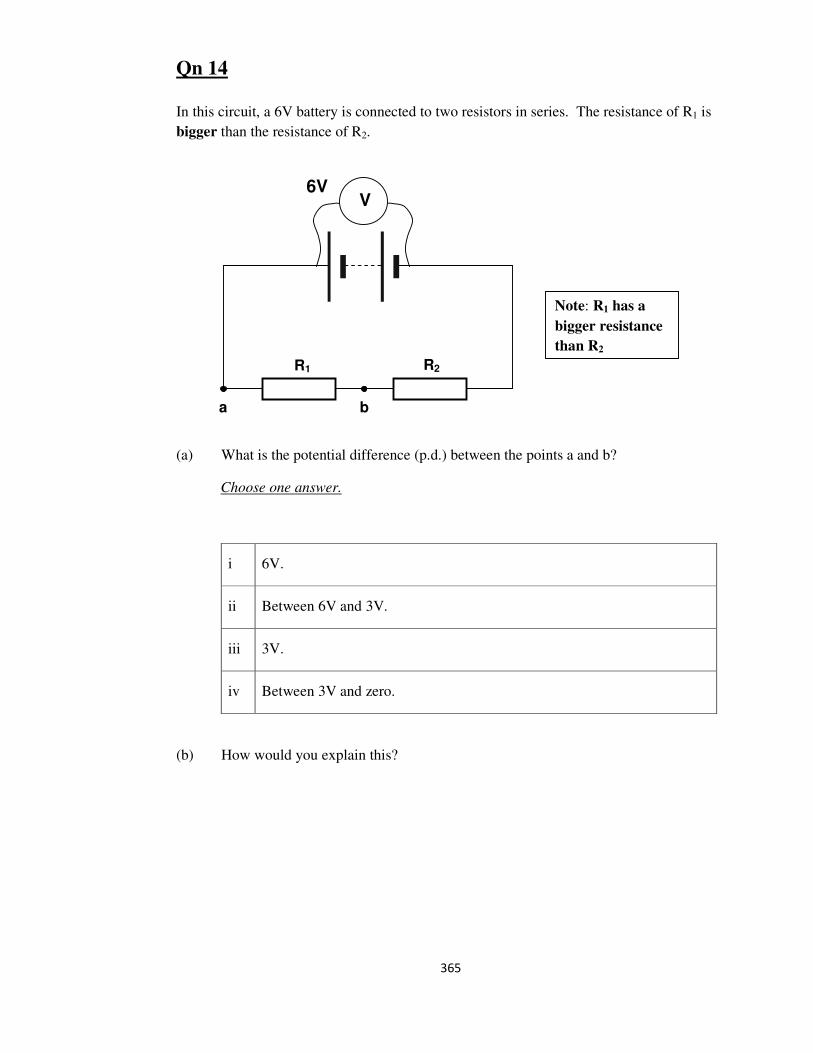
365
Qn 14
In this circuit, a 6V battery is connected to two resistors in series. The resistance of R1 is
bigger than the resistance of R2.
(a) What is the potential difference (p.d.) between the points a and b?
Choose one answer.
i 6V.
ii Between 6V and 3V.
iii 3V.
iv Between 3V and zero.
(b) How would you explain this?
R1 R2
Note: R1 has a
bigger resistance
than R2
6V V
b a

366
Qn 15
The two resistors in this circuit are identical. The voltmeter connected across the battery
reads 8V.
(a) What is the reading, in volts, on voltmeter V1?
Use the answer sheet.
How would you explain this?
(b) What is the reading, in volts, on voltmeter V2?
Use the answer sheet.
How would you explain this?
R
V1
R
V2
8V V

367
Qn 16
In this circuit, the voltmeter across the battery reads 6V.
(a) What is the reading, in volts, on voltmeter V1?
Use the answer sheet.
How would you explain this?
(b) What is the reading, in volts, on voltmeter V2?
Use the answer sheet.
How would you explain this?
V
2Ω
V1
4Ω
V2
6V

368
Qn 17
(a) This circuit consists of a 3V battery, connected to a resistor R and a switch S. The
switch is closed. The ammeter reads 100 mA.
What is the potential difference (p.d.) between a and b?
Use the answer sheet.
(b) The switch S is then opened. The voltmeter across the battery still reads 3V.
(i) What is the reading on the ammeter now?
Use the answer sheet.
(ii) What is the potential difference (p.d.) between a and b, now?
Use the answer sheet.
R
b a
S
A
3V V
R
b a
S
A 100 mA
3V V

369
Qn 17’
(a) This circuit consists of a 3V battery, connected to a resistor R and a switch S. The
switch is closed. The ammeter reads 100 mA.
What is the potential difference (p.d.) between a and b?
How would you explain this? Use the answer sheet.
(b) The switch S is then opened. The voltmeter across the battery still reads 3V. The
ammeter now gives zero reading.
What is the potential difference (p.d.) between a and b, now?
How would you explain this? Use the answer sheet.
R
b a
S
A
3V V
R
b a
A 100 mA
3V V
S

370
Qn 18
In this circuit, the power supply has a fixed
voltage output.
The resistors R1 and R2 are connected
as shown.
The switch, S, is open.
There is a reading on the voltmeter
connected across R1.
The switch is then closed.
(a) What happens to the reading on the voltmeter?
Choose one answer.
i It gets bigger.
ii It stays the same.
iii It gets smaller.
(b) How would you explain this?
Choose one answer.
i The voltage is now shared between the two resistors.
ii R1 is connected directly across the terminals of the power supply. So the
voltage across it is always equal to the power supply voltage.
iii The total resistance in the circuit is now bigger, so V increases (as V=IR).
R2
fixed voltage
power supply
V
R1
S

371
Qn 19
In this circuit, a battery is connected to a resistor R.
The voltmeter reads 1.5V.
A second identical battery is now added, like
this.
(a) What is the reading on the voltmeter now?
Choose one answer.
i 3 V.
ii 1.5 V.
iii 0.75 V.
iv Zero.
(b) How would you explain this?
Choose one answer.
i Two batteries ‘push’ harder than one on its own.
ii The voltmeter measures the potential difference across each battery,
which stays the same.
iii The second battery pushes against the first one.
iv The two batteries transfer more energy to the resistor every second.
R
V 1.5V
V
R

372
R A
Qn 20
In this circuit, a battery is connected to a
resistor R. There is a reading on the ammeter.
A second identical battery is now added,
like this.
(a) What happens to the reading on the ammeter?
Choose one answer.
i It gets bigger.
ii It stays the same.
iii It gets smaller.
(b) How would you explain this?
Choose one answer.
i Two batteries ‘push’ harder than one on its own.
ii The potential difference across the resistor is still the same.
iii The second battery pushes against the first one.
iv Two batteries supply more energy every second.
A R

373
Qn 21
Two resistors, R1 and R2, are connected as
shown in the diagram. An ideal fixed
power supply is used.
The switch S is open.
There is a reading on both ammeters.
The switch is then closed.
(a) What happens to the reading on ammeter A1?
Choose one answer.
i It gets bigger.
ii It stays the same.
iii It gets smaller.
(b) How would you explain this?
Choose one answer.
i Some of the current now goes through R2, bypassing R1.
ii Two resistors need a bigger current from the power supply.
iii The voltage across each parallel branch stays the same.
iv The total resistance is now bigger, so the current gets less.
Note: This question continues on the next page.
R2
A1
A2
fixed voltage
power supply
R1
S

374
The circuit below is identical to the one on the previous page.
(c) What happens to the reading on ammeter A2 when S is closed?
Choose one answer.
i It gets bigger.
ii It stays the same.
iii It gets smaller.
(d) How would you explain this?
Choose one answer.
i Some of the current now goes through R2, bypassing R1.
ii Two resistors need a bigger current from the power supply.
iii The voltage across each parallel branch stays the same.
iv The total resistance is now bigger, so the current gets less.
R1 A1
fixed voltage
power supply
A2
S R2

375
Appendix 4 Reasoning Tasks

376
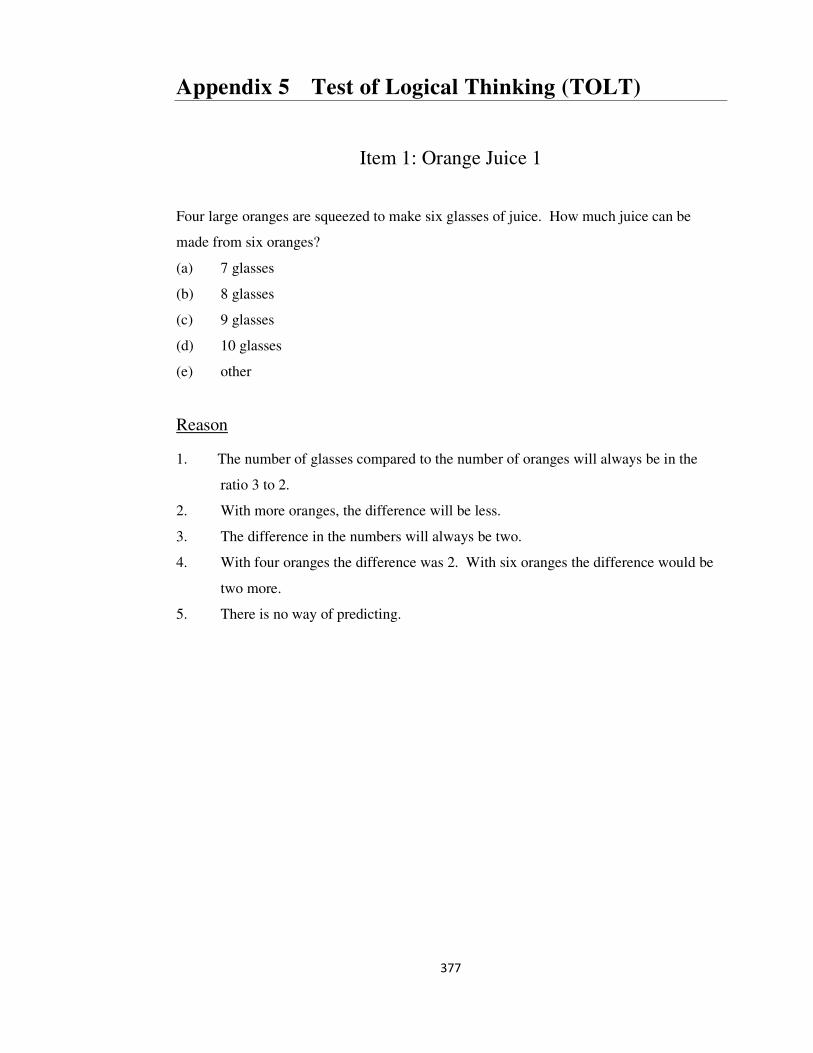
377
Appendix 5 Test of Logical Thinking (TOLT)
Item 1: Orange Juice 1
Four large oranges are squeezed to make six glasses of juice. How much juice can be
made from six oranges?
(a) 7 glasses
(b) 8 glasses
(c) 9 glasses
(d) 10 glasses
(e) other
Reason
1. The number of glasses compared to the number of oranges will always be in the
ratio 3 to 2.
2. With more oranges, the difference will be less.
3. The difference in the numbers will always be two.
4. With four oranges the difference was 2. With six oranges the difference would be
two more.
5. There is no way of predicting.
378
Item 2: Orange Juice 2
How many oranges are needed to make 13 glasses of juice?
(a) 6½ oranges
(b) 8⅔ oranges
(c) 9 oranges
(d) 11 oranges
(e) other
Reason
1. The number of oranges compared to the number of glasses will always be in the
ratio of 2 to 3.
2. If there are seven more glasses, then five more oranges are needed.
3. The difference in the numbers will always be two.
4. The number of oranges will be half the number of glasses.
5. There is no way of predicting the number of oranges.
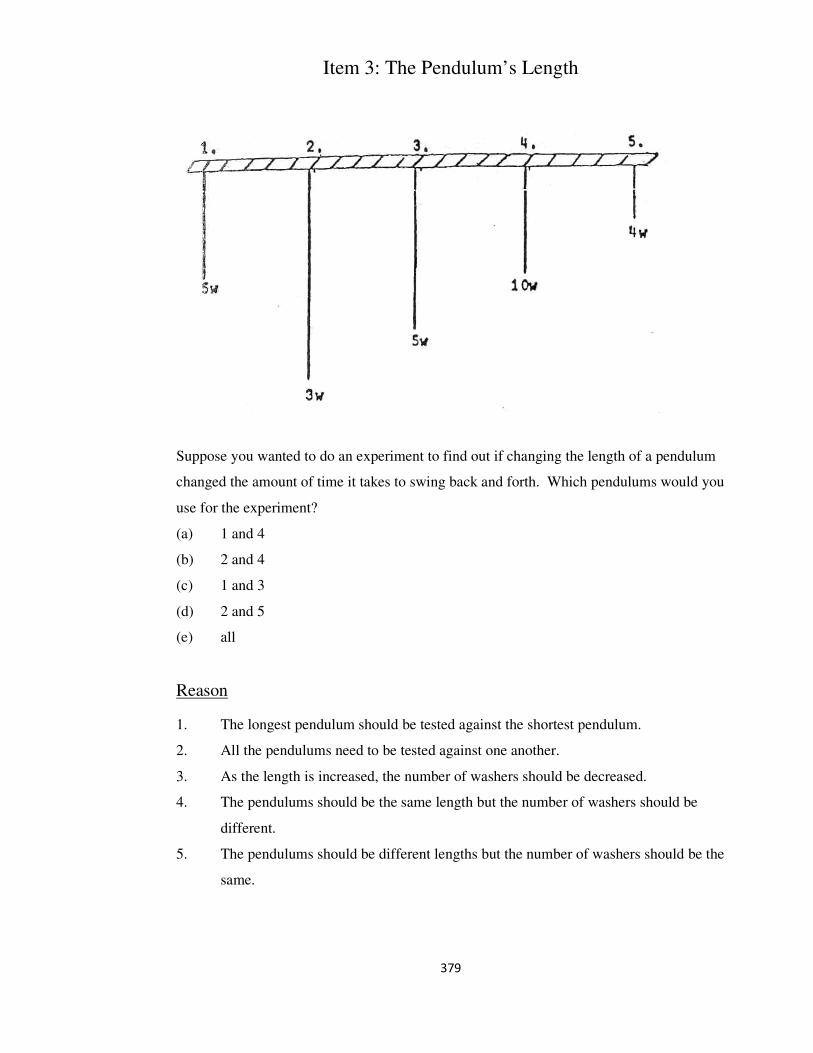
379
Item 3: The Pendulum’s Length
Suppose you wanted to do an experiment to find out if changing the length of a pendulum
changed the amount of time it takes to swing back and forth. Which pendulums would you
use for the experiment?
(a) 1 and 4
(b) 2 and 4
(c) 1 and 3
(d) 2 and 5
(e) all
Reason
1. The longest pendulum should be tested against the shortest pendulum.
2. All the pendulums need to be tested against one another.
3. As the length is increased, the number of washers should be decreased.
4. The pendulums should be the same length but the number of washers should be
different.
5. The pendulums should be different lengths but the number of washers should be the
same.
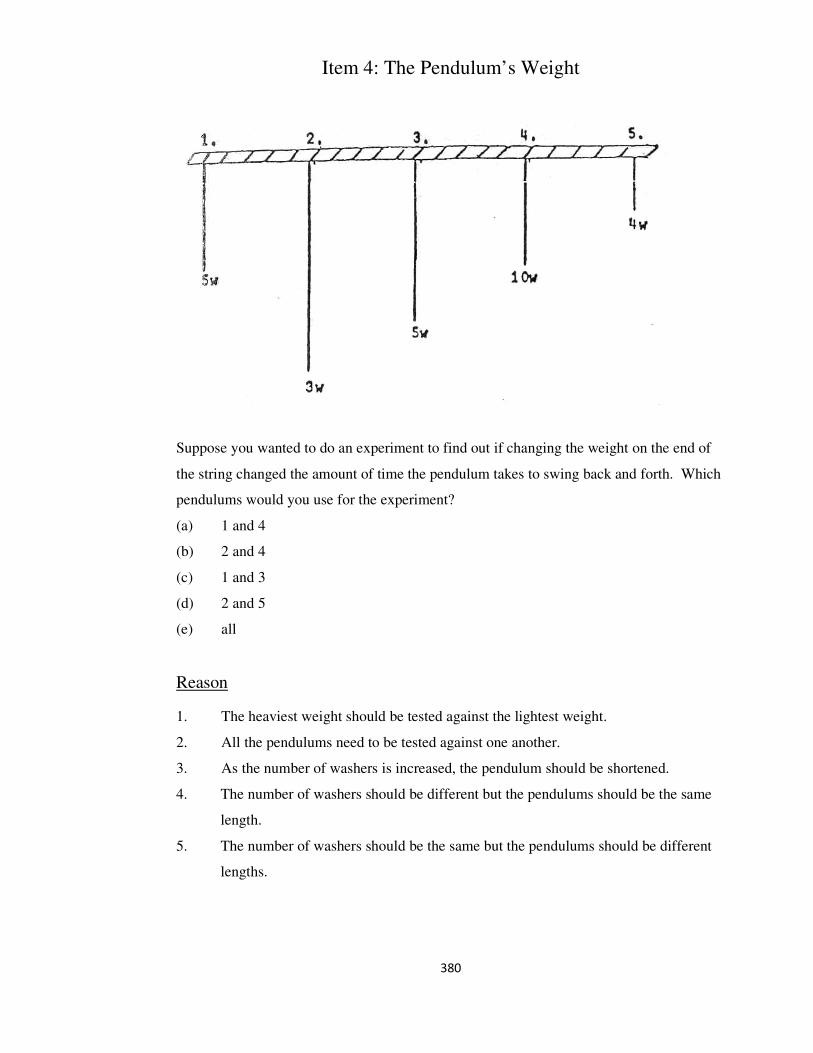
380
Item 4: The Pendulum’s Weight
Suppose you wanted to do an experiment to find out if changing the weight on the end of
the string changed the amount of time the pendulum takes to swing back and forth. Which
pendulums would you use for the experiment?
(a) 1 and 4
(b) 2 and 4
(c) 1 and 3
(d) 2 and 5
(e) all
Reason
1. The heaviest weight should be tested against the lightest weight.
2. All the pendulums need to be tested against one another.
3. As the number of washers is increased, the pendulum should be shortened.
4. The number of washers should be different but the pendulums should be the same
length.
5. The number of washers should be the same but the pendulums should be different
lengths.

381
Item 5: The Vegetable Seeds
A gardener bought a package containing 3 squash seeds and 3 bean seeds. If just one seed
is selected from the package, what are the chances that it is a bean seed?
(a) 1 out of 2
(b) 1 out of 3
(c) 1 out of 4
(d) 1 out of 6
(e) 4 out of 6
Reason
1. Four selections are needed because the three squash seeds could have been chosen
in a row.
2. There are six seeds from which one bean seed must be chosen.
3. One bean seed need to be selected from a total of three.
4. One half of the seeds are bean seeds.
5. In addition to a bean seed, three squash seeds could be selected from a total of six.
382
Item 6: The Flower Seeds
A gardener bought a package of 21 mixed seeds. The package contents listed:
3 short red flowers
4 short yellow flowers
5 short orange flowers
4 tall red flowers
2 tall yellow flowers
3 tall orange flowers
If just one seed is planted, what are the chances that the plant that grows will have red
flowers?
(a) 1 out of 2
(b) 1 out of 3
(c) 1 out of 7
(d) 1 out of 21
(e) other
Reason
1. One seed has to be chosen from among those that grow red, yellow or orange
flowers.
2. ¼ of the short and 4/9 of the tall are red.
3. It does not matter whether a tall or a short is picked. One red seed needs to be
picked from a total of seven red seeds.
4. One red seed must be selected from a total of 21 seeds.
5. Seven of the 21 seeds will produce red flowers.
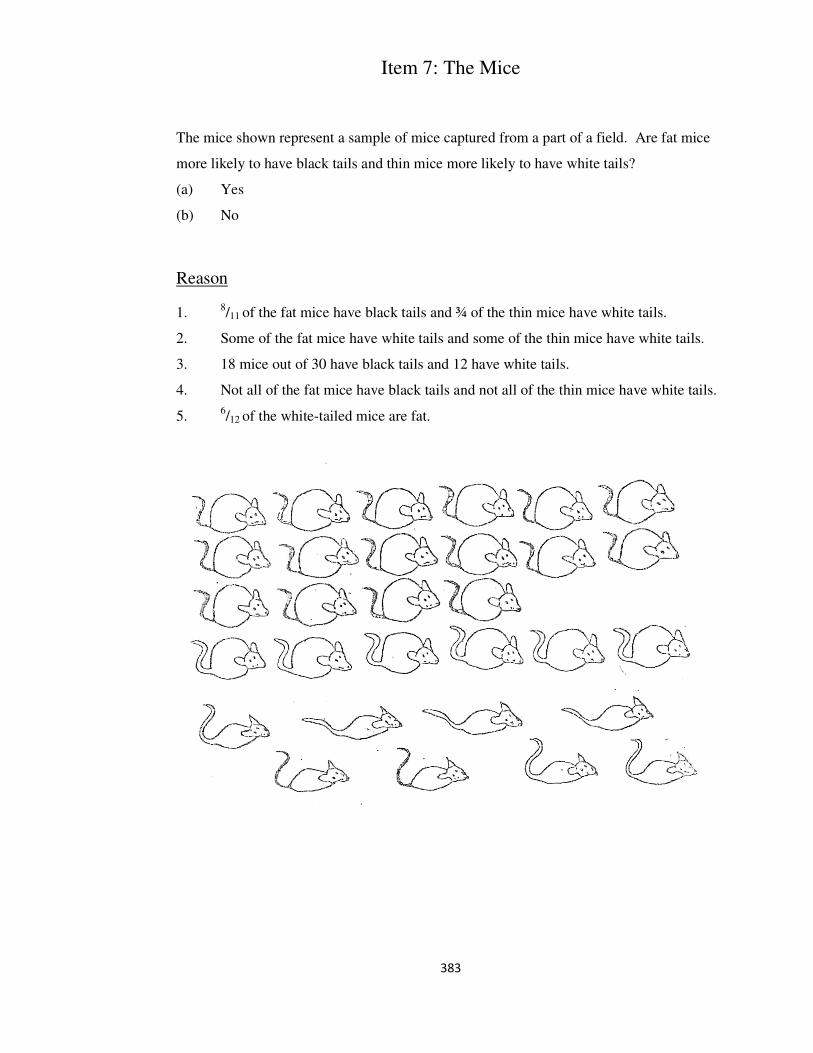
383
Item 7: The Mice
The mice shown represent a sample of mice captured from a part of a field. Are fat mice
more likely to have black tails and thin mice more likely to have white tails?
(a) Yes
(b) No
Reason
1. 8/11 of the fat mice have black tails and ¾ of the thin mice have white tails.
2. Some of the fat mice have white tails and some of the thin mice have white tails.
3. 18 mice out of 30 have black tails and 12 have white tails.
4. Not all of the fat mice have black tails and not all of the thin mice have white tails.
5. 6/12 of the white-tailed mice are fat.

384
Item 8: The Fish
Are fat fish more likely to have broad stripes than thin fish?
(a) Yes
(b) No
Reason
1. Some fat fish have broad stripes and some have narrow stripes.
2. 3/7 of the fat fish have broad stripes.
3. 12/28 are broad striped and
16/28 are narrow striped.
4. 3/7 of the fat fish have broad stripes and
9/21 of the thin fish have broad stripes.
5. Some fish with broad stripes are thin and some are fat.
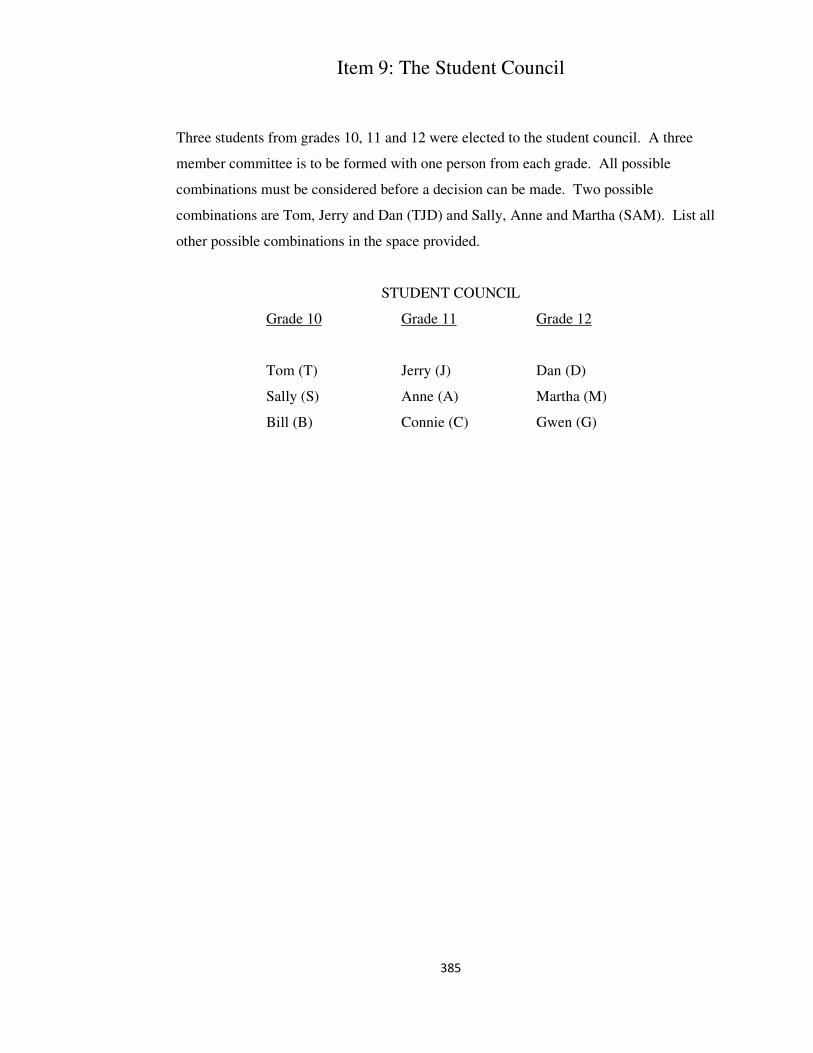
385
Item 9: The Student Council
Three students from grades 10, 11 and 12 were elected to the student council. A three
member committee is to be formed with one person from each grade. All possible
combinations must be considered before a decision can be made. Two possible
combinations are Tom, Jerry and Dan (TJD) and Sally, Anne and Martha (SAM). List all
other possible combinations in the space provided.
STUDENT COUNCIL
Grade 10 Grade 11 Grade 12
Tom (T) Jerry (J) Dan (D)
Sally (S) Anne (A) Martha (M)
Bill (B) Connie (C) Gwen (G)

386
Item 10: The Shopping Centre
In a new shopping centre, 4 store locations are going to be opened on the ground level. A
BARBER SHOP (B), a DISCOUNT STORE (D), a GROCERY STORE (G) and a
COFFEE SHOP (C) want to move in there. Each one of the stores can choose any one of
four locations. One way that the stores could occupy the four locations are BDGC. List all
other possible ways that the stores could occupy the four locations.
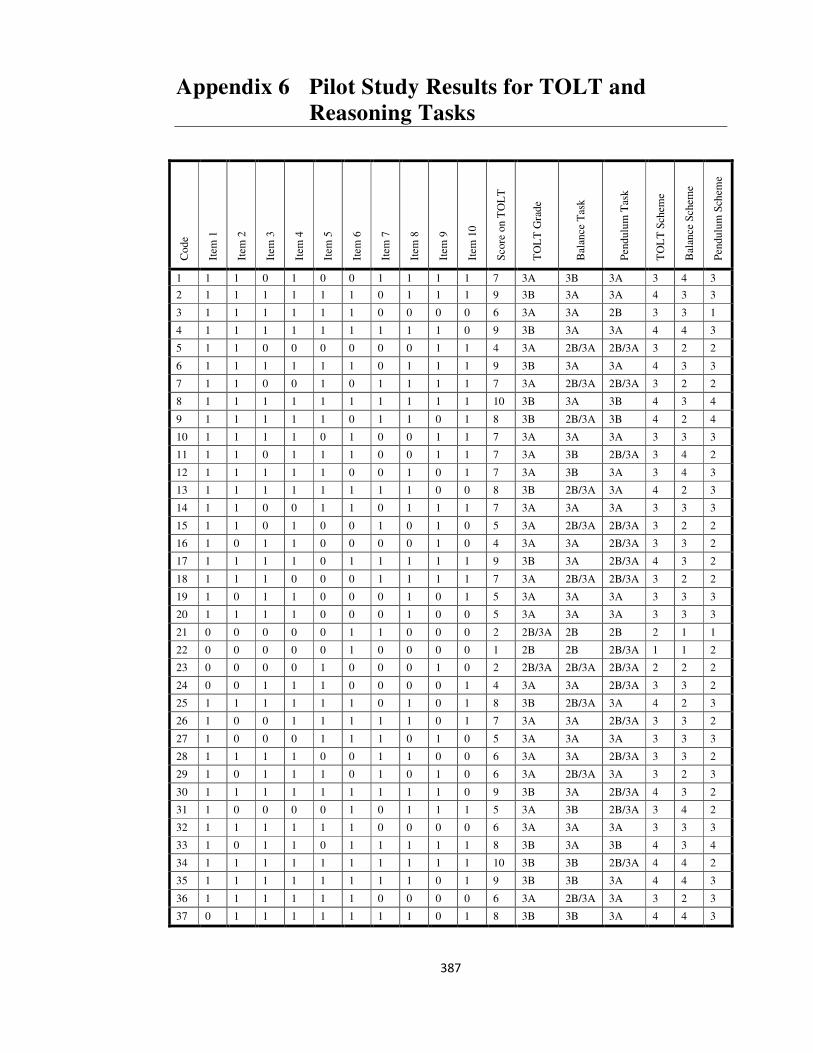
387
Appendix 6 Pilot Study Results for TOLT and
Reasoning Tasks
Code
Item
1
Item
2
Item
3
Item
4
Item
5
Item
6
Item
7
Item
8
Item
9
Item
10
Score
on T
OL
T
TO
LT
Gra
de
Bal
ance
Tas
k
Pendulu
m T
ask
TO
LT
Sch
eme
Bal
ance
Schem
e
Pendulu
m S
chem
e
1 1 1 0 1 0 0 1 1 1 1 7 3A 3B 3A 3 4 3
2 1 1 1 1 1 1 0 1 1 1 9 3B 3A 3A 4 3 3
3 1 1 1 1 1 1 0 0 0 0 6 3A 3A 2B 3 3 1
4 1 1 1 1 1 1 1 1 1 0 9 3B 3A 3A 4 4 3
5 1 1 0 0 0 0 0 0 1 1 4 3A 2B/3A 2B/3A 3 2 2
6 1 1 1 1 1 1 0 1 1 1 9 3B 3A 3A 4 3 3
7 1 1 0 0 1 0 1 1 1 1 7 3A 2B/3A 2B/3A 3 2 2
8 1 1 1 1 1 1 1 1 1 1 10 3B 3A 3B 4 3 4
9 1 1 1 1 1 0 1 1 0 1 8 3B 2B/3A 3B 4 2 4
10 1 1 1 1 0 1 0 0 1 1 7 3A 3A 3A 3 3 3
11 1 1 0 1 1 1 0 0 1 1 7 3A 3B 2B/3A 3 4 2
12 1 1 1 1 1 0 0 1 0 1 7 3A 3B 3A 3 4 3
13 1 1 1 1 1 1 1 1 0 0 8 3B 2B/3A 3A 4 2 3
14 1 1 0 0 1 1 0 1 1 1 7 3A 3A 3A 3 3 3
15 1 1 0 1 0 0 1 0 1 0 5 3A 2B/3A 2B/3A 3 2 2
16 1 0 1 1 0 0 0 0 1 0 4 3A 3A 2B/3A 3 3 2
17 1 1 1 1 0 1 1 1 1 1 9 3B 3A 2B/3A 4 3 2
18 1 1 1 0 0 0 1 1 1 1 7 3A 2B/3A 2B/3A 3 2 2
19 1 0 1 1 0 0 0 1 0 1 5 3A 3A 3A 3 3 3
20 1 1 1 1 0 0 0 1 0 0 5 3A 3A 3A 3 3 3
21 0 0 0 0 0 1 1 0 0 0 2 2B/3A 2B 2B 2 1 1
22 0 0 0 0 0 1 0 0 0 0 1 2B 2B 2B/3A 1 1 2
23 0 0 0 0 1 0 0 0 1 0 2 2B/3A 2B/3A 2B/3A 2 2 2
24 0 0 1 1 1 0 0 0 0 1 4 3A 3A 2B/3A 3 3 2
25 1 1 1 1 1 1 0 1 0 1 8 3B 2B/3A 3A 4 2 3
26 1 0 0 1 1 1 1 1 0 1 7 3A 3A 2B/3A 3 3 2
27 1 0 0 0 1 1 1 0 1 0 5 3A 3A 3A 3 3 3
28 1 1 1 1 0 0 1 1 0 0 6 3A 3A 2B/3A 3 3 2
29 1 0 1 1 1 0 1 0 1 0 6 3A 2B/3A 3A 3 2 3
30 1 1 1 1 1 1 1 1 1 0 9 3B 3A 2B/3A 4 3 2
31 1 0 0 0 0 1 0 1 1 1 5 3A 3B 2B/3A 3 4 2
32 1 1 1 1 1 1 0 0 0 0 6 3A 3A 3A 3 3 3
33 1 0 1 1 0 1 1 1 1 1 8 3B 3A 3B 4 3 4
34 1 1 1 1 1 1 1 1 1 1 10 3B 3B 2B/3A 4 4 2
35 1 1 1 1 1 1 1 1 0 1 9 3B 3B 3A 4 4 3
36 1 1 1 1 1 1 0 0 0 0 6 3A 2B/3A 3A 3 2 3
37 0 1 1 1 1 1 1 1 0 1 8 3B 3B 3A 4 4 3

388
Appendix 7 PowerPoint Presentation
(Fullick, 2000)
(Fullick, 2000) (Fullick, 2000)
(Hewitt, 2002)

389
(Abbott, 1969) (Abbott, 1969)
(Abbott, 1969)
(Hewitt, 2002) (Hewitt, 2002)

390
(England, Milward & Barratt, 1990) (Bradley, Gale & Winterbottom, 2001)
(Twenty First Century Science Project, 2003)
(Chapman, Musker, Nicholson & (Xuereb, 1999)
Sheehan, 2000)

391
(Millar, 1989)
(Breithaupt, 2000)
(Mee, Arnold, Crundell & Brown, 2000) (Warren, 1983)
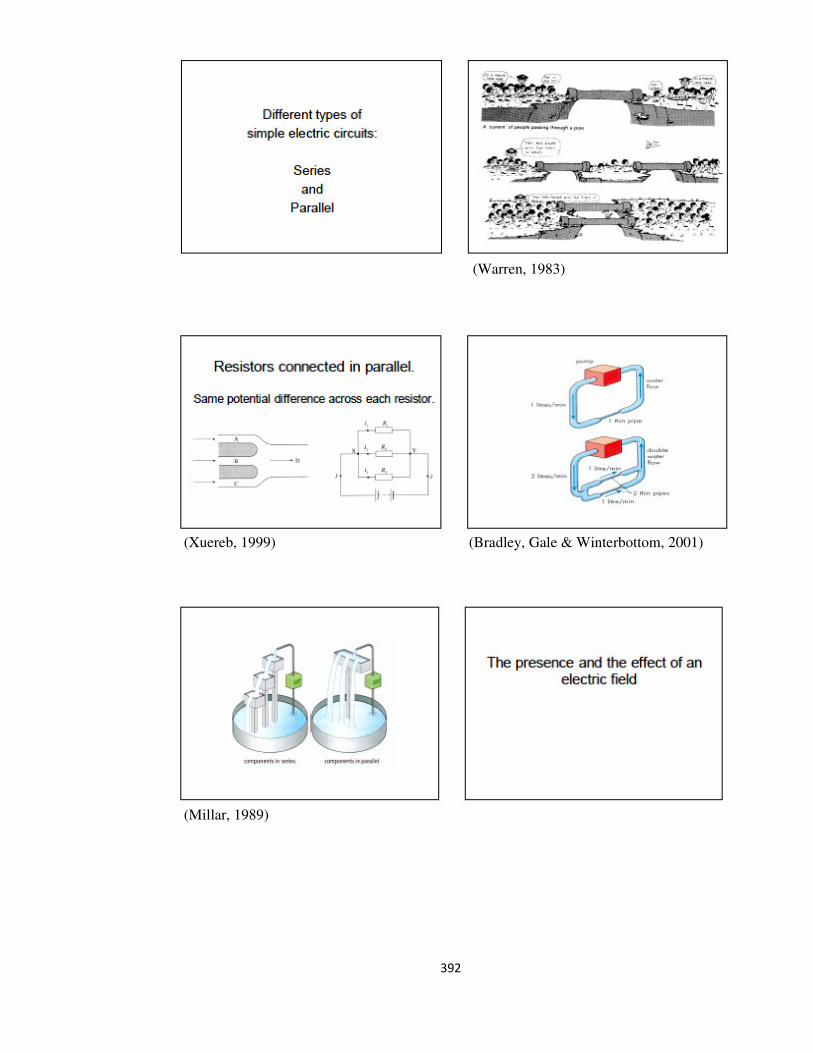
392
(Warren, 1983)
(Xuereb, 1999) (Bradley, Gale & Winterbottom, 2001)
(Millar, 1989)

393
(Haertel, 1987)
(Haertel, 1987) (Swartz, 2003)
(Hewitt, 2002) (Hewitt, 2002)

394
Appendix 8 Interview Schedules used with Cohort 1
1st Interview – Current in a simple circuit
The student will be thanked for accepting to be interviewed and told that the
interview will take about an hour. It will be made clear that the researcher needs to get a
better view of what the student understands about electric circuits. The student will be
reassured that what the researcher is looking for is not necessarily correct answers but
answers which reveal the student’s ideas as learning and understanding are in progress.
Figure 1: A simple circuit
The circuit diagram in Figure 1 will be shown to the student being interviewed.
The student will be asked the following questions:
• Describe your mental picture of what is happening in this electric circuit when S is
switched on.
• What affects the ammeter reading? Why?
• What do you imagine is happening within the circuit? What mental model do you have
as you give this answer?
The student will be supplied with the necessary apparatus to construct the
circuit. Help will be offered, if required. The interview will use the Predict-Observe-
Explain technique to probe further into the models of current flow inferred by the student’s
answers. The student will be asked to predict what will happen when the circuit is
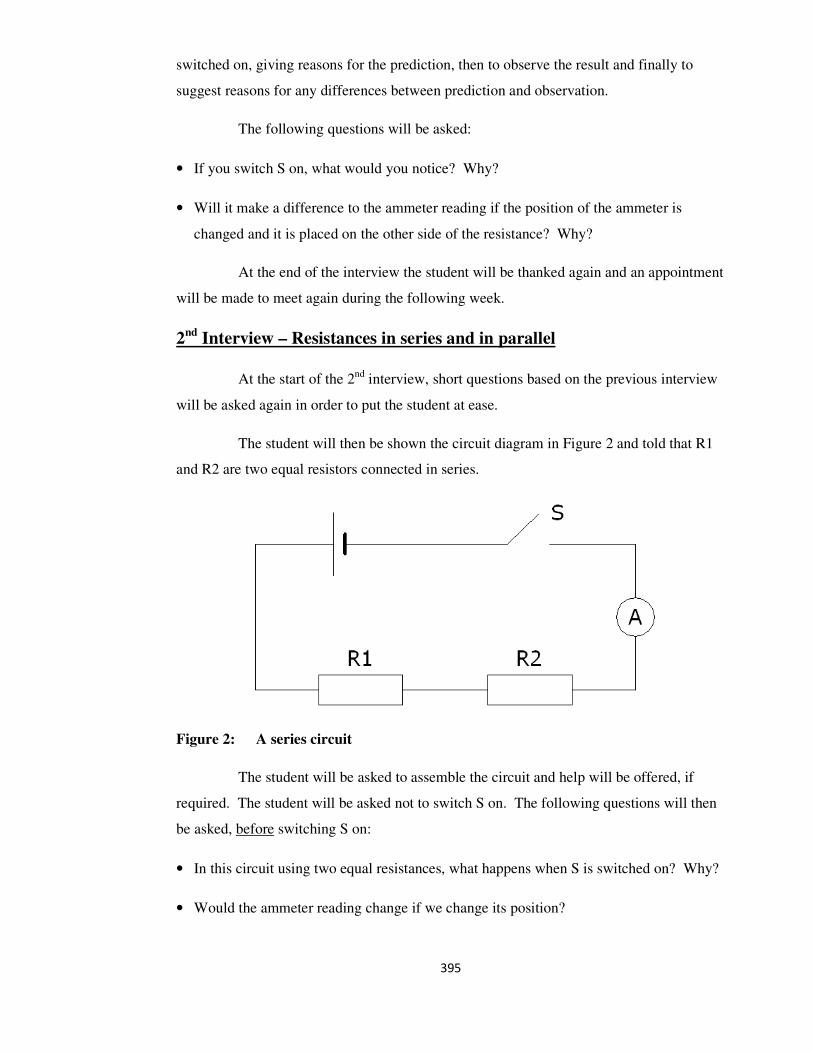
395
switched on, giving reasons for the prediction, then to observe the result and finally to
suggest reasons for any differences between prediction and observation.
The following questions will be asked:
• If you switch S on, what would you notice? Why?
• Will it make a difference to the ammeter reading if the position of the ammeter is
changed and it is placed on the other side of the resistance? Why?
At the end of the interview the student will be thanked again and an appointment
will be made to meet again during the following week.
2nd
Interview – Resistances in series and in parallel
At the start of the 2nd
interview, short questions based on the previous interview
will be asked again in order to put the student at ease.
The student will then be shown the circuit diagram in Figure 2 and told that R1
and R2 are two equal resistors connected in series.
Figure 2: A series circuit
The student will be asked to assemble the circuit and help will be offered, if
required. The student will be asked not to switch S on. The following questions will then
be asked, before switching S on:
• In this circuit using two equal resistances, what happens when S is switched on? Why?
• Would the ammeter reading change if we change its position?
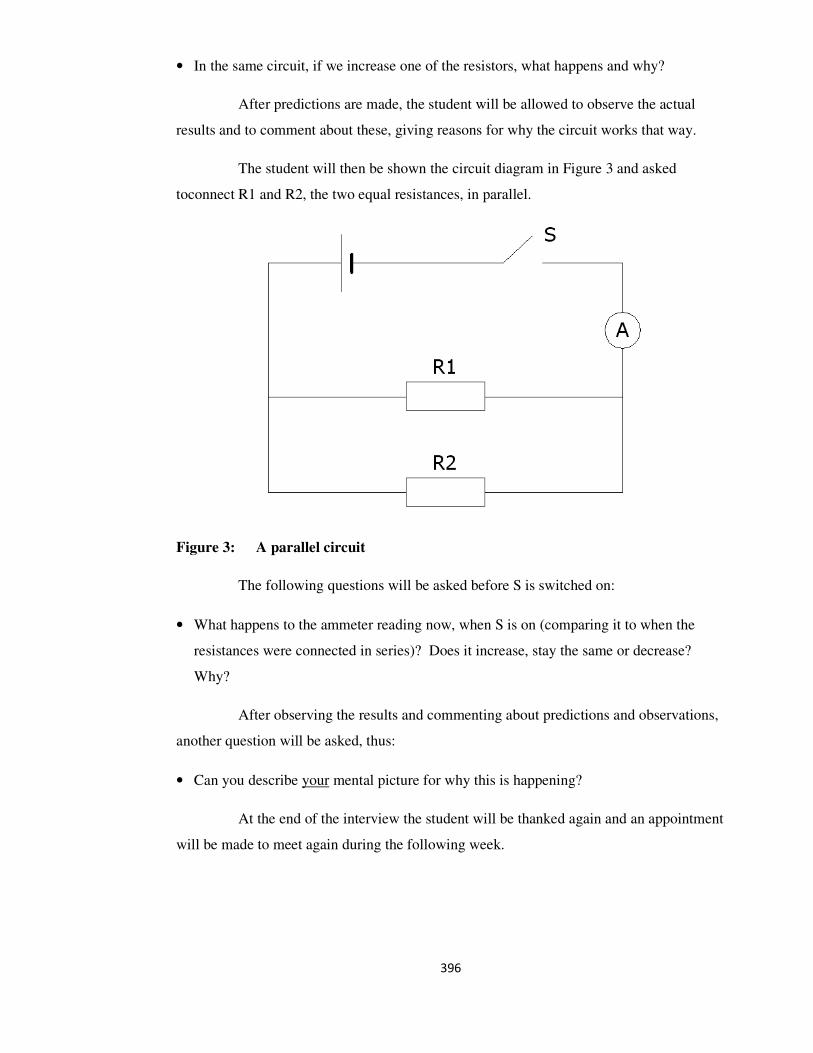
396
• In the same circuit, if we increase one of the resistors, what happens and why?
After predictions are made, the student will be allowed to observe the actual
results and to comment about these, giving reasons for why the circuit works that way.
The student will then be shown the circuit diagram in Figure 3 and asked
toconnect R1 and R2, the two equal resistances, in parallel.
Figure 3: A parallel circuit
The following questions will be asked before S is switched on:
• What happens to the ammeter reading now, when S is on (comparing it to when the
resistances were connected in series)? Does it increase, stay the same or decrease?
Why?
After observing the results and commenting about predictions and observations,
another question will be asked, thus:
• Can you describe your mental picture for why this is happening?
At the end of the interview the student will be thanked again and an appointment
will be made to meet again during the following week.

397
3rd
Interview – Part 1: Probing microscopic views
The student will be shown Qn 4 dealing with microscopic views of circuit (see
Appendix 3) and her/his answers to the question in the pre-test. The student will be asked
for reasons which prompted these answers, while at the same time she/he will be allowed
to talk of the mental models of circuit which had guided the pre-test answers and also to
describe how these models may now have changed because of the student’s learning
experience.
3rd
Interview – Part 2: Meanings attributed to voltmeter readings
The student will be shown the circuit diagram in Figure 4 and asked to connect
the series circuit using two equal resistances, without switching S on.
Figure 4: Voltmeter readings in a series circuit
The following questions will be asked to the student:
• What will the voltmeters read when the resistances are equal and S is closed? Why?
• What will the voltmeters read when one of the resistances is increased? Why?
The student will then be allowed to observe the actual results and will be asked
to provide reasons for why the circuit behaves this way, with the aim of finding out what
meanings the student gives to the voltmeter readings.

398
The student will then be asked to connect two equal resistances in parallel, as
shown in Figfure 5.
Figure 5: Voltmeter readings in a parallel circuit
The following questions will be asked before switching S on:
• What will the voltmeters read when the resistances are equal? Why?
• What will the voltmeters read when one of the resistances is increased? Why?
After observing the results, the student will be asked for reasons why the circuits
behave this way.
At the end, the student will be asked a direct question about the voltmeter
reading, thus:
• What does the voltmeter reading mean to you? Why?
At the end of the interview the student will be thanked again and an appointment
will be made to meet again during the following week.
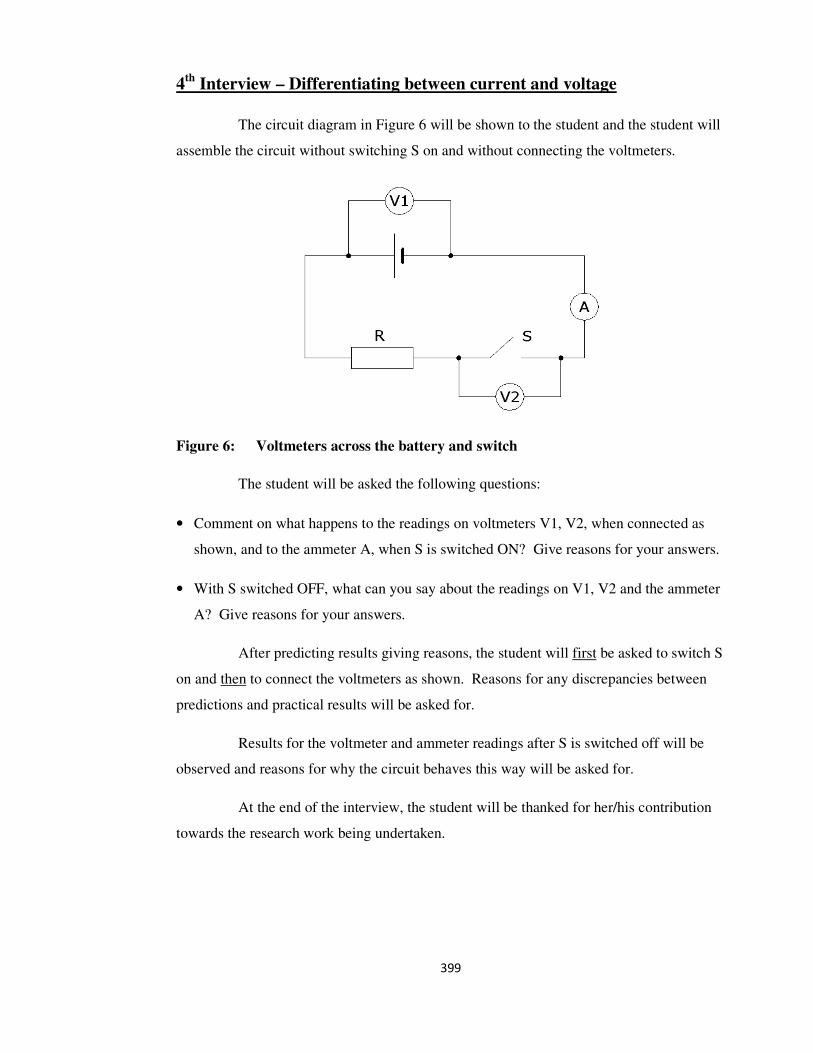
399
4th
Interview – Differentiating between current and voltage
The circuit diagram in Figure 6 will be shown to the student and the student will
assemble the circuit without switching S on and without connecting the voltmeters.
Figure 6: Voltmeters across the battery and switch
The student will be asked the following questions:
• Comment on what happens to the readings on voltmeters V1, V2, when connected as
shown, and to the ammeter A, when S is switched ON? Give reasons for your answers.
• With S switched OFF, what can you say about the readings on V1, V2 and the ammeter
A? Give reasons for your answers.
After predicting results giving reasons, the student will first be asked to switch S
on and then to connect the voltmeters as shown. Reasons for any discrepancies between
predictions and practical results will be asked for.
Results for the voltmeter and ammeter readings after S is switched off will be
observed and reasons for why the circuit behaves this way will be asked for.
At the end of the interview, the student will be thanked for her/his contribution
towards the research work being undertaken.

400
Appendix 9 Interview Schedules used with Cohort 2
The student will be thanked for accepting to be interviewed and told that the
interview will take about an hour. It will be made clear that the researcher needs to get a
better view of what the student understands about electric circuits. The student will be
reassured that what the researcher is looking for is not necessarily correct answers but
answers which reveal what the student’s ideas are of how the circuit functions.
The student will be shown the circuit diagram in Figure 1, and then asked the
following questions:
Figure 1: A simple circuit
• What is your mental picture of how the circuit works when S is switched ON?
• What models/ideas do you use to help you understand how the circuit functions?
• To what do you compare what goes on in the circuit so that you can help your
understanding?
The student will next be shown Figure 2, and then asked the following
questions:
Figure 2: A series circuit
V
R
S
V
R1
S
R2

401
• When you see Figure 2, imagine that R1 and R2 are two equal resistances connected in
series, how do you explain what goes on in the circuit?
• What do you ‘see’ or imagine is going on within the circuit?
Figure 3: A parallel circuit
The student will then be asked to look at Figure 3. She/he will be told that S1 is
first switched on, making the upper part of the circuit the same as the circuit in Figure 1.
The student will be told that now there is an added branch in the circuit which includes R2
and S2. The following questions will then be asked:
• What happens when S2 is switched on? What picture do you imagine?
• Can you use your previous comparison, developing it further, to explain how you ‘see’
what is happening in this circuit?
At this point, irrelevant of any comparison students may have made, and even if
students have not mentioned any comparison at all, I shall introduce the water analogy
myself to them, thus:
• Now, I wish to ask you to give me your interpretation of how you see the circuit
working in terms of water passing through pipes. Let us say that before S2 was
switched on, but with S1 closed, 100cm3/s of water was flowing through the circuit.
What do you imagine happens when S2 is switched on?
• In Figure 3, does the potential difference across the upper resistor (which is in the
circuit already when S1 is switched on) change when S2 is switched on?
• How do you visualise this potential difference? What meaning does this potential
difference have for you?
V S1
R2
R1
S2
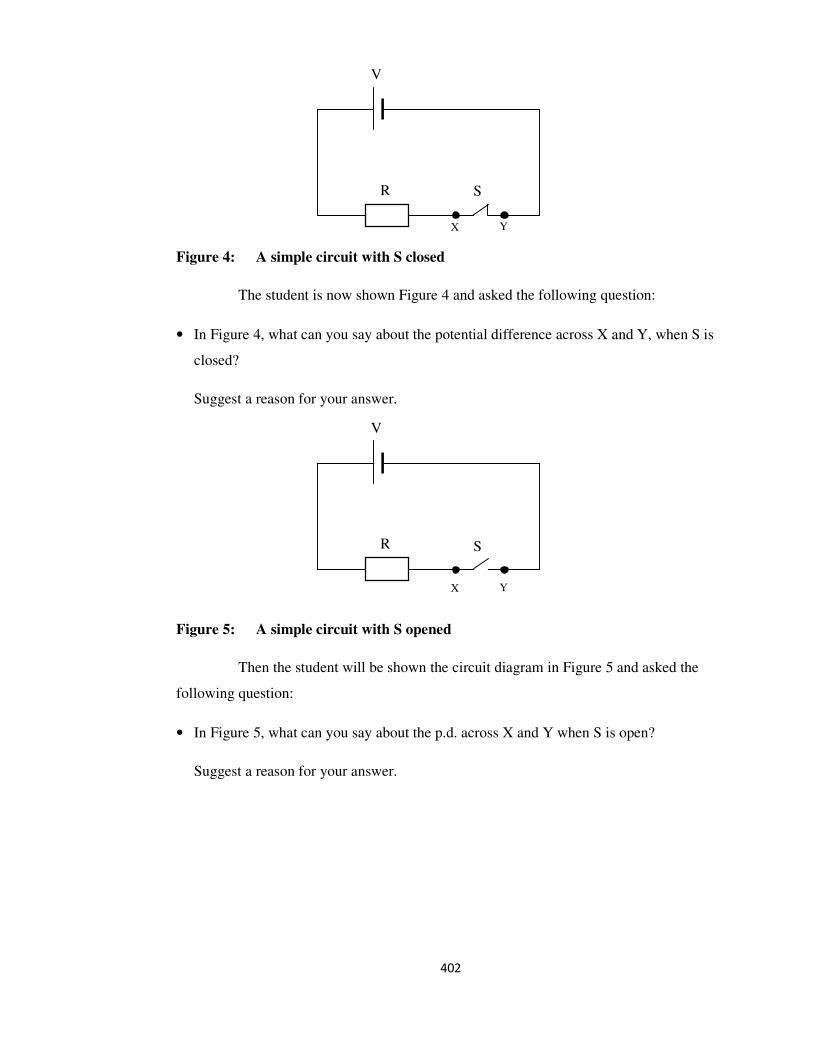
402
Figure 4: A simple circuit with S closed
The student is now shown Figure 4 and asked the following question:
• In Figure 4, what can you say about the potential difference across X and Y, when S is
closed?
Suggest a reason for your answer.
Figure 5: A simple circuit with S opened
Then the student will be shown the circuit diagram in Figure 5 and asked the
following question:
• In Figure 5, what can you say about the p.d. across X and Y when S is open?
Suggest a reason for your answer.
V
R S
X Y
V
R S
X Y

403
Appendix 10 An Extract from Dan’s Transcript – The
Interview with a Difference
Dan was a student in Cohort 2. He was a high ability student who was asked to
be interviewed. The following transcript describes how Dan used the water analogy to
understand and explain how he looked at resistors connected in parallel.
Dan: Now there are 2 paths for the electrons and these have a better chance to
pass… They pass more easily. More of them pass.
I: More of them move?
Dan: In fact, the battery gets drained more easily. In fact, when the R is less,
more electrons flow. If the battery is short circuited, then R=0 and the
battery is used up immediately. Here there is a lower R, the battery is used
up quicker and the electrons move and separate out more easily.
I: So can you try and visualize the situation in terms of some comparison
within another context?
Dan: There are many things you can compare it with. Water, say. You can
consider the battery as a tank which is placed high up so that you can
create the p.d. You put the tank high up and a pipe lower down. In this
case you are using 2 pipes since there are 2 resistances in parallel. The 2
pipes are in parallel. The water comes out of the tank more quickly from 2
pipes instead of 1. More water comes out, because if there is just 1 pipe, a
certain amount of water is released, but if you open another outlet there
will be 2 pipes. The pipes have to be the same width if the resistances are
the same and more water comes out.
I: And if you were to imagine a certain amount of water flowing, say
100cm3 /s, flowing when you only had one resistor?
Dan: This is the ‘current’ in terms of water flow. Now with electrons the
current is electrons per second. In fact current is charge transfer per unit
time.
I: So now, how would you imagine the situation when switch 2 is switched
on?
Dan: Now the rate will be increased. It will be doubled. Double what it was
before, since a new path has been introduced. They both have the same
pressure, these pipes, since the voltage remains the same. The 2 pipes will
have the same pressure of water through them, because the pressure is the
same and you’ve opened a larger flow of water. So now you have an extra
100cm3 /s. Now you have 200cm
3 /s.
I: From where?
Dan: Going out of the battery and reaching it again. So if we consider it as
water, I mean that from the tank to the ground, 200cm3 /s have come out
and have reached the pipes.
I: And how much would be passing through switch 2 and the first R?
Dan: 100cm3 /s
I: So you see it that way. Do you find the comparison you made with water
…because you came up with it after all… do you find it useful for you?

404
Dan: Very much so. You can imagine new pathways, extra pipes for water to
pass through. You have a complicated system and you can see it better
with this comparison. It depends though. If you have 4 or 5 resistors, then
you have to imagine different widths, lengths…. But in terms of the
concept, it is always the same.
I: So do you see that there are difficulties when you compare, but that it
helps you at the same time?
Dan: It depends. 4 ohms and 5 ohms it will be difficult to imagine, but in terms
of the concept it is the same. The equations may be used in both. But
through an exam or in solving problems you cannot take the area of the
pipe …etc. Then it becomes more complicated. Then you start working
on the circuit directly. But, just to imagine what is really happening, it
works. You don’t see the electrons, you only see the result.
I: Has there been any time when you realized it is helpful but you also
noticed that there were situations when the comparison had its limits? Do
you recognize these limits?
Dan: Recognise these limits?! If it works, I mean it is ok. It is almost all the
same. In one case it is the electrons which move, in the other case it is
water. Both can be seen in terms of particles. It is the size which is
different. I think that it always works. That is what I think. If you want to
see it, instead of the ammeter and voltmeter in circuits, you use the flow-
meter and the pressure-meter in water. The latter would indicate the
voltage but it would calculate pressure. The flow-meter works like the
ammeter, seeing the current flow through it.
I: By the way, did you always use this comparison?
Dan: At the start, you start trying to understand it, then you start seeing the
electrons moving. You start saying that the electrons move in the same
way as the water does. Then you start not using so much passages and
pipes, because you get used to the way the concept works. Because all it
is, is passages and paths through which water and electrons pass.
I: But since when did you use this comparison? Has it been since a long
time ago or did you just start using it here at the college?
Dan: Even since I was young I used to use these ideas. I used to go to our
garage and play with switches and batteries. I always tried to understand
what was happening in terms of water. Then when we covered the topic of
capacitors at the college, the teacher asked us to compare and use this tank
analogy and I started to agree more with what I had been thinking. So I
continued along this way of thinking.
I: So this was at the college.
Dan: I went on further to agree with what I knew already… what I had been
comparing before.
I: And one more thing about this circuit, before we go to something else. If I
were to ask you how you visualize voltage across this resistor, if switch 2
is open…?
Dan: V across the first resistor.
I: And when you switch it on?
Dan: V also. No change. It will be the same voltage for both resistors. It is the
same wires.
I: So you think there won’t be a change.

405
Dan: I see it like pressure in the water. Yes, exactly so. It varies according to
the resistance, that is depending on how the pipe is and depending on how
much flow there is in it.
[And later on during the interview]
I: Do you remember the PowerPoint presentation which I showed you in
class, and the DVD?
Dan: The one with the ducks!
I: Which one was that?
Dan: When you had 2 pipes with ducks going through. Just the same as for
water. When you open 2 paths, it is the same.
I: Did you like that presentation?
Dan: Everything helps. It was the same as the water analogy. I saw everything
linked with each other.
I: So you made more comparisons?
Dan: Yes.
I: And do you suggest that it be shown to other people?
Dan: Yes, very much… for those people especially who do not know what
electricity is, it would be really helpful.
I: Did it help you also?
Dan: Yes, because I could agree and clear my doubts.

406
Bibliography
AAAS (American Association for the Advancement of Science) (2008). Science for all
Americans: Online. Retrieved July 26, 2008 from
http://www.project2061.org/publications/sfaa/online/sfaatoc.htm
Abbott, A. F. (1969). Ordinary level physics. London: Heinemann Educational Books.
Aguirre, J. (1988). Student preconceptions about vector kinematics. The Physics Teacher,
26(4), 212-216.
Anderson, G. (1998).Fundamentals of Educational Research(2nd
ed.). London: Falmer
Press.
Andersson, B. (1986). The experiential gestalt of causation: A common core to pupils’
preconceptions in science. European Journal of Science Education, 8(2), 155-171.
Arnold, M., & Millar, R. (1987). Being constructive: An alternative approach to the
teaching of introductory ideas in electricity. International Journal of Science Education,
9(5), 553-563.
Asami, N., King, J., & Monk, M. (2000). Tuition and memory: Mental models and
cognitive processing in Japanese children’s work on d.c. electrical circuits. Research in
Science and Technological Education, 18(2), 141-154.
Assis, A. K. T., Hernandes, J. A., & Lamesa, J. E. (2001). Surface charges in conductor
plates carrying constant currents. Foundations of Physics, 31(10), 1501-1511.
Ausubel, D. P. (1968). Educational psychology: A cognitive view. New York: Holt,
Reinhart, & Winston.
Bassey, M. (1999). Case study research in educational settings. Buckingham: Open
University Press.
Bell, B., & Cowie, B. (2001). The characteristics of formative assessment in science
education. Science Education, 85(5), 536-553.
Borg Marks, J. (1998). The gifted child. Unpublished master’s dissertation, University of
Loughborough.
Borg Marks, J. (2007, August). Do students just see what they want to see? Some revealing
aspects of a pilot study dealing with the learning of electricity at pre-university level.
Unpublished paper presented at the International Conference of the European Science
Education Research Association (ESERA), Malmö, Sweden.
Borg Marks, J. (2008, August). Understanding key concepts in current electricity.
Unpublished paper presented at the European Science Education Research Association
(ESERA) Summer School, York, U.K.

407
Borg Marks, J. (2009a, August/September). Capturing students’ mental models of ‘electric
circuit’: the establishment of learning pathways. Unpublished paper presented at the
International Conference of the European Science Education Research Association
(ESERA), Istanbul, Turkey.
Borg Marks, J. (2009b, June). Predict-observe-explain sessions with students at pre-
university level, as they learn the topic of current electricity. Unpublished paper presented
at the First Malta International Forum on Learning, Malta.
Borges, A. T., & Gilbert, J. K. (1999). Mental models of Electricity. International Journal
of Science Education, 21(1), 95-117.
Borghi, L., De Ambrosis, A., & Mascheretti, P. (2007). Microscopic models for bridging
electrostatics and current. Physics Education, 42(2), 146-155.
Boston, C. (2002). The concept of formative assessment. Practical Assessment, Research
& Evaluation, 8(9). Retrieved November 30, 2012 from
http://PAREonline.net/getvn.asp?v=8&n=9
Brace, N., Kemp, R., & Snelgar, R. (2006). SPSS for psychologists (3rd
ed.). Hampshire:
Palgrave Macmillan.
Bradley, I., Gale, P., & Winterbottom, M. (2001). The Heinemann Science Scheme:
Books 1- 3. Oxford: Heinemann.
Breithaupt, J. (2000). New understanding physics for advanced level (4th
ed.). Cheltenham:
Stanley Thornes Publishers Ltd.
Bullock, B. (1979). The use of models to teach elementary physics. Physics Education, 14,
312-317.
Carlton, K. (1999). Teaching electric current and electric potential. Physics Education,
34(6), 341-345.
Carmichael, P., Watts, M., Driver, R., Holding, B., Philips, I., & Twigger, D. (1990).
Research on students’ conceptions in science: A bibliography. Leeds: Children’s Learning
in Science Research Group.
Casperson, J. M., & Linn, M. C. (2006). Using visualizations to teach electrostatics.
American Journal of Physics, 74(4), 316-323.
Chabay, R. W., & Sherwood, B. A. (1994). Electric and magnetic interactions. New York:
Wiley.
Chabay, R. W., & Sherwood, B. A. (1999). A unified treatment of electrostatics and
circuits. Carnegie Mellon University: Pittsburgh PA 15213. Retrieved June 10, 2008, from
http://www.matterandinteractions.org/Content/Articles/circuit.pdf
Chapman, C., Musker, R., Nicholson, D., & Sheehan, M. (2000). Eureka. Success in
science, Unit 1G. Oxford: Heinemann.
Chetcuti, K. (2011, June 19). No improvement in Malta’s education challenges. The
Sunday Times (Malta), p. 71.
408
Chiu, M., Chou, C., & Liu, C. (2002). Dynamic processes of conceptual change: Analysis
of constructing mental models of chemical equilibrium. Journal of Research in Science
Teaching, 39(8), 688-712.
Clement, J. (1989). Learning via model construction and criticism: Protocol evidence on
sources of creativity in science. In J. A. Glover, R. R. Ronning, & C. R. Reynolds (Eds.),
Handbook of creativity: Assessment, theory and research (pp. 341-381). New York:
Plenum Press.
Clement, J. (2000). Model based learning as a key research area for science education.
International Journal of Science Education, 22(9), 1041-1053.
Clement, J. (2011, September). Roles for non-formal reasoning and imagery in expert
scientific model construction. Unpublished paper presented at the 9th
International
Conference of the European Science Education Research Association (ESERA), Lyons,
France.
Clement, J. J. (2008a). Model based learning and instruction in science. In J. Clement &
M. A. Rea-Ramirez (Eds.), Model based learning and instruction in science (pp. 1-9).
USA: Springer.
Clement, J. J. (2008b). Student/Teacher co-construction of visualisable models in large
group discussion. In J. Clement & M. A. Rea-Ramirez (Eds.), Model based learning and
instruction in science (pp. 11-22). USA: Springer.
Clement, J. J. (2009). Creative model construction in scientists and students - The role of
imagery, analogy, and mental simulation. USA: Springer.
Clement, J. J., & Steinberg, M. S. (2002). Step-wise evolution of mental models of electric
circuits: A "learning-aloud" case study. The Journal of the Learning Sciences, 11(4), 389-
452.
Closset, J. L. (1983). Sequential reasoning in electricity. In Research on physics education,
Proceedings of the first international workshop (pp. 313-319). Paris: Editions du Centre
National de la Recherche Scientifique.
Cohen, L., Manion, L., & Morrison, K. (2001). Research methods in education (5th ed.).
London: RoutledgeFalmer.
Cohen, R., Eylon, B., & Ganiel, U. (1983). Potential difference and current in simple
electric circuits: A study of students’ concepts. American Journal of Physics, 51(5), 407-
412.
Coll, R. K., & Lajium, D. (2011). Modeling and the future of science learning. In M. S.
Khine & I. M. Saleh (Eds.), Models and modeling: Cognitive tools for scientific enquiry
(pp. 3-23). Dordrecht: Springer.
Coll, R. K., France, B., & Taylor, I. (2005). The role of models/and analogies in science
education: Implications from research. International Journal of Science Education, 27(2),
183-198.
Constantinou, C. P. & Papadouris, N. (2004). Potential contribution of digital video to the
analysis of the learning process in physics: A case study in the context of electric circuits.
Educational Research and Evaluation, 10(1), 21–39.

409
Cosgrove, M. (1995). A study of science-in-the-making as students generate an analogy for
electricity. International Journal of Science Education, 17(3), 295-310.
Costello, P. (2011). Effective action research: Developing reflective thinking and practice.
London: Continuum International Publishing Group.
DeBoer, G. (2011). Assessment as a tool for improving science teaching and learning. In
an editorial of the July 2011 issue of NSTA Reports. Retrieved August 20, 2011 from
http://www.project2061.org/publications/2061connections/2011/documents/summer2011c
ommentary.NSTAReports_2.pdf
De Posada, J. M. (1997). Conceptions of high school students concerning the internal
structure of metals and their electric conduction: Structure and evolution. Science
Education, 81(4), 445-467.
Directorate for Quality and Standards in Education (Malta). (2012). Primary syllabi for
Years 1 to 6: Science [Electronic database]. Directorate for Quality and Standards in
Education. Retrieved July 27, 2012 from
http://www.curriculum.gov.mt/primary_syllabi.htm
diSessa, A. (1988). Knowledge in pieces. In G. Forman & P. Pufall (Eds.), Constructivism
in the computer age (pp. 49-70). Hillsdale, NJ: Lawrence Erlbaum Associates, Inc.
diSessa, A. (1993). Toward an epistemology of physics. Cognition and Instruction,
10(2/3),105-225.
Driver, R. (1991). The pupil as scientist? Buckingham: The Open University Press.
Driver, R., & Easley, J. (1978). Pupil and paradigms: A review of the literature related to
concept development in adolescent science students. Studies in Science Education, 5, 61-
84.
Duit, R. (1985). Students’ representations of the topological structure of the simple electric
circuit. In R. Duit, W. Jung & C. von Rhöneck (Eds.), Aspects of understanding electricity:
Proceedings of an international workshop (pp. 83-93). Kiel: IPN.
Duit, R. (1991). On the role of analogies and metaphors in learning science. Science
Education, 75, 649-672.
Duit, R. (2009). Students' and teachers' conceptions and science education (STCSE)
bibliography. Retrieved October 8, 2010 from http://www.ipn.uni-
kiel.de/aktuell/stcse/stcse.html
Duit. R., & Glynn, S. M. (1996). Mental modelling. In G. Welford, J. Osborne, & P. Scott
(Eds.), Research in science education in Europe: Current issues and themes (pp. 166-176).
London: Falmer Press.
Duit, R., & von Rhöneck, C. (1998). Learning and understanding key concepts of
electricity. In A. Tiberghien, E. L. Jossem, & J. Barojas (Eds.), Connecting research in
physics education with teacher education, (section C2). International Commission on
Physics Education. Retrieved November 14, 2012 from
ww.physics.ohio-state.edu/~jossem/ICPE/BOOKS.html
Duit, R., Jung, W., & von Rhöneck, C. (1985). Aspects of understanding electricity:
Proceedings of an international workshop. Kiel: IPN.

410
Duncan, T. (1994). Advanced physics (4th
ed.). London: John Murray (Publishers) Ltd.
Dupin, J.-J., & Johsua, S. (1987). Conceptions of French pupils concerning electric
circuits: Structure and evolution. Journal of Research in Science Teaching, 24(9), 791-806.
Duschl, R. A., Schweingruber, H. A., & Shouse, A. W. (Eds.) (2006). Taking science to
school: Learning and teaching science in grades K-8. Board on Science Education, Center
for Education, Division of Behavioral and Social Sciences and Education. Washington,
DC: The National Academies Press. Retrieved December 10, 2008 from
http://www.nap.edu/catalog.php?record_id=11625
Else, M. J., Clement, J., & Rea-Ramirez, M. A. (2008). Using analogies in science
teaching and curriculum design: Some guidelines. In J. Clement & M. A. Rea-Ramirez
(Eds.), Model based learning and instruction in science (pp. 215-231). USA: Springer.
Engelhardt, P. V., & Beichner, R. J. (2004). Students' understanding of direct current
resistive electrical circuits. American Journal of Physics, 72(1), 98-115.
England, N., Milward, C., & Barratt, P. (1990). Physics in perspective. London: Hodder &
Stoughton.
Eylon, B., & Ganiel, U. (1990). Macro-micro relationships: The missing link between
electrostatics and electrodynamics in students’ reasoning. International Journal of Science
Education, 12(1), 79-94.
Farrell, M. P. (2004). Intermediate physics (1st ed.). Malta: Indigobooks.
Feldman, A. (1994). Erzberger’s dilemma: Validity in action research and science
teachers’ need to know. Science Education, 78(1), 83-101.
Feldman, A. (2003). Validity and quality in self-study. Educational Researcher, 32(3), 26-
28.
Fleer, M. (1994). Determining children’s understanding of electricity. Journal of
Educational Research, 87(4), 248-253.
Fredette, N., & Lockhead, J. (1980). Students’ conceptions of simple electric circuits.
Physics Teacher, 18(11), 194-198.
Freeman, J. (1995). Towards a policy for actualizing talent. In J. Freeman, P. Span, & H.
Wagner (Eds.), Actualizing talent: A lifelong challenge (pp. 174-192). London: Cassell.
Fullick, P. (2000). Physics. U.K.: Heinemann Educational Publishers.
Gauld, C. (1989). A study of pupils’ responses to empirical evidence. In R. Millar (Ed.),
Doing science: Images of science in science education (pp. 62-82). London: Falmer Press.
Gauld, C. F. (1988). The cognitive context of pupils’ alternative frameworks. International
Journal of Science Education, 10(3), 267-274.
Gentner, D. (1983). Structure-mapping: A theoretical framework for analogy. Cognitive
Science, 7(2), 155-170.
411
Gentner, D., & Gentner, D. (1983). Flowing waters or teeming crowds: Mental models of
electricity. In D. Gentner & A. L. Stevens (Eds.), Mental models (pp. 99–129). Hillsdale,
NY: Lawrence Erlbaum Associates, Inc.
Gick, M. L., & Holyoak, K. J. (1980). Analogical problem solving. Cognitive Psychology,
12, 306-355.
Gick, M. L., & Holyoak, K. J. (1983). Schema induction and analogical transfer. Cognitive
Psychology, 15, 1-38.
Gilbert, J., Osborne, R., & Fensham, P. (1982). Children’s science and its consequences for
teaching. Science Education, 66(4), 623-633.
Gilbert, J. K., & Boulter, C. (1998). Learning science through models and modeling. In B.
J. Fraser & K. G. Tobin (Eds.), International handbook of science education (pp. 53-66).
Dordrecht: Kluwer.
Gilbert, J.K., Boulter, C. & Rutherford, M. (1998). Models in explanations, Part 1: Horses
for courses? International Journal of Science Education, 20(1), 83-97.
Glynn, S. M. (1991). Explaining science concepts: A teaching-with-analogies model. In S.
Glynn, R. Yeany, & B. Britton (Eds.), The psychology of learning science (pp. 219-240).
Hillside, NJ: Erlbaum.
Gott, R. (1985a). The place of electricity in the assessment of performance in science. In R.
Duit, W. Jung, & C. von Rhöneck (Eds.), Aspects of understanding electricity:
Proceedings of an international workshop (pp. 49-61). Kiel: IPN.
Gott, R. (1985b). Predicting and explaining the operation of simple dc circuits. In R. Duit,
W. Jung, & C. von Rhöneck (Eds.), Aspects of understanding electricity: Proceedings of
an international workshop (pp. 63-72). Kiel: IPN.
Great Pacific Media Physics Essentials (1996). Electricity: The invisible river of energy
[DVD]. Colorado: Great Pacific Media.
Greca, I. M., & Moreira, M. A. (2000). Mental models, conceptual models and modelling.
International Journal of Science Education, 22(1), 1-11.
Grotzer, T. A., & Perkins, D. N. (2000, April). A taxonomy of causal models: The
conceptual leaps between models and students’ reflections on them. Paper presented at the
annual conference of the National Association of Research in Science Teaching (NARST),
New Orleans, LA. Retrieved November 15, 2010 from
http://www.pzweb.harvard.edu/ucp/overview/papers/taxnarst.pdf
Grotzer, T. A., & Sudbury, M. (2000, April). Moving beyond underlying linear causal
models of electrical circuits. Unpublished paper presented at the annual conference of the
National Association for Research in Science Teaching (NARST), New Orleans, LA.
Retrieved April 2, 2007 from http://pzweb.harvard.edu/ucp/overview/papers/elecnarst.pdf
Gunstone, R., McKittrick, B. Mulhall, P., & Case, J. (2001, July). The complexity of
explanations in electricity. Unpublished paper presented at the annual conference of the
Australasian Science Education Research Association, Sydney, Australia.
Haertel, H. (1982). The electric circuit as a system: A new approach. European Journal of
Science Education, 4(1), 45-55.
412
Haertel, H. (1985a). The electric circuit as a system. In R. Duit, W. Jung, & C. von
Rhöneck (Eds.), Aspects of understanding electricity: Proceedings of an international
workshop (pp. 343-352). Kiel: IPN.
Haertel, H. (1985b). The electric voltage: What do students understand? What can be done
for better understanding? In R. Duit, W. Jung, & C. von Rhöneck (Eds.), Aspects of
understanding electricity: Proceedings of an international workshop (pp. 353-362). Kiel:
IPN.
Haertel, H. (1987). Constant electric current and the distribution of surface charges.
Revised part of a full paper published under the title "A qualitative approach to electricity"
at: Institute for Research on Learning, Report No. IRL87-000. University of Kiel.
Retrieved September 20, 2008 from
http://www.astrophysik.uni-kiel.de/~hhaertel/PUB/Stromkreis_Lit.htm
Haertel, H. (2008a). The so-called simple electric circuit. Retrieved September 20, 2008
from http://www.astrophysik.uni-kiel.de/~hhaertel/Circuit/electric_circuit.pdf
Haertel, H. (2008b, August 19). [Understanding potential difference]. Personal
communication.
Haertel, H. (2008c, August). Voltage - A basic term in electricity. Shortcomings of the
traditional approach and new ideas for improvement. Paper presented at the International
Research Group on Physics Teaching (GIREP) Conference, Nicosia, Cyprus. Retrieved
November 14, 2012 from
http://www.astrophysik.uni-kiel.de/~hhaertel/PUB/voltage_girep.pdf
Haertel, H. (2010). New approach to introduce basic concepts in electricity. In M. Caillot
(Ed.), Learning electricity and electronics with advanced educational technology (pp. 5-
22). Berlin: Springer-Verlag.
Halloun, I. A., & Hestenes, D. (1985a). The initial knowledge state of college physics
students. American Journal of Physics, 53(11), 1043-1055.
Halloun, I. A., & Hestenes, D. (1985b). Common sense concepts about motion. American
Journal of Physics, 53(11), 1056-1065.
Hammer, D. (1995). Student inquiry in a physics class discussion. Cognition and
Instruction, 13(3), 401-430.
Harrison, A. G. (2001, December). Thinking and working scientifically: The role of
analogical and mental models. Paper presented at the annual meeting of the Australian
Association for Research in Education, Fremantle, WA. Retrieved March 9, 2012 from
http://www.aare.edu.au/01pap/har01126.htm
Harrison, A. G., & Treagust, D. F. (1993). Teaching with analogies: A case study in grade-
10 optics. Journal of Research in Science Teaching, 30 (10), 1291-1307.
Harrison, A. G., & Treagust, D. F. (2000). Learning about atoms, molecules and chemical
bonds: A case study of multiple model use in grade 11 chemistry. Science Education,
84(3), 352-381.
Hart, C. (2008). Models in physics, models for physics learning, and why the distinction
may matter in the case of electric circuits. Research in Science Education, 38(5), 529–544.

413
Heald, M. A. (1984). Electric fields and charges in elementary circuits. American Journal
of Physics, 52(6), 522-526.
Helm, H. (1980). Misconceptions in physics amongst South African students. Physics
Education, 15(2), 92-105.
Hestenes, D. (1992). Modeling games in the Newtonian world. American Journal of
Physics, 60(8), 732-748.
Hewitt, P. G. (2002). Conceptual physics (9th
ed.). San Francisco: Pearson Education, Inc.
Holt, J. (1982). How children fail. New York: Delta/Seymour Lawrence.
Hopkins, D. (2008). A teacher’s guide to classroom research (4th
ed.). Maidenhead: Open
University Press.
Inhelder, B., & Piaget, J. (1966). The growth of logical thinking from childhood to
adolescence (2nd
ed.). London: Routledge and Kegan Paul Ltd.
Iona, M. (1979). Teaching electrical resistance. Physics Teacher, 17(5), 299-305.
Jackson, J. D. (1996). Surface charges on circuit wires and resistors play three roles.
American Journal of Physics, 64(7), 855-869.
Jacobs, J., Kawanaka, T., & Stigler, W. (1999). Integrating qualitative and quantitative
approaches to the analysis of video data on classroom teaching. International Journal of
Educational Research, 31(8), 717-724.
Jefimenko, O. (1962). Demonstration of electric fields of current carrying conductors.
American Journal of Physics, 30(1), 19-21.
Johnson, K. (1996). Physics for you. Cheltenham: Stanley Thornes (Publishers) Ltd.
Johnson-Laird, P. N. (1983). Mental models: Towards a cognitive science of language,
inference, and consciousness. Cambridge: The Press Syndicate of the University of
Cambridge.
Johnson-Laird, P. N., Girotto, V., & Legrenzi, P. (1998). Mental models: a gentle guide for
outsiders. Retrieved April 30, 2009 from
http://musicweb.ucsd.edu/~sdubnov/Mu206/MentalModels.pdf
Johnstone, A. H., & Mughol, A. R. (1978). The concept of electrical resistance. Physics
Education, 13, 46-49.
Johsua, S., & Dupin, J. J. (2010). Using ‘modelling analogies’ to teach electricity: A
critical analysis. In M. Caillot (Ed.), Learning electricity and electronics with advanced
educational technology (pp. 39-55). Berlin: Springer-Verlag.
Jung, W. (1985a). An example of the speaking-aloud technique in the domain of
electricity. In R. Duit, W. Jung, & C. von Rhöneck (Eds.), Aspects of understanding
electricity: Proceedings of an international workshop (pp. 185-196). Kiel: IPN.
Jung, W. (1985b). Category questionnaires - The technique and some results. In R. Duit,
W. Jung, & C. von Rhöneck (Eds.), Aspects of understanding electricity: Proceedings of
an international workshop (pp. 197-204). Kiel: IPN.

414
Kashdan, T. (2010). The power of curiosity. Experience Life: an electronic journal.
Retrieved May 31, 2010 from http://experiencelife.com/article/the-power-of-curiosity/
Kieting, D. P. (1976). A Piagetian approach to intellectual precocity. In D. P. Kieting
(Ed.), Intellectual talent: Research and development (pp. 90-99). Baltimore: Johns
Hopkins University Press.
Klaassen, C. W. J. M. (1995). A problem-posing approach to teaching the topic of
radioactivity. Utrecht: CD-β Press.
Klaassen, C. W. J. M., & Lijnse, P. L. (1996). Interpreting students’ and teachers’
discourse in science classes: An underestimated problem? Journal of Research in Science
Teaching, 33(2), 115-134.
Koumaras, P., Kariotoglou, P., & Psillos, D. (1997). Causal structures and counter-intuitive
experiments in electricity. International Journal of Science Education, 19(6), 617-630.
Lee, L., & Law, N. (2001). Explorations in promoting conceptual change in electrical
concepts via ontological category shift. International Journal of Science Education, 23(2),
111-149.
Licht, P. (1991). Teaching electrical energy, voltage and current: An alternative approach.
Physics Education, 26, 272-277.
Liégeois, L., Chasseigne, G., Papin, S. P., & Mullet, E. (2003). Improving high school
students’ understanding of potential difference in simple electric circuits. International
Journal of Science Education, 25(9), 1129-1145.
Liégeois, L., & Mullet, E. (2002). High school students’ understanding of resistance in
simple series circuits. International Journal of Science Education, 24(6), 551- 564.
Lincoln, Y. S., & Guba, E. G. (1985). Naturalistic inquiry. London: SAGE Publications,
Inc.
Lind, G. (1980). Models in physics: Some pedagogical reflections based on the history of
science. European Journal of Science Education, 2(1), 15-23.
Maichle, U. (1981). Representation of knowledge in basic electricity and its use for
problem solving. In W. Jung, H. Pfundt, & C. von Rhöneck (Eds.), Proceedings of the
international workshop on problems concerning students’ representations of physics and
chemistry knowledge, (pp. 174-193). Ludwigsburg: Pedagogische Hochschule
MASE (Maltese Association of Science Educators) (2009). TIMSS 2007 - Science
highlights from Malta’s results. Malta Council for Science and Technology.
May, D. B., Hammer, D., & Roy, P. (2006). Children’s analogical reasoning in a third-
grade science discussion. Science Education, 90(2), 316–330.
Mazur, E. (1997). Peer instruction: A user's manual series in educational innovation.
Upper Saddle River, NJ: Prentice Hall.
McDermott, L. C., & Redish, E. F. (1999). RL-PER1: Resource letter on physics education
research. The American Journal of Physics, 67(9), 755-767.
415
McDermott, L. C., & Shaffer, P. S. (1992). Research as a guide to curriculum
development: An example from introductory electricity. Part I: Investigation of student
understanding. American Journal of Physics, 60(11), 994-1003.
McDermott, L. C., & van Zee, E. H. (1985). Identifying and addressing student difficulties
with electric circuits. In R. Duit, W. Jung, & C. von Rhöneck (Eds.), Aspects of
understanding electricity: Proceedings of an international workshop (pp. 39-48). Kiel:
IPN.
Mee, C., Arnold, B., Crundell, M., & Brown, W. (2000). AS/A2 physics. London: Hodder
& Stoughton.
Millar, R. (1989). Understanding physics. London: Unwin Hyman.
Millar, R. (2004, June). The role of practical work in the teaching and learning of science.
Paper prepared for the meeting: High school science laboratories: Role and vision,
National Academy of Sciences, Washington, DC. Retreived October 10, 2011 from
http://www7.nationalacademies.org/bose/millar_draftpaper_jun_04.pdf
Millar. R., & Beh, K. L. (1993). Students’ understanding of voltage in simple parallel
electric circuits. International Journal of Science education, 15(4), 351-361.
Millar, R., & Gill, J.S. (1996). School students’ understanding of processes involving
radioactive substances and ionizing radiation. Physics Education, 31(1), 27-33.
Millar, R., & King, T. (1993). Students’ understanding of voltage in simple series electric
circuits. International Journal of Science Education, 15(3), 339-349.
Millar, R., Leach, J., Osborne, J., & Ratcliffe, M. (2006). Improving subject teaching:
Lessons from research in science education. London: Routledge.
Ministry of Education (Malta). (1999). Creating the future together: The national
minimum curriculum. Malta. Retrieved October 20, 2005 from
http://www.curriculum.gov.mt/docs/nmc_english.pdf
Ministry of Education, Youth and Employment (Malta). (2005). For all children to
succeed: A new network organization for quality education in Malta. Retrieved November
19, 2008 from
https://www.education.gov.mt/MediaCenter/Docs/1_for_all_children_to_succeed.pdf
Ministry of Education, Employment and the Family (Malta). (2011). Quality education for
all: The national curriculum framework. Consultation document 1: Executive summary.
Malta. Retrieved September 20, 2012 from
https://www.education.gov.mt/MediaCenter/Docs/1_BOOK%201%20ENG.pdf
Monk, M. (1990). A genetic epistemological analysis of data on children’s ideas about dc
electrical circuits. Research in Science and Technological Education, 8(2), 133-143.
Mosca, E. P., & De Jong, M. L. (1993). Implications of using the CASTLE model. The
Physics Teacher, 31, 357-359.
Mozzer, N., Justi, R. & Costa, P. (2011, September). Students’ analogical reasoning when
participating in modeling-based teaching activities. Unpublished paper presented at the 9th
International Conference of the European Science Education Research Association
(ESERA), Lyons, France.

416
Muncaster, R. (1993). A-level physics (4th
ed.). Cheltenham: Stanley Thornes Ltd.
Munn, P. & Drever, E. (1990).Using questionnaires in small-scale research. Edinburgh:
The Scottish Council for Research in Education.
National: Maltese students score low in science, higher in Maths. (2008, December 15).
The Times (Malta), p. 3.
Newman, J. (1999). Validity and action research: An online conversation. In I. Hughes
(Ed.) Action research electronic reader. Retrieved May 14, 2011 from
http://www.lupinworks.com/article/validity.html
Niedderer, H. (2006, Summer). Learning process studies – aims, theoretical approaches,
methods and selected results. Unpublished paper presented at the European Science
Education Research Association (ESERA) Summerschool, Braga, Portugal.
Niedderer, H. & Goldberg, F. (1994, April). An individual student's learning processes in
electric circuits. Unpublished paper presented at the annual meeting of the National
Association for Research in Science Teaching (NARST), Anaheim, CA.
Niedderer, H. & Goldberg, F. (1996, April). Learning processes in electric circuits.
Unpublished paper presented at the annual meeting of the National Association for
Research in Science Teaching, St. Louis, Missouri.
Oppenheim, A. N. (1992). Questionnaire design, interviewing and attitude measurement.
New York: Basic Books Inc.
Osborne, R. (1983a). Towards modifying children’s ideas about electric current. Research
in Science and Technological Education, 1(1), 73-82.
Osborne, R. (1983b). ‘Children’s science meets scientists’ science’. Lab Talk, 28(1), 2-7
(Victoria, Australia).
Paatz, R., Ryder, J., Schwedes, H., & Scott, P. (2004). A case study analysing the process
of analogy-based learning in a teaching unit about electric circuits. International Journal of
Science Education, 26(9), 1065-1081.
Physics Education Technology (2008). PhET interactive simulations of the University of
Colorado at Boulder. Retrieved July 24, 2008 from http://phet.colorado.edu
Prain, V., & Hand, B. (1999). Students’ perceptions of writing for learning in secondary
school science. Science Education, 83(2), 151-162.
Preyer, N. W. (2000). Surface charges and fields of simple circuits. American Journal of
Physics, 68(11), 1002-1006.
Psillos, D., Koumaras, P., & Valassiades, O. (1987). Pupils’ representations of electric
current before, during and after instruction on dc circuits. Research in Science and
Technological Education, 5(2), 185-199.
Punch, K. F. (2009). Introduction to research methods in education. London: Sage
Publications Ltd.
Rabow, J., Charness, M. A., Kipperman, J., & Radcliffe-Vasile, S. (1994). William
Fawcett Hill’s learning through discussion (3rd
ed.). London: Sage Publications Inc.
417
Ramadas, J. (2009). Visual and spatial modes in learning science. International Journal of
Science Education, 31(3), 301-318.
Reason, P., & Bradbury, H. (2006). Handbook of action research: the concise paperback
edition. London: Sage Publication Ltd.
Rizk, N. J. (2003). Productive face-to-face interview. In C. P. Constantinou, & Z. C.
Zacharia (Eds.), Computer based learning in science: Conference proceedings
2003,Volume 1, New technologies and their applications in education (pp. 927-986).
Cyprus: Department of Educational Sciences, University of Cyprus, Nicosia, Cyprus.
Robson, C. (2002). Real world research (2nd
ed.). Oxford: Blackwell Publishers Inc.
Rosenthal, A. S., & Henderson, C. (2006). Teaching about circuits at the introductory
level: An emphasis on potential difference. American Journal of Physics, 74(4), 324-328.
Rosser, W. G. V. (1963). What makes an electric current 'flow'. American Journal of
Physics, 31(11), 884-885.
Rosser, W. G. V. (1970). Magnitudes of surface charge distributions associated with
electric current flow. American Journal of Physics, 38(2), 265-266.
Rouse, W., & Morris, N. M. (1986). On looking into the black box: Prospects and limits in
the search for mental models. Psychological Bulletin, 100(3), 349-363.
Sassi, E., & Feiner-Valkier, S. (2010). On the use of new methods and multimedia. Il
Nuovo Cimento C, 33(3), 1-11.
Schwedes, H., & Dudeck, W. G. (1996). Teaching electricity by the help of a water
analogy (How to cope with the need for conceptual change). In G. Welford, J. Osborne, &
P. Scott (Eds.), Research in science education: Current issues and themes (pp. 50-63).
London: Falmer Press.
Scott, P. (1987). The process of conceptual change in science: A case study of the
development of a secondary pupil’s ideas relating to matter. In J. D. Novak (Ed.),
Proceedings of the second international seminar on misconceptions and educational
strategies in science and mathematics, 2, (pp. 404-419). Ithaca, NY: Cornell University.
Scott, P. (1992). Pathways in learning science: A case study of the development of one
student’s ideas related to the structure of matter. In R. Duit, F. Goldberg, & H. Niedderer
(Eds.), Research in physics learning: Theoretical issues and empirical studies (pp.203-
224). University of Kiel: IPN.
Shaffer, P. S., & McDermott, L. C. (1992). Research as a guide to curriculum
development: An example from introductory electricity. Part II: Design of instructional
strategies. American Journal of Physics, 60(11), 1003-1013.
Shank, G. D. (2006). Qualitative research. A personal skills approach (2nd
ed.). New
Jersey: Pearson Prentice Hall.
Shayer, M., & Adey, P. (1981). Towards a science of science teaching: cognitive
development and curriculum demand. London: Heinemann Educational Books.
Shayer, M., Adey, P., Kuchemann, D., & Wylam, H. (1973/78). Reasoning tasks. Chelsea
College, University of London: NFER Publishing Co. Ltd.

418
Shepardson, D. P., & Moje, E. B. (1994). The nature of fourth graders’ understandings of
electric circuits. Science Education, 78(5), 489-514.
Shepardson, D. P., & Moje, E. B. (1999). The role of anomalous data in restructuring
fourth graders’ frameworks for understanding electric circuits. International Journal of
Science Education, 21(1), 77-94.
Sherwood B. A., & Chabay, R. W. (2010). Electrical interactions and the atomic structure
of matter: Adding qualitative reasoning to a calculus-based electricity and magnetism
course. In M. Caillot (Ed.), Learning electricity and electronics with advanced educational
technology, (pp. 23-35). Berlin: Springer-Verlag.
Shipstone, D. M. (1984). A study of children's understanding of electricity in simple D.C.
circuits. European Journal of Science Education, 6(2), 185-198.
Shipstone, D.M. (1985a). On children’s use of conceptual models in reasoning about
current electricity. In R. Duit, W. Jung and C. von Rhöneck (Eds.), Aspects of
understanding electricity: Proceedings of an international workshop (pp. 73-82). Kiel:
IPN.
Shipstone, D. M. (1985b). Electricity in simple circuits. In R. Driver, E. Guesene and A.
Tiberghien (Eds.), Children's ideas in science (pp.33-51). Milton Keynes: Open University
Press.
Shipstone, D. M. (1988). Pupils’ understanding of simple electrical circuits: Some
implications for instruction. Physics Education, 23(2), 92-96.
Shipstone, D. M. (2002). A study of children’s understanding of electricity in dc circuits.
In S. Amos and R. Boohan (Eds.), Teaching science in secondary schools (pp. 223-235).
London: RoutledgeFalmer.
Shipstone, D. M., & Gunstone, R. F. (1985). Teaching children to discriminate between
current and energy. In R. Duit, W. Jung, & C. von Rhöneck (Eds.), Aspects of
understanding electricity: Proceedings of an international workshop (pp. 287-297). Kiel:
IPN.
Shipstone, D. M., von Rhöneck, C., Dupin, J., Johsua, S., & Licht, P. (1988). A study of
students’ understanding of electricity in five European countries. International Journal of
Science Education, 10(3), 303-316.
Sokoloff, R., & Thornton, R. K. (1997). Using interactive lecture demonstrations to create
an active learning environment. The Physics Teacher, 35, 340–347.
Span, P. (1995). Self-regulated learning by talented children. In J. Freeman, P. Span, & H.
Wagner (Eds.), Actualizing talent: A lifelong challenge (pp. 72-86). London: Cassell.
Stavy, R., & Tirosh, D. (1996). Intuitive rules in science and mathematics: the case of
‘more of A–more of B’. International Journal of Science Education, 18(6), 653-667.
Steinberg, M. S., & Wainwright, C. L. (1993). Using models to teach electricity - The
CASTLE project. The Physics Teacher, 31, 353-357.
Stocklmayer, S. M., & Treagust, D. F. (1996). Images of electricity: How do novices and
experts model electric current? International Journal of Science Education, 18(2), 163-
178.

419
Swartz, C. (2003). Back-of-the-envelope physics. USA: The Johns Hopkins University
Press.
Taber, K. S., de Trafford, T., & Quail, T. (2006). Conceptual resources for constructing the
concepts of electricity: the role of models, analogies and imagination. Physics Education,
41(2), 155-160.
Thacker, B. A., Ganiel, U., & Boys, D. (1999). Macroscopic phenomena and microscopic
processes: Student understanding of transients in direct current electric circuits. American
Journal of Physics, Supplement 67(7), S25- S31.
Thornton, R. K. (2008, August). Interactive lecture demonstrations: active learning in
large lectures and small one-computer classrooms. Unpublished paper presented at the
International Research Group on Physics Teaching (GIREP) Conference, Nicosia, Cyprus.
Thornton, R. K. (2009). WebLID: Web-delivered interactive lecture demonstrations.
Creating an active science learning environment on the internet. Workshop presented at
the 14th
meeting of the Multimedia in Physics Teaching and Learning (MPTL), Udine,
Italy.
Tiberghien, A. (1983). Critical review on the research aimed at elucidating the sense that
the notions of electric circuits have for students aged 8 to 20 years. In Research on physics
education, Proceedings of the first international workshop (pp. 109-123). Paris: Editions
du Centre National de la Recherche Scientifique.
Tiberghien, A., & Delacote G. (1976). Manipulations et representations de circuits
electriques simples chez les enfants de 7 a 12 ans (Uses and representations of electric
circuits by children 7 to 12 years of age). Revue Française de Pedagogie, 34, 32-44.
Tobin, K. G., & Capie, W. (1981). The development and validation of a group test of
logical thinking. Educational and Psychological Measurement, 41(2), 413-423.UP
Treagust, D. F., Harrison, A. G., Venville, G. J., & Dagher, Z. (1996). Using an analogical
teaching approach to engender conceptual change. International Journal of Science
Education, 18, 213-229.
Tsai, C., Chen, H., Chou, C., & Lain, K. (2007). Current as the key concept of Taiwanese
students’ understandings of electric circuits. International Journal of Science Education,
29(4), 483-496.
Twenty First Century Science Project (2003). General module Ge6, Pilot trials version,
p. 59. Oxford: Oxford University Press.
Urban-Woldron, H. (2008, August). Is the concept of electricity better understood with the
help of electronic media? Unpublished paper presented at the International Research
Group on Physics Teaching (GIREP) Conference, Nicosia, Cyprus.
Valanides, N. (1997). Cognitive abilities among twelfth-grade students: Implications for
science teaching. Educational Research and Evaluation, 3(2), 160-186.
van Aalst, H. F. (1985). The differentiation between connections in series and in parallel
from cognitive mapping: Implications for teaching. In R. Duit, W. Jung, & C. von Rhöneck
(Eds.) Aspects of understanding electricity: Proceedings of an international workshop
(pp. 115-128). Kiel: IPN.

420
Vanhear, J. (2010, February 14). Promoting more meaningful learning and critical
thinking. The Sunday Times (Malta), p. 69.
Viennot, L. (1985). Analyzing students’ reasoning: Tendencies in interpretation. American
Journal of Physics, 53(5), 432-436.
Viennot, L. (1999). Design and evaluation of a research-based teaching sequence: the
superposition of electric field. International Journal of Science Education, 21(1), 1-16.
Viennot, L., & Rainson, S. (1992). Students’ reasoning about the superposition of electric
fields. International Journal of Science Education, 14(4), 475-487.
von Rhöneck, C. (1981, September). Student conceptions of the electric current before
physics instruction. In W. Jung, H. Pfundt, & C. von Rhöneck (Eds.), Proceedings of the
international workshop on problems concerning students’ representations of physics and
chemistry knowledge, (pp. 194-213). Ludwigsburg: Pedagogische Hochschule.
von Rhöneck, C. (1985). The introduction of voltage as an independent variable - The
importance of pre-conceptions, cognitive conflict and operating rules. In R. Duit, W. Jung,
& C. von Rhöneck (Eds.), Aspects of understanding electricity: Proceedings of an
international workshop (pp. 275-286). Kiel: IPN.
Walz, A. (1985). Fields that accompany currents. In R. Duit, W. Jung, & C. von Rhöneck
(Eds.) Aspects of understanding electricity: Proceedings of an international workshop
(pp. 403–412). Kiel: IPN.
Ward, R. E., & Wandersee, J. H. (2002). Struggling to understand abstract science topics:
A roundhouse diagram-based study. International Journal of Science Education, 24(6),
575-591.
Warren, P. (1983). Understanding electricity. London: John Murray.
Watkins, K. (1991, April). Validity in action research. Paper presented at the annual
meeting of the American Educational Research Association, Chicago, IL.
Weinstein, C. E., & Underwood, V. L. (1985). Learning strategies: The how of learning. In
J. W. Segal, S. Chipman, & R. Glaser (Eds.), Thinking and learning skills (Volume 1):
Relating instruction to research (pp. 241-258). New Jersey: Lawrence Erlbaum Associates,
Inc.
Welzel, M. (1997). Student-centered instruction and learning processes in physics.
Research in Science Education, 27(3), 383-394.
Welzel, M. (1998). The emergence of complex cognition during a unit on static electricity.
International Journal of Science Education, 20(9), 1107-1118.
Welzel, M., & Roth, W. M. (1998). Do interviews really assess students’ knowledge?
International Journal of Science Education, 20(1), 25-44.
Westbrook, S. L., & Rogers, L. N. (1994). Examining the development of scientific
reasoning in the ninth-grade physical science students. Journal of Research in Science
Teaching, 31(1), 65-76.

421
White, B. Y. (1993). Intermediate causal models: A missing link for successful science
education. In R. Glaser (Ed.), Advances in instructional psychology (Volume 4). Hillsdale,
New Jersey: Lawrence Erlbaum Associates.
White, R., & Gunstone, R. (1992). Probing understanding. London: Falmer Press.
Winner, E. (1997). Gifted children: Myths and realities. New York: Basic Books.
Wong, E. D. (1993a). Self-generated analogies as a tool for constructing and evaluating
explanations of scientific phenomena. Journal of Research in Science Teaching, 30(4),
367-380.
Wong, E. D. (1993b). Understanding the generative capacity of analogies as a tool for
explanation. Journal of Research in Science Teaching, 30(10), 1259-1272.
Xuereb, A. C. (1999). Physics at secondary school level. Malta: Publishers Enterprises
Group (PEG) Ltd.
Xuereb, A. C. (2007). Sixth form college physics. Malta: Allied Publications.

422


