Understanding its role in outbreak response · Lassa fever management) 1.5.4. Ongoing...
12
Weekly Epidemiological Report Issue: Volume 7 No. 20 2 nd June, 2017 NIGERIA CENTRE FOR DISEASE CONTROL Weekly Epidemiological Report Main Highlight of the week Risk Communication: Understanding its role in outbreak response In this reporting week, the ongoing Cerebrospinal Meningitis (CSM) outbreak entered its 23 rd week. The number of affected states increased to 25 and four (4) additional LGAs reported a suspected case, bringing the total number of affected LGAs to 230. Since onset, a total of 14,298 suspected cases have been identified, out of which 901 samples were collected for laboratory testing. 437 of samples tested were confirmed positive for Neisseria meningitidis. 75.7% (331) of tested samples showed the causative organism to be Neisseria meningitidis serogroup C. The number of deaths recorded so far is 1,148 giving a case fatality rate (CFR) of 8%. The events during the course of this outbreak have revealed gaps in our response systems, which need to be addressed for future outbreak response activities. Improvements in the Issue: Volume 7 No. 20 2 nd June, 2017
Transcript of Understanding its role in outbreak response · Lassa fever management) 1.5.4. Ongoing...

Weekly Epidemiological Report
Issue: Volume 7 No. 20 2nd June, 2017
NIGERIA CENTRE FOR DISEASE CONTROL
Weekly Epidemiological Report Main Highlight of the week
Risk Communication: Understanding its role in outbreak response
In this reporting week, the ongoing Cerebrospinal Meningitis (CSM) outbreak entered its 23rd week. The number of affected states increased to 25 and four (4) additional LGAs reported a suspected case, bringing the total number of affected LGAs to 230. Since onset, a total of 14,298 suspected cases have been identified, out of which 901 samples were collected for laboratory testing. 437 of samples tested were confirmed positive for Neisseria meningitidis. 75.7% (331) of tested samples showed the causative organism to be Neisseria meningitidis serogroup C. The number of deaths recorded so far is 1,148 giving a case fatality rate (CFR) of 8%. The events during the course of this outbreak have revealed gaps in our response systems, which need to be addressed for future outbreak response activities. Improvements in the
Issue: Volume 7 No. 20 2nd June, 2017

Weekly Epidemiological Report
Issue: Volume 7 No. 20
2nd June, 2017
surveillance systems have been palpable, given the high number of suspected cases identified as a result of the sensitivity of the standard case definition for CSM and enhanced surveillance activities. However, the number of samples collected cumulatively as seen above is low (6.3%). Zamfara and Sokoto States recorded individual increases in lumbar puncture procedures carried out (21% and 23% increased rates respectively) in the last few weeks, which was as a result of on-site support provided by the Nigeria Centre for Disease Control (NCDC) and its partner agencies. The number of deaths recorded has progressively increased, despite recorded outbreak response activities. An identified tool for improving good outcomes in outbreaks is risk communication A key component to a preparedness plan is risk communication. Effective risk communication during an outbreak is not limited to the exchange of information between responsible authorities and the populace. It also entails taking proactive steps towards creating a bond of trust, accountability and reliability between public health authorities and the individuals in the communities. An outcome of this is creating awareness of expectations in the event of an outbreak. Others include providing guidance during an outbreak and evaluating systems for effective feedback following an outbreak A coordinated approach is fundamental for effective risk communication. It is essential that identified key stakeholders understand the importance of effective risk communication and are able to garner and channel all available resources to implement related activities. Outbreaks and emergencies of public health concern will continue to test our response systems. Therefore, meaningful and coordinated steps should be taken to reduce morbidity and mortality from these events. As part of activities to address gaps and strengthen our preparedness and response systems, the NCDC alongside the National Primary Health Care Development Agency (NPHCDA) and other partner agencies have carried out a week long capacity building session on effective risk communication on Meningitis for Health Educators and Directors of Public Health in all 19 Northern States of Nigeria. Future plans will be targeted at conducting these sessions in all States of the Federation. It is hoped that participants are able to use these training sessions as a tool for improving preparedness and response to outbreak and emergencies of public health concern in their respective States.
In the reporting week: o There were 250 new cases of Acute Flaccid Paralysis (AFP) reported. None was
confirmed as Polio. The last reported case of Polio in Nigeria was in August 2016. Active case search for AFP is being intensified as Nigeria has assiduously reinvigorated its efforts at eradicating Polio.
o Three suspected cases of Cholera were reported from Kaduna South LGA in Kaduna
State and no death was recorded.
o There were 128 suspected cases of Cerebrospinal Meningitis (CSM) reported from 45 LGAs in 12 States. Of these, six were laboratory confirmed and four deaths were recorded. Ongoing surveillance for CSM has been intensified in the States.

Weekly Epidemiological Report
Issue: Volume 7 No. 20
2nd June, 2017
o There were 422 suspected cases of Measles reported from 28 States including the FCT.
Three laboratory confirmed cases were recorded with six deaths. In the reporting week, Adamawa, Anambra and Edo States failed to report. Timeliness of reporting remains 81% in both previous and current weeks while completeness decreased from 100% in the previous week to 99% in the current week. It is very important for all States to ensure timely and complete reporting at all times. Summary Table 1 (IDSR Weekly Report as at 26/05/2017)
Week 19
2017 2017 2016 01 - 20, 2017 01 - 20, 2016Cases 308 250 466 6,099 4859
Deaths 0 0 0 0 0
CFR 0.00% 0.00% 0.00% 0.00% 0.00%
WPV Types 1 & 3 0 0 0 0 0
WPV Types 1 0 0 0 0 0
WPV Types 3 0 0 0 0 0
Cases 5 3 0 83 216
Deaths 0 0 0 4 1
CFR 0.00% 0.00% 0.00% 4.82% 0.46%
Cases 2 4 0 262 658
Deaths 0 2 0 48 75
CFR 0.00% 50.00% 0.00% 18.32% 11.40%
Cases 343 128 3 9477 487
Deaths 13 4 0 596 25
CFR 3.79% 3.13% 0.00% 6.29% 5.13%
Cases 406 422 488 11,283 17903
Deaths 0 6 2 70 75
CFR 0.00% 1.42% 0.41% 0.62% 0.42%
Cases 0 0 0 0 0
Deaths 0 0 0 0 0
CFR 0.00% 0.00% 0.00% 0.00% 0.00%
Disease VariablesWeek 20 Cumulative Weeks
AFP
Polio
Cholera
Lassa Fever
CSM
Measles
Guinea Worm

Weekly Epidemiological Report
Issue: Volume 7 No. 20
2nd June, 2017
1. Lassa fever Please note that the data reflects the routine reports i.e. all suspected cases including
the laboratory positive and negative cases 1.1. Four suspected cases of Lassa fever with one laboratory confirmed and two deaths
(CFR, 50.0%) were reported from four LGAs (three States) in week 20, 2017 compared with zero during the same period in 2016.
1.2. Laboratory results of the four suspected cases were one positive for Lassa fever (Plateau – 1), three negatives (Cross River – 1, Nassarawa – 1 and Plateau - 1).
1.3. Between weeks 1 and 20 (2017), 262 suspected Lassa fever cases with 59 laboratory confirmed cases and 48 deaths (CFR, 18.32%) from 54 LGAs (20 States) were reported compared with 658 suspected cases with 63 laboratory confirmed cases and 75 deaths (CFR, 11.40%) from 122 LGAs (27 States) during the same period in 2016 (Figure 1).
1.4. Between weeks 1 and 52 2016, 921 suspected Lassa fever cases with 109 laboratory confirmed cases and 119 deaths (CFR, 12.92%) from 144 LGAs (28 States and FCT) were
reported compared with 430 suspected cases with 25 laboratory confirmed cases and 40 deaths (CFR, 9.30%) from 37 LGAs (14 States and FCT) during the same period in 2015 (Figure 2).
1.5. Investigation and active case search ongoing in affected States with coordination of response activities by the NCDC with support from partners.
1.5.1. National Lassa Fever Working Group meeting and weekly National Surveillance and Outbreak Response meeting on-going at NCDC to keep abreast of the current Lassa
fever situation in the country. 1.5.2. Response materials for VHFs prepositioned across the country by NCDC at the
beginning of the dry season
1.5.3. New VHF guidelines have been developed by the NCDC (Interim National Viral Haemorrhagic Fevers Preparedness guidelines and Standard Operating Procedures for
Lassa fever management) 1.5.4. Ongoing reclassification of reported Lassa fever cases 1.5.5. Ongoing review of the variables for case-based surveillance for VHF
1.5.6. VHF case-based forms completed by affected States are being entered into the new VHF management system. This system allows for the creation of a VHF database for the
country. 1.5.7. Confirmed cases are being treated at identified treatment/isolation centres across the
States with Ribavirin and necessary supportive management also instituted 1.5.8. Onsite support was earlier provided to Ogun, Nasarawa, Taraba, Ondo and Borno States
by the NCDC and partners
1.5.9. Offsite support provided by NCDC/partners in all affected States 1.5.10. States are enjoined to intensify surveillance

Weekly Epidemiological Report
Issue: Volume 7 No. 20
2nd June, 2017
Figure 1: Map of Nigeria showing areas
affected by Lassa fever, week 1- 20, 2016 & 2017
Figure 2: Map of Nigeria showing areas
affected by Lassa fever, week 1 - 53, 2015 and week 1 – 52, 2016
2. MEASLES 2.1. In the reporting week, 422 suspected cases of Measles with three laboratory confirmed
cases and six deaths (CFR, 1.42%) were reported from 27 States and FCT compared with 488 suspected measles cases and two deaths (CFR, 0.41%) from 30 States during the
same period in 2016. 2.2. So far, 11,283 suspected Measles cases with 72 laboratory confirmed cases and 70
deaths (CFR, 0. 62%) have been reported in 2017 from 36 States and FCT (Figure 4) compared with 17,930 suspected cases and 75 deaths (CFR, 0.42%) from 36 States and FCT during the same period in 2016.
2.3. In 2016 (week 1 -52), 25,251 suspected Measles cases with 102 deaths (CFR, 0.40%)
were reported from 36 States and FCT compared with 24,421 suspected cases with 127 deaths (CFR, 0.52%) during the same period in 2015 (Figure 5)
2.4. Response measures include immunization for all vaccine-preventable diseases in some selected/affected wards/LGAs during SIAs, as well as case management.
2.5. Scheduled Measles campaigns in the North East were conducted from 12th – 17th
January, 2017 in Adamawa, Borno and Yobe States (Phase I) and Phase II from 21st – 25th January, 2017 in Borno State and 4th – 8th February, 2017 in Yobe State

Weekly Epidemiological Report
Issue: Volume 7 No. 20
2nd June, 2017
Figure 3: Suspected Measles attack rate by States, week 20, 2017 as at 26th May, 2017
Figure 4: Map of Nigeria showing Distribution of suspected Figure 5: Suspected & confirmed (Lab + Epi Link + Measles cases, Weeks 1- 20, 2017as at 26/05/2017 C linical) Measles cases weeks 1 – 52, 2014 - 2016

Weekly Epidemiological Report
Issue: Volume 7 No. 20
2nd June, 2017
3. POLIOMYELITIS 3.1. As at May 19th 2017, no new case of WPV was recorded
3.2. Three new cVDPV2, environmental derived and Polio compatible cases identified 3.2.1. In the reporting week, 250 cases of AFP were reported from 186 LGAs in 31 States and
FCT 3.2.2. AFP Surveillance has been enhanced and outbreak response is on-going in Borno and
other high risk States 3.2.3. The 1st round of SIPDs in 2017 was conducted from 28th – 31st January 2017 in the 18
high risk States. This was carried out using mOPV2 (2nd mOPV2 OBR). The schedule for
other SIAs is as described in Table 2 3.2.4. The 2nd round of SIPDs completed (25th-28th February, 2017) in 14 high risk States using
bOPV.
3.2.5. The 1st and 2nd rounds of NIPDs completed (from 25th – 28th March, 2017 and 22nd –
25th April, 2017) nationwide respectively.
3.2.6. Between weeks 1 and 52 in 2016, four WPVs were isolated from Borno State compared to no WPV isolated during the same period in 2015.
3.3. No circulating Vaccine Derived Polio Virus type 2 (cVDPV2) was isolated in week 1 - 52, in both 2016 and 2015.
3.4. Between weeks 1 and 52, 2016 two (2) cVDPV2 were isolated in two LGAs (two States) while one (1) cVDPV2 was isolated from Kwali, FCT during the same period in 2015.
3.5. Six confirmed WPVs were isolated in 2014. 3.6. The SIAs were strengthened with the following events: 3.6.1. Immunization for all vaccine-preventable diseases in some selected wards/LGAs. 3.6.2. Use of health camp facilities. 3.6.3. Field supportive supervision and monitoring.
3.6.4. Improved Enhanced Independent Monitoring (EIM) and Lots Quality Assessments (LQAs) in all Polio high risk States.
3.6.5. High level of accountability framework
Figure 6: Polio Compatible cases in Nigeria as at Table 2: 2017 SIAs Week 1 - 52, 2014 - 2016 (Data as at 19/05/17)

Weekly Epidemiological Report
Issue: Volume 7 No. 20
2nd June, 2017
4. CHOLERA 4.1. Three suspected cases of Cholera were reported from Kaduna South LGA (Kaduna State)
in week 20 compared with zero case at the same period in 2016. 4.2. Between weeks 1 and 20 (2017), 83 suspected Cholera cases and four deaths (CFR,
4.82%) from 15 LGAs (12 States) were reported compared with 216 suspected cases and one death (CFR, 0.47%) from 24 LGAs (nine States) during the same period in 2016 (Figure 7).
4.3. Between weeks 1 and 52 (2016), 768 suspected Cholera cases with 14 laboratory confirmed cases and 32 deaths (CFR, 4.17%) from 57 LGAs (14 States) were reported
compared with 5,301 cases with 29 laboratory confirmed cases and 186 deaths (CFR, 3.51%) from 101 LGAs (18 States and FCT) during the same period in 2015 (Figure 8).
4.4. States are enjoined to intensify surveillance.
4.5. Cholera preparedness workshop held from 31st May – 1st June, 2017 in Abuja to developed Cholera preparedness plan as the set in.
Figure 7: Status of LGAs/States that reported Cholera cases in week 1- 20, 2016 & 2017
Figure 8: Status of LGAs/States that reported Cholera cases in week 1- 52, 2015 & 2016
5. CEREBROSPINAL MENINGITIS (CSM)
5.1. In the reporting week 20, 128 suspected Cerebrospinal Meningitis (CSM) cases with six laboratory confirmed cases and four deaths (CFR, 3.13%) were reported from 45 LGAs (12 States) compared with three suspected cases with two laboratory confirmed cases from two LGAs (two States) during the same period in 2016.
5.2. Between weeks 1 and 20 (2017), 9477 suspected CSM cases with 99 laboratory
confirmed cases and 596 deaths (CFR, 6.29%) were recorded from 288 LGAs (31 States) compared with 487 suspected cases and 25 deaths (CFR, 5.13%) from 115 LGAs (25
States) during the same period in 2016 (Figure 9).

Weekly Epidemiological Report
Issue: Volume 7 No. 20
2nd June, 2017
5.3. Between weeks 1 and 52, 2016, 831 suspected CSM cases with 43 laboratory confirmed cases and 33 deaths (CFR, 3.97%) were recorded from 154 LGAs (30 States and FCT) compared with 2,711 suspected cases and 131 deaths (CFR, 4.83%) from 170 LGAs (28 States and FCT) during the same period in 2015 (Figure 10)
Figure 9: Map of Nigeria showing areas affected by CSM, Figure 10: Nigeria: Dot maps of CSM cases, week 1 Week 1 – 20, 2016 & 2017 - 53, 2015 & 2016
5.4. Timeliness/completeness of CSM case-reporting from States to the National Level (2017
versus 2016): on average, 79.6% of the 26 endemic States sent CSM reports in a timely manner while 96.0% were complete in week 1 – 20, 2017 as against 82.3% timeliness and
96.2% completeness recorded within the same period in 2016 5.5. CSM preparedness checklist sent to 36 States and FCT ahead of 2017 meningitis season 5.6. Confirmed cases are being treated at identified treatment centres in affected States
(Zamfara, Sokoto, Katsina, Kebbi, Niger, Kano, Yobe and Jigawa) and necessary supportive management also instituted
5.7. CSM National Emergency Operations Centre constituted at the Nigeria Centre for Disease Control
5.8. Onsite support was earlier provided to Zamfara State and still ongoing. 5.9. Ongoing onsite support to Sokoto, Katsina, Kebbi, Kano and Niger States by NCDC and
partners
5.10. Intensive Surveillance is on-going in high risk States. 5.11. Reactive vaccination completed in Zamfara State for people aged one to 29 years using
polysaccharide meningococcal A & C vaccine. 5.12. Reactive vaccination completed in two wards (Gada and Kaffe) in Gada LGA in Sokoto
State using polysaccharide meningococcal A & C vaccine for people aged two to 29 years.
5.13. Reactive vaccination completed in nine LGAs in Sokoto State using monosaccharide meningococcal conjugate C vaccine for aged one to 20 years.
5.14. Reactive vaccination campaign completed in Yobe State and the second phase of the campaign in Zamfara State also completed.
5.15. Training and deployment of first batch of medical teams to support case management in
Sokoto and Zamfara States completed (from Friday 5th - 26th May, 2017). 5.16. Deployed mobile testing laboratory to Zamfara State to aid diagnosis

Weekly Epidemiological Report
Issue: Volume 7 No. 20
2nd June, 2017
5.17. Deployed additional team of three NCDC staff to support surveillance activities, laboratory data harmonization and monitoring of implementation plan in Yobe state
6. GUINEA WORM DISEASE
6.1. In the reporting week, no rumour report of Guinea Worm disease was received from any State.
6.2. Nigeria has celebrated eight consecutive years of zero reporting of Guinea worm disease in the country. The Country has been officially certified free of Dracunculiasis transmission by the International Commission for the Certification of Dracunculiasis Eradication (ICCDE).
(For further information, contact NIGEP NC/Director: Mrs. I, Anagbogu: +2348034085607, [email protected]) FOR MORE INFORMATION CONTACT Surveillance Unit: Nigeria Centre for Disease Control 801 Ebitu Ukiwe Street, Jabi, Abuja, Nigeria. [email protected] www.ncdc.gov.ng/reports 0800-970000-10

Weekly Epidemiological Report
Issue: Volume 7 No. 20
2nd June, 2017
Table 3: Status of Reporting by the State Epidemiologists, Nigeria, Weeks 1 - 20, 2017, as at 26th May, 2017
Keys: <50% Poor 3 States
T= Arrived on Time 50-79% Good 10 States
L= Arrived late N Report not received 80-100% Excellent 24 States
N = No Report (Report not received)
1 Abia SEZ L L L L L T L T L T T L T T L L T T T T 20 10 10 0 50% 100%2 Adamawa NEZ L L L L L L T L T T T T T L L T L T N N 20 8 10 2 40% 90%3 Akwa Ibom SSZ T L T T T T L T T T L L L T T T T T T T 20 15 5 0 75% 100%4 Anambra SEZ T T T T L T T T T T L L T T T T T T T N 20 16 3 1 80% 95%5 Bauchi NEZ T T T T T T T L T T T T T T T T T T T T 20 19 1 0 95% 100%6 Bayelsa SSZ T T T T T T T T T T T T T T T T T T T T 20 20 0 0 100% 100%7 Benue NCZ T T T T T T L T T T T T T L L T L T T T 20 16 4 0 80% 100%8 Borno NEZ L T T T T T L L L T T T T T T L T T T T 20 15 5 0 75% 100%9 Cross River SSZ L L L L L L L L L T T T T T T T L L T T 20 9 11 0 45% 100%
10 Delta SSZ L T L L L T L L L L L T T T T T T T T T 20 11 9 0 55% 100%11 Ebonyi SEZ T L L L T L T T L T T T T T T T L L T T 20 13 7 0 65% 100%12 Edo SSZ L L L L T L T T T T T L T L T L L T T N 20 10 9 1 50% 95%13 Ekiti SWZ T T T T T T T T T T L T T T T T T T T T 20 19 1 0 95% 100%14 Enugu SEZ L L L L T L T L T T T T L T T T T T T T 20 13 7 0 65% 100%15 FCT NCZ T T T T T T T T T T T T T T T T T T T T 20 20 0 0 100% 100%16 Gombe NEZ T T T T T T T T T T T T T T T T L T T T 20 19 1 0 95% 100%17 Imo SEZ L L L L L L L L L T T T T T T T T T T T 20 11 9 0 55% 100%18 Jigawa NWZ T T T L L L L L T T T T T T T T T T T L 20 14 6 0 70% 100%19 Kaduna NWZ T T T T L T L T T T L T T T T T T T T T 20 17 3 0 85% 100%20 Kano NWZ T T T T T T T T T T T T T T T T T T T T 20 20 0 0 100% 100%21 Katsina NWZ T T T T T T T T T T T T T T T T T T L T 20 19 1 0 95% 100%22 Kebbi NWZ T T T T L L T T T T T T L T T T T T T T 20 17 3 0 85% 100%23 Kogi NCZ T T T T T T T T T T T T T L T T T T T T 20 19 1 0 95% 100%24 Kwara NCZ L L L L L L L L L T L L L L L L L T T T 20 4 16 0 20% 100%25 Lagos SWZ T T T T T T T T T T T T T T T T T T T T 20 20 0 0 100% 100%26 Nasarawa NCZ T T T T T T T T T T T T T T T T T T T T 20 20 0 0 100% 100%27 Niger NCZ T T T T T T T T L T T T T T T T T T T T 20 19 1 0 95% 100%28 Ogun SWZ T T T T T T T T T T T T T T T T T T T T 20 20 0 0 100% 100%29 Ondo SWZ T T T T T T T T T T T T L T L T T T L T 20 17 3 0 85% 100%30 Osun SWZ T T T T T T T T T T T T T T T T T T T T 20 20 0 0 100% 100%31 Oyo SWZ T T L T T T T T L T T T L L T T L T T T 20 15 5 0 75% 100%32 Plateau NCZ T T T T T T T T T T T T T T T T T T T T 20 20 0 0 100% 100%33 Rivers SSZ T T T T T T T T T T T T T T T T T T T T 20 20 0 0 100% 100%34 Sokoto NWZ T T T T T T T T T T T T T T T T T T T T 20 20 0 0 100% 100%35 Taraba NEZ T T T T T T T T T T T T T T T T T T T T 20 20 0 0 100% 100%36 Yobe NEZ T L T T T T T T T T T T T T T T T T T T 20 19 1 0 95% 100%37 Zamfara NWZ T T T L T L L T T T T T T T T T T T T T 20 17 3 0 85% 100%
Total number of reports expected (E) 37 37 37 37 37 37 37 37 37 37 37 37 37 37 37 37 37 37 37 37 740
Total reports sent on time (T) 28 27 27 26 27 27 26 28 28 36 31 32 31 31 32 33 29 35 34 33 601
Total reports sent late (L) 9 10 10 11 10 10 11 9 9 1 6 5 6 6 5 4 8 2 2 1 135
Total number of reports not received (N) 0 0 0 0 0 0 0 0 0 0 0 0 0 0 0 0 0 0 1 3 4
Timeliness of reports =100*T/E 75.7 73.0 73.0 70.3 73.0 73.0 70.3 75.7 75.7 97.3 83.8 86.5 83.8 83.8 86.5 89.2 78.4 94.6 91.9 89.2 81%
Completeness of reporting=100*(E-N)/E 100.0 100.0 100.0 100.0 100.0 100.0 100.0 100.0 100.0 100.0 100.0 100.0 100.0 100.0 100.0 100.0 100.0 100.0 97.3 91.9 99%
Latest Week 20
%
Timely
%
Complete
Last updated 26th May, 2017
Expected (Es)Timely Rpts
(Ts)
Late Rpts
(Ls)
Rpts Not Recvd
(Ns)W12 W13 W14 W15 W16 W17 W18 W19 W20W05 W06 W07 W08 W09 W10 W11
Timely
Reports
State GeoZones W01 W02 W03 W04
Weekly Epidemiological Report
Issue: Volume 7 No. 20
2nd June, 2017
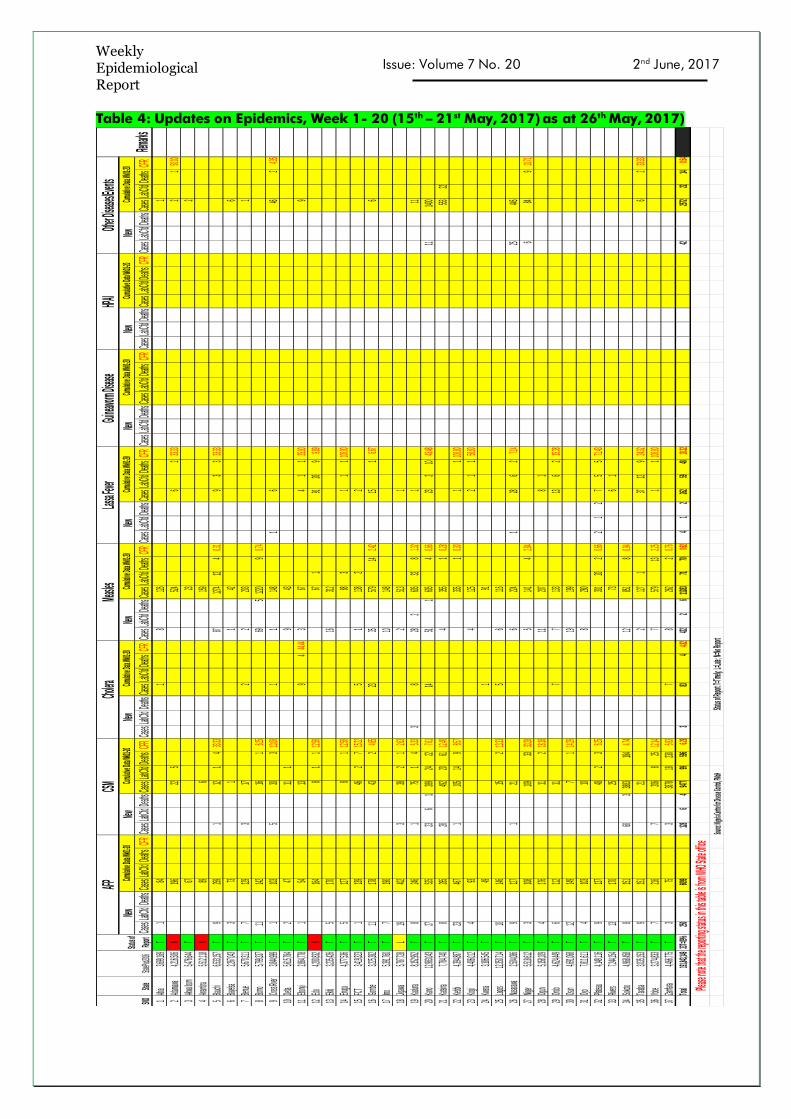
Table 4: Updates on Epidemics, Week 1- 20 (15th – 21st May, 2017) as at 26th May, 2017)
CasesL
abCfdD
eathsC
asesLab
CfdDea
thsCFR
CasesL
abCfdD
eathsC
asesLab
CfdDea
thsCFR
CasesL
abCfdD
eathsC
asesLab
CfdDea
thsCFR
CasesL
abCfdD
eathsC
asesLab
CfdDea
thsCFR
CasesL
abCfdD
eathsC
asesLab
CfdDea
thsCFR
CasesL
abCfdD
eathsC
asesLab
CfdDea
thsCFR
CasesL
abCfdD
eathsC
asesLab
CfdDea
thsCFR
CasesL
abCfdD
eathsC
asesLab
CfdDea
thsCFR
1Abia
3,699,16
9
T
184
18
1261
2Ada
mawa
4,216,50
6
N
19622
5524
62
33.33
21
50.00
3Akw
a Ibom
5,476,64
4
T
6723
2
4Ana
mbra
5,512,11
8
N
896
159
5Bau
chi6,53
3,157
T9
2591
121
433.3
387
1274
124
0.319
33
33.33
6Bay
elsa2,26
7,043
T3
731
142
6
7Ben
ue5,67
0,311
T7
1293
172
2203
1
8Born
o5,79
9,337
T11
14216
16.25
695
1220
90.74
9Cros
s River
3,844,99
9
T
1103
530
310.0
01
1148
16
462
4.35
10Delt
a5,61
5,784
T2
4711
19
43
11Ebo
nyi2,86
4,778
T1
5413
94
44.44
367
41
125.0
09
12Edo
4,200,83
2
N
1648
11
12.50
671
9120
99.89
13Ekit
i3,23
5,426
T5
17016
312
14Enu
gu4,37
7,536
T5
1278
112.5
088
31
111
00.00
15FCT
3,419,32
3
T
1139
462
715.2
25
1138
22
16Gom
be3,22
5,382
T11
17843
24.65
2335
57914
2.4215
16.67
6
17Imo
5,391,76
0
T
7190
10148
18Jiga
wa5,78
7,728
L19
4023
382
12.63
2513
1
19Kad
una8,15
2,952
T8
2461
751
45.33
38
282
60532
81.32
111
20Kan
o12,9
83,043
T27
52523
61
28924
227.61
1451
1605
40.66
232
1043.4
811
1400
21Kats
ina7,78
4,740
T8
28520
49220
6112.4
04
3551
0.28553
22
22Keb
bi4,39
4,887
T23
4671
10514
98.57
3351
0.301
1100.0
0
23Kog
i4,40
6,012
T4
934
1252
11
50.00
24Kwa
ra3,18
6,545
T49
191
25Lag
os12,3
50,714
T10
14615
213.3
35
6116
26Nas
arawa
2,504,08
6
T
9127
121
6224
128
62
7.1425
445
27Nige
r5,51
8,612
T3
108109
3330.2
85
1414
2.846
849
10.71
28Ogu
n5,15
8,109
T4
17611
218.1
811
2078
1
29Ond
o4,62
4,449
T6
11211
77
13313
62
15.38
30Osu
n4,69
1,068
T12
1497
114.2
919
199
31Oyo
7,811,61
1
T
4103
108
280
32Plat
eau4,14
9,116
T9
13748
23
6.25301
202
0.662
12
75
571.4
3
33Rive
rs7,24
4,154
T13
17025
736
1
34Sok
oto4,96
8,458
T8
15160
3388
3184
4.7412
8518
0.94
35Tara
ba3,03
5,153
T9
15121
2127
137
129
24.32
62
33.33
36Yob
e3,27
4,833
T7
2167
2068
2512.1
47
57913
2.251
1100.0
0
37Zam
fara4,46
6,775
T3
753
3878
18230
5.937
8262
20.76
Total
191,843,
149
33T
=89%
2506099
1286
49477
99596
6.293
834
4.82422
26
11283
7170
0.624
12
26259
4818.3
242
257222
140.54
Source: N
igeria Cen
tre for Dis
ease Con
trol, FMo
HStat
us of Re
port: T=
Timely;
L=Late;
N=No R
eport
Please n
ote that
the rep
orting st
atus in t
his tabl
e is from
WHO S
tate offi
ce
NewCum
ulative
Data Wk
01-20
NewCum
ulative
Data Wk
01-20
NewCum
ulative
Data Wk
01-20
NewCum
ulative
Data Wk
01-20
Other D
iseases/
Events
Remarks
NewCum
ulative
Data Wk
01-20
NewCum
ulative
Data Wk
01-20
NewCum
ulative
Data Wk
01-20
NewCum
ulative
Data Wk
01-20
Cholera
Measles
Lassa F
everGui
neawor
m Disea
seHPA
I
SNOStat
eStat
ePop201
6
Status o
f
Report
AFPCSM