Understanding India's Services Revolution, by Jim Gordon ... · Indian services exports is ... The...
34
Understanding India's Services Revolution* Jim Gordon and Poonam Gupta International Monetary Fund Paper prepared for the IMF-NCAER Conference, A Tale of Two Giants: India’s and China’s Experience with Reform, November 14-16, 2003, New Delhi This Version: November 12, 2003 Abstract This paper analyzes the factors behind the growth of the services sector in India. The paper shows that growth acceleration of the services in the 1990s was mostly due to fast growth in communication services, financial services, business services (IT) and community services. While factors such as a high income elasticity of demand for services, increased input usage of services by other sectors, and rising exports were important in boosting services growth in the 1990s, supply side factors including reforms and technological advances also played a significant role. The large growth potential of Indian services exports is well known, but the paper finds that there is also considerable scope for future rapid growth in the Indian service economy provided that deregulation of the services sector continues. The paper shows that employment growth in the Indian services sector has been quite modest, thus underscoring the importance of industry and agriculture also growing rapidly. ____________________________________________________________ We are grateful to Martin Cerisola, Deepak Mishra, Ashoka Mody, Sudip Mohapatra, Uma Ramakrishnan, and Michael Wattleworth for helpful comments and discussions. We would also like to thank Mr. Kolli from CSO for assistance with the data. Errors remain our own.
Transcript of Understanding India's Services Revolution, by Jim Gordon ... · Indian services exports is ... The...

Understanding India's Services Revolution*
Jim Gordon and Poonam Gupta
International Monetary Fund
Paper prepared for the IMF-NCAER Conference, A Tale of Two Giants: India’s and China’s Experience with Reform,
November 14-16, 2003, New Delhi
This Version:
November 12, 2003
Abstract
This paper analyzes the factors behind the growth of the services sector in India. The paper shows that growth acceleration of the services in the 1990s was mostly due to fast growth in communication services, financial services, business services (IT) and community services. While factors such as a high income elasticity of demand for services, increased input usage of services by other sectors, and rising exports were important in boosting services growth in the 1990s, supply side factors including reforms and technological advances also played a significant role. The large growth potential of Indian services exports is well known, but the paper finds that there is also considerable scope for future rapid growth in the Indian service economy provided that deregulation of the services sector continues. The paper shows that employment growth in the Indian services sector has been quite modest, thus underscoring the importance of industry and agriculture also growing rapidly.
____________________________________________________________ We are grateful to Martin Cerisola, Deepak Mishra, Ashoka Mody, Sudip Mohapatra, Uma Ramakrishnan, and Michael Wattleworth for helpful comments and discussions. We would also like to thank Mr. Kolli from CSO for assistance with the data. Errors remain our own.

- 2 -
I. INTRODUCTION
A striking feature of India’s growth performance over the past decade has been the strength of the services sector. Table 1 shows that on average services grew more slowly than industry between 1951 and 1990. Growth of services picked up in the 1980s, and accelerated in the 1990s, when it averaged 7.5 percent per annum, thus providing a valuable prop to industry and agriculture, which grew on average by 5.8 percent and 3.1 percent respectively.1 Most forecasters expect that services will grow at similar if not higher rates over the next few years.
Table 1: Sectoral Growth Rates
Average growth (In percent per annum)
1951-1980 1981-1990 1991-2000 Agriculture Industry Services GDP
2.1 5.3 4.5
3.5
4.4 6.8 6.6
5.8
3.1 5.8 7.5
5.8
Source: Own calculations using the CSO data
The emergence of services as the most dynamic sector in the Indian economy has
in many ways been a revolution. The most visible and well-known dimension of the take-off in services has been in software and IT-enabled services (including call centers, design, and business process outsourcing). However, growth in services in India has been much more broad-based than IT. In fact, although IT exports have had a profound impact on the balance of payments, the sector remains a small component of GDP. As of 2001, business services (which includes IT) was only about 1 percent of GDP, or 1/50 of the size of total services output.
The paper shows that almost all service subsectors in India have grown faster than
GDP over time, but the pick-up in growth in the 1990s was the strongest in business services, communication, and financial services, followed by community services and hotels and restaurants. These activities together account for the entire acceleration in services growth in the 1990s. The growth in public administration and defense, real estate, storage, transport, and personal services in the 1990s was broadly similar to that in the previous decades.
Rapid growth of the service sector is not unique to India. The existing literature shows that as an economy matures the share of services in output increases consistently.
1 Growth in the services sector has also been less cyclical and more stable than the growth of industry and agriculture (in the sense of having the smallest coefficient of variation).

- 3 -
To begin with, the increase occurs along with an increase in the share of industry. Thereafter, the service share grows more rapidly, accompanied by a stagnant or declining share of the industrial sector. Cross-country experience suggests that the first stage occurs until the country reaches lower middle income status, while the second stage commences once it becomes an upper middle income country.
Consistent with the trend observed in other countries, India’s growth experience has been characterized by a decline in the share of agriculture in GDP and an increase in the shares of industry and services. Between 1951 and 2000, the share of agriculture in GDP fell from 58 to 25 percent, while the share of industry and the share of services increased from 15 to 27 percent, and from 27 to 48 percent, respectively. In the 1990s, however, the share of services in India’s GDP climbed by about 8 percentage points, as compared to a cumulative increase of 13 percentage points during 1951-1990. The share of the industrial sector, on the other hand, has been stagnant since the 1990s. As a result, the sectoral composition of output in India has come to resemble that of a middle income country, even though its per capita income remains that of a low income country. This paper explores the factors behind the dynamism of the services sector in India. One explanation suggested in the literature for fast growth in services is that the income elasticity of demand for services is greater than one. Hence, the final demand for services grows faster than the demand for goods and commodities as income rises. Another explanation is that technical and structural changes in an economy make it more efficient to contract out services that were once produced in the industry. This type of outsourcing has been called the “splintering” of industrial activity. Splintering results in an increase in net input demand for services from the industrial sector, as well as the services sector growing proportionately faster than other sectors.
The empirical evidence presented in the paper shows that while splintering and
high income elasticity of demand for services have served to stimulate services growth in India, it is necessary to look beyond these factors to fully explain the growth acceleration since the 1990s. In particular, important roles also seem to have been played by economic reforms, the advent of the IT era, and growing external demand for services exports.2
Looking forward, our analysis suggests a bright future for the Indian services sector. The effects of high income elasticity of demand and increased input usage in industry are likely to continue for some time, before tapering off. But extra impetus to
2 Industrial sector reforms have also been carried out in India and the question arises why the industrial sector has not experienced the same sustained high level of growth that the service sector has experienced. This could be because industrial growth is more dependent on infrastructure development (such as roads and ports), which have acted as a bottleneck to growth. Labor restrictions and small-scale reservations may also have disadvantaged industry more than services. In addition, the faster growing services activities seem to be more intensive in skilled labor, with which India is well endowed.
- 4 -
services growth is also likely to come from exports and from liberalization. New markets for Indian service exports are just beginning to be tapped and there is substantial scope for further high growth rates in tradable services. There is also scope for considerable growth from liberalization and the associated productivity gains in some of the services subsectors where growth has lagged behind in the 1990s. The distribution sector seems to be a prime candidate in this regard.
The rest of the paper is organized as follows. In Section II, we place India's
growth experience in perspective by reviewing the existing literature and cross country evidence on sectoral transformation during growth. In Section III, we identify the services activities where growth was particularly high in the 1990s. In Section IV, we analyze the various possible factors behind the recent dynamism of the services sector. Section V provides econometric analysis of the importance of each competing hypothesis to explain growth, and Section VI concludes.
II. GROWTH AND SECTORAL SHARES, CROSS COUNTRY EVIDENCE AND INDIAN EXPERIENCE
The evolution of sectoral shares in output, consumption and employment as economies grow has been studied by economists for well over fifty years. During the 1950s and 1960s, research by Kuznets and Chenery suggested that development would be associated with a sharp decline in the proportion of GDP generated by the primary sector, counterbalanced by a significant increase in industry, and by a more modest increase in the service sector.3 Sectoral shares in employment were predicted to follow a similar pattern.
With the benefit of more data on development than was available to Kuznets and
Chenery, recent literature has tended to emphasize the growing importance of service sector activity (Inman 1985, Kongsamut, Rebelo and Xie, 2001). For example, Kongsamut, et al, (2001) analyze a sample of 123 countries for 1970-1989 and show that rising per-capita GDP is associated with an increase in services and a decline in agriculture both in terms of share in GDP and employment. In other words, the sectoral share given up by agriculture as the economy matures goes more to the services sector and less to industry than the Kuznets-Chenery work had suggested. The modern view is that as an economy matures, the share of services (in output, consumption, and employment) grows along with a decline in agriculture. By contrast, the share of industry first increases modestly, and then stabilizes or declines.
3 Using pooled cross-section and time-series data, Chenery and Taylor (1968) found the industry share in GDP to be positively associated with income and population, and negatively associated with primary exports. This implied a tendency for industry to gain as income rose, but that the gain would be less pronounced in small countries with substantial natural resource endowments.

- 5 -
A. Share of Services in GDP
Such a pattern of growth is visible in the cross-country data on shares in GDP presented in Table 2. These data suggest two stages of development. In the first, both industry and services shares increase as countries move from low income to lower middle income status, while in the second, the share of industry declines and that of services increases as the economy moves to upper middle and higher income levels.
Table 2: Sectoral Shares in GDP in 2001, Global Averages
(Percent of GDP)
How does the Indian experience fit in with this pattern? Through the 1980s at least, the fit is quite close. Chart 1 shows that in the four decade period, 1950-1990, agriculture’s share in GDP declined by about 25 percentage points, while industry and services gained equally. The share of industry has stabilized since 1990, and the entire subsequent decline in the share of agriculture has been picked up by the services sector. Thus, while over the four decades, 1950-1990, the services sector gained a 13 percent share, the gain in the 1990s alone was 8 percentage points.
Chart 1: India, Sectoral Shares in GDP, 1950-2000
Consequently, at current levels, India’s services share of GDP is higher than the average for other low income countries. A comparison of Table 3 with Table 2 shows that the size of India’s services sector, relative to GDP, is closer to the average of lower middle income countries.
Agriculture Industry Services Low income Lower middle income Upper middle income High income
24 12 7 2
32 40 33 29
45 Stage I 48 60 Stage II 70
Source: World Bank’s WDI, 2003, Table 4.2. Definition: Low income: per capita GDP<$745; Lower middle-$746-2975; Upper middle-$2976-9205; and high->$9206.
Sectoral Shares in GDP
0
20
40
60
1951
1961
1971
1981
1991
2001
Agr Ind Ser
Change in Sectoral Shares
-10
-6
-2
2
6
10
50s
60s
70s
80s
90s
Agr Ind Ser

- 6 -
Table 3: India, Sectoral Shares in GDP, 1950-2003 (Percent of GDP)
Is India an outlier? The evidence suggests that though the Indian services sector is
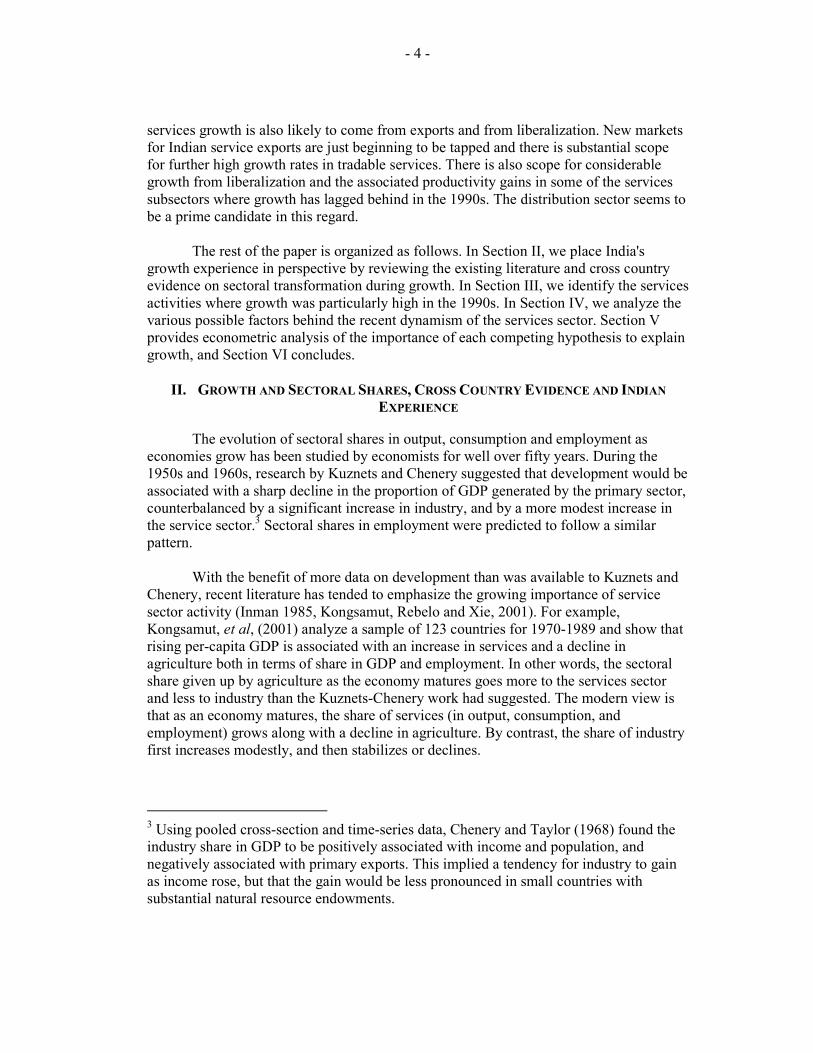
above average compared to other countries, India cannot be called an outlier. Chart 2 relates the share of services in GDP to the per capita income in 1990 and 2001 using the WDI data for various countries.4 As is shown by the fitted line, the share of services in GDP is associated positively with per capita income, i.e., the countries with higher per capita income also have a larger share of their GDP contributed by the services sector.
In 1990, the Indian services sector share in GDP is very close to the average share
predicted by this linear relationship. As a result of rapid services growth in the 1990s, however, India’s share in services had moved above the average share predicted by the cross country experience by as much as 5 percentage points of GDP by 2001. Even so, in terms of having a large share of services in GDP, India is by no means an outlier.5
4 The sample includes countries with GDP more than US$ 10 billion, for which the data are available in WDI. Based on these criteria, data for 55 countries are used in the chart.
5 By contrast, the share of the service sector in China is considerably below the cross-country average. One view is that this is a legacy of the centrally planned economy, where the primary focus was on agriculture and industry. Under this system, many services (such as transportation, finance, and education and health for workers) were provided by the state owned enterprises themselves and thus would have been classified as industrial activity. Another view is that the data on the Chinese service sector is under-estimated by about 5-10 percentage points of GDP due to under-reporting of the informal sector. Salient features of the Chinese services sector are summarized in Box 1.
Agriculture Industry Services 1950 1980 1990 2000 2003#
58 38 33 24 22
15 24 27 27 27
28 38 Stage I 41 49 Stage II 51
Source: Own calculation using CSO data for India. # indicates revised estimates
- 7 -
Chart 2: Cross Country Data on Per Capita Income and Share of Services in GDP
If different sectors in India grow at the average growth rates experienced in 1996-
2000, then by 2010, the share of services would increase to 58 percent, which would bring the size of the India’s services sector, relative to GDP, closer to that of an upper middle income country, while still belonging to the low income group.
Per Capita Income and Services Share in GDP (1990)
y = 4.7Ln(x) + 12.7R2 = 0.4
20
30
40
50
60
70
80
100 1,000 10,000 100,000GDP per capita (current US$)
Shar
e of
Ser
vice
s in
GD
P (%
)India
China
Per Capita income and Services Share in GDP (2001)
y = 6.0Ln(x) + 8.8R2 = 0.5
20
30
40
50
60
70
80
100 1,000 10,000 100,000GDP per capita (current US$)
Sha
re o
f Ser
vice
s in
GD
P (%
)
India
China

- 8 -
B. Box 1: Services Sector in China
India and China had quite similar sectoral shares in 1950. Over the past five decades, both countries have experienced a sharp decline in the weight of agriculture in GDP. This process paused in China in the 1970s, but in the period since the early 1980s when economic reforms commenced, agriculture’s share has fallen by over half. In 1982, agriculture contributed 33.3 percent of China’s GDP; by 2001, the share was only 15.2 percent.
Sectoral Shares in GDP in China Agriculture Industry Services 1951/52 1981/82 1991/92 2000/1
50.5 33.3 21.8 15.2
20.9 45.0 43.9 51.1
28.6 21.7 34.3 33.6
Source: Own calculations using CEIC database Services is the fastest growing sector in the 1990s in India, but not in China
1979-1990 1991-2000 Agriculture Industry Services GDP
6.3 9.6 12.4 9.3
3.8
13.6 9.1
10.1 A notable feature of the comparison is that growth has been uniformly higher across sectors in China. There has, of course, been considerable debate about whether Chinese growth rates are overstated. The table shows that the conclusion that growth has been higher in all sectors would still hold if the overstatement is only about 1-2 percentage points (which is a common belief--see IMF, 1999). It obviously would not survive more radical revisions to the Chinese data. Measurement issues aside, the higher growth in Chinese agriculture, particularly in the 1980s, is striking. Srinivasan (2001) attributes this to China having liberalized agriculture at an early stage, whereas this task still lies largely ahead in India. Growth of services is least volatile in both India and China For both countries, the coefficient of variations of sectoral growth rates show the service sector to be less volatile than industry, and much less volatile than agriculture. Even so, the volatility of growth is lower in China than in India for both agriculture and industry. Composition of the services sector is similar in India and China Although China’s service sector is smaller as a share of GDP, the composition is much the same in both countries. The only significant difference is that Community, Social and Personal services are relatively larger in China. Since this sector includes government, this may reflect China’s greater socialist orientation. The share of trade, hotels, and restaurants is correspondingly larger in India.
Share of Various Activities in Services Sector in 2000
18
23
34
24
Transport, Storage, Postaland T elecommunication
Financing, Insurance and RealEstate
Community, Social, andPersonal Service
Wholesale and Retail Tradeand Catering Services
- 9 -
B. Share of Services in Employment
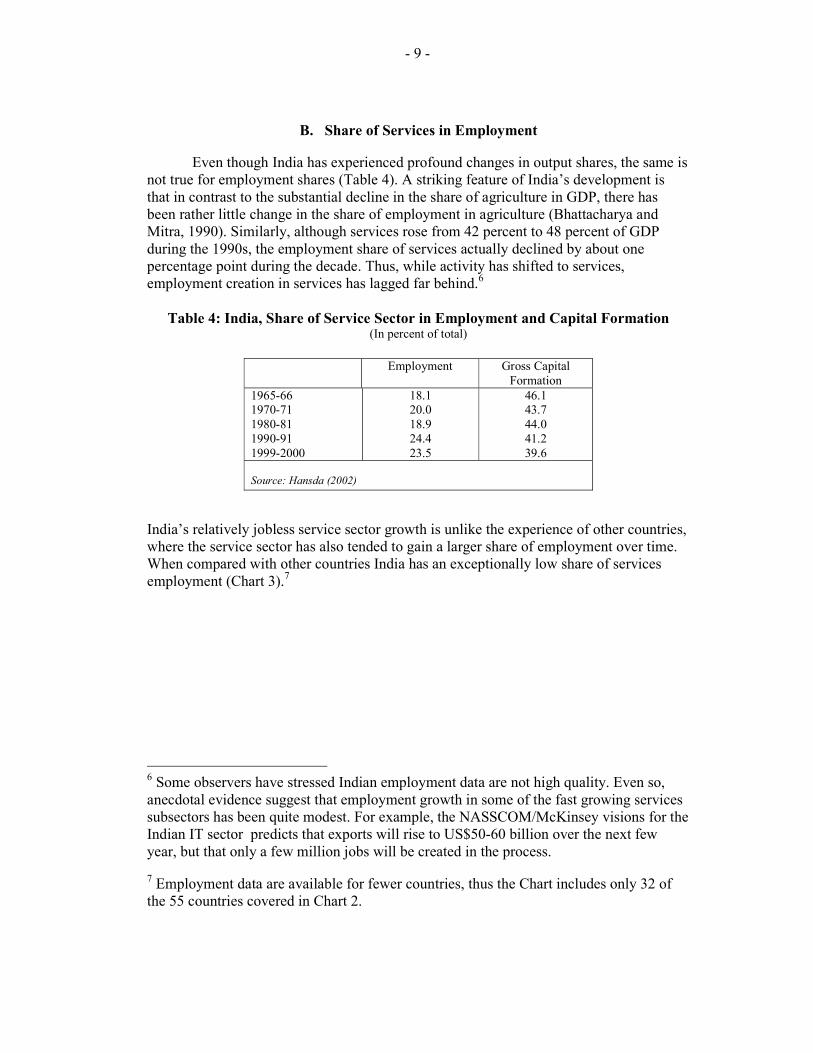
Even though India has experienced profound changes in output shares, the same is not true for employment shares (Table 4). A striking feature of India’s development is that in contrast to the substantial decline in the share of agriculture in GDP, there has been rather little change in the share of employment in agriculture (Bhattacharya and Mitra, 1990). Similarly, although services rose from 42 percent to 48 percent of GDP during the 1990s, the employment share of services actually declined by about one percentage point during the decade. Thus, while activity has shifted to services, employment creation in services has lagged far behind.6
Table 4: India, Share of Service Sector in Employment and Capital Formation
(In percent of total)
Employment Gross Capital Formation
1965-66 1970-71 1980-81 1990-91 1999-2000
18.1 20.0 18.9 24.4 23.5
46.1 43.7 44.0 41.2 39.6
Source: Hansda (2002)
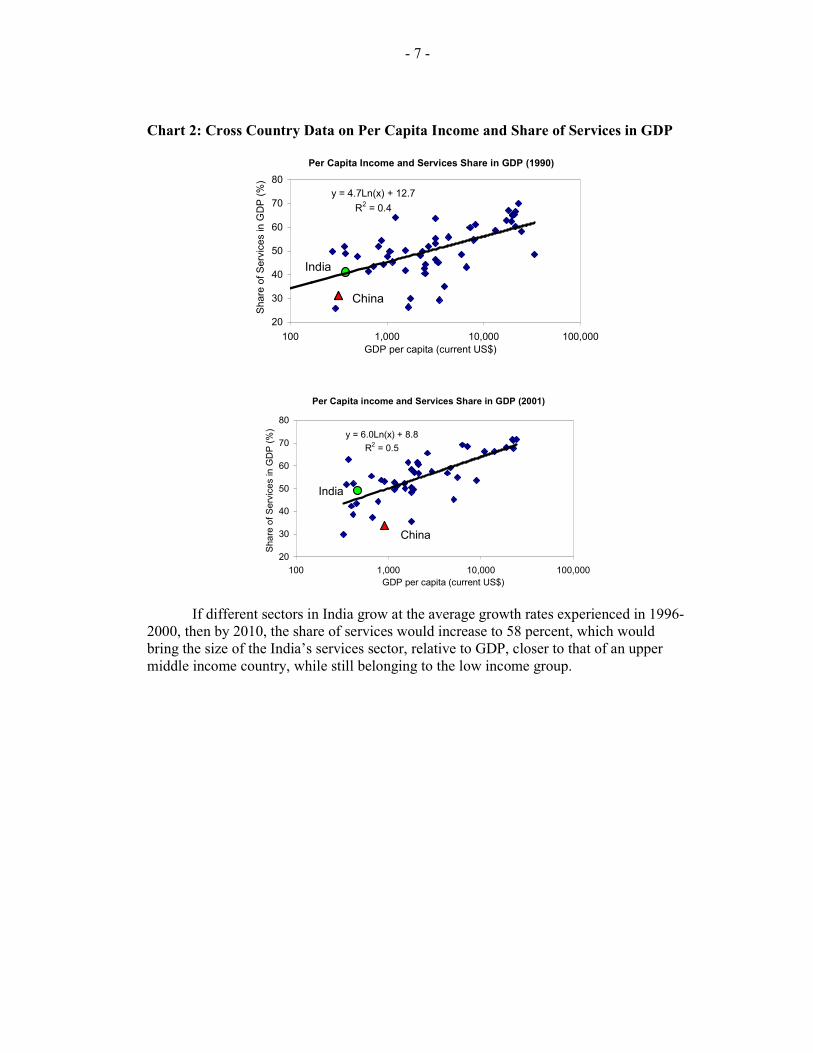
India’s relatively jobless service sector growth is unlike the experience of other countries, where the service sector has also tended to gain a larger share of employment over time. When compared with other countries India has an exceptionally low share of services employment (Chart 3).7
6 Some observers have stressed Indian employment data are not high quality. Even so, anecdotal evidence suggest that employment growth in some of the fast growing services subsectors has been quite modest. For example, the NASSCOM/McKinsey visions for the Indian IT sector predicts that exports will rise to US$50-60 billion over the next few year, but that only a few million jobs will be created in the process.
7 Employment data are available for fewer countries, thus the Chart includes only 32 of the 55 countries covered in Chart 2.
- 10 -
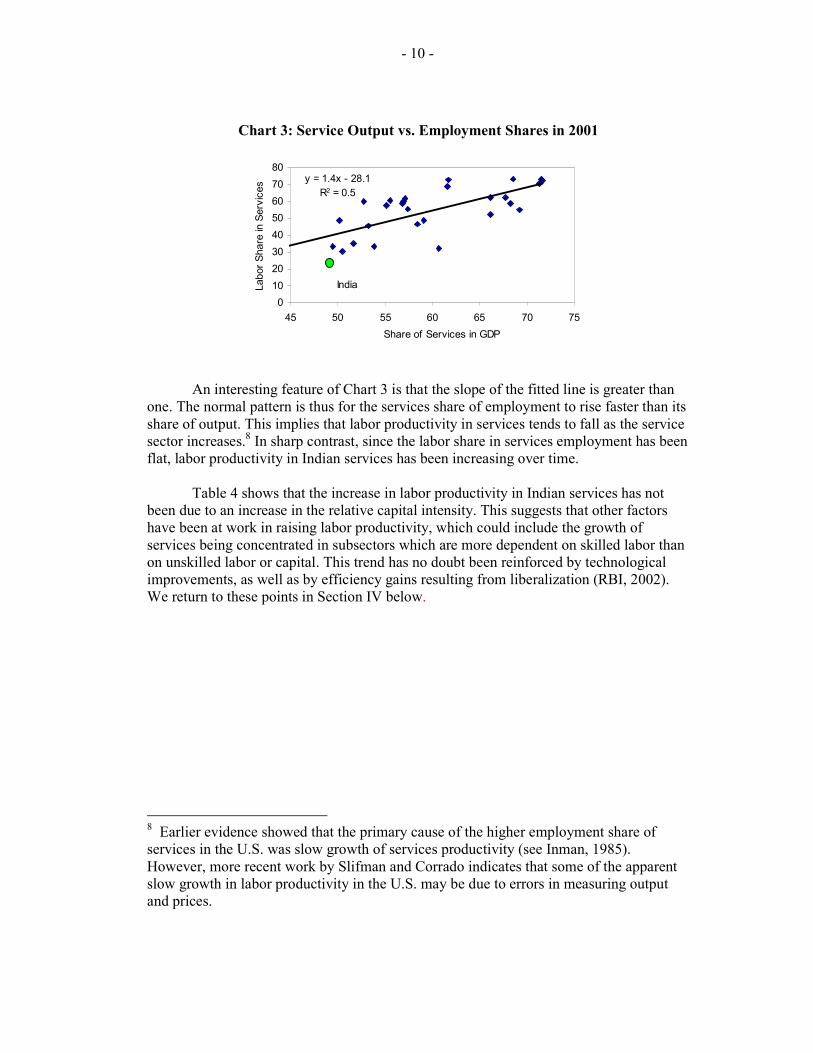
Chart 3: Service Output vs. Employment Shares in 2001 An interesting feature of Chart 3 is that the slope of the fitted line is greater than
one. The normal pattern is thus for the services share of employment to rise faster than its share of output. This implies that labor productivity in services tends to fall as the service sector increases.8 In sharp contrast, since the labor share in services employment has been flat, labor productivity in Indian services has been increasing over time.
Table 4 shows that the increase in labor productivity in Indian services has not
been due to an increase in the relative capital intensity. This suggests that other factors have been at work in raising labor productivity, which could include the growth of services being concentrated in subsectors which are more dependent on skilled labor than on unskilled labor or capital. This trend has no doubt been reinforced by technological improvements, as well as by efficiency gains resulting from liberalization (RBI, 2002). We return to these points in Section IV below.
8 Earlier evidence showed that the primary cause of the higher employment share of services in the U.S. was slow growth of services productivity (see Inman, 1985). However, more recent work by Slifman and Corrado indicates that some of the apparent slow growth in labor productivity in the U.S. may be due to errors in measuring output and prices.
y = 1.4x - 28.1R2 = 0.5
01020304050607080
45 50 55 60 65 70 75Share of Services in GDP
Labo
r Sha
re in
Ser
vice
s
India

- 11 -
III. WHICH SERVICES HAVE GROWN RAPIDLY?
In this section we identify the drivers of growth acceleration in the services. The data on annual growth rate series over the past fifty years (Chart 4) suggests a structural break in growth in services starting in 1980. While through the 1970s, the growth path was more or less flat, the trend shifted upwards in the 1980s and then perhaps again in the 1990s. By contrast, the growth path for industry (not shown here), which had exhibited a declining trend between 1954-1980, has been flat over the past two decades.
Chart 4: Growth Rate of Services Sector in India
0
2
4
6
8
10
1953
1958
1963
1968
1973
1978
1983
1988
1993
1998
Growth Rate (3 year M.A.) Linear Trend until 1980
Linear Trend Since 1980
Y = 0.01 x + 4.4R2 = 0.02
Y = 0.16 x + 5.26R2 = 0.52
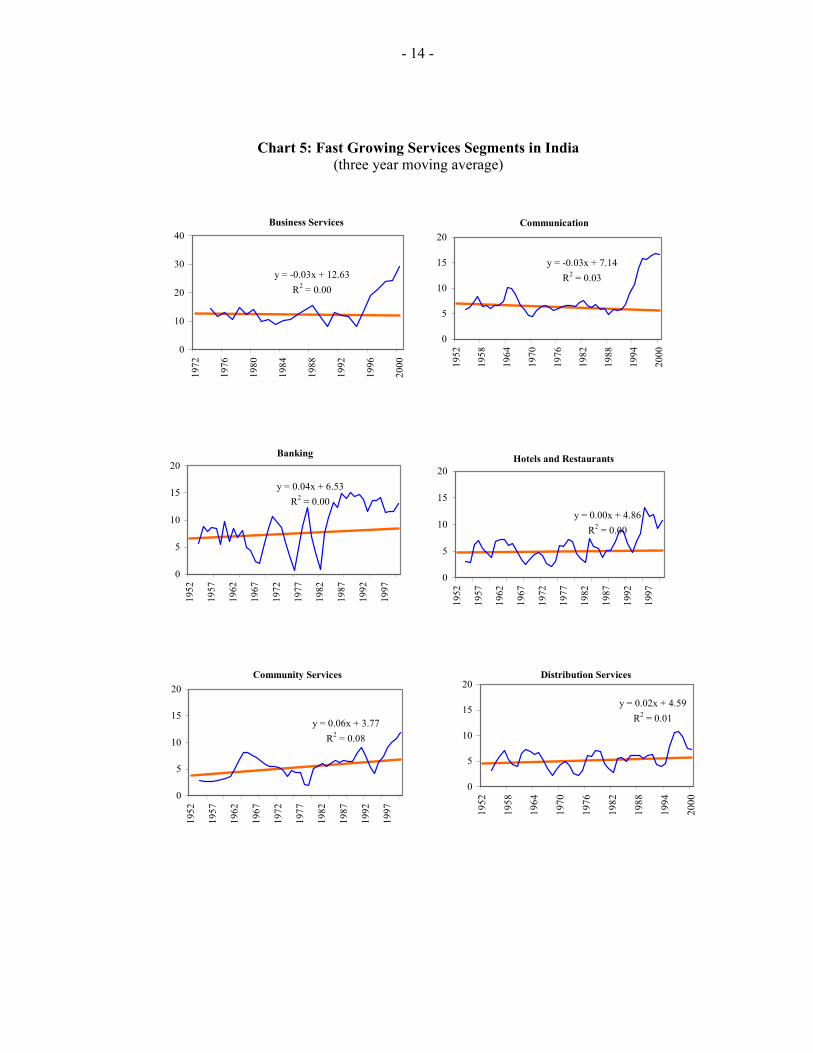
The acceleration in services growth in the 1980s and 1990s was not uniform
across different activities (Table 5). Some segments grew at a rate much faster than their past average growth rates, while for other sub-sectors, growth rates were similar to the past trend. To identify the growth-drivers within the services sector, we compare the growth rates of various activities in the 1990s with their previous trend growth rates (Chart 5). The trend growth rates are estimated using the three year moving average of the growth rate and the period through 1990 is included in estimating the trend (except for banking for which the trend is estimated using the data until 1980).
Comparison of the actual and the trend growth rates shows that growth in several
service sub-sectors accelerated sharply in the 1990s (and 1980s for banking); indicating some sort of a structural break in their growth series. We call these activities fast growers. The remaining activities grew more or less at a trend rate, these we call trend growers.
Based on the above criterion, fast growers include business services (which
includes IT), communication services, financial services, hotels and restaurants, community services, and trade (distribution) services. The trend growers include real estate, legal services, transport, storage, personal services, and public administration and defense (PAD).
- 12 -
A. Fast Growers
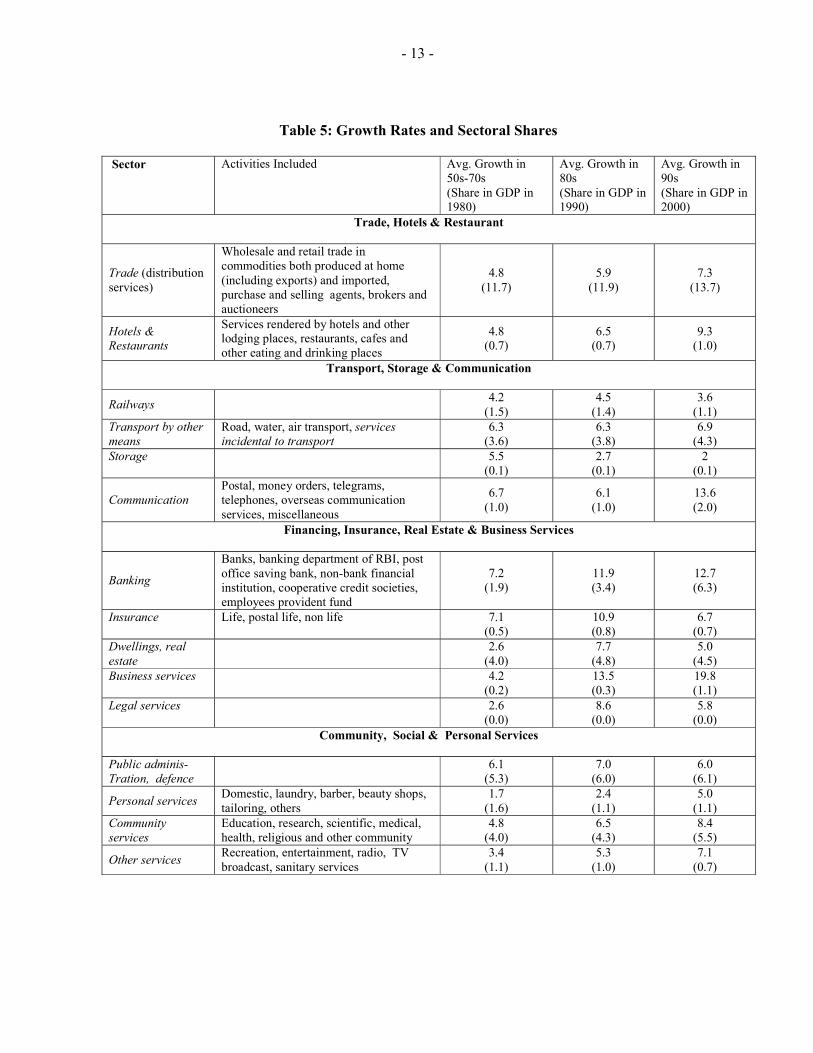
Business services was the fastest growing sector in the 1990s, with growth averaging nearly 20 percent a year. Though disaggregated data for this category are not available, however export and software industry data show that the growth was mainly on account of the IT sector. Despite being the fastest growing sector, business services, particularly IT activity, was growing off a low base and its contribution to service sector and GDP growth was quite modest in the nineties. As we discuss later, this segment is expected to continue growing at a very high rate and is likely to contribute more significantly to services growth in the future.
Communication services, which registered growth of 14 percent a year during the
1990s, made a significant contribution to services growth. The growth in communication was mostly due to telecom, which accounts for 80 percent of output and grew at 17 percent a year on average during the 1990s.
In the banking sector, growth jumped from about 7 percent over the period 1950-
1980, to 12 percent in the 1980s, and to 13 percent in the 1990s. Growth was most rapid in NBFIs (which grew by 24 percent in the 1980s and 19 percent in the 1990s), followed by growth in the banks (10 percent and 9 percent respectively in the 1980s and 1990s). The contribution of banking to services sector growth was larger than that of the communications sector.
Community services and hotels and restaurants increased at the trend growth rate
through the early 1990s, and experienced a pick up in growth in the latter part of the decade. In community services, this was due to both education and health services (accounting for about 70 percent and 23 percent of the value added, respectively) growing at an average rate of 8 percent in 1990s.
.
- 13 -
Table 5: Growth Rates and Sectoral Shares
Sector
Activities Included Avg. Growth in 50s-70s (Share in GDP in 1980)
Avg. Growth in 80s (Share in GDP in 1990)
Avg. Growth in 90s (Share in GDP in 2000)
Trade, Hotels & Restaurant
Trade (distribution services)
Wholesale and retail trade in commodities both produced at home (including exports) and imported, purchase and selling agents, brokers and auctioneers
4.8 (11.7)
5.9 (11.9)
7.3 (13.7)
Hotels & Restaurants
Services rendered by hotels and other lodging places, restaurants, cafes and other eating and drinking places
4.8 (0.7)
6.5 (0.7)
9.3 (1.0)
Transport, Storage & Communication
Railways
4.2 (1.5)
4.5 (1.4)
3.6 (1.1)
Transport by other means
Road, water, air transport, services incidental to transport
6.3 (3.6)
6.3 (3.8)
6.9 (4.3)
Storage
5.5 (0.1)
2.7 (0.1)
2 (0.1)
Communication Postal, money orders, telegrams, telephones, overseas communication services, miscellaneous
6.7 (1.0)
6.1 (1.0)
13.6 (2.0)
Financing, Insurance, Real Estate & Business Services
Banking
Banks, banking department of RBI, post office saving bank, non-bank financial institution, cooperative credit societies, employees provident fund
7.2 (1.9)
11.9 (3.4)
12.7 (6.3)
Insurance
Life, postal life, non life 7.1 (0.5)
10.9 (0.8)
6.7 (0.7)
Dwellings, real estate
2.6 (4.0)
7.7 (4.8)
5.0 (4.5)
Business services
4.2 (0.2)
13.5 (0.3)
19.8 (1.1)
Legal services
2.6 (0.0)
8.6 (0.0)
5.8 (0.0)
Community, Social & Personal Services
Public adminis- Tration, defence
6.1 (5.3)
7.0 (6.0)
6.0 (6.1)
Personal services Domestic, laundry, barber, beauty shops, tailoring, others
1.7 (1.6)
2.4 (1.1)
5.0 (1.1)
Community services
Education, research, scientific, medical, health, religious and other community
4.8 (4.0)
6.5 (4.3)
8.4 (5.5)
Other services Recreation, entertainment, radio, TV broadcast, sanitary services
3.4 (1.1)
5.3 (1.0)
7.1 (0.7)
- 14 -
Chart 5: Fast Growing Services Segments in India
(three year moving average)
Business Services
y = -0.03x + 12.63R2 = 0.00
0
10
20
30
40
1972
1976
1980
1984
1988
1992
1996
2000
Communication
y = -0.03x + 7.14R2 = 0.03
0
5
10
15
20
1952
1958
1964
1970
1976
1982
1988
1994
2000
Banking
y = 0.04x + 6.53R2 = 0.00
0
5
10
15
20
1952
1957
1962
1967
1972
1977
1982
1987
1992
1997
Community Services
y = 0.06x + 3.77R2 = 0.08
0
5
10
15
20
1952
1957
1962
1967
1972
1977
1982
1987
1992
1997
Distribution Services
y = 0.02x + 4.59R2 = 0.01
0
5
10
15
20
1952
1958
1964
1970
1976
1982
1988
1994
2000
Hotels and Restaurants
y = 0.00x + 4.86R2 = 0.00
0
5
10
15
2019
52
1957
1962
1967
1972
1977
1982
1987
1992
1997
- 15 -
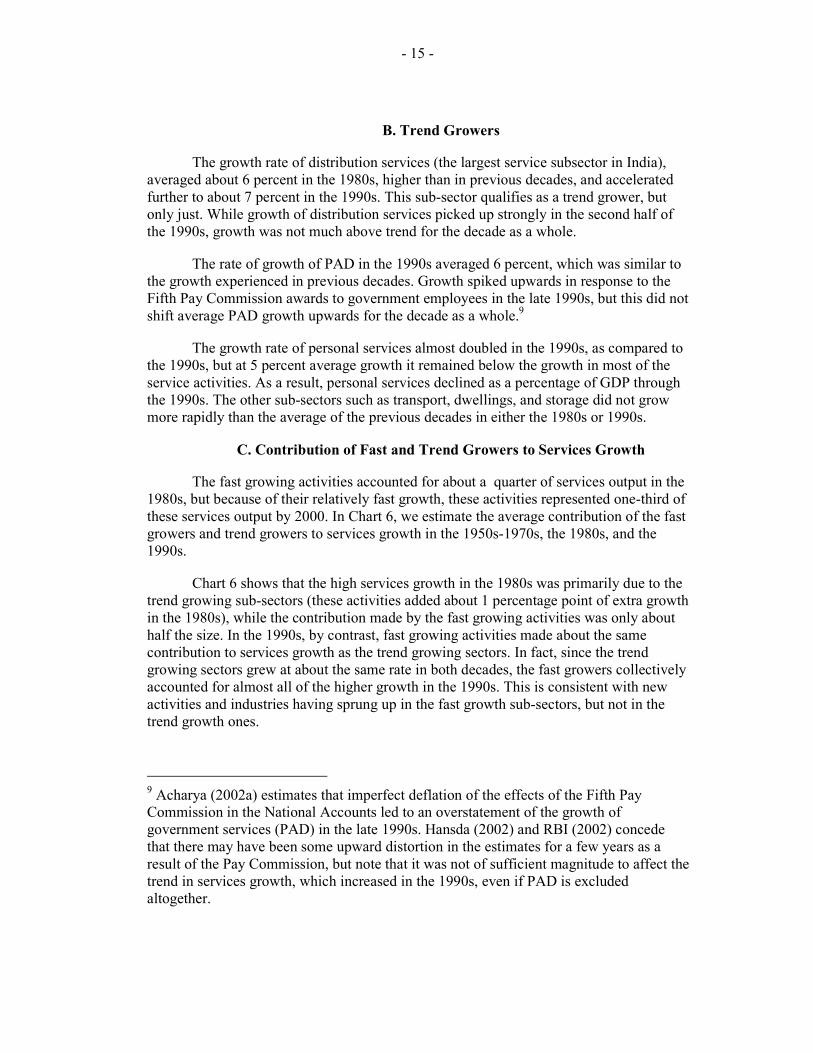
B. Trend Growers
The growth rate of distribution services (the largest service subsector in India), averaged about 6 percent in the 1980s, higher than in previous decades, and accelerated further to about 7 percent in the 1990s. This sub-sector qualifies as a trend grower, but only just. While growth of distribution services picked up strongly in the second half of the 1990s, growth was not much above trend for the decade as a whole.
The rate of growth of PAD in the 1990s averaged 6 percent, which was similar to the growth experienced in previous decades. Growth spiked upwards in response to the Fifth Pay Commission awards to government employees in the late 1990s, but this did not shift average PAD growth upwards for the decade as a whole.9
The growth rate of personal services almost doubled in the 1990s, as compared to the 1990s, but at 5 percent average growth it remained below the growth in most of the service activities. As a result, personal services declined as a percentage of GDP through the 1990s. The other sub-sectors such as transport, dwellings, and storage did not grow more rapidly than the average of the previous decades in either the 1980s or 1990s.
C. Contribution of Fast and Trend Growers to Services Growth
The fast growing activities accounted for about a quarter of services output in the 1980s, but because of their relatively fast growth, these activities represented one-third of these services output by 2000. In Chart 6, we estimate the average contribution of the fast growers and trend growers to services growth in the 1950s-1970s, the 1980s, and the 1990s.
Chart 6 shows that the high services growth in the 1980s was primarily due to the trend growing sub-sectors (these activities added about 1 percentage point of extra growth in the 1980s), while the contribution made by the fast growing activities was only about half the size. In the 1990s, by contrast, fast growing activities made about the same contribution to services growth as the trend growing sectors. In fact, since the trend growing sectors grew at about the same rate in both decades, the fast growers collectively accounted for almost all of the higher growth in the 1990s. This is consistent with new activities and industries having sprung up in the fast growth sub-sectors, but not in the trend growth ones.
9 Acharya (2002a) estimates that imperfect deflation of the effects of the Fifth Pay Commission in the National Accounts led to an overstatement of the growth of government services (PAD) in the late 1990s. Hansda (2002) and RBI (2002) concede that there may have been some upward distortion in the estimates for a few years as a result of the Pay Commission, but note that it was not of sufficient magnitude to affect the trend in services growth, which increased in the 1990s, even if PAD is excluded altogether.

- 16 -
Chart 6: Contribution of Fast and Trend Growers to Growth in Services10
IV.
10 Chart 6 does not include the contribution of railways, legal services, storage, real estate, and other services. Hence the total contribution shown does not add up to the total growth of the services sector.
0
1
2
3
4
50s-70s 80s 90s
Hotels and Rest.Business SerCommunicationCommunity SerBanking
0.00
1.00
2.00
3.00
4.00
50s-70s 80s 90s
TransportPersonal SerPADDistribution Ser

- 17 -
IV. EXPLAINING SERVICES SECTOR GROWTH
A number of studies have attempted to explain the fast growth in the share of service activity observed in cross country data. The literature draws a distinction between demand and supply factors (Kravis, 1982, Francois and Reinhart, 1996).
On the supply side, the share of services can be boosted by a switch to a more
service-input intensive method of organizing production. Such a change in production methods can arise as a result of increasing specialization as the economy matures. For example, over time, industrial firms may make greater use of specialist sub-contractors to provide services that were previously provided by the firms themselves. Legal, accounting, and security services are obvious candidates to be contracted out. Bhagwati (1994) calls this process of specialization splintering. Kravis (1982) points out that splintering will lead to growth in the share of services in GDP, even when GDP itself is not growing.
On the demand side, an increase in the output share of services can arise from
rapid growth in the final demand for services. This could be from domestic consumers with a high income elasticity of demand for services, or from foreign consumers with a growing demand for the country’s service exports. Demand-led growth of this type is likely to result, at least initially, in higher prices of services, as well as a shift of resources into the production of services.
Service activity can also be stimulated by technological advances, whereby new
activities or products emerge as a result of technological breakthrough—such advances are likely to be particularly relevant in the case of the IT sector (e.g. the internet), telecommunication (cellular phone services) and to some extent in financial services (credit cards, ATMs etc.).11
Liberalization can also provide a boost to services. In India, important policy reforms were made in the 1990s which were conducive to the growth of services sector, such as deregulation, privatization and opening up to FDI. If the growth of services was previously inhibited by government controls, then policy changes may provide a positive shock that unleashes new activity and growth.12
We review each factor in turn and discuss their applicability to India.
11 While these are supply side effects, demand is important for these effects to survive. For example, a number of technological advances during the dot.com boom failed to take off because demand was insufficient to make them commercially viable (e.g. ebooks).
12 Technically, it is the relative speed of liberalization that counts—service activity can be stimulated by rapid deregulation of services or by slow liberalization of other sectors such as industry.

- 18 -
A. Splintering
As noted, changes in production technique can cause industry to splinter. This causes an increase in the proportion of output originating in the services sector. Such splintering would be reflected in an increase in the use of intersectoral inputs, but not in an increase in the final demand for services.
One way to estimate the importance of splintering to services growth would be to try and measure the increase in input usage of services in other sectors through changes in the input-output coefficients. The latest input-output matrix for India is available only for 1993-94, and the change in the pattern of intersectoral usage of inputs for the whole of the 1990s cannot be studied. The matrices for different years show that the use of service sector inputs in industry increased by about 40 percent between 1979/80 and 1993/94, i.e., the input-output coefficient increased from 0.15 to 0.21. The use of services inputs into agriculture almost doubled during this period, but still remained low (only 5 percent of the gross output).
Table 6: Evolution of Input Output Coefficients in India
Agriculture Industry Services
1979-80 Agriculture Industry Services
0.06 0.07 0.02
0.13 0.35 0.15
0.04 0.11 0.10
1989-90 Agriculture Industry Services
0.17 0.14 0.05
0.04 0.37 0.19
0.04 0.17 0.19
1993-94 Agriculture Industry Services
0.15 0.14 0.05
0.04 0.37 0.21
0.03 0.15 0.20
Source: Sastry et al (2001) Using the input-output coefficients and sectoral shares in output, it is possible to
illustrate how important splintering has been in India. The input-output coefficients for services input in agriculture and industry increased by 0.03 and 0.04, respectively, during the 1980s. These coefficient changes would have increased demand for services (as a first round effect) by:
∆YS = 0.03YA + 0.04YI
Dividing through by total output Y and evaluating at the average sectoral shares
during the 1980s (0.35, 0.25 and 0.40 for agriculture, industry and services, respectively), yields:
∆YS/YS = ((0.03*0.35) + (0.04*0.25)) /0.4 = 0.051

- 19 -
i.e., 5.1 percent over the decade. This would suggest that splintering may have added about ½ percentage point to annual services growth during the 1980s.
Data for the 1990s are only partial. However, a similar calculation for the period
1989/90-1993/94 yields a splintering effect on growth of about ¼ percentage point per annum. Thus the increase in the use of service inputs is much less during early 1990s than in the 1980s. We do not yet know whether this trend continued for the rest of the decade. However, it has already been seen that some of the fastest growing services activities in the 1990s were oriented toward final consumption (e.g., community services, communication services, and hotels and restaurants), and this would be consistent with splintering having played a less important role in boosting growth in the 1990s.
Thus, increases in the use of services input in other sectors over time may be
partly responsible for the increase in services share in GDP. However, the changes in input usage do not appear to have accelerated in the 1990s and thus cannot explain the recent pick-up in services growth.
B. Elastic Final Demand The high income elasticity argument appears to have some merit in explaining
services growth in India. Table 7 indicates that the share of services in private final consumption expenditure has almost tripled since 1951.
Table 7: Private Final Consumption of Services in India
Year
Private Final consumption (percent of total final
consumption)
1950-51 1970-71 1980-81 1990-91 1999-00
10.2 13.4 15.5 20.4 27.6
Source: Hansda (2002)
How important a role has increasing final demand played in boosting services
growth? The available data do not permit a precise split of private final consumption expenditure into a goods and a services component. Nonetheless, a rough estimate can be made and this indicates a sharp rise in the growth of final demand for services in the 1990s.

- 20 -
Table 8: Growth Rates of Value Added and Final Consumption of Services and GDP
Private final consumption of
services
Service sector value-
added
GDP
1970s 4.6 4.5 2.9 1980s 5.4 6.6 5.8 1990s 7.9 7.5 5.8
Source: Own estimates using CSO data
Table 8 shows that final consumption of services grew at a rate broadly similar to
services output in the 1990s, whereas in the 1980s, final consumption of services grew at a slower rate than service output (this is consistent with the observation that there may have been more splintering during the 1980s).
Another way of trying to understand how large a role could have been played by
elastic demand is to examine the behavior of services output as percentage of GDP. Chart 7 shows that the share in GDP of most of the activities, fast as well as trend growers, is increasing over time, which can best be described by a positive linear trend, and is consistent with the income elasticity of final demand for services being greater than one. However, the fast growing activities also exhibit a sharp increase in the output to GDP ratio from the early 1990s. For increases in final demand to explain this rapid growth in the 1990s would imply a huge increase in the elasticity of final demand for these activities, and there is no prior reason to expect this kind of behavioral change.
Thus, there seem to be other factors at play besides splintering and income
elasticity. In addition, if the growth in services output was largely a demand side phenomenon, we should not see a decline in the relative price of the services, as we do in the data. Chart 8 shows that the fast growing services subsectors were characterized by declining prices, which suggests that supply must have increased at a faster pace, or the productivity in the production of these services increased. By contrast, prices in the trend growing subsectors rose faster than the GDP deflator (not shown here), which supports the theory that a different mix of supply and demand factors were at work than in the case of the fast growers.

- 21 -
Chart 7: Output as Percentage of GDP (Linear time trend was estimated using data up to 1990, for banking data up to 1980 was used)
A. Fast Growers
B. Trend Growers
Business Services
y = 0.00x + 0.06R2 = 0.44
0
0.5
1
1.5
1951
1956
1961
1966
1971
1976
1981
1986
1991
1996
Communication
y = 0.02x + 0.35R2 = 0.98
0
1
2
3
1951
1956
1961
1966
1971
1976
1981
1986
1991
1996
Banking
y = 0.04x + 0.64R2 = 0.92
01234567
1951
1956
1961
1966
1971
1976
1981
1986
1991
1996
Community Services
y = 0.04x + 2.45R2 = 0.89
0
1
2
3
4
5
6
1951
1956
1961
1966
1971
1976
1981
1986
1991
1996
Distribution Services
y = 0.11x + 8.11R2 = 0.95
6
8
10
12
14
16
1951
1956
1961
1966
1971
1976
1981
1986
1991
1996
Public Adminstration and Defense
y = 0.10x + 2.07R2 = 0.97
012345678
1951
1956
1961
1966
1971
1976
1981
1986
1991
1996
Hotels
y = 0.01x + 0.47R2 = 0.95
0
0.3
0.6
0.9
1.2
1951
1956
1961
1966
1971
1976
1981
1986
1991
1996
Transport (Other Than Railways)
y = 0.06x + 1.38R2 = 0.97
0
1
2
3
4
5
1951
1956
1961
1966
1971
1976
1981
1986
1991
1996
Personal Services
y = -0.04x + 2.77R2 = 0.96
0
1
2
3
1951
1956
1961
1966
1971
1976
1981
1986
1991
1996

- 22 -
Chart 8: Price Deflator of Services Relative to the GDP Deflator (Index, 1991 = 100; for Business Services and Banking, Index, 1980=100)
Services
94
96
98
100
10219
91
1993
1995
1997
1999
Banking and Insurance
70
80
90
100
110
120
1980
1982
1984
1986
1988
1990
1992
1994
1996
1998
2000
Communication
6070
8090
100110
1991
1993
1995
1997
1999
Business Services
5060708090
100110
1980
1982
1984
1986
1988
1990
1992
1994
1996
1998
2000
Hotel and Restaurants
94
96
98
100
102
1991
1993
1995
1997
1999

- 23 -
C. Higher Foreign Demand
With the advent of the IT revolution, it has become possible to deliver services over long distances at a reasonable cost, thus trade in services has increased world wide. India has been a particular beneficiary of this trend. In India, the exports in services (in dollar) grew in average at 15 percent a year in the 1990s, compared with 9 percent in the 1980s, and at 21 percent a year in the second half of the 1990s. Cumulatively, services exports increased four fold in the 1990s and reached US$ 25 billion in 2002 (about 7.5 billion of which was software exports). Chart 9 shows that Services exports from India now exceed 1 percent of the global exports in services (see Salgado, 2003).
Chart 9: Indian Services Exports
The increase in exports has been most dramatic in software and other business
services (included in the miscellaneous category), but there has also been growth in the export of transport, and travel services. As a result, the composition of services has changed dramatically in favor of miscellaneous services, which includes software exports (Chart 10).
Chart 10: Composition of Services Exports from India
Indian Services Exports as a Percentage of Global Services Exports
0
0.5
1
1.5
1980
1983
1986
1989
1992
1995
1998
2001
1990 4%
21%
34%
41%
Other transport travel Miscellaneous
2000 5%12%
20%
63%
Other transport travel Miscellaneous
Indian Services Exports as a Percentage of GDP
0
1
2
3
4
5
1980
1983
1986
1989
1992
1995
1998
2001

- 24 -
In order to make a rough estimate of the contribution of services exports to growth, we need to first estimate the value added component of exports. For this, we assume that input usage is same for services exports as for others services. From the I/O matrix, the input usage in services is roughly about 40 percent of gross output. Thus, about 60 percent of services exports would be valued added. Based on this assumption, value added by services exports can be calculated to have made a contribution to services growth of about 0.2 and 0.6 percentage points per annum in the 1980s and the 1990s, respectively.
Even though the estimated contribution of higher foreign demand to growth in the 1990s is calculated to have been fairly small, services exports have continued to grow rapidly into the 2000s (with the growth of software exports averaging 46 percent per annum during 1995-2003). With the IT sector expected to continue to flourish in the future, its contribution to growth will become increasingly significant over time.
D. Liberalization
Policy changes are also likely to be a factor behind the growth in services sector
activity in India, especially changes relating to deregulation, liberalization of FDI, and privatization of government owned services. An example would be the telecom industry where inefficient government provision led to a situation of effective rationing of services up until the early 1990s. As seen earlier, communications has been one of the fastest growing services subsectors in the 1990s and liberalization undoubtedly played a major role.
In order to empirically relate the growth in services to liberalization measures an
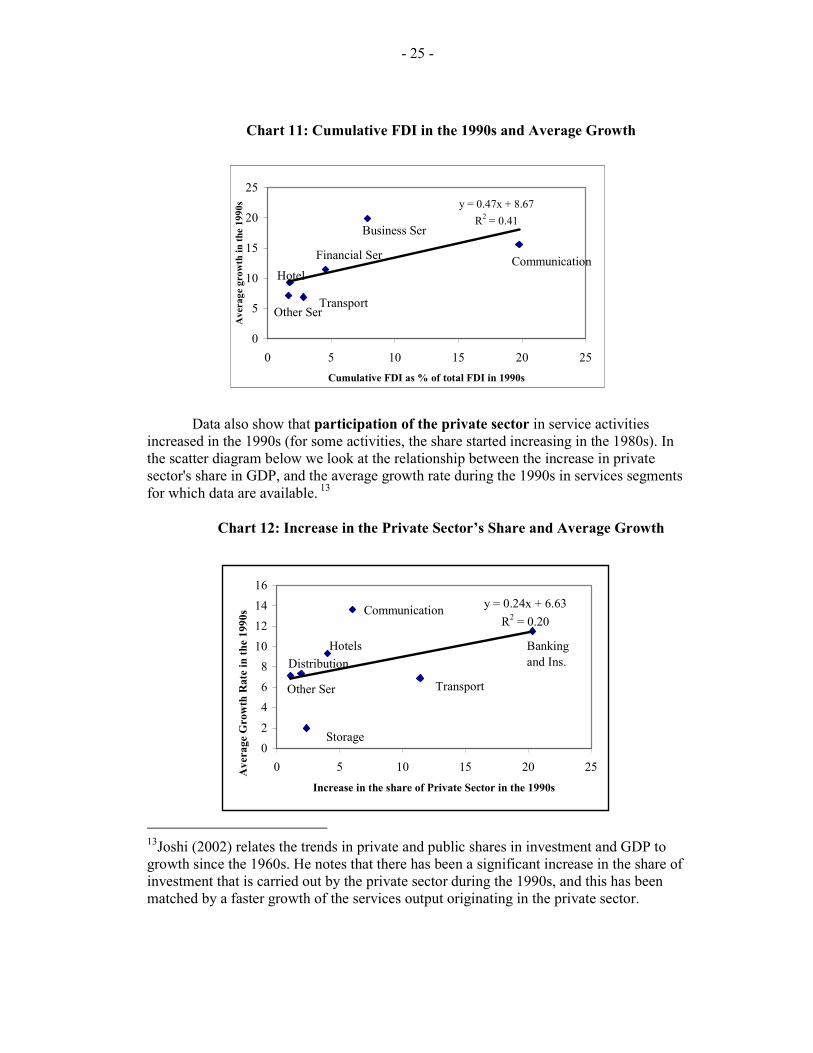
index of liberalization is needed, which is difficult to create using the available information. Nonetheless, preliminary support for the effect of reform related measures on growth is provided by analyzing the correlation between the flow of FDI and the increase in private sector participation in services to growth. The relationship between the cumulative flow of FDI in the 1990s and average growth performance is found to be quite strong (even though this information is available only at a highly aggregated level, and the direction of causation is not clear a priori). The positive and significant association in Chart 11 survives even if we exclude the fastest growing communication segment.
- 25 -
Chart 11: Cumulative FDI in the 1990s and Average Growth
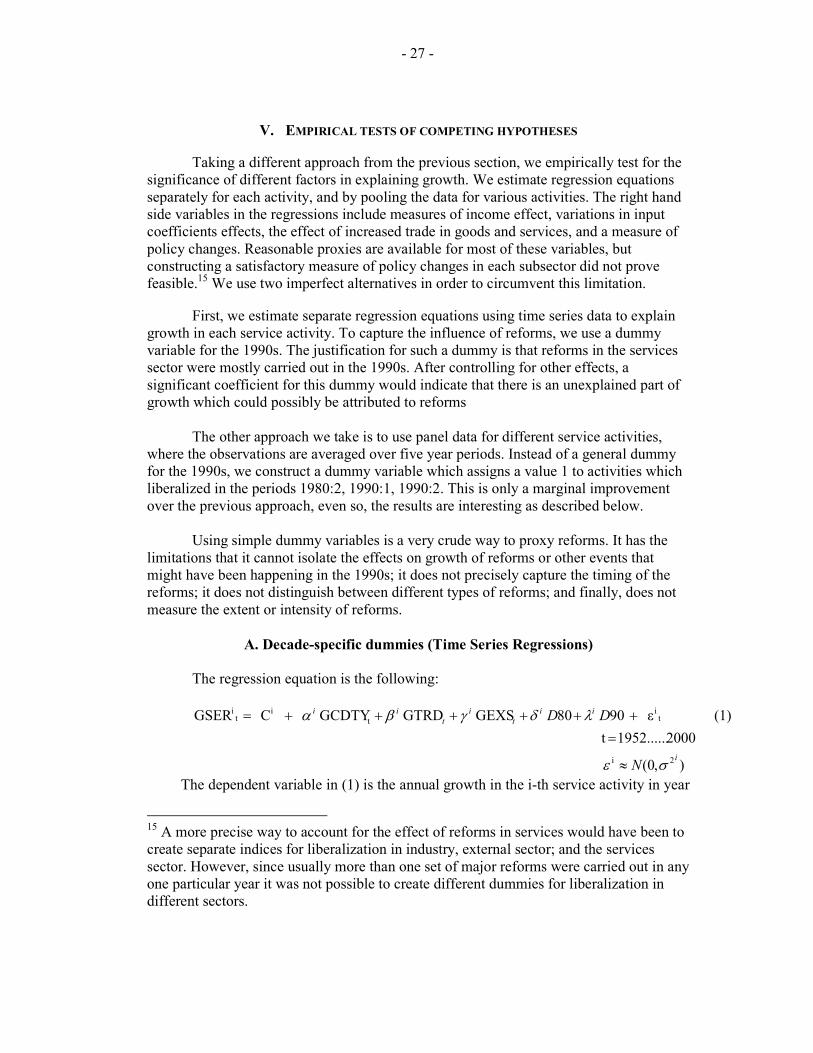
Data also show that participation of the private sector in service activities increased in the 1990s (for some activities, the share started increasing in the 1980s). In the scatter diagram below we look at the relationship between the increase in private sector's share in GDP, and the average growth rate during the 1990s in services segments for which data are available. 13
Chart 12: Increase in the Private Sector’s Share and Average Growth
13Joshi (2002) relates the trends in private and public shares in investment and GDP to growth since the 1960s. He notes that there has been a significant increase in the share of investment that is carried out by the private sector during the 1990s, and this has been matched by a faster growth of the services output originating in the private sector.
y = 0.47x + 8.67R2 = 0.41
0
5
10
15
20
25
0 5 10 15 20 25Cumulative FDI as % of total FDI in 1990s
Ave
rage
gro
wth
in th
e 19
90s
Communication
Business Ser
Transport
Financial Ser
Other Ser
Hotel
y = 0.24x + 6.63R2 = 0.20
02
468
10121416
0 5 10 15 20 25Increase in the share of Private Sector in the 1990s
Ave
rage
Gro
wth
Rat
e in
the
1990
s
Banking and Ins.
Other Ser
Communication
Hotels
Transport
Storage
Distribution

- 26 -
The relationship is likely to be stronger if we include business services, for which the data on private and public shares are not available, but most of which is known to belong to the private sector.
E. Quantifying the Contribution of Different Factors in Services Growth
As the discussion above shows, many different factors played a role in explaining the growth of services in the 1990s. We now make a rough estimate of the relative contribution of each factor in explaining services growth. We first estimate the trend part of the growth rates (which could be attributed to income elasticity and splintering effects). For this we estimate the trend rate at which various service activities as a share of GDP increased up until 1990. We use this estimate to predict the size of the services sector during the 1990s. High income elasticity and splintering effects (unless the elasticities or the input-output coefficients change dramatically) would imply an increase in the share of services in GDP at a predetermined rate, but at one which is not likely to change much over time. We compare the actual share of services in GDP with our predicted share and calculate the difference. This residual (or excess) growth, which is positive for the fast growing sectors, cannot be attributed to elasticity and splintering effects, and reflects other factors such as increased exports, policy reforms and technological progress.14
As illustrated by Chart 13, the residual component of growth in fast growers on
average accounted for 1¾ percentage points of growth of the services sector in the 1990s. The next step is to net out from the residual growth, the growth attributed to increased exports of services in the 1990s. This we estimated at about ½ percentage points. The remaining growth, of about 1¼ percentage points, can thus be attributed to factors such as reforms.
Chart 13: Contribution of Different Factors in Explaining Growth in Services
14 By definition, we find that trend growers do not exhibit any residual growth. The entire growth in these activities can be attributed to elasticity and splintering effects.
0
1
2
3
4
5
Unexplainedgrowth of fast
growers
Trend growth offast growers
Growth of trendgrowers
- 27 -
V. EMPIRICAL TESTS OF COMPETING HYPOTHESES
Taking a different approach from the previous section, we empirically test for the significance of different factors in explaining growth. We estimate regression equations separately for each activity, and by pooling the data for various activities. The right hand side variables in the regressions include measures of income effect, variations in input coefficients effects, the effect of increased trade in goods and services, and a measure of policy changes. Reasonable proxies are available for most of these variables, but constructing a satisfactory measure of policy changes in each subsector did not prove feasible.15 We use two imperfect alternatives in order to circumvent this limitation.
First, we estimate separate regression equations using time series data to explain growth in each service activity. To capture the influence of reforms, we use a dummy variable for the 1990s. The justification for such a dummy is that reforms in the services sector were mostly carried out in the 1990s. After controlling for other effects, a significant coefficient for this dummy would indicate that there is an unexplained part of growth which could possibly be attributed to reforms
The other approach we take is to use panel data for different service activities,
where the observations are averaged over five year periods. Instead of a general dummy for the 1990s, we construct a dummy variable which assigns a value 1 to activities which liberalized in the periods 1980:2, 1990:1, 1990:2. This is only a marginal improvement over the previous approach, even so, the results are interesting as described below.
Using simple dummy variables is a very crude way to proxy reforms. It has the
limitations that it cannot isolate the effects on growth of reforms or other events that might have been happening in the 1990s; it does not precisely capture the timing of the reforms; it does not distinguish between different types of reforms; and finally, does not measure the extent or intensity of reforms.
A. Decade-specific dummies (Time Series Regressions) The regression equation is the following:
),0(
20001952...... t (1) ε 90 80 GEXS GTRD GCDTY C GSER
2i
ti
ti
ti
i
iit
it
ii
N
DD
σε
λδγβα
≈
=++++++=
The dependent variable in (1) is the annual growth in the i-th service activity in year
15 A more precise way to account for the effect of reforms in services would have been to create separate indices for liberalization in industry, external sector; and the services sector. However, since usually more than one set of major reforms were carried out in any one particular year it was not possible to create different dummies for liberalization in different sectors.

- 28 -
t. The right hand side variables include growth rate of the commodity producing sectors (GCDTY), growth rate of the external trade volume of goods (GTRD), and growth of exports in services (GEXS), all in year t. To smooth out the noise in the annual data, all growth rates are measured as 3 year moving averages (see Appendix A for details on construction of these variables).
The first argument in the above equation (growth rate in commodity producing
sectors) is intended to capture the effect of growth in income on final demand, and the effect of growth in other sectors on the demand for service inputs. We include growth in the volume of external trade to see whether increased openness of the economy to external trade has resulted in higher growth for services as well. This link is expected to be important a priori for distribution services, transport, and hotels and restaurants.
Since certain sectors, especially business services, and the hotel industry, are
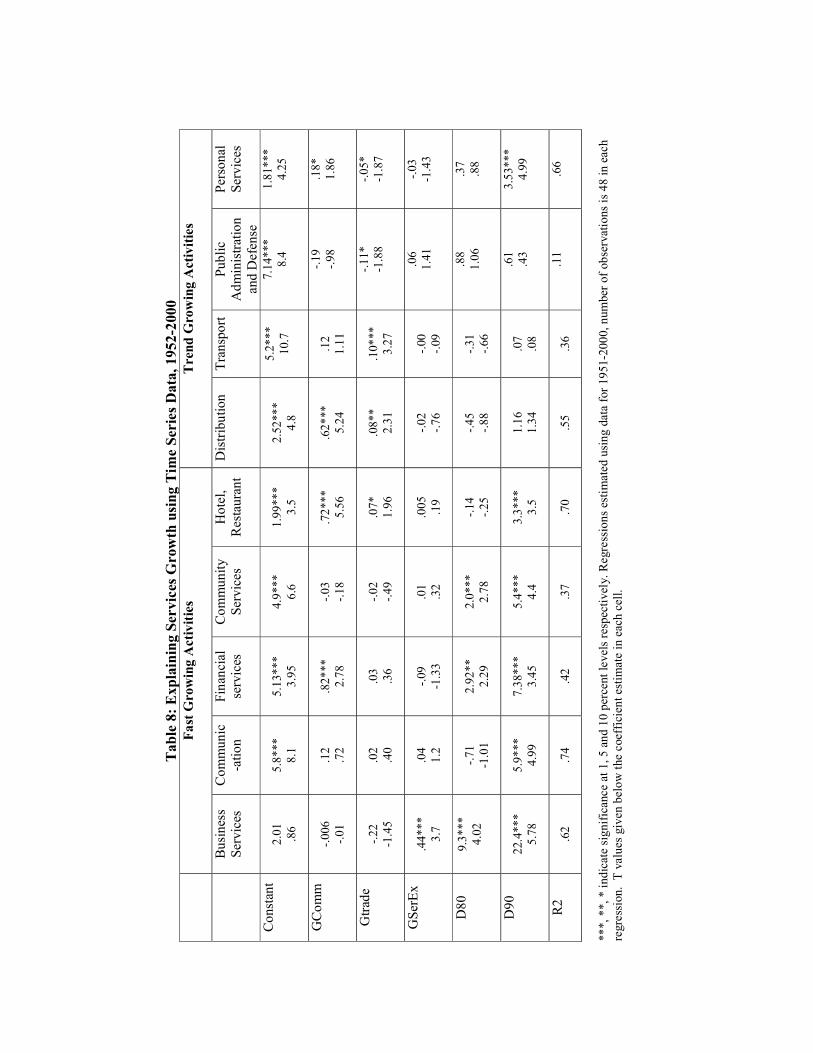
highly dependent on foreign demand, we include service exports in the regressions. In order to account for any residual in growth which cannot be explained by these three variables, we include separate dummies for the 1980s and 1990s. The equations are estimated using Ordinary Least Squares, and the results are reported in Table 12.
Regression results show that for all the fast growing sub-sectors, the dummy for
the 1990s is positive and highly significant. The demand side factors seem relatively less important in explaining growth in these activities, as their coefficients are mostly insignificant. One exception is GEXS, which, unsurprisingly, has a positive and significant coefficient in the equation for business services (IT). By contrast, in the equations for trend growing activities, at least one of the demand side variables has a significant coefficient. Another contrast is that the dummy for the 1990s is not significant in explaining the growth in most of the activities which grew at trend rates in the 1990s.
Results also show that the dummy for the 1980s is significant for business
services, financial services and community services. For financial services this could be because deregulation began in the 1980s. For business services, the IT sector was almost non-existent in the 1980s, so the growth is perhaps due to other activities included in business services. As expected, growth in commodity sector and in the volume of external trade in goods are both important in explaining the growth in distribution services.
We considered two modifications in the regressions above. First, in order to
capture the income effect on the growth of services demand, we include growth rate of GDP, rather than growth of just the commodity producing sectors. Second, we include separate dummies for the first and second half of the 1990s. The rationale for doing this is that some of the major reforms in the services sector were carried out in mid-1990s and may have affected growth more in the second half of the decade than in the first half.
The results for the demand side variable GGDP are stronger, its coefficient is
larger and more significant for most activities, which is not surprising. Even with this variable, the significance of the dummy for the 1990s is retained. As expected, results are also found to be stronger for the dummy for the second half of the 1990s, than for the first half.
Tab
le 8
: Exp
lain
ing
Serv
ices
Gro
wth
usi
ng T
ime
Seri
es D
ata,
195
2-20
00
Fa
st G
row
ing
Act
iviti
es
Tre
nd G
row
ing
Act
iviti
es
Bus
ines
s Se
rvic
es
Com
mun
ic-a
tion
Fi
nanc
ial
serv
ices
C
omm
unity
Se
rvic
es
Hot
el,
Res
taur
ant
Dis
tribu
tion
Tran
spor
tPu
blic
A
dmin
istra
tion
and
Def
ense
Pers
onal
Se
rvic
es
Con
stan
t
2.01
.8
6 5.
8***
8.
1 5.
13**
* 3.
95
4.9*
**
6.6
1.99
***
3.5
2.52
***
4.8
5.2*
**
10.7
7.14
***
8.4
1.81
***
4.25
GC
omm
-.006
-.0
1 .1
2 .7
2 .8
2***
2.
78
-.03
-.18
.72*
**
5.56
.6
2***
5.
24
.12
1.11
-.19
-.98
.18*
1.
86
Gtra
de
-.22
-1.4
5 .0
2 .4
0 .0
3 .3
6 -.0
2 -.4
9 .0
7*
1.96
.0
8**
2.31
.1
0***
3.
27
-.11*
-1
.88
-.05*
-1
.87
GSe
rEx
.44*
**
3.7
.04
1.2
-.09
-1.3
3 .0
1 .3
2 .0
05
.19
-.02
-.76
-.00
-.09
.06
1.41
-.0
3 -1
.43
D80
9.3*
**
4.02
-.71
-1.0
1 2.
92**
2.
29
2.0*
**
2.78
-.1
4 -.2
5 -.4
5 -.8
8 -.3
1 -.6
6
.88
1.06
.3
7 .8
8
D90
22.4
***
5.78
5.
9***
4.
99
7.38
***
3.45
5.
4***
4.
4 3.
3***
3.
5 1.
16
1.34
.0
7 .0
8
.61
.43
3.53
***
4.99
R2
.62
.74
.42
.37
.70
.55
.36
.11
.66
***,
**,
* in
dica
te si
gnifi
canc
e at
1, 5
and
10
perc
ent l
evel
s res
pect
ivel
y. R
egre
ssio
ns e
stim
ated
usi
ng d
ata
for 1
951-
2000
, num
ber o
f obs
erva
tions
is 4
8 in
eac
h re
gres
sion
. T
valu
es g
iven
bel
ow th
e co
effic
ient
est
imat
e in
eac
h ce
ll.

B. Sector-specific liberalization dummies (panel data regressions)
For the panel data specification we estimate the following regression equation controlling for fixed effects (which allows for intercepts to vary over different units).
(1) ε RSer GTS GAgr GInd C GSER itititiit ++++++= δγηβα ititit GTG
The regressions are estimated for a panel of growth rates in the following service activities: trade, hotels, rail transport, transport other means, storage, communication, banking, insurance, dwellings, business services, legal services, community services, and personal services. The time period used is 1970-2000, and the observations are averaged over 1970s, 1981-85, 1986-1990, 1991-1995, and 1996-2000. Thus there are five observations per cross section unit, and total 65 observations are used in the regressions.
The dependent variable is average growth in service activity i in period t. The
right hand side variables are average growth in industry (Gind), average growth in agriculture (GAgr), average growth in external volume of trade in goods (GTG), average growth in the export of services (GTS), in period t. A dummy variable (RSer) accounts for the fact whether reforms were carried out in each segment of services (see Appendix A for data sources and construction of variables).
Table 9. Explaining Services Growth using Panel Data, 1970-2000
I II
GAgr .99 1.1
.07
.20 GInd 1.33**
2.12 .82* 1.88
GTG .45 1.1
GTS .15* 1.7
.13 1.5
DSer 5.7*** 3.6
5.7*** 3.6
D90s -1.1 -1.0
R2, adj. R2 .65, .53 .65, .53
F test for equality of intercept across units
2.8 (F-Stat) .00 (p value)
2.8 (F-Stat) .00 (p value)
Number of observations is 65 in each regression. ***, **, * indicate significance at 1, 5 and 10 percent levels respectively. T values given below the coefficient estimate in each cell
The variable which is found to be the most significant is the dummy variable for
reform measures in each activity. Thus, the sectors which were opened up for FDI,

- 31 -
external trade, or private ownership etc. were the ones which experienced faster growth. Among other variables, we find services growth to be significantly correlated with the growth in the industrial sector.
As a robustness test, we check whether the dummy for the 1990s (D90s) yields a
significant coefficient after controlling for the reform-specific dummy. Results in column II of Table 13 show that the coefficient for D90s is no longer significant. Thus, it can probably be argued that the acceleration of the 1990s is due to reforms and that this variable is able to explain econometrically the higher growth of the 1990s.
VI. SUMMARY AND CONCLUSION
This paper studies the growth of the services sector in India. It shows that in
common with the experience of many other countries, the service sector in India has grown faster than agriculture and industry. As a result, the share of services in GDP has increased over time. In the 1990s, services growth was particularly strong, and this has led to the services share in output being relatively large compared to other countries at similar levels of development.
What is also striking about India’s growth experience is that the services sector
does not appear to have created many jobs. Admittedly the employment data suffer from limitations. Nonetheless, unlike the experience of many countries where productivity growth in the service economy has tended to lag behind that of other sectors, it appears that the Indian service sector has high labor productivity.
The acceleration in growth of the service sector in India in the 1990s was due to
fast growth in the communication, financial services, business services (IT)and community services (education and health). The remaining sectors grew at a constant or trend growth rate. The paper shows that factors such as high income elasticity of demand and increased input usage of services by other sectors have played an important part in elevating services growth. However, other factors such as economic reforms and the growth of services exports also played an important role in accelerating services growth in the 1990s. Significant productivity gains appear to have occurred in the faster growing sectors, leading to a decline in their relative prices.
The findings of the paper suggest that there is considerable scope for further rapid
growth in the Indian service economy. That Indian service exports have strong future growth prospects is well known, but the paper also finds that there is considerable scope for further rapid growth in the Indian service economy provided that deregulation of the services sector continues. However, the relatively jobless nature of growth in the Indian services sector underscores the importance of industry and agriculture also growing rapidly.
- 32 -
References Acharya, Shankar, 2002a, India's Medium-Term Growth Prospects, EPW, July 13, 2897-2906. ______________, 2002b, Macroeconomic Management in the 1990s, EPW, 37 (16), April 20, 1515-1538. Bhagwati, Jagdish, 1984, Splintering and Disembodiment of Services and Developing Nations, World Economy,7:2, 133-43 Bhattacharya, B.B. and Arup Mitra, 1990, Excess Growth of Tertiary Sector in Indian Economy, Issues and Implications, EPW, November 3, 2445-2450. Chenery, Hollis, B. 1960, Patterns of industrial Growth, American Economic Review, Vol. 57, pp 415-26. Chenery, Hollis and L.J. Taylor, 1968, Development Patterns: Among Countries and Over Time, Review of Economics and Statistics, 50, 391-416 Echevarria, Cristina, 1997, Changing Sectoral composition associated with economic growth, International Economic Review, vol 38, pp 431-52. Francois, Joseph, F. and Kenneth A. Reinhart, 1996, The Role of Services in the Structure of Production and Trade: Some Stylized Facts from a Cross-Country Analysis. Asia-Pacific Economic Review, Vol. (2)1: May. Joshi, Dharmakirti, 2002, The Public Private Balance: A Macro View, Discussion Paper Series, Crisil Center for Economic Research. Hansda, Sanjay Kumar, 2002a, Services Sector in the Indian Economy: A Status Report, RBI Staff Studies, Department of Economic Analysis and Policy, RBI. ___________ 2002b, Sustainability of Services and Services-Led Growth: An Input Output Exploration of the Indian Economy, RBI Papers Kongsamut, Piyabha, Sergio Rebelo and Danyang Xie, 2001, Beyond Balanced Growth, IMF Working Paper, WP/01/85. Kravis, Irving, B. 1985, Services in World Transactions, in Inman, Robert. P. (ed.), Managing the Service Economy: Prospects and Problems, Cambridge University Press, Cambridge. Inman, Robert. P., 1985, Introduction and Overview, in Managing the Service Economy: Prospects and Problems, Cambridge University Press, Cambridge.
- 33 -
International Monetary Fund, 1999, World Economic Outlook, IMF, Washington D.C. Mattoo, Aaditya, Deepak Mishra and Anirudh Shinghal, 2003, Trade in Services: Access to Foreign Markets, Domestic Reform and International Negotiations, mimeo, World Bank. Reserve Bank of India, 2002, Report on Currency and Finance, RBI, Mumbai. Salgado, Ranil (2003), India’s Global Integration and The Role of the IT Sector, India: Selected Issues, IMF. Sastry, D.V.S, Balwant Singh, Kaushik Bhattacharya and N.K. Unnikrishnan, Sectoral Linkages and Growth Prospects: Some reflections on the Indian Economy. Srinivasan, T.N., 2002, China and India: Growth and Poverty, 1980-2000., mimeo, Yale University. Virmani, Arvind, 2002, Bhartiya Rate of Growth: The role of services, Planning Commission.

- 34 -
Appendix A Sources of Data and Construction of Variables
Variable Name Construction of Variable16 Source
Variables used in regression equation 1
Growi Average growth rate of output in activity i during the 1990s.
Own calculations using CSO data
GCDTY 3 year moving average of growth rates in the commodity producing sectors
Own calculations using CSO data
Gtrade 3 year moving average of growth of the volume of external trade (exports + imports) of goods.
Own calculations using data from RBI Bulletins
GSerEx 3 year moving average of growth of services exports.
Own calculations using data from RBI Bulletins
D80 Dummy variable which takes the value one for the years 1981-1990, and 0 otherwise.
D 90
Dummy variable which takes the value one for the years 1991-2000, and 0 otherwise.
Variables used in regression equation 2
Growit Average growth rate of activity I in period t Own calculations using CSO data
GInd Average growth rate of industrial sector in period t Own calculations using CSO data
GAgr Average growth rate of agriculture in period t Own calculations using CSO data
GTmerc Average growth of external trade (exports + imports) of merchandise in period t
Own calculations using data from RBI Bulletins
GTSer Average growth of exports of services in period t Own calculations using data from RBI Bulletins
DSer
Dummy variable which takes a value one if a particular services activity was liberalized significantly in period t, 0 otherwise. The following observations were assigned a value of 1: hotels 90:1, 90:2, transport other means 90:2, Communication 90:1, 90:2, banking 80:2, 90:1, 90:2, insurance 90:2, business services 90:1, 90:2, community services 90:2. All other observations were accorded a value 0.
Created using information from many different sources
16 All growth rates are calculated using data in constant prices, external trade data are in US$.