Non-aqueous foams: Current understanding on the formation ...

PHYSICAL REVIEW B 85, 125416 (2012)
Understanding image contrast formation in TiO2 with force spectroscopy
Ayhan Yurtsever,1 Delia Fernandez-Torre,2 Cesar Gonzalez,3 Pavel Jelınek,4 Pablo Pou,2 Yoshiaki Sugimoto,1
Masayuki Abe,1 Ruben Perez,2,* and Seizo Morita1
1Graduate School of Engineering, Osaka University, 2-1 Yamada-Oka, 565-0871 Suita, Osaka, Japan2Departamento de Fısica Teorica de la Materia Condensada, Universidad Autonoma de Madrid, E-28049 Madrid, Spain
3Instituto de Ciencia de Materiales de Madrid (ICMM-CSIC), E-28049 Madrid, Spain4Institute of Physics, Academy of Sciences, Cukrovarnicka 10, 162 00, Prague, Czech Republic
(Received 18 September 2011; revised manuscript received 14 February 2012; published 13 March 2012)
Site-specific force measurements on a rutile TiO2(110) surface are combined with first-principles calculationsin order to clarify the origin of the force contrast and to characterize the tip structures responsible for the twomost common imaging modes. Our force data, collected over a broad range of distances, are only consistentwith a tip apex contaminated with clusters of surface material. A flexible model tip terminated with an oxygenexplains the protrusion mode. For the hole mode we rule out previously proposed Ti-terminated tips, pointinginstead to a chemically inert, OH-terminated apex. These two tips, just differing in the terminal H, provide anatural explanation for the frequent contrast changes found in the experiments. As tip-sample contact is difficultto avoid while imaging oxide surfaces, we expect our tip models to be relevant to interpret scanning probe studiesof defects and adsorbates on TiO2 and other technologically relevant metal oxides.
DOI: 10.1103/PhysRevB.85.125416 PACS number(s): 68.37.Ps, 07.05.Tp, 68.47.Gh
I. INTRODUCTION
Titanium dioxide (TiO2) is used in a broad range ofapplications, for example, light harvesting, catalysis, surfacecoating, gas sensing, and medical implants. An atomic-scaleunderstanding of its surface properties and chemistry isessential to optimize most of these processes.1–3 The moststable facet of TiO2, rutile TiO2(110), has become the modeloxide surface for these studies. Its structure is characterizedby alternating rows of fivefold coordinated Ti atoms (Ti5c) andbridging oxygens (Ob)—protruding ∼1 A from the surfaceplane—that run along the [001] direction [see Fig. 2(a) (inset)].Scanning tunneling microscopy (STM) images usually showperfect bright rows, identified with Ti5c,4 and bright, localizedfeatures in between that have been associated with two defectspecies [oxygen vacancies and hydroxyl (OH) groups] locatedon the Ob rows.5,6 At variance with STM, atomic forcemicroscopy with true atomic resolution [known as noncontact(nc)-AFM7] has revealed a number of qualitatively differentcontrast modes.8–12 Most images show either a contrast similarto STM with Ti5c rows and defects imaged bright and Ob rowsimaged dark (protrusion mode), or its complete reversal (Ob
bright and Ti5c rows and defects appearing dark), called holemode. In a third but rather rare mode called neutral, OH groupsand the Ob atoms are imaged bright while Ob vacancies andTi5c rows appear dark. Other noncommon image contrastsinclude the “all-inclusive mode” where both Ob and Ti5c aresimultaneously resolved as bright features11 and the “hiddenmode” which does not exhibit OH groups.12
This contrast variability in nc-AFM represents both anopportunity and a challenge. It reflects the extreme dependenceof the tip-sample forces on the structure and composition of thetip apex. But, at the same time, it opens the possibility, througha combination of experiments and theoretical modeling, tocharacterize the tip and to make a direct identification ofdefects and adsorbates on technologically relevant oxidesurfaces. Calculations with model tips, like an MgO cube,13
provide a basic understanding of the contrast in the protrusionand hole modes in TiO2 in terms of electrostatic interactionscontrolled just by the tip apex polarity, as also proposed forother ionic surfaces.14 The neutral case has been explained asdue to the onset of covalent bonding with a nonpolar modelSi tip.10 However, a deeper, quantitative understanding ofthe contrast and the link with the tip structure requires usto go beyond just nc-AFM imaging. Combining the AFMtopography and the simultaneously recorded average STMcurrents with atomistic simulations, several models basedon O- and Ti-terminated clusters attached to a Si tip anddifferent Si apexes have been proposed to explain the fivedifferent combinations of AFM/STM contrasts found in theexperiments.15 Force spectroscopy (FS) experiments, in whichtip-sample forces are determined as a function of distance forspecific surface sites16 or over a two-dimensional (2D) area(3D mapping),17 impose an even stronger constrain on the tipstructure and the nature of the interactions. FS has been usedto discriminate between the two ionic sublattices on severalinsulator surfaces,18–22 to achieve single-atom chemical iden-tification on semiconductors,23 and to understand the nc-AFMcontrast on carbon nanostructures.24,25
In this work we combine site-specific force measurementsand extensive first-principles calculations on TiO2(110)-1 × 1,aiming to clarify the origin of the observed nc-AFM contrastand to characterize the tip structures responsible for theprotrusion and hole imaging modes. While many tip modelscould be compatible with forces and contrast on typicalimaging distances, our data close to the force minima is onlyconsistent with a tip apex contaminated with clusters of surfacematerial. A flexible model tip terminated with an oxygenexplains the data obtained for the protrusion mode. For the holemode, FS data rule out previously proposed Ti-terminated tips,pointing instead to a chemically inert, OH-terminated TiO2
apex. These two tips, that just differ in the terminal H, providea natural explanation for the frequent contrast changes foundin the experiments.
125416-11098-0121/2012/85(12)/125416(9) ©2012 American Physical Society

AYHAN YURTSEVER et al. PHYSICAL REVIEW B 85, 125416 (2012)
The rest of the paper is organized as follows. In Sec. IIwe describe the experimental and theoretical methodology.Section III provides a discussion of our results for theprotrusion and hole imaging modes, including a detailedaccount on the reproducibility of the experimental force curvesand the tip models that are consistent with those results. Wesummarize our findings and main conclusions in Sec. IV.Finally, in two Appendices we discuss the determination ofthe van der Waals forces between tip and surface and theirtheoretical treatment.
II. METHODS
A. Experimental details
The experiments were carried out with a home-builtultrahigh-vacuum nc-AFM26 operated at a temperature of 80 Kwith a base pressure better than 5 × 10⁻¹¹ Torr. The nc-AFMinstrument was operated under the frequency modulationdetection method.27 The cantilever deflection was measuredusing a home-made optical interferometer. The images wereacquired under the constant oscillation amplitude mode usingcommercial silicon cantilevers (provided by Nanosensors).Before use, the tips were cleaned using Ar-ion sputtering toremove the native oxide layer and other contaminants. In orderto minimize the long-range electrostatic force during bothtopographic and spectroscopic measurements, the averagecontact potential difference was compensated by applying asample bias in the range 0.5–2.5 V, with the tip being heldat ground potential. In addition to the capability of the lowtemperature system for keeping the thermal drift effect at aminimal level, for the force spectroscopic measurements, atomtracking and feed-forward software28 were used to preciselyposition the tip on top of target atoms.
A clean rutile TiO2(110) crystal (provided by Shinko-sha)used in our experiments was prepared using repeated cycles ofAr+ ion bombardment (2 keV, 3 × 10⁻⁶ Torr) for about 5 minat room temperature (RT) and annealing to approximately∼1000 K for 1 min to restore a flat substrate. During thefinal annealing of the surface, the pressure was kept below5 × 10−10 Torr. After 1 h of cooling to room temperature,the sample was transferred into an observation chamber thathouses the AFM unit at low temperature. The OH groups onthe TiO2(110) surface were spontaneously created from thedissociation of water molecules (from background residualgas) over the oxygen vacancy sites by transferring an H atom toneighboring Ob sites.5 By keeping the freshly prepared samplein UHV more than 4 h, all of the O vacancies are occupiedby OHs. Thus, in our measurements, only the OH groups areconsidered as surface impurity defects.
Site specific force spectroscopy measurements were per-formed by recording the frequency shift (�f ) of the firstmechanical resonance frequency (f0) of the cantilever as afunction of the tip-sample distance. In total, five approach-retraction frequency shift vs distance measurements havebeen conducted, and the total frequency shift is the averageof these measurements. The frequency shift (�f ) curveshave been shifted at the regulation set points for takinginto account topographic corrections.29 After smoothing overten data points, the averaged �f curves are converted to
total force by using the inversion formula derived by Saderet al.30 The short-range forces were calculated by subtractingthe long-range forces from the total forces. The long-rangebackground forces were obtained by fitting the total forces inthe tip-sample distance range from 6 to 25 A to an analyticfunction given as AHR/6(z − z0)2. In Appendix A we showan example of this procedure to extract the short-range forcesfrom the experimental �f curves.
B. Theoretical modeling
All calculations were done with VASP 4.6,31 using theprojector-augmented-wave method, a plane-wave cutoff of400 eV, and the Perdew-Burke-Ernzernhof (PBE)32 functional.We also re-calculated the forces for some of the modelsusing LDA, obtaining the same general trend but overall moreattractive interactions.
To represent the TiO2(110) surface pure and with a hydroxyldefect we constructed supercells of two different sizes, 4 × 3and 4 × 2 (11.9 × 19.8 A and 11.9 × 13.2 A), which we useddepending on the lateral size of the tip model under study. Thesampling in k space was done using the � point and larger2 × 2 Monkhorst-Pack meshes. The slab was two trilayersthick, and the lowermost trilayer was kept fixed to the bulkpositions. Although a thicker slab is needed for convergingmany surface properties of TiO2(110),1 the geometry of theuppermost trilayer is well described within the present model,and we thus expect it to produce converged values for thetip-surface interaction forces. For each tip model under study,the lattice parameter perpendicular to the surface was differentdepending on both the tip size and the largest tip-surfacedistance, but we made sure that the vacuum left was atleast 7 A.
An important ingredient in our modeling is that weapproach the tip to the surface in a quasistatic way, in smallsteps of 0.25 A, and for each step we relax the atoms at thebottom of the tip and at the top of the surface until the forcesare smaller than 0.04 eV/A. As we will demonstrate in thenext section, the relaxations of the tip are crucial to evaluatethe forces at short tip-sample distances.
As an exchange of material between tip and surface is likelyto happen in the experiments, we have built our tip models fol-lowing two different directions (see Fig. 1): (1) silicon-basedtips,33 with their apices contaminated with surface (Ti,O) orH atoms, as proposed in previous works;11 and (2) small TiO2
clusters, based on a (TiO2)5 isomer proposed by Lundqvistet al.34 (in the reference, the model in Fig. 1 C). We rotated theisomer to expose different terminations characteristic of TiO2
cluster structures: a doubly or a singly coordinated O atom[Figs. 1(c) and 1(d)], and a Ti atom [Fig. 1(h)]. Besides, wealso considered the possibility of H contamination for the twoO-terminated models [Figs. 1(k) and 1(l)].
III. RESULTS AND DISCUSSION
A. Protrusion mode forces
A typical nc-AFM image in the protrusion mode obtainedduring our set of experiments, with the sites over which werecorded the FS curves marked with crosses, is displayed inFig. 2(a). The dissipation signal (not shown) was recorded
125416-2

UNDERSTANDING IMAGE CONTRAST FORMATION IN TiO . . . PHYSICAL REVIEW B 85, 125416 (2012)
FIG. 1. (Color online) Most relevant tip models tested in thiswork. (a)–(d) Oxygen-terminated, (e)–(h) Titanium-terminated, and(i)–(l) Hydrogen-terminated. The color code for the ball-and-stickstructures is the following: white corresponds to H, red to O, grey toTi, and cream to Si. The Si-based tips have their apex contaminatedwith O [(a), (b)], Ti [(e)], Ti and O [(f), (g)], H [(i)], and an OH group[(f)]. Tips (c), (d), (h), (k) and (l) correspond to a (TiO2)5 isomer34
rotated to expose different terminations [(c), (d), (h)] and includingpossible H contamination [(k), (l)].
simultaneously with the forces, and it was site independentand negligible for all distances. Surprisingly, the experimentalshort-range forces turn out to be attractive for the three sites,with large maximum values over Ti5c and Ob (about 1.6 and1.2 nN, respectively). Moreover, these maximum forces arereached after a decay that is too steep to be caused by pureelectrostatic interactions, as it has been assumed in previousnc-AFM works. Interestingly, the curves over Ti5c and Ob ford < 2 A are remarkably parallel to each other.
The reproducibility of the protrusion mode forces was verygood in all our experiments performed with different tips
and cantilevers. An example of forces measured on the samearea displayed in Fig. 2(a) and with identical tip conditions(including tip termination) but over different Ob and Ti5c sitesis shown in Fig. 3(a). Force curves obtained with another tipon a different surface area are displayed in Fig. 3(b). In bothcases, the results are very similar to those in Fig. 2(a). Resultsof this kind have been repeatedly observed during independentexperimental runs, so we can conclude that protrusion modeforces are indeed reproducible and do not show a significanttip dependence.
To explain these results, we have calculated force curves onthe relevant surface sites for several tip models. Based eitheron the contrast they produce at typical imaging distances11 orthe values at the force minima, our calculations rule out thecontaminated Si tips. Among the TiO2 tip models, the structurewhich best reproduces the measured forces is a cluster rotatedto expose a singly coordinated oxygen atom at the apex [seemodel in Fig. 1(d)]. Figure 2(b) shows that the agreementbetween the measured and calculated forces is very good apartfrom the repulsive stretch at the Ob site for distances between1.75 and 3.5 A found in the simulations. Furthermore, thistip does not present hysteresis in an approach-retraction cycle(not shown), in line with the experiments.
One of the most striking features in Fig. 2(b), for anominally “negative tip,” like the one we are considering, is thelarge attractive force found when approaching the Ob atoms.The way in which the tip relaxes over this site is the key toexplain the measured forces. At long tip-sample distances, thetip undergoes little relaxation, but, upon approaching, the Oatom at the tip apex and the surface Ob start to repel each other,and the tip oxygen starts moving away. At short distances, therelaxation is already completed [see models of Fig. 2(b)], anda Ti atom is now at the tip apex. This Ti atom interacts andforms a bond with the surface Ob (confirmed by a charge pileupbetween these atoms), explaining the large force minimumand the fast decay of the experimental forces. This interaction
FIG. 2. (Color online) (a) Experimental short-range forces on TiO2(110) for the protrusion mode image contrast shown in the inset. Thestudied sites are: bridging oxygens (Ob, red dots), fivefold-coordinated Ti atoms (Ti5c, blue squares), and hydroxyl defects (OH, black triangles).Another inset illustrates the surface structure: O (Ti) atoms are displayed as red (gray) balls, H atoms as white. (b) Calculated short-rangeforces over the same sites considered in (a). Insets: ball-and-stick models of the tip and surface structure over the Ob site at d = 0.75 A andd = 6 A (d is measured with respect to the Ob atoms). The d axis of the experimental force curves has been shifted to adjust the position ofthe attractive force maximum of the OH site to the theoretical one (d ∼ 3 A).
125416-3

AYHAN YURTSEVER et al. PHYSICAL REVIEW B 85, 125416 (2012)
FIG. 3. (Color online) Reproducibility of the force curves obtained during the experiments with tip terminations producing protrusion modecontrast images. The color code and notation are the same as in Fig. 2. Each d axis has been shifted to place the OH minimum at d ∼ 3 A.(a) Forces measured on the same area displayed in Fig. 2(a) and with identical tip conditions (including tip termination) but over differentOb and Ti5c sites. (b) Force curves obtained with another tip on a different surface area. These results prove that protrusion mode forces arereproducible and do not show a significant tip dependence.
mechanism is further confirmed by the similarity in both theexperimental and calculated force minima for the Ti5c and Ob
sites. At variance, around the minimum at the OH site, wehave a weaker interaction that is dominated by the hydrogenbond between the surface hydroxyl and the oxygen in thetip apex and includes also electrostatic contributions. It couldbe assumed that a large van der Waals (vdW) backgroundwould be necessary to provide a net attractive interaction fora “negative” tip approaching the Ob sites. The relaxation ofthe TiO2 tip to expose a Ti atom at the apex close to the forceminimum shows that this is not the case. In fact, the vdWforces measured in the experiment are significantly smallerthan the short-range forces (see Appendix A), giving furthersupport to our proposed tip model. The flexibility of the tipcontrols the energetics of such relaxation at the apex. Due to thecomputational cost, we have modeled it with a small (TiO2)5
cluster where only the last five atoms were allowed to relax [see
Fig. 2(b)]. Thus we assign the repulsive stretch in the Ob forcecurve to our very limited description of the elastic properties ofthe tip as a whole. This characteristic relaxation is not privateto the singly coordinated oxygen atom at the apex. We havefound the same structural changes and very similar force curvesfor the same cluster rotated to expose a doubly coordinatedoxygen [see Fig. 1(c)], but the repulsive force overshoot waslarger. Given our limited tip size, we cannot rule out completelyany of these two energetically favorable terminations. Moreimportantly, the common behavior confirms that oxide-basedtip models are really necessary to explain our FS data.
B. Hole mode forces
We now move to the analysis of the hole mode in TiO2(110).Figure 4(a) shows the short-range forces measured above thethree lattice sites (Ob, Ti, and OH) marked with crosses in the
FIG. 4. (Color online) (a) Experimental and (b) calculated short-range forces for the hole imaging mode (definitions as in Fig. 2). The tipand surface relaxed structures over the OH site in (b) correspond to d = 1.5 A and d = 6 A.
125416-4

UNDERSTANDING IMAGE CONTRAST FORMATION IN TiO . . . PHYSICAL REVIEW B 85, 125416 (2012)
FIG. 5. (Color online) Calculated force vs distance curves for aTiO2 based, Ti-terminated tip model. The color code and the structurerepresentation of the insets are analogous to those in Fig. 2. The arrowsindicate the force points which correspond to each structure in theinset.
inset image. Once again the dissipation signal is negligible forall sites. At large to medium tip-sample distances, the smallestforces are measured over the OH site, and the strongest over theOb, which consequently appear, respectively, as dark spots andbright stripes in the nc-AFM image. At shorter distances, all theforce curves reach almost the same attractive force maximumof about 0.5 nN. It is interesting to notice the similarity betweenthe FS curves under discussion and the experimental forces inthe protrusion mode over the OH site discussed previously.
We started our search over tip model candidates basedon Si tips and TiO2 clusters terminated with Ti similar tothose proposed previously to explain simultaneously recordednc-AFM and STM images.15 All of them consistently producedforce minima several times larger than those in the experiment.These minima were always accompanied by large structuralrelaxations in which the Ti atom protrudes to bind covalentlyto the nearest surface oxygen atoms available. To illustrate this
point with an example, we show in Fig. 5 the calculated forcesover the three surface sites when the tip is modeled with aTi-terminated cluster [see Fig. 1(h)]. The scale for the forcesin this figure is much larger than that used in Fig. 4, and weobserve large repulsion stretches over OH and Ti5c. Althoughat long distances the ordering of the curves is consistent witha hole mode contrast, the forces and the force differencesamong sites are qualitatively different than those observed inthe experiments. The same qualitative disagreement betweentheory and experiment was also found for different Ti-terminated tip candidates such as those illustrated in Fig. 1. Asneither the magnitude of the forces nor the force differencesbetween sites were comparable to those in the experiment, weruled out the titanium terminated tip models.
We next considered tips terminated with an OH group,assuming that the hydrogen can be easily picked up fromthe surface or produced as a result of collisions with watermolecules from the background residual gas. These tipsproduce minima of the force much closer to experimentalvalues. The model with the best overall agreement, a singlycoordinated O termination with an H atom attached, isdisplayed in Fig. 4(b). The calculated force curves [Fig. 4(b)]over the different sites are parallel to each other, as observedin the experiment. Over the Ob and OH sites, this is probablycaused by the formation of similar hydrogen bonds, whichcontrol the tip-surface interaction. The two insets in Fig. 4(b)show the tip and sample structure when imaging the OH site forfar and close distances. Notice the bending movement of thetip H induced by the tip-sample interactions. This same effecthas been observed previously in a Si-based, OH-terminated tipmodel used to explain the neutral nc-AFM contrast in TiO2.11
For the Ti site, the bending of the H atom allows a strongerO-Ti interaction at close distances, but the OH distance issmall and the electrostatic screening quite effective, reducingthe maximum force.
We have found very similar results for a tip formed attachingan H atom to a doubly coordinated O termination. These
FIG. 6. (Color online) Representative sample of experimental force curves obtained for images showing hole mode contrast. (a) Forcesmeasured on the same area displayed in Fig. 4(a) but with a different tip. (b) Forces recorded on a different experimental run performed with adifferent cantilever and tip. This latter case illustrates that force curves in the hole, although qualitatively similar in all cases, show a variabilityin the strength and relatively position of the force maxima. The color code and notation are the same as in Fig. 2. Each d axis has been shiftedto put the Ob minimum at d ∼ 2.25 A.
125416-5

AYHAN YURTSEVER et al. PHYSICAL REVIEW B 85, 125416 (2012)
calculations show that, although the force strength is consistentwith the formation of an H bond, electrostatic interactionswhich are very dependent on the particular orientation of thetip (e.g., if the two Ti atoms above the OH are aligned with theOb rows) can increase the force minimum by up to 80% whenapproaching the Ob sites compared to the OH defects (see nextsection). We think that this combination of H bonding andelectrostatic interactions can explain the contrast variabilityfound for “positive” tips both in our results and in previousexperiments.10
1. Variability in the experimental forces
While in the protrusion mode all measured force sets werealmost identical, in the hole mode there is a small variationin the position and absolute value of the force minima ofthe curves on the three probed sites (OH, Ob, and Ti5c)for certain measurements. As we already anticipated in theprevious section and discussed in more detail below, thistip dependence can be understood in terms of additionalelectrostatic interactions, that can be either repulsive orattractive depending on the tip structure, that sum up to themain contribution, the formation of the H bond, and modulatethe force strength on the different sites.
The first set of results is shown in Fig. 6(a), and correspondsto a tip different from the one used for the measurements inFig. 4(a), but sampling the same surface area. The similaritybetween these data and those in Fig. 4(a) is evident. Thesecond set belongs to a different experimental run performedwith another cantilever and another tip. In this case, therecorded force curves, although qualitatively similar, showsome differences in the strength of the forces. In particular, theforce minimum over the OH site occurs at about 0.35 nN,while for the other sets its value was close to 0.5 nN.We have observed similar changes in the relative value of
the force minima measured on the three probed sites inseveral independent experimental runs. The largest differencecorresponds to a set where the Ob force minimum was closeto 0.8 nN, instead of the 0.5–0.6 nN found in most of themeasurements.
2. Calculations with different OH-terminated tips
The forces calculated with different OH-terminated tipsclearly show the basic features of the force spectroscopymeasurements. Moreover, they also reproduce the variabilityfound in the experiments. Figure 7 illustrates this point withthe forces calculated for three additional tip models. Thefirst one is the same tip discussed in Fig. 4(b) but orientedparallel to the surface normal [see inset in Fig. 7(a)]. Thecorresponding forces (filled symbols) are almost identical tothe ones presented for the OH and Ob sites in Fig. 4, while theyvary a little for the Ti5c site, where the minimum of the forceis about 0.2 nN deeper—the force curve for the tip discussedin Fig. 4 over the Ti5c site (empty symbols) is included forcomparison.
The two other cases discussed here correspond to a differentOH-terminated TiO2 cluster with two different orientationswith respect to the substrate. Three of the force curves inFig. 7(b) (filled symbols) are calculated with a cluster wherethe triangle spanned by the O atom in the OH group and thetwo neighboring Ti atoms above is parallel to the Ob rows. Thefourth curve (empty symbols) corresponds to the calculationover the Ob site with the same cluster rotated 90◦ around thesurface normal, so the Ti-O-Ti triangle is perpendicular to theOb rows. Comparing the first case with the results presentedin Fig. 4, we observe once more some relative changes inthe force minima, but now the Ob site is the most affected,with a force minima 80% deeper. The rotated model, however,
FIG. 7. (Color online) Calculated force vs distance curves for three TiO2 based, OH-terminated tip models. The color code and the structurerepresentation of the insets are analogous to those in Fig. 2. The arrows join the structures of the insets with their corresponding force values.(a) Filled symbols: Forces over the three surface sites for the tip oriented perpendicularly to the surface. Empty symbols: Force over the Ti5c
site for the rotated cluster considered in Fig. 4. (b) Filled symbols: forces over the three surface sites for the tip model shown in the insets atthe top left and the bottom right part of the panel, where the triangle spanned by the O atom in the OH group and the two neighboring Ti atomsabove is parallel to the Ob rows. Empty symbols: Force curve calculated over the Ob site with the same cluster rotated 90◦ around the surfacenormal, so the Ti-O-Ti triangle is perpendicular to the Ob rows (structure shown in the inset in the bottom left part of the figure).
125416-6

UNDERSTANDING IMAGE CONTRAST FORMATION IN TiO . . . PHYSICAL REVIEW B 85, 125416 (2012)
brings the force minima over the Ob site back to the value of∼−0.4 nN found in Figs. 7(a) and 4.
As the structures in the insets of Fig. 7 show, the mainmechanism responsible for the tip-sample interaction is stillthe formation of the hydrogen bond at short distances discussedbefore, but now we can assign the small modulation in theforces found both in the experiments and the calculationsto additional electrostatic interactions that are controlled bythe different detailed arrangement of the atoms surroundingthe OH at the tip apex. The two tip models presented inFig. 7(b), differing just in a rotation around the surfacenormal, clearly illustrate this point. The forces indicated withfilled symbols correspond to the cluster where the two Tiatoms near the apex are aligned along the Ob row. Thisconfiguration of the Ti atoms provides some extra electrostaticattraction that makes the Ob force minimum deeper than inthe rest of the cases. Upon a 90◦ rotation, the Ti atoms aremoved further away from the surface Ob sites, and thus theminimum over Ob goes back to its usual observed value (about−0.4 nN).
Electrostatic interactions are also responsible for the largerattractive force over the Ti5c found in Fig. 7(a) for thecluster oriented normal to the surface. In the case of therotated cluster discussed in Fig. 4, one of the oxygens on
the side of the cluster comes very close to one of the Ob
rows when the tip approaches the Ti5c site [see inset inFig. 7(a)]. The resulting repulsive interaction (not presentfor the perpendicularly oriented cluster) reduces the mainattractive interaction between the surface Ti atom and the OHgroup at the tip apex. These additional electrostatic interactionsare also present in the protrusion mode case, but as the mainapex-substrate interaction is significantly stronger than in thehole mode case, they have a very limited impact in the totalobserved interaction.
Notice that not only the strength but also the positionof the force maximum is modulated by the detailed tipstructure. It is difficult to determine precisely the experimentalvariation in the relative position of the force curves due tothe fact that, in many cases [as in Figs. 4 and 6(a)], theforce maximum on the Ti atoms cannot be clearly identified.The experiments in Fig. 6(b), where this position is clearlyresolved, show a separation of 0.7 A, smaller than the ∼1.5 Afound in the theoretical results in Fig. 4. The main contributionto the theoretical value comes from a purely geometricaleffect as the Ti5c atoms are about 1.1 A lower than thebridging oxygen atoms. Furthermore, in order to have somesignificant interaction with the Ti5c atom, our sharp tip apexneeds to get closer here than over other sites. Here is where
OH
++ ++++
++ ++++
OH
(a) (b)
FIG. 8. (Color online) The averaged �f (Z) curves and corresponding total interaction forces measured over the surface atomic and defectsites indicated in the inset topography image (a) for protrusion mode and (b) for hole mode. The short-range force curves shown in Figs. 2(a)and 4(a) (Sec. III) were calculated from the frequency shift curves displayed in (a) and (b). The light blue lines were fitted to the long-rangebackground forces. The acquisition parameters were: (a) Q = 173 000, K = 30.4 N/m, f0 = 137.762 kHz, Vcpd = 1.0 V, and A = 12.7 nm.(b) Q = 224 000, K = 33.8 N/m, f0 = 142.691 kHz, Vcpd = 2.2 V, and A = 10.4 nm. Image parameters: (a) 4.6 × 4.6 nm2 and �f = −7.4 Hz;(b) 4.2 × 4.2 nm2 and �f = −7.4 Hz.
125416-7
AYHAN YURTSEVER et al. PHYSICAL REVIEW B 85, 125416 (2012)
the detailed atomic arrangement around the protruding OHgroup plays a crucial role. Figure 7(a) illustrates again thispoint: the tip oriented perpendicular to the surface has alarger force maximum at a closer distance than the “blunter”rotated tip, where the additional electrostatic repulsion amongneighboring oxygen atoms reduces the total interaction andmoves the force maxima away from the surface. This resultimplies that, larger tip models, that are beyond the capabilitiesof ab initio methods, would be necessary in order to havea perfect match between theory and experiment for eachparticular tip.
IV. CONCLUSIONS
The strong requirements imposed by the FS data on thetip models paves the way to clarify the complex FM-AFMimaging scenario with a simple and elegant solution. Ourcalculations show that the common protrusion and hole modecan only be consistently explained with TiO2 clusters at the tipapex. Only if particular care is taken to avoid contaminationwith surface material, we can have Si tips with just an Oor OH atom at the apex that provide the rare neutral and“all-inclusive” modes. Our experimental difficulties to performFS with neutral tips due to tip changes during the force curveacquisition confirm the strong tendency to contamination.Furthermore, these tip models explain the frequent contrastchanges while imaging the surface: only the addition/removalof a single H atom is required to change the imaging mode. Ourcalculations do show these proton transfer events at distancescloser than the force minima. The oxygen-terminated tip picksup the proton from the surface OH for d < 2.65 A. Similarly,the OH-terminated tip donates its proton to the TiO2 surface ford < 1.5 A. While in the protrusion mode all measured forcesets were almost identical, in the hole mode there is a smallvariation in the position and absolute value of the force minimaof the curves on the three probed sites (OH, Ob and Ti5c) forcertain measurements. Our calculations show conclusively thatthis tip dependence (also found in previous experiments10) canbe understood in terms of additional electrostatic interactions,that can be either repulsive or attractive depending on the tipstructure, that sum up to the main contribution, the formationof the H bond, and modulate the force strength on the differentsites. We believe that similar interaction mechanisms and tipmodels can be applied to model and understand nc-AFMimaging on other oxide surfaces. In particular, an FS studyof the NiO surface has reported attractive forces with minimaat 1.6 and at 2.3 nN,18 very close to the values obtained herefor the protrusion mode.
ACKNOWLEDGMENTS
We thank the MEXT (19053006, 22221006, 21246010,21656013, 20760024, and 22760028), JST, HandaiFRC (Japan), and the spanish MICINN (MAT2008-1497, CSD2007-41, MAT2008-02929, MAT2008-02939-E,MAT2008-02953-E, PLE2009-0061, CSD2010-00024) forfinancial support. P.J. thanks ME10076. Y.S., C.G., and P.P.thank, respectively, Funding Program for Next GenerationWorld-Leading Researchers, a CSIC JAE-Doc contract, andthe Ramon y Cajal Program (MICINN). Computer time
provided by the RES at the Magerit supercomputer (CesViMa,Madrid, Spain).
APPENDIX A: LONG-RANGE VAN DER WAALS FORCES
The experimental long-range van der Waals forces betweentip and surface can be determined using the method describedin Sec. II A. Here we show how these forces were extractedfor the data sets of Figs. 2(a) and 4(a) that we used forthe discussion of the protrusion and hole imaging modes(Sec. III). In Figs. 8(a) and 8(b) we represent the correspondingfrequency shift curves registered over the different surface sites(Ob, Ti5f , and OH). By using the Sader inversion algorithm,30
we obtained the total force data shown in the lower panelof Fig. 8. By fitting the long-distance part of these forcecurves to the analytic function AHR/6(z − z0)2, we obtainedthe long-range van der Waals forces between tip and samplefor both experiments (light blue curves). These van der Waalsforces are responsible for the slow decay of the total forces,and also are a non-negligible contribution at short distances,for example, in the hole mode (Fig. 8(b), lower panel), theyaccount for more than 20% of the total.
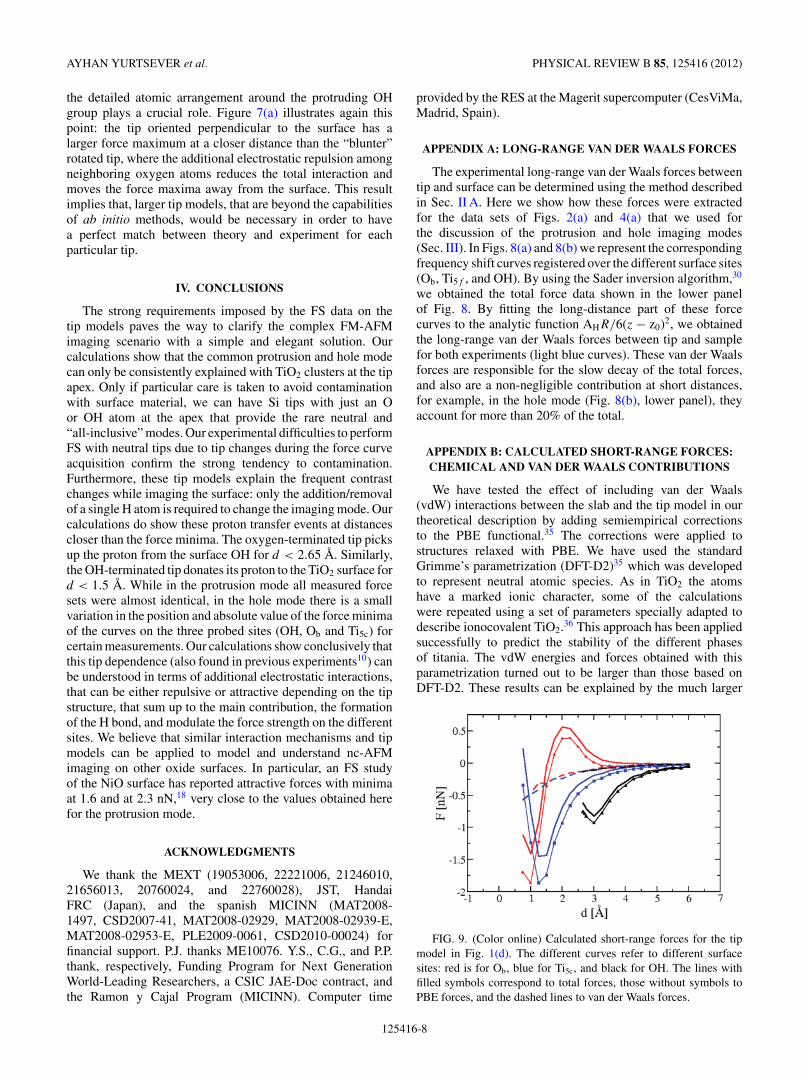
APPENDIX B: CALCULATED SHORT-RANGE FORCES:CHEMICAL AND VAN DER WAALS CONTRIBUTIONS
We have tested the effect of including van der Waals(vdW) interactions between the slab and the tip model in ourtheoretical description by adding semiempirical correctionsto the PBE functional.35 The corrections were applied tostructures relaxed with PBE. We have used the standardGrimme’s parametrization (DFT-D2)35 which was developedto represent neutral atomic species. As in TiO2 the atomshave a marked ionic character, some of the calculationswere repeated using a set of parameters specially adapted todescribe ionocovalent TiO2.36 This approach has been appliedsuccessfully to predict the stability of the different phasesof titania. The vdW energies and forces obtained with thisparametrization turned out to be larger than those based onDFT-D2. These results can be explained by the much larger
FIG. 9. (Color online) Calculated short-range forces for the tipmodel in Fig. 1(d). The different curves refer to different surfacesites: red is for Ob, blue for Ti5c, and black for OH. The lines withfilled symbols correspond to total forces, those without symbols toPBE forces, and the dashed lines to van der Waals forces.
125416-8

UNDERSTANDING IMAGE CONTRAST FORMATION IN TiO . . . PHYSICAL REVIEW B 85, 125416 (2012)
polarizability of the O ions in the ionic model, and the fact thatthe O-O interatomic distances associated with tip and surfaceatoms are shorter than their Ti-Ti counterparts.
The methodology used here naturally separates the van derWaals from the rest of chemical contributions to the force. Wedisplay these two components and also the total forces in Fig. 9.for the model tip of Fig. 1(d) and the DFT-D2 approach. This tiphas been used in Sec. III A to explain the experimental forces ofthe protrusion imaging mode. The van der Waals forces are thesame for the three sites except at short tip-sample distances, seed = 1–1.5 A and d = 2–2.5 A in Fig. 9. In these two regionsthe dispersive forces over Ob and Ti5c are slightly differentbecause the tip structures also differ [see insets of Fig. 2(b)]due to the action of strong chemical forces. Therefore, ingeneral terms, the short-range van der Waals force does
not affect the contrast between sites. However, it affects themagnitude of the total force, especially at short distances orwhen chemical forces are relatively small. The same trendsdescribed here have also been reported in previous theoreticalworks.25
The short-range van der Waals force calculated here (Fig. 9)and the macroscopic van der Waals component obtained froma fit of the experimental forces in Fig. 8 are very similar(∼0.5 nN) at the shortest tip-sample distances. This seemsan indication of an overestimation of the dispersive forcesby DFT-D2 in TiO2, and the same applies to the ionicparametrization mentioned at the beginning of this sectionsince it produces even larger values. Due to this, we decidednot to include the empirical van der Waals terms into our finaltheoretical analysis.
*Corresponding author: [email protected]. Diebold, Surf. Sci. Rep. 48, 53 (2003).2C. L. Pang, R. Lindsay, and G. Thornton, Chem. Soc. Rev. 37, 2328(2008).
3B. Hammer, S. Wendt, and F. Besenbacher, Top. Catal. 53, 423(2010).
4U. Diebold, J. F. Anderson, K.-O. Ng, and D. Vanderbilt, Phys. Rev.Lett. 77, 1322 (1996).
5S. Wendt, R. Schaub, J. Matthiesen, E. K. Vestergaard, E.Wahlstrom, M. Rasmussen, P. Thostrup, L. Molina, E. Lagsgaard,I. Stensgaard, B. Hammer, and F. Besenbacher, Surf. Sci. 598, 226(2005).
6O. Bikondoa, C. L. Pang, R. Ithnin, C. A. Muryn, H. Onishi, andG. Thornton, Nat. Mater. 5, 189 (2006).
7S. Morita, F. J. Giessibl, and R. Wiesendanger, NCAFM Vol.2,Springer, edited by S. Morita, F. J. Giessibl, and R. Wiesendanger,NanoScience and Technology (Springer, Berlin, 2009).
8J. V. Lauritsen, A. S. Foster, G. H. Olesen, M. C. Christensen,A. Kuhnle, S. Helveg, J. R. Rostrup-Nielsen, B. S. Clausen, M.Reichling, and F. Besenbacher, Nanotechnology 17, 3436 (2006).
9C. L. Pang, O. Bikondoa, D. S. Humphrey, A. C. Papageorgiou,G. Cabailh, R. Ithnin, Q. Chen, C. A. Muryn, H. Onishi, andG. Thornton, Nanotechnology 17, 5397 (2006).
10G. H. Enevoldsen, A. S. Foster, M. C. Christensen, J. V. Lauritsen,and F. Besenbacher, Phys. Rev. B 76, 205415 (2007).
11R. Bechstein, C. Gonzalez, J. Schutte, P. Jelınek, R. Perez, andA. Kuhnle, Nanotechnology 20, 505703 (2009).
12A. Yurtsever, Y. Sugimoto, M. Abe, and S. Morita, Nanotechnology21, 165702 (2010).
13A. S. Foster, A. Y. Gal, J. M. Airaksinen, O. H. Pakarinen, Y. J.Lee, J. D. Gale, A. L. Shluger, and R. M. Nieminen, Phys. Rev. B68, 195420 (2003).
14C. Barth, A. S. Foster, C. R. Henry, and A. L. Shluger, Adv. Mater.23, 477 (2010).
15G. H. Enevoldsen, H. P. Pinto, A. S. Foster, M. C. R. Jensen,A. Kuhnle, M. Reichling, W. A. Hofer, J. V. Lauritsen, andF. Besenbacher, Phys. Rev. B 78, 045416 (2008).
16M. A. Lantz, H. J. Hug, R. Hoffmann, P. J. van Schendel,P. Kappenberger, S. Martin, A. Baratoff, and H. J. Guntherodt,Science 291, 2580 (2001).
17B. J. Albers, T. C. Schwendemann, M. Z. Baykara, N. Pilet,M. Liebmann, E. I. Altman, and U. D. Schwarz, Nat. Nanotechnol.4, 307 (2009).
18R. Hoffmann, M. A. Lantz, H. J. Hug, P. J. A. van Schendel,P. Kappenberger, S. Martin, A. Baratoff, and H.-J. Guntherodt,Phys. Rev. B 67, 085402 (2003).
19R. Hoffmann, L.N. Kantorovich, A. Baratoff, H. J. Hug, and H.-J.Guntherodt, Phys. Rev. Lett. 92, 146103 (2004).
20K. Ruschmeier, A. Schirmeisen, and R. Hoffmann, Phys. Rev. Lett.101, 156102 (2008).
21R. Hoffmann, D. Weiner, A. Schirmeisen, and A. S. Foster, Phys.Rev. B 80, 115426 (2009).
22G. Teobaldi, K. Lammle, T. Trevethan, M. Watkins, A. Schwarz,R. Wiesendanger, and A. L. Shluger, Phys. Rev. Lett. 106, 216102(2011).
23Y. Sugimoto, P. Pou, M. Abe, P. Jelinek, R. Perez, S. Morita, andO. Custance, Nature (London) 446, 64 (2007).
24M. Ashino, A. Schwarz, T. Behnke, and R. Wiesendanger, Phys.Rev. Lett. 93, 136101 (2004).
25M. Ondracek, P. Pou, V. Rozsıval, C. Gonzalez, P. Jelınek, andR. Perez, Phys. Rev. Lett. 106, 176101 (2011).
26N. Suehira, Y. Tomiyoshi, Y. Sugawara, and S. Morita, Rev. Sci.Instrum. 72, 2971 (2001).
27T. R. Albrecht, P. Grutter, D. Horne, and D. Rugar, J. Appl. Phys.69, 668 (1991).
28M. Abe, Y. Sugimoto, O. Custance, and S. Morita, Nanotechnology16, 3029 (2005).
29Y. Sugimoto, O. Custance, S. Morita, M. Abe, P. Pou, P. Jelinek,and R. Perez, Phys. Rev. B 73, 205329 (2006).
30J. E. Sader and S. P. Jarvis, Appl. Phys. Lett. 84, 1801(2004).
31G. Kresse and J. Furthmuller, Phys. Rev. B 54, 11169 (1996).32J. P. Perdew, K. Burke, and M. Ernzerhof, Phys. Rev. Lett. 77, 3865
(1996).33P. Pou, S. A. Ghasemi, P. Jelinek, T. Lenosky, S. Goedecker, and
R. Perez, Nanotechnology 20, 264015 (2009).34M. J. Lundqvist, M. Nilsing, and P. Persson, Int. J. Quantum Chem.
106, 3214 (2006).35S. Grimme, J. Comp. Chem. 27, 1787 (2006).36J. C. Conesa, J. Chem. Phys. C 114, 22718 (2010).
125416-9