Understanding How to Enhance Business Creativity · Methods and Participants ... why creativity is...
264
Understanding How to Enhance Business Creativity Robert Dew
Transcript of Understanding How to Enhance Business Creativity · Methods and Participants ... why creativity is...

Understanding How to Enhance Business Creativity
Robert Dew

1
Understanding How to Enhance Business Creativity
Thesis by publication in fulfilment of the requirements for the degree of
Doctor of Philosophy (PhD)
written and submitted by
Robert Dew
B.App.Sc. (Physics) QUT
MBA QUT
Creative Industries Faculty
Queensland University of Technology
Brisbane, Australia
June 2009

2
I dedicate this thesis to the men whom I most admire and
whose influences on my life have helped me develop the
capacity to both commence and complete this journey:
Theo Fouras for inspiring me to be enthusiastic;
Garfield Prowse for leading me to start thinking for myself;
Greg Hearn for showing me a way forward;
Rick Schram for teaching me the importance of integrity;
And my father, Anthony Dew for showing me the value of
hard work and self belief

3
Abstract
Understanding How to Enhance Business Creativity
This PhD study examines some of what happens in an individual’s mind
regarding creativity during problem solving within an organisational context. It
presents innovations related to creative motivation, cognitive style and
framing effects that can be applied by managers to enhance individual
employee creativity within the organisation and thereby assist organisations
to become more innovative.
The project delivers an understanding of how to leverage natural changes in
creative motivation levels during problem solving. This pattern of response is
called Creative Resolve Response (CRR). The project also presents evidence
of how framing effects can be used to influence decisions involving creative
options in order to enhance the potential for managers get employees to
select creative options more often for implementation.
The study’s objectives are to understand:
• How creative motivation changes during problem solving
• How cognitive style moderates these creative motivation changes
• How framing effects apply to decisions involving creative options to solve
problems
• How cognitive style moderate these framing effects
The thesis presents the findings from three controlled experiments based
around self reports during contrived problem solving and decision making
situations. The first experiment suggests that creative motivation varies in a

4
predictable and systematic way during problem solving as a function of the
problem solver’s perception of progress. The second experiment suggests that
there are specific framing effects related to decisions involving creativity. It
seems that simply describing an alternative as innovative may activate
perceptual biases that overcome risk based framing effects. The third
experiment suggests that cognitive style moderates decisions involving
creativity in complex ways. It seems that in some contexts, decision makers
will prefer a creative option, regardless of their cognitive style, if this option is
both outside the bounds of what is officially allowed and yet ultimately safe.
The thesis delivers innovation on three levels: theoretical, methodological and
empirical. The highlights of these findings are outlined below:
1. Theoretical innovation with the conceptualisation of Creative Resolve
Response based on an extension of Amabile’s research regarding
creative motivation.
2. Theoretical innovation linking creative motivation and Kirton’s research
on cognitive style.
3. Theoretical innovation linking both risk based and attribute framing
effects to cognitive style.
4. Methodological innovation for defining and testing preferences for
creative solution implementation in the form of operationalised
creativity decision alternatives.
5. Methodological innovation to identify extreme decision options by
applying Shafir’s findings regarding attribute framing effects in reverse
to create a test.

5
6. Empirical innovation with statistically significant research findings which
indicate creative motivation varies in a systematic way.
7. Empirical innovation with statistically significant research findings which
identify innovation descriptor framing effects
8. Empirical innovation with statistically significant research findings which
expand understanding of Kirton’s cognitive style descriptors including
the importance of safe rule breaking.
9. Empirical innovation with statistically significant research findings which
validate how framing effects do apply to decisions involving
operationalised creativity.
Drawing on previous research related to creative motivation, cognitive style,
framing effects and supervisor interactions with employees, this study delivers
insights which can assist managers to increase the production and
implementation of creativity in organisations. Hopefully this will result in
organisations which are more innovative. Such organisations have the
potential to provide ongoing economic and social benefits.

6
Keywords
Creativity
Motivation
Creative motivation
Creative production
Framing effects
Cognitive style
Operationalised creativity
Organisational creativity
Supervision

7
List of Publications and Refereed Conference Papers
In fulfilment of QUT’s requirements for thesis by publication, material from this
study has been submitted for publication as detailed below. This author was
the sole author for the papers below as submitted:
Study 1: Dew R 2008 ‘Creative Resolve Response: How changes in creative
motivation relate to cognitive style’. Accepted for publication The
International Journal of Management Development. (Accepted February
2009)
Study 2: Dew R 2008 ‘Innovation and Creativity Framing Effects’. In review for
Creativity Research Journal.
Study 3: Dew R 2008 ‘Cognitive Style, Creativity and Framing Effects’.
Accepted for publication by Journal of Creative Behavior. (Accepted
November 2008)
Additional publication arising:
Dew R 2007 ‘Creative Resolve Response: How changes in creative motivation
relate to cognitive style’. In Proceedings ISPIM 2007 Innovation for Growth: The
Challenges for East and West.
8
Table of Contents Abstract ....................................................................................................................................... 3 List of Publications and Refereed Conference Papers ...................................................... 7 Prologue .................................................................................................................................... 10
Research Questions ............................................................................................................ 13 Structure ................................................................................................................................ 14
Literature Review ..................................................................................................................... 16 Creativity Definitions ........................................................................................................... 16 Creativity Measurement .................................................................................................... 17 Deviance, Rule Breaking and Creativity in the Business Context .............................. 21 Operationalised Creativity ................................................................................................ 22 Creative Production ........................................................................................................... 23 Creative Motivation ............................................................................................................ 25 Organisational Effects on Creative Motivation ............................................................. 27 Mood Effects and Creativity ............................................................................................. 30 Cognitive Style ..................................................................................................................... 32 Framing Effects .................................................................................................................... 37 Creativity and Framing under Uncertainty .................................................................... 38 Creativity and Attribute Framing ..................................................................................... 41 Creativity and Goal Behaviour Framing ......................................................................... 44 Literature Review Summary ............................................................................................... 46
Areas for Investigation ............................................................................................................ 46 Rationale for Study 1: Variable Creative Motivation during Problem Solving ........ 47 Linking Creative Motivation and Self Determination Theory ...................................... 50 Linking Creative Motivation and Cognitive Style ......................................................... 51 Introducing Creative Resolve Response ........................................................................ 53 Table 1: CRR Motivation Modes ....................................................................................... 54 Creative Motivation with Increasing Success Certainty .............................................. 55 Creative Motivation with Increasing Failure Certainty ................................................ 56 Adaptor Creative Resolve Response .............................................................................. 59 Innovator Creative Resolve Response ............................................................................ 61 Rationale for Study 2: Framing Effects and Operationalised Creativity ................... 66
Chapter 1: Creative Resolve Response; How Changes in Creative Motivation Relate to Cognitive Style .................................................................................................................... 74
Introduction .......................................................................................................................... 75 The Creative Resolve Response (CRR) model ............................................................... 81 Adaptor CRR ........................................................................................................................ 82 Innovator CRR ...................................................................................................................... 85 Hypotheses ........................................................................................................................... 89 Methods and experimental design ................................................................................. 89 Results .................................................................................................................................... 96 Analysis .................................................................................................................................. 97 Discussion ........................................................................................................................... 100 Conclusion ......................................................................................................................... 108 References ........................................................................................................................ 110
Chapter 2: Innovation, Creativity and Framing Effects ................................................ 118 Abstract.............................................................................................................................. 118 Introduction ....................................................................................................................... 119 Defining and Measuring Creativity ............................................................................... 123 Framing Effects ................................................................................................................. 126 Hypotheses ........................................................................................................................ 132 Method............................................................................................................................... 136 Results ................................................................................................................................. 143 Discussion ........................................................................................................................... 154

9
Conclusion ......................................................................................................................... 161 References ........................................................................................................................ 163
Chapter 3: Cognitive Style, Creativity and Framing Effects ........................................ 169 Abstract.............................................................................................................................. 169 Introduction ....................................................................................................................... 170 Cognitive Styles ................................................................................................................ 172 Creativity in Organisations ............................................................................................. 173 Framing Effects ................................................................................................................. 174 Hypotheses ........................................................................................................................ 176 Methods and Participants .............................................................................................. 179 Procedure and Instruments ............................................................................................ 181 Limitations of the Experimental Design ........................................................................ 184 Results: Risk Based and Attribute Framing for the Entire Sample ............................ 185 Results: Risk Based Framing and Cognitive Style ........................................................ 187 Results: Fluency/Flexibility Preferences and Cognitive Style .................................... 190 Results: Originality/Novelty Preferences and Cognitive Style ................................. 192 Results: Divergence Preferences and Cognitive Style .............................................. 195 Results: Rule Breaking Preferences and Cognitive Style........................................... 198 Results Summary ............................................................................................................... 201 Discussion ........................................................................................................................... 201 Conclusion ......................................................................................................................... 212 References ........................................................................................................................ 215
Conclusions ........................................................................................................................... 219 Study One Response to Objectives .............................................................................. 219 Study Two Response to Objectives ............................................................................... 227 Study Three Response to Objectives ............................................................................ 230 Caveats and Limitations ................................................................................................. 233 Enhancing Understanding of Creativity Management ............................................ 241
References ............................................................................................................................. 244

10
Prologue
This research program arose out of consulting work for a large Australian
mining and construction company. During the several years that the author
was retained by that organisation there were several occasions where
training in creative problem solving tools was provided to various managers
within the client organisation. Whilst on the whole the training was well
received, the author was astounded when some of the trainees responded
with comments such as “Yes, that’s all fine but what is the minimum we have
to do with this stuff?” and “Will this be included in my KPI’s (meaning key
performance indicators used for employee performance appraisals)?” Whilst
at first these comments were dismaying because they suggested that
motivation to be creative was lacking within this organisation, ultimately the
challenge of managing employee creative motivation became engaging,
intriguing and more relevant.
Introduction
Creativity is important for businesses because it potentially improves problem
solving outcomes. Many organisations are interested in enhancing creativity.
Recently many researchers and practitioners alike have also suggested that
creativity and innovation are important for managerial effectiveness
(Basadur, 2004; Drucker, 2004; Cameron M Ford, 2002; S. S. Gryskiewicz, 2000b;
Reiter-Palmon & Illies, 2004). This contrasts with the historic paradigm that
creativity was irrational and therefore the antithesis of good management
(Lataif et al., 1992; Mintzberg & Sacks, 2004; Pech, 2001; Scratchley &

11
Hakstian, 2000). Almost universally creativity and innovation are now
accepted as important for both managers and organisations.
Despite the acknowledgement of the importance of creativity in
organisations and the focus on increasing creativity to drive innovation, many
managers appear to struggle to improve their organisations’ creative output.
Leavy (2002) suggests that organisations have been ‘found out’ in the last 10
years regarding their ability to manage creativity. It is not immediately clear
why creativity is so hard to enhance in organisations and there are a range of
different points of view.
Berkshire (1995) identified how managers constrain creativity with controlling,
competitive, and critical behaviours, by implementing rationalisations, and
failing to escape routine thinking. Assink (Assink, 2006) suggests the problem
may be inherent in organisational designs where a range of factors reduce
successful firms’ innovation capabilities. Assink seems to suggest creativity can
be a victim of the organisational the success derived from a winning business
strategy, risk-reducing culture and reliance on historically useful mental
models. Elsbach and Hargadon (2006) assert that the interaction of the
organisation and management upon the employee can lead to overwork
and high pressure for performance. They show how these factors are
significantly damaging to professional creativity.
Välikangas and Jett (2006) assert that the leadership challenge for creativity
involves ‘learning to manage the independent thinkers’. These employees are
those who are determined to innovate on their own terms, refusing to accept
professionalism as a valid constraint on non-conformance.

12
The difficulty for managers to accept the research findings above is that
enhancing creativity would seem to come at an unacceptable price: Few
managers are prepared to reduce their management control, shelve good
cost saving initiatives, decrease standardisation efficiencies, reduce their
monitoring of employees or decrease their expectations of quality,
performance, productivity and risk reduction to allow creative types to do
more of whatever they please.
Management is about planning, leading, organising and controlling. How do
you plan for emergence? Why would you lead others to undermine your
leadership? When should organisations increase complexity and risk? What
controls do not constrain?
The study is not about finding a compromise between these extremes. Instead
the vision that inspired this research is about how to synthesise the two
seemingly contradictory points of view. It is about how to create options that
align most managers’ philosophies about what it is they are supposed to do in
order for their businesses to perform with what is needed to enhance
employee creativity at a personal intervention level.
The study does not view this problem through the lens of the organisation.
Hamel (Hamel, 2000) proposed a radical restructure to do this and has gone
on to suggest that the next step is to change the process of management
innovation (Hamel, 2006). This study instead starts with a level of analysis
around the interactions between managers and employees because this
smaller problem is easier to start with. It suggests that interactions with
managers affect employees’ motivation to be creative when solving
problems.

13
This conceptualised interaction is to some extent a simplified abstraction
because most managers are also employees that report to higher level
managers. These higher level managers are themselves managed by some
other even more powerful managers until Board level is reached. The
employee-manager creativity interaction happens between each level in the
organisation. A further simplification is also required.
There are many points in the problem solving process that employee
creativity motivation can be evaluated and influenced. In order to simplify
these investigations only two aspects of employee creativity enhancement
were considered: how to increase employees’ desire to amplify their creative
production and how to then influence them to choose more creative solution
options rather than less creative ones.
Research Questions
The background (outlined above) and the literature review (see below) lead
to the following research questions around the theme of what manager’s can
do to enhance employee creativity. The studies objectives are to understand:
• How does creative motivation change during problem solving with the
potential for creative production?
• How does cognitive style moderate these creative motivation changes?
• How do framing effects apply to decisions involving creative and non-
creative options to solve problems?
• How does cognitive style moderate these framing effects?

14
Structure
This document starts with a review of the relevant literature relating to the
nature of creativity in business, creative motivation, framing effects and
cognitive style before presenting the areas for investigation of this research.
The research was arranged into three separate studies, each of which was
submitted individually for publication prior to this document being created.
References for each of the three studies are included at the end of each
paper as well as in a master list at the end of the thesis. Chapter 1 reports
findings that relate to the first two research questions above in terms of
natural fluctuations in creative motivation in individuals during specific group
problem solving sessions. Chapter 2 reports on findings that relate to the third
research question above. This research discusses general implications of
framing effects as they apply in preferences for creative options. Chapter 3
repeats the methodology used in the previous paper with a different focus:
the research examines how individuals with different cognitive styles respond
to framing effects applied to decisions involving creative options. This work
relates to research question 4 above. In the following paragraphs each paper
is now outlined in more detail.
The first paper in the study links individual creative motivation, problem solving
progress and cognitive style. This paper shows how individual problem solving
motivation varies during problem solving. Outcome certainty is proposed as a
proxy for problem solving progress since most of the time it is impossible to
know during problem solving efforts how much progress the problem solver
has actually (objectively) achieved. (Of course the problem solver may
subjectively perceive progress has been made). The results show that

15
individual creative motivation initially increases peaking at around 20%
certainty of outcome. Creative motivation then reduces to a minimum at
around 70% certainty of outcome. At greater levels of certainty creative
motivation again increases with outcome certainty. Whilst the pattern of
varying motivation (called Creative Resolve Response) is consistent, the level
of motivation appears to be moderated by cognitive style as measured by
the Kirton Adaptation Inventory (KAI) (Kirton, 1976).
The second paper in the study examines how decisions involving creative and
non-creative options are influenced by framing effects. The paper shows that
risk based and attribute based framing effects apply to decisions involving
creativity. It also shows that merely describing an option as innovative
enhances individual decision making preference for that option in binary
choices. In some contexts this preference is more powerful than the original
risk based framing effects first presented by Tversky and Kahneman (Tversky &
Kahneman, 1981). The paper also codifies operational creativity (defined
below) into specific context options. The results show that operational
creativity is perceived as an extreme option in some contexts. Extreme
options contain both advantages and detriments that must be considered by
the decision maker in order to compare against the more moderate
alternative presented in the decision. Shafir (Shafir, 1993) showed that
extreme options are significantly less preferred when decisions are presented
as rejections, rather than as a choice between an extreme and a moderate
option. The second paper uses the finding of Shafir to develop a new
methodology which identifies when operational creativity options are indeed
extreme.

16
The third paper investigates whether or not framing effects are dependent on
cognitive style. The results identify one specific context where participant
responses to risk based framing are significantly different for sub groups with
different cognitive styles. This suggests that framing effects may not be
universal as implied by previous research approaches. The third paper also
shows that in specific contexts preferences for operationalised creativity
options are moderated by cognitive style as measured by the KAI. Generally
the cognitive style sub group that preferred the operational creativity option
also perceived it as an extreme option. Importantly the results unexpectedly
suggest that cognitive style is not important in determining attitudes to rule
breaking in contexts described as safe. This finding contradicts rule breaking
preferences for different cognitive styles as originally described by Kirton
(Kirton, 1976). Overall the third paper does support the idea of different
cognitive style subgroups, but it shows that creativity and rule breaking
preferences are more complex than previously suggested by the body of
cognitive style research.
Literature Review
The starting point for these studies is to understand other researchers’ prior
contributions to understanding creativity, creative motivation, cognitive style
and framing effects.
Creativity Definitions
Amabile (1997) defines business creativity as the production of novel and
appropriate solutions to organisational problems. Amabile’s model is
compatible with other authors’ definitions. For example, Plsek (1997) and

17
Gryskiewicz (2000) have similar conceptions of creativity but also go on to
define innovation as the implementation of creative solutions. Csikszentmihaly
(1996a) and Simonton (1993; 1999) assert that creativity is only meaningful as
an evaluation by third party beneficiaries of a problem solution. Interestingly
this recognition for creativity is still based on both the relative novelty and
appropriateness of the solution.
Creativity Measurement
According to Cropley (2000) there are more than 255 different tests for
measuring creativity. Measures of creativity that were simple to use, well
validated and relevant to business contexts were deemed most appropriate
for this study.
Commonly used creativity tests include Mednick’s Remote Association Test
(1962; 1967), Torrance Test of Creative Thinking (1962), Creativity Index
(Gough 1981) and Rainmaker Index (Stevens, Burley et al. 1998). One
common test rejected for use in this study was Amabile’s Consensual
Assessment Technique (1982). It was rejected because it is a time consuming
test that requires multiple raters, and this made it outside the resource scope
of what was possible. A test useful for this study is the Guilford Divergence Test
(Guilford J P 1967) which provides a reliable and basic starting point for
assessing creative outputs in business settings. The advantage of this test is
that it is very simple and yet powerful for assessing creativity. The test proposes
three measures of creativity: fluency, flexibility and originality.
Fluency is a measure of the number of options produced to solve a problem
and is essentially a measure of volume (E P Torrance & Haensly, 2003). Fluency
assumes that a more creative employee will be able to generate more

18
potential ideas to solve a problem. However in practice fluency as a unique
measure of creativity is flawed because it is possible to create many ideas
that do not vary significantly and still achieve a high fluency score. For
example consider the problem of trying to buy a gift for a partner. This is a
situation where it is quite possible (and often valuable) to be creative. A fluent
problem solver might consider flowers as a good gift and then proceed to
consider a large number of different types of flowers that could constitute a
bouquet. In doing so their creativity is limited because other gifts (for example
a massage, chocolates or a sky diving lesson) are not considered. Clearly
whilst it is to some extent more creative to propose more options to solve a
problem other measures of creativity are also required.
A second measure of creativity is flexibility1
1 Current Torrance Tests omit flexibility as a possible score due to correlations with fluency. In the tests
conducted in this study shown later fluency and flexibility are combined. The separation shown here is
definitional not operational
which relates the number of
different categories or themes that generated ideas can be grouped into (E P
Torrance & Haensly, 2003). Flexibility is essentially a measure of spread of
ideas and assumes that a more creative problem solver will be able to
suggest a wider range of possible solutions to a problem. In practice flexibility
is somewhat harder to measure than fluency because in many instances it is
not clear how far apart two different ideas need to be in order to be
considered as being from different themes or categories. In our gift giving
example above is difficult to be conclusive as to whether or not a pot plant is
in the same category as a bouquet of flowers or in a new category. Despite
this practical concern it is apparent that a compared to a problem solver

19
who only considered a variety of bouquets as a gift, one who also considered
a pot plant as well is in that instance more creative.
Fluency and flexibility are applicable business creativity management
because of these outputs ability to be measured directly by examining a
problem solver’s list of proposed ideas. The third measure of creativity used in
business (originality) is paradoxically more and less applicable to business
creativity management.
Originality is a measure of how rare an idea is (E P Torrance & Haensly, 2003)
and essentially is an indicator of unusualness or novelty. Such a quantity can
only be determined in comparison to responses generally proposed by a
normal population. An idea is rare to the 1% level if it is proposed by less than
1 in 100 normal problem solvers as a response to the problem at hand. This
requirement for comparison makes originality harder to measure in business
and therefore less useful than the other two creativity measures. Original ideas
in business are often considered to be risky due to their inherent liability of
newness (Stinchcombe, 1965). However original business ideas have the
potential to achieve the greatest impact on performance (Schumpeter,
1983), so originality as a creativity output measure cannot be ignored by
managers.
The Torrance Test of Creative Thinking (1962) measures very similar outputs to
Guilford ‘s Divergence Test (Guilford J P, 1967) except that it includes an
additional creativity characteristic called elaboration. Elaboration is the
ability of the creative problem solver to extend or modify an existing idea with
more detail (E P Torrance & Haensly, 2003). Elaboration presents similar
measurement difficulties to originality in that elaboration levels are typically

20
determined in reference to a normal population. It should also be noted that
typically Torrance considered the elaboration measure in the context of
children that were modifying existing proto drawings in order to make them
“more complete”. The relative level of additional detail added was
considered proportional to elaboration creativity. Such evaluations were
fundamentally subjective.
Elaboration was not considered in this research as it is typically manifested in
business problem solving situations during attempts to implement creative
ideas (for more on this see Basadur, 1997). Problem solvers typically elaborate
their creative potential solutions in order to get them to fit better within
organisational constraints and/ or fit with other organisational stakeholders in
order to maximise implementation success chances. Since this study is limited
to the understanding of how to enhance the production of creative ideas
and then increase the preference to choose to implement these creative
ideas, it was decided that elaboration could be eliminated from
consideration. This is not to say that elaboration is not relevant in the business
context, nor that more elaborated creative options would not potentially be
more preferred for attempted implementation. Instead it has been left to later
research studies to properly deal with elaboration creativity within the
business context.
There is quite a substantial debate over the appropriateness of the underlying
measures of creativity, and whether or not divergent thinking is in fact a major
component of creativity. Milgram and Livine (in Kaufman and Baer 2005:
pages 187-190) provide a good summary of the concerns proposed by a
range of researchers. Milgram and Livine go on to describe the important
trend towards measuring creativity in context. However they also confirm the
21
reliability, convergent validity and validity of ideational fluency-based
measures of creativity including both Guilford’s and Torrance’s tests (page
188).
Whilst the testing validity provides an adequate basis to consider fluency,
flexibility and originality as valid creativity measures, it was determined that
additional variables could also be considered that incorporate some aspect
of creativity’s domain relevance. Two other measures of creativity that the
study does include that relate to how creative options are perceived by
employees in response to the norms of their organisations, namely deviance
and rule breaking. These measures were chosen for their connection to the
concept of cognitive style (Kirton, 1972) as a predictor of creativity in an
organisational context, as well as their ease to be operationalised in the form
of experiment used.
Deviance, Rule Breaking and Creativity in the Business Context
The models of creativity consider creativity in abstract without regard to the
organisational context. Organisational factors are very important to creative
production (Andriopoulos, 2001; Ismail, 2005; Robben, 1998; Schepers & Berg,
2007; Tierney, Farmer, & Graen, 1999; Woodman, Sawyer, & Griffin, 1993).
Creativity measures consider creativity from the perspective of creative
production. These approaches fall short of including the organisation as
reference point for determining what it means to be creative (and Barlow,
2001; Basadur, 1994; for example see McLean). Thus it is also important to
understand “contextual creativity” – how employees perceive what it means
to be creative at work. Many authors (including Basadur, 2004; Berkshire, 1995;

22
Boeddrich, 2004; S. Gryskiewicz & Taylor, 2003; Leavy, 2002; Mumford, 2000;
Proctor, 1999; Rieple, 2004; Scratchley & Hakstian, 2000) have asserted that
organisations either purposefully or inadvertently decrease creativity (Klein,
1990). This can be manifest in many ways for example via punitive personal
accountability, overzealous risk management, conservative capital allocation
procedures or inflexible corporate governance initiatives.
In organisations where purposeful creativity reduction occurs, groups and
individuals that are too creative when solving problems can be subject to
sanctions (T. M. Amabile, 1998; Kirton, 1984a; Pinchot & Callahan, 2000). In
organisations where inadvertent creativity reduction occurs, groups and
individuals are subject to increased oversight and decreased autonomy after
any failed innovation attempt (Kirton, 1978a).
Thus employees in many organisations automatically associate creativity with
deviance or rule breaking (Pascale & Sternin, 2005; Pech, 2001; Sternin &
Choo, 2000; Wells, Donnell, Thomas, Mills, & Miller, 2006). This can occur where
inadvertent creativity reduction is the norm and where purposeful creativity is
the norm. Generating more options, a wider range of options, novel or rare
options requires a preparedness on the part of the employee to overcome
organisation signals that promote efficiency and risk reduction (Dewett, 2004;
Shaw, O'Loughlin, & McFadzean, 2005; Sutton, 2001) during problem solving.
Operationalised Creativity
The five indicators of creativity – fluency, flexibility, originality, deviance and
rule breaking are all used in this study to operationalise creativity. Creativity is
operationalised when a manager or employee is presented with a choice of
options to solve a problem, at least one of which includes an alternative that

23
exhibits greater relative fluency, flexibility, originality, deviance and/ or rule
breaking. The element of choice is important in a business context due to the
requirement for explicit or implicit approval for a creative output to be
granted before attempting to implement the creative alterative to solving the
problem. Note that the successful implementation of such an alternative
would represent an innovation as defined above.
Improving the potential for successful implementation of creative ideas in a
business context is beyond the scope of this study. What is relevant to this
research is how to influence the choice to try and implement a creative
option. In other words – how to increase preference for operationalised
creativity. As well, before such a choice can be made operationalised
creativity options must be produced.
Creative Production
Amabile’s three factor theory of individual creativity (1983; 1996; 1997; 1998)
combines creativity skills, domain-relevant knowledge and task motivation as
sole components intrinsic to creativity. Creativity skills build on an individual’s
natural ability to be fluent, flexible, or original with training in generic heuristics
or other techniques for enhancing creative problem solving skill. An example
of such a generic heuristic might be the SCAMPER technique as presented by
Michalko (Michalko 2000). The SCAMPER acronym stands for substitute,
combine, adapt, magnify or add, put to other uses, eliminate or reduce and
reverse or rearrange. Each of these actions represents a generic attention
redirection tool designed to help a problem solver prompt themselves for
more fluent, flexible or original solutions. It is apparent from the acronym’s
meaning that the attention redirection tools could be applied within any
24
problem solving domain that the problem solver is familiar with. Of course an
individual may act creatively without the requirement to use a formally
acquired heuristic. Consider a creative artist for whom creative expression is
an informally acquired ability. In Amabile’s definition this talent also should be
included in the term ‘creativity skills’.
Amabile’s second factor in creative production is domain knowledge. This is
defined as specific technical expertise that relates to the problem at hand.
Amabile’s three factor model suggests that some minimum amount of
relevant domain knowledge is required in order to have any chance of
solving a problem. This is similar to what Csikszentmihalyi calls knowledge of
the “field of accomplishment” (Csikszentmihalyi, 1996b). Amabile’s model also
suggests that creativity increases proportionally with domain knowledge.
There is potential that research relating to priming (also called fixation or
thinking inertia) will ultimately show in some contexts domain knowledge can
prevent creative discoveries from being made. No such papers could be
identified. This is significant as results showing an inverse relationship between
domain knowledge and creativity would invalidate Amabile’s three factor
model in at least some situations.
In fact, Amabile’s three factor theory has been empirically supported by a
variety of researchers (Conti, Coon, & Amabile, 1996; Ruscio, Whitney, &
Amabile, 1998), though Taggar (2002) proposes further potential factors for
consideration. Since the product of the three components determines total
creative output (or partly determines creative output if Taggar’s model is
true), any change in one of the factors will proportionally change the

25
problem solver’s results regardless of whether Taggar’s additional factors
apply.
Whilst there is significant research to suggest both creativity skills and domain-
relevant knowledge can be increased by training, this is relatively costly and
time consuming (for example see Wang; & Horng;, 2002) in the short term
compared to management interventions designed to influence creative
motivation. Thus I argue managers should be interested in understanding how
to affect an individual employee’s creative motivation.
Creative Motivation
Creative motivation is an important component of individual creativity. In
Amabile’s three factor model or creativity, creative motivation is the extent to
which a problem solver will choose to engage their existing creativity skills and
domain-relevant knowledge. Amabile (1997; 2005; 1983; 1990; 1996; 1997;
1998; 2002; 2004) outlines how intrinsic and extrinsic motivators combine to
determine creative motivation and shows that individuals are more creative
when motivated appropriately.
An individual’s motivation for any task at a particular instant is determined
from intrinsic motivators (like curiosity, interest and fatigue) and extrinsic
motivators (including rewards, recognition and resource abundance).
Generally creativity is motivated by intrinsic factors (T. M. Amabile, 1997;
Cooper, Clasen, Silva-Jalonen, & Butler, 1999; B A Hennessey & Amabile, 1998;
Katz, 2002).
A specific finding of Amabile’s work is that extrinsic motivators most
commonly operate to reduce creative motivation (Amabile 1997). This is the
case even when the extrinsic motivators are designed to reward creative
26
behaviour. There are extrinsic motivators which do not reduce creativity: this
special class of extrinsic motivators were designated by Amabile as synergistic
extrinsic motivators. They act to enhance creative motivation when intrinsic
motivation is already present (Polland 1994; Amabile 1997; Hennessey and
Amabile 1998; Ruscio, Whitney et al. 1998).
Two common examples of synergistic, extrinsic motivators are recognition and
resource support (Amabile, 1997). A creative employee who is intrinsically
motivated to solve a problem creatively is further motivated when recognised
for their creative work. Similarly a creative employee who is intrinsically
motivated to solve a problem creatively is further motivated when resources
are provided that ensure they can continue their creative work regardless of
results. Monitoring the creative employee’s progress is an extrinsic de-
motivator for creativity and would be expected to reduce creative output (T.
M. Amabile et al., 2002; Williams, 2004). Offering additional payment or
resources as a bonus for superior creative work are also extrinsic motivators
that dampen creativity even though designed to enhance it.
In general creativity seems to be a specific case of Deci and Ryan’s Self
Determination Theory (Deci & Ryan, 1985b, 2000a, 2000b). According to Self
Determination Theory intrinsic motivation is undermined by the presence of
tangible extrinsic motivators. This supports Amabile’s body of research cited
above which suggests intrinsic motivation is critical for creative motivation.
Despite the substantive evidence citing the importance of intrinsic motivation
and the detrimental effects of extrinsic motivation on creativity, there is a
contrary opinion asserted by Eisenberger (e.g. Eisenberger and Cameron,
1996; Eisenberger and Shanock, 2003). Eisenberger and Cameron (1996)

27
suggest that review of the research shows “reward for a high degree of
creative performance can be used to increase generalised creativity”
(p1162). This debate reached its height in the late 1990’s but is still ongoing. A
reasonable summary is that whilst the importance of intrinsic motivation for
creativity still has many advocates, it is now agreed by even these that under
some conditions rewards can increase creativity (e.g. Eisenberger and
Shanock, 2003; Amabile and Kramer, 2007).
Organisational Effects on Creative Motivation
Problem solving in an organisational context is by definition subject to extrinsic
motivators due to the overarching imperative to achieve organisational
objectives. Many of these factors are not synergistic and hence serve to
inhibit creativity even though they are designed to improve individual
motivation to perform. This suggests that creativity in organisational settings
will be naturally lower than other domains (i.e. those without overarching
objectives like profitability, return on investment and/ or market share).
Assink (Assink, 2006) identifies a range of factors that inhibit organisational
innovation capability. The most relevant of these to this study include the
reticence to innovate when an existing product is successful, problems with
managing the risks associated with innovation, excessive bureaucracy,
change resistance, an inability to unlearn, obsolete mental models, difficulty
in forecasting innovation returns, and compliance focussed organisation
culture. In fact, many authorities (including Basadur, 2004; Berkshire, 1995;
Boeddrich, 2004; S. Gryskiewicz & Taylor, 2003; Leavy, 2002; Mumford, 2000;
Proctor, 1999; Välikangas & Jett, 2006) have asserted that organisations either
purposefully or inadvertently decrease creativity (via punitive personal
28
accountability, overzealous risk management, conservative capital allocation
procedures or inflexible corporate governance initiatives). For example
Elsbach & Hargadon (2006) argue that overwork and high pressure for
performance are significantly damaging to professional creativity and
advocate recuperation periods of so called “mindless” work to improve this.
Amabile et al (2002) found that creativity is reduced under the time pressure
experienced by many in organisations. Wells et al.’(2006) presented data
showing a significant correlation between creativity and deviance in
organisations. Dewett (2004) goes as far as suggesting that an employee’s
willingness to take risks is the key determinant of individual creativity.
There seems to be a tendency in organisations to rank appropriateness of
solutions over novelty (T. M. Amabile, 1998; Kirton, 1984b, 1991; Matherly &
Goldsmith, 1985). Managers can potentially improve creative motivation in
their organisations with specific management interventions that increase the
potential for intrinsic motivation, utilise synergistic extrinsic motivators and/ or
insulate problem solvers from extrinsic motivation effects (Mumford, 2000;
Mumford & Others, 1997; Mumford, Scott, Gaddis, & Strange, 2002; Oldham &
Cummings, 1996)
Forbes and Domm (Forbes & Domm, 2004) agreed that “external” controls
designed to increase productivity could diminish involvement and creativity.
In this context “external” controls equate to supervision and management
push for completion. Despite this they showed how creativity and productivity
can increase under circumstances where there is high involvement: They
assert that some extrinsic rewards can enhance personal involvement, and
hence creativity.

29
Overall the body of research above suggests that creativity in organisational
settings will be naturally lower than other domains. Thus there is a significant
and relevant problem for managers related to managing creativity: what to
do given that the majority of management approaches just do not seem to
work for creativity because they are fundamentally and essentially extrinsic in
their motivation approach? How to motivate employees to complete tasks
with creativity when intrinsically motivated employees are not available?
Despite the current focus on the importance of organisational creativity and
innovation, many managers in organisational settings often appear unwilling
or unable to change the extrinsic motivators inherent in their organisations.
And as outlined above switching from extrinsic motivation modes of
traditional management to more intrinsically based motivation seems to be
the antithesis of good management for many. Management of employees is
just not perceived by managers to be compatible with increased autonomy
support in many cases.
These managers find it inappropriate to give up budgets, monitoring, key
performance indicators, commissions, bonuses, promotions, transfers,
demotions and reprimands. Replacing these things with recognition, pre
approved resources independent of performance and job redesign for
increased curiosity, interest and self expression just to improve creativity is not
acceptable. Even at a very simple level many managers believe that they
should direct employees to do a job, and that they are not supposed to
surrender to their employees the choice of which task or project might interest
them the most. Many of these managers interact with their employees on the
basis that it is not appropriate to enrich work in order to ensure that it is
enjoyed: if work is enjoyable that is a bonus not a requirement.
30
The potential for supportive supervisors and leaders to enhance creativity
during organisational problem solving has also been examined by a variety of
researchers (including T. M. Amabile et al., 2004; Baer, Oldham, & Cummings,
2003; Basadur, 2004; Boerner, Eisenbeiss, & Griesser, 2007; Clapham, 2000; de
Jong & Hartog, 2007; Egan, 2005a, 2005b; Forbes & Domm, 2004; S.
Gryskiewicz & Taylor, 2003; Mumford et al., 2002; Oldham & Cummings, 1996;
Reiter-Palmon & Illies, 2004; Sosik, Avolio, & Kahai, 1997; Välikangas & Jett,
2006).
The common finding in this body of research is that employee creativity
increases in an organisational context where supervisors are perceived to be
supportive towards creativity and to some extent are able to shield
employees somewhat from the overarching extrinsic achievement
imperatives demanded by the organisation. Viewed through the lens of
creative motivation, supportive supervisor behaviour can be conceptualised
a synergistic extrinsic motivator because being supportive to creativity may
include recognising creative individuals and providing resource support. This
suggests that increases in employee creativity may only occur when the
employee is already intrinsically motivated to be creative. Enhancing
creativity further and/ or managing non-intrinsically motivated employees
requires a consideration of some other factors that can affect creative
motivation including mood.
Mood Effects and Creativity
Much of the prior research that relates to mood and creativity is based on
how mood disorders are correlated with creativity (for a summary see
Rickards and Runco et al. 2008, see also Amabile and Barsade et al. 2005).

31
This work tends to consider creativity over an individual’s lifetime rather than
on a moment to moment basis. However Vosburg’s work considers the
potential for mood to effect creativity in the short term. Vosburg (1998)
provides evidence that consistency of problem solving approach is not
normal: mood can affect creativity in complex ways during individual
problem solving activities. Vosburg used contrived means to affect moods
and then measured the resulting difference in creative output.
Vosburg empirically validated that mood affects creativity in a more complex
manner that previously accepted. Specifically positive mood does not
unconditionally facilitate creative problem solving and negative mood does
not unconditionally hinder creative problem solving. Vosburg found that
under certain conditions negative mood can facilitate, and positive mood
can inhibit, creative problem solving. To some extent both employee mood
responses and/or their sensitivity to organisational controls is important to their
creativity.
Kaufmann and Vosberg (Kaufmann & Vosburg, 1997) also showed that mood
effects were correlated with creative production in an unexpected way: in
their study negative mood seem to enhance creativity and positive mood
seemed to diminish creativity. This suggests that negative moods are more
likely to activate or sensitise the individual to their natural intrinsic motivators.
Recent work by Friedman et al (Friedman, Forster, & Denzler, 2007) has
connected problem solving context with mood interactions. However
Kaufmann and Vosburg cite earlier research by other researchers (including
Isen, Means, Patrick, & Nowicki, 1982) that correlates creativity production
positively with mood and apparently conflicts with their own findings. They

32
suggest that feedback is a key factor in how mood effects moderate
creative production.
Feedback in the two studies cited above was inherent in the task. In another
study a form of feedback was provided by a supervisor rather than inherently
from the task. George and Zhou (George & Zhou, 2007) investigated creativity
and mood relationships in the context of supervisor supportive behaviour.
They found that positive and negative mood both facilitated creativity when
supervisors were perceived to be supportive.
A possible conclusion from the research findings relating mood and creativity
is that an individual’s creative motivation is not constant during a specific task
because an individual’s mood can change. It is also plausible that these
factors (both motivation and mood) may be moderated by an individual’s
cognitive style.
Cognitive Style
Kirton’s (Kirton, 1976) Adaption Innovation inventory (KAI) is a validated
measure of cognitive style relevant specifically to employees operating in
organisational contexts. KAI has been validated empirically by many
researchers (Fleenor & Taylor, 1994; Foxall & Hackett, 1992; Goldsmith &
Matherly, 1987a; Keller & Holland, 1978; Riley, 1993; Taylor, 1989). There are
now more than 350 peer reviewed studies that utilise KAI. As such it can be
considered a consistent, reliable and valid measure of cognitive style.
Despite evidence of KAI’s reliability, cognitive style is not a definitively
predictive construct. Cognitive style influences problem solving and decision
making, rather than determining it. In a review published in the Psychological
Bulletin, Kozhevnikov (Kozhevnikov, 2007) outlined these issues and the

33
conjecture over the correct dimensions of cognitive style in the following
statements:
…At the present time, many cognitive scientists would agree that
research on cognitive styles has reached an impasse. In their view,
although individual differences in cognitive functioning do exist, their
effects are often overwhelmed by other factors, such as general
abilities and cognitive constraints that all human minds have in
common. The paradox of the current situation is that interest in building
a coherent theory of cognitive styles remains at a low level among
researchers in the cognitive sciences; however, investigators in
numerous applied fields have found that cognitive style can be a
better predictor of an individual’s success in a particular situation than
general intelligence or situational factors. In the field of industrial and
organizational psychology, cognitive style is considered a fundamental
factor determining both individual and organizational behaviour (e.g.,
Streufert & Nogami, 1989; Sadler-Smith & Badger, 1998; Talbot, 1989)...
(Page 464).
For this thesis, KAI was used rather than other more general models of
cognitive style (e.g. Sternberg, 1990; Bruner, 1990) because of the specific
relevance of KAI to business creativity. That is KAI has face validity with
business contexts.
The KAI scale was synthesised from three independent problem solving
related scales for originality, efficiency and conformity preferences. The
originality scale measures preference for ideas that are unorthodox, novel or
unusual. The efficiency scale measures preference for detailed, orderly and

34
appropriate behaviour. The conformity scale measures acceptance of
prevailing rules, organisational paradigms and group norms. Kirton (1976)
constructed the scale by selecting different numbers of self report questions
from each of the subscales in order to sort the normal population into a
normal distribution. KAI score is determined from 32 question responses. It
ranges from 32-160. The overall population exhibits a mean KAI of 96 with a
standard deviation of 13, normally distributed. KAI is seems stable regardless
of age, career, industry or nationality. Ethnicity and gender seem to be
independent to KAI.
Individuals with KAI score greater than 96 are called Innovators by Kirton.
Individuals with lower KAI scores are called Adaptors. According to Kirton’s
descriptions, Innovators are motivated make large changes and break
prevailing rules, norms and paradigms. Adaptors apparently prefer making
incremental changes that remain within organisational expectations. This
results in Adaptors being more conforming. Kirton perhaps pejoratively
describes Innovators as “preferring to do things differently” and Adaptors as
“preferring to do things better” (Kirton, 1976).
Other research supports Kirton’s assertions that Innovators and Adaptors solve
problems differently. Hammerschmidt (Hammerschmidt, 1996b) showed that
cognitive style determined a role preference for either designing or
implementing solutions. Adaptors were less likely to propose radical solutions,
and they were more likely to completely implement known problem solutions.
In Hammerschmidt’s studies they studied rules, often in total silence and then
constructed detailed written plans. Innovators were observed in
Hammerschmidt’s experiments to disregard rules, move around more and
challenge constraints like time limits. Comments from the Innovators in

35
Hammerschmidt’s studies included “rules were made to be broken” and “he
who cheats first cheats best” (see Hammerschmidt, 1996a pages 68-69).
The reasons for the differences in problem solving behaviour between
Innovators and Adaptors may lie in the some other reported factors. For
example, Innovators tend to exhibit higher levels of self esteem (Goldsmith &
Matherly, 1987c; Houtz, Denmark, Rosenfield, & Tetenbaum, 1980; Keller &
Holland, 1978). In these studies self esteem was defined as an individual’s
sense of importance or self worth. Note that this is not necessarily only a
positive trait – inappropriately high levels of self worth can be exhibited as
arrogance or overconfidence.
Other research suggests that Innovators are more tolerant of ambiguity (Keller
& Holland, 1978) and optimistic (Wunderley, Reddy, & Dember, 1998) when
compared to Adaptors. Innovators are also more likely to solve problems with
an internal locus of control (Engle, Mah, & Sadri, 1997; Houtz et al., 1980; Keller
& Holland, 1978; Luck, 2004; Tetenbaum & Houtz, 1978). These characteristics
would suggest that Innovators are more likely to be motivated to produce
operationalised creativity options in response to the extrinsic motivators
prevalent in organisations. Within an organisation there is often a general
requirement to overcome management controls in order to be creative in
many problem solving and decision contexts. This can result in creativity being
perceived as non-conforming or deviant. Thus Innovators are often perceived
to be more creative (or at least willing to be more creative) within
organisations because of their preference for rule breaking.
However, these differences between Innovators and Adaptors do not
necessarily imply one is inherently more creative than the other. Kirton

36
asserted that neither cognitive style is inherently more capable of creativity
(Kirton, 1978b). Indeed whilst Amabile defined creativity skills to include
generic divergent thinking, other researchers (Basadur, 1997; Sand, 2003)
have asserted that generic convergent thinking processes are also required
for organisational creativity. How do we reconcile equality between
Innovators and Adaptors in terms of inherent creativity, with the differences
between the two styles just discussed, particularly as manifested in business
contexts.
The resolution of these potentially conflicting considerations perhaps comes
from Amabile’s three factor model: Adaptors may be equally creatively
skilled as Innovators, but more sensitive to organisational requirements for
conformity. That is, Adaptors may have equal potential to be creative in
organisations, but perhaps are affected more by the dampening of extrinsic
motivational factors inherent in organisations generally. It is possible that in
certain organisational contexts Adaptors could be more motivated to be
creative than Innovators – for example in certain research organisational
cultures where avoiding creativity might be perceived as non-conforming. In
such organisations Adaptors may actually end up being more creative than
Innovators, even though the organisational culture is a dominant extrinsic
motivating factor.
Differences in creative production due to sensitivity to motivational factors
may not be the only difference between Innovators and Adaptors. Optimism,
locus of control and tolerance for ambiguity could be expected to affect
preferences for operationalised creativity options. Fluent and flexible
alternatives have greater chances for success, but are less efficient than less
creative, simple, tried and true methods. Original alternatives may lead to

37
potentially superior results, but be perceived as more risky (and therefore
more ambiguous in terms of value) due to their novelty when compared to
non-creative proven options. Any of these operationalised creativity
alternatives may be perceived as relatively divergent or rule-breaking. In
summary, exploration of the difference between innovators and adaptors in
creativity is an important stimulus for this thesis. However, regardless of which
aspects of operationalised creativity are more relevant to an individual with a
given cognitive style, decisions involving operationalised creativity are also
potentially subject to framing effects.
Framing Effects
Framing effects relate to changes in preferences that occur due to the way
that a decision is presented. Framing may naturally apply when an individual
considers solving a problem creatively. Creativity could be framed in many
ways: divergence from past, rule breaking/disruption, additional work,
rareness/uniqueness, novelty, self expression, interest, enjoyment, humour,
change, threat, required, rational or emotional in character. Depending on
perspective, these frames can be perceived positively or negatively: for
example “rule breaking” may be a negative frame for an auditor or law
enforcement official but positive for a teenager or entrepreneur.
Levin et al (I. G. Levin, Schneider, & Gaeth, 1998) provide a useful typology
that describes three framing effects:
• Framing under uncertainty;
• Attribute framing;
• Goal behaviour framing;

38
The independence of these effects has subsequently been validated (Levin I
P, Gaeth G J, Schreiber J, & Lauriola M, 2007). Framing effects research
implies that these psychological perceptual biases are generic and
universally applicable. Thus we can consider creativity during problem solving
as affecting risk, or as a desirable/ undesirable attribute or as behaviour with
the potential to impact on goal achievement (i.e. how does being creative
potentially assist with solving the problem at hand). Each different type of
framing effect and its potential relationship to creativity is outlined below.
Creativity and Framing under Uncertainty
Levin et al. (1998) cite 29 studies regarding “risky choice framing” (framing
under uncertainty) and assert that this kind of framing is a “standard” framing
effect (p151). The most significant of these is Tversky and Kahneman (1981).
Tversky and Kahneman showed that individuals may exhibit a preference
reversal when equivalent choices are framed positively or negatively.
Essentially they showed that rationally equivalent choices were subject to
perceptual distortions based on how the choice was presented. When
subjects were presented with a choice that had a smaller sure gain or a
larger risky gain, they tended to favour the sure gain (even if the expected
returns adjusted for risk from the choices were equivalent). Significantly if the
same choice was presented in terms of its costs rather than gains, with a sure
smaller cost or a larger risky cost, subjects tended to choose the larger risky
cost. This led Tversky and Kahneman to determine a hierarchy of weightings
that related to choices involving the potential for gain and loss. Typically
subjects were most sensitive to loss, then sensitive to risk and least sensitive to
gains. A form of the classic risky choice is shown below:

39
Suppose that you are in charge of a government immunisation program to deal with an impending outbreak of a rare disease that is expected to kill 600 people. Two alternative programs have been proposed to combat the disease. Which program would you favour if costs for each program are the same?
A If Program A is adopted 200 people will be saved
B If Program B is adopted there is a 1/3 chance 600 people will be saved and a 2/3 probability that no-one will be saved
When this problem was presented as framed above the majority of people
choose option A. This is predictable for choices of this type because the
problem is framed in terms of gains (i.e. lives saved). When the problem is
reframed in the form below Tversky and Kahneman found a significant
reversal of preference:
Suppose that you are in charge of a government immunisation program to deal with an impending outbreak of a rare disease that is expected to kill 600 people. Two alternative programs have been proposed to combat the disease. Which program would you favour if costs for each program are the same?
A If Program A is adopted 400 people will die
B If Program B is adopted there is a 1/3 chance no one will die and a 2/3 probability that 600 people will die
Option B apparently becomes more preferable when the choice is framed in
terms of loss (i.e. deaths) rather than gains. Levin et al cite 22 other papers
that support Tversky and Kahneman’s findings (see I. G. Levin et al., 1998).
This choice of certainty versus risky gain may have an analogous application
to individual problem solvers: an individual may perceive that attempting to
be creative involves a risk of failure compared to a “non-creative” problem
solving approach. However attempting to be creative may offer the potential
of a higher utility solution.
Consider the problem of walking through a minefield at night without the
benefit of specialist mine detection equipment. Whilst this is not strictly a

40
business problem traversing a mine field can be representative of business
problems like identifying the best candidate for a job, choosing which new
product to develop or negotiating with a fickle customer. How does one walk
through a mine field in conditions like these? Consider this problem literally in
its specific context…
Analysis suggests that the shortest point through a mine field is a straight line.
However, a straight line through the mine field is certain to fail if the designer
of the mine field is competent and committed because such a designer
would want to harm enemies who were otherwise unaware of the presence
of mines. The most radical alternative to a straight line is a random path with
twists and turns. Such a path is highly likely to detonate a mine as the more
distance travelled within the field, the more likely that a mine will be
encountered and activated. “Carefully” walking through a mine field
(presumably some kind of tiptoe stepping) seems to be both a tautology and
an oxymoron and in either event unlikely to produce a successful problem
solving outcome.
Of course the insight solution is to ensure that one traverses the mine field last
(i.e. after watching someone else makes it through successfully). This solution is
ideal if it takes advantage of an externality like watching how the enemy
traverses the mine field first from a hidden position, or a wandering goat
somehow safely makes its way through. This insight solution typically requires
either a redefinition of the problem or some kind of lateral thinking
provocation to discover.
In a business context the decision about how to approach problems like the
mine field problem can be framed in different ways by managers. One

41
framing perspective might be that attempting lateral approaches does not
guarantee success and typically costs more to attempt. As a result problem
solvers may be pressured to “get on with it” rather than look for more radical
(creative) solutions. Creativity as framed in this context is an uncertain,
negative thing to be avoided.
However another manager may focus on the importance of attempting
lateral/ insight based approaches as a way of finding breakthrough solutions
with superior potential utility. Such a manager may encourage employees to
spend some of their time at work each week on problems that capture their
interest in order to increase the potential for highly creative, valuable
solutions. Creativity in this context is framed as an uncertain, positive thing to
be supported (this is similar to choosing to buy a lottery ticket: the cost is low
and the gains whilst unlikely are potentially very high). Thus regardless of the
environment or the problem solver’s cognitive style it is possible that being
creative while problem solving can be framed under uncertainty as either
something to avoid (negative) or something to cultivate (positive).
Creativity and Attribute Framing
Levin et al. (1998) cite many other studies that relate to framing phenomena
which disconfirm the preference reversals asserted by Tversky and Kahneman
(1981). Levin et al. (1998) propose that these disconfirming studies are
actually subject to either Attribute framing or Goal behaviour framing. This is
relevant because creativity can be framed as an attribute for a problem
solution.
Attribute framing relates to how different weighted aspects of a decision
choice may be prioritised. Shafir asked subjects to choose or reject one of

42
two options for a variety of problem contexts (including a child custody
battle, preferred holiday destination, university course enrolment and lottery
prizes). Each choice was described qualitatively in terms of several different
elements (for example holiday destinations were described by their weather,
beaches, hotel, water temperature, and nightlife). In all cases one option was
“enriched” in that all of its elements were relatively good or relatively poor
relative to the “impoverished” option (which was of average quality for all
elements). Shafir showed that there is a tendency for subjects to weight
desirable elements as more important when choosing and undesirable
elements more important when rejecting. This resulted in subjects tending to
choose enriched options over impoverished options when selecting. However
when rejecting subjects tended to reject enriched options over impoverished
options: thus the enriched option was both the most preferred and least
preferred option depending on whether the decision was framed as “select”
or “reject”.
Attribute framing effects apply to perceptions of products, decisions about
optional extras and consent for surgical procedures. For example 75% lean
meat is apparently better tasting and less greasy than 25% fat meat (Levin I P
& Gaeth G J, 1988); yoghurt that is 0% fat is apparently more attractive than
100% fat free yoghurt (Janiszewski C, Silk T, & Cooke A D J, 2003); internet
hosting packages are more highly valued when they include extra services
rather than being discounted in price (Stibel J, 2005); pizzas and cars tend to
be more expensive and feature laden when customers start with fully loaded
product bundles and delete options rather than building up from scratch
(Levin I P, Schreiber J, Lauriola M, & Gaeth G J, 2002; Park, Sung Youl, &
Deborah, 2000); and more patients consent to surgery when discussed in

43
terms of survival rather than mortality rates (Marteau T M, 1989; Wilson D K,
Kaplan R M, & Schneiderman L J, 1987).
This attribute framing phenomenon is important for creative motivation in
problem solving. Creative solutions to problems can be seen as positive
attributes or negative attributes. Consider the common problem that a city
commuter must solve in order to get to work: The introduction of a new public
transport system may be seen by some commuters as bad because it
invalidates past traditions (“I preferred the old days when there were trams
because they were cheap and safe”). However other travellers may evaluate
the new system as a progressive step forward (“I like the fact that the new
public transport is better for the environment”). In addition commuters will
frame the decision to use the new public transport as either an opportunity to
choose (“Now I have a new alternative to get to work”) or an opportunity to
reject (“Why would I give up my car to travel by public transport?”).
In the absence of concerted framing effects, individual problem solvers will
decide using one of four possible attribute frames: negative/ choose;
positive/ choose; negative/ reject; positive/ reject. The existing literature
would suggest that most commuters that use the positive/ choose frame
would favour the new transport system. Similarly commuters using the
negative/ reject frame would be expected not to favour the new system.
Interestingly in Australia the Public Transport Users Association’s website which
seems to want to enhance public transport usage presents public transport in
terms of its costs relative to a car (see Public Transport Users Association,
2007).

44
During problem solving an individual may stop to consider whether or not
creative solution is really worth it. Their decision is likely to be dependent of
their perception of creativity as a positive or a negative and whether or not it
is a given or an option. Thus creativity can be considered as an attribute of a
problem solution. However creativity is “unnatural” for some (in that it clashes
with preferences for conformity and efficiency). In these situations creativity
may be exhibited by conforming in a novel way. Thus the decision to be
creative can be conceived of as a behavioural change and therefore
subjected to a third kind of framing effect.
Creativity and Goal Behaviour Framing
Levin et al. (1998) cite other studies that result in different framing effects
when behavioural change is considered. Goal behaviour framing relates
decisions to change and take a new action in order to achieve a goal. For
example Meyerowitz and Chaiken (Meyerowitz & Chaiken, 1987) reported
that women were more likely to undertake self breast examinations when
they were told of the risks of not doing the self examination rather than when
they were advised of the benefit. In other words people tend to take more
notice of potentially negative consequences when choosing to modify their
behaviour.
It would be expected that Goal behaviour framing and attribute framing
would operate in similar manners because they both relate to decisions
involving potential gain. However, goal behaviour framing and attribute
framing effects are at first confounding because each influences toward
apparently paradoxical decision outcomes. Both are based on the idea of
getting something. Typically attribute framing relates to getting something

45
more in a product that costs more, whereas goal behaviour framing is based
on getting a benefit at the cost of doing something new. The apparent
paradox comes from the fact that attribute framing seems to propose
positives are more important when choosing attributes, whereas goal framing
seems to propose negatives are more important when choosing whether or
not change behaviour.
The key to this paradox is to include the reference points inherent in the two
scenarios: attribute framing requires a comparison of the attribute against a
money cost. Various researchers cited above for their framing effects
research have suggested that an attribute’s perceived value is typically more
concrete in a decision maker’s mind than money. Because of this in attribute
framing situations, the attribute’s positive aspect is most important. However
this is reversed in the case of a change in behaviour – where having to do
something different and new is seen as a significant cost, so the focus
becomes on whether or not it is worth making the effort.
So a choice between options with both attribute benefits and money costs is
typically framed positively with a focus on gain because the attributes are
more significant generally than the money. A choice between options with
both attribute benefits and behavioural change is typically framed negatively
with a focus on reducing the change cost because the change is more
significant generally than the benefits. This comes about because people are
more sensitive to loss than to gain (see Kahneman D, Knetsch J L, & Thaler R H,
1990): they cannot make an adequate comparison between attributes and
money, so the largest factor gets focus. They can adequately compare
change and benefits, so the focus switches to costs.

46
This argument suggests that goal behaviour framing and attribute framing are
similar effects with different reference points. This assertion is significant to this
study because how creativity framing effects are investigated determines
whether or not they will manifest as relatively positive or negative attributes or
goal behaviours. For example if a choice involving a creative output of a
problem solving effort is proposed, creativity becomes an attribute and
attribute framing applies. However as an input to problem solving the
decision as to try to be creative is a goal behaviour framing situation.
Goal behaviour framing was ultimately determined to be outside of the
scope of this study due to the difficulty with designing methods to test
hypotheses relating to these effects and the potential for equivalence with
attribute framing depending on reference points.
Literature Review Summary
The literature review above highlights some of the complexity and wide range
of studies relating to creativity: Creativity has been considered through the
lenses of different definitions, subjective and objective assessment,
measurement approaches, cognitive style, environmental effects, mood and
framing effects. This literature review is comprehensive, but necessarily limited
in its scope to prior research that is more directly relevant to the studies to be
developed in this thesis.
Areas for Investigation
The literature above provides the basis for determining new areas of
investigation which link creative motivation, cognitive style and framing

47
effects. A more general justification for combining these areas is implied by
Latham and Pinder (2005) in their extensive review of motivation theory. These
authors assert that motivation, needs, values, traits, cognition, environment
and affect mutually interact.
Based on needs, values, and the situational context, people set goals
and strategize ways to attain them. They develop assumptions of
themselves and of their identity. This too affects their choice of goals
and strategies. (p 498)
However, motivation studies commonly differentiate process questions (e.g.
goals, expectancies and choices) from content questions (e.g. needs and
drives) (Vecchio, Hearn and Southey, 1996). Given the focus of this thesis on
creative process and choice, Latham and Pinder articulate well why a
process approach to creative motivation has been chosen over other
possible motivational constructs (e.g. needs):
…Needs based theories explain why a person must act: they do not
explain why specific actions are chosen in specific situations to obtain
specific outcomes. (p488)
The next section introduces specific rationales for each of the three studies.
Rationale for Study 1: Variable Creative Motivation during Problem
Solving
Amabile’s body of research related to creative motivation suggests that an
individual’s creative motivation is the result of a combination of extrinsic and
intrinsic motivators. As explained in the literature review above extrinsic
motivators in general diminish creative motivation even if designed to

48
encourage creativity, unless they are synergistic. Synergistic extrinsic
motivators act to increase creativity, but only in the presence of intrinsic
motivation.
Neither Amabile’s research nor any other work on creative motivation has
specifically examined how creative motivation may change during problem
solving efforts within a business context. Whilst the extrinsic and intrinsic
motivators may not change significantly during a specific instance of business
problem solving, it seems likely that the problem solver’s perception of how
successfully they are progressing is likely to impact their motivation levels.
At the start of the problem solving effort the individual does not know for sure
(but hopes) that the problem can be solved. At some later stage after
investment in the task of problem solving the individual will have progressed
to either a conclusion or a preparedness to continue problem solving. One of
the two possible conclusion outcomes is if the problem is solved (success). The
other occurs if the problem solver determines that it is not worth continuing
their efforts (failure). These two outcomes represent a perceived level of
certainty on the part of the problem solver about the success or failure of their
efforts. As well, the problem solver may determine that there is more work to
do.
That is, when problem solvers pause to review their progress, they can make a
determination about their problem solving progress. Assuming that they do
decide they are neither successful nor failed in their efforts, they may
continue problem solving. There is no reason that the problem solver should
assume that no progress or indeed that positive progress has been made.
Problem solvers can variously perceive that a solution is closer or further away.
49
This perception affects their motivation (consciously and/ or unconsciously) to
be creative in their problem solving efforts. Thus during problem solving, the
individual’s perception of outcome certainty progresses from completely
uncertain (at the start of the task) to ultimate success or failure (at the
conclusion of the task). General motivational research supports this theory.
For example Atkinson’s (1974) expectancy x value theory asserts that the
potential for success or failure is a significant factor of total motivation.
Vroom’s (Vroom, 1964) expectancy theory also suggests that motivation will
vary during problem solving: Expectancy is defined by Vroom as an
individual’s belief that a level of effort will result in the potential for success.
Given that an individual is likely to monitor progress during problem solving, it
is expected that this feedback will affect their perception of expectancy. In
other words if problem solving is progressing at least satisfactorily expectancy
(and therefore motivation) should increase. As setbacks (temporary or
otherwise) are perceived by the problem solver expectancy should
decrease, causing overall motivation to decrease as well.
Whilst expectancy theory suggests overall motivation will change during
problem solving, it does not necessarily follow that creative motivation will
similarly vary. Variable creative motivation is however indirectly supported by
a variety of researchers investigations into mood and creativity (George &
Zhou, 2007; Kaufmann, 2003; Kaufmann & Vosburg, 1997; Vosburg, 1998),
which showed that mood affects creativity in complex ways. Whilst these
researchers did not investigate creative motivation and mood (rather
creative production), Amabile’s three factor theory of creativity would
suggest that mood interacts with creative production via motivation as it is
unlikely that mood will affect stable domain knowledge and creativity skill.

50
Overall these findings suggest that creativity could vary during problem
solving due to variable mood effects or more general motivation expectancy
effects. How creative motivation may vary systematically is not explained at
all by any of the above research however. In order to conceptualise this, it is
necessary to reconsider extrinsic and intrinsic motivation effects.
In particular the paper by George and Zhou cite above investigated how
supervisor support affects mood and creativity. Supervisor support is a form of
synergistic extrinsic motivation. George and Zhou findings regarding the
relationship between extreme moods (good and bad) and creativity support
the concept of mood being related to creative motivation. If an extreme
mood is indicative of high involvement of the individual trying to solve the
problem at hand it is reasonable to conclude that the problem solver is
intrinsically motivated. Supervisor support would synergistically support the
individual’s intrinsic motivation to be creative and thereby result in increased
creativity.
Supervisor behaviour and creativity has been examined in a number of
studies (Oldham & Cummings, 1996; Redmond, Mumford, & Teach, 1993;
Tierney et al., 1999). The general findings of these studies and Amabile’s
findings regarding the importance of intrinsic motivators for creative
motivation support the potential for creative motivation to be a specific
example of Deci and Ryan’s (Deci & Ryan, 1985b, 2000a, 2000b) self
determination theory.
Linking Creative Motivation and Self Determination Theory
Deci and Ryan’s work asserts two important conclusions regarding motivation
that suggest how creative motivation can vary. Firstly they suggest that in the

51
presence of tangible extrinsic motivators, intrinsic motivation diminishes.
Secondly they suggest that there is a hierarchy of motivation effects
processed by individuals (Vallerand, 2000). This hierarchy of motivational
effects may equally apply to creative motivation.
If this is true then it would suggest that once an individual satisfies extrinsic
motivational requirements, intrinsic motivators may become more important.
If so individual creative motivation would be expected to potentially increase
during successful problem solving efforts as organisational imperatives to
resolve the problem situation were perceived by the problem solver to be
managed. It is likely that this simple relationship is too simple however due to
the potential impacts on creative motivation from cognitive style.
Linking Creative Motivation and Cognitive Style
Christensen-Szalanski (1978) asserted that problem solvers are influenced by
characteristics of the decision task, the decision problem itself, the decision-
making environment, and the characteristics of the decision maker. Kwang et
al. (2005) and Van Den Broeck et al.(2003) show relationships between KAI
and values. The next section suggests how the idea of variable creative
motivation due to hierarchical motivation sensitivities may be moderated by
cognitive style2
2 As argued earlier, KAI was chosen over other general measures of cognitive style
because of its face validity for business contexts and its robust empirical base.
. Kirton’s (1996) definition of cognitive style was used in
preference to other definitions of cognitive style because it relates explicitly to
innovation in organisations and it has substantive empirical validation.

52
Martinsen (1994) investigated links between cognitive style and motivation for
insight problems. Such problems require significant creativity to solve. Whilst
Martinsen did not use KAI as his scale for cognitive style (instead using
Kauffman’s (1979) theory of Assimilative and Explorative cognitive styles which
is qualitatively similar to KAI but less empirically validated) his findings suggest
that cognitive style and probability of success combine to produce creative
motivation. He also suggested that there are situations where cognitive style
and success probability can combine to produce ‘over motivation’ for
creativity. This suggests that neither Adaptors nor Innovators will be necessarily
superior in producing creative outputs.
Martinsen’s over motivation is in partial contrast to Cummings’ (1997) findings
that more paradigm breaking ideas were produced in a business context
when problem solvers were KAI Innovators. This is supported by Casbolt (1984)
who found that Adaptors were in general less creative on two tasks than
Innovators. It appears that Adaptors exhibit different creative outputs to
Innovators – Adaptors are less likely to propose radical solutions even though
they may be just as creatively skilled as Innovators.
Much of the past KAI research implies that because an individual’s cognitive
style is constant then their approach to problem solving can be expected to
be non-dynamic (though no specific research that examines this was found
during literature reviews). In practice we observe in colleagues and ourselves
varying levels of motivation during problem solving efforts, particularly in
organisational contexts. We also observe how some colleagues tend to focus
on the potential upside in a problem solving situation, whereas others seem to
be very sensitive to failure risks and consequences.

53
Introducing Creative Resolve Response
This suggests the potential of examining the relationship between creative
motivation and cognitive style. To this end, I define Creative Resolve
Response (CRR) as the pattern of variation that applies to individual creative
motivation during problem solving. It is hypothesised that CRR suggests how
creative output may change due to changes in creative motivation levels
that naturally occur during problem solving efforts.
CRR can also be conceptualised as the pattern of creative motivational
response obtained by combining various motivational modes. I develop this
idea further below and present it graphically in Table 1 below. The CRR
motivation modes I define in this table are primary, secondary, solution,
coping and emergency. Each of these is categorised in terms of creative
motivation.
I propose that in each of these mutually exclusive modes the problem solver
will be more sensitive to either extrinsic or intrinsic motivators. The CRR model
assumes that modes of motivation are variously activated during problem
solving (usually unconsciously) as a subject’s perception of certainty about
solving (or failing to solve) a problem changes.
A subject’s “primary motivation mode” may be indicative of their natural
response to organisational imperatives. CRR predicts that a problem solver is
expected to prioritise either intrinsic or extrinsic motivations initially when
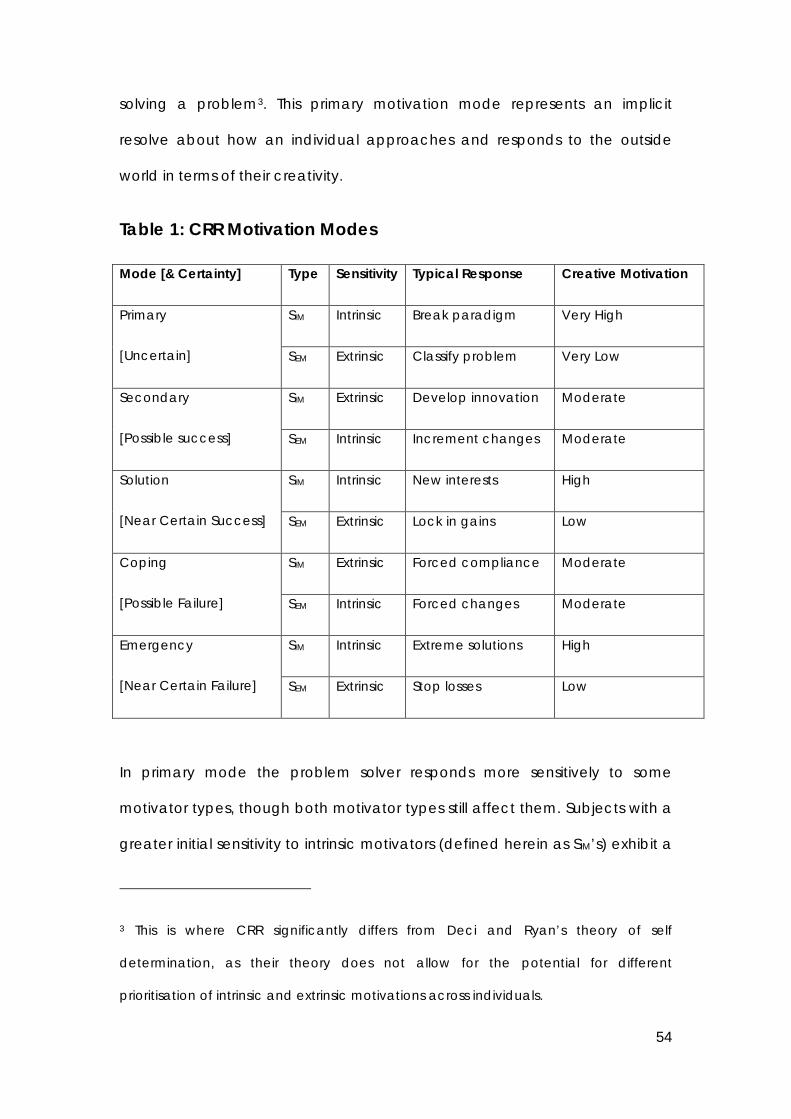
54
solving a problem3
Table 1: CRR Motivation Modes
. This primary motivation mode represents an implicit
resolve about how an individual approaches and responds to the outside
world in terms of their creativity.
Mode [& Certainty] Type Sensitivity Typical Response Creative Motivation
Primary
[Uncertain]
SIM Intrinsic Break paradigm Very High
SEM Extrinsic Classify problem Very Low
Secondary
[Possible success]
SIM Extrinsic Develop innovation Moderate
SEM Intrinsic Increment changes Moderate
Solution
[Near Certain Success]
SIM Intrinsic New interests High
SEM Extrinsic Lock in gains Low
Coping
[Possible Failure]
SIM Extrinsic Forced compliance Moderate
SEM Intrinsic Forced changes Moderate
Emergency
[Near Certain Failure]
SIM Intrinsic Extreme solutions High
SEM Extrinsic Stop losses Low
In primary mode the problem solver responds more sensitively to some
motivator types, though both motivator types still affect them. Subjects with a
greater initial sensitivity to intrinsic motivators (defined herein as SIM’s) exhibit a
3 This is where CRR significantly differs from Deci and Ryan’s theory of self
determination, as their theory does not allow for the potential for different
prioritisation of intrinsic and extrinsic motivations across individuals.
55
primary intrinsic motivation mode. Primary extrinsic motivation mode is
exhibited by subjects with greater initial sensitivity to extrinsic motivators
(defined herein as SEM’s). SIM’s are expected to be more motivated to be
creative when operating in primary motivation mode because of their
reduced sensitivity to extrinsic motivators.
Creative Motivation with Increasing Success Certainty
Figure 1 further elaborates the CRR model. It suggests that when primary
motivations are satisfied, the opposite type of motivation (extrinsic or intrinsic)
emerges as more important. The problem solver then acts in “secondary
motivation mode”. In this mode the problem solver becomes more sensitive
to motivators that are the opposite of their primary type: SIM’s become more
sensitive to extrinsic motivators and SEM’s become more sensitive to intrinsic
motivators. This prompts SIM’s creative motivation to decrease and SEM’s
creative motivation to increase. Both problem solver types advance to their
final motivation mode when they have satisfied both intrinsic and extrinsic
motivators relating to the problem at hand.
This occurs as problem solving continues to progress towards near certain
success. At this point both intrinsic and extrinsic motivations are essentially
managed, so the problem solver switches to “solution motivation mode”.
Solution mode is similar to primary mode for both SIM’s and SEM’s, only less
extreme in terms of overall motivator sensitivity. At high levels of success
certainty SIM’s declare the problem solved and move onto more interesting
issues to satisfy intrinsic motivators. In contrast, at the same levels of success
certainty SEM’s refuse to “push their luck further” and proceed to lock in the
gains achieved from prior problem solving efforts.

56
Figure One: Creative Motivation and Increasing Success
Creative Motivation with Increasing Failure Certainty
Now consider a scenario where a subject’s problem solving efforts appear to
fail soon after commencement on a particular task. In this situation the
subject must respond to their failure and their implicit creative resolve may
falter. The problem solver changes from primary mode to “coping motivation
mode” to deal with the impact on their self image. In coping mode, primary
motivations are subjugated in order to achieve some kind of success: SEM’s
are forced to respond to their failure so far by making some changes. So even
though they don’t want to be more creative, they act more creatively and
appear more motivated to diverge. Whilst this has the potential to satisfy their
intrinsic motivations, it may not satisfy their primary (extrinsic) motivations.
SIM’s are similarly forced to respond to their failure so far: they exhibit more
compliant approaches to solving the problem because their convention
breaking approaches have backfired. Similar to SEM’s above, this has the
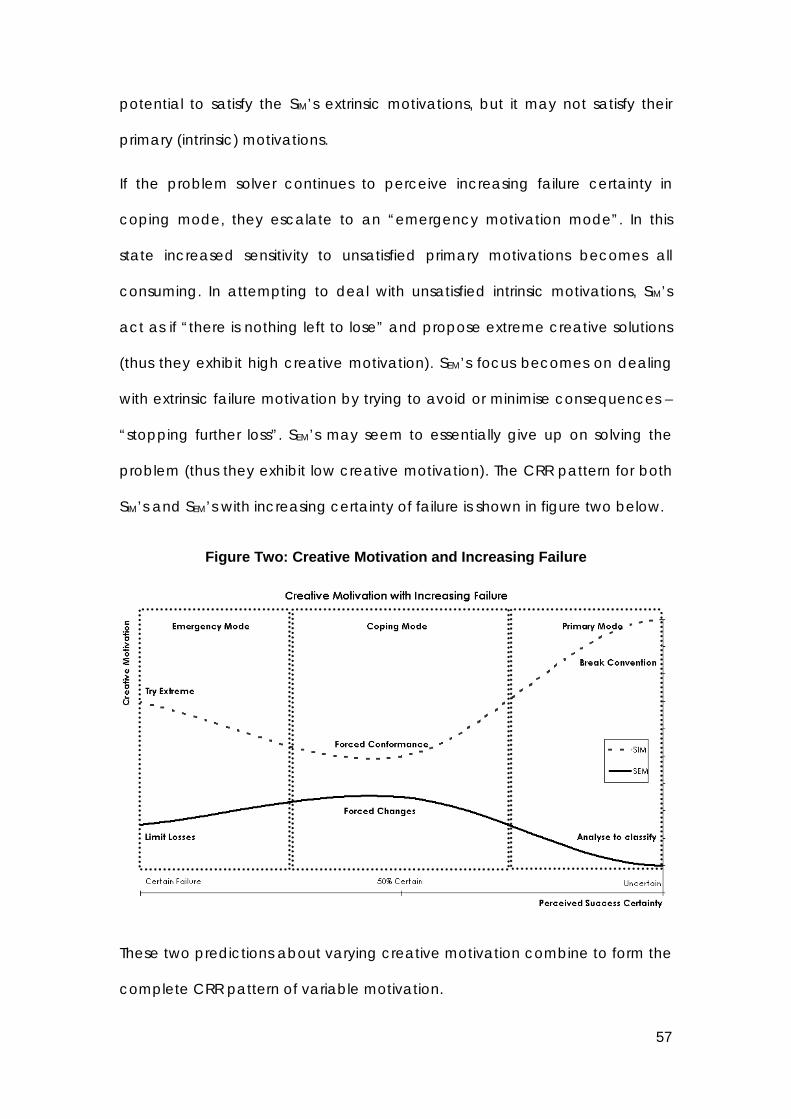
57
potential to satisfy the SIM’s extrinsic motivations, but it may not satisfy their
primary (intrinsic) motivations.
If the problem solver continues to perceive increasing failure certainty in
coping mode, they escalate to an “emergency motivation mode”. In this
state increased sensitivity to unsatisfied primary motivations becomes all
consuming. In attempting to deal with unsatisfied intrinsic motivations, SIM’s
act as if “there is nothing left to lose” and propose extreme creative solutions
(thus they exhibit high creative motivation). SEM’s focus becomes on dealing
with extrinsic failure motivation by trying to avoid or minimise consequences –
“stopping further loss”. SEM’s may seem to essentially give up on solving the
problem (thus they exhibit low creative motivation). The CRR pattern for both
SIM’s and SEM’s with increasing certainty of failure is shown in figure two below.
Figure Two: Creative Motivation and Increasing Failure
These two predictions about varying creative motivation combine to form the
complete CRR pattern of variable motivation.

58
There is no scale for determining SIM’s and SEM’s, nor any test proposed by this
study. However, I propose that these notional conceptual problem solving
types can be theoretically related to Kirton’s KAI (1976). In general it can be
hypothesized that KAI scores can be related to factors that may affect
creative problem solving progress. For example, KAI scores have been found
to positively correlate with self esteem (Goldsmith & Matherly, 1987b, 1987c;
Houtz et al., 1980; Keller & Holland, 1978). According to Shukla & Sinha (1993)
self esteem is a pre requisite for creativity. This requirement is likely to be even
more relevant in a business context where extrinsic motivation factors tend to
inhibit creativity. Individuals with low self worth and sense of importance are
unlikely to be creative when the organisation climate restricts creativity and
rewards other behaviours. Equally, individuals with a high self worth and sense
of importance are likely to act in accordance with their intrinsic motivations,
including those that motivate creativity. So the correlation found between KAI
orientation and self esteem suggests that Innovators are more likely to be
motivated to be creative in business contexts. There are other findings to
support increased creative motivation from Kirton’s Innovators.
KAI scores have been found to positively correlate with tolerance for
ambiguity (Keller & Holland, 1978) and locus of control (Engle et al., 1997;
Houtz et al., 1980; Keller & Holland, 1978; Luck, 2004; Tetenbaum & Houtz,
1978). Wunderley L J et al. (1998) also found a correlation between optimism/
pessimism and Innovation/ Adaption respectively. Again these studies would
suggest that in business contexts, Innovators are more likely to be motivated
to be creative because of their increased tolerance for ambiguity, internal
locus of control and optimism.
59
Some studies, (Foxall, 1986; Foxall & Bhate, 1999; Foxall & Hackett, 1994; Foxall
& Szmigin, 1999) have failed to find significant correlations between KAI and
functional management preferences. It could be that these results were
overwhelmed by the influences of other more significant factors like domain
specific knowledge or that both Adaptor and Innovator problem solvers can
produce equivalent results in solving the specific problems in the situations
studied. Equally it may also be that motivation effects such as those
postulated by the CRR model were significant. This possibility is now
elaborated.
Adaptor Creative Resolve Response
Adaptor problem solvers are characterised by preferences for efficiency and
conformity (1978a; Kirton, 1980; 1984a; 1988). Thus they focus on creative
solutions that offer appropriateness over novelty. They exhibit relatively lower
self esteem, pessimism and a tendency towards external locus of control.
Adaptors and SEM’s self evidently would seem to have the same primary
motivation mode: sensitivity to extrinsic motivators.
If the Adaptor perceives that early progress toward a solution occurs during
problem solving, it is asserted that their extrinsic motivation to achieve results is
diminished relative to their intrinsic motivation to develop novelty. To some
extent their early success overcomes their natural pessimism. It is also asserted
that the Adaptor’s extrinsic motivations to complete the problem solving task
and conserve scarce resources remain constant. Hence there is a net
incremental increase in creative motivation (a move toward response),
though this increase is expected to be slight.

60
Assuming that the Adaptor perceives that their good progress continues and
a successful solution becomes more likely, it is asserted that their extrinsic
motivation to complete the problem solving exercise resumes dominance
and the Adaptor’s natural pessimism resumes. This can be conceptualised as
the Adaptor believing that continuing to “push their luck” is not worth the
“risk” of continuing to be creative when a successful result is so close. The net
effect is a decrease in the Adaptor’s creative motivation. In effect the
Adaptor wants to lock in the gains they now see as highly likely and do not
value any further investment in novelty.
Alternatively, if an early setback during the problem solving task is perceived
by the Adaptor, then their extrinsic motivators to conformity and diligence
become dominant. The Adaptor’s anxiety to resolve the situation increases.
This forces the Adaptor to try and develop more novel approaches to
manage the problem because of their increasing pessimism. Thus creativity
increases as a move away response like a kind of last resort. So creativity
increases slightly as a result of pessimism! If setbacks are perceived to
continue, the Adaptor’s extrinsic motivation considerations related to
resource scarcity and their external locus of control influence them to
terminate problem solving efforts. The Adaptor’s pessimism becomes a self
fulfilling prophecy requiring that the Adaptor to prevent further failure. In
effect they reduce their creativity to prevent further losses by implementing a
“stop loss” position.
Thus the pattern of Adaptor creative motivation has parallels in theory with SEM
CRR described above. The Adaptor’s creative motivation at any moment
during problem solving is determined by the interplay of extrinsic and intrinsic
motivators that change as the certainty of outcome becomes more or less
61
likely. The success or failure of the outcome is not important, only the change
in perceived certainty. For the Adaptor creative motivation is expected to be
at its lowest during both maximum outcome uncertainty and maximum
outcome certainty. The Adaptor’s creative motivation (whilst still relatively low
compared to the Innovator) is expected to be at a maximum when outcome
uncertainty is neither zero nor maximum. Innovators exhibit a characteristically
different response even though they can be subject to the same extrinsic
motivating factors in similar problem solving situations.
Innovator Creative Resolve Response
Innovator problem solvers are characterised by preferences for originality
(novelty) and non-conformity. They exhibit relatively higher self esteem,
optimism and a tendency towards internal locus of control. Thus Innovators
focus on creative solutions that offer novelty over appropriateness. Innovators
and SIM’s self evidently would seem to have the same primary motivation
mode: sensitivity to intrinsic motivators.
If early progress toward a solution is perceived by the Innovator, it is asserted
that their intrinsic motivation to be original is somewhat sated by their early
success and creative motivation decreases slightly. The extrinsic motivation to
achieve results becomes a focus especially as the success in organisational
context often brings resources to continue being creative. Recall that
Amabile (1997) identified continuing resource supply and recognition for
creative efforts as synergistic extrinsic motivators. Successful problem solvers in
organisations are often told to “keep doing what you are doing”, thus gaining
creative rights and escaping the accountability oversight which acts as an
extrinsic de-motivator for creativity.

62
In this case, the potential for increased resources, recognition, increased
creative rights and decreased monitoring motivate the Innovator to conform
by completing the problem solving task. The easiest way for the Innovator to
do this is to use their (so far) successful creative approach to the problem and
proceed without additional novelty. Hence there is a net incremental
decrease in creative motivation (a move toward response), and this
decrease may be large if the Innovator is sufficiently forward thinking.
Assuming that the Innovator perceives that their good progress continues and
a successful solution becomes even more likely, then their extrinsic motivation
to complete the problem solving exercise wanes. The Innovator is not
characterised by diligence or efficiency and optimistically assumes that the
problem is essentially solved. The Innovator rationalises that as success is
already certain, at least some of the impending rewards of success can be
“spent now”. Thus the Innovator’s intrinsic motivation for originality again
dominates and creative motivation increases even though it is no longer
required to solve to problem. In effect the Innovator “gets carried away
experimenting” with some more interesting and original non-conforming
solutions. The Innovator’s high self worth and sense of importance validate this
freedom to experiment after having “effectively” solved the problem even
though the result may not be completely achieved yet.
Alternatively, if an early setback during the problem solving task is perceived
by the Innovator, then their extrinsic motivators to conformity and diligence
become dominant. In extreme cases the Innovator is subjected to oversight
and controls that reduce their autonomy and available resources to be
creative. Even the threat of such interventions will have the potential to de-

63
motivate the Innovator from continuing to be creative, as asserted by Kubes
(1992).
Thus after a perceived initial partial setback the Innovator experiences real or
imagined external pressure to stop experimenting and make measurable
progress towards a solution. This perceived pressure forces the Innovator to
conform to the dominant paradigm for managing the problem and their
creativity decreases to allow the Innovator to retain some of their autonomy.
In a sense the Innovator is forced to “get with the program”.
If setbacks are perceived to continue after this conformance, then the
Innovator’s intrinsic motivation for originality and their internal locus of control
influence them to resume novel problem solving efforts. Their internal locus of
control and optimism causes them to assume (rightly or wrongly) that they will
be able to solve the problem eventually. The Innovator in extreme cases may
go into an “emergency mode” to retain their creative autonomy. In effect
they perceive that they have nothing to lose and everything to gain by trying
everything they can think of to solve the problem. The result is that their
motivation to be creative increases by a large amount.
Thus the pattern of Innovator creative motivation is similar to that proposed as
SIM’s CRR detailed above. Additionally Innovator creative motivation is
determined by the same interplay of extrinsic and intrinsic motivators as the
Adaptor, but the Innovator’s CRR is expected to be the mirror image of the
Adaptor’s. The Innovator’s creative motivation is at its highest during both
maximum outcome uncertainty and maximum outcome certainty. The
Innovator’s creative motivation is at its lowest when outcome uncertainty is

64
neither zero nor maximum. SIM’s and SEM’s from the CRR model seem to extend
understanding of Kirton’s Innovator and Adaptor cognitive styles4
KAI theory suggests that the Adaptors will have a lower creative motivation
initially than an Innovator for any problem due to differences in preferences.
CRR suggests the same prediction, but goes further suggesting that an
individual’s creative motivation varies during a specific problem solving task
based on the perception of progress (or lack thereof) where progress relates
to increasing outcome certainty. Figure 3 above combines all of these
theorised changes in creative motivation during problem solving into a single
diagram.
.
4 It is important to note that neither CRR nor KAI purport to measure creative ability, merely the
preferred style or pattern of creativity. Using KAI four groups of problem solvers can be
conceptualised: relatively creative Innovators, relatively non-creative Innovators, relatively
creative Adaptors and relatively non-creative Adaptors. These extremes relate to creative
output, not to creative motivation. Analogous groups can be conceptualised for CRR.

65
Expected Outcome
Creative Motivation
InnovatorAdaptor
100% Bad100% Good 50% Bad50% Good Uncertain
Freedom to Create
Consolidate Gains
Disrupt for Advantage
Nothing to Lose
Constrained by Firm
Lock in Gain
Consider small changes
Analyse to simplify
Forced to change
Stop further loss
Figure Three: Creative Resolve Response and KAI
In summary, an individual’s preference for the Innovator or Adaptor cognitive
style is considered to be robust and consistent over time, in contrast with task
motivation which can change significantly and frequently. CRR suggests that
primary motivation mode is constant over time but includes variations in
creative motivation based on task progress. It seems reasonable therefore to
conclude that there is some meta model capable of relating cognitive style,
creative motivation and task progress. CRR is such a model. The first of three
studies in this research examined whether or not the proposed pattern of
motivation was able to be validated. The next sections discuss the rationale
for Study 2 and Study 3.

66
Rationale for Study 2: Framing Effects and Operationalised
Creativity
As the literature review demonstrated, the operation of framing effects in
organisations is well documented. However, the body of research related to
framing effects has not examined whether or not specific framing effects
apply differently to decisions involving creativity. Given the link between
motivation and creativity, also discussed in the literature review, it seems
reasonable to consider that framing effects may be influential in creative
contexts.
For example, one way that framing effects and creativity might interact is
that each of the various operationalised creativity options could invoke
framing effects. This would mean that framing may naturally apply when an
individual considers solving a problem creatively even if the decision is not
presented in a way that normally invokes framing effects. Consider a problem
solver who has developed two potential solution options to resolve a business
issue. Assume that one option is perceived as relatively non-creative and the
alternative includes some kind of operationalised creativity. The problem
solver must compare the two options and decide which to try and
implement.
If the operationalised creativity option in question includes fluency, the
problem solver may perceive impacts on risk considerations. Thus risk based
framing effects may automatically affect the decision being made even
though it was presented in a form that would not normally be associated with
risk based framing. Alternatively the operationalised creativity option
considered in the decision may include originality or novelty characteristics.

67
Such characteristics clearly have attribute biases (potentially positive and
negative) that advertisers seek to exploit with slogans like “new and
improved” and “established for more than 100 years”. Again attribute based
framing may automatically apply to decisions involving operationalised
creativity options. Even if operationalised creativity does not automatically
invoke framing effects, it may moderate how they apply to decisions.
The literature relating to framing effects implies that they are universally
applicable across two dimensions. The first universal applicability of framing
effects relates to domain: framing effects are conceptualised within the
literature as being non-specific to any set of domains. That is framing effects
apply in the same way in contexts ranging from investment decisions to
health choices to purchase evaluations to determinations about the best
partner (see the examples in Levin et al. (1998) for the range of different
domains that framing effects have been tested in). It may be that framing
effects apply differently to decisions involving operationalised creativity
because motivation applies differently to creativity. The effects of
operationalised creativity options cited in the previous paragraph could also
apply to decisions that were presented with risk or attribute framing effects
included. In these situations operationalised creativity could enhance or
diminish the primary framing effect presented in the decision regardless of
whether it was risk or attribute based.
In summary, Study 2 therefore investigates some of the above questions. It
considers whether or not framing effects are universally applicable to
decisions involving operationalised creativity. The research includes an
investigation into the potential for operationalised creativity options to invoke
or distort risk based and attribute framing. Study 3 relates to how framing

68
effects may apply differently for individuals when making decisions involving
operationalised creativity options.
Rationale for Study 3: Framing Effects and Cognitive Style:
Framing effects are usually conceptualised within the literature as being
uncorrelated with personality, cognitive style, age, ethnicity or gender.
However, it is conceivable through simple thought experiments to hypothesise
how personality, for example, could moderate framing effects. Extroverted
and introverted individuals are affected likely to by goal behaviour framing
effects differently when making choices about the value of active listening in
a sales training environment. More technical views of personality imply
framing effects variability to a greater extent.
Jung’s Judging types and Perceiving types (Jung, 1926) exhibit different
preferences for decisiveness (Judging types tend to feel anxiety if they
hesitate and risk losing an opportunity, whereas Perceiving types feel anxiety
if they act prematurely and lock themselves in to an otherwise avoidable
failure). Perhaps the difference in orientation to action is a manifestation of
different sensitivity to risk based framing effects. Jung’s Thinking and Feeling
types (Jung, 1926) are by definition likely to respond to attribute framing
effects differently. Consider two managers of different personality types in this
dimension trying to decide about an initiative that involves increasing
profitability by retrenching staff. The Thinking type manager would be
expected to be far more influenced by profitability concerns because that
personality type is characterised as making decisions by utilising objective,
impersonal criteria. The Feeling type manager would be expected to take
greater consideration of the effects of retrenching workers because that
69
personality type is characterised as making decisions based on how the
decisions affect others or using more subjective criteria. Whilst personality,
age, ethnicity and gender may all moderate framing effects, of particular
relevance to this research is how cognitive style might moderate decisions
involving operationalised creativity and framing effects.
One area of cognitive style that has not been investigated is how Adaptors
and Innovators respond to framing effects. Kirton’s investigations into
cognitive style specifically relate to individual problem solving and decision
making approaches within an organisational context. Clearly organisations
can create very different frames within which to view operationalised
creativity. Choosing to try and implement the more creative option within a
business context does not guarantee success and typically costs more to
attempt than a more traditional approach. As a result problem solvers may
be pressured to “get on with it” rather than opt for more radical (creative)
solutions. Thus problem solvers in business contexts can be constrained by
extrinsic performance requirements to minimise costs and maximise certainty,
which in turn reduce creativity.
For many business problems, compliance with the paradigm that proposed
the problem is easier if the individual stops wasting time and effort to
implement insight solutions and instead gets on with resolving the problem in
the simplest, most direct way. Operationalised creativity in this context is an
uncertain, negative thing to be avoided. Individual problem solvers that
comply with this paradigm exhibit low originally, high conformance and high
perceived efficiency in the choices they make about which options to
implement. These characteristics are associated with low KAI scores – i.e.
Adaptors.

70
However some problem solvers in organisation contexts are affirmed by
choosing to break both the formal and informal business rules and either insist
or persist in looking for insight solutions to typical business problems. In other
organisations employees are supported when they spend time looking for
and choosing to implement operationalised creativity solutions. Such problem
solvers exhibit higher originality, lower conformance and lower perceived
efficiency in their decisions relating to which potential solution options to
implement. Creativity in this context is an uncertain, positive thing to be
supported (this is similar to choosing to buy a lottery ticket: the cost is low and
the gains whilst unlikely are potentially very high). Such characteristics are
associated with high KAI scores - Innovators.
Thus regardless of the environment or the problem solver’s cognitive style it is
possible that being creative while problem solving can be framed under
uncertainty as either something to avoid (negative) or something to cultivate
(positive). It seems reasonable to hypothesize that in situations where
creativity is framed under uncertainty, Innovators will be more predisposed to
be creative than Adaptors and thus framing effects will apply differently to
individuals with different cognitive styles. This is a similar hypothesis to the
expected non-universality of framing effects across domains: operationalised
creativity and/ or cognitive style may automatically invoke and/ or moderate
different risk based framing effects depending on whether or decisions are
presented with or without inherent framing effects. The same considerations
could apply to decisions involving (or with the potential to involve) attribute
framing effects.
As presented previously in the example relating to choices about public
transport, creative solutions to problems can be seen as positive attributes or

71
negative attributes. Innovators are likely to consider creativity as a positive
attribute due to their preference for originality and non-conformance.
Adaptors are likely to consider creativity as a negative, especially when they
perceive that being creative reduces efficiency. Thus it seems likely that
cognitive style may play a significant part in the attribute framing of creativity.
In summary, from the previous sections it is apparent that Innovators and
Adaptors may respond significantly differently to different framing effects.
Compared to Adaptors, Innovators may be less concerned with risk, tend to
value desirable attributes more and respond to beneficial outcomes
communications more readily in some contexts (where originality and non-
conformance are involved) and less in others (where conformity and
efficiency are involved). Decisions involving creativity may be automatically
framed differently by individuals with different cognitive styles even when
framing effects might not normally be present. Finally for decisions involving
both operationalised creativity and framing effects, individual cognitive style
may moderate the framing effects present. Study 3 seeks to improve the
understanding of how cognitive style, operationalised creative and framing
effects interact in individual decision making.
By way of conclusion Figure Four overviews how the three studies combine in
pursuit of a better understanding of how to enhance business creativity.

72
Figure Four: Theoretical Overview
Whilst business creativity is not necessarily produced as a linear process, the
following description steps through the models linearly for ease of
comprehension. When there is an opportunity for creativity in business, a
problem solver’s intrinsic motivation and extrinsic motivation combine to
produce creative motivation. Intrinsic motivators are creativity enhancing
and extrinsic motivators are generally creativity diminishing, except for
synergistic extrinsic motivators (which in the presence of intrinsic motivation
are additionally creativity enhancing). The amount of creativity is proportional
to the creative motivation, relevant domain knowledge and creativity skill of
the problem solver. The problem solver’s efforts manifest to produce creative
outputs. These outputs can be measured in terms of the degree of fluency,
flexibility, divergence and rule breaking. Conveniently these measures can be
conceptualised as non-mutually exclusive types of creativity. The amount of
each type produced is moderated by the problem solver’s cognitive style.

73
Cognitive style also impacts on the decision that the problem solver makes
about which potential problem solving solutions are preferred for
implementation. This decision is further moderated by framing effects related
to both the way that the decision is presented and the kinds of creativity
involved.

74
Chapter 1: Creative Resolve Response; How Changes in
Creative Motivation Relate to Cognitive Style
Purpose – This paper introduces a new phenomena related to creative
motivation called Creative Resolve Response (CRR). CRR predicts how
creative motivation will vary during problem solving.
Design/methodology/approach –66 MBA students were asked to respond at
random intervals during different class problem solving activities. Participants
were asked to rate on two preset scales their perceived certainty of solving
the problem successfully and creativity level required. Mean creativity
required responses were calculated for subgroups with different cognitive
style ranges at each outcome certainty level. T-tests were used to determine
significant differences between various means.
Findings – The results suggest that creative motivation will vary systematically
as a problem solver’s perception of problem solving progress increases in a
wax-wane-wax pattern.
Research limitations/implications – Post hoc analysis suggested that
potentially confounding effects related to problem heterogeneity, learning
effects, environment, group interaction and interviewer response bias were
not significant. However the relatively small sample size and limited scope of
the problem activities suggests that further research is required to establish the
extent that the findings can be generalised.
Practical implications – CRR promises a new form of extrinsic control for
managers to enhance creativity via extrinsic motivation. The author makes

75
suggestions on how managers may enhance creativity by influencing
employees to reconsider their perceived level of problem solving progress.
Originality/value – This paper links expectancy theory, cognitive style and
creative motivation and provides an alternative approach to directly trying to
motivate employees to be more creative.
Keywords Creativity, Motivation, Cognitive style, Management, Group work
Paper Type Research paper
Introduction
Enhancing organisational creativity to foster greater innovation is a challenge
for contemporary managers. This study investigates how creative motivation
waxes and wanes during problem solving tasks as a function of perceived
outcome certainty. Understanding how creative motivation varies during
problem solving is useful for managing creativity. If creative motivation varies
systematically and predictably during problem solving, then managers can
affect creative motivation (and therefore creativity) by influencing
employees’ perceptions of their problem solving progress. This indirect
approach would help to overcome the limitations of traditional management
interventions which fail to enhance creative motivation because they act as
extrinsic motivators.
Generally, creativity during organisational problem solving is enhanced by
intrinsic motivational factors, though some extrinsic factors (so called
synergistic extrinsic motivators) may also assist (Amabile, 1997a; Hennessey &

76
Amabile, 1998; Polland, 1994; Ruscio et al., 1998). Synergistic extrinsic factors
include recognition and continued resources to support creative endeavours.
These factors are generally only effective in enhancing creativity in individuals
where intrinsic creative motivation is also prevalent. Other extrinsic factors (i.e.
those that are not synergistic, including money rewards) tend to inhibit
creativity by decreasing creative motivation. How an individual responds to
extrinsic factors may be explained by their cognitive style.
Kirton (1976) classifies the range of individual problem solver cognitive
styles in an organisational context in the Kirton Adaption–Innovation Inventory
(KAI). The KAI scale provides a reliable and consistent measure of cognitive
style that has been empirically validated by many subsequent researchers
(including Fleenor and Taylor, 1994; Foxall and Hackett, 1992; Goldsmith and
Matherly, 1987a; Keller and Holland, 1978; Riley, 1993; Taylor, 1989). KAI is
comprised of three independent problem solving constructs: originality is the
preference for generating many novel, unusual or unorthodox ideas;
efficiency is the preference for detailed, appropriate and orderly behaviour;
and conformity is the tendency to conform to prevailing rules or group norms.
The scale allows an individual to be classified as an Innovator or Adaptor from
their responses to 32 questions. A KAI survey produces a KAI score ranging
from 32–160 with a mean of 96 and standard deviation of 13. A KAI score
increases with an Innovation preference and decreases with an Adaption
preference.
Despite the body of evidence that KAI is stable over time, there are
concerns about the validity of cognitive style as a predictive construct and
about which dimensions of cognitive should be preferred. Kozhevnikov
explains this as follows:

77
…At the present time, many cognitive scientists would agree
that research on cognitive styles has reached an impasse. In
their view, although individual differences in cognitive
functioning do exist, their effects are often overwhelmed by
other factors, such as general abilities and cognitive constraints
that all human minds have in common. The paradox of the
current situation is that interest in building a coherent theory of
cognitive styles remains at a low level among researchers in the
cognitive sciences; however, investigators in numerous applied
fields have found that cognitive style can be a better predictor
of an individual’s success in a particular situation than general
intelligence or situational factors. In the field of industrial and
organizational psychology, cognitive style is considered a
fundamental factor determining both individual and
organizational behaviour (e.g. Streufert & Nogami, 1989; Sadler-
Smith & Badger, 1998; Talbot, 1989) and a critical variable in
personnel selection, internal communications, career guidance,
counselling, and conflict management (Hayes & Allinson, 1994).
In the field of education, researchers have argued that
cognitive styles have predictive power for academic
achievement beyond general abilities (e.g. Sternberg & Zhang,
2001). (Kozhevnikov, 2007 p.464)
…In summary, the most significant contribution of applied
studies was the expansion of the cognitive style concept to
include constructs that operate in relation to complex cognitive
activities. As a consequence, one distinguishing characteristic of

78
these studies is the use of self-report questionnaires as a method
of style assessment, reflecting a new tendency in cognitive style
research to study conscious preferences in organizing and
processing information. Another significant contribution of these
studies is the examination of external factors that affect the
formation of an individual’s style. The studies converged on the
conclusion that cognitive styles, although relatively stable, are
malleable, can be adapted to changing environmental and
situational demands, and can be modified by life experiences.
The main problem with these studies is the same as I discussed
earlier—the explosion of style dimensions: The number of styles
was defined by the number of applied fields in which styles were
studied. As a consequence, the cognitive style construct
multiplied to include decision-making styles, learning styles, and
personal styles, without clear definitions of what they were or
how they differed from the “basic” cognitive styles identified
previously. The set of theoretical questions regarding the
mechanisms of cognitive styles, their origins, and their relation to
other psychological constructs remained open. (page 470)
Much of the past Kirton Adaption–Innovation (KAI) research implies that
because an individual’s cognitive style is constant then their approach to
problem solving can be expected to be consistent. However Vosburg (1998)
and Kaufmann (2003) provide evidence that consistency in an individual’s
problem solving approach is not normal. For example, mood can affect
creativity in complex ways. One reason that creative motivation (and
79
therefore creative output) is likely to change during a problem solving task is
that the problem solver perceives that the likelihood of problem solving
success or failure changes during the task. At the start of the problem solving
effort, the individual does not know for sure (but hopes) that the problem can
be solved. At some later stage, after there has been an investment of time
and effort in the task of problem solving, the individual will have progressed to
either a resolution or a preparedness to continue problem solving. It seems
reasonable to expect that such progress evaluations also affect creative
motivation.
Martinsen (1994) investigated links between cognitive style and problem
solving motivation. Martinsen’s findings suggest that cognitive style and
probability of success combine to produce motivation. Whilst Martinsen did
not use KAI as his scale for cognitive style (instead using Kauffman’s (1979)
theory of Assimilative and Explorative cognitive styles), his work is relevant to
KAI-based studies because Kauffman’s and Kirton’s definitions of cognitive
style are very similar.
Martinsen (1994) also suggested that there are situations where cognitive
style and success probability can combine to produce ‘over motivation’ for
creativity. This over motivation results in a reduction of creative output and
suggests that in this situation neither cognitive style will be superior in
producing creative outputs. This is in partial contrast to Cummings’ (1997)
findings that more paradigm-breaking ideas were produced in a business
context when problem solvers were KAI Innovators. Adaptors exhibit different
creative outputs to Innovators. For example, they are less likely to propose
radical solutions, even though they may be as creative as Innovators.

80
Other researchers have investigated other aspects of cognitive style that
relate indirectly to creativity. For example, KAI scores have been found to
positively correlate with self esteem (Goldsmith and Matherly, 1987b; Houtz et
al., 1980; Keller and Holland, 1978). In these studies, self esteem referred to the
individual’s sense of importance or self worth. According to Shukla and Sinha
(Shukla and Sinha, 1993), self esteem is a prerequisite for creativity. This
requirement is likely to be even more relevant in a business context where
extrinsic motivation factors tend to inhibit creativity. Individuals with low self
worth and sense of importance are unlikely to be creative when the
organisation climate restricts creativity and rewards other behaviours.
Alternatively, individuals with a high self worth and sense of importance are
likely to act in accordance with their intrinsic motivations, including those that
motivate creativity. So the correlations found between KAI orientation and
self esteem suggest that Innovators are more likely to be motivated to be
creative in business contexts, supporting Cummings’ (Cummings, 1997)
findings described above.
There are other findings to support increased creative motivation from
Kirton’s Innovators. KAI scores have been found to positively correlate with
tolerance for ambiguity (Keller and Holland, 1978) and locus of control (Engle
et al., 1997; Houtz et al., 1980; Keller and Holland, 1978; Luck, 2004; Tetenbaum
and Houtz, 1978). Wunderley et al., (Wunderley et al., 1998) also found a
correlation between optimism/pessimism and Innovation/Adaption
respectively. These studies are support for the proposition that in business
contexts, Innovators are more likely to be motivated to be creative because
of their increased tolerance for ambiguity, their internal locus of control, and
tendency for optimism. In contrast to the above studies’ confirmation of the

81
correlations between KAI score and personal characteristics, other studies
(Foxall and Bhate, 1999; Foxall and Hackett, 1994; Foxall and Szmigin, 1999)
have failed to find significant correlations between KAI and functional
management preferences. This lack of correlation is initially confounding
when cognitive style could reasonably be expected to have a significant
influence in these studies. It could be that these results were overwhelmed by
the influences of other more significant factors such as domain specific
knowledge or other circumstances whereby the specific problem enabled
both the Adaptor and Innovator to produce equivalent problem solving
results.
The Creative Resolve Response (CRR) model
This paper proposes an alternative explanation to these conflicting findings
called Creative Resolve Response (CRR). In this model, Adaptors and
Innovators change their creative output during problem solving due to
changing levels of creative motivation. At least to some extent this allows
both styles of problem solver to tackle the same kinds of problems, though
they would be expected to approach the problems in systematically different
ways. Such a conclusion is supported by Vosburg (Vosburg, 1998).
Vosburg empirically validated that mood affects creativity in a more
complex manner that previously accepted. This finding is important to the
CRR model as mood effects may be correlated to motivation changes during
problem solving. Specifically, positive mood does not unconditionally
facilitate creative problem solving and negative mood does not
unconditionally hinder creative problem solving. Vosburg found that under

82
certain conditions negative mood can facilitate, and positive mood can
inhibit creative problem solving. Subsequently, Amabile (Amabile et al., 2005)
has asserted that positive mood assists with creativity in business contexts,
despite the apparent conflicts with Vosburg (Vosburg, 1998) and also
Kaufmann and Vosburg (Kaufmann and Vosburg, 1997). The difference
between Vosburg’s and Amabile et al.’s findings appears to be related to the
level of analysis: Vosburg was testing specific (in specific problem solving
contexts), whereas Amabile’s teams were looking for longer timescale
correlations. The CRR model is more comparable to Vosburg’s work due to
the shorter reference timescale involved (i.e. CRR describes creative
motivation within a single problem solving context rather than over a longer
period in an organisational setting).
Specifically the CRR model is based on the assumption that high self
esteem (defined as high self worth and sense of importance), and internal
locus of control and optimism enable more sensitivity to intrinsic motivation (as
is the case for Innovators). The corollary is that low self esteem, external locus
of control and pessimism would suggest more sensitivity to extrinsic motivation
(as is the case for Adaptors). The model incorporates expectations of how
Adaptors’ and Innovators’ sensitivity to intrinsic and extrinsic motivational
factors can change with their perception of outcome certainty, which then
subsequently changes their overall creative motivation.
Adaptor CRR
Adaptor problem solvers are characterised by preferences for efficiency and
conformity. They exhibit relatively lower self esteem, pessimism and a

83
tendency towards external locus of control. Thus Adaptors focus on creative
solutions that offer appropriateness over novelty.
In order to understand the Adaptor’s CRR, consider the following
hypothetical problem solving attempt. Upon commencement of a problem
solving task in which the Adaptor holds an unbiased view, the individual can
be assumed to be completely uncertain about the potential for a good or
bad result. Whilst this view may change quickly, both the CRR model and KAI
theory suggest that the Adaptor will have lower creative motivation initially
than an Innovator for solving the problem. In Figure 1, this corresponds to the
points for each line at 0% expected outcome certainty.
If the Adaptor perceives that early progress towards a solution occurs, it is
asserted that their extrinsic motivation to achieve results is diminished relative
to their intrinsic motivation to develop novelty (which remains low relative to
the Innovator). To some extent their early success overcomes their natural
pessimism. It is also asserted that the Adaptor’s extrinsic motivations to
complete the problem solving task and conserve scarce resources remain
constant. Hence there is a net incremental increase in creative motivation (a
move towards potential gains response), though this increase is expected to
be slight. In Figure 1, this corresponds to the point for the solid line at 50%
expected outcome certainty on the left side of the graph.
Assuming that the Adaptor perceives that their good progress continues
and a successful solution becomes more likely, it is asserted that their extrinsic
motivation to complete the problem solving exercise resumes dominance
and the Adaptor’s natural pessimism resumes. This can be conceptualised as
the Adaptor believing that continuing to ‘push their luck’ is not worth the ‘risk’
of continuing to be creative when a successful result is so close. The net effect

84
is a decrease in the Adaptor’s creative motivation. In effect the Adaptor
wants to lock in the gains they now see as highly likely and do not value any
further investment in novelty. In Figure 1, this corresponds to the point for the
solid line at 100% expected outcome certainty on the left side of the graph.
Alternatively, if the Adaptor perceives an early setback during the
problem solving task, then their extrinsic motivators towards conformity and
diligence become dominant. The Adaptor’s anxiety to resolve the situation
increases. This forces the Adaptor to try and develop more novel approaches
to manage the problem because of their increasing pessimism. Thus creativity
increases as a move away response – a kind of last resort. So creativity
temporarily increases as a result of pessimism. In Figure 1, this corresponds to
the point for the solid line at 50% expected outcome certainty on the right
side of the graph.
If setbacks are perceived to continue, the Adaptor’s extrinsic motivation
considerations, related to resource scarcity and their external locus of control,
influence them to terminate problem solving efforts. The Adaptor’s pessimism
becomes a self-fulfilling prophecy, requiring the Adaptor to prevent further
failure. In effect they reduce their creativity to prevent further losses by
implementing a ‘stop loss’ position. In Figure 1, this corresponds to the point
for the solid line at 100% outcome certainty on the right side of the graph.
Thus the pattern of Adaptor creative motivation (their CRR) is determined
by the interplay of extrinsic and intrinsic motivators that change as the
certainty of an outcome becomes more likely. The success or failure of the
outcome is not important, only the change in perceived certainty. For the
Adaptor, creative motivation is at its lowest during both maximum outcome
uncertainty and certainty. The Adaptor’s creative motivation (whilst still

85
relatively low compared to the Innovator) is at a maximum when outcome
uncertainty is neither zero nor maximum. Innovators exhibit a characteristically
different response, even though they are subject to the same extrinsic
motivating factors.
Innovator CRR
Innovator problem solvers are characterised by preferences for originality
(novelty) and non-conformity. They exhibit relatively higher self esteem,
optimism and a tendency towards internal locus of control. Thus Innovators
focus on creative solutions that offer novelty over appropriateness.
In order to understand an Innovator’s CRR, consider the same
hypothetical problem solving attempt as described above for the Adaptor.
As with the Adaptor, the Innovator is assumed to commence the problem
solving task with an unbiased view of the potential outcome and is therefore
completely uncertain about the potential for a good or bad result. In this
case, the CRR model and KAI theory both suggest that the Innovator will have
a higher creative motivation than an Adaptor for solving the problem.
If early progress towards a solution is perceived by the Innovator, it is
asserted that their intrinsic motivation to be original is somewhat sated by their
early success and creative motivation slightly decreases. The extrinsic
motivation to achieve results becomes a focus, especially as success in an
organisational context often brings additional resources to enable the
problem solver to continue being creative on other projects. Recall that
Amabile (Amabile, 1997a) identified continuing resource supply and
recognition for creative efforts as synergistic extrinsic motivators. Successful
problem solvers in organisations are often told to ‘keep doing what you are

86
doing’, thus gaining creative rights and escaping the accountability oversight
which acts as an extrinsic de-motivator for creativity.
In this case, the potential for increased resources, recognition, increased
creative rights and decreased monitoring motivate the Innovator to conform
by completing the problem solving task. The easiest way for the Innovator to
do this is to use their (so far) successful creative approach to the problem and
proceed without additional novelty. Hence there is a net incremental
decrease in creative motivation (a move towards potential gains response)
and this decrease may be large if the Innovator is sufficiently forward thinking.
In Figure 1, this corresponds to the point for the dotted line at 50% expected
outcome certainty on the left side of the graph.
Assuming that the Innovator perceives that their good progress continues
and a successful solution becomes even more likely, then their extrinsic
motivation to complete the problem solving exercise wanes. The Innovator is
not characterised by diligence or efficiency, and optimistically assumes that
the problem is essentially solved. The Innovator rationalises that as success is
already certain, at least some of the impending rewards of success can be
‘spent now’. Thus the Innovator’s intrinsic motivation for originality again
dominates and creative motivation increases even though it is no longer
required to solve to problem. In effect the Innovator ‘gets carried away
experimenting’ with some more interesting and original non-conforming
solutions. The Innovator’s high self worth and sense of importance validate this
freedom to experiment after having ‘effectively’ solved the problem, even
though the result may not be completely achieved yet. In Figure 1, this
corresponds to the point for the dotted line at 100% expected outcome
certainty on the left side of the graph.

87
Alternatively, if the Innovator perceives an early setback during the
problem solving task, then their extrinsic motivators towards conformity and
diligence become dominant. In extreme cases, the Innovator is subjected to
oversight and controls that reduce their autonomy and available resources to
be creative. Even the threat of such interventions will have the potential to
de-motivate the Innovator from continuing to be creative as is asserted by
Kubes (Kubes, 1992).
Thus after a perceived initial partial setback, the Innovator experiences real or
imagined external pressure to stop experimenting and to make measurable
progress towards a solution. This perceived pressure forces the Innovator to
conform to the dominant paradigm for managing the problem and their
creativity decreases to allow the Innovator to retain some of their autonomy
at this point in the task. In a sense the Innovator is forced to ‘get with the
program’. In Figure 1, this corresponds to the point for the dotted line at 50%
expected outcome certainty on the right side of the graph.
Figure 1 Expected Creative Resolve Response

88
If setbacks are perceived to continue after this conformity, then the
Innovator’s intrinsic motivation for originality and their internal locus of control
influence them to resume novel problem solving efforts. Their internal locus of
control and optimism causes them to assume (rightly or wrongly) that they will
be able to solve the problem eventually. The Innovator in extreme cases may
go into an ‘emergency mode’ to retain their creative autonomy. In effect,
they perceive that they have nothing to lose and everything to gain by trying
everything they can think of to solve the problem. The result is that their
motivation to be creative increases by a large amount. In Figure 1, this
corresponds to the point for the dotted line at 100% outcome certainty on the
right side of the graph.
Thus the pattern of Innovator creative motivation (their CRR) is determined
by the same interplay of extrinsic and intrinsic motivators as the Adaptor, but
the Innovator’s CRR is the mirror image of the Adaptor’s. The Innovator’s
creative motivation is at its highest during both maximum outcome
uncertainty and certainty. The Innovator’s creative motivation is at its lowest
Expected Outcome
Creative Motivation
InnovatorAdaptor
100% Bad100% Good 50% Bad50% Good Uncertain
Freedom to Create
Consolidate Gains
Disrupt for Advantage
Nothing to Lose
Constrained by Firm
Lock in Gain
Consider small changes
Analyse to simplify
Forced to change
Stop further loss

89
when outcome uncertainty is neither zero nor maximum. The expected
Innovator and Adaptor CRR patterns are shown in Figure 1.
Hypotheses
The formulation of hypotheses below is based on the expected CRR pattern
graphed in Figure 1:
1. Innovator creative motivation varies with outcome certainty: (a) creative
motivation max at max certainty; (b) creative motivation high at zero
certainty; (c) creative motivation lowest at moderate certainty; and (d)
variation should be more significant with increasing KAI score.
2. Adaptor creative motivation varies with outcome certainty: (a) creative
motivation min at max certainty; (b) creative motivation low at zero
certainty; (c) creative motivation highest at moderate certainty; (d)
variation should be more significant with decreasing KAI score.
3. Innovators and Adaptors similarly motivated at moderate outcome
certainty.
Methods and experimental design
Participants
The data for this study were drawn from in-class problem solving exercises
designed to give postgraduate students opportunities to attempt problem
solving. The participants in this study were 51 respondents out of 66 individuals
enrolled in a Master of Business Administration unit called Creative Problem

90
Solving. The international nature of the MBA program ensured that
participants were from a wide range of nationalities, though most of the
participants were Australian. Both genders and a range of ages were present
in the sample, though neither variable was reported. More than two thirds of
the participants were enrolled part time (typically working full time as
professionals or managers) and the rest were full time students. Participants’
prior MBA education ranged from nil (i.e. this was their first class) to almost
complete (i.e. several participants had to complete only this class to
graduate).
Entry requirements to the MBA ensured that all participants had at least
two years of work experience. Some students were able to enrol in the
program without an undergraduate degree provided they had extensive
work experience. Thus the sample included current and aspiring real world
managers with at least an undergraduate degree and two years of
professional work experience or more than five years of managerial
experience.
Participants were told that the broad purpose of the exercise was to
attempt to use tools and frameworks presented in the lecture and that the
survey data collected would be used for both teaching and research
purposes. Students were told that their participation would have no effect on
student grades for the class and that participation was voluntary. They were
also told that their individual responses would remain confidential and the
data would only be viewed in aggregate. Because the central outcome
variable of interest in the research program was creative motivation, all
potential class subjects available were offered the opportunity to participate.
The majority of participants treated these projects as class tutorial exercises.

91
The problems used for the exercises were designed to provide learning
opportunities for specific creative problem solving skills and covered a wide
range of tasks. Some tasks were similar to those found in business domains,
and others were quite different to business problems. Only one problem was
attempted within each weekly class, and all participants undertook their
problem solving efforts at the same time and in the same general location.
Participants were given 30–60 minutes to complete problems in small self-
selected groups of four to six members. Some groups were able to solve some
exercises to their satisfaction earlier than others, and within the time limit.
Some groups failed to complete some exercises to their satisfaction within the
maximum time available in the class. The four problem solving exercises were:
• Launcher (use a small model catapult to launch a bullet 1m into a target
bucket);
• Mutual funds (critically evaluate an advertorial relating to investment
funds);
• Asit (improve an online program designed to teach creative problem
solving); and
• Wiki (resolve a corporate extortion attempt via a real-time, interactive and
online text-based platform).
Thus all the participants focused on open-ended problem solving tasks
that were specified by the lecturer. Most individuals participated in the study
throughout the entire short semester (six weeks). Because student attendance
was not constant, individual participation ranged from four responses to a

92
single problem solving exercise, to up to five responses for all four problem
solving exercises.
At the beginning of the study, all participants completed an online KAI
survey that established their cognitive style. These measures were used as
controls in the quantitative analyses. Twenty-nine Innovators and 22 Adaptors
responded. The mean KAI score was 100.2 with a standard deviation of 12,
compared to a normal population of mean KAI 96 with a standard deviation
of 13. Whilst this sample mean is higher than the upper 95% confidence limit of
99.6, the nature of the analysis does not require the sample to be necessarily
representative of the general population, as comparisons between different
cognitive styles within the sample will be made.
Procedure and Instruments
At different intervals during the problem solving tasks, subjects were asked to
individually complete responses to two questions: ‘how creative do you think
that you need to be to solve this problem’ and ‘how certain are you that you
will be successful’. Both questions required subjects to circle the most
appropriate response on a Likert scale. The creativity Likert scale had 7
discrete points ranging from ‘nil’ to ‘max’ (nil, v. low, low, moderate, high, v.
high, max). The certainty Likert scale ranged from ‘uncertain’ to ‘certain’ (0%,
20%, 40%, 60%, 80%, 100%).
Amabile (Amabile et al., 2005) provides significant precedence and
validation for using self-reported scales for creativity assessment in
organisation creativity research, and also validation for the creation of new
simple self-reported scales. The Likert scales used in this study were chosen to
minimise the loss of significant data due to noise, and because an initial pilot
study suggested that more detailed scale increased the cognitive load too

93
much for subjects. During and after the initial pilot study, subjects reported
that they did not understand the survey and were unable to record survey
responses without losing their momentum in solving the problem.
Likert scales with 6–7 point scales are common in psychological research,
even though more graduated scales could offer finer detail. An example is
Kirton’s (Kirton, 1976) test, which uses only a 5 point scale (v. hard, hard,
moderate, easy, v. easy). In fact all of the examples cited in Levin (Levin et
al., 1998) require a forced choice from two alternatives.
In order to maintain good response rates, the researcher visited each
group during the problem solving exercises and verbally requested that the
next survey point be completed. There was no way to ensure that participants
attended to each problem solving exercise, or that participants who were
strongly involved in the exercise would stop work to respond to the survey. As
a result, final response rates were 351 out of a possible 580 for Innovator
responses (60.5%), and 280 out of a possible 440 for Adaptor responses
(63.6%). Data or results were not discussed with participants until their
participation was completed. No participant’s data was excluded from the
analysis.
Limitations of the experimental design
Potentially confounding variables in this experimental design were those
related to the problem heterogeneity, learning effects, class environment,
group interaction and interviewer response bias. The four problem solving
exercises proposed were from very different knowledge domains. This
presents potential problems for comparison of subject responses to different
problems. This difficulty was managed by considering outcome certainty as
94
the independent variable – in essence the problem being solved was
irrelevant as long as outcome certainty could be consistently reported. From
this perspective, the heterogeneous nature of the problems provides support
for the generalisation of the results to other unrelated problem contexts. Post
hoc analysis of the frequency of specific outcome certainty responses
showed that different problems had different ranges and peak outcome
certainty responses, confirming the heterogeneity of the exercises.
Interestingly, post hoc analysis of the mean outcome certainty of responses
over time also showed a general trend to slightly increase outcome certainty
as well.
Increasing outcome certainty suggests that learning effects may be
present. (Learning was the original objective of the class exercises.) Within a
specific problem exercise, learning is not a confounding variable. Indeed, the
corollary of the CRR model is to understand how creative motivation changes
as learning about how to solve a particular problem increases. Learning
effects, however, are potentially confounding if they apply between different
problem exercises. Given the heterogeneous nature of the problem exercises
and the week time delay between each one, these confounding inter-
problem learning effects were expected to be low. This is supported by the
lack of significant differences in mean outcome certainty for the first survey
responses to each problem.
The class environment promoted demonstrating successful creative
problem solving. As a result this would be expected to place additional
extrinsic motivation in the form of both control (i.e. implied expectation) and
intangible reward (i.e. recognition) for creativity. Different participants would
be expected to respond in differing degrees of sensitivity to these extrinsic

95
motivators, resulting in a variance in overall reported motivation. However,
the degree of this variance would be expected to average out over the
sample and be effectively constant for a particular problem solving exercise,
and therefore not confound the analysis.
There is generally a problem with individual administration within a group
task. However, in this study group, effects acted again as a form of (mainly)
extrinsic motivation, so the same considerations for a class environment would
be expected to apply. Since group problem solving is now commonplace in
business contexts, using group-based problem solving was considered more
representative and able to be generalised. Interestingly, individual reporting
showed very different perceptions of outcome certainty during the task within
the same small group of participants. This suggests that an individual response
was appropriate to measure.
The final potentially confounding variable was interviewer response bias. It
would be expected that students in a creative problem solving class would
over report the need to be creative as a response to the lecturer. Again these
effects act as an extrinsic motivator, and provided that the effect is constant
across a specific problem and individual participant sensitivity is variable,
analysis can proceed using mean responses. Similar to the group work
consideration, many business problems are attempted in the context where a
supervisor is hoping for successful results, which is similar (from a motivational
perspective) to the student–lecturer relationship.
In summary, the main concerns for the study design were the presence of
additional extrinsic motivators (including some synergistic motivators) that
would be expected to affect overall creative motivation. Since CRR relates to
the variability of creative motivation, these confounding effects can be

96
ignored as they were constant. In addition several of the potentially
confounding effects were analogous to real world situations (i.e. group work
and supervision) and therefore the results are potentially more able to be
generalised to the real world.
Results
Data collection efforts yielded two quantitative data sets: creative motivation
and outcome certainty responses for each problem, and KAI scores for the
participants. To examine the relationship between creative motivation and
outcome certainty, the creative motivation responses were coded cardinally:
score 0 for ‘nil’ creativity, through to score 7 for ‘maximum’ creativity.
Participant responses were aggregated by the KAI score into either Innovator
(KAI>96), Adaptor (KAI<=96), Extreme Innovator (top quartile of all KAI scores)
or Extreme Adaptor (bottom quartile of all KAI scores) sub groups. For each
sub group, mean and standard deviation required creativity score was
calculated for each outcome certainty measure, regardless of problem
exercise. Comparisons between different mean required creativity scores
within subgroups and between subgroups was completed using two-tailed t-
tests to establish confidence intervals for differences.
Figure 2 shows how the mean creative motivation score varies against
outcome certainty. The solid lines with the largest amplitude of creative
motivation represent extreme Innovators (at the top) and extreme Adaptors
(at the bottom). The dashed lines with less amplitude represent all Innovator
and all Adaptors (again top and bottom respectively).

97
Figure 2 Results Graph – Mean Required Creativity vs. Outcome Certainty.
Qualitative inspection of the graph reveals that mean creative motivation
response does appear to vary for both cognitive styles. In addition, Innovators
report higher mean creativity scores than Adaptors for all outcome certainty
levels. These effects appear stronger for extreme Innovators and Adaptors.
Analysis
Two-tailed t-tests of significance were conducted for each outcome certainty
value in order to determine if there was a significant difference between
mean responses for all Innovators and all Adaptors. Additionally, two-tailed t-
tests were conducted for each outcome certainty to determine if there was a
significant difference between mean responses for extreme Innovators and
Adaptors. The results of the analysis are shown in the Table 1, and suggest that
for all outcome certainties (except 40% and 100%), the mean creativity score
for all Innovators is significantly higher than mean creativity score for all
Adaptors.

98
Table 1 All Innovators vs. All Adaptors – Mean Creativity Responses
Outcome Certainty 0% 20% 40% 60% 80% 100%
Innovator Mean Creativity 4.83
n=6
4.68
n=50
4.130
n=69
4.15
n=104
4.15
n=86
4.33
n=36
Adaptor Mean Creativity 3.57
n=7
4.07
n=26
3.90
n=53
3.82
n=92
3.82
n=84
4.06
n=18
Significance level: difference
between means
10% 5% Not
(30%)
5% 5% Not
(>30%)
The results in Table 2 show that for all outcome certainties (except 100%),
mean creativity score for extreme Innovators is significantly higher than mean
creativity score for extreme Adaptors5
.
Table 2 Extreme Innovators v. Extreme Adaptors – Mean Creativity Responses
Outcome Certainty 0% 20% 40% 60% 80% 100%
Extreme I Mean Creativity 4.50
n=2
5.31
n=16
4.50
n=16
4.10
n=30
4.15
n=27
5.00
n=20
Extreme A Mean Creativity
3.00
n=4
4.09
n=11
3.79
n=29
3.56
n=32
3.67
n=30
4.40
n=10
Significance level: difference
between means
5% 5% 10% 5% 6% Not
(20%)
5 The need for extreme caution in interpreting p<.10% results is noted.

99
In addition, the level of significant difference between the means for each
outcome certainty can be compared by examining the bottom row of both
tables. It is evident that the level of significant difference between means for
each outcome certainty is generally equal or greater for the extreme
subgroups than the entire group (e.g. the significant difference between
mean creativity at outcome certainty of 40% is not significant for all Innovators
and Adaptors, but is significant to the 10% level for extreme Innovators and
Adaptors).
Innovator Response Analysis
Two-tailed t-tests of significance were conducted for sequential pairs of
selected outcome certainty values in order to determine if there was a
significant difference between mean responses for all Innovators over
different ranges of outcome certainty. The outcome certainty pairs were
selected to maximise potential differences based on the shape of the Figure 2
graph. A similar analysis was conducted for extreme Innovators. The results of
both analyses are shown in Table 3. The results show mean creative response
varies significantly across all selected outcome certainty ranges for extreme
Innovators, and across only the 20–60% range for all Innovators.

100
Table 3 Innovator Creativity Variation
Outcome Certainty Comparison 0%–20% 20%–60% 60%–100%
All Innovators significance level:
difference between means
Not
(>30%) 1%
Not
(>30%)
Extreme Innovators significance
level: difference between means
Not
(20%) 1% 1%
Adaptor Response Analysis
Similar t-tests of significance were conducted for all Adaptors’ and extreme
Adaptors’ mean creativity responses over the same outcome certainty
ranges. The results of the analysis are shown in Table 4. The results show mean
creative response varies only significantly across two of the three selected
outcome certainty ranges for extreme Adaptors.
Table 4 Adaptor Creativity Variation
Outcome Certainty Comparison 0%–20% 20%–60% 60%–100%
All Adaptors significance level:
difference between means
Not
(>30%)
Not
(30%)
Not
(>30%)
Extreme Adaptors significance
level: difference between means 5%
Not
(30%) 5%
Discussion
Some important aspects of CRR are supported by this study to statistically
significant levels. The results suggest that mean creative motivation does vary

101
systematically during problem solving, based on perception of outcome
certainty and depending on a subject’s cognitive style. Though the overall
variation is relatively small, it is significant. Whilst this supports the general
hypothesis of CRR, the specific pattern of response predicted was not
observed:
H1 (a) Innovator creative motivation is max at max certainty was
supported;
H1 (b) Innovator creative motivation high at zero certainty was not
supported;
H1 (c) Innovator creative motivation lowest at moderate certainty was
supported;
H1 (d) Variation more significant with increasing KAI score was supported.
H2 (a) Innovator creative motivation is min at max certainty was not
supported;
H2 (b) Innovator creative motivation low at zero certainty was supported;
H2 (c) Innovator creative motivation highest at moderate certainty was
not supported;
H2 (d) Variation more significant with decreasing KAI score was
supported.
H3 Innovators and Adaptors being similarly motivated at moderate
outcome certainty, was not supported.
The results tend to support the findings of Kaufmann and Vosburg
(Kaufmann and Vosburg, 1997) and Vosburg (Vosburg, 1998), though the

102
theoretical basis for the variation is different: CRR is founded on changing
sensitivity to intrinsic and extrinsic motivators rather than mood effects.
This study shows that creative motivation appears to follow a wax–wane–
wax pattern, regardless of cognitive style. A possible explanation for Innovator
CRR and Adaptor CRR varying ‘in phase’ is that both respond more sensitively
to extrinsic motivation (which in general lowers creative motivation) at 0%
outcome certainty. Once the problem at hand is better understood (20%
outcome certainty), extrinsic motivations are somewhat satisfied. Problem
solver motivation sensitivity then switches to responding to intrinsic motivations
(which in general increase creative motivation and therefore creativity). This
switch to intrinsic motivation could be understood as one or a combination of
the following:
• Increased involvement in the problem due to time invested (i.e. there is an
escalation of commitment);
• Reduced concerns over failure consequences as problem understanding
increases (i.e. there is relief that uncertainty is reduced because the
problem has been identified); and
• Increased interest in the problem solving exercise due to a better
understanding of what is involved (i.e. there are more positive
expectations about how to resolve the problem).
Once peak motivation has been reached (at 20% outcome certainty),
increasing certainty further results in a switch back to trying to progress with
the problem solving task in order to satisfy extrinsic motivators. This results in a
reduction in creativity as the problem solver concentrates on developing and

103
evaluating possible solutions implied by the previous problem definition, rather
than creating new solutions or looking for additional possible problem
definitions.
Finally at minimum creative motivation (at 60% outcome certainty), the
problem solver begins to believe that the problem solving task will be
ultimately successful. This starts to satisfy all extrinsic motivators and leaves
only intrinsic motivation remaining. Largely released from the concern of
whether or not the result will be successful, the problem solver starts to explore
additional creative options that are more interesting: the final creative
finishing touches perhaps or other related but non-critical aspects of the
problem’s context. The result is increased creative motivation and creativity.
Thus this study suggests that extrinsic motivation is initially prioritised during
problem solving over intrinsic motivation. CRR fits with the body of work
completed by Deci and Ryan regarding Self Determination Theory and some
aspects of Cognitive Evaluation Theory (see Gagné and Deci, 2005 for a
summary). Broadly, Deci and Ryan’s body of research shows that tangible
extrinsic motivators reduce intrinsic motivation. This fits neatly with Amabile’s
(Amabile, 1996; Amabile, 1997a; Amabile, 1997b; Amabile, 1998; Amabile et
al. ,2002; Amabile et al., 2004) research which shows that non-synergistic
extrinsic motivators reduce creativity, and intrinsic motivation enhances
creativity. CRR extends the current understanding of responses to intrinsic and
extrinsic motivation by showing how problem solvers’ sensitivity to each type
of motivation can change during problem solving, resulting in a low–high–
low–high pattern of response, as perceived outcome certainty increases from
0–100%.

104
The above description of CRR, however, is conceptually simplified. In
practice, subjects in the same small group did not report similar measures of
outcome certainty. In addition, while the overall trend was increasing mean
outcome certainty over time, an individual’s specific outcome certainty
response was not predictable at any point. Some subjects’ outcome certainty
decreased over time, even though the average for their small group was
increasing. Finally, CRR only shows average creative motivation responses,
not specific individual responses, and it is valid only for single-sitting problem
solving tasks. Problem solving tasks undertaken over several different sessions
may exhibit very different CRR patterns due to a range of changing factors6
In general, the CRR phenomenon is stronger for more extreme cognitive
styles (both Innovator and Adaptor), suggesting that the sensitivity to intrinsic
and extrinsic motivators does increase for subjects with cognitive styles further
away from the average. The overall difference in creative motivation
between Innovators and Adaptors suggests that Adaptors in general are
more sensitive to extrinsic motivation, which tends to reduce creative
motivation and creativity. This would suggest that Adaptors should exhibit
lower levels of creativity than Innovators in organisational environments where
significant non-synergistic extrinsic motivation is common.
.
Assink (Assink, 2006) identifies a range of factors that inhibit organisational
innovation capability. In fact, many authorities (Berkshire, 1995; Basadur, 2004;
Boeddrich, 2004; Gryskiewicz and Taylor, 2003; Leavy, 2002; Mumford, 2000;
Proctor, 1999; Välikangas and Jett, 2006) have asserted that organisations
6 In particular the context here – a university classroom – is a limiting factor in how far
we can generalise these findings.
105
either purposefully or inadvertently decrease creativity (via punitive personal
accountability, overzealous risk management, conservative capital allocation
procedures, or inflexible corporate governance initiatives). For example,
Elsbach and Hargadon (Elsbach and Hargadon, 2006) argue that overwork
and high pressure for performance are significantly damaging to professional
creativity and advocate periods of so-called ‘mindless’ work for recuperation.
Amabile (Amabile et al., 2002) found that creativity is reduced under the time
pressure experienced by many individuals in organisations.
Most extrinsic motivational factors are not synergistic (as defined by
Amabile, 1997a) and hence serve to inhibit creativity even though they are
generally expected to improve individual motivation to perform. There seems
to be a tendency in organisations to rank appropriateness of solutions over
novelty (see Amabile, 1998; Kirton, 1984, 1991; Matherly and Goldsmith, 1985).
This study’s finding that Adaptors appear to be more sensitive to extrinsic
motivation regardless of outcome certainty, suggests that organisational
extrinsic motivators are more likely to affect Adaptors than Innovators. This is
supported by Casbolt (Casbolt, 1984) who found that Adaptors were in
general less creative on two tasks than Innovators. Wells’ (Wells et al., 2006)
study also supports this by showing a small but significant correlation between
creativity and deviance in organisations. Dewett (Dewett, 2004) goes as far as
suggesting that an employee’s willingness to take risks is the key determinant
of individual creativity.
The potential for supportive supervisors and leaders to enhance creativity
during organisational problem solving has also been examined by a variety of
researchers (including Amabile et al., 2004; Gryskiewicz and Taylor, 2003;
Välikangas and Jett, 2006; de Jong and Hartog, 2007; Boerner et al., 2007;

106
Egan, 2005a; Egan, 2005b; Reiter-Palmon and Illies, 2004; Basadur, 2004;
Mumford et al., 2002; Clapham, 2000; Sosik, 1997; Baer et al., 2003; Oldham
and Cummings, 1996; Forbes and Domm, 2004). Of these studies, Forbes and
Domm (Forbes and Domm, 2004) specifically examined the perceived trade
off between creativity and productivity.
Forbes and Domm (Forbes and Domm, 2004) agreed that ‘external’
controls designed to increase productivity could diminish involvement and
creativity. In this context ‘external’ controls equate to a supervisor’s or
management’s push for completion. Despite this, they show how creativity
and productivity can increase under circumstances where there is high
involvement. They assert that some extrinsic rewards can enhance personal
involvement, and hence creativity.
Implications of CRR
CRR provides one such potential ‘external control’ for managing creativity
not proposed by Forbes and Domm (Forbes and Domm, 2004): influencing
employee perception of outcome certainty. Mean creative motivation of
individuals in a small problem solving group appears to vary during a specific
problem solving task in a pattern of low–high–low–high, in line with increasing
perception of outcome certainty. For both Innovators and Adaptors, creative
motivation appears to be high at 20% and 100% outcome certainty, and low
at 0% and approximately 60% outcome certainty. Thus managers that can
influence employees’ perception of outcome certainty (towards 20% and/or
100%) are expected to increase creative motivation, and therefore creativity.
Specifically, (useful) peak mean creative motivation seems to occur when
a problem solving task is perceived to be approximately 20% complete. Once
a problem solving task is perceived by employees to have progressed

107
beyond this point, creative motivation and creativity appear to decrease
until the project is perceived by the problem solvers to reach substantial
completion. A manager may be able to increase creative motivation and
therefore creativity, by influencing employees to reconsider their perception
of problem solving progress. Where a manager can provide validation that
the problem should be reconsidered from another definition or create doubt
as to the current problem solving strategy, employees may be prepared to
revisit the problem from a different starting point. This reframing approach
would also be expected to enhance productivity unless the resulting
employee perception is that the problem solving task has become hopeless.
Influencing employees’ outcome certainty perception acts as an external
management control. Managers using this approach should expect creativity
changes to be greatest for employees with extreme cognitive styles.
Based on the findings of this study, managers should also expect Adaptors
to exhibit relatively lower motivation at all outcome certainty levels than
Innovators, particularly in organisations with strong extrinsic controls. This
suggests that managers should select Innovators over Adaptors to complete
tasks where higher creative motivation and creativity is preferred. Managers
could also apply CRR to enhance collaboration during problem solving.
Conflict between problem solvers with very different styles (as shown by
Hammerschmidt, 1996) could be potentially managed by ensuring problem
solvers maintain different perceptions of the likely certainty of outcome for
the problem solving task. To some extent this provides an alternative
approach to that suggested by Mumford (Mumford et al., 2001), involving
shared mental models where problem solving group members agree on how

108
to approach a problem solving task. This is particularly important for problem
solving groups comprised of individuals with diverse cognitive styles.
This study suggests that such a group’s creative motivation levels will
remain in conflict if all group members agree on outcome certainty for the
duration of the problem solving task. In this situation, Adaptors will always feel
that less creativity is required than Innovators. However, if a manager can
enable individuals to undertake problem solving together, whilst retaining
different perceptions of outcome certainty, then creative motivation levels
within the group would more closely match and conflict should reduce. This
application of CRR seems at odds with the dominant paradigms in managing
problem solving groups, which relate to increasing collaboration via a
common view of the problem and how to approach it. A practical resolution
to this problem could be to structure the group so that individuals work
independently and concurrently on the same problem. Research on this
nominal group technique suggests other creativity benefits unrelated to
motivation
In practice it was observed that problem solvers rarely had their
perception of outcome certainty directly affected by the group process,
even when leaders emerged within the small problem solving groups. Further
research into the application of CRR for management and leadership of
creativity is therefore required.
Conclusion
This paper introduces the Creative Resolve Response: a model for how
Innovators’ and Adaptors’ creative motivation can be expected to vary
during a problem solving task. The study provides support to the theory that

109
individuals with different problem solving styles vary in their sensitivity to
intrinsic and extrinsic motivators. Adaptors appear to be more sensitive than
Innovators to extrinsic motivation. In addition, sensitivity to extrinsic motivation
is prioritised at very low and moderate levels of outcome certainty. Between
these levels of outcome certainty, intrinsic motivation appears to be
prioritised. Intrinsic motivation also appears to be prioritised at high levels of
outcome certainty. This CRR pattern appears to be more significant for
individuals with extreme cognitive styles.
CRR is a potentially important phenomenon because it promises a new
form of extrinsic control for enhancing creative motivation and creativity: the
influence of outcome certainty. Managers that can influence employee
outcome certainty are expected to be able to better manage creative
motivation. Managers that can support problem solving groups to sustain
different individual perceptions of outcome certainty (relative to cognitive
style) are expected to be able to improve group collaboration by matching
individual creative motivation levels more closely.
Further research is required to examine how problem solver motivation
varies in response to attempts to influence outcome expectation certainty. It
may be that attempting to influence outcome certainty changes the CRR
pattern of response, which would reduce the management utility of this
study’s findings.

110
References
Amabile, T.M. (1996), Creativity in context, Westview Press, Boulder.
Amabile, T.M. (1997a), ‘Entrepreneurial creativity through motivational
synergy’, Journal of Creative Behavior, Vol. 31, No. 1, pp. 18–26.
Amabile, T.M. (1997b), ‘Motivating creativity in organizations: on doing what
you love and loving what your do’, California Management Review, Vol.
40, No. 1, pp. 39–58.
Amabile, T.M. (1998), ‘How to kill creativity’, Harvard Business Review, Vol. 76,
No. 5, pp. 76–87.
Amabile, T.M. Hadley, C.N. and Kramer, S.J (2002), ‘Creativity under the gun’,
Harvard Business Review, Vol. 80, No. 8, pp. 52–61.
Amabile, T.M, Schatzel, E.A., Moneta, G.B. and Kramer, S.J. (2004), ‘Leader
behaviors and the work environment for creativity: perceived leader
support’, Leadership Quarterly, Vol. 15, No. 1, pp. 5–32
Amabile, T.M. Barsade, S.G. Mueller, J.S. and Staw, B.M. (2005), ‘Affect and
creativity at work’, Administrative Science Quarterly, Vol. 50, No. 3, pp.
367–403.
Assink, M. (2006), ‘Inhibitors of disruptive innovation capability: a conceptual
model’, European Journal of Innovation Management, Vol. 9, No. 2, pp.
215–233.
Baer, M. Oldham, G. and Cummings, A. (2003), ‘Rewarding creativity: when
does it really matter?’, Leadership Quarterly, Vol. 14, No. 5, pp. 569–586.

111
Basadur, M. (2004), ‘Leading others to think innovatively together: creative
leadership’, Leadership Quarterly, Vol. 15, No. 1, pp. 103–121.
Berkshire, S.D. (1995), Critical Behaviours in Innovative and Creative Decision-
Making and Problem-Solving Work Groups, Boston University,
Massachusetts.
Boeddrich, H. J. (2004), ‘Ideas in the workplace: a new approach towards
organizing the fuzzy front end of the innovation process’, Creativity and
Innovation Management, Vol. 13, No. 4, pp. 274–285.
Boerner, S. Eisenbeiss, S.A. and Griesser, D. (2007), ‘Follower behavior and
organizational performance: the impact of transformational leaders’,
Journal of Leadership and Organizational Studies, Vol. 13, No. 3, pp. 15–26.
Casbolt, D.M. (1984), The Effects of Idea Generation Technique, Problem
Type, and Creative Thinking Style on Individual Problem Solving
Performance, Ohio University, Ohio.
Clapham, M.M. (2000), ‘Employee creativity: the role of leadership’, The
Academy of Management Executive, Vol. 14, No. 3, pp. 138–139.
Cummings, A. (1997), ‘The radicalness of employee ideas: An interactive
model of co-worker networks and problem-solving styles’, Dissertation
Abstracts International Section A: Humanities and Social Sciences, Vol. 6,
pp. 2287-.
de Jong, J.P. and Hartog, D.N. (2007), ‘How leaders influence employee’s
innovative behaviour’, European Journal of Innovation Management, Vol.
10, No. 1, pp. 41–64.

112
Dewett, T. (2004), ‘Employee creativity and the role of risk’, European Journal
of Innovation Management, Vol. 7, No. 4, pp. 257–266.
Egan, T.M. (2005a), ‘Factors influencing individual creativity in the workplace:
an examination of quantitative empirical research’, Advances in
Developing Human Resources, Vol. 7, No. 2, pp. 160–181.
Egan, T.M. (2005b), ‘Creativity in the context of team diversity: team leader
perspectives’, Advances in Developing Human Resources, Vol. 7, No. 2,
pp. 207–225.
Elsbach, K.D. and Hargadon, A.B. (2006), ‘Enhancing creativity through
“mindless” work: a framework of workday design’, Organization Science,
Vol. 17, No. 4, pp. 470–473.
Engle, D.E. Mah, J.J. and Sadri, G. (1997), ‘An Empirical Comparison of
Entrepreneurs and Employees: Implications for Innovation’, Creativity
Research Journal, Vol. 10, No. 1, pp. 45–50.
Fleenor, J.W. and Taylor, S. (1994), ‘Construct validity of three self-report
measures of creativity’, Educational and Psychological Measurement, Vol.
54, No. 2, pp. 464–470.
Forbes, J.B. and Domm, D.R. (2004), ‘Creativity and productivity: resolving the
conflict’, S.A.M. Advanced Management Journal, Vol. 69, No. 2, pp. 4–11.
Foxall, G.R. and Hackett, P.M. (1992), ‘The factor structure and construct
validity of the Kirton Adaption–Innovation Inventory’, Personality and
Individual Differences, Vol. 3, No. 9, pp. 967–975.
Foxall, G.R. and Hackett, P.M. (1994), ‘Styles of managerial creativity: A
comparison of adaption–innovation in the United Kingdom, Australia and

113
the United States’, British Journal of Management, Vol. 5, No. 2, pp. 85–100.
Foxall, G.R. and Bhate, S. (1999), ‘Computer use-innovativeness: Cognition
and context’, International Journal of Technology Management, Vol. 17,
No. 1/2, pp. 157–172.
Foxall, G.R. and Szmigin, I. (1999), ‘Adaption–innovation and domain–specific
innovativeness’, Psychological Reports, Vol. 84, No. 3, pp. 1029–1030.
Gagné, M. and Deci, E.L. (2005), ‘Self-determination theory and work
motivation’, Journal of Organizational Behavior, Vol. 26, No. 4, pp. 331–
362.
Goldsmith, R.E. and Matherly, T.A. (1987a), ‘Adaption–innovation and
creativity: A replication and extension’, British Journal of Social Psychology,
Vol. 26, No. 1, pp. 79–82.
Goldsmith, R.E. and Matherly, T.A. (1987b), ‘Adaption–innovation and self-
esteem’, Journal of Social Psychology, Vol. 127, No. 3, pp. 351–352.
Gryskiewicz, S. and Taylor, S. (2003), Making Creativity Practical: Innovation
That Gets Results for the Practicing Manager. An Ideas into Action
Guidebook. Center for Creative Leadership, Greensborough.
Hammerschimidt, P.K. (1996), ‘The Kirton adaption–innovation inventory and
group problem solving success rates’, Journal of Creative Behaviour, Vol.
30, No. 1, pp. 61–74.
Hennessey, B.A. and Amabile, T.M. (1998), ‘Reward, intrinsic motivation, and
creativity’, American Psychologist, Vol. 53, No.6, pp. 674–675.
Houtz, J.C. Denmark, R. Rosenfield, S. and Tetenbaum, T.J. (1980), ‘Problem
solving and personality characteristics related to differing levels of

114
intelligence and ideational fluency’, Contemporary Educational
Psychology, Vol. 5, No. 2, pp. 118–23.
Kaufmann, G. (1979), ‘The explorer and the assimilator: a cognitive style
distinction and its potential implications for innovative problem solving’,
Scandinavian Journal of Educational Research Vol. 23, No. 3, pp. 101–108.
Kaufmann, G. (2003), ‘Expanding the mood-creativity equation’, Creativity
Research Journal, Vol. 15, No. 2/3, pp. 131–135.
Kaufmann, G. and Vosburg, S. (1997), ‘Paradoxical effects of mood on
creative problem solving’, Cognition and Emotion, Vol. 11, pp. 151–170.
Keller, R.T. and Holland, W.E. (1978), ‘A cross-validation study of the Kirton
Adaption–innovation inventory in three research and development
organizations’, Applied Psychological Measurement, Vol. 2, No. 4, pp. 563–
570.
Kirton, M.J. (1976), ‘Adaptors and innovators – a description and measure’,
Journal of Applied Psychology, Vol. 61, No. 5, pp. 622–629.
Kirton, M.J. (1984), ‘Adaptors and innovators – why new initiatives get
blocked’, Long Range Planning, Vol. 17, No. 2, pp. 137–143.
Kirton, M.J. (1991), ‘Adaptors and innovators – why new initiatives get
blocked’, in Henry J. (Ed.), Creative Management, Sage Publications
Open University Press, London, pp. 209–220.
Kozhevnikov, M. (2007). "Cognitive Styles in the Context of Modern
Psychology: Toward an Integrated Framework of Cognitive Style."
Psychological Bulletin, Vol. 133, No. 3, pp. 464-481.
Kubes, M. (1992), ‘Cognitive style and interpersonal behaviour: The Kirton
115
adaption–innovation and Schultz's FIRO-B inventories’, Journal of Human
Behaviour, Vol. 29, No. 2, pp. 33–38.
Leavy, B. (2002), ‘Creativity – the new imperative’, Journal of General
Management, Vol. 28, No. 1, pp. 70–85.
Levin, I.G. Schneider, S.L. and Gaeth, G.J. (1998), ‘All frames are not created
equal: a typology and critical analysis of framing effects’, Organizational
Behaviour and Human Decision Processes, Vol. 76, No. 2, pp. 149–188.
Luck, G. (2004), ‘The relationship of an innovative thinking style, locus of
control and perceived control on job satisfaction and workspace
preferences among knowledge workers’, Dissertation Abstracts
International: Section B: The Sciences and Engineering, No. 4, pp. 2133– .
Martinsen, O. (1994), ‘The effect of individual differences in cognitive style
and motives in solving insight problems’, Scandinavian Journal of
Educational Research, Vol. 38, No. 2, pp. 83–85.
Matherley, T.A. and Goldsmith, R.E. (1985), ‘The two faces of creativity’,
Business Horizons, Vol. 28, No. 5, pp. 8–11.
Mumford, M.D. (2000), ‘Managing creative people; strategies and tactics for
innovation’, Human Resource Management Review, Vol. 10, No. 3, pp.
313–351.
Mumford, M.D. Feldman, J.M. Hein, M.B. and Nagao, D.J. (2001), ‘Tradeoffs
between ideas and structure: individual versus group performance in
creative problem solving’, Journal of Creative Behavior, Vol. 35, No. 1, pp
1–23.
116
Mumford, M.D. Scott, G.M. Gaddis, B. and Strange, J.B. (2002), ‘Leading
creative people: orchestrating expertise and relationships’, Leadership
Quarterly, Vol. 13 No. 6, pp. 705–750.
Oldham, G.R. and Cummings, A. (1996), ‘Employee creativity: personal and
contextual factors at work’, Academy of Management Journal, Vol. 39,
No. 3, pp. 607–634.
Paulus, P. B. and H. C. Yang, (2000). "Idea Generation in Groups: A Basis for
Creativity in Organizations." Organizational Behaviour and Human
Decision Processes Vol. 82, No. 1, pp. 76-87.
Polland, M. (1994), ‘The Evaluation of Creative Behaviors’, Opinion Papers,
Educational Resources Information Centre, US Department of
Education
Proctor, T. (1999), Creative Problem Solving for Managers, Routledge,
London.
Reiter-Palmon, R. and Illies, J.J. (2004), ‘Leadership and creativity:
understanding leadership from a creative problem-solving perspective’,
Leadership Quarterly, Vol. 15, No.1, pp. 55-78.
Riley, M. (1993), ‘Organization and creativity: A replication of the KAI test’,
Journal of Managerial Psychology, Vol. 8, No. 6, pp. i–iv.
Ruscio, J. Whitney, D.M. and Amabile, T.M (1998), ‘Looking inside the fishbowl
of creativity: Verbal and behavioral predictors of creative performance,’
Creativity Research Journal, Vol. 11, No. 3, pp. 243–263.
Shukla, A. and Sinha, A.K. (1993), ‘Self esteem: A requisite for creativity’,
Abhigyan, Vol. Summer/Autumn, pp. 53–60.

117
Sosik, J.J. Avolio, B.J. and Kahai, S.S. (1997), ‘Effects of leadership style and
anonymity on group potency and effectiveness in a group decision
support system environment’, Journal of Applied Psychology, Vol. 82, No.
1, pp. 89–103.
Taylor, W.G. (1989), ‘The Kirton Adaption-Innovation Inventory: Should the sub-
scales be orthogonal?’ Personality and Individual Differences, Vol. 10, No.
9, pp. 921–929.
Tetenbaum, T. and Houtz, J. (1978), ‘The role of affective traits in the creative
and problem-solving performance of gifted urban children’ Psychology in
the Schools, Vol. 15, No. 1, pp. 27–31.
Välikangas, L. and Jett, Q. (2006), ‘The golden spur: innovation
independence’, Strategy and Leadership, Vol. 34, No. 5, pp. 41–45.
Van De Ven, A. H. and A. L. Delbecq (1971). "The Effectiveness of Nominal,
Delphi and Interacting Group Decision Making Processes." Academy of
Management Journal Vol. 14, No. 4, pp. 605-621.
Vosburg, S. (1998), The Effects of Mood on Creative Problem-Solving,
Universitetet i Bergen, Norway.
Wells, D. Donnell, A.J. Thomas, A. Mills, M.S. and Miller, M. (2006), ‘Creative
deviance: a study of the relationship between creative behavior and the
social construct of deviance’, College Student Journal, Vol. 40, No. 1, pp.
74–77.
Wunderley, L.J. Reddy, W.B. and Dember, W.N. (1998), ‘Optimism and
Pessimism in Business Leaders’, Journal of Applied Social Psychology, Vol.
28, No. 9, pp. 751–760.

118
Chapter 2: Innovation, Creativity and Framing Effects
Abstract
Framing effects are usually associated with perceptual
distortions that affect decision making, especially decisions
involving risk related behaviours. This paper empirically
demonstrates framing effects associated with innovation
decisions in a sample of 146 postgraduates and business
managers. In addition, we observed a reversal of preferences
for decisions involving embedded creative characteristics
(fluency/flexibility, originality/novelty, deviance and/or
divergence) when these decisions were reframed from choices
to rejections. These results suggest that innovation and creativity
framing effects may be useful as extrinsic motivational
management tools for unlocking intrinsic motivators to creativity.
The findings are highly relevant to managers wishing to enhance
employee creativity because prior research has suggested that
extrinsic motivators dampen creative motivation.
Keywords: Framing Effects, Innovation, Creativity, Motivation

119
Introduction
Creativity and innovation are considered important for managerial
effectiveness, according to both practitioners (Drucker, 2004; Reiter-Palmon &
Illies, 2004), and academic researchers (e.g., (Basadur, 2004; Cameron M
Ford, 2002; S. S. Gryskiewicz, 2000b)). Indeed, Woodman, Sawyer, and Griffith
(1993) suggest creativity is foundational to organisational effectiveness.
However, managing for increased creativity seems to be somewhat at odds
with other management approaches, for example, those which emphasize
increased efficiency and rational problem solving. Sadler-Smith (2004) argues
for augmenting rational decision making with “gut feel”. Mintzberg and Sacks
(2004) criticise MBA education as damaging to management creativity,
despite the fact that these programs are designed to improve management
skills. Välikangas and Jett (2006) assert that the leadership challenge involves
“learning to manage the independent thinkers” (p. 44) who refuse the
constraints of professionalism and instead innovate on their own terms.
Similarly, Leavy (2002) suggests that organisations have been “found out” in
the last 10 years regarding their ability to manage creativity. Despite the
current focus in organizations on the importance of creativity and innovation,
many managers often appear unwilling or unable to enhance creativity.
Berkshire (1995) identified a range of managerial behaviours that can hinder
creativity, including controlling, competitive, and critical behaviours,
rationalisation, and routine thinking.
Motivating employees to be creative is therefore perhaps the main
challenge that managers face in increasing creativity in the organisation.
However, managers may also be part of the problem. According to Ford and
Gioia (C M Ford & Gioia, 2000)

120
“…instead of generating potentially creative alternatives,
managers usually adopt well understood, previously successful
options. This empirical evidence suggests that managers rarely
concern themselves with creativity during their day-to-day
decision making activities. These findings also suggest that this
domain is quite different from those commonly investigated by
creativity researchers where creativity is a primary concern
guiding actors’ choices (e.g., science, the arts, R&D, etc.).
Thus, despite the substantial dividends one might expect from
creative managerial action, the expedient decision processes
typical of this domain tend to preclude creative choices.” (p.
709)
Thus both management and employee motivation to select creative
options seems to be an important part of enhancing creativity in the
organisation.
Motivation can be intrinsic, extrinsic or a combination of the two types.
Extrinsic motivators are those that are initiated by someone else. For example,
a project deadline, sales commission or recognition for quality work are all
examples of typical organisational extrinsic motivators that could apply to
employees. Intrinsic motivators are those that are internal to the individual (for
example, being curious about how some equipment works). Amabile (T. M.
Amabile, 1997; 1998) showed that most management interventions are based
on extrinsic motivators and these generally dampen creativity. This work was
supported by other studies (T. M. Amabile, Hennessey, & Grossman, 1986; B. A.
Hennessey, 1989; B A Hennessey & Amabile, 1998; Kashdan & Fincham, 2002;
Kruglanski, Friedman, & Zeevi, 1971) that in combination suggest that
121
creativity requires self determination in accord with Deci and Ryan’s Self
Determination Theory (Deci & Ryan, 1985a). One of the key assertions of Self
Determination Theory is that intrinsic motivation diminishes with increased
extrinsic motivation.
The nature of creative motivation therefore proposes a significant
challenge to managers, namely, how to create intrinsic employee motivation
for creativity when by definition management interventions act as extrinsic
motivators. One potential approach might leverage Amabile’s (1997)
identification of “synergistic extrinsic” motivators (like recognition) that can
generally augment existing intrinsic employee motivation. Amabile’s
synergistic extrinsic motivators act to increase intrinsic motivation already
present. Examples include recognition and resource support. Synergistic
motivators are limited in their effectiveness however, because they rely on
existing intrinsic motivation. The body of research on creative motivation has
not addressed how to resolve this creative motivation management problem.
Instead the research has tended to focus on environmental factors (see
Simonton, 2003) that affect creativity via intrinsic motivation and cognitive
style. For example Jaskyte and Kisieliene showed that employee intrinsic
motivation and cognitive style can support creativity within an organisational
culture that values diversity. Tierney(Tierney et al., 1999) found that leader-
employee interactions, the intrinsic motivations of both, and cognitive styles
of both affect creativity of employees. Other studies also relate to supervisor
affects on employee creativity (DiLiello & Houghton, 2006; George & Jing,
2007; Lonergan, Scott, & Mumford, 2004; Oldham & Cummings, 1996;
Redmond et al., 1993; Tierney & Farmer, 2004; Williams, 2004). The actual
122
mechanisms by which supervisors and environments may affect creativity are
not specified in the research above.
It seems worthwhile therefore to identify the specific supervisor
interventions that enhance employee creativity either directly or indirectly by
affecting creative motivation. Such interventions could conceivably happen
prior to the production of potentially creative ideas or at the point where a
decision about whether to opt for a more creative or less creative solution to
solve a problem.
This paper therefore investigates how decisions involving creativity and
innovation are subject to framing effects (first introduced by Tversky &
Kahneman, 1981). Framing effects are typically imposed by whoever presents
or restates a decision and so are potentially useful as an extrinsic
management intervention. For example in one study the price of a pizza
ordered ended up significantly less when customers had to add ingredients to
an empty pizza base compared to removing ingredients from a fully loaded
pizza (I. P. Levin, Schreiber, Lauriola, & Gaeth, 2002). The price difference was
a direct result of customers removing fewer ingredients from fully loaded
pizza, so that it ended up retaining more toppings than one built from
nothing. This study is one example that shows that the way a decision is
presented can affect decision maker preferences.
Importantly, framing effects create perceptual distortions in the mind of
the decision maker to affect their preferences. Individuals that are subject to
framing effects are typically unaware of any external influence on their
decision. Thus the perceptual distortions created by framing effects act
inherently as intrinsic motivators, even though they are externally imposed.
This suggests that framing effects might be used by managers to unlock

123
employee intrinsic creative motivation, even though they are essentially an
extrinsically imposed effect.
This paper therefore introduces framing effects as a possible extrinsic
motivational approach for enhancing creativity. The research tests how
framing effects can influence the preference for relatively more creative
options over less creative options. Despite the fact that framing effects have
been examined in multiple domains, no research could be found that has
empirically investigated how any of the three main types of framing effects
relate to innovation and creativity. The study aims to discover contexts
involving innovation and creativity that activate framing effects and how
these might be used to influence employees to prefer and select creative
decision options. The next section explains the basis for how creativity was
operationalised into testable decisions.
Defining and Measuring Creativity
Amabile (1997) defines business creativity as the production of novel and
appropriate solutions to organizational problems. This agrees with other
authors’ definitions of creativity and innovation, including Plsek (1997) and
Gryskiewicz (2000a). These authors define innovation as applied (successfully
implemented) creativity with three components: novelty, user utility and
problem solver utility. To achieve the potential for innovation, an individual
must first develop creative outputs (some of which may subsequently be
successfully implemented to become innovations). Just what constitutes a
creative output and how to measure this is not clear from the current
literature.

124
Creativity tests essentially attempt to measure creative outputs. Although
many tests measuring creativity are based on subjective or self assessment
(Cropley, 2000) some commonly used objective tests include Mednick’s
Remote Association Test (1962; 1967), the Torrance Test of Creative Thinking
(1962), the Creativity Index (Gough, 1981) and the Rainmaker Index (Stevens
G A, Burley J, & Devine R, 1998). Of particular interest to this research is the
objective Guilford Divergence Test (Guilford J P, 1967) which provides a
reliable and basic starting point for assessing creative outputs in business
settings. The test proposes three measures of creativity: fluency, flexibility and
originality. Fluency is a measure of the number of options produced to solve a
problem (essentially a measure of volume). Flexibility is the number of distinct
themes that group the options proposed (essentially a measure of spread).
Originality is a measure of the rareness of the proposed options (essentially a
measure of unusualness or novelty). Thus the Guilford Divergence Test
provides one way to conceptualise what managers may call “operational
creativity”.
I define operational creativity (for this study) as a specific alternative
decision option that offers relatively increased creativity compared to a more
typical course of action. This can apply to making a decision or solving a
problem. Operational creativity options provide increased fluency, flexibility,
and/ or originality compared to the available alternative. For example, if an
employee is late for a sales meeting, various alternative route options are
available, each of which operationalises creativity. One route may be
considered because it offers many possible streets that could be taken
through a market district to get to the meeting (operational creativity:
fluency). Another approach to this problem might be to develop routes that

125
utilise different modes of transport other than car travel in order to avoid
traffic. This could include cycling through a park or catching a river ferry.
These alternative routes increase the spread of routes available for
consideration (operational creativity: flexibility). Finally, a quite rare approach
might be for an executive to take to the footpath on roller blades in order to
avoid traffic snarls (operational creativity: originality).
It is not the utility of these various options that is important from a creative
perspective. Instead, what is important is the fact that decision alternatives
are available in order to solve a problem. Additionally, it is not the
development of these creative options that is being considered in this study –
the creative options already exist and the employee is required to make a
decision regarding the relatively less creative (normal) option or the relatively
creative option.
Managers can increase both the preference and implementation for
operational creativity by increasing creative motivation in their organisations.
Three options are apparent from Amabile’s research cited above: specific
management interventions that increase the potential for intrinsic motivation,
insulating problem solvers from extrinsic motivation effects inherent in the
organisational environment, and/or utilising synergistic extrinsic motivators
(specific extrinsic motivators – for example, recognition – that enhance
creative motivation when intrinsic motivation is present).
Unfortunately, these options are not viable in many organisational
situations as some jobs just need to be done despite the lack of intrinsic
motivation involved. Performance imperatives in organisations are an
inescapable part of the business world. Incentives for superior performance
and sanctions for inferior performance act as non-synergistic extrinsic

126
motivators and reduce employee creative motivation. Being creative in some
organisational contexts may be regarded as non-conforming or deviant due
to the requirement to overcome (extrinsic) controls in order to be creative.
One approach to overcome these problems that is discussed below could be
for managers to use the various framing effects (I. G. Levin et al., 1998) to
unlock relevant intrinsic motivators. How the use of framing effects could
increase innovative and creative outputs has not been examined by previous
research.
Framing Effects
Framing effects cause changes in option preferences because of the
way a decision is presented. These effects activate perceptual biases or
distortions that cause decision makers to make different choices because
they weight aspects of the decision alternatives differently due when framing
effects are involved. As a result framing effects can cause decision makers to
be inconsistent in their preferences in a predictable way. Levin et al. (1998)
provide a useful typology that describes three types of framing effects: risk
based, attribute based, and goal behaviour. The independence of these
effects has subsequently been validated (Levin I P et al., 2007). These three
types of framing effects, and how they might affect creativity and/ or
innovation decisions, are explained further below.
Risk based Framing
Risk based framing effects were first reported by Tversky and Kahneman
(1981). Essentially, they showed that choices equivalent in their rational merit
were subject to perceptual distortions based on how the choice was
presented. Participants were presented with a simple decision involving two

127
options, both of which had equivalent expected returns after adjusting for risk.
Importantly, the decision could be framed in terms of gains or losses. For
example, an investment decision could be presented in terms of the potential
investment gains or in terms of potential investment losses. When posed with a
choice between a small, almost certain gain; and a risky, larger gain,
participants tended to favour the more certain option. When the decision
was reframed as a choice between a small, almost certain loss, or a larger,
risky loss, participants tended to favour the less certain option. This led Tversky
and Kahneman to determine a hierarchy of weightings that related to
choices involving the potential for gain and loss. Typically participants are
more sensitive to potential losses than potential gains. They are also more
sensitive to risk (variability of outcomes) than to the absolute magnitude of
gains or losses. These findings have been replicated extensively in other
research (for a review see I. G. Levin et al., 1998).
Risk based framing is potentially important to employees’ decisions
involving innovation and/or creativity because such decisions may be
perceived to involve a degree of risk. An innovative plan could be perceived
as a risky option with potential gains because of its breakthrough approach.
A creative option may offer potential gains otherwise unavailable using a
standard solution. However, both creative and innovative alternatives could
equally be perceived as unfavourably risky because they include untried and
unusual aspects. Risk based framing is only one of the framing effects
identified that may apply to innovation and creativity.

128
Attribute Framing
Attribute framing relates to how different weighted aspects of a choice
may be prioritised. Unlike risk based framing effects, attribute framing effects
apply to decisions where the outcomes are certain – in choosing a particular
option it is certain that all the attributes (positive and negative) associated
with that option are obtained. Shafir (1993) showed that when participants
were asked to choose from two options that involved a bundle of features
(attributes) that were both positive and negative, the positive features were
apparently more important than the negative features. When participants
were asked to reject an option, negative attributes became more important.
Shafir used this to show how attribute framing could be used to reverse the
preferences in a variety of domains.
Attribute framing effects apply to many situations including perceptions of
products, decisions about optional extras, and consent for surgical
procedures. For example, 75 per cent of lean meat is apparently better
tasting and less greasy than 25 per cent of fat meat (Levin I P & Gaeth G J,
1988); yoghurt that is zero per cent fat is apparently more attractive than 100
per cent fat free yoghurt (Janiszewski C et al., 2003); pizzas and cars tend to
be more expensive and feature laden when customers start with product
bundles and delete options, rather than building up their order from scratch
(Levin I P et al., 2002; Park et al., 2000); and more patients consent to surgery
when its discussed in terms of survival rather than mortality rates (Marteau T M,
1989; Wilson D K et al., 1987). Attributes seem to be pervasive concepts in
decision making. A special case of attribute framing relates to the descriptor
“free” in the case of volume offers for fast moving goods. According to
Gendall, Hoek, Pope and Young (Gendall, Hoek, Pope, & Young, 2006):

129
“…if using a volume promotion for fast moving consumer goods,
“buy x get one free” is likely to be more effective than “y for the
price of x”….”
If innovation and creativity are perceived as risk free qualities of the
presented options, then attribute framing effects may apply to such
decisions. We can imagine that a coffee proof laptop is “innovative”
compared to a regular laptop. A humorous TV advertisement is “creative”
compared to a regular one. Including an audio customer testimony in a
presentation to a Board of Directors to enhance its validity may be creative
and/ or innovative. In these contexts, innovation and creativity become
attributes, even though they are derived from other features (in these
examples, coffee resistance, humour and validity respectively). This suggests
that attribute framing effects could apply to decisions involving innovative
and creative options. In addition describing something as “innovative” may
elicit a disproportional positive or negative response similar to the positive
response elicited by the descriptor “free” as presented by the findings of by
Gendall et al. above.
Note that attribute framing effects potentially apply only when the
innovative or creative aspect already exists, that is, where creativity has
already been operationalised. In situations where the innovative or creative
aspect has yet to be developed, goal behaviour framing applies.
Goal Behaviour Framing
Goal behaviour framing relates decisions to change and the taking of
new actions in order to achieve a goal. For example, Meyerowitz and
Chaiken (1987) reported that women were more likely to undertake self
examinations of their breasts when they were told of the risks of not doing the

130
self examination, rather than when they were advised of the benefit. This
suggests that people tend to take more notice of potentially negative
consequences when choosing to modify their behaviour. This is the opposite
to attribute framing, where positive attributes were more important than
negative ones when making a decision. When attribute framing applies,
people tend to frame decisions positively if choosing. When goal behaviour
framing applies, people tend to frame decisions negatively.
Attribute and Goal Behaviour Framing Conflict
Goal behaviour framing and attribute framing are at first confounding
because they are so similar, and yet result in apparently contradictory
outcomes. Both are based on the idea of attaining something. Typically,
attribute framing involves a decision comparing tangible product features
and money costs, whereas goal behaviour framing relates an intangible
future personal benefit to having to change a habit. The apparent
contradiction comes from the fact that attribute framing seems to propose
positive attributes are more important when choosing product features,
whereas goal framing seems to propose that negative attributes are more
important when choosing whether or not change behaviour.
The key to understanding the two framing effects is to consider the
reference points inherent in the two scenarios: attribute framing requires a
comparison of the attribute (a tangible product feature) against a money
cost. Various researchers cited above have suggested that an attribute’s
perceived value is typically more concrete in a decision maker’s mind than
money (Kahneman D et al., 1990; I. G. Levin et al., 1998; I. P. Levin & Gaeth,
1988; I. P. Levin et al., 2002; Shafir, 1993). Because of this (in attribute framing
situations), the attribute’s positive aspect is most important. However, this is

131
reversed in the case of a change in behaviour – having to do something
different and new is seen as a significant cost, so the focus becomes on
whether or not it is worth making the effort.
An alternative explanation for the difference in attribute and goal
behaviour framing effects may simply be related to timing. Attribute framing
effects apply to choices where the gain (the attribute) will immediately be
realised. Goal behaviour framing effects have potential gains that are likely to
be manifested in the future.
People are more sensitive to loss than to gain (see Kahneman D et al.,
1990). Therefore, a choice between options with both attribute benefits and
money costs is typically framed positively with a focus on gain because the
attributes are more significant and immediate. A choice between options
with both intangible benefits and behavioural change is typically framed
negatively with a focus on reducing the change cost, because the decision
maker resists the change more than they value the intangible benefits which
will take time to materialise.
This argument suggests that goal behaviour framing and attribute framing
are similar effects with different reference points (tangibility and/or timing).
This assertion is significant to this study because how framing effects related to
creativity and innovation are investigated determines which framing effects
are likely to apply. For example, if a choice involving an innovative or creative
output of a problem solving effort is proposed, the innovative or creative
aspect becomes an attribute and attribute framing applies. However, as an
input to problem solving, an individual’s decision as to whether to try to be
innovative or creative is a goal behaviour framing situation.

132
Hypotheses
The overarching research question posed relates to identifying whether or
not innovation and operational creativity options elicit inherent decision
biases either way. Depending on the decision framing applied, innovation
and operational creativity options could invoke positive bias, negative bias,
or both positive and negative biases for decisions involving attribute framing
effects. Similarly innovation and operational creativity options could be
perceived to increase or decrease outcome certainty for decisions involving
risk based framing effects.
For example, relatively innovative options may be generally preferred over
non-innovative options regardless of whether the decision maker is choosing
or rejecting alternatives. Based on Shafir’s (1993) attribute framing effects
research cited above this would suggest that innovation in itself is perceived
simply as a positive attribute. Equally innovative options may be generally not
preferred over relatively non-innovative options in decisions framed as
choices and rejections. This would suggest that innovation is perceived simply
as a negative attribute. The key to this analysis is that if innovation is
perceived simply as either offering only benefits or offering only limitations,
then preferences for or against innovation should not change when choices
are reframed as rejections.
This need not be the case, however. An innovative option may be
preferred over a relatively non-innovative option only when the decision
maker is choosing between alternatives: when rejecting alternatives decision
makers may to tend reject relatively innovative options. In terms of Shafir’s
(1993) study cited above, this would make an innovative option “extreme”
(that is, the innovative option is perceived to be a bundle of both positive
133
and negative attributes). The above discussion contains an inherent
assumption about the way innovation is perceived that may not be
immediately apparent: it is assumed that innovation does not affect
perceptions of risk.
It may be that describing an option as creative or innovative affects the
decision maker’s perception of outcome certainty. Tversky and Kahneman
(1981) showed that in situations where equivalent options are presented as
risky potential gains, the more certain gain option is preferred. When these
decisions are reframed to present equivalent options as risky potential losses,
the less certain loss is preferred. If innovation is perceived to affect certainty, it
will likely increase risk because it has an inherent “liability of newness”. This
suggests that in decisions explicitly involving risk, relatively innovative options
will only be preferred when the alternatives are framed as potential losses.
When the same decisions are reframed as potential gains, the less innovative
option will be preferred because it will be perceived as more certain. The
following hypotheses summarise the above discourse to predict perceptual
biases could apply to innovation:
Hypothesis 1. Describing an option as innovative invokes an inherent
positive bias when choosing, which causes the option to be more
preferred than it otherwise would have been.
Hypothesis 2. Describing an option as innovative invokes an inherent
negative bias when rejecting, which causes the option to be less
preferred than it otherwise would have been.

134
Hypothesis 3. Describing an option as innovative invokes an inherent
uncertainty bias when choosing or rejecting, which causes the option
to be perceived as less certain
Hypothesis 3a. Describing an option as innovative will cause it to be
more preferred in decisions involving risk framing where options are
presented in terms of their potential losses
Hypothesis 3b. Describing an option as innovative will cause it to be
less preferred in decisions involving risk framing where options are
presented in terms of their potential gains
The above hypotheses are designed to test how inherent perceptual
biases can be invoked using “innovative” as a descriptor. However
operational aspects of creativity may also be naturally associated with
framing effects without any additional descriptors. For example, fluency and
flexibility increase options, and are therefore likely to be subject to attribute
framing. These operational creativity aspects could be associated with either
positive attributes or negative attributes, depending on the wording of the
question presented. For example, more volume could be considered as
offering more solutions (a positive attribute), however, it could also be
perceived as more work (a negative attribute). This dual nature of
fluency/flexibility suggests that these aspects are likely to be perceived both
positively and negatively, depending on the framing of the decision to be
made. Similarly, other operational creativity aspects would also be expected
to be considered as extreme.
Originality, novelty, deviance and divergence all represent change from
the status quo that can be considered as a positive or negative attribute.

135
Hence they are likely to be subject to attribute framing effects and
considered as extreme options when compared to non-original, traditional,
conforming and convergent options.
Hypothesis 4. Options with operationalised creativity elements will be
perceived to have positive attributes when choosing.
Hypothesis 4a. Options with enhanced fluency/flexibility will be
preferred when choosing over options with relatively less
fluency/flexibility.
Hypothesis 4b. Options with enhanced originality/novelty will be
preferred when choosing over options with relatively less
originality/novelty.
Hypothesis 4c. Options with enhanced divergence/deviancy will be
preferred when choosing over options with relatively less
divergence/deviancy.
Hypothesis 5. Options with operationalised creativity elements will be
perceived to have negative attributes when rejecting.
H5a Options with relatively less fluency/flexibility will be preferred when
rejecting over options with enhanced fluency/flexibility.
H5b Options with relatively less originality/novelty will be preferred
when rejecting over options with enhanced originality/novelty.
H5c Options with relatively less divergence/deviancy will be preferred
when rejecting over options with enhanced divergence/deviancy.

136
Method
Participants
The participants in this study were 107 postgraduate students (of whom 68
were currently also employed full time or part time) and 39 professional
employees. The postgraduate students were studying business either within a
business or creative industries faculty. The international nature of these
business programs ensured that participants were from a wide range of
nationalities, though most of the participants were Australian. Both genders
(81 males, 65 females) and a range of ages (18–55 years old) were present in
the sample. More than two thirds of the student participants were enrolled
part time (typically working full time as a professional or a manager) and the
rest were full time students. Participants prior MBA education ranged from nil
(this was their first class) to almost complete (several participants had to
complete only this class to graduate). Entry requirements ensured that all
participants had at least two years of work experience. Some students were
able to enrol in the program without an undergraduate degree provided that
they had extensive work experience. Thus the sample included current and
aspiring real world professionals.
The business employees were managers from a wide range of industries
including construction, mining, law, government, insurance, logistics,
consulting, energy, information technology and banking. Again, both
genders and a wide range of ages were represented, though the participants
were almost entirely Australian. This group was chosen from my past and
current consulting clients. Thus overall, despite the convenient nature of the

137
combined sample, it can be considered as maximally variant as defined by
Patton (1990) and therefore representative of employees in general.
Participants were told that the broad purpose of the exercise was to
investigate creative motivation. Students were told that their participation
would have no effect on student grades for the class, and that participation
was voluntary. All participants were told that their individual responses would
remain confidential and that the data would only be viewed in aggregate.
Procedure
Participants were asked to complete a questionnaire comprising 25
questions. There were two versions of the questionnaire (Set One and Set
Two). Both versions had 18 similar questions. Set Two had seven questions
where decisions presented as choices in Set One were reframed as rejections.
Various comparisons of aggregate responses to pairs of questions from Set
One were made. Additional comparisons of aggregate responses to Set One
choice questions reframed in Set Two rejection decisions were also examined.
The questions were all presented as simple, forced choice, binary decisions.
All of the examples (more than 100) cited in Levin et al. (1998) require a
forced choice between two alternatives. Some questions were very similar to
those used in Tversky and Kahneman’s original design (1981) – for example,
see question 8 below. Others were based on Shafir’s (Shafir, 1993) attribute
framing research, modified to provide responses relevant to operational
creativity and innovation (see questions 9 and 10 below). Shafir (1993)
provides significant precedence and validation for using similar questions
within the same survey to test framing effects. The cognitive load of the task
was such that only three participants reported noticing a similarity between

138
questions – for example, between questions 11 and 22 (shown further below).
Here is an excerpt from Set 1 including questions 8–10:
8 Suppose that you are in charge of a government
immunisation program to deal with an impending outbreak of a
rare disease: Lymphatic Anaemic Fever (LAF). This disease is
expected to kill 600 people. Two alternative programs have
been proposed to combat the disease. Which program would
you favour if costs for each program are the same?
A If Program A is adopted, 200 people will be saved.
B If Program B is adopted, there is a 1/3 chance 600 people
will be saved and a 2/3 probability that no one will be saved.
9 Suppose you are driving a friend to an important medical
examination and they advise you that they got the time wrong
and need to hurry. Which of the following routes would you
reject?
A The route you would normally travel.
B A potentially faster route with a short off-road section that
will be uncomfortably bumpy.
10 Imagine you have to make a decision about two similar
candidates for a job. Which of the following would you choose?
A The candidate who prioritises innovation.
B The candidate who prioritises compliance.
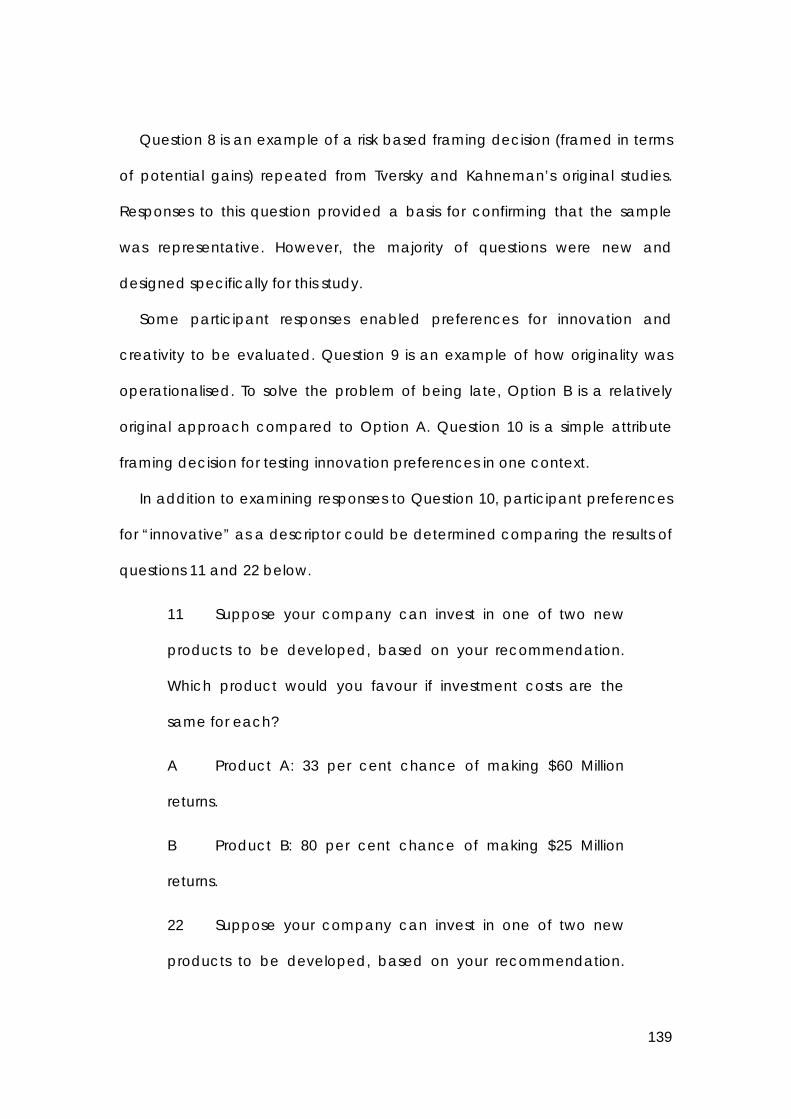
139
Question 8 is an example of a risk based framing decision (framed in terms
of potential gains) repeated from Tversky and Kahneman’s original studies.
Responses to this question provided a basis for confirming that the sample
was representative. However, the majority of questions were new and
designed specifically for this study.
Some participant responses enabled preferences for innovation and
creativity to be evaluated. Question 9 is an example of how originality was
operationalised. To solve the problem of being late, Option B is a relatively
original approach compared to Option A. Question 10 is a simple attribute
framing decision for testing innovation preferences in one context.
In addition to examining responses to Question 10, participant preferences
for “innovative” as a descriptor could be determined comparing the results of
questions 11 and 22 below.
11 Suppose your company can invest in one of two new
products to be developed, based on your recommendation.
Which product would you favour if investment costs are the
same for each?
A Product A: 33 per cent chance of making $60 Million
returns.
B Product B: 80 per cent chance of making $25 Million
returns.
22 Suppose your company can invest in one of two new
products to be developed, based on your recommendation.

140
Which product would you favour if investment costs are the
same for each?
A Product A is a very innovative product: 33 per cent
chance of making $60 Million returns.
B Product B is a non-innovative product line extension: 80
per cent chance of making $25 Million returns.
In question 11, Product B is typically preferred by more respondents
because it is less risky, even though it produces potentially lower returns. It is
evident that question 22 is exactly the same as question 11, except that the
least preferred option (Product A) was additionally described as “innovative”,
and the most preferred option (Product B) was described as “non-
innovative”. Thus any significant change in the preferred options between the
two questions would suggest whether or not “innovative” as a descriptor was
perceived more positively or negatively in a risk based framing context. A
change in preference could be due to “innovative” being associated with
simple attributes (positive or negative), extreme attributes (both positive and
negative) and/or risk.
Tversky and Kahneman’s (1981) study provides a test for whether or not an
option is risky: If an option is equally preferred regardless of whether the
decision is framed in terms of gains or losses, then it is not perceived to
increase risk. But if the preference for an option changes depending on
whether the choice is presented in terms of potential losses or gains, then the
option is perceived to include risk. The option is perceived as more risky than
its alternative if it is preferred in decisions framed in terms of potential loss and
not preferred in decisions framed in terms of potential gain. The reverse of this

141
also applies: the option is perceived as less risky than its alternative if it is
preferred in decisions framed in terms of potential gain and not preferred in
decisions framed in terms of potential loss.
Questions 11 and 22 above are “positively” framed because they present
the decision in terms of risky, potential gains. Questions 17 and 24 below show
the corresponding “negatively” framed options.
17 Suppose your company can invest in one of two new
products to be developed, based on your recommendation.
Which product would you favour if investment returns are the
same for each?
A Product A: 20 per cent chance of making $100 Million
loss.
B Product B: 80 per cent chance of making $25 Million loss.
24 Suppose your company can invest in one of two new
products to be developed, based on your recommendation.
Which product would you favour if investment costs are the
same for each?
A Product A is a non-innovative product line extension: 20
per cent chance of making $100 Million loss.
B Product B is a very innovative product: 80 per cent
chance of making $100 Million loss.
So if A (the innovative option) is preferred in Question 22 and B (again the
innovative option) is preferred Question 24, this would suggest two
conclusions. Firstly, that just describing an option as innovative made it

142
somehow more preferred in this context. Secondly, innovation would be
perceived as not increasing or decreasing risk in this context. Overall
innovation in this context could be considered as a net positive attribute that
did not implicitly invoke risk based framing effects.
Shafir’s work provides a test for whether or not an option is extreme: if an
option is preferred regardless of whether the decision is framed as either a
choice or a rejection, then it simply contains positive attributes. If an option is
not preferred regardless of whether the decision is framed as either a choice
or a rejection, then it simply contains negative attributes. But if the preference
for an option changes depending on whether the decision is presented as a
choice or rejection, then the option is extreme (that is it contains both positive
and negative attributes).
In order to determine whether or not innovation and/or operational
creativity elements were extreme, two sets of questions were created. The
difference between Set 1 and Set 2 questions was that 17 of the Set 2
questions were presented as a rejection of one option, rather than a choice
of one option.
For example, consider Question 22 in Set 1 and Set 2. In Set 1 the decision is
framed as a choice between A and B. In Set 2 the decision is framed as a
rejection of A or B. In each set, A is the innovative option. If A was chosen in
Question 22 Set 1 and yet rejected in the similar Question 22 Set 2, this would
suggest that the innovative option was considered extreme (that is,
contained both positive and negative attributes). If option A was preferred in
both Sets then innovation would be a simple, positive attribute. If option A
was not preferred in both Sets then innovation would be considered to be a
simple, negative attribute.

143
Table 1 summarises all the tests undertaken in this study:
TABLE 1 [Framing Effects Tested in this Study]
Perceptual
Bias Framing
Effect Decision
Type Innovation Operational
Creativity Expected
Result
Positive attribute All Choose
Tested
Tested Prefer
Negative attribute All Choose
Tested
Tested Reject
Extreme attribute Attribute Choose
Tested
Tested Prefer
Extreme attribute Attribute Reject
Tested
Tested Reject
Risky option Positive risk Choose
Tested
Not Tested Reject
Risky option Negative
risk Choose
Tested
Not Tested Prefer
Results
Data collection efforts yielded two quantitative data sets – selected
options (A or B) for each survey question in each of the two survey sets. To
determine if various innovation and creativity framing effects existed, various
pairs of similar questions (intra set and inter set) were compared. Chi-squared
analyses were used to determine if the distribution of responses from each
pair of comparable questions was significantly different.
Limitations of the Experimental Design
Potentially confounding variables in this experimental design were those
related to question interpretation heterogeneity, learning effects, class
environment, and interviewer response bias. The various questions proposed
were from very different knowledge domains (including investment, health
effects, recruitment decisions, career decisions and travel decisions).

144
Comparisons between responses were limited to questions in the same
knowledge domain to avoid confounding results due to domain differences.
From this perspective, the heterogeneous nature of the problems provides
support for the generalisation of the results to other unrelated problem
contexts.
As noted above at least three participants realised the similarity between
the questions that I intentionally paired within the survey. This suggests that
learning effects may be present. Unfortunately, previous research has not
been reported in significant detail to determine if learning effects were
prevalent. Learning in this context is a confounding variable because the
desire to make choices consistently could overwhelm or distort responses
designed to highlight framing effects. Learning effects are also potentially
confounding if they apply between otherwise unrelated questions within the
survey. Given the cognitive load of the surveys, overall learning effects are
expected to be low. Ex post discussions with respondents provided anecdotal
support for this assertion. This is further supported by the agreement of the
results from this study with previously accepted research. Specifically, the
participants’ responses to unmodified framing questions (copied from prior
studies) were equivalent to those previously reported.
This leaves only effects due to the survey environments as potentially
distorting. Research respondents were able to undertake surveys in a range of
environments: at work unsupervised, at work with my supervision, as the first
exercise in a class related to creative problem solving that I taught, and in
classes given by other lecturers unrelated to creative problem solving. Some
class environments would be expected to promote innovation and creativity
as positive attributes. This would manifest as additional extrinsic motivation in

145
the form of both control (that is, implied expectation) and intangible reward
(that is, recognition) in favour of creativity and innovation. If such an effect
had occurred, then the aggregate responses for questions from the
managers/professionals in the sample would appear to be significantly
different to the aggregate responses from the students. Chi-squared analyses
of responses from all Set 1 respondents (based on 39 managers and 63
students) did not reveal any significant differences for any of the questions.
The lack of significant differences seems to confirm that class specific
environmental effects are minimal and able to be ignored.
The final potentially confounding variable was interviewer response bias. It
would be expected that students in a creative problem solving class would
over report the need to be creative or innovative to the lecturer. If this was
true then aggregate responses from students in the creative problem solving
class in which I was the lecturer should be significantly different to the
aggregate responses of students from other classes. (The other classes were
related to leadership and marketing communications.) A second set of chi-
squared analyses of responses from all Set 1 student respondents (based on
22 lectured students and 41 other students) similarly failed to reveal any
significant differences for any of the questions. The lack of significant
differences seems to confirm that interviewer effects are minimal and able to
be ignored.
In summary, the main concerns for the study design were the presence of
potentially confounding variables that would be expected to distort
responses. Careful analysis of the responses suggests that none of these
confounding variables exhibited significantly measurable effects in this study.

146
Risk Based and Attribute Framing Results
Certain questions in the surveys essentially repeated prior studies’
investigations of risk based framing effects and attribute framing effects.
Figures 1–3 show that the sample responded similarly to risk based framing
effects as those participants tested by Tversky and Kahneman (1981). That is,
participants significantly (p<0.01, χ²=47.3, χ²=25.0, χ²=6.9 for Figures 1,2 and 3
respectively) preferred smaller, less risky, positive outcomes over larger, more
risky, positive outcomes for three different domains.
FIGURE 1
Expected Risk Based Framing Effects [Gambling]

147
FIGURE 2
Expected Risk Based Framing Effects [Saving/ Losing Lives]
FIGURE 3
Expected Risk Based Framing Effects [Company Investments]
Similarly three of the attribute framing results are in accord with those
reported in Shafir’s (1993) prior studies. A significant reversal of preference was
evident for decisions framed as a rejection of the least attractive option,
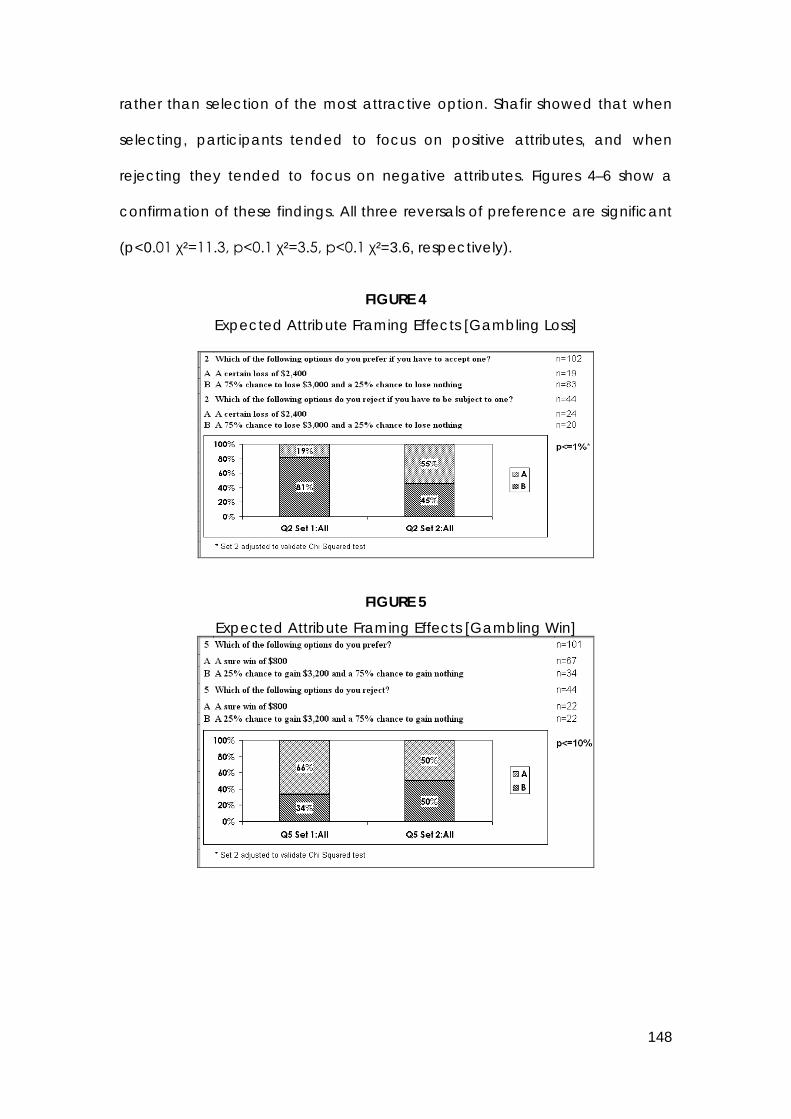
148
rather than selection of the most attractive option. Shafir showed that when
selecting, participants tended to focus on positive attributes, and when
rejecting they tended to focus on negative attributes. Figures 4–6 show a
confirmation of these findings. All three reversals of preference are significant
(p<0.01 χ²=11.3, p<0.1 χ²=3.5, p<0.1 χ²=3.6, respectively).
FIGURE 4
Expected Attribute Framing Effects [Gambling Loss]
FIGURE 5
Expected Attribute Framing Effects [Gambling Win]

149
FIGURE 6
Expected Attribute Framing Effects [Company Investment]
Note that even though figures 4–6 relate to questions involving risk, the
framing effect being measured is attribute framing. This is because the
second question in each figure is framed as a rejection rather than a choice.
The agreement of these results with Shafir’s (1993) study, whilst not
surprising, is important because it further establishes the representative nature
of the sample to support claims that other findings can be generalised.
Participants exhibited a significant reversal of preference (combined
p<0.01, d.f. = 5 χ²=23.9 for all three tests; and p<0.01 χ²=12.6, p <0.05 χ²=4.6,
p<0.05 χ²=5.0 for tests in Figures 7,8 and 9 respectively) when some of the
choices presented above were modified to include descriptors relating to
innovation (see figures 7–9). Figures 7–9 show comparisons for various
decisions involving innovation as a descriptor and risk based framing and
provide support for hypothesis 1.
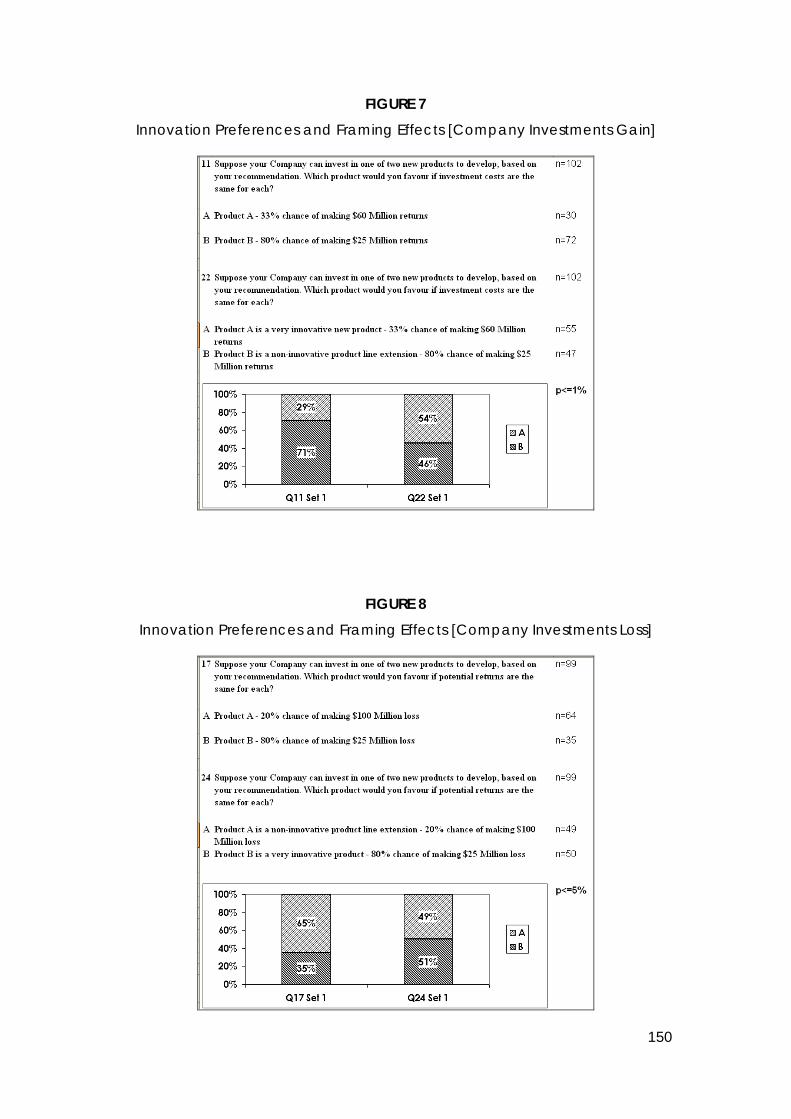
150
FIGURE 7
Innovation Preferences and Framing Effects [Company Investments Gain]
FIGURE 8
Innovation Preferences and Framing Effects [Company Investments Loss]

151
FIGURE 9
Innovation Preferences and Framing Effects [Saving Lives]
The consistent preference for the innovative option in both positive and
negative risk framed decisions in figures 7–9 suggests that innovation is not
perceived to increase risk. Participants also preferred innovative employees
over compliant employees whether choosing or rejecting. Figure 10 also
shows how the preference for innovative employees was significantly weaker
when rejecting (p<0.05 χ²=4.6). This suggests that innovation is perceived as a
net positive, extreme attribute. This provides support for both hypothesis 1 and
hypothesis 2.
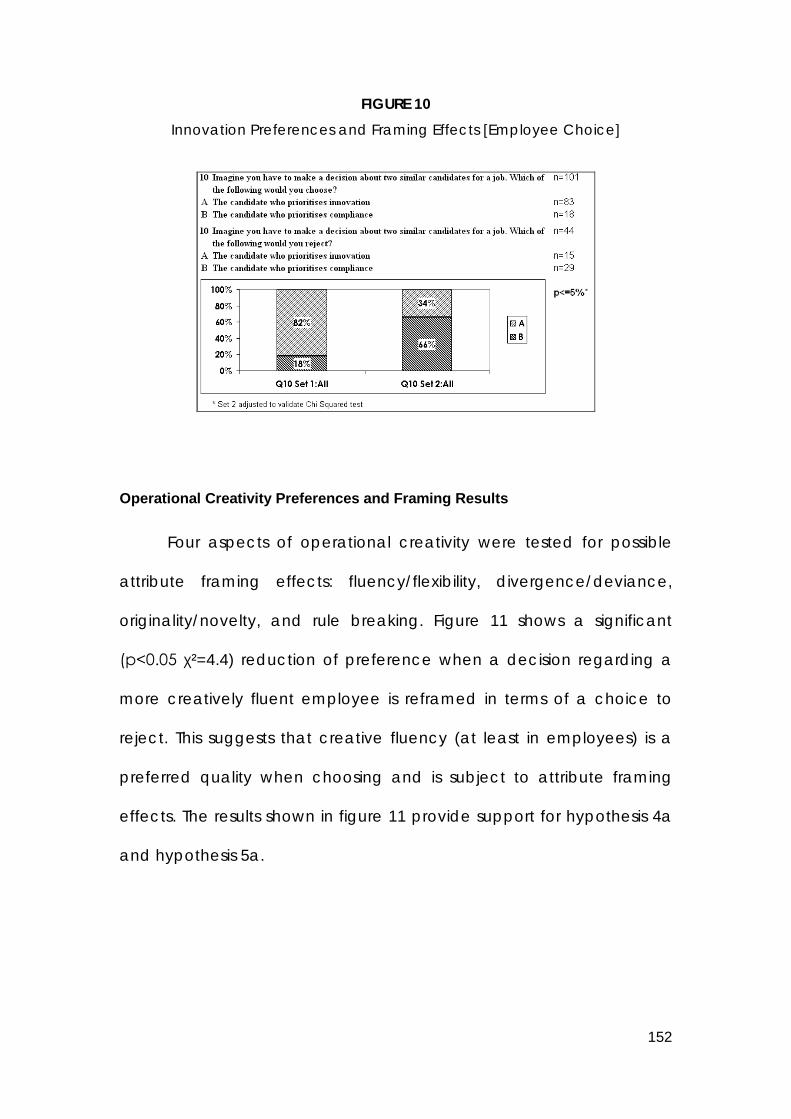
152
FIGURE 10
Innovation Preferences and Framing Effects [Employee Choice]
Operational Creativity Preferences and Framing Results
Four aspects of operational creativity were tested for possible
attribute framing effects: fluency/flexibility, divergence/deviance,
originality/novelty, and rule breaking. Figure 11 shows a significant
(p<0.05 χ²=4.4) reduction of preference when a decision regarding a
more creatively fluent employee is reframed in terms of a choice to
reject. This suggests that creative fluency (at least in employees) is a
preferred quality when choosing and is subject to attribute framing
effects. The results shown in figure 11 provide support for hypothesis 4a
and hypothesis 5a.

153
FIGURE 11
Fluency Preference and Attribute Framing Effects [Choosing an Employee]
Figure 12 shows a similar significant reduction of preference under attribute
framing conditions for decisions involving creative divergence: choosing an
employer (p<0.01 χ²=8.4). This suggests that creative divergence (in some
situations) is a preferred quality when choosing and is subject to attribute
framing effects. This provides support for hypothesis 4c and for hypothesis 5c.
FIGURE 12 Divergence Preference and Attribute Framing Effects [Choosing a Company]

154
Figure 13 shows a similar significant (p<0.01 χ²=19.3) reversal of preference
under attribute framing conditions for a decision involving a novel route. This
suggests that creative novelty (in some situations) is a preferred quality and is
subject to attribute framing effects. This provides support for hypothesis 4b
and 5c. In combination these results suggest that the various operational
creativity elements are all considered net positive attributes and are subject
to framing effects in some decision contexts. All of the options involving
operational creativity were to some extent extreme. This provides support for
hypothesis 4 and hypothesis 5.
FIGURE 13
Originality Preference and Attribute Framing Effects [Choosing a Route]
Discussion
The study’s results suggest that there are significant and important inherent
perceptual biases that apply to decisions involving innovation as a descriptor
and aspects of operational creativity. Innovation as a descriptor does seem
to be associated with inherent attribute framing effects. In general, describing
an option as innovative significantly increases the preference for this option

155
when choosing for decisions involving both risk based and attribute framing
effects. This supports Hypothesis 1. The results show that describing an option
as innovative significantly decreases the preference for this option when
decisions are framed as rejections rather than choices. This provides some
support for Hypothesis 2 and suggests that to some extent describing an
option as innovative activates positive and negative perceptual biases. The
lack of complete reversal of preferences when rejecting options described as
innovative (there was a reduction in preference only, however this was
significant) suggests that innovative as a descriptor is somewhat extreme. That
is innovative is, in general, perceived as mostly positive with some lesser
negatives.
Overall, the results suggest that risky options will be perceived as more
attractive if described as innovative, regardless of positive or negative
decision framing. This rejects Hypothesis 3 that the term “innovative” is
perceived to increase risk because if it did an option described as innovative
would be expected to be significantly less preferred in positively framed
decisions. Specifically, participants exhibited preferences for options
described as innovative that was even more powerful than the risk based
framing effects discovered by Tversky and Kahneman (1981) in the simple
binary decisions studied.
Overall, participants perceived “innovative” as a net positive attribute in
several different decision domains. Their preferences also suggested that
describing an option as innovative did not affect the perception of the
option’s inherent risk. It appears that simply describing a risky option as
innovative makes the option appear so attractive that this overcomes
concerns regarding the risks (to some significant extent) due to attribute

156
framing effects. This could suggest that managers can influence employees
to be more creative by describing certain options as innovative (even though
creativity may be perceived by employees as risky). However, caution is
advised.
Managers attempting to leverage this innovative descriptor perceptual
bias, need to be mindful that the decisions tested presented innovative
options as an objective aspect they could choose immediately, rather than
as a potential gain (some time in the future) to be achieved from a change in
behaviour. Employees deciding whether or not to pursue an approach that
could yield an innovation are likely to be subject to goal behaviour framing
rather than attribute framing. Thus they may still decide not to undertake the
behaviours required to produce innovations. Attribute framing effects are
best used as a way of influencing choices after the innovation has been
developed. Describing something as innovative does not seem (after the
thing has been created) to increase the perception of risk. However,
innovative options are apparently perceived as somewhat extreme. This
suggests that decisions involving innovation are more likely to be pro
innovation when presented as a choice rather than as a rejection. This is
similar to the findings relating to operational creativity framing effects.
Attribute framing effects inherently applied to decisions involving
operational creativity expressed as fluency/flexibility. Participants significantly
preferred employees that worked on many possible solutions rather than a
few probable solutions (approximately 2:1) when choosing. When rejecting
there was only a slight preference for the more fluent employee, with the
results almost equally split between employees that worked on many possible
solutions and those that worked on only a few probable solutions. This

157
supports both Hypothesis 4a and partially supports Hypothesis 4b: creative
fluency/flexibility is perceived as a positive, somewhat extreme attribute (that
is, fluency/flexibility is perceived positively overall, but with some inherent
negative attributes that are highlighted in decisions framed as rejections).
Perhaps a less focussed employee might be perceived to take longer to
complete tasks. The results suggest that participants were not very sensitive to
such negative attributes, and that fluency/flexibility was perceived mostly as
a positive attribute.
A similar result was found for divergence in two tests: a more divergent
company employer and a more innovative (less compliant) employee were
preferred (approximately 3:1 and 4:1 respectively) over less divergent options
when choosing. When rejecting the company employers, respondents
exhibited only a slight preference for the more divergent option. When
rejecting employees, the less compliant employee was still preferred (though
this dropped from around 4:1 to around 2:1). These results support Hypothesis
4c, and somewhat support Hypothesis 5c: creative divergence is perceived
as a positive, somewhat extreme attribute similar to creative fluency above.
Operational creativity expressed as originality was perceived as more
extreme.
A significant reversal of preference was found for the relatively original
idea of travelling off-road to a medical appointment to get there on time.
When framed as a choice preference, 3:1 were in favour of the more original
option, but framed as a rejection, the preference was 2:1 against the more
original option. This supports Hypothesis 4b and 5b, and suggests that
originality is perceived as a bundle of positive and negative attributes
(making it an extreme option). It may be that risk based framing effects also

158
apply to originality, though this cannot be concluded from the available
data. Of course, the result may measure more about the participants’
perceptions of travelling off-road than choosing an original route – so further
work is required to establish how far this conclusion can be generalised.
Despite the former caveat it does appear that in general attribute framing
effects are inherently invoked by aspects of operational creativity, though
they apply differently to different operational creativity aspects. In general,
participants preferred operational creativity aspects for some decisions when
choosing, and this preference generally lessened when rejecting. It seems
likely that most operational creativity aspects are not associated strongly with
risk, but they are considered at least somewhat extreme.
There was one decision where the preference for originality increased
when the decision was reframed from choosing to rejecting. This suggests
responses to decisions involving operational creativity are context specific,
and whilst fluency/flexibility and divergence/deviance operational creativity
aspects are mainly perceived positively, originality/novelty may be
associated with positive and negative aspects including risk.
Unfortunately, the results do not support a conclusion regarding whether or
not risk based framing effects apply to operational creativity aspects
because it was impossible to conceptualise and pose decisions involving
creativity under uncertain loss. It seems reasonable, however, to conclude
that the dominant framing effects associated with operational creativity are
attribute (not risk based) framing effects due to the fact that they were
generally perceived as preferable. These findings lead to some interesting
implications for managers who wish to utilise framing effects to increase (or
decrease) creativity and innovation within their organisations. However, due

159
to the context specific nature of operational creativity framing effects, it is
likely that these elements would be difficult for managers to utilise, even
without the complications associated with goal behaviour framing effects. It is
expected that framing effects are far easier to leverage with innovation
descriptors rather than with the operational creativity inherent in options.
Given the large number of tests where significant differences in
preferences were found it would seem that this study does offer valid findings.
However the large number of tests conducted increases the potential to find
significant results merely due to random effects. This cumulative Type I error
can be managed by determining a significance level based on the Sidak-
Bonferroni treatment see Shaffer (1995). Applying this calculation for the 9
significant items found, only results with p<0.002 should be considered as non
random; the other results above should be interpreted with caution. However
this correction approach might be too conservative because it increases the
potential for Type II errors even as it reduces the risk of Type I errors. There is
quite a reasonable chance that at least one test result could appear to be
significant to p<0.05 out of 25 tests when in fact no significance really existed.
However there is a much smaller chance that 9 in 19 tests would appear
significant just due to random effects. The chance for this can be calculated
as less than 0.0003 (for the derivation and calculations see Dew, 2008). This
suggests that the high proportional of apparently significant results in this study
should be considered as significant, because the potential for cumulative
Type 1 family wise error is vanishingly small.
The second potential concern regarding these tests is whether or not they
should be grouped together. This is not normally the case in prior studies of
framing effects due to the context specific nature of the decisions and

160
framing effects involved. In order to validate the use of independent chi
squared analysis of questions, various groups of related questions were
constructed and Cornbach's Alpha scores were calculated for each. The
results of this analysis are shown below in Figure 14.
FIGURE 14
Validation of Independence of Questions
Group Questions KR20 n
Fluency/ Flexibility 1,6,18 0.200 100
Originality/ Novelty 12, 25 0.362 101
Divergence 3,7,9,10,20 0.306 101
Rule Breaking 4, 23 0.427 102
Risk based framing 2,5,8,11,14,17,19,22,24 0.244 97
Personal money 2,5 0.303 101
People's lives 8,14,19 0.488 100
Product Investment 11,17,22,24 0.224 97
All 1-25 0.422 95
All of these results are below the 0.7 value normally used to validate scale
consistency. This suggests that the tests are not consistent and therefore are
not testing the same things, so grouping chi squared results is not necessary or
appropriate.
This finding is somewhat confounding at first, because questions in the
same group should theoretically be measuring the same thing. If this was the
case it would be expected that their Cornbach's Alpha scores would indicate

161
consistency. The reason for this discrepancy relate to the other contextual
aspects involved in the various questions. In particular (as with other framing
effects studies cited above) context seems to be a critical moderating
variable in how framing effects and preferences for creativity are evaluated.
Conclusion
Creative motivation seems to be affected by framing in complex ways.
Framing specific options with some operational creativity aspects may make
these alternatives generally more attractive in decisions framed as choices.
Describing an option as innovative will to some extent overcome risk concerns
and in any event, increases the preference for the option. However, whether
or not the perceptual distortions due to these framing effects are enough to
encourage behavioural change has not been tested. Thus managers who
wish to increase creativity and creative motivation in general should consider
describing certain decision alternatives as innovative in order to make them
appear more attractive and less risky. They should also try to frame decisions
involving innovation descriptors and operational creativity aspects as choices
rather than rejections. These influencing effects are expected to be weaker
under goal behaviour framing conditions (that is, when the innovative or
creative aspect of an option is less certain, less tangible and less immediate).
This is an important finding because framing effects are by their nature
external, and hence can act as surrogates for extrinsic motivation. Recall that
Amabile’s body of work (as outlined above) suggests that extrinsic motivators
almost universally dampen creativity, even when designed to enhance. These
findings support research that suggests certain kinds of supervisor approaches
enhance employee creativity (for example see George & Jing, 2007). It may

162
be that these supervisors actually instinctively used innovation descriptors and
operation creativity based framing effects in a way that enhanced employee
creative motivation. Further work is required to understand how relevant these
framing effects are to encourage innovation and creativity in terms of
behavioural change. In any event, it seems that framing effects can provide
a way to externally leverage inherent perceptual biases. By using framing
effects managers can activate intrinsic motivators for decisions involving
extant creativity and innovation, and perhaps enhance potential creativity
and innovation motivation during ideation.
163
References
Amabile, T. M. (1997). Entrepreneurial creativity through motivational synergy.
Journal of Creative Behavior, 31(1), 18-26.
Amabile, T. M. (1997). Motivating Creativity in Organizations: On Doing What
You Love and Loving What You Do. California Management Review,
40(1), 39-58.
Amabile, T. M. (1998).How to Kill Creativity. (Cover story). 76(5), 76-87.
Amabile, T. M., Hennessey, B. A. & Grossman, B. S. (1986). Social influences on
creativity: The effects of contracted-for reward. Journal of Personality
and Social Psychology, 50, 14-23.
Basadur, M. (2004). Leading others to think innovatively together: Creative
leadership. Leadership Quarterly, 15, 103.
Berkshire, S. D. (1995). Critical behaviors in innovative and creative decision-
making and problem-solving work groups. Massachusetts: Boston
University.
Cropley, A. J. (2000). Defining and measuring creativity: Are creativity tests
worth using? Roeper Review, 23(2), 72.
Deci, E. L., & Ryan, R. M. (1985). Intrinsic motivation and self-determination in
human behavior. New York: Plenum.
Dew, R. (2008). Cognitive Style, Creativity and Framing Effects Journal of
Creative Behaviour (under review)
DiLiello, T. C., & Houghton, J. D. (2006). Maximizing organizational leadership
capacity for the future. Journal of Managerial Psychology, 21(4), 319.
Drucker, P. F. (2004). The Way Ahead. Executive Excellence, 21, 3.

164
Ford, C. M. (2002). The futurity of decisions as a facilitator of organizational
creativity and change. Journal of Organizational Change
Management, 15(6), 635.
Ford, C. M., & Gioia, D. A. (2000). Factors Influencing Creativity in the Domain
of Managerial Decision Making. Journal of Management, 26(4), 705-
732.
Gendall, P., Hoek, J., Pope, T., & Young, K.. (2006). Message framing effects on
price discounting. Journal of Product & Brand Management, 15(7),
458-465.
George, J. M., & Jing, Z. (2007). Dual tuning in a supportive context: Joint
contributions of positive mood, negative mood, and supervisory
behaviors to employee creativity. Academy of Management Journal,
50(3), 605-622.
Gough, H. (1981). Studies of the Myers-Briggs Type Indicator in a personality
assessment research institute. Paper presented at Fourth National
Conference on the Myers-Briggs Type Indicator
Gryskiewicz, S. S. (2000). Creating Positive Turbulence. Association
Management, 52, 46.
, Stanford University, CA.
Gryskiewicz, S. S. (2000). Positive Turbulence. Executive Excellence, 17, 18.
Guilford, J. P. (1967). The nature of human intelligence. New York: McGraw-
Hill.
Hennessey, B. A. (1989). The effects of extrinsic constraints on children's
creativity while using a computer. Creativity Research Journal 2, 151-
168.
Hennessey, B. A., & Amabile, T. M. (1998). Reward, Intrinsic Motivation, and
Creativity. American Psychologist, 6, 674-675.

165
Janiszewski, C., Silk, T., & Cooke, A. D. J. (2003). Different Scales for Different
Frames: The Role of Subjective Scales and Experience in Explaining
Attribute-Framing Effects. Journal of Consumer Research 30(3), 311-325.
Jaskyte, K., & Kisieliene, A. (2006) Determinants of Employee Creativity: A
Survey of Lithuanian Nonprofit Organizations. Voluntas,17(2), 128.
Kahneman, D., Knetsch, J. L., & Thaler, R. H. (1990). Experimental Tests of the
Endowment Effect and the Coase Theorem. Journal of Political
Economy, 98, 1325-1348.
Kashdan, T. B., & Fincham, F. D. (2002). Facilitating creativity by regulating
curiosity. The American Psychologist, 57(5), 373.
Kruglanski, A. W., Friedman, I., & Zeevi, G. (1971). The effects of extrinsic
incentive on some qualitative aspects of task performance. Journal of
Personality and Social Psychology, 39, 606-617.
Leavy, B. (2002). Creativity: The new imperative. Journal of General
Management 28(1), 70.
Levin, I. P., & Gaeth, G. J. (1988). Framing of attribute information before and
after consuming the product. Journal of Consumer Research, 15, 374–
378.
Levin, I. P., Gaeth, G. J., Schreiber, J., & Lauriola, M. (2007). A New Look at
Framing Effects: Distribution of Effect Sizes, Individual Differences, and
Independence of Types of Effects. Iowa, University of Iowa.
Levin, I. P., Schreiber, J., Lauriola, M., & Gaeth, G. J. (2002). A Tale of Two
Pizzas: Building Up from a Basic Product Versus Scaling Down from a
Fully-Loaded Product. Marketing Letters, 13(4), 335.
166
Levin, I. G., Schneider, S. L., & Gaeth, G. J. (1998). All Frames Are Not Created
Equal: A Typology and Critical Analysis of Framing Effects.
Organizational Behavior And Human Decision Processes, 76(2), 149-188.
Lonergan, D. C., Scott, G. M., & Mumford, M.D. (2004). Evaluative aspects of
creative thought: Effects of appraisal and revision standards. Creativity
Research Journal, 16(2), 231-246.
Marteau, T. M. (1989). Framing of information: Its influence upon decisions of
doctors and patients. British Journal of Social Psychology, 28, 89–94.
Mednick, S. A. (1962). The associative basis of the creative process.
Psychological Review, 69, 220-232.
Mednick, S. A., & Mednick, M. T. (1967). Examiner's Manual." Remote
Associates Test." College and Adult Forms 1 and 2.
Meyerowitz, B. E., & Chaiken, S. (1987). The effect of message framing on
breast self-examination attitudes, intentions, and behavior. Journal of
Personality and Social Psychology, 52, 500-510.
. Boston, Houghton
Mifflin.
Mintzberg, H., & Sacks, D. (2004). The MBA Menace. Fast Company, 31-32.
Oldham, G. R., & Cummings, A. (1996). Employee creativity: Personal and
contextual factors at work. Academy of Management Journal, 39(3),
607.
Park, C. W., Sung Youl, J., & MacInnes, D. J. (2000). Choosing what I want
versus rejecting what I do not want: An application of decision framing
to product option choice decisions. JMR, Journal of Marketing
Research 37(2), 187.
Patton, M. Q. (1990). Qualitative evaluation and research methods. London:
SAGE Publications.

167
Plsek, P. E. (1997). Creativity, Innovation and Quality. Milwaukee: ASQ Quality
Press
Redmond, M. R., Mumford, M. D., & Teach, R. (1993). Putting Creativity to
Work: Effects of Leader Behavior on Subordinate Creativity.
Organizational Behavior & Human Decision Processes, 55, 120.
Reiter-Palmon, R., & Illies, J. J. (2004). Leadership and creativity: Understanding
leadership from a creative problem-solving perspective. Leadership
Quarterly, 15, 55.
Sadler-Smith, E. (2004). The intuitive executive: Understanding and applying
'gut feel' in decision-making. Academy of Management Executive,
18(4), 76.
Shafir, E. (1993). Choosing Versus Rejecting: Why Some Options are Both Better
and Worse Than Others. Memory and Cognition, 21, 546-556.
Simonton, D. (2003). Creativity as variation and selection: Some critical
constraints. Critical creative processes, 3-18.
Stevens, G. A., Burley, J., & Divine, R. (1998). Profits & Personalities:
Relationships Between Profits from New Product Development and
Analysts' Personalities. Paper presented at the 1998 Research
Conference at the Annual International Conference of the Product
Development and Management Association, Atlanta, GA.
Tierney, P. & Farmer, S. M. (2004). The Pygmalion Process and Employee
Creativity. Journal of Management, 30(3), 413.
Tierney, P., Farmer, S. M., & Graen, G. B. (1999). An examination of leadership
and employee creativity: The relevance of traits and relationships.
Personnel Psychology, 52(3), 591.
Torrance, E. P. (1962). Guiding creative talent. New Jersey: Prentice-Hall.

168
Tversky, A. & Kahneman, D. (1981). The Framing of Decisions and the
Psychology of Choice. Science, 211, 435-458.
Välikangas, L., & Jett, Q. (2006). The golden spur: innovation independence.
Strategy & Leadership, 34(5), 41.
Williams, S. D. (2004). Personality, attitude, and leader influences on divergent
thinking and creativity in organizations. European Journal of Innovation
Management, 7(3), 187.
Wilson, D. K., Kaplan, R. M., Schneiderman, L. J. (1987). Framing of decisions
and selections of alternatives in health care. Social Behaviour, 2, 51–59.
Woodman, R. W., Sawyer, J. E., & Griffin, R. W. (1993). Toward a theory of
organizational creativity. Academy of Management Review, 18(2),
293.

169
Chapter 3: Cognitive Style, Creativity and Framing Effects
Abstract
This study investigates how individuals with different cognitive styles
respond to choices involving framing effects. The results suggest that
cognitive style as defined by Kirton (1976) is far more complex than
previous studies indicate. Kirton characterises “Innovators” as rule
breakers and “Adaptors” as conformists. The most important finding of
this study is that in some decision contexts, Innovators and Adaptors
exhibit similar preferences for rule breaking. In other situations, Adaptors
actually prefer non-conformity in comparison to Innovators. The study
analysed responses from 146 university students and professional
managers to 25 binary choices involving investment decisions, job
choices and travel routes. The questions were constructed to reveal
significant reversals of preference related to risk and attribute based
framing effects. Additionally, some questions were constructed to
reveal preferences for certain operational aspects of creativity. Overall,
the results suggest that framing effects may provide an important tool
for unlocking individual creativity in organisations, as long as cognitive
style and context are carefully taken into account.
Keywords: Framing Effects, Creativity, Motivation, Cognitive Style

170
Introduction
Employee creativity is essential for organisational effectiveness (Woodman,
Sawyer & Griffith, 1993). However, organisations seem to be constructed by
default to prevent creativity. Assink (2006) explains how factors including a
successful business strategy, risk-reducing culture, and reliance on previously
successful mental models can reduce firms’ innovation capabilities. Elsbach
and Hargadon (2006) argue that overwork and high pressure for performance
are significantly damaging to professional creativity, and advocate
recuperation periods of so called “mindless” work to improve this
predicament. These examples are symptomatic of a general management
paradox: the management approach required to foster organisational
creativity appears to be the antithesis of good management.
This apparent paradox may explain why organisational creativity is such a
challenge, according to Välikangas and Jett (2006), and why Leavy (2002) is
critical of organisational attempts to manage creativity over the last decade.
Ultimately, creativity within an organisational context is affected by individual
decisions about whether or not to choose “creative” options over more
“traditional” options. Whilst there is a growing body of research that relates to
how the organisational environment affects these kinds of choices, there is no
work examining how the framing of choices and an individual’s cognitive
style affect decisions involving creativity.
This study investigates whether or not framing effects apply differently to
individuals with different cognitive styles when making decisions, including
those that involve relatively creative and normal alternatives. The study uses

171
Kirton’s (1976) classification for individual problem solving preferences to
measure cognitive style. This classification – the Kirton Adaption–Innovation
Inventory (KAI) – is specifically relevant to decision making in organisational
contexts because according to Kirton’s research, this variation in individuals’
cognitive styles elicits different responses to organisational cues relating to
creativity.
This paper investigates how framing effects and cognitive style affect
employee decisions involving creative alternatives. Amabile’s research (1998)
shows that extrinsic motivators (even rewards) tend to dampen creativity.
Most employee management controls are by definition extrinsically
motivating (and so damaging to creativity). Framing effects are interesting
because despite being externally imposed, they cause internal perceptual
distortions. Thus, framing effects may be useful for managers to solve the
problem of how to utilise extrinsic controls without dampening creativity.
It is expected that individuals’ cognitive styles vary the responses to framing
effects, because of different sensitivity to some aspects of a decision. For
example, Kirton suggests that Adaptors are more inclined to make decisions
that conform to the status quo rather than break rules, as Innovators prefer to
do. Thus, a decision framed in a way that highlights how an option conforms
to or disrupts the status quo would be expected to result in different
preferences for Adaptors and Innovators in general.
This paper investigates key features of cognitive style, creativity in
organisations and framing effects. Experimental results are presented that
compare decisions made by participants with different cognitive styles.
Analysis of these results provides a deeper understanding of how cognitive
style affects decisions involving framing effects and creativity. Finally, some

172
implications for managers are presented that suggest how to frame
employee decisions in order to enhance organisational creativity.
Cognitive Styles
Kirton’s KAI (1976) is a measure of cognitive style that describes individual
problem solving preferences in an organisational context. KAI has been
empirically validated by many researchers (Keller & Holland, 1978; Goldsmith
& Matherly, 1987; Taylor, 1989; Foxall & Hackett, 1992; Riley, 1993; Fleenor &
Taylor, 1994) and is considered a reliable and consistent measure of cognitive
style. A KAI score for cognitive style ranges from 32–160 and can be
determined from 32 question responses. The overall normal population
exhibits a mean KAI of 96 with a standard deviation of 13.
The KAI scale was synthesised from three independent scales relating to
problem solving: originality (relating to preferences for unusual, unorthodox or
novel ideas); efficiency (relating to orderly, appropriate and detailed
behaviour); and conformity (acceptance of group norms, paradigms and
prevailing rules). Innovators report KAI scores greater than 96. Adaptors
typically report lower scores. According to Kirton’s descriptions, Innovators are
motivated to break rules and make large changes, whereas Adaptors prefer
to conform to current rules and make incremental changes. Kirton (1976)
pejoratively describes Adaptors as “preferring to do things better”, and
Innovators as “preferring to do things differently”.
Adaptors solve problems differently to Innovators – they are less likely to
propose radical solutions, and they are more likely to completely implement
known problem solutions. Hammerschmidt (1996) showed that cognitive style
determined a role preference for either designing or implementing solutions.
173
The reasons for this may lie in the other aspects of cognitive style reported by
other researchers.
For example, self esteem positively correlates to KAI scores (Keller & Holland,
1978; Houtz, Denmark, Rosenfield & Tetenbaum, 1980; Goldsmith & Matherly,
1987). In these studies, self esteem (an individual’s sense of importance or self
worth) was generally reported as higher for Innovators. Similarly, Innovators
are significantly more tolerant to ambiguity (Keller & Holland, 1978) as a
group, and are more likely to exhibit an internal locus of control (Keller &
Holland, 1978; Tetenbaum & Houtz, 1978; Houtz et al., 1980; Engle, Mah &
Sadri, 1997; Luck, 2004). Wunderley, Reddy and Dember (1998) also found
Innovators are more optimistic. These characteristics are potentially important
for exhibiting creativity in organisations.
Within an organization, there is often a general requirement to overcome
management controls in order to be creative in many problem solving and
decision contexts. This can result in creativity being perceived as non-
conforming or deviant. Thus, Innovators are often perceived to be more
creative (or at least willing to be more creative) within organisations, despite
Kirton’s (1978) assertion that neither cognitive style is inherently more capable
of creativity. Measurements of creativity are required to understand these
conflicting assertions.
Creativity in Organisations
Creativity in business can be measured by creativity tests and used as a proxy
for quantifying creativity. Cropley (2000) identified at least 255 different tests
for measuring creativity, but argued that subjective creativity tests were not
reliable predictors of creative outputs. Commonly used objective tests include
174
the Torrance Test of Creative Thinking (Torrance, 1962), Mednick’s Remote
Association Test (Mednick, 1962; Mednick & Mednick, 1967), the Creativity
Index (Gough, 1981) and the Rainmaker Index (Stevens, Burley & Divine,
1998).
Guilford’s (1967) Divergence Test (GDT) is useful in business settings for
measuring creative outputs because it is simple and reliable. GDT measures
creativity in three ways: fluency, flexibility and originality. Fluency is the GDT
measure of creative volume – having more options to solve a problem equals
more creative fluency. Flexibility is a measure of spread – having more distinct
categories of potential solutions means more creative flexibility. Fluency and
flexibility are essentially counts of the options proposed and of their different
categories, respectively. Originality is a measure of novelty or unusualness. It is
determined by how rare the options proposed are in comparison to the
normal population’s responses. GDT provides definitions for operationalising
creativity. A creative option may offer more fluency, flexibility or originality
than a more traditional (i.e. relatively non-creative) option. As discussed
above, decisions involving both creative and non-creative alternatives will be
subject to framing effects.
Framing Effects
Levin, Schneider and Gaeth (1998) classified three types of framing effects:
risk based, attribute, and goal behaviour. Research has subsequently
validated the independence of these effects (Levin, Gaeth & Schreiber,
2007). Risk based framing and attribute framing are applicable to this study.
Goal behaviour framing was not applicable to the methodology of this study.
175
Tversky and Kahneman (1981) discovered risk based framing effects and
showed how perceptual distortions reduced rationality in decision making.
Subjects tended to choose sure gains over larger risky gains. However, if a
similar decision was framed in terms of its potential losses, subjects preferred
risky larger losses over unavoidable smaller losses. Tversky and Kahneman
discovered that for decisions involving potential gains and/or losses, how the
decision is presented can significantly influence the decision maker’s
preference.
It is apparent that risk based framing would be expected to be correlated to,
or moderated by cognitive style. Innovators would be expected to be more
prepared to take risks than Adaptors due to their preference for rule breaking
and tolerance for ambiguity. To the extent that creative options can be
perceived as risky or variable decisions within organisations, framing effects
should apply to decisions involving creative and non-creative alternatives.
Risk based framing is not the only framing effect to have been investigated
previously. Another kind of framing effect, “attribute framing”, may also be
correlated to or moderated by cognitive style. Attribute framing effects relate
to how different elements in a decision may be weighted due to the way that
the decision is presented. Shafir (1993) presented subjects with choices that
involved both positive and negative attributes. Unlike the risk based framing
decisions investigated by Tversky and Kahneman, Shafir’s alternatives did not
include quantifiable risks.
Shafir contrived one option to be enriched with more positive and more
negative features combined, when compared with a more moderate
alternative. He then asked participants to either choose or reject one of the
options (the enriched option or the moderate option). When decisions were

176
presented a choice, more subjects tended to prefer the enriched option.
However, when the same decision was reframed as a rejection of one option,
more subjects tended to prefer the moderate option.
Shafir attributed this reversal of preference to positive and negative framing.
When dealing with decisions framed as a choice, participants tended to
consider only the positive aspects of the alternatives, and thus preferred the
enriched option. (The enriched option had greater positive attributes than the
moderate option.) When the same decision was presented in a way that one
alternative had to be rejected, participants tended to focus on the negative
aspects of the alternatives. This meant that the enriched option was
perceived as worse than the more moderate option. Thus, depending on how
a decision was framed (as a choice or as a rejection), people were more or
less likely to prefer the enriched option over the moderate option. Shafir
called this enriched option the “extreme” option.
Attribute framing would be expected to apply differently to subjects
depending on their cognitive styles, especially if the enriched attributes
included ambiguous, non-conforming or non-efficient aspects. Often creative
alternatives are perceived as having more extreme positive and negative
attributes than more traditional solution alternatives. This suggests that
attribute framing effects are likely to apply to decisions involving creative and
non-creative alternatives.
Hypotheses
Framing effects have been examined in a variety of domains (e.g. consumer
behaviour, gambling situations, and health related contexts) and have been
assumed to apply universally. However, no empirical research could be found

177
that investigated how cognitive style correlates to, or moderates framing
effects, even though decisions in an organisational context and decisions
involving operationalised creativity are affected by cognitive style. Thus, the
basic research question is how risk based framing effects, attribute framing
effects, and cognitive style interact with decisions including those that involve
operationalised creativity options.
In general, Innovators are expected to be less sensitive to risk on average due
to their relatively higher tolerance for ambiguity, optimism, self esteem, and
their preference for rule breaking. This would suggest that Adaptors are more
likely to have their decision preferences influenced by risk based framing
effects.
H1Innovators will tend to be less affected by risk based framing compared
to Adaptors
Adaptors and Innovators are likely to perceive operational creativity aspects
differently as well. Operationalised creativity alternatives are expected to be
more preferred than normal options by Innovators (compared to Adaptors)
regardless of the type of operationalised creativity involved in the decision.
Operationalised creativity options inherently increase ambiguity by
generating more options to solve the problem at hand. Operationalised
creativity presents non-conforming approaches when compared to reuse of
tried and true solutions. Finally, operationalised creativity is typically less
efficient when it results in more work and increasing complexity.
Preference for operationalised creativity can depend on what inherent
aspects are being considered. For example, when comparing a less creative
option to a more fluent option, a decision maker may compare positive or
negative aspects of the two alternatives in making a decision. The fluent

178
option includes more potential for success perhaps because it contains more
volume, but is also more work. If a decision maker focuses on success
potential, the fluency is preferred, but if they focus simply on the task at hand,
then fluency is rejected. Options that contain both positives and negatives
are called extreme options.
Innovators are expected to be more sensitive to the positives and less
sensitive to the negatives associated with operationalised creativity options.
This suggests that Innovators will not perceive operationalised creative options
as extreme options as defined above. Adaptors are expected to be more
sensitive to the perceived negatives of operationalised creativity options and
therefore perceive these alternatives (compared to more normal
approaches) as extreme.
Rule breaking is associated with creativity in organisational contexts (as a
special case of deviance or divergence). By its nature, rule breaking is risky
and therefore should be associated with risk based framing effects. Given
Kirton’s description of Innovators and Adaptors, rule breaking would be
expected to be positively attributed by Innovators relative to Adaptors.
H2 Innovators will more strongly prefer operationalised creativity
alternatives
H2a Innovators will prefer relatively more fluent/flexible options
H2b Innovators will prefer relatively more original/novel options
H2c Innovators will prefer relatively more divergent/deviant options
H2d Innovators will prefer relatively more rule breaking options
H3 Only Adaptors will perceive operationalised creativity alternatives
as extreme
179
H3a Only Adaptors will perceive relatively more fluent/flexible options
as extreme
H3b Only Adaptors will perceive relatively more original/novel options
as extreme
H3c Only Adaptors will perceive relatively more divergent/deviant
options as extreme
H3d Only Adaptors will perceive relatively more rule breaking options
as extreme
Methods and Participants
This study was based on subjects’ responses to one of two questionnaires,
each with 25 binary decisions. Some questions were based on Shafir’s (1993)
attribute framing research, and the rest were the same or similar to questions
presented by Tversky and Kahneman (1981). The study participants included
39 managers and 107 postgraduate students. Whilst the study was a
convenience sample, it is also considered maximally variant, and therefore
representative of aspiring and current managers as outlined below.
The postgraduate students were enrolled in creative industries or business
faculties, and studying business. A wide range of nationalities was
represented due to the international enrolment in these programs, with
Australian students being predominant. Male and female subjects’ ages
ranged from 18–55, though neither variable was recorded. Most students
(more than two thirds) worked as full time managers and were enrolled part
time. The rest were enrolled as full time students. For some of the MBA
students, this was their first class, and for others, this was their final class prior to

180
graduation. For admission into the course, students needed a minimum of two
years’ prior work experience. Some students had more extensive work
experience and were accepted into their course programs without an
undergraduate degree.
The business managers from a range of industries were represented in the
manager sample. These included banking, construction, consulting, energy,
government, information technology, insurance, law, and logistics. Whilst this
group was entirely Australian, a variety of ages and both genders were
represented.
All participants were informed that the study was related to investigating
creative motivation. Students were informed that their participation was
voluntary and their involvement (or choice not to participate) would not have
any bearing on their grades. All participants were informed that the data
would only be presented in aggregate, with individual answers kept
confidential.
At the beginning of the study, all participants completed an online KAI survey
that established their cognitive style. The KAI scores were used to group
Innovators’ and Adaptors’ responses together respectively for the
quantitative analyses. There were 95 Innovators and 51 Adaptors who
responded. The mean KAI score was 102.3 with a standard deviation of 14.5.
(A normal population has a mean KAI score of 96 with a standard deviation
of 13.) This sample mean is higher than the upper 95% confidence limit of 99.6
(for a representative sample); however, this does not confound the analysis.
Chi squared analysis enables comparisons between subgroups of different
sizes. As a result, any sample used does not need to be representative of the
181
general population when comparisons between different subgroups (in this
case cognitive styles) are to be made.
Procedure and Instruments
The experimental questions were designed to measure participants’
responses to decisions involving risk based and attribute framing effects. The
questions also enabled comparisons of subjects’ preferences for
operationalised creativity alternatives over more normal options. All of the
questions were presented as a forced choice between two alternatives
similar to the many examples cited in (Levin et al., 1998).
Some questions related to risk based framing were adapted from Tversky and
Kahneman’s (1981) study. For example, see question 8 and 11 below:
8 Suppose that you are in charge of a government
immunisation program to deal with an impending outbreak of a
rare disease: Lymphatic Anaemic Fever (LAF). This disease is
expected to kill 600 people. Two alternative programs have
been proposed to combat the disease. Which program would
you favour if costs for each program are the same?
A If Program A is adopted, 200 people will be saved.
B If Program B is adopted, there is a 1/3 chance 600 people
will be saved and a 2/3 probability that no one will be
saved.
11 Suppose your company can invest in one of two new
products to be developed, based on your recommendation.

182
Which product would you favour if investment costs are the
same for each?
A Product A: 33 per cent chance of making $60 Million
returns.
B Product B: 80 per cent chance of making $25 Million
returns.
Both of the above questions are framed in terms of potential benefits (lives
saved) or gains (money returns). Because of this, most participants were
expected to choose the more certain of the alternatives presented (option A
in question 8 and option B in question 11). Participants could additionally be
expected to choose the more risky alternative when similar decisions were
presented in terms of potential detriments and losses rather than gains. These
expected responses provided a method to validate that the overall sample
was representative of the normal population.
The main hypothesis testing was completed by comparing the responses of
Innovators to those of Adaptors for each question. Innovator (KAI>96) and
Adaptor (KAI<=96) sub groups were determined for each question and
analysed using chi squared methodology. This enabled any significant
differences in risk framing effects due to cognitive style to be determined in
order to determine H1’s validity. Different binary decisions were presented for
testing H2 and H3 using the same chi squared analysis of Innovator and
Adaptor sub group preferences. For example, question 9 below shows a
decision contrived to determine preferences for originality/novelty.
9 Suppose you are driving a friend to an important medical
examination and they advise you that they got the time wrong

183
and need to hurry. Which of the following routes would you
choose?
A The route you would normally travel.
B A potentially faster route with a short off-road section that
will be uncomfortably bumpy.
In the question above, option B represents an operationalised creativity
alternative to taking a normal route. This alternative presents some potential
benefits (i.e. it could be faster), but it is also strange (non-conforming)
because it is off-road and at least partly detrimental due to being bumpy. If
H2 holds, Innovators would be expected to be less negative than Adaptors
about the off-road non-conformance aspect of option B. This would suggest
that Innovator preferences for option B should be significantly greater than
Adaptor preferences.
Note that this combination of benefits and detriments also suggests that
option B could be perceived as extreme. This can be tested using a method
derived from Shafir’s (1993) study. Extreme options tend to be preferred when
presented within decisions framed as a choice like the Question 9 example
above. They also tend to be rejected within decisions framed as a rejection.
Question 9 above could be reworded so that the decision maker was asked
which option they would reject. In this case, it would be expected that
preferences for option B would significantly reduce and potentially reverse
due to attribute framing effects. Asking decision makers which option they
reject focuses them on the negative attributes of both decision alternatives. In
this case, option A has no negatives, so it is potentially superior to option B
(which is bumpy and non-conforming). Again Adaptors would be expected

184
to show this change in preference more significantly than Innovators,
because the non-conformance is expected to be perceived as a potential
positive by Innovators.
The comparison proposed above required two sets of questions to be
created. Set 1 questions were mostly framed as choices. In Set 2, 17 of the 25
questions from Set 1 were reframed as rejections in order to identify
operationalised creativity options that were perceived as extreme.
Limitations of the Experimental Design
Question interpretation differences, class environment, learning effects and
interviewer response bias all had the potential to bias the results in this
experimental design. Question responses that related to different fields of
expertise (including career decisions, health issues, investments, recruitment
choices and travel decisions) were not compared. The heterogeneous nature
of the decisions tested subsequently provides support for these results to be
generalised to other domains.
Confounding biases from effects due to the class environment were believed
to be minimal. Ex post comparison of manager responses to student
responses showed no significant differences between the two subgroups’
preferences for any of the decision options. Additional ex post comparison of
student responses from different classes (those where I was the lecturer and
other classes that had a different lecturer) again showed no significantly
different responses to questions. Both comparisons were analysed used chi-
squared tests. This analysis confirms that environmental effects are likely to be
negligible for this experiment. It also suggests that interviewer response bias
was also low enough to be discounted.

185
A similar result was expected for learning effects biases. Unfortunately,
previous research does not seem to have taken account of potential learning
effects within question sets. It may be that subjects prefer to choose
consistently across a questionnaire rather than consider each question in
isolation. This desire could distort (enhance or diminish) responses in a way
that might falsely indicate highlight framing effects or cognitive style
preferences. Given the complexity of the survey questions, the fact that only
three subjects recalled a similarity between any of the questions during ex
post discussions, and given the agreement between this study’s results and
previous research, the cognitive load of the task appears to be high enough
to mitigate any significant learning effects.
In summary, the main confounding variables identified in the study design
were able to be eliminated by either ex post analysis of responses from
different subgroups or by comparison with data from previous research.
Results: Risk Based and Attribute Framing for the Entire Sample
Some questions in the questionnaires were adapted from prior risk based
framing effects studies. The responses to these questions for the entire sample
are similar to Tversky and Kahneman’s (1981) findings. Participants significantly
preferred smaller, more certain and positive outcomes over equivalent,
larger, less certain and positive outcomes in three different decision domains
(p<0.01). This preference for certainty was reversed when subjects were asked
to choose between certain negative outcomes and equivalent alternatives
that offered a chance for a larger loss or detriment, and a chance for no
negative result at all. Decisions included choices between different vaccines
used to save lives, decisions regarding company investments, and gambling

186
alternatives for disposable income. Overall, the results suggest that the
subjects in the sample respond similarly to subjects involved in prior studies
related to risk based framing effects.
FIGURE 1. Expected risk based framing effects [gambling]
FIGURE 2. Expected risk based framing effects [saving/losing lives]

187
FIGURE 3. Expected risk based framing effects [company investments]
The remainder of the results below relate to comparisons of responses for
Innovator and Adaptor sub groups. Significant differences in preferences and
sensitivity to some framing effects were revealed.
Results: Risk Based Framing and Cognitive Style
Of the 25 questions presented in Set 1 and Set 2, eight in each set were
contrived to include risk based framing effects. The decision contexts
included gambling decisions to potentially lose or gain $800 to $3000,
investment decisions in the range $25 million to $100 million, and vaccine
choices to try and save up to 600 people infected with exotic diseases. Some
questions were framed in terms of potential gains or lives to be saved, while
others were framed in terms of potential losses or deaths. The majority of the
responses (seven in each set) showed no significant preference differences
between Innovators and Adaptors. However, one similar decision in each set

188
did show a significant difference between Innovators and Adaptors as shown
in figure 4. This result was the only one which offered evidence in support of
H1.
FIGURE 4. Risk based framing and KAI [personal loss]
In Set 1, Innovator respondents were significantly more likely than Adaptors to
choose the option with a chance of no loss (but also the chance of an
ultimately larger loss) over a certain loss (n=101, p<0.05). In Set 2, Innovator
respondents were significantly more likely than Adaptors to reject the option
with a chance of no loss, though the result was not as strong (n=44, p<0.1).

189
This suggests that for this decision context (involving certain or potential
personal loss), Innovators and Adaptors respond differently to risk based
framing effects. However, for other decision contexts (involving certain or
potential, personal or company gains; and life and death vaccination
choices), there was no significant differences between Adaptors and
Innovators.
Note that there was no significant difference between Set 1 and Set 2
responses for Adaptors (n=36), but there was a significant difference between
sets for Innovators (n=66, p<0.01) as shown in figure 5. This suggests that
Innovators perceive the option of taking a risk of losing more money in order
to potentially avoid all losses as an extreme option. Adaptors apparently
perceive this option as simply preferred, regardless of how the decision is
framed. Both of these findings are unrelated to the various hypotheses
presented above.
FIGURE 5. Risk based framing and KAI [personal loss]

190
Results: Fluency/Flexibility Preferences and Cognitive Style
Two tests of preference for fluency/flexibility were conducted. In the first test,
respondents were presented with an alternative to their normal travel route in
order to potentially avoid being late. The alternative was described as
offering more options to change route in the future which inherently
increased both its flexibility and complexity. Thus, this decision represented an
instance to determine preferences for fluency and flexibility due to the
increased options inherent in the alternative. Thus, this situation was framed in
terms of avoiding potential loss via either a creative or non-creative option.
The second test of preference for fluency/flexibility presented a similar
decision framed in terms of potential gain. In this circumstance, the same
options (a normal route or a more flexible, complicated and alternative
route) were presented as alternatives when potentially arriving hours early for
an overseas flight. In this situation, there was some potential gain related to
being able to spend time in some intrinsically rewarding way, rather than
waiting at the airport. Thus, this decision represented an instance to
determine preference for fluency and flexibility in a situation of potential gain.
However, the decision is less clear cut than the previous example because it
could be expected that some respondents might be happy to arrive early at
an airport before an international flight in order to do some shopping, or try
and be allocated a better seat position on the plane. Figure 6 shows the
responses to both questions.
In both examples above there is a significant difference between Adaptors
and Innovators preferences (p<=0.05 for potential loss and p<=0.10 gain
situations respectively). It appears that in a situation of potential loss (being
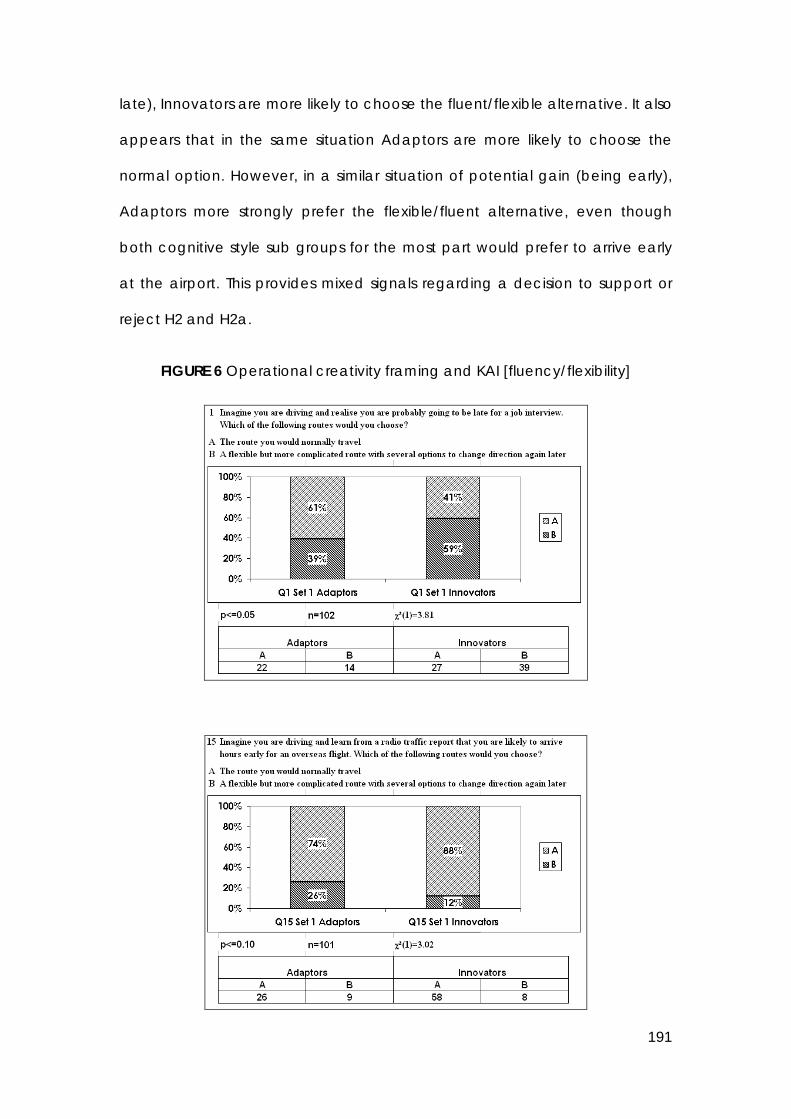
191
late), Innovators are more likely to choose the fluent/flexible alternative. It also
appears that in the same situation Adaptors are more likely to choose the
normal option. However, in a similar situation of potential gain (being early),
Adaptors more strongly prefer the flexible/fluent alternative, even though
both cognitive style sub groups for the most part would prefer to arrive early
at the airport. This provides mixed signals regarding a decision to support or
reject H2 and H2a.
FIGURE 6 Operational creativity framing and KAI [fluency/flexibility]

192
In order to test whether or not the fluent/flexible option was considered an
extreme option (i.e. that it contained both advantages and detriments),
responses to the above questions were compared to similar Set 2 questions
that were reframed as rejections rather than choices. No significant
differences were found between responses for either question when choosing
and rejecting by either the Innovator sub group, Adaptor subgroup or the
entire sample. This suggests that the fluent/flexible option is not considered
extreme by any participant group and refutes both H3 and H3a.
Results: Originality/Novelty Preferences and Cognitive Style
Two tests of preference for originality/novelty were conducted. In the first test,
respondents were presented with a choice between jobs that offered usual
or unusual work. It is clear that this decision offers obviously a less novel and a
more novel choice. Figure 7 shows that as expected Innovators exhibit a
significant preference for novelty (p<=0.05) compared to Adaptors. This
provides support for both H2 and H2b. It also shows that a large proportion of
subjects overall wanted interesting jobs, regardless of their KAI.

193
FIGURE 7. Operational creativity framing and KAI [novelty]
Please note that the results shown in figure 7 identify the responses as coming
from “Q21 Set 3”. Where Set 1 and Set 2 questions were exactly the same, the
responses were combined to increase the number of responses able to be
analysed and named Set 3. Any reference to Set 3 throughout the results
section means combined responses from Set 1 and Set 2 questions that were
worded in the same way. In this example, the similarity of Set 1 and Set 2
questions meant that a test for unusual work as an extreme option was not
able to be tested. This means that H3b was not able to be tested with these
questions.
In the second test for originality/novelty, participants were presented with two
route alternatives from which to choose. The decision context related to
being asked by a client to arrive early if possible for a meeting. In this case,
the operationalised creativity option was a choice to stop driving 200m from
the meeting point and travel this remaining distance by foot. The option was
presented as being potentially attractive by virtue of its shorter overall
distance than the normal route option.

194
The second decision example is less clearly about novelty or originality as
stated. It may be that running/walking the last 200m is an original and/or
novel approach for many who can conceptualise themselves in this situation.
Alternatively, this option could simply be considered divergent from the
normal approach, rather than novel or original (in which case, it would still be
useful for testing operationalised creativity preferences). Finally, it may be that
what is being tested for at least some respondents is their desire to enjoy a
walk, or leverage their client’s preference to meet early, having
conceptualised the context as a potential negotiation situation. Despite these
concerns about how the alternatives in the second test were conceptualised
by participants, the results show significant preference differences between
Innovators and Adaptors (p<=0.05). See figure 8.
FIGURE 8. Operational creativity framing and KAI [originality/novelty]
The most interesting aspect of this result is that compared with the Innovators,
the Adaptors seem to prefer the most creative option. This provides evidence
to refute both H2 and H2b. Set 1 preferences shown in figure 8 were also
compared to Set 2 responses, where the same question was reframed as a

195
rejection of one option. In reference to the fluency/flexibility tests above,
these enabled extreme options to be identified.
There was no significant difference between Innovators’ preferred responses
when choosing or rejecting. However, there was a significant difference
between Adaptors’ preferences when choosing, compared with their
responses when rejecting (though not a full reversal of preference). This
suggests that Adaptors viewed the creative option as somewhat extreme
and provides support for both H3 and H3b. This is shown in figure 9.
FIGURE 9. Adaptors consider originality/novelty option as extreme
Results: Divergence Preferences and Cognitive Style
Two tests of preference for divergence were conducted. In the first test,
respondents were presented with a choice between job offers from two
companies; one of which emphasised exploring tangents and the other
remaining focussed. It is clear that this decision offers a less novel and a more
novel choice. Figure 10 shows Innovators exhibit a significant preference for

196
divergence (p<=0.01) compared to Adaptors, as expected. This provides
support for both H2 and H2c.
FIGURE 10. Operational creativity framing and KAI [divergence]
Whilst Adaptors showed no significant change in Set 2 preferences for Q3
options, there was a significant reversal of preference (p<=0.01) between
Innovators’ responses when choosing or rejecting a relatively divergent
option. This suggests Innovators perceive divergence as an extreme option in
this context. These results provide evidence to refute both H3 and H3c. See
Figure 11.
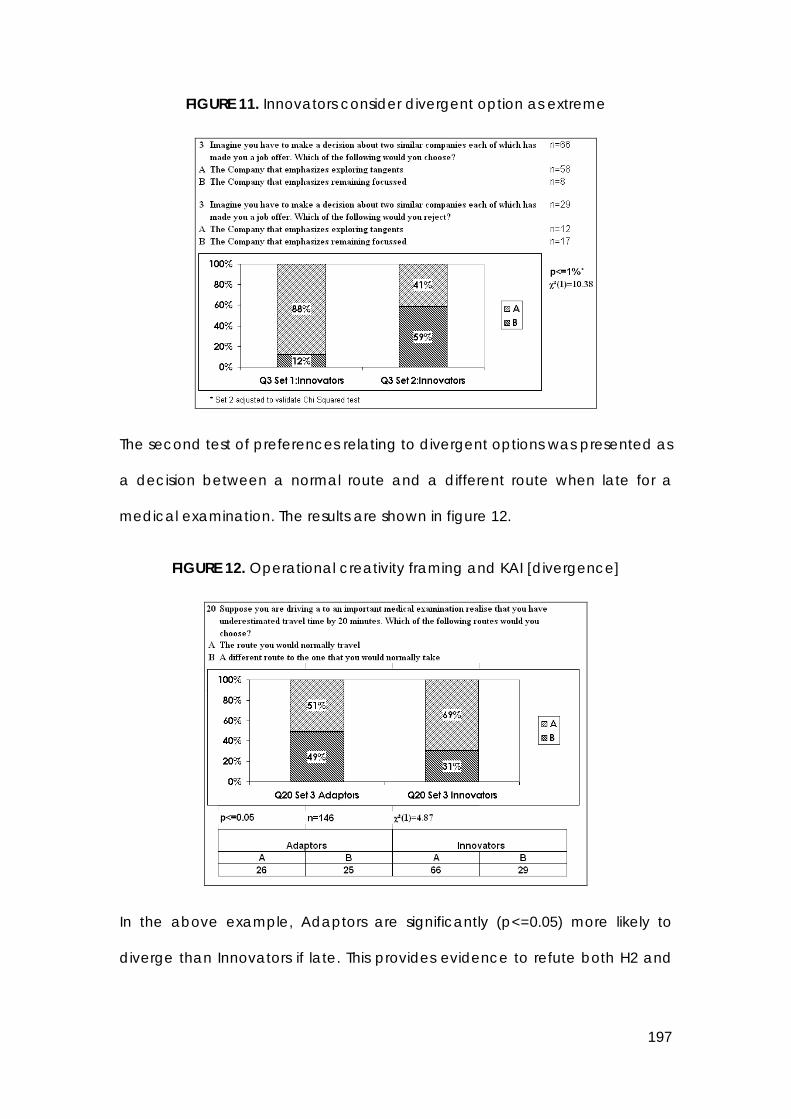
197
FIGURE 11. Innovators consider divergent option as extreme
The second test of preferences relating to divergent options was presented as
a decision between a normal route and a different route when late for a
medical examination. The results are shown in figure 12.
FIGURE 12. Operational creativity framing and KAI [divergence]
In the above example, Adaptors are significantly (p<=0.05) more likely to
diverge than Innovators if late. This provides evidence to refute both H2 and

198
H2c. In this example, the similarity of Set 1 and Set 2 questions meant that a
test for a different route as an extreme option was not able to be tested.
Results: Rule Breaking Preferences and Cognitive Style
Operational creativity can also be represented as “rule breaking” behaviour
because many organisations categorise non-conforming behaviour as
creative and against the rules. Kirton (1976) uses the rule breaking preference
as the key descriptor for describing the differences between Adaptors and
Innovators. It would be expected, therefore, that Innovators should be more
prepared to break rules when compared with Adaptors. Innovators would
also be expected to perceive rule breaking options as less extreme because
of their inherent preferences for non-conformity.
Two tests for rule breaking preferences were presented in the Set 1
questionnaire. The first test related to trying to avoid missing an overseas flight.
The operationalised creative rule breaking option in this case was to choose
to do a safe but illegal u-turn in order to avoid a road accident. The second
test presented in the Set 1 questionnaire was very similar. Again the decision
related to trying to avoid missing an international flight, but this question was
presented as a rejection rather than a choice. One further difference
between the two questions was how the potential delay was communicated.
In the first question, the delay was based on a radio report, but in the second
question, the delay was based on seeing road works and determining their
potential to make the participant miss their flight.
The results (shown in figures 13–14) do not show significant differences
between Innovators’ and Adaptors’ preferences for rule breaking in the
context presented. This is not what is expected from Kirton’s descriptions of

199
how Innovators and Adaptors are expected to make decisions. This also
provides evidence to refute both H2 and H2d.
FIGURE 13. Similar rule breaking preferences Innovators and Adaptors [Q4]
FIGURE 14. Similar rule breaking preferences Innovators and Adaptors [Q23]
Despite these similarities in responses from different cognitive style subgroups,
rule breaking does exhibit significant (p<=0.05, p<=0.01) preference reversals
due to attribute framing effects. Set 2 questions 4 and 23 were similar to Set 1
questions 4 and 23, except that choices were reframed as rejections and vice
versa.

200
The results below show that both Adaptors and Innovators perceive rule
breaking as a somewhat extreme option (p<=0.01 for Innovators and p<=0.05
for Adaptors). See figures 15–16 for responses to Q23. Similar results were
observed for Q4 (not shown). In combination, these results provide evidence
to refute H3 and H3d because of the similarity between Innovator and
Adaptor responses.
FIGURE 15. Innovators perceive rule breaking as extreme [Q23]
FIGURE 16. Adaptors perceive rule breaking as extreme [Q23]

201
Results Summary
The following table details how the results compared with the hypotheses
previously listed:
TABLE 1. Results Overall
No. Detail Results
H1 Innovators will tend to be less affected by risk based framing compared to Adaptors
2 instances support H1 14 instances reject H1
H2 Innovators will more strongly prefer operationalised creativity alternatives
3 instances support H2 5 instances reject H2
H2a Innovators will prefer relatively more fluent/flexible options
1 instance supports H2a 1 instance rejects H2a
H2b Innovators will prefer relatively more original/novel options
1 instance supports H2b 1 instance rejects H2b
H2c Innovators will prefer relatively more divergent/deviant options
1 instance supports H2c 1 instance rejects H2c
H2d Innovators will prefer relatively more rule breaking options
2 instances reject H2d
H3 Only Adaptors will perceive operationalised creativity alternatives as extreme
5 instances in 7 reject H3
H3a Only Adaptors will perceive relatively more fluent/flexible options as extreme
2 instances reject either KAI subgroup perceiving as extreme
H3b Only Adaptors will perceive relatively more original/novel options as extreme
2 instances support only Adaptors perceiving as extreme
H3c Only Adaptors will perceive relatively more divergent/deviant options as extreme
1 instance rejects – Innovators only perceived option as extreme
H3d Only Adaptors will perceive relatively more rule breaking options as extreme
2 instances reject – Both KAI subgroup perceiving as extreme
Discussion
The overall results suggest that there are significant framing effects that apply
to decisions involving operational creativity. In some cases, these are
affected by an individual’s cognitive style. The most interesting findings of this
study are that in some contexts Adaptors significantly prefer operationalised
creativity options more than Innovators do, and that KAI sub groups’
preferences for rule breaking are similar in contexts described as safe.

202
Risk based framing effects seemed to apply similarly to Innovators and
Adaptors in general, and as a result, H1 was not supported overall. For
fourteen of the sixteen decisions posed that involved risk based framing, there
was no significant difference between Innovator and Adaptor responses. This
suggests that Adaptors’ low tolerance for ambiguity is not activated as much
as might be expected in decisions involving risk based framing. One common
aspect of these decisions was that all the risks were quantified, which may
have had a reduced the apparent ambiguity involved.
What is interesting is that in both decisions where a significant difference was
found for risk based framing, the decisions involved the potential for personal
money loss. One decision was framed as a choice of whether to accept a
larger risky loss or a smaller certain loss. The other decision offered the same
options, but was presented as a rejection decision. In these decisions, both
Adaptors’ and Innovators’ preferences were as predicted by prior research
on risk based and attribute framing effects: respondents preferred the risky
loss even though it was bigger, when presented with a choice, regardless of
cognitive style. When rejecting the Adaptors still strongly rejected the certain
loss, and Innovators actually reversed their preference (slightly tending to
reject the larger risky loss). Combining the two results produced a highly
significant result (p<0.01, χ² =19.45). This suggests that Adaptors may be more
sensitive to risk based framing than Innovators when potential personal losses
are involved.
In other tests, significant differences between Innovators and Adaptors were
observed, which varied and were highly dependent on context. The
contradictory nature of these results did not assist in proving H2 overall or any

203
of the related sub hypotheses involved different operationalised creativity
(fluency/flexibility; originality/novelty; divergence; rule breaking).
For example, in testing H2a it was found that Innovators significantly preferred
fluency/flexibility in one context (being late), but Adaptors significantly
preferred fluency/flexibility in a different context (being early). In the case of
H2b (which related to originality/novelty), a high proportion of Adaptors
preferred the original option (more unusual work), though significantly less
than Innovators preferred this option. But Adaptors were significantly more
likely to choose an original route (shorter, but with a 200m walk) in order to
respond to a client’s wishes for them to arrive earlier. One reason for this may
be in this case the original option is perceived by the Adaptor as being both
efficient and conforming (because it is shorter and meets the client’s
request).
H2c related to preferences for divergence. Compared with Adaptors,
Innovators preferred working for companies that focussed on exploring
tangents as opposed to remaining focussed. However (unexpectedly)
Innovators did not automatically prefer different options, with only 31%
choosing an alternative described only as “different” compared with one
that was “normal”. Adaptors were almost equally divided over whether or not
the different option was superior to the normal option in this case. The
contradictory nature between these statistically significant results again made
it difficult to confirm or refute H2c.
Overall the only conclusion proposed regarding operational creativity
preferences is that Innovators’ and Adaptors’ preference for operational
creativity can be significantly different, but changes in the decision context
will affect these preferences in ways that are hard to predict. In general the
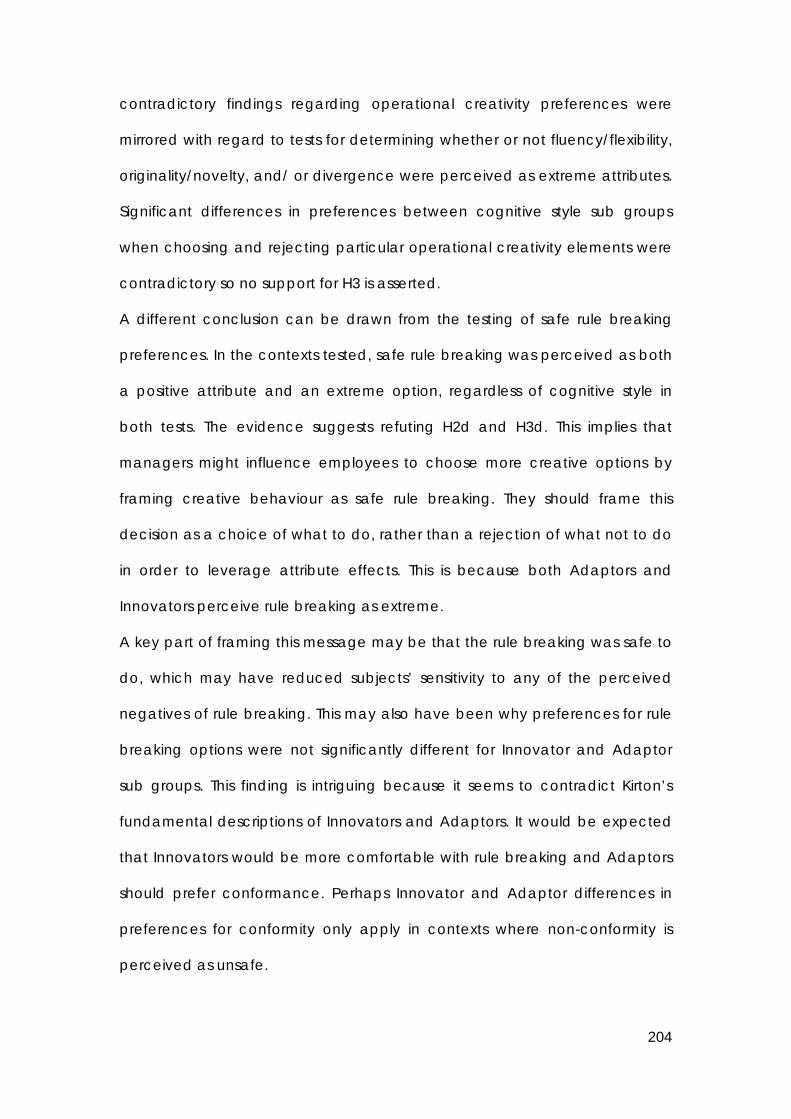
204
contradictory findings regarding operational creativity preferences were
mirrored with regard to tests for determining whether or not fluency/flexibility,
originality/novelty, and/ or divergence were perceived as extreme attributes.
Significant differences in preferences between cognitive style sub groups
when choosing and rejecting particular operational creativity elements were
contradictory so no support for H3 is asserted.
A different conclusion can be drawn from the testing of safe rule breaking
preferences. In the contexts tested, safe rule breaking was perceived as both
a positive attribute and an extreme option, regardless of cognitive style in
both tests. The evidence suggests refuting H2d and H3d. This implies that
managers might influence employees to choose more creative options by
framing creative behaviour as safe rule breaking. They should frame this
decision as a choice of what to do, rather than a rejection of what not to do
in order to leverage attribute effects. This is because both Adaptors and
Innovators perceive rule breaking as extreme.
A key part of framing this message may be that the rule breaking was safe to
do, which may have reduced subjects’ sensitivity to any of the perceived
negatives of rule breaking. This may also have been why preferences for rule
breaking options were not significantly different for Innovator and Adaptor
sub groups. This finding is intriguing because it seems to contradict Kirton’s
fundamental descriptions of Innovators and Adaptors. It would be expected
that Innovators would be more comfortable with rule breaking and Adaptors
should prefer conformance. Perhaps Innovator and Adaptor differences in
preferences for conformity only apply in contexts where non-conformity is
perceived as unsafe.
205
Given the large number of tests where significant differences in preferences
were found it would seem that this study does offer valid findings. However
the large number of tests conducted increases the potential to find significant
results merely due to random effects. This cumulative Type I error can be
managed by determining a significance level based on the Sidak-Bonferroni
treatment see Shaffer (1995). Applying this calculation for the 13 significant
items found, only results with p<0.003846 should be considered as non
random; the other results above should be interpreted with caution. However
this correction approach might be too conservative. There is quite a
reasonable chance that at least one test result could appear to be significant
to p<0.05 out of 25 tests when in fact no significance really existed. However
there is a much smaller chance that say 10 tests would appear significant. The
chance for this can be calculated, and is derived in the equations below.
Start by considering a study involving a number of tests, all of which in
actuality are devoid of correlation. For these tests any correlation found is
falsely significant and constitutes a Type 1 statistical error. Equation [1] details
the probability of completing the tests and not getting any falsely significant
result
P(fsr=0|n@p) = (1-p)n
[1]
Where P(fsr=0|n@p) is the probability of zero falsely significant results for n
tests at a given significance level of p (typically p=0.05 or p=0.01). Now the
chance of at least 1 falsely significant result is shown in [2] below. This is simply
the chance that something other than zero false significant results occurs:

206
P(fsr>=1|n@p) = 1- P(fsr>0|n@p)
P(fsr>0|n@p) = 1- P(fsr=0|n@p)
P(fsr>=1|n@p) = 1-(1-p)n
Calculating with values p=0.05, n = 25 gives:
[2]
P(fsr>=1|[email protected]) = 1-0.95
P(fsr>=1|[email protected]) = 0.723
25
Now the chance of 2 or more falsely significant results in n tests is given by
determining the probability of at least one falsely significant result in n tests
and multiplying this by the probability of at least a single false test for the
remaining tests after the first. The probability of this second factor is by
definition P(fsr>=1|n-1@p). This enables the derivation of P(fsr>=2|n@p) as
follows:
P(fsr>=2|n@p) = P(fsr>=1|n@p) x P(fsr>=1|n-1@p)
[3]
Equation [3] above can be generalised to apply to determine the probability
of finding m falsely significant results in n tests for a given significance level of
p or P(fsr>=m|n@p):
P(fsr>=m|n@p) = P(fsr>=1|n@p) x P(fsr>=1|n-1@p)x….P(fsr>=1|n-
m+1@p)
P(fsr>=m|n@p) = [1-(1-p)n] x [1-(1-p)n-1] x ….[1-(1-p)n-m+1
Table 2 below shows the calculated values of P(fsr>=m|[email protected])
]
[4]

207
TABLE 2. Probability of Falsely Significant Results in 25 Tests for p=0.05
P(fsr>=1|[email protected]) 0.723
P(fsr>=2|[email protected]) 0.512
P(fsr>=3|[email protected]) 0.354
P(fsr>=4|[email protected]) 0.240
P(fsr>=5|[email protected]) 0.158
P(fsr>=6|[email protected]) 0.101
P(fsr>=7|[email protected]) 0.063
P(fsr>=8|[email protected]) 0.038
P(fsr>=9|[email protected]) 0.022
P(fsr>=10|[email protected]) 0.012
P(fsr>=11|[email protected]) 0.007
P(fsr>=12|[email protected]) 0.003
P(fsr>=13|[email protected]) 0.002
In this study 9 significant items were found in 25 tests used to test H1 and H2. In
addition 9 extra tests were completed to test H3, of which 4 appeared to be
significant. To determine if these results could be falsely significant due to
cumulative type 1 error, probabilities of falsely significant results were
calculated using equation [4]. The calculation was performed in order most
significant result to least significant result. This analysis was completed for both
the 9 apparently significant items in 25 tests (see Table 3) and the total of 13
apparently significant items in 34 tests overall (see Table 4).
TABLE 3. Probability of 9 Falsely Significant Results in 25 Tests for Given p

208
P(fsr>=1|[email protected]) 0.222
P(fsr>=2|[email protected]) 0.048
P(fsr>=3|[email protected]) 0.033
P(fsr>=4|[email protected]) 0.022
P(fsr>=5|[email protected]) 0.015
P(fsr>=6|[email protected]) 0.009
P(fsr>=7|[email protected]) 0.006
P(fsr>=8|[email protected]) 0.005
P(fsr>=9|[email protected]) 0.004
TABLE 4. Probability of 14 Falsely Significant Results in 34 Tests for Given p
P(fsr>=1|[email protected]) 0.289
P(fsr>=2|[email protected]) 0.082
P(fsr>=3|[email protected]) 0.022
P(fsr>=4|[email protected]) 0.006
P(fsr>=5|[email protected]) 0.005
P(fsr>=6|[email protected]) 0.004
P(fsr>=7|[email protected]) 0.003
P(fsr>=8|[email protected]) 0.002
P(fsr>=9|[email protected]) 0.002
P(fsr>=10|[email protected]) 0.001
P(fsr>=11|[email protected]) 0.001
P(fsr>=12|[email protected]) 0.001

209
P(fsr>=13|[email protected]) 0.001
This suggests that the likelihood of achieving this number of false positives is
vanishingly small, and hence the results can be considered as significant
despite the potential for a cumulative type I family wise error.
The second potential concern regarding these tests is whether or not they
should be grouped together. This is not normally the case in prior studies of
framing effects due to the context specific nature of the decisions and
framing effects involved. In order to validate the use of independent chi
squared analysis of questions, various groups of related questions were
constructed and Cornbach's Alpha scores were calculated for each. The
results of this analysis are shown below in Table 5.
TABLE 5. Validation of Independence of Questions
Group Questions KAI KR20 n
Fluency/ Flexibility 1,6,18 Adaptors 0.207 35
Fluency/ Flexibility 1,6,19 Innovators 0.236 65
Fluency/ Flexibility 1,6,18 All 0.200 100
Originality/
Novelty 12, 25 Adaptors 0.427 36
Originality/
Novelty 12, 25 Innovators 0.333 65
Originality/
Novelty 12, 25 All 0.362 101
Divergence 3,7,9,10,20 Adaptors 0.319 36
Divergence 3,7,9,10,20 Innovators 0.191 65

210
Divergence 3,7,9,10,20 All 0.306 101
Rule Breaking 4, 23 Adaptors 0.602 36
Rule Breaking 4, 23 Innovators 0.316 66
Rule Breaking 4, 23 All 0.427 102
Risk based
framing 2,5,8,11,14,17,19,22,24 Adaptors 0.119 31
Risk based
framing 2,5,8,11,14,17,19,22,24 Innovators 0.306 66
Risk based
framing 2,5,8,11,14,17,19,22,24 All 0.244 97
Personal money
2,5 All 0.303 101
People's lives
8,14,19 All 0.488 100
Product
Investment 11,17,22,24 All 0.224 97
All
1-25 All 0.422 95
All
1-25 Adaptors 0.141 30
All
1-25 Innovators 0.505 65
All of these results are below the 0.7 value normally used to validate scale
consistency. This suggests that the tests are not consistent and therefore are

211
not testing the same things, so grouping chi squared results is not necessary or
appropriate.
This finding is somewhat confounding at first, because questions in the same
group should theoretically be measuring the same thing. If this was the case it
would be expected that their Cornbach's Alpha scores would indicate
consistency. The reason for this discrepancy relate to the other contextual
aspects involved in the various questions. Consider the two questions below
designed to measure preferences for fluency/ flexibility:
1 Imagine you are driving and realise you are probably going to
be late for a job interview. Which of the following routes would
you choose?
A The route you would normally travel
B A flexible but more complicated route with several options to
change direction again later
6 Imagine you have to make a decision about two similar
employees for a promotion. Which of the following routes would
you choose?
A The employee who works on many possible solutions
B The employee who works on a few probable solutions
Both of these questions may indeed measure preferences to fluency/
flexibility, but the different contexts that the questions are related to cause
different decision making weightings to also be activated. This suggests that
context is a key third variable in considering preferences for decisions
involving creativity (which is in hind sight is probably to be expected).

212
Conclusion
The hypotheses in this study were generally not supported even though they
were derived from expectations about preferences for creativity from Kirton’s
descriptions of Innovators and Adaptors. The surprising nature of these results
makes this paper more interesting.
This study suggests that Adaptors are more favourable than Innovators to
taking creative options in some contexts. It appears that Adaptors will express
preference for creative options (even if perceived as extreme) when these
seem to be more efficient and/or more compliant. This suggests that
Adaptors might be more motivated to be creative than Innovators in
situations where creativity is obviously useful and expected. It also suggests
that Kirton’s original descriptors of the two main cognitive styles are
somewhat simplistic when it comes to predicting both rule breaking
behaviour and creativity preference.
Operationalised creativity preference appears to be affected by framing
effects and context in complex ways. Framing operational creativity decision
alternatives may result in positive or negative associations that are
dependent on the subject’s cognitive style and the domain considered. In
general, this suggests that an understanding of cognitive style is likely to
complicate managers’ attempts to frame decisions about creativity overall.
There are three potential generalisations for practice, however, that emerge
from this paper.
The first is that risk based framing effects might seem to apply equally to
Innovators and Adaptors, except under conditions of personal loss. Prior to
understanding the results obtained in this study, it would be perhaps intuited
by managers that if a company were to operate innovatively then Adaptors

213
should be barred from holding positions where they make decisions about
whether or not implement operationalised creativity options. For example it
wouldn’t seem to be effective to put an Adaptor in charge of investment
decisions that related to approvals for disruptive strategic innovations due to
the Adaptor’s expected preference for incremental change. However the
results obtained from this study suggest there is no reason to limit (to
Innovators) positions of authority that would deal with making company
investment decisions about operationalised creativity. Innovators and
Adaptors are equally likely to be averse to risk from a framing effects point of
view.
Secondly, attribute framing effects seem to apply to many decisions
involving operationalised creativity. Even though the result was not always
significant, every question in this study about creativity returned less
preference for the creative option when reframed from a choice to a
rejection. Therefore, managers that have the capacity to frame employee
decisions in terms of choosing the best option, rather than rejecting the worst
option are likely to be able to get more operationalised creative alternatives
chosen. Whilst this attribute framing effect seems to be different depending
on context and cognitive style, there was no net reduction of preference
observed in this study by presenting decisions involving creativity as choices
rather than rejections. It is quite possible to conceptualise in some quality
assured organisational environments how the idea of rejecting non-
conforming products could translate to automatically framing other decisions
(like those involving operationalised creativity) as rejections resulting in
reduced creativity implementation.

214
Finally, despite the expectation that cognitive style differences imply different
rule breaking preferences, framing an option as minor, but also as safe rule
breaking, appears generally to make it seem more attractive to both KAI sub
groups. Thus, managers who wish to increase operationalised creativity in their
organisations should consider presenting certain decision alternatives as “rule
breaking” and “safe”. This should make these options appear both less risky
and more attractive to all employees, regardless of their cognitive style.
These generalisations should be interpreted with a note of caution however:
overall the most important aspect of how framing effects interact with
cognitive style seems to relate to context. The fact that the decisions
proposed in many cases were outside of the normal organisational domain
suggests that further research into classifying contexts and examining how
they impact on framing effects would be worthwhile.
This study does seem to provide some suggestion that framing effects are by
nature external and so may act as substitutes for the management control
provided through extrinsic motivation. The advantage of framing effects is
that they do not seem to dampen creativity, as is the case with extrinsic
motivators. Used carefully, attribute framing effects may unlock intrinsic
motivators to choose more creative options by leveraging inherent individual
perceptual distortions. In particular, framing creative options as both deviant
and safe may provide managers with the extra influence they need to help
their employees make more creative choices.

215
References
Amabile, T. M. (1998). How to kill creativity. Harvard Business Review, 76 (5),
76–87.
Assink, M. (2006). Inhibitors of disruptive innovation capability: A conceptual
model. European Journal of Innovation Management, 9 (2), 215–233.
Cropley, A. J. (2000). Defining and measuring creativity: Are creativity tests
worth using? Roeper Review, 23 (2), 72.
Elsbach, K. D., & Hargadon A. B. (2006). Enhancing creativity through
"mindless" work: A framework of workday design. Organization Science,
17 (4), 470.
Engle, D. E., Mah, J. J., & Sadri, G. (1997). An empirical comparison of
entrepreneurs and employees: Implications for innovation. Creativity
Research Journal, 10 (1), 45–50.
Fleenor, J. W., & Taylor, S. (1994). Construct validity of three self-report
measures of creativity. Educational and Psychological Measurement,
54 (2), 464–470.
Foxall, G. R., & Hackett, P. M. W. (1992). The factor structure and construct
validity of the Kirton Adaption–Innovation Inventory. Personality and
Individual Differences, 3 (9), 967–975.
Goldsmith, R. E., & Matherly, T. A. (1987). Adaption–Innovation and creativity:
A replication and extension. British Journal of Social Psychology, (1), 79–
82.
Goldsmith, R. E., & Matherly, T. A. (1987). Adaption–Innovation and self-
esteem. Journal of Social Psychology, 127, 351.
216
Gough, H. (1981). Studies of the Myers-Briggs type indicator in a personality
assessment research institute. Fourth National Conference on the
Myers-Briggs Type Indicator. CA, Stanford University.
Guilford J. P. (1967). The nature of human intelligence. New York: McGraw-Hill.
Hammerschmidt, P. K. (1996). The Kirton Adaption–Innovation inventory and
group problem solving success rates. Journal of Creative Behavior, 30
(1), 61–74.
Houtz, J. C., Denmark, R., Rosenfield, S., & Tetenbaum, J. J. (1980). Problem
solving and personality characteristics related to differing levels of
intelligence and ideational fluency. Contemporary Educational
Psychology, (2), 118–123.
Keller, R. T., & Holland, W. E. (1978). A cross-validation study of the Kirton
Adaption-Innovation inventory in three research and development
organizations. Applied Psychological Measurement, (4), 563–570.
Kirton, M. J. (1976). Adaptors and innovators – a description and measure.
Journal of Applied Psychology, 61, (5), 622.
Kirton, M. J. (1978). Have adaptors and innovators equal levels of creativity?
Psychological Reports, 42 (3), 695–698.
Leavy, B. (2002). Creativity – the new imperative. Journal of General
Management, 28 (1), 70.
Levin, I. P., Gaeth, G. J., & Schreiber, J. (2007). A new look at framing effects:
Distribution of effect sizes, individual differences, and independence of
types of effects. Organizational Behaviour and Human Decision
Processes, 88 (1), 411–429.
Levin, I. G., Schneider, S. L., & Gaeth, G. J. (1998). All frames are not created
equal: A typology and critical analysis of framing effects.

217
Organizational Behavior And Human Decision Processes, 76 (2), 149–
188.
Luck, G. (2004). The relationship of an innovative thinking style, locus of control
and perceived control on job satisfaction and workspace preferences
among knowledge workers. Dissertation Abstracts International:
Section B: The Sciences and Engineering (4), 2133.
Mednick, S. A. (1962). The associative basis of the creative process.
Psychological Review, 69, 220–232.
Mednick, S. A., & Mednick, M. T. (1967). Examiner's Manual: Remote
Associates Test, College and Adult Forms 1 and 2. Boston: Houghton
Mifflin.
Riley, M. (1993). Organization and creativity: A replication of the KAI test.
Journal of Managerial Psychology, 8 (6), i.
Shaffer, J. P. (1995) Multiple hypothesis testing. Annual Review of Psychology,
46, 561-584
Shafir, E. (1993). Choosing versus rejecting: Why some options are both better
and worse than others. Memory and Cognition, 21, 546–556.
Stevens, G. A., Burley, J., & Divine, R. (1998). Profits and personalities:
Relationships between profits from new product development and
analysts' personalities. In proceedings of the 1998 Research
Conference at the Annual International Conference of the Product
Development and Management Association: Atlanta, GA: 157–175.
Taylor, W. G. (1989). The Kirton Adaption–Innovation inventory: Should the sub-
scales be orthogonal? Personality and Individual Differences, (9), 921–
929.
218
Tetenbaum, T., & Houtz, J. (1978). The role of affective traits in the creative
and problem-solving performance of gifted urban children. Psychology
in the Schools, (1), 27–32.
Torrance, E. P. (1962). Guiding creative talent. Englewood Cliffs, NJ: Prentice-
Hall.
Tversky, A., & Kahneman, D. (1981). The framing of decisions and the
psychology of choice. Science, 211 (30 January), 435–458.
Välikangas, L., & Jett, Q. (2006). The golden spur: innovation independence.
Strategy & Leadership, 34 (5), 41.
Woodman, R.W., Sawyer, J. E., & Griffith, R.W. (1993). Toward a theory of
organizational creativity. Academy of Management Review, 18 (2),
293–321.
Wunderley, L. J., Reddy, W. B., & Dember, W. N. (1998). Optimism and
Pessimism in Business Leaders. Journal of Applied Social Psychology, 28
(9), 751–760.

219
Conclusions
This thesis delivers innovation on three levels informed by an understanding of
the linkages between creativity, motivation, cognitive style and framing
effects. The following sections summarise proposed applications for the
study’s findings and discuss constraints and limitations.
Study One Response to Objectives
The first investigation in this report provides evidence to suggest that the
Creative Resolve Response pattern of creative motivation might exist. There is
significant evidence to suggest that individual creative motivation does vary
during problem solving as a function of perceived outcome success certainty.
The findings are however different from those hypothesised in that the
variation for Innovators and Adaptors is in phase rather than the mirror image
predicted. The study suggests that creative motivation peaks during problem
solving at approximately 20% perceived outcome certainty (labelled here as
the creative motivation zenith). It also provides evidence for minimum
creative problem solving motivation at 60% perceived outcome certainty
(labelled here as the creative motivation nadir). Importantly the zenith and
nadir points for both Innovator and Adaptor sub groups appear at the same
levels of perceived outcome certainty. Additionally Adaptors on average
report significantly lower levels of creative motivation across the entire range
of perceived outcome certainty from 0% to 100%.
In order to assist managers to apply this finding it is asserted that perceived
outcome certainty may be a proxy for an individual’s opinion regarding
problem solving progress. Consider an individual’s perception of outcome

220
certainty at the instant that they recognise there is a problem to be solved: at
that first moment they have no real idea whether or not the problem can be
solved and thus are completely uncertain as to what their problem solving
outcome might be. Thus they are at a 0% outcome certainty level and they
are by definition also 0% complete in solving the problem. This perception of
outcome certainty may rapidly change as the individual investigates how to
deal with the problem. In many circumstances the problem solver may
choose to abandon the problem if adequate initial increase in outcome
certainty is not perceived. This requirement for adequate increased outcome
certainty is based on two general motivation theories (Atkinson, 1974; Vroom,
1964).
Assuming that the individual commences problem solving then as they make
progress with resolving the situation their perception of the potential for
success increases in lock step with their progress. At the point where they are
completely certain that the problem is solved, by definition the problem
solving progress is 100% complete. This suggests that the creative motivation
zenith and nadir points of creative motivation identified in CRR may have
some specific qualitative meaning in terms of problem solving progress.
The zenith of creative motivation may be related to problem definition.
Problem solvers typically attack problems by trying to categorise or reconcile
problems in order to use previously successful problem solving strategies.
Belief that a problem has been properly or usefully defined is likely to result in
a reduction of anxiety regarding the potential to satisfy extrinsic motivators.
Thus 20% outcome certainty (the zenith point of creative motivation) is
asserted to qualitatively relate to the point where the individual problem
solver is satisfied that they have defined the problem. It seems reasonable to

221
conclude that maximum creativity could naturally occur when the problem
solver switches from working out what the problem is to creating ideas to
manage the problem. This point may also represent peak intrinsic interest in
the problem as curiosity relating to how to understand the problem situation
peaks. Once the problem has been defined to the satisfaction of the problem
solver ideation is expected to begin.
Thus it is also asserted that the section of the CRR pattern of response
between peak and minimum creative motivation may correspond to idea
generation and/ or trial and error processes to attempt to solve the problem.
As more and more ideas are created and evaluated the problem solver has
the potential to make progress towards an acceptable solution. During these
efforts the problem solver may gradually exhaust a range of ideas with the
potential to solve the problem, or they may make a discovery to have a
sudden insight about how to deal with their problem. In any event, at some
point they become satisfied that they have optimised their problem solving
efforts and begin to implement their preferred option or options to resolve the
problem. At this point their perception of outcome certainty is that the
problem is practically complete because a solution strategy has been
formulated.
It is during this ideation and implementation phase that the problem solver
may increase their sensitivity to extrinsic motivators that encourage the
problem solver to resolve the problem. Two mechanisms are proposed as the
potential cause of this increase insensitivity: time pressure and completion
motivation. In organisational problem solving contexts, problem solvers are
typically faced with either an explicit deadline for completion or an implicit
understanding that “time is money”. Thus the more time that is spent on a

222
problem the more sensitive the individual becomes to the extrinsic need to
solve the problem. In some cases the level of urgency to solve the problem
may increase, but this need not be the case for increased sensitivity to a real
or imaginary deadline to occur on the part of the problem solver. Amabile (T.
M. Amabile et al., 2002) shows that in general time pressures reduce creative
motivation. Creative motivation is also expected to be effected by
expectancy.
Expectancy theories of motivation (Atkinson, 1974; Vroom, 1964) suggest that
motivation is proportional to problem solving progress. Atkinson’s theory
asserts that motivation is proportional to potential for success. Vroom’s theory
includes expectancy that effort will result in success as a factor of motivation.
Both Vroom’s and Atkinson’s theories define this component of motivation as
an extrinsic factor contributing to overall motivation. As outcome certainty
increases the extrinsic component common to Vroom’s and Atkinson’s
motivational theories also increases (by definition). Increasing extrinsic
motivation results in reduced creative motivation (Amabile, 1997; T. M.
Amabile, 1996; T. M. Amabile, 1998). This waning of creative motivation in turn
reduces the problem solver’s creative output in accordance with Amabile’s
(T. M. Amabile, 1983) three factor model of creative production.
At some point it can be assumed that the problem solver ideally achieves
“practical completion”. At this point that problem solver has essentially
satisfied all extrinsic motivation requirements to solve the problem:
expectancy becomes near certainty and time pressures are subsequently
eliminated. It would be expected that at this point the problem solver
switches to satisfying their intrinsic motivations and subsequently creative
motivation increases after reaching a minimum level.
223
Minimal creative motivation occurs at between 60% and 70% perceived
outcome certainty. This nadir in the CRR pattern is asserted to correspond with
the problem solver perceiving that they have achieved practical completion
in solving the problem. After practical completion is achieved the CRR
pattern suggests that problem solvers become more motivated to be
creative because the time and risk pressures associated with solving the
problem are relieved. These interpretations of the mechanism of CRR prompt
some practical application advice for managers that want to enhance
creativity in their organisations.
To some extent the findings related to CRR support previous research relating
to the requirement to reduce extrinsic motivators (like time and success
pressure) in order to enhance motivation. In addition CRR also suggests that
creativity is enhanced if Innovators are involved in problem solving more than
if Adaptors are involved in problem solving due to Innovators’ higher average
levels of creative motivation. However the most important potential
application of CRR is whether or not managers should try to get problem
solvers to stay in the problem definition stage of problem solving as long as
possible. Managers might do this by influencing problem solvers to believe
that their perceptions of outcome certainty (prior to practical completion)
are overly optimistic. This could be expected to be effective at increasing
creative motivation if it results in a reduction of individual outcome certainty
perception back towards 20%. The method of presenting this information is
also important: If the manager does not also provide support for problem
solvers in terms of corresponding reduced urgency and increased potential
for success, then they will exacerbate extrinsic motivators and increase the

224
stress of the problem solvers. Thus the message from managers to employees
may need to include three key credible points:
1. There is more to this problem than meets the eye at first glance, so it
may be worthwhile to revisit some earlier parts of the problem solving
process.
2. Considering a wider range of problem definitions and more ideas will
likely increase the potential for problem solving success.
3. There is plenty of time to revisit other possible problem definitions
without risk of over running completion deadlines, so why not spend
the time reconsidering how to define the problem differently.
There is a second consideration relating to the application of CRR. Managing
a diverse problem solving team comprised of both Innovators and Adaptors is
likely to be hard to coordinate. Hammerschmidt (Hammerschmidt, 1996b)
shows how individuals with different cognitive styles exhibit very different
approaches to problem solving. Mumford and Feldman (Mumford, Feldman,
Hein, & Nagao, 2001) assert that such diversity should be managed by
creating a so called “shared mental model”. A shared mental model reduces
conflict by getting all problem solving team members to agree to common
approach to understand and deal with the problem at hand. At first
consideration establishing a shared mental model seems to be rational for the
management of problem solving groups. CRR suggests a different and
counter intuitive option.
A manager who wants a diverse team of problem solvers to operate together
may inherently or explicitly try to match the various individuals' levels of
creative motivation. CRR suggests that if individuals with differing cognitive

225
styles are working on a problem together with similar perceptions of outcome
certainty, then they will certainty have different levels of creative motivation.
This can cause dysfunctional group conflict. Managers may be able to
intervene to reduce this conflict by promoting an approach that supports
“diverse mental models”.
Essentially a manager could try to influence Adaptors in the problem solving
team to reduce their perception of outcome certainty without amplifying
time or risk concerns in order to increase their creative motivation via the CRR
pattern of response. Additionally the manager might also try and influence
the Innovators in the problem solving team to increase their perception of
outcome certainty or to increase their concerns about time pressures and
completion risk so that the Innovator’s creative motivation reduces in
accordance with their CRR pattern. By reducing the Innovators’ creative
motivation and increasing the Adaptors’ creative motivation the manager
might decrease the intra group conflict due to different individual conclusions
about the level of creativity required.
The diverse mental model concept derived from the findings of CRR is about
assisting members of a problem solving team to retain different perceptions of
outcome certainty (paradoxically to match creative motivation levels). CRR
findings can also be used to decrease creative motivation.
The corollary of the above discourse is that managers who wish to reduce the
creativity during problem solving efforts may consider a range of options:
1. Increase time, performance risk or other extrinsic motivational pressures
2. Select problem solving teams biased to include more Adaptors

226
3. Influence problem solvers to increase their perceptions of outcome
certainty towards 70%
CRR suggests some management activities that assist the systemisation of the
so called “fuzzy front end” of innovation as suggested by Boeddrich
(Boeddrich, 2004) and others (Koen et al.). CRR provides support for belief
that creativity production during organisational problem solving is the result of
the interplay between expectancy, urgency, cognitive style and perceived
outcome certainty. The complexity of this relationship and the relative rarity of
high expectancy, low urgency, high KAI, low outcome certainty problem
solving situations may also explain to aspects of so called “Hot groups”.
Hot groups have been examined by Bradford (Bradford, 1997) and
Rappaport (Rappaport, 1996) and are defined as teams that are extremely
creative because they exhibit an extreme level of member involvement and
commitment as ‘hot groups’. Members of hot groups apparently exhibit an
enthusiasm for their work that makes them apparently behave like people in
love. Little is understood about the mechanism for establishing hot groups,
though prescriptions about the organisational conditions required for them to
emerge has been outlined. Bradford and Rappaport assert that in general
hot groups occur in response to a non-urgent crisis; where there is significant
shared belief within the hot group about the importance of their actions in
tackling the problem solving task; and where organisational barriers to
creative production (like bureaucracy) are few. Viewed through the lenses of
creative motivation and CRR hot groups may arise in a particular set of
circumstances that match the conditions for creative motivation zenith: From
a CRR perspective expectancy is high (shared belief), urgency is low (non-
urgent crises) and outcome certainty is low (crises). From a creative

227
motivation perspective intrinsic motivation is high (falling in love with the work)
and extrinsic motivators are suspended or reduced for the hot group (low
bureaucracy).
In summary, whilst the link to hot group formation is tenuous, the other findings
from Study One regarding Creative Resolve Response are important in the
context of the research objectives above. CRR does suggest that individual
creative motivation might vary in a systematic way as a function of outcome
certainty, though further research is recommended to confirm the extent that
this finding can be generalised. Whilst the pattern of response is similar for
both Innovators and Adaptors, Innovators on average report higher levels of
creative motivation at all levels of outcome certainty. These findings suggest
a range of possible new interventions for managers to enhance or reduce the
creativity of employees they supervise. The findings also suggest the potential
for diverse mental models as a method of team problem solving
coordination. The next section relates the application of findings from Study
Two.
Study Two Response to Objectives
Whilst Study One essentially investigated how to enhance the production of
creative ideas, Study Two was about how to enhance the potential for these
ideas to be chosen for implementation within the organisational context.
Study Two was conceived in order to identify relationships between framing
effects and decisions about whether or not to implement potential creative
solutions to problems (defined above as operationalised creativity).
The most important finding in Study Two was that describing an alternative as
“innovative” seemed to make it more attractive. This preference distortion

228
appeared to apply across a range of different decision domains and in some
cases was so powerful as to counteract the effects of risk based framing
previously presented by Tversky and Kahneman (Tversky & Kahneman, 1981).
Managers wishing to enhance the potential for creative options to be
selected for implementation merely need to explicitly describe such options
as innovative and they may appear significantly more attractive to decision
makers. This preference shift seems to occur even if the options in question
are perceived as risky and potential losses and gains are quantified.
A second finding from Study Two is that in general operationalised creativity
options seem to be preferred when choosing but also seem to be perceived
as extreme (that is they contain both advantages and disadvantages). Shafir
(Shafir, 1993) showed that extreme options are preferred more often in
decisions presented as choices rather than rejections due to attribute framing
effects. Managers wishing to enhance the potential operationalised creativity
options to be implemented could try to retain control of the framing of
implementation decisions. Specifically they could try to ensure that such
decisions are presented as choices (e.g. “Which of these is best to do?”)
rather than rejections (e.g. “Which of these should we rule out?”). This finding
seems to hold regardless of the particular instance of operationalised
creativity under consideration in these studies (fluency, flexibility, originality,
novelty, divergence, deviance or rule breaking) in the limited range of
contexts tested. Further work is recommended to determine the extent that
this finding could be generalised.
In the event that a manager cannot control how an implementation decision
is framed, then it seems to be rational to deemphasize the operationalised
creativity aspects for decisions presented as rejections if creativity

229
implementation is to be enhanced. This is because some operationalised
creativity aspects were apparently not preferred or at least less preferred
when decision makers were presented with choices framed in terms of
rejection. Similarly if managers wish to reduce the potential for the
implementation of creative options, then decisions could be framed as
rejections and operationalised creativity aspects of options could be made
explicit (though this effect did not hold in all contexts tested and further work
needs to be done to test the extent that this finding can be generalised).
Study Two suggests an important area for future research regarding creativity
production. It seems that framing effects are external interventions that
unlock an individual’s own perceptual distortions. Viewed through the lens of
creative motivation, framing effects seem to act like extrinsic motivators
except that they unlock or activate individual intrinsic motivations in the form
of perceptual distortions that affect preferences. Framing effects are not like
synergistic extrinsic motivators in that they do not seem to require intrinsic
motivation to be present in order to be effective, though further investigation
needs to be completed to confirm this. Framing effects seem to be a rare
form of extrinsic motivation that has an intrinsic effect. This suggests tentative
support for the idea that framing effects could be used earlier in the problem
solving process by managers to enhance creative production. This conclusion
is partially supported by other research that highlights the importance of the
supervisor-employee relationship to employee creativity (T. M. Amabile, 1998;
DiLiello & Houghton, 2006; George & Zhou, 2007; Oldham & Cummings, 1996;
Redmond et al., 1993; Tierney et al., 1999; Wang & Casimir, 2007). The ability
to effectively use framing effects to enhance employee creativity would
seem to be idiosyncratic to a relationship with a supervisor. Further research is

230
required in order to investigate how framing effects could be explicitly used in
this regard.
In summary attribute framing effects seem to apply to decisions involving
creativity in complex ways. Despite this complexity, there are some apparent
consistencies that apply. The research findings suggest that managers might
improve the chances that operationalised creativity options will be selected
for implementation by:
1. Qualitatively describing these options as innovative, even when the
risks and potential gains and losses have been otherwise quantified.
2. Retaining control of how the implementation decision is framed in
order to ensure the selection decision is presented as a choice, rather
than submitting to a selection decision being presented as a rejection.
3. Making operationalised creativity aspects explicit in decisions framed
as choices, because generally creative options were either more
preferred or equally preferred to relatively less creative options due to
positive attributes.
4. Deemphasizing operationalised creativity aspects explicit in decisions
framed as rejections due to the perception that creative choices have
some negative attributes that are highlighted in rejecting decision
frames.
The next section relates the application of findings from Study Three.
Study Three Response to Objectives
Study Three extends the application of framing effects to decisions involving
operationalised creativity to consider the moderating effects of individual
231
cognitive style. The first finding from Study Three is that it seems reasonable to
consider that risk based and attribute framing effects apply in general to all
individuals regardless of their cognitive style. This is important from an
organisational design perspective for firms that wish to enhance creativity.
Whilst the findings of Study One suggest that Innovators are more motivated
to be creative than Adaptors, Study Three does not suggest that Adaptors are
any more sensitive to risk based framing effects. To the extent that
operationalised creativity is perceived as risky inside the organisational
context, there seems to be no need to be concerned about the cognitive
style of implementation decision makers. Study Three suggests that Adaptors
in a position to authorise or veto operationalised creativity options may not be
significantly more or less affected by risk based framing.
The results of Study Three further suggest that in different contexts Adaptors
may actually tend to prefer some kinds operationalised creativity more than
Innovators. This suggests that it may be important from an organisation design
perspective to promote both Innovators and Adaptors to positions of
authority within the organisation in order to ensure that operationalised
creativity options have the greatest potential for selection and
implementation. The fact that different KAI subgroups exhibited different
preference tendencies for operationalised creativity in different contexts
makes it too complex to predict Adaptor or Innovator decision outcomes on
any case by case basis.
Overall it is possible to combine some findings of Study One and Study Three
as they relate to enhancing creativity within the organisation. It is possible that
by choosing individuals for roles based on their cognitive style creativity within
the organisation can increase. Compared to Innovators, Adaptors seem likely

232
to be less motivated to develop operationalised creativity options. However
neither group was consistently more or less likely to select such options for
implementations over less creative alternatives. Managers that wish to exploit
this finding could consider reducing the proportion of Adaptors involved in
design functions, while possibly ensuring that they are adequately
represented in approval roles. These findings may not be the most important
from Study Three, however.
Both KAI sub groups seemed to exhibit significant preferences for safe rule
breaking over non-creative, compliant alternatives. This result suggests two
potentially important implications for managers that wish to enhance
creativity in their organisations. Firstly it suggests that Kirton’s (Kirton, 1976)
foundational description of Adaptors and Innovators in terms of their attitudes
to compliance and rule breaking might be too simplistic. Cognitive style
seems to be more complex than Kirton’s descriptions imply or perhaps human
cognition is too complex to be neatly described by cognitive style alone.
Perhaps even more importantly there is a clear application for potentially
enhancing operationalised creativity implementation inside the organisation:
Managers could present the selection of operationalised creativity as both
safe and deviant (i.e. rule breaking).
The extrinsic motivational nature of the typical organisation probably requires
managers to protect would be creative implementers from a negative
organisational response. Pichot and Callahan (Pinchot & Callahan, 2000)
present an archetypal case study of how organisations may inherently retard
creativity implementation. Two practitioner based articles support this
empirical finding (Pascale & Sternin, 2005; Sternin & Choo, 2000). Sternin and
Choo advocate permitting rule breakers to operate in defiance of
233
organisational policy and processes provided that they are aligned with
organisational goals. Pascale and Sternin suggest that change agents within
an organisation may often remain unidentified. It is possible that this secrecy is
required to protect them from a negative organisational response to
instituting creative changes.
In summary Study Three suggests that cognitive style may be more
complicated than presented by Kirton, and in particular cognitive style seems
to interact differently with creative motivation production when compared to
how it moderates decisions involving operationalised creativity. In contrast to
consistently lower Adaptor creative motivation during problem solving
exhibited in Study One, in some contexts in Study Three Adaptors seemed to
prefer operationalised creativity more than Innovators. Study Three also
suggests that managers who wish to enhance the implementation of
operationalised creativity options in their organisations could frame these
options as safe rule breaking.
Caveats and Limitations
The extent to which the findings of the three studies above can be
generalised is limited. This section presents cautionary elements regarding the
conclusions above that relate to context, environment, definitions, individual
factors, scope, durability, application and alternatives.
The fundamental limitation of the study is that the effects observed were
confined to a limited range of contexts. In Study One for example the results
were aggregated across five different problem solving situations only. Whilst
the diverse nature of these experiments supports generalisation, there is no
way from this research to identify whether or not these results are exceptional

234
because of the problems involved. In Study Two and Three the question sets
were not able to cover the entire range of decisions faced within the
organisation. These concerns are further exacerbated by the fact that all the
data was collected in the laboratory and not in real world organisational
contexts. The potential for the effects to be increased, decreased,
moderated or overwhelmed by unidentified organisational factors not
present suggests some caution in applying the management suggestions
above.
The findings also require acceptance of the definitions used in the research. In
Study One, creative motivation was represented as a Likert scale. It is possible
that respondents attributed very different meaning to what was meant by
terms like “very high creativity” for example. A similar caveat could apply to
the idea that outcome certainty perception is an adequate proxy measure
for problem solving progress. Specifically 20% outcome certainty may not
relate reliably at all to problem definition; 70% outcome certainty does not
have to represent practical completion. The various questions in Study Two
and Study Three create instances of operationalised creativity that are also
open to interpretation. For example, an individual may perceive that
stopping short while driving to a destination in order to travel the last section
on foot and potentially arrive earlier is not original, novel, or divergent. Some
individuals may not even perceive this alternative as creative at all.
Many of these concerns relate to issues regarding individual meaning making.
These studies measure tendencies not cause and effect. It is not possible to
conclude for example that every decision maker will be more likely to choose
an innovative option over a non-innovative option. Different individuals will
process this decision idiosyncratically to arrive at their own personal

235
conclusion. This reduces the findings in this research to “playing the odds” in
order to improve long run aggregate outcomes rather than “moving the
levers” for instant cause and effect. For operationalised creativity decisions
framing effects appear to be moderated by contextual considerations that
were not tested in these studies. Cognitive style further exacerbates these
limitations.
All of the effects in Study One and Study Three that involve cognitive style
were observed or more likely to be more pronounced for more extreme KAI
scores. The fact that more extreme Innovators and more extreme Adaptors
are the minority is not helpful for managing individuals with more moderate
cognitive styles. Future research could consider other possible moderating
variables not investigated in these studies including age, gender, and
ethnicity.
Another issue for future research concerns the assumption that the CRR
pattern of response is constant. It may be that attempting to influence an
individual’s outcome certainty perception also distorts their CRR pattern of
response. Further work is required to determine what happens to creative
motivations when employees are influenced in this way. Even if the effect of
influencing outcome certainty is predictable, the size of the effect may be
too small to be useful. In fact other approaches to enhancing employee
creativity like supervisor support may be more effective than attempts to
influence outcome certainty.
The utility of the framing effects findings from Study Two and Study Three may
also be limited because no investigation into goal behaviour framing effects
was undertaken. Even operationalised creativity decisions may be framed by

236
employees as behavioural choices rather than attribute based decisions
when translated into real world contexts. This could limit the extent to which
the findings in Study Two and Study Three can be generalised.
Even if the findings are able to be translated to real organisation situations
and contexts, the effects may not be durable. Specifically the descriptor
“innovative” may become so common over time that it loses its preference
distorting impacts. This effectiveness reduction could happen at individual,
organisational or even societal levels. Outside of organisations individuals are
assaulted by a myriad of different advertisements and other marketing
initiatives that attempt to utilise framing effects to influence purchase
decisions. Over time it is likely that resistance to these framing effects can be
cultivated. For example Sheehan asserts that Generation Y are subject to
around 22,000 advertisements each day and as a result have developed an
exceptional level of scepticism (Sheehan, 2005). However a more concerning
issue regarding framing effects relates to managers’ ability to retain control of
the framing of decisions related to operationalised creativity.
In many organisations procedures are institutionalised in forms that
automatically cause framing effects. Consider for example a quality
assurance audit that is designed to identify non-conforming components via
a visual inspection. This process is inherently framed as a decision whether or
not to reject the component in question. This decision framing has high utility
because there will be a tendency on the part of the decision maker to
identify and reject components that may be 90% ok, but are otherwise
defective. Applying the same approach to a management hiring decision
does not necessarily offer the same utility.

237
In comparison to the component quality assurance inspection example listed
above, consider a manager following a quality assured recruitment
procedure that operates in a similar way. In this situation is possible that a
manager may have to decide between two applicants – one who meets all
of the hiring criteria and has a history of mediocre past job performance,
versus another more extreme applicant that has excellent past job
performance but is somehow substandard on a few of the job performance
criteria. If this hiring decision is framed as a rejection (in a similar way to the
component inspection decision above) then there is a greater likelihood that
the excellent past performing candidate is likely to be rejected due to
attribute framing effects. This same hiring procedure framed in terms of
choosing the best applicant for the job would be highly likely to have a
different outcome.
Finally a methodological issue also requires discussion. Study Two and Study
Three have a potential research design flaw that became apparent after
they were concluded: Cumulative Type I error also called Familywise error
(see Shaffer 1995). Given the large number of tests where significant
differences in preferences were found it would seem that the two studies do
offer valid findings. However the large number of tests conducted increases
the potential to find significant results merely due to random effects. This
cumulative Type I error can be managed by determining a significance level
based on the Sidak-Bonferroni treatment (Shaffer 1995). Applying this
calculation for the 13 significant items found, only results with p<0.003846
should be considered as non random; the other results above should be
interpreted with caution. However this correction approach might be too
conservative and increases the potential to make a Type II error (Schaffer,

238
1995). There is quite a reasonable chance that at least one test result could
appear to be significant to p<0.05 out of 25 tests when in fact no significance
really existed. However there is a much smaller chance that 10 tests would
appear significant. The chance for this can be calculated, and is derived in
the equations below.
Start by considering a study involving a number of tests, all of which in
actuality are devoid of correlation. For these tests any correlation found is
falsely significant and constitutes a Type 1 statistical error. Equation [1] details
the probability of completing the tests and not getting any falsely significant
result:
P(fsr=0|n@p) = (1-p)n
Where P(fsr=0|n@p) is the probability of zero falsely significant results for n
tests at a given significance level of p (typically p=0.05 or p=0.01). Now the
chance of at least 1 falsely significant result is shown in [2] below. This is simply
the chance that something other than zero false significant results occurs:
[1]
P(fsr>=1|n@p) = 1- P(fsr>0|n@p)
P(fsr>0|n@p) = 1- P(fsr=0|n@p)
P(fsr>=1|n@p) = 1-(1-p)n
Calculating with values p=0.05, n = 25 gives:
[2]
P(fsr>=1|[email protected]) = 1-0.95
P(fsr>=1|[email protected]) = 0.723
25
Now the chance of 2 or more falsely significant results in n tests is given by
determining the probability of at least one falsely significant result in n tests
and multiplying this by the probability of at least a single false test for the

239
remaining tests after the first. The probability of this second factor is by
definition P(fsr>=1|n-1@p). This enables the derivation of P(fsr>=2|n@p) as
follows:
P(fsr>=2|n@p) = P(fsr>=1|n@p) x P(fsr>=1|n-1@p) [3]
Equation [3] above can be generalised to apply to determine the probability
of finding m falsely significant results in n tests for a given significance level of
p or P(fsr>=m|n@p):
P(fsr>=m|n@p)=P(fsr>=1|n@p)xP(fsr>=1|n-1@p)x….P(fsr>=1|n-
m+1@p)
P(fsr>=m|n@p)=[1-(1-p)n]x[1-(1-p)n-1]x….[1-(1-p)n-m+1
The table below shows the calculated values of P(fsr>=m|[email protected])
] [4]
Item Probability
P(fsr>=1|[email protected]) 0.723
P(fsr>=2|[email protected]) 0.512
P(fsr>=3|[email protected]) 0.354
P(fsr>=4|[email protected]) 0.240
P(fsr>=5|[email protected]) 0.158
P(fsr>=6|[email protected]) 0.101
P(fsr>=7|[email protected]) 0.063
P(fsr>=8|[email protected]) 0.038
P(fsr>=9|[email protected]) 0.022
P(fsr>=10|[email protected]) 0.012
In Study Three, 9 significant items were found in 25 tests used to test
hypotheses H1 and H2 detailed in that paper. In addition 9 extra tests were
completed to test H3 from that paper, of which 4 appeared to be significant.
To determine if these results could be falsely significant due to cumulative
type 1 error, probabilities of falsely significant results were calculated using
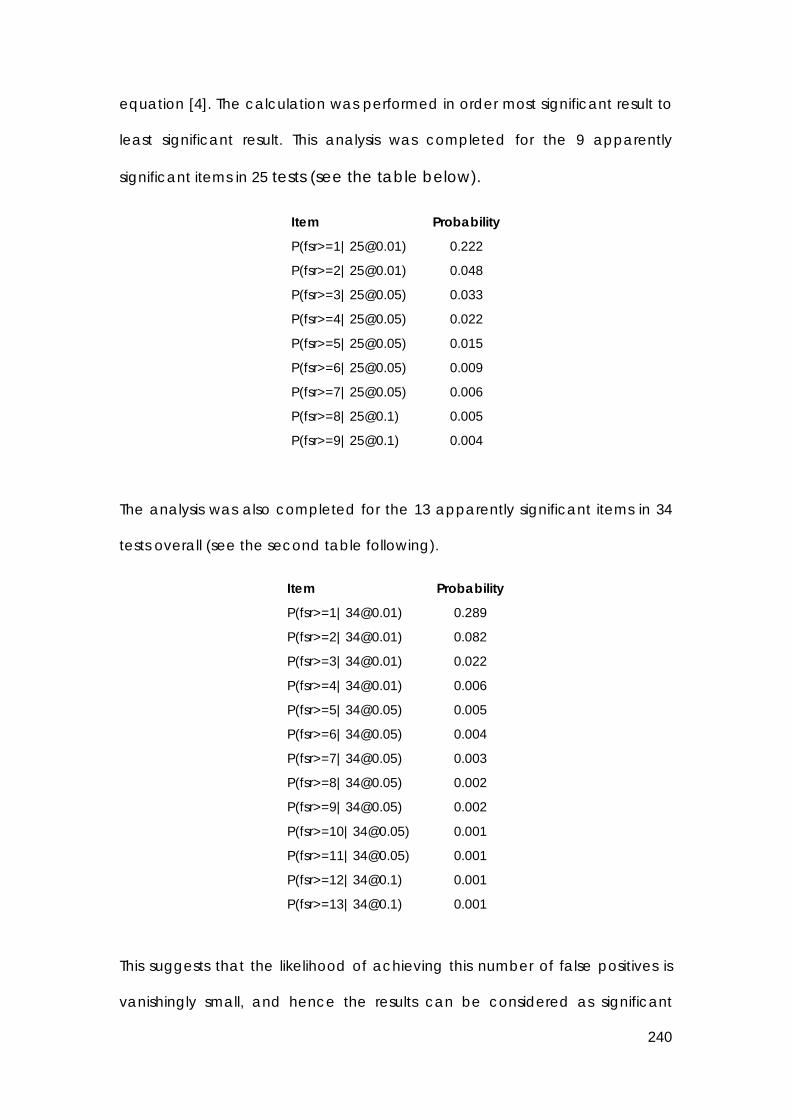
240
equation [4]. The calculation was performed in order most significant result to
least significant result. This analysis was completed for the 9 apparently
significant items in 25 tests (see the table below).
Item Probability
P(fsr>=1|[email protected]) 0.222
P(fsr>=2|[email protected]) 0.048
P(fsr>=3|[email protected]) 0.033
P(fsr>=4|[email protected]) 0.022
P(fsr>=5|[email protected]) 0.015
P(fsr>=6|[email protected]) 0.009
P(fsr>=7|[email protected]) 0.006
P(fsr>=8|[email protected]) 0.005
P(fsr>=9|[email protected]) 0.004
The analysis was also completed for the 13 apparently significant items in 34
tests overall (see the second table following).
Item Probability
P(fsr>=1|[email protected]) 0.289
P(fsr>=2|[email protected]) 0.082
P(fsr>=3|[email protected]) 0.022
P(fsr>=4|[email protected]) 0.006
P(fsr>=5|[email protected]) 0.005
P(fsr>=6|[email protected]) 0.004
P(fsr>=7|[email protected]) 0.003
P(fsr>=8|[email protected]) 0.002
P(fsr>=9|[email protected]) 0.002
P(fsr>=10|[email protected]) 0.001
P(fsr>=11|[email protected]) 0.001
P(fsr>=12|[email protected]) 0.001
P(fsr>=13|[email protected]) 0.001
This suggests that the likelihood of achieving this number of false positives is
vanishingly small, and hence the results can be considered as significant

241
despite the potential for a cumulative type I family wise error. Similar
calculations for Study Two were completed and combined overall with Study
Three. Study Two was based on 19 new tests of which 9 appeared to be
significant. The probability of this happening as a random event assuming null
hypotheses is approximately 0.0002. Overall combining Study Two and Study
Three, the probability of randomly achieving 22 falsely significant results in 53
tests is approximately 0.0003.
Enhancing Understanding of Creativity Management
Notwithstanding the range of limitations identified in the three studies, this
research does develop the creativity management research frontier. Xu and
Rickards suggest that the future of creativity research will relate to three
principles: universality, development and environment (Xu & Rickards, 2007).
Their model of creative management asserts the importance of creative
managers as critical to innovative companies. The findings of this study satisfy
all three principles. By definition Creative Resolve Response and Framing
Effects (as applied to creativity) seem to be universally applicable. Applying
these findings usefully as a manager may require development on the part of
the manager and also may facilitate development in the potentially creative
employee. Finally environmental factors seem to be critical in terms of the
overarching extrinsic motivation within the organisational context.
Some further areas for research that these studies suggest include:
► Understanding how creative resolve response changes when
perception of outcome certainty is influenced.

242
► Identifying systematic contextual groupings that predict
operationalised creativity preferences for Adaptors and Innovators.
► Determining other variables (e.g. age, ethnicity or gender) that also
moderate creative motivation, sensitivity to framing effects and
preferences operationalised creativity.
In general this research introduces management options to potentially
enhance creativity by unlocking intrinsic motivators. Creative Resolve
Response suggests that influencing employees indirectly by getting them to
reconsider the extent of their outcome certainty (and hence reduce their
belief in their own problem solving process) has the potential to increase
creativity production through greater creative motivation. Creative Resolve
Response is supported by research related to individual creativity factors
(Munoz-Doyague, Gonzalez-Alvarez, & Nieto, 2008) which shows creativity is
related not only to personality, expertise and intrinsic motivation but also to
cognitive style. Further support is also offered by Sternberg’s investment theory
of creativity (Sternberg, 2006) which splits the expertise factor above into
knowledge and intellectual skills; and adds environment as a new
component.
Additionally the findings related to framing effects in this project provide
further potential tools for managers to influence employee’s choices
regarding whether or not to implement operationalised creativity options.
Framing effects appear to unlock individual intrinsic motivations in the form of
perceptual distortions. Whilst this study limits the investigation of framing
effects to how they may influence operationalised creativity choices, there is
significant potential for applying framing effects earlier in the problem solving

243
process to enhance creative production. Kasof et al (Kasof, Chen, Himsel, &
Greenberger, 2007) propose “self-determined extrinsic motivation arising from
one’s personally held core values” can enhance creativity, supporting the
idea that some extrinsic motivators can increase creativity motivation.
Managers may also benefit from an increased understanding of the new
complexities discovered relating to cognitive style.
Finally this project expands the understanding of cognitive style to
unexpectedly identify decision contexts where Adaptors seem to exhibit
significantly higher preferences for operationalised creativity than Innovators.
Adaptors seemed to exhibit no significant differences to Innovators in their
preferences for safe rule breaking. This suggests that Adaptors may be more
creative than previously implied.
Combined, these conclusions suggest that there are more options for
creativity management than simply trying to reduce extrinsic motivational
effects inherent in the organisation.

244
References
Amabile. (1997). Entrepreneurial creativity through motivational synergy.
Journal of Creative Behavior, 31(1), 18-26.
Amabile, T., Barsade, S., Mueller, J., & Staw, B. M. (2005). Affect and Creativity
at Work. Administrative Science Quarterly, 50(3), 367-403.
Amabile, T. M. (1983). The social psychology of creativity: A componential
conceptualization. Journal of Personality and Social Psychology 45,
357-376.
Amabile, T. M. (1990). Within you, without you: The social psychology of
creativity, and beyond. 61-91.
Amabile, T. M. (1996). Creativity in context. Boulder. CO: Westview Press.
Amabile, T. M. (1997). Motivating Creativity in Organizations: ON DOING WHAT
YOU LOVE AND LOVING WHAT YOU DO. California Management
Review, 40(1), 39-58.
Amabile, T. M. (1998). How to Kill Creativity. (Cover story). 76(5), 76-87.
Amabile, T.M. (1982). The Social Psychology of Creativity: A Consensual
Assessment Technique. Journal of Personality and Social Psychology 43,
997-1013.
Amabile, T. M., Hadley, C. N., & Kramer, S. J. (2002). Creativity under the gun.
Harvard Business Review, 80(8), 52.
Amabile, T. M., Hennessey, B. A., & Grossman, B. S. (1986). Social influences on
creativity: The effects of contracted-for reward. Journal of Personality
and Social Psychology, 50, 14-23.

245
Amabile, T.M. and Kramer, S.J. Inner Work Life: Understanding the Subtext of
Business Performance. Harvard Business Review, Vol. 85(5) May 2007,
72, 74-83.
Amabile, T. M., Schatzel, E. A., Moneta, G. B., & Kramer, S. J. (2004). Leader
Behaviors and the Work Environment for Creativity: Perceived Leader
Support. Leadership Quarterly, 15(1), 5.
Andriopoulos, C. (2001). Determinants of organisational creativity: A literature
review. Management Decision, 39(10), 834.
Assink, M. (2006). Inhibitors of disruptive innovation capability: a conceptual
model. European Journal of Innovation Management, 9(2), 215-233.
Atkinson, J. W. (1974). The mainsprings of acheivement-oriented activity. In
Motivation and Achievement (pp. 13-41). New York: Wiley.
Baer, M., Oldham, G., & Cummings, A. (2003). Rewarding creativity: When
does it really matter? Leadership Quarterly, 14(4,5), 569.
Barlow, C. M. (2001, 2001///). Insight or ideas: escaping the idea centered
"Box" defining creativity. Paper presented at the Proceedings of Hawaii
International Conference on System Sciences. HICSS-34, Maui, HI, USA.
Basadur, M. (1992). Managing creativity: a Japanese model., Academy of
Management Executive (Vol. 6, pp. 29): Academy of Management.
Basadur, M. (1994). Managing the creative process in organizations. In M. A.
Runco (Ed.), Problem finding, problem solving, and creativity. (pp. 237-
268): Ablex Publishing.
Basadur, M. (1997). Organizational Development Interventions for Enhancing
Creativity in the Workplace. Journal of Creative Behavior, 31(1), 59-72.
Basadur, M. (2004). Leading Others to Think Innovatively Together: Creative
Leadership. Leadership Quarterly, 15(1), 103.

246
Berkshire, S. D. (1995). Critical behaviors in innovative and creative decision-
making and problem-solving work groups. Unpublished 9525793, Boston
University, United States -- Massachusetts.
Boeddrich. (2004). Ideas in the Workplace: A New Approach Towards
Organizing the Fuzzy Front End of the Innovation Process. Creativity
and Innovation Management, 13(4), 274-285.
Boerner, S., Eisenbeiss, S. A., & Griesser, D. (2007). Follower Behavior and
Organizational Performance: The Impact of Transformational Leaders.
Journal of Leadership & Organizational Studies, 13(3), 15.
Bradford. (1997). Some like it hot. Management Development Review, 10(6),
207.
Bruner, J. (1990) Acts of meaning. Cambridge MA: Harvard University Press.
Casbolt, D. M. (1984). The effects of idea generation technique, problem
type, and creative thinking style on individual problem solving
performance. Unpublished 8412552, Ohio University, United States --
Ohio.
Christensen-Szalanski, J. J. J. (1978). Problem Solving Strategies: A Selection
Mechanism, Some Implications, and Some Data. Organizational
Behavior and Human Performance, 22(2), 307.
Clapham, M. M. (2000). Employee creativity: The role of leadership. The
Academy of Management Executive, 14(3), 138.
Conti, R., Coon, H., & Amabile, T. (1996). Evidence to support the
componential model of creativity: Secondary analysis of three studies.
Creativity Research Journal, 9, 385-389.
247
Cooper, B. L., Clasen, P., Silva-Jalonen, D. E., & Butler, M. C. (1999). Creative
performance on anin-basket exercise Effects of inoculation against
extrinsic reward. Journal of Managerial Psychology, 14(1), 39.
Cropley, A. J. (2000). Defining and measuring creativity: Are creativity tests
worth using? Roeper Review, 23(2), 72.
Csikszentmihalyi, M. (1996). Creativity : Flow and the Psychology of Discovery
and Invention. New York, NY: Harper Collins.
Csikszentmihalyi, M. (1996). Fields of Accomplishment. In Creativity : Flow and
the Psychology of Discovery and Invention (pp. 41-45). New York:
Harper Collins.
Cummings, A. (1997). The radicalness of employee ideas: An interactive
model of co-worker networks and problem-solving styles. Dissertation
Abstracts International Section A: Humanities and Social Sciences(6),
2287.
de Jong, J. P. J., & Hartog, D. N. D. (2007). How leaders influence employees'
innovative behaviour. European Journal of Innovation Management,
10(1), 41.
Deci, E. L., & Ryan, R. M. (1985). Intrinsic motivation and self-determination in
human behavior. . New York: Plenum.
Deci, E. L., & Ryan, R. M. (2000). Self-determination theory and the facilitation
of intrinsic motivation, social development, and well-being. American
Psychologist, 55, 68-78.
Deci, E. L., & Ryan, R. M. (2000). The "what" and "why" of goal pursuits: Human
needs and the self-determination of behavior. Psychological Inquiry,
11, 227-268.

248
Dewett, T. (2004). Employee creativity and the role of risk. European Journal of
Innovation Management, 7(4), 257.
DiLiello, T. C., & Houghton, J. D. (2006). Maximizing organizational leadership
capacity for the future. Journal of Managerial Psychology, 21(4), 319.
Drucker, P. F. (2004). The Way Ahead., Executive Excellence (Vol. 21, pp. 3):
Executive Excellence Publishing.
Egan, T. M. (2005). Creativity in the Context of Team Diversity: Team Leader
Perspectives. Advances in Developing Human Resources, 7(2), 207.
Egan, T. M. (2005). Factors Influencing Individual Creativity in the Workplace:
An Examination of Quantitative Empirical Research. Advances in
Developing Human Resources, 7(2), 160.
Eisenberger, R. and Cameron, J. (1996) Detrimental Effects of Reward Reality
or Myth American Psychologist 51(11), 1153-1166.
Eisenberger, R. and Shanock, L (2003) Rewards, intrinsic motivation and
creativity: A case study of conceptual and methodological isolation.
Creativity Research Journal, 15(1), 121-130.
Elsbach, K. D., & Hargadon, A. B. (2006). Enhancing Creativity Through
"Mindless" Work: A Framework of Workday Design. Organization
Science, 17(4), 470.
Engle, D. E., Mah, J. J., & Sadri, G. (1997). An Empirical Comparison of
Entrepreneurs and Employees: Implications for Innovation. Creativity
Research Journal, 10(1), 45-50.
Fleenor, J. W., & Taylor, S. (1994). Construct validity of three self-report
measures of creativity. Educational and Psychological Measurement,
54(2), 464-470.

249
Forbes, J. B., & Domm, D. R. (2004). Creativity and Productivity: Resolving the
Conflict. S.A.M. Advanced Management Journal, 69(2), 4.
Ford, C. M. (2002). The futurity of decisions as a facilitator of organizational
creativity and change. Journal of Organizational Change
Management, 15(6), 635.
Ford, C. M., & Gioia, D. A. (2000). Factors Influencing Creativity in the Domain
of Managerial Decision Making. Journal of Management, 26(4), 705-
732.
Foxall, G. R. (1986). Managerial Orientations of Adaptors and Innovators.
Journal of Managerial Psychology, 1(2), 24.
Foxall, G. R., & Bhate, S. (1999). Computer use-innovativeness: Cognition and
context. International Journal of Technology Management, 17(1,2),
157.
Foxall, G. R., & Hackett, P. M. W. (1992). The factor structure and construct
validity of the Kirton Adaption-Innovation Inventory. Personality and
Individual Differences, 3(9), 967-975.
Foxall, G. R., & Hackett, P. M. W. (1994). Styles of managerial creativity: A
comparison of adaption-innovation in the United Kingdom, Australia
and the United States. British Journal of Management, 5(2), 85.
Foxall, G. R., & Szmigin, I. (1999). Adaption-innovation and domain-specific
innovativeness. Psychological Reports, 84(3), 1029-1030.
Friedman, R. S., Forster, J., & Denzler, M. (2007). Interactive Effects of Mood
and Task Framing on Creative Generation. Creativity Research Journal,
19(2-3), 141-162.

250
Gendall, P., Hoek, J., Pope, T., & Young, K. (2006). Message framing effects on
price discounting. Journal of Product & Brand Management, 15(7),
458-465.
George, J. M., & Jing, Z. (2007). Dual tuning in a supportive context: joint
contributions of positive mood, negative mood, and supervisory
behaviors to employee creativity. Academy of Management Journal,
50(3), 605-622.
George, J. M., & Zhou, J. (2007). Dual Tuning In A Supportive Context: Joint
Contributions Of Positive Mood, Negative Mood, And Supervisory
Behaviors To Employee Creativity. Academy of Management Journal,
50(3), 605-622.
Goldsmith, R. E., & Matherly, T. A. (1987). Adaption-Innovation and creativity:
A replication and extension. British Journal of Social Psychology(1), 79-
82.
Goldsmith, R. E., & Matherly, T. A. (1987). Adaption-Innovation and Self-
Esteem. Journal of Social Psychology
Journal of Social Psychology J1 - Journal of Social Psychology, 127(3), 351.
Gough, H. (1981). Studies of the Myers-Briggs Type Indicator in a personality
assessment research institute. Paper presented at the Fourth National
Conference on the Myers-Briggs Type Indicator.
Gryskiewicz, S., & Taylor, S. (2003). Making Creativity Practical: Innovation That
Gets Results. For the Practicing Manager. An Ideas into Action
Guidebook.
Gryskiewicz, S. S. (2000). Creating Positive Turbulence., Association
Management (Vol. 52, pp. 46): American Society of Association
Executives.

251
Gryskiewicz, S. S. (2000). Positive Turbulence., Executive Excellence (Vol. 17,
pp. 18): Executive Excellence Publishing.
Guilford J P. (1967). The nature of human intelligence. . New York: McGraw-
Hill.
Hamel, G. (2000). Reinvent your company. Fortune, 141(12), 98-110.
Hamel, G. (2006). The Why, What and How of Management Innovation.
Harvard Business Review, 84(2), 72-84.
Hammerschmidt, P. K. (1996). The Kirton Adaption-Innovation Inventory and
group problem solving success rates. Journal of Creative Behavior,
30(1), 61-74.
Hennessey, B. A. (1989). The effects of extrinsic constraints on children's
creativity while using a computer. Creativity Research Journal, 2, 151-
168.
Hennessey, B. A., & Amabile, T. M. (1998). Reward, Intrinsic Motivation, and
Creativity. American Psychologist(6), 674-675.
Houtz, J. C., Denmark, R., Rosenfield, S., & Tetenbaum, T. J. (1980). Problem
solving and personality characteristics related to differing levels of
intelligence and ideational fluency. Contemporary Educational
Psychology(2), 118-123.
Isen, A. M., Means, B., Patrick, R., & Nowicki, G. (1982). Some factors
influencing decision making strategy and risk taking. In M. Clark & S.
Fiske (Eds.), Affect and Cognition (pp. 243-261). Hillsdale , NJ: Lawrence
Erlbaum Associates Inc.
Ismail, M. (2005). Creative climate and learning organization factors: their
contribution towards innovation. Leadership & Organization
Development Journal, 26(7/8), 639.

252
Janiszewski C, Silk T, & Cooke A D J. (2003). Different Scales for Different
Frames: The Role of Subjective Scales and Experience in Explaining
Attribute-Framing Effects. Journal of Consumer Research, 30(3), 311-
325.
Jung, C. G. (1926). Psychological Types. New York: Brace Harcourt.
Kahneman D, Knetsch J L, & Thaler R H. (1990). Experimental Tests of the
Endowment Effect and the Coase Theorem. Journal of Political
Economy, 98, 1325-1348.
Kashdan, T. B., & Fincham, F. D. (2002). Facilitating creativity by regulating
curiosity. The American Psychologist, 57(5), 373.
Kasof, J., Chen, C., Himsel, A., & Greenberger, E. (2007). Values and Creativity.
Creativity Research Journal, 19(2-3), 105-122.
Katz, H. S. (2002). The relationship of intrinsic motivation, cognitive style, and
tolerance of ambiguity, and creativity in scientists. Dissertation
Abstracts International: Section B: The Sciences and Engineering(11),
5419.
Kaufmann, G. (1979). The explorer and the assimilator: a cogntiive style
distinction and its potential implications for innovative problem solving.
Scandinavian Journal of Educational Research, 23, 101-108.
Kaufmann, G. (2003). Expanding the mood-creativity equation. Creativity
Research Journal, 15, 131–135.
Kaufmann, G., & Vosburg, S. (1997). Paradoxical effects of mood on creative
problem solving. Cognition and Emotion, 11, 151–170.
Keller, R. T., & Holland, W. E. (1978). A cross-validation study of the Kirton
Adaption-Innovation Inventory in three research and development
organizations. Applied Psychological Measurement(4), 563-570.

253
Kirton, M. J. (1976). Adaptors and innovators - a description and measure.
Journal of Applied Psychology, 61(5), 622.
Kirton, M. J. (1978). Adaptors and innovators in culture clash. Current
Anthropology, 19(3), 611-612.
Kirton, M. J. (1978). Have adaptors and innovators equal levels of creativity?
Psychological Reports, 42(3), 695-698.
Kirton, M. J. (1980). Adaptors and Innovators in Organizations. Human
Relations, 33(4), 213.
Kirton, M. J. (1984). Adaptors and Innovators -- Why New Initiatives Get
Blocked., Long Range Planning (Vol. 17, pp. 137-143).
Kirton, M. J. (1988). Adaptors and innovators: Problem solvers in organizations.
In K. Gronhaug & G. Kaufmann (Eds.), Innovation: A cross-disciplinary
perspective. (pp. 65-85): Norwegian University Press.
Kirton, M. J. (1991). Adaptors and innovators: Why new initiatives get blocked.
In J. Henry (Ed.), Creative management. (pp. 209-220): Sage
Publications, Inc Open University Press.
Klein, A. R. (1990). Organizational Barriers to Creativity. . . And How to Knock.
The Journal of Services Marketing, 4(4), 69.
Koen, P., Ajamian, G., Boyce, S., Clamen, A., Fisher, E., Fountoulakis, S., et al.
Fuzzy Front End: Effective Methods, Tools, and Techniques. Retrieved
8/2/2008, 2008, from
http://www.stevens.edu/cce/NEW/PDFs/FuzzyFrontEnd_Old.pdf
Kozhevnikov, M. (2007). Cognitive Styles in the Context of Modern Psychology:
Toward an Integrated Framework of Cognitive Style. Psychological
Bulletin, 133(3), 464-481.

254
Kruglanski, A. W., Friedman, I., & Zeevi, G. (1971). The effects of extrinsic
incentive on some qualitative aspects of task performance. Journal of
Personality and Social Psychology, 39, 606-617.
Kubes, M. (1992). 'Cognitive Style and interpersonal behaviour: The Kirton
Adaption-Innovation and Schultz's FIRO-B inventories.' Journal of
Human Behaviour, 29, 33-38.
Kwang, N. A., Ang, R. P., Ooi, L. B., Shin, W. S., & al, e. (2005). Do Adaptors and
Innovators Subscribe to Opposing Values? Creativity Research Journal,
17(2/3), 273.
Lataif, L. E., Mintzberg, H., Leonard, E. W., Saka, B., Steele, L., Haruyama, A., et
al. (1992). MBA: Is the Traditional Model Doomed?, Harvard Business
Review (Vol. 70, pp. 128): Harvard Business School Publication Corp.
Latham, G. P., & Pinder, C. C. (2005). Work Motivation Theory and Research at
the Dawn of the Twenty-First Century. Annual Review of Psychology, 56,
485-516.
Leavy, B. (2002). Creativity - The new imperative. Journal of General
Management, 28(1), 70.
Levin I P, & Gaeth G J. (1988). Framing of attribute information before and
after consuming the product. Journal of Consumer Research, 15, 374–
378.
Levin I P, Gaeth G J, Schreiber J, & Lauriola M. (2007). A New Look at Framing
Effects: Distribution of Effect Sizes, Individual Differences, and
Independence of Types of Effects. Retrieved 2/8/07, 2007, from
http://www.biz.uiowa.edu/mrktg/pdf/Framing_Effects_Levin.pdf

255
Levin I P, Schreiber J, Lauriola M, & Gaeth G J. (2002). A Tale of Two Pizzas:
Building Up from a Basic Product Versus Scaling Down from a Fully-
Loaded Product. Marketing Letters, 13(4), 335.
Levin, I. G., Schneider, S. L., & Gaeth, G. J. (1998). All Frames Are Not Created
Equal: A Typology and Critical Analysis of Framing Effects.
Organizational Behavior and Human Decision Processes, 76(2), 149-188.
Lonergan, D. C., Scott, G. M., & Mumford, M. D. (2004). Evaluative aspects of
creative thought: Effects of appraisal and revision standards. Creativity
Research Journal, 16(2), 231-246.
Luck, G. (2004). The relationship of an innovative thinking style, locus of control
and perceived control on job satisfaction and workspace preferences
among knowledge workers. Dissertation Abstracts International:
Section B: The Sciences and Engineering(4), 2133.
Marteau T M. (1989). Framing of information: Its influence upon decisions of
doctors and patients. British Journal of Social Psychology
28, 89–94.
Martinsen, O. (1994). The effect of individual differences in cognitive style and
motives in solving insight problems. Scandinavian Journal of
Educational Research, 38, 83-85.
Matherly, T. A., & Goldsmith, R. E. (1985). The Two Faces of Creativity. Business
Horizons, 28(5), 8.
McLean, L. D. Organizational Culture's Influence on Creativity and Innovation:
A Review of the Literature and Implications for Human Resource
Development. Advances in Developing Human Resources, 7(2), 226.
Mednick, S. A. (1962). The associative basis of the creative process. .
Psychological Review, 69, 220-232.

256
Mednick, S. A., & Mednick, M. T. (1967). Examiner's Manual." Remote
Associates Test." College and Adult Forms 1 and 2. . Boston: Houghton
Mifflin.
Meyerowitz, B. E., & Chaiken, S. (1987). The effect of message framing on
breast self-examination attitudes, intentions, and behavior. Journal of
Personality and Social Psychology, 52, 500-510.
Michalko, M. (2000). Four Steps Towards Creative Thinking. The Futurist, 34(3),
18-21.
Milgram, R. M. and Livine, N. L. (2005) Creativity as a General and Domain-
Specific Ability: The Domain of Mathematics as an Exemplar. In
Kaufman, J. C and Baer, J. (Eds.), Creativity across domains: faces of
the muse. (pp. 187-204): Routledge.
Mintzberg, H., & Sacks, D. (2004). The MBA Menace., Fast Company (pp. 31-
32): Fast Company.
Mumford, M. D. (2000). Managing Creative People: Strategies and Tactics for
Innovation., Human Resource Management Review (Vol. 10, pp. 313):
Elsevier Science Publishing Company, Inc.
Mumford, M. D., Feldman, J. M., Hein, M. B., & Nagao, D. J. (2001). Tradeoffs
between Ideas and Structure: Individual versus Group Performance in
Creative Problem Solving. Journal of Creative Behavior, 35(1), 1-23.
Mumford, M. D., & Others, A. (1997). Thinking Creatively at Work: Organization
Influences on Creative Problem Solving. Journal of Creative Behavior,
31(1), 7-17.
Mumford, M. D., Scott, G. M., Gaddis, B., & Strange, J. M. (2002). Leading
creative people: Orchestrating expertise and relationships., Leadership
Quarterly (Vol. 13, pp. 705): Elsevier Science Publishing Company, Inc.
257
Munoz-Doyague, M. F., Gonzalez-Alvarez, N., & Nieto, M. (2008). An
Examination of Individual Factors and Employees’ Creativity: The Case
of Spain. Creativity Research Journal, 20(1), 21-33.
Oldham, G. R., & Cummings, A. (1996). Employee creativity: Personal and
contextual factors at work. Academy of Management Journal, 39(3),
607.
Park, C. W., Sung Youl, J., & Deborah, J. M. (2000). Choosing what I want
versus rejecting what I do not want: An application of decision framing
to product option choice decisions. JMR, Journal of Marketing
Research, 37(2), 187.
Pascale, R. T., & Sternin, J. (2005). Your company's secret change agents.
Harvard Business Review, 83(5), 72-81.
Patton, M. Q. (1990). In Qualitative evaluation and research methods (pp.
169-186). London: SAGE Publications.
Pech, R. J. (2001). Reflections: Termites, group behaviour, and the loss of
innovation: Conformity rules! Journal of Managerial Psychology,
16(7/8), 559.
Pinchot, G., & Callahan, G. (2000). Calming the corporate immune system.
Software Development, 64(January), 62-64.
Plsek, P. E. (1997). In Creativity, Innovation and Quality (pp. 28-30). Milwaukee,
WI: ASQ Quality Press.
Polland, M. (1994). The Evaluation of Creative Behaviors.
Proctor. (1999). Creative Problem Solving for Managers. In (pp. 7-15).
Public Transport Users Association. (2007, 18/10/07).
http://www.ptua.org.au/myths/popular.shtml. Retrieved 21/01/08,
2008, from http://www.ptua.org.au/myths/popular.shtml
258
Rappaport, A. (1996). How to Get Hot. Psychology Today, 29(1), 29.
Redmond, M. R., Mumford, M. D., & Teach, R. (1993). Putting Creativity to
Work: Effects of Leader Behavior on Subordinate Creativity.,
Organizational Behavior & Human Decision Processes (Vol. 55, pp. 120):
Academic Press Inc.
Reiter-Palmon, R., & Illies, J. J. (2004). Leadership and creativity: Understanding
leadership from a creative problem-solving perspective., Leadership
Quarterly (Vol. 15, pp. 55): Elsevier Science Publishing Company, Inc.
Rickards, T., M. A. Runco, et al. (2008). Mood Disorders. In The Routledge
Companion to Creativity (pp.274-275). Taylor and Francis.
Rieple, A. (2004). Understanding Why Your New Design Ideas Get Blocked.
Design Management Review, 15(1), 36.
Riley, M. (1993). Organization and creativity: A replication of the KAI test.
Journal of Managerial Psychology, 8(6), i.
Robben, M. A. (1998). A study of the determinants of individual innovative
behavior in a high-technology product development organization.
Dissertation Abstracts International Section A: Humanities and Social
Sciences(4), 1252.
Ruscio, J., Whitney, D. M., & Amabile, T. M. (1998). Looking inside the fishbowl
of creativity: Verbal and behavioral predictors of creative
performance. Creativity Research Journal(3), 243-263.
Sadler-Smith, E. (2004). The intuitive executive: Understanding and applying
'gut feel' in decision-making. Academy of Management Executive,
18(4), 76-.

259
Sand, B. V. (2003). Toward a definition of creativity: Construct validation of the
cognitive components of creativity. Dissertation Abstracts International
Section A: Humanities and Social Sciences(10), 3476.
Schepers, P., & Berg, P. T. v. d. (2007). Social Factors of Work-Environment
Creativity. Journal of Business and Psychology, 21(3), 407.
Schumpeter, J. A. (1983). The Theory of Economic Development. London:
Transaction Publishers.
Scratchley, & Hakstian. (2000). The Measurement and Prediction of
Managerial Creativity. Creativity Research Journal, 13(4), 367-384.
Shafir, E. (1993). Choosing Versus Rejecting: Why Some Options are Both Better
and Worse Than Others. Memory and Cognition, 21, 546-556.
Shaw, E., O'Loughlin, A., & McFadzean, E. (2005). Corporate entrepreneurship
and innovation part 2: a role- and process-based approach. European
Journal of Innovation Management, 8(4), 393.
Sheehan, P. (2005). Generation Y: thriving (and surviving) with Generation Y at
work. In (pp. 72-77).
Shukla, A., & Sinha, A. K. (1993). Self esteem: A requisite for creativity.
Abhigyan, 53-60.
Simonton, D. (1993). Genius and chance: A Darwinian perspective. In J.
Brockman (Ed.), Creativity. (pp. 176-201): Simon & Schuster.
Simonton, D. (1999). Origins of Creativity: Darwinian perspectives on creativity.
In (pp. 47-49). New York: Oxford.
Simonton, D. (2003). Creativity as variation and selection: Some critical
constraints. In M. A. Runco (Ed.), Critical creative processes. (pp. 3-18):
Hampton Press, Inc.

260
Sosik, J. J., Avolio, B. J., & Kahai, S. S. (1997). Effects of leadership style and
anonymity on group potency and effectiveness in a group decision
support system environment. Journal of Applied Psychology, 82(1), 89.
Sternberg, R. J. (1990) Metaphors of mind: Conceptions of the nature of
intelligence. NY: Cambridge University Press.
Sternberg, R. J. (2006). The Nature of Creativity. Creativity Research Journal,
18(1), 87-98.
Sternin, J., & Choo, R. (2000). The Power of Positive Deviancy. Harvard Business
Review, 78(1), 14-15.
Stevens G A, Burley J, & Devine R. (1998). Profits & Personalities: Relationships
Between Profits from New Product Development and Analysts'
Personalities. Paper presented at the 1998 Research Conference at the
Annual International Conference of the Product Development and
Management Association
Stibel J. (2005). Increasing productivity through framing effects for interactive
consumer choice. Cognition, Technology & Work, 7(1), 63-68.
Stinchcombe, A. L. (1965). Social Structures and Organizations. In J. G. March
(Ed.), Handbook of Organizations (pp. 148). Chicago: Rand McNally.
Sutton, R. I. (2001). The weird rules of creativity. Harvard Business Review, 79(8),
94.
Taggar, S. (2002). Individual Creativity and Group Ability to Utilize Individual
Creative Resources: A Multilevel Model. Academy of Management
Journal, 45(2), p315-330.
Taylor, W. G. (1989). The Kirton Adaption-Innovation Inventory: Should the sub-
scales be orthogonal? Personality and Individual Differences(9), 921-
929.

261
Tetenbaum, T., & Houtz, J. (1978). The role of affective traits in the creative
and problem-solving performance of gifted urban children. Psychology
in the Schools(1), 27-32.
Tierney, P., & Farmer, S. M. (2004). The Pygmalion Process and Employee
Creativity. Journal of Management, 30(3), 413.
Tierney, P., Farmer, S. M., & Graen, G. B. (1999). An examination of leadership
and employee creativity: The relevance of traits and relationships.
Personnel Psychology, 52(3), 591.
Torrance, E. P. (1962). Guiding creative talent. . Englewood Cliffs, N.J.:
Prentice-Hall.
Torrance, E. P., & Haensly, P. (2003). Assessment of Creativity in Children and
Adolescents. In C. R. Reynolds & R. W. Kamphaus (Eds.), Handbook of
psychological and educational assessment of children : intelligence,
aptitude, and achievement (pp. 584-607). New York ; London: Guilford
Press.
Tversky, A., & Kahneman, D. (1981). The Framing of Decisions and the
Psychology of Choice. Science, 211(30 January), 435-458.
Välikangas, L., & Jett, Q. (2006). The golden spur: innovation independence.
Strategy & Leadership, 34(5), 41.
Vallerand, R. J. (2000). Deci and Ryan's Self-Determination Theory: A View
from the Hierarchical Model of Intrinsic and Extrinsic Motivation
Psychological Inquiry, 11(4), 312-318.
Van Den Broeck, H., Vanderhetden, K., & Cools, E. (2003). Linking cognitive
styles and values. Vlerick Leuven Gent Working Paper Series 2003/09
Retrieved 26/12/05, 2005, from
http://www.vlerick.be/research/workingpapers/vlgms-wp-2003-09.pdf

262
Vosburg, S. K. (1998). The effects of mood on creative problem-solving.
Unpublished C685394, Universitetet i Bergen (Norway), Norway.
Vroom, V. H. (1964). Work and Motivation. New York: John Wiley and Sons.
Wang, K. Y., & Casimir, G. (2007). How Attitudes of Leaders May Enhance
Organizational Creativity: Evidence from a Chinese Study. Creativity &
Innovation Management, 16(3), 229-238.
Wang;, C.-W., & Horng;, R.-Y. (2002). The effects of creative problem solving
training on creativity, cognitive type and R&D performance. R & D
Management, 32(1), 35-45.
Wells, D., Donnell, A. J., Thomas, A., Mills, M. S., & Miller, M. (2006). Creative
deviance: a study of the relationship between creative behavior and
the social construct of deviance. College Student Journal, 40(1), 74.
Williams, S. D. (2004). Personality, attitude, and leader influences on divergent
thinking and creativity in organizations. European Journal of Innovation
Management, 7(3), 187.
Wilson D K, Kaplan R M, & Schneiderman L J. (1987). Framing of decisions and
selections of alternatives in health care. Social Behaviour, 2, 51–59.
Woodman, R. W., Sawyer, J. E., & Griffin, R. W. (1993). Toward a Theory of
Organizational Creativity. Academy of Management Review, 18(2),
293.
Wunderley, L. J., Reddy, W. B., & Dember, W. N. (1998). Optimism and
Pessimism in Business Leaders. Journal of Applied Social Psychology
Journal of Applied Social Psychology J1 - Journal of Applied Social
Psychology, 28(9), 751-760.

263
Xu, F., & Rickards, T. (2007). Creative Management: A Predicted Development
from Research into Creativity and Management. Creativity &
Innovation Management, 16(3), 216-228.


![Following Leads Using Faculty Focus groups to Spark Creativity and Enhance Collaboration Michael Stoepel, AUP Josiah Drewry, AUC []](https://static.fdocuments.in/doc/165x107/56649cef5503460f949be539/following-leads-using-faculty-focus-groups-to-spark-creativity-and-enhance.jpg)