
UNDERSTANDING GREAT LAKES WATER LEVEL … Info/Committee Reports/Apr 16... · WATER LEVEL...
18
UNDERSTANDING GREAT LAKES WATER LEVEL FLUCTUATIONS AND CURRENT CONDITIONS APRIL 2013 John Allis Chief, Great Lakes Hydraulics and Hydrology Office (313) 226-2137 [email protected] Keith Kompoltowicz Chief, Watershed Hydrology Branch (313) 226-6442 [email protected] Eric Tauriainen Chief, Hydraulic Engineering Branch (313) 226-4886 [email protected]
Transcript of UNDERSTANDING GREAT LAKES WATER LEVEL … Info/Committee Reports/Apr 16... · WATER LEVEL...
UNDERSTANDING GREAT LAKES WATER LEVEL FLUCTUATIONS
AND CURRENT CONDITIONS
APRIL 2013
John Allis Chief, Great Lakes Hydraulics
and Hydrology Office (313) 226-2137 [email protected]
Keith Kompoltowicz Chief, Watershed Hydrology Branch (313) 226-6442 [email protected] Eric Tauriainen Chief, Hydraulic Engineering Branch (313) 226-4886 [email protected]

Table of Contents Introduction………………………………………………………………………………….....2 Understanding Great Lakes Water Level Fluctuations …………………..…………….2 Descriptions of the major components causing Great Lakes water levels to rise and fall Current Great Lakes Water Level Conditions…………………………………………….4 A lake by lake listing of current and forecasted water levels and the contributions of hydrologic parameters Appendix A: Figures Figure 1 – The Great Lakes Basin ………………………………………………………….6 Map showing the outline of the Great Lakes drainage basin, noting that 1/3 of this area is the actual lake surface itself Figure 2 – Great Lakes System Profile ……………………………………………………7 Figure showing the step like profile of the system, falling about 600 feet from Lake Superior to the Atlantic Ocean Figure 3 – Great Lakes Water Levels ……………...………………………………………8 Hydrographs showing the monthly lake level fluctuations for all lakes over the period 1918-2012, from record lows to record highs Figure 4 – Monthly Bulletin of Water Levels for the Great Lakes...………………......9 The official 6 month forecast for the Great Lakes Figure 5 – Current Precipitation Values………………………………………………….10 Graphic for each lake showing the last 3 years of precipitation values compared to their long-term average Figure 6 – Current Evaporation Values ………………………………………………….11 Graphic for each lake showing the last 4 years of evaporation values, expressed as a positive or negative difference from their long-term average Figure 7 – Hydrologic Components ..….…………………………………………………12 A graphical representation of the magnitude of the contribution of runoff, precipitation, outflow and evaporation to the water supply for each lake Figure 8 – Current Lake Levels ……………………………………………………………13 Appendix B: Water Level Talking Points..……………………………………………….14 Appendix C: Water Level Summary …………………….………………………………..16 Narrative describing recent water level conditions Appendix D: Useful Great Lakes Web Addresses ……………………………………..17 A listing of web sites containing a variety of Great Lakes information

2
Introduction This document is provided as a means to help people become more informed on the science behind the fluctuations in Great Lakes water levels. Conditions have been drier than normal in recent years, leading to below average water levels on all of the Great Lakes. Lake Michigan-Huron set a new all-time record low water level in January 2013. Water level fluctuations are primarily driven by the natural hydrologic cycle with only minor influences from humans. Information is presented on the Great Lakes basin in general, the driving forces behind why the levels rise and fall, and more detailed data on recent precipitation, evaporation and river flows that play a key role in current water level conditions.
Understanding Great Lakes Water Level Fluctuations
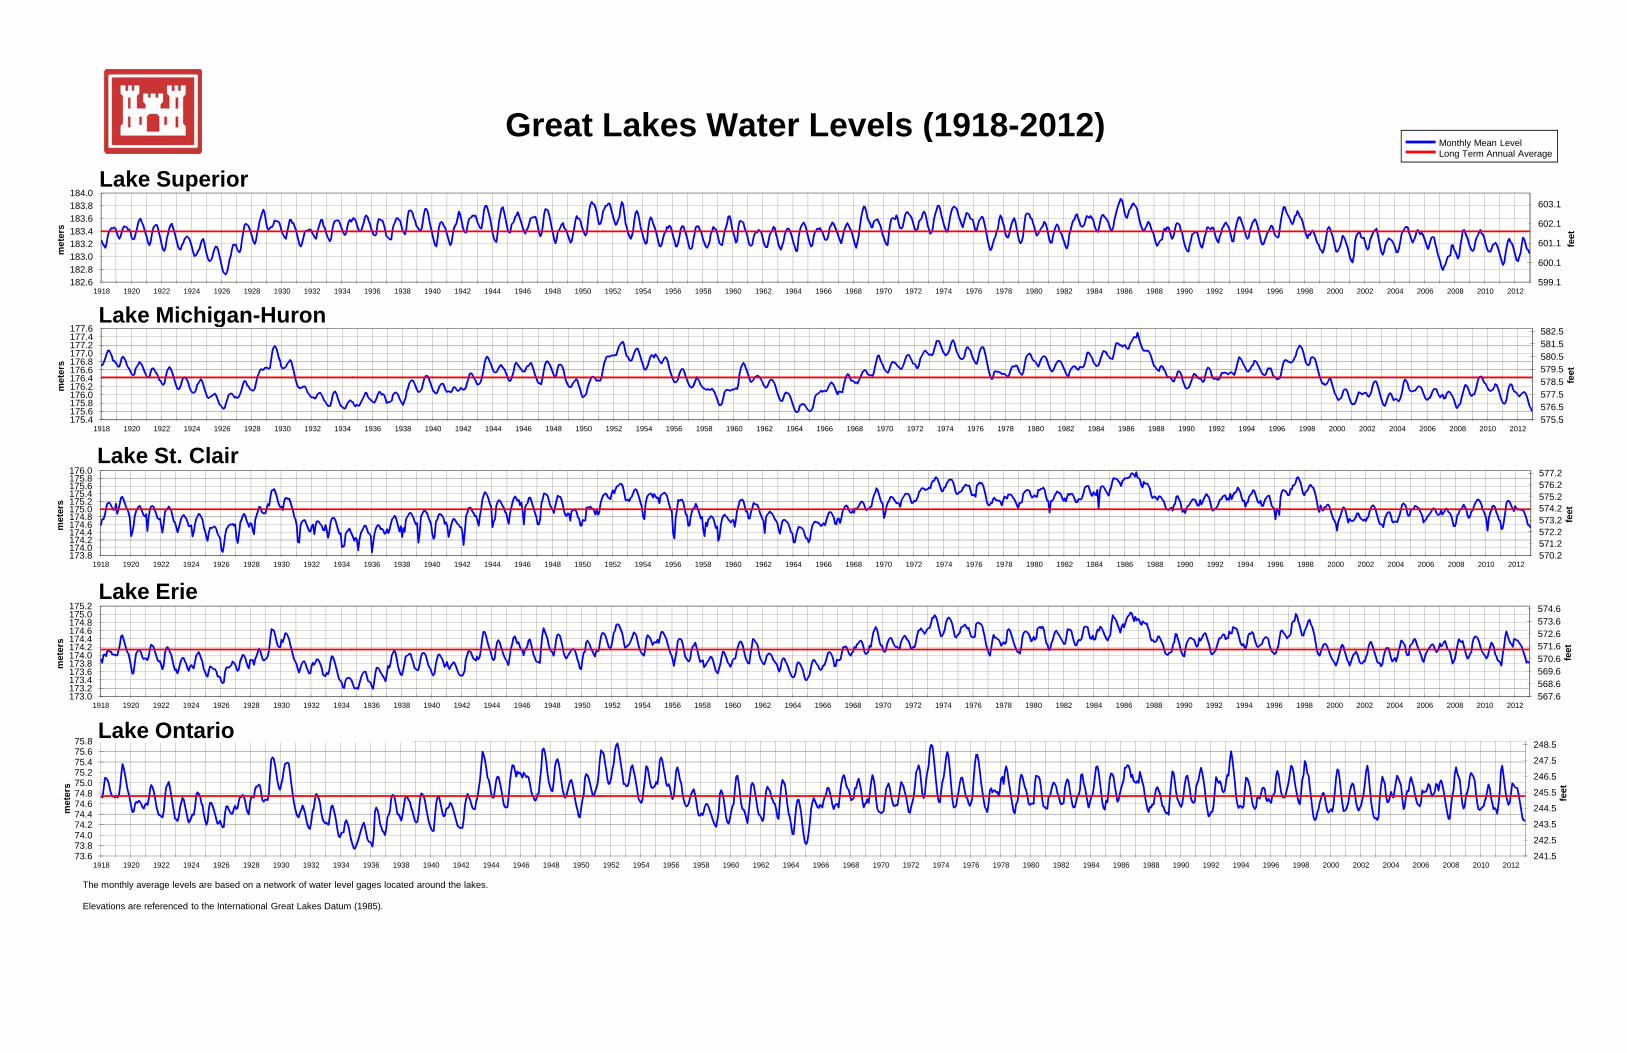
The Great Lakes and St. Lawrence River are a dynamic system. The Great Lakes basin covers more than 94,000 square miles of water and more than twice as much land. It includes part or all of eight U.S. states and two Canadian provinces as shown in Figure 1. The profile of the system is depicted in Figure 2 and shows a series of steps leading from Lake Superior at the headwaters down to the Atlantic Ocean. The St. Marys River flows from Lake Superior to Lake Huron. Lakes Michigan and Huron are connected by the broad and deep Straits of Mackinac and are considered to be one lake hydraulically, with levels rising and falling together. The St. Clair and Detroit rivers, with Lake St. Clair in between, connect Lake Huron with Lake Erie. The Niagara River then links Lake Erie with Lake Ontario, including the dramatic drop over Niagara Falls. The man-made Welland Canal also links Lakes Erie and Ontario, providing a detour around the Falls. From Lake Ontario, water flows into the St. Lawrence River, which converges with the Ottawa River and flows on to the Atlantic Ocean. Since the retreat of the glaciers, water levels have undergone dramatic fluctuations, as much as hundreds of feet. Figure 3 shows the water level ranges of the Great Lakes over the last 95 years, based on monthly lake-wide averages for each lake. The difference between the amount of water coming into a lake and the amount going out is the determining factor in whether the water level will rise, fall or remain stable. Moisture is carried into the Great Lakes basin by continental air masses originating in the northern Pacific Ocean, tropical systems originating in the Gulf of Mexico, or Arctic systems originating in the far north. As these weather systems move through, they deposit moisture in the form of rain, snow, hail or sleet. Water enters the lakes through precipitation on the lake, runoff from surrounding land, groundwater inflow and inflow from upstream lakes. Figure 5 shows the precipitation values for each lake, for the last few years compared to average. Water leaves the lakes through evaporation from the water surfaces, groundwater outflow, consumptive use, diversions and outflows to downstream lakes or rivers. Evaporation is a major factor when warm lake surfaces come in contact with cool, dry air. Figure 6 shows the evaporation values for each lake, for the last few years compared to average. Water levels fluctuate on a short-term basis, usually due to winds and changes in barometric pressure lasting from a couple of hours to several days. The lakes also fluctuate on a seasonal cycle each year. Levels decline to their lowest level in the winter months because more water leaves the lake through evaporation (greatest in the fall and early winter), and precipitation falling as snow can accumulate on the land during winter. As the snow melts in the spring,
3
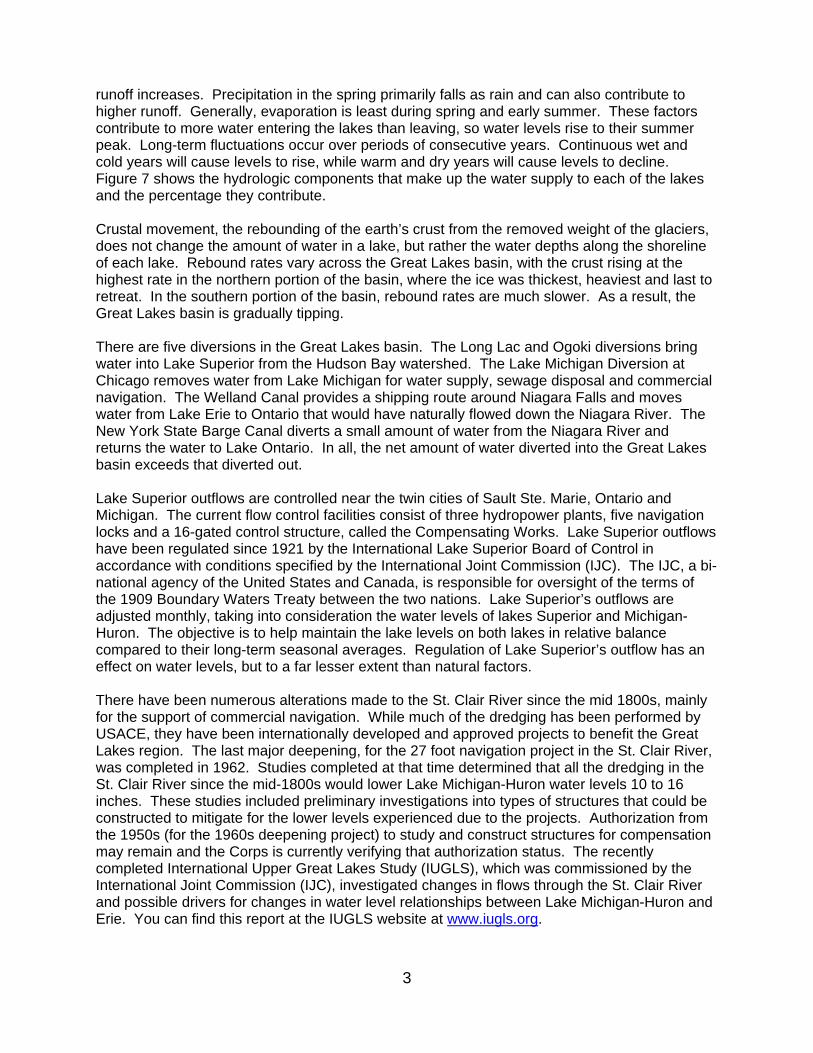
runoff increases. Precipitation in the spring primarily falls as rain and can also contribute to higher runoff. Generally, evaporation is least during spring and early summer. These factors contribute to more water entering the lakes than leaving, so water levels rise to their summer peak. Long-term fluctuations occur over periods of consecutive years. Continuous wet and cold years will cause levels to rise, while warm and dry years will cause levels to decline. Figure 7 shows the hydrologic components that make up the water supply to each of the lakes and the percentage they contribute. Crustal movement, the rebounding of the earth’s crust from the removed weight of the glaciers, does not change the amount of water in a lake, but rather the water depths along the shoreline of each lake. Rebound rates vary across the Great Lakes basin, with the crust rising at the highest rate in the northern portion of the basin, where the ice was thickest, heaviest and last to retreat. In the southern portion of the basin, rebound rates are much slower. As a result, the Great Lakes basin is gradually tipping. There are five diversions in the Great Lakes basin. The Long Lac and Ogoki diversions bring water into Lake Superior from the Hudson Bay watershed. The Lake Michigan Diversion at Chicago removes water from Lake Michigan for water supply, sewage disposal and commercial navigation. The Welland Canal provides a shipping route around Niagara Falls and moves water from Lake Erie to Ontario that would have naturally flowed down the Niagara River. The New York State Barge Canal diverts a small amount of water from the Niagara River and returns the water to Lake Ontario. In all, the net amount of water diverted into the Great Lakes basin exceeds that diverted out. Lake Superior outflows are controlled near the twin cities of Sault Ste. Marie, Ontario and Michigan. The current flow control facilities consist of three hydropower plants, five navigation locks and a 16-gated control structure, called the Compensating Works. Lake Superior outflows have been regulated since 1921 by the International Lake Superior Board of Control in accordance with conditions specified by the International Joint Commission (IJC). The IJC, a bi-national agency of the United States and Canada, is responsible for oversight of the terms of the 1909 Boundary Waters Treaty between the two nations. Lake Superior’s outflows are adjusted monthly, taking into consideration the water levels of lakes Superior and Michigan-Huron. The objective is to help maintain the lake levels on both lakes in relative balance compared to their long-term seasonal averages. Regulation of Lake Superior’s outflow has an effect on water levels, but to a far lesser extent than natural factors. There have been numerous alterations made to the St. Clair River since the mid 1800s, mainly for the support of commercial navigation. While much of the dredging has been performed by USACE, they have been internationally developed and approved projects to benefit the Great Lakes region. The last major deepening, for the 27 foot navigation project in the St. Clair River, was completed in 1962. Studies completed at that time determined that all the dredging in the St. Clair River since the mid-1800s would lower Lake Michigan-Huron water levels 10 to 16 inches. These studies included preliminary investigations into types of structures that could be constructed to mitigate for the lower levels experienced due to the projects. Authorization from the 1950s (for the 1960s deepening project) to study and construct structures for compensation may remain and the Corps is currently verifying that authorization status. The recently completed International Upper Great Lakes Study (IUGLS), which was commissioned by the International Joint Commission (IJC), investigated changes in flows through the St. Clair River and possible drivers for changes in water level relationships between Lake Michigan-Huron and Erie. You can find this report at the IUGLS website at www.iugls.org.

4
Current Great Lakes Water Level Conditions Current Great Lakes water levels for 2012 and 2013, as well as forecasted levels to September 2013 are shown in Figures 4 and 8. Note that currently all of the Great Lakes are below last year’s levels and their long-term averages. In January 2013, Lake Michigan-Huron’s water level of 576.02 ft was the lowest water level for any month for the entire period of record, which dates back to 1918. The previous all-time record low was set in March 1964 at 576.05 ft. Lakes Superior, St. Clair, Erie, and Ontario are not forecasted to set record low water levels. Figure 5 shows the monthly precipitation values since January 2010 as compared to their monthly averages, while Figure 6 shows the monthly evaporation since January 2009, in terms of their difference above or below average. This information provides insight into the differing hydrologic conditions experienced across the Great Lakes basin in the last few years. Lake Superior’s monthly average water level for March 2013 (600.10 ft) was seven inches above the lowest recorded level of March (599.54 ft) which was set in 1926. The current forecast shows the water level of Lake Superior remaining well below its long-term average but above its record low water levels during the next six months. Since April 1998 Lake Superior has been below its long-term average (1918-2012) and is currently in the longest period of below average water levels in recorded history. Natural factors contributing to recent low water levels on Lake Superior include:
Evaporation in 2012 was 14 inches greater than average Evaporation in 2011 was 8 inches more than average Evaporation in 2010 was 5 inches above average Precipitation in 2012 was 3 inches less than average Precipitation in 2011 was 3 inches less than average Precipitation in 2010 was nearly 2 inches below average
Lake Michigan-Huron has been below long-term average water levels since January 1999 and is currently in its longest period of below average water levels in recorded history. The January 2013 level of 576.02 ft broke the previous all time record low water level for any month. Since then, the water level has risen slightly and the March 2013 water level was two inches above the lowest recorded level of March (576.05 ft) which was set in 1964. The most probable forecast for the next six months shows Michigan-Huron remaining 2 to 4 inches ABOVE record lows through September. Natural factors contributing to recent low levels on Lake Michigan-Huron include:
Evaporation in 2012 was 12 inches greater than average Evaporation in 2011 was near average Evaporation in 2010 was 5 inches above average Precipitation in 2012 was 4 inches below average Precipitation in 2011 was 3 inches above average Precipitation in 2010 was 1 inch below average

5
Lake St. Clair began 2012 with above average water levels but has since fallen to below average levels. It is currently 10 inches below average and 14 inches below last year’s levels. The most probable forecast for the next six months shows the lake remaining below average and last year’s levels, but above its record lows. Significant natural factors include:
Evaporation in 2012 was 3 inches greater than average Evaporation in 2011 was 6 inches below average Evaporation in 2010 was 9 inches above average Precipitation in 2012 was 2 inches less than average Precipitation in 2011 was 10 inches greater than average Precipitation in 2010 was near average
Lake Erie was above, below and at average water levels in 2012. It is currently 6 inches below average and 17 inches below last year’s levels. Lake Erie had no seasonal rise during 2012, which is the first such occurrence in the period of record. The most probable forecast for the next six months shows the lake will remain below average and last year’s level, but well above its record low levels. Significant natural factors include:
Evaporation in 2012 was 13 inches greater than average Evaporation in 2011 was 3 inches below average Evaporation in 2010 was 6 inches above average Precipitation in 2012 was 4 inches less than average Precipitation in 2011 was 16 inches above average Precipitation in 2010 was near average
Lake Ontario was also above, below and at average water levels in 2012. It is currently 4 inches below average and 15 inches below last year’s levels. The most probable forecast for the next six months shows the lake will return to last year’s levels in June and also return to its long-term average in July 2013. Lake Ontario is forecasted to remain more than 2 feet above its record low levels. Significant natural factors include:
Evaporation in 2012 was 11 inches greater than average Evaporation in 2011 was 1 inch more than average Evaporation in 2010 was 5 inches above average Precipitation in 2012 was 5 inches less than average Precipitation in 2011 was 4 inches above average Precipitation in 2010 was 1 inch below average
Forecasted water levels are highly dependent on the supply of water the lakes are expected to receive over the coming months. The U.S. Army Corps of Engineers, in coordination with Environment Canada, will continue to monitor basin conditions and provide updated information on our website at http://www.lre.usace.army.mil/glhh. Additional web links of interest are listed in Appendix D.

Hudson Bay
LakeOntario
Lake St. Clair
St. Clair River
DetroitDetroit River
St. Marys River
Niagara River
Minnesota
WisconsinMichigan
Illinois
Indiana Ohio PENNSYLVANIA
Quebec
Ontario
Diversion Dam
Control Dam
Long Lake
LakeNipigon
Thunder Bay
Diversion Dam
AguasabonRiver
Albany
River
DuluthKeweenawPeninsula Canada
UnitedStates
Sault Ste. Marie
Sault Ste. MarieLake Superior Control Structure
StraitsOf Mackinac
Geo
rgia
nBay
Green Bay
Gre
enBay
Chicago Sanitary& Ship Canal
Illinois Waterway
Bay City
Toledo
Cleveland
Toronto
Buffalo
Oswego
Welland CanalNiagara Falls
Cape Vincent
Ottawa River
OttawaLAKE ST. LOUIS
Great Lakes - St. Lawrence River System
Ogoki Project
Long Lake ProjectControl Dam
Nipigon River
Kenogami River
Ogoki River
Albany
Riv
er
Bas in
Lake SuperiorL a
k eM
i ch
aig
n
Chicago
Great
Drain
age
LakeH
uro
n
LakeErie
Missi
Ri
ssippi
aive
nr B s
Montreal
St. Lawrence River
Lakes
Bas i
n
Milwaukee
Pennsylvania
New York
Rochester
Kingston
St. Lawrence RiverControl structure
Cornwall
Massena
14,000 miles of shoreline95,000 square miles of water200,000 square miles of land8 States & 2 Provinces
The Great Lakes Basin

599.1
600.1
601.1
602.1
603.1
182.6182.8183.0183.2183.4183.6183.8184.0
1918 1920 1922 1924 1926 1928 1930 1932 1934 1936 1938 1940 1942 1944 1946 1948 1950 1952 1954 1956 1958 1960 1962 1964 1966 1968 1970 1972 1974 1976 1978 1980 1982 1984 1986 1988 1990 1992 1994 1996 1998 2000 2002 2004 2006 2008 2010 2012
feet
met
ers
1 6Lake Michigan-Huron
Lake Superior
Great Lakes Water Levels (1918-2012)Monthly Mean LevelLong Term Annual Average
575.5576.5577.5578.5579.5580.5581.5582.5
175.4175.6175.8176.0176.2176.4176.6176.8177.0177.2177.4177.6
1918 1920 1922 1924 1926 1928 1930 1932 1934 1936 1938 1940 1942 1944 1946 1948 1950 1952 1954 1956 1958 1960 1962 1964 1966 1968 1970 1972 1974 1976 1978 1980 1982 1984 1986 1988 1990 1992 1994 1996 1998 2000 2002 2004 2006 2008 2010 2012
feet
met
ers
570.2571.2572.2573.2574.2575.2576.2577.2
173.8174.0174.2174.4174.6174.8175.0175.2175.4175.6175.8176.0
1918 1920 1922 1924 1926 1928 1930 1932 1934 1936 1938 1940 1942 1944 1946 1948 1950 1952 1954 1956 1958 1960 1962 1964 1966 1968 1970 1972 1974 1976 1978 1980 1982 1984 1986 1988 1990 1992 1994 1996 1998 2000 2002 2004 2006 2008 2010 2012
feet
met
ers
Lake Michigan-Huron
Lake St. Clair
244.5
245.5
246.5
247.5
248.5
74 474.674.875.075.275.475.675.8
met
ers
feet
570.2571.2
173.8174.0
1918 1920 1922 1924 1926 1928 1930 1932 1934 1936 1938 1940 1942 1944 1946 1948 1950 1952 1954 1956 1958 1960 1962 1964 1966 1968 1970 1972 1974 1976 1978 1980 1982 1984 1986 1988 1990 1992 1994 1996 1998 2000 2002 2004 2006 2008 2010 2012
567.6568.6569.6570.6571.6572.6573.6574.6
173.0173.2173.4173.6173.8174.0174.2174.4174.6174.8175.0175.2
1918 1920 1922 1924 1926 1928 1930 1932 1934 1936 1938 1940 1942 1944 1946 1948 1950 1952 1954 1956 1958 1960 1962 1964 1966 1968 1970 1972 1974 1976 1978 1980 1982 1984 1986 1988 1990 1992 1994 1996 1998 2000 2002 2004 2006 2008 2010 2012
feet
met
ers
Lake Erie
Lake Ontario
241.5
242.5
243.5
244.5
245.5
73.673.874.074.274.474.674.8
1918 1920 1922 1924 1926 1928 1930 1932 1934 1936 1938 1940 1942 1944 1946 1948 1950 1952 1954 1956 1958 1960 1962 1964 1966 1968 1970 1972 1974 1976 1978 1980 1982 1984 1986 1988 1990 1992 1994 1996 1998 2000 2002 2004 2006 2008 2010 2012
met
er fee
The monthly average levels are based on a network of water level gages located around the lakes.
Elevations are referenced to the International Great Lakes Datum (1985).

Ft.
-1
0
+ 1
+ 2
+ 3
+ 4
+ 5
M.
-0.3
0
+ 0.3
+ 0.6
+ 0.9
+ 1.2
+ 1.5
2011
APR
1973
MAY
1973
JUN
1952
JUL
1947
AUG
1947
SEP
1947
OCT
1945
NOV
1945
DEC
1945
2012
JAN
1946
FEB
1952
MAR
1952
APR
1973
1935
MAY
1973
1935
JUN
1952
1935
JUL
1947
1934
AUG
1947
1934
SEP
1947
1934
OCT
1945
1934
NOV
1945
1934
DEC
1945
1934
2013
JAN
1946
1935
FEB
1952
1936
MAR
1952
1935
APR
1973
1935
MAY
1973
1935
JUN
1952
1935
JUL
1947
1934
AUG
1947
1934
SEP
1947
1934
CHART DATUM 243.3 FEET (74.2 METERS)
Ft.
-1
0
+ 1
+ 2
+ 3
+ 4
+ 5
+ 6
M.
-0.3
0
+ 0.3
+ 0.6
+ 0.9
+ 1.2
+ 1.5
+ 1.8
2011
APR
1985
MAY
1986
JUN
1986
JUL
1986
AUG
1986
SEP
1986
OCT
1986
NOV
1986
DEC
1986
2012
JAN
1987
FEB
1987
MAR
1986
APR
1985
1934
MAY
1986
1934
JUN
1986
1934
JUL
1986
1934
AUG
1986
1934
SEP
1986
1934
OCT
1986
1934
NOV
1986
1934
DEC
1986
1934
2013
JAN
1987
1935
FEB
1987
1936
MAR
1986
1934
APR
1985
1934
MAY
1986
1934
JUN
1986
1934
JUL
1986
1934
AUG
1986
1934
SEP
1986
1934CHART DATUM 569.2 FEET (173.5 METERS)
Ft.
-1
0
+ 1
+ 2
+ 3
+ 4
+ 5
M.
-0.3
0
+ 0.3
+ 0.6
+ 0.9
+ 1.2
+ 1.5
2011
APR
1986
MAY
1986
JUN
1986
JUL
1986
AUG
1986
SEP
1986
OCT
1986
NOV
1986
DEC
1986
2012
JAN
1986
FEB
1986
MAR
1986
APR
1986
1926
MAY
1986
1934
JUN
1986
1934
JUL
1986
1934
AUG
1986
1934
SEP
1986
1934
OCT
1986
1934
NOV
1986
1934
DEC
1986
1964
2013
JAN
1986
1936
FEB
1986
1926
MAR
1986
1934
APR
1986
1926
MAY
1986
1934
JUN
1986
1934
JUL
1986
1934
AUG
1986
1934
SEP
1986
1934CHART DATUM 572.3 FEET (174.4 METERS)
Ft.
-1
0
+ 1
+ 2
+ 3
+ 4
+ 5
M.
-0.3
0
+ 0.3
+ 0.6
+ 0.9
+ 1.2
+ 1.5
2011
APR
1986
MAY
1986
JUN
1986
JUL
1986
AUG
1986
SEP
1986
OCT
1986
NOV
1986
DEC
1986
2012
JAN
1987
FEB
1986
MAR
1986
APR
1986
1964
MAY
1986
1964
JUN
1986
1964
JUL
1986
1964
AUG
1986
1964
SEP
1986
1964
OCT
1986
1964
NOV
1986
1964
DEC
1986
2012
2013
JAN
1987
1965
FEB
1986
1964
MAR
1986
1964
APR
1986
1964
MAY
1986
1964
JUN
1986
1964
JUL
1986
1964
AUG
1986
1964
SEP
1986
1964
CHART DATUM 577.5 FEET (176.0 METERS)
Ft.
-1
0
+ 1
+ 2
M.
-0.3
0
+ 0.3
+ 0.6
2011
APR
1986
MAY
1986
JUN
1986
JUL
1950
AUG
1952
SEP
1985
OCT
1985
NOV
1985
DEC
1985
2012
JAN
1986
FEB
1986
MAR
1986
APR
1986
1926
MAY
1986
1926
JUN
1986
1926
JUL
1950
1926
AUG
1952
2007
SEP
1985
2007
OCT
1985
1925
NOV
1985
1925
DEC
1985
1925
2013
JAN
1986
1926
FEB
1986
1926
MAR
1986
1926
APR
1986
1926
MAY
1986
1926
JUN
1986
1926
JUL
1950
1926
AUG
1952
2007
SEP
1985
2007
CHART DATUM 601.1 FEET (183.2 METERS)
EL
EV
AT
IO
NS
R
EF
ER
EN
CE
D T
O T
HE
C
HA
RT
D
AT
UM
O
F E
AC
H R
ES
PE
CT
IV
E L
AK
E
Superior
600.10
182.91
600.16
182.93
602.40
183.61
1986
599.54
182.74
1926
601.15
183.23
Mich-Huron
576.21
175.63
577.43
176.00
581.10
177.12
1986
576.05
175.58
1964
578.41
176.30
St.Clair
572.97
174.64
574.11
174.99
576.77
175.80
1986
571.03
174.05
1934
573.82
174.90
Erie
570.60
173.92
572.05
174.36
573.75
174.88
1986
568.24
173.20
1934
571.10
174.07
Ontario
244.69
74.58
245.96
74.97
247.28
75.37
1952
242.59
73.94
1935
245.01
74.68
MARCH MEAN LAKE LEVELS
(IGLD 1985)
* 2013 Ft.
M.
2012 Ft.
M.
** MAX.
Ft.
M.
Yr.
** MIN.
Ft.
M.
Yr.
** AVG. Ft.
M.
* provisional
** Average, Maximum and Minimum for period 1918-2012
19851985
19731973
19361934
19261934
APRIL 2013
LAKE ONTARIO
LAKE ERIE
LAKE ST. CLAIR
LAKES MICHIGAN-HURON
LAKE SUPERIOR
LEGEND
LAKE LEVELS
RECORDED
PROJECTED
AVERAGE **
MAXIMUM **
MINIMUM **
US Army Corps
of Engineers
Detroit District
MONTHLY BULLETIN OF
LAKE LEVELS FOR THE
GREAT LAKES
Water levels for the previous year and the
current year to date are shown as a solid line
on the hydrographs. A projection for the next
six months is given as a dashed line. This
projection is based on the present condition
of the lake basin and anticipated future
weather. The shaded area shows a range of
possible levels over the next six months
dependent upon weather variations. Current
and projected levels (solid and dashed lines)
can be compared with the 1918-2012 average
levels (dotted line) and extreme levels
(shown as bars with their year of occurrence).
The legend below further identifies the
information on the hydrographs.
The levels on the hydrographs are shown in
both feet and meters above (+) or below (-)
Chart Datum. Chart Datum, also known as
Low Water Datum, is a reference plane on
each lake to which water depth and Federal
navigation improvement depths on navigation
charts are referred.
���
All elevations and plots shown in this bulletin
are referenced to International Great Lakes
Datum 1985 (IGLD 1985). IGLD 1985 has its
zero base at Rimouski, Quebec near the mouth
of the St. Lawrence River (approximate sea
level).

0.00
1.00
2.00
3.00
4.00
5.00
6.00
7.00Ja
n-1
0
Jan
-11
Jan
-12
Jan
-13
Pre
cip
(in)
Lake Superior Precipitation (2010-2013)
0.001.002.003.004.005.006.007.00
Jan
-10
Jan
-11
Jan
-12
Jan
-13
Pre
cip
(in
)
Lake Michigan-Huron Precipitation (2010-2013)
1.00
2.00
3.00
4.00
5.00
6.00
7.00
Pre
cip
(in
)
Lake St. Clair Precipitation (2010-2013)
1 00
2.00
3.00
4.00
5.00
6.00
7.00
8.00
Pre
cip
(in
)
Lake Erie Precipitation (2010-2013)
U.S. Army Corps of Engineers Detroit District 15-Apr-13 http://www.lre.usace.army.mil
0.00
1.00
2.00
Jan
-10
Jan
-11
Jan
-12
Jan
-13
Pre
0.00
1.00
2.00
3.00
Jan
-10
Jan
-11
Jan
-12
Jan
-13
Pr
0.00
1.00
2.00
3.00
4.00
5.00
6.00
7.00
Jan
-10
Jan
-11
Jan
-12
Jan
-13
Pre
cip
(in
)
Lake Ontario Precipitation (2010-2013)
Actual
Average

-80.00
-60.00
-40.00
-20.00
0.00
20.00
40.00
60.00
Jan-09 Jan-10 Jan-11 Jan-12 Jan-13
Dif
fere
nce
fro
m a
vera
ge,
mm
Month
Evaporation on Lake Superior
-60.00
-40.00
-20.00
0.00
20.00
40.00
60.00
Jan-09 Jan-10 Jan-11 Jan-12 Jan-13
Dif
fere
nce
fro
m a
vera
ge,
mm
Month
Evaporation on Lake Michigan-Huron
-40.00
-20.00
0.00
20.00
40.00
60.00
80.00
fere
nce
fro
m a
vera
ge,
mm
Evaporation on Lake St. Clair
40 00
-30.00
-20.00
-10.00
0.00
10.00
20.00
30.00
40.00
50.00
eren
ce f
rom
ave
rag
e, m
m
Evaporation on Lake Erie
U.S. Army Corps of Engineers Detroit District http://www.lre.usace.army.mil
15-Apr-13
-60.00
-40.00
-20.00
Jan-09 Jan-10 Jan-11 Jan-12 Jan-13
Dif
fere
nc
Month
-50.00
-40.00
-30.00
-20.00
Jan-09 Jan-10 Jan-11 Jan-12 Jan-13D
iffe
ren
ceMonth
-60.00
-40.00
-20.00
0.00
20.00
40.00
Jan-09 Jan-10 Jan-11 Jan-12 Jan-13
Dif
fere
nce
fro
m a
vera
ge,
mm
Month
Evaporation on Lake Ontario

CONSTANT LEVEL
LONG LAKE,OGOKIDIVERSIONS
LAKE SUPERIOR
LAKES MICH-HURONLAKE ERIE
LAKEONTARIO
74
50
51
CONSTANT LEVEL
LAKE SUPERIOROUTFLOW TOMICH-HURON
78
LAKE MICH-HURONOUTFLOW TO ERIE
187
25 26
109
90
87 CONSTANT LEVEL
205
CHICAGODIVERSION
3WELLAND CANAL
7
CONSTANTLEVEL
1934
205251
LAKE ERIEOUTFLOW TOONTARIO
OUTFLOWTO THE SEA
LAKEONTARIO
26
14
RUNOFF FROM LAKE
PRECIPITATION ON LAKE
OUTFLOW
EVAPORATION FROM LAKE
Hydrologic ComponentsFlow from upstream lakes, evaporation and precipitation influence lake levels. This graph illustrates the relative influence of each of those factors on the Great Lakes system. Values are based on a monthly average and are represented as thousand cubic feet per second. Note that the net amount of water diverted into the Great Lakes is greater than the amount diverted out. The Welland and NY State Barge canals are intra-basin diversions, meaning the diverted water does not leave the Great Lakes basin.
Superior57% in is precipitation39% in is runoff4% in from diversions_________________
40% out is evaporation60% out is outflow
Mich-Huron*39% in is precipitation32% in is runoff29% in is inflow__________________
31% out is evaporation68% out is outflow1% out thru Chi. Diversion
*Lakes Michigan and Huron are considered to be one lake, as they rise and fall together due to their union at the Straits of Mackinac.
Erie79% in is inflow11% in is precipitation10% in is runoff_________________
89% out is outflow11% out is evaporation
Ontario80% in is inflow13% in is runoff7% in is precipitation__________________
95% out is outflow5% out is evaporation
U.S. Army Corps of EngineersDetroit Districthttp://www.lre.usace.army.mil
5
NY STATE BARGE CANAL
1

-20.00
-15.00
-10.00
-5.00
0.00
5.00
10.00
15.00
20.00
Jan Feb Mar Apr May Jun Jul Aug Sep Oct Nov Dec
Dif
fere
nc
e f
rom
Da
tum
(in
ch
es
)Lake Superior
Chart Datum = 601.1 ft
-20.00
-15.00
-10.00
-5.00
0.00
5.00
10.00
15.00
20.00
25.00
30.00
Jan Feb Mar Apr May Jun Jul Aug Sep Oct Nov Dec
Dif
fere
nce
fro
m D
atu
m (
inch
es)
Lake Michigan-Huron
Chart datum = 577.5 ft
5 00
10.00
15.00
20.00
25.00
30.00
35.00
40.00
e f
rom
Da
tum
(in
ch
es
)
Lake St. Clair
15 00
20.00
25.00
30.00
35.00
40.00
45.00
e f
rom
Da
tum
(in
ch
es
)
Lake Erie
4/11/2013
U.S. Army Corps of Engineers Detroit District http://www.lre.usace.army.mil
-10.00
-5.00
0.00
5.00
10.00
15.00
Jan Feb Mar Apr May Jun Jul Aug Sep Oct Nov Dec
Dif
fere
nc
e f
rom
D
Chart datum = 572.3 ft
0.00
5.00
10.00
15.00
20.00
Jan Feb Mar Apr May Jun Jul Aug Sep Oct Nov Dec
Dif
fere
nc
e f
rom
D
Chart datum = 569.2 ft
0.00
5.00
10.00
15.00
20.00
25.00
30.00
35.00
40.00
45.00
50.00
Jan Feb Mar Apr May Jun Jul Aug Sep Oct Nov Dec
Dif
fere
nc
e f
rom
Da
tum
(in
ch
es
)
Lake Ontario
Chart datum = 243.3 ft
2009
Forecast
2008
Long Term Average
2013
2012
4/11/20134/11/2013

U.S. ARMY CORPS OF ENGINEERS – Detroit District 477 Michigan Ave Detroit, MI 48226
(AS OF: 3 April 2013) CURRENT 1) Lake Michigan-Huron’s January 2013 monthly mean water level set an all-time record low at 576.02 ft. This is
lower than any other month in the entire period of record, which goes back to 1918. The previous all-time record low was set in March 1964 at 576.05 ft. All elevations are referenced to the 1985 International Great Lakes Datum.
2) The most probable forecast from our most recent 6 month bulletin shows Lake Michigan-Huron remaining 2 to 4
inches ABOVE record lows through September. If dry conditions are experienced in the Michigan-Huron basin during the next few months, water levels could return to record lows.
3) Lakes Superior and Michigan-Huron have been below average for 14 straight years, the longest stretch in each of their recorded histories.
4) Current forecasts for Lakes Superior, St. Clair, Erie, and Ontario do not call for record low levels given any
scenario.
5) All the Great Lakes are below their long term averages and below their levels of a year ago. Lakes Superior, Michigan-Huron, St. Clair and Erie are expected to remain below their long term averages (LTA) for at least the next 6 months. Lake Ontario is expected to remain below LTA through June, and then return to LTA by July. Even under very wet scenarios, Michigan-Huron will remain below its LTA for a much longer period of time.
6) Lake Superior and Lake Michigan-Huron are currently below chart datum. Lake Superior is forecasted to remain
below chart datum through July, be at chart datum in August and rise 1 inch above chart datum in September. Lake Michigan-Huron is forecasted to remain 6 to 13 inches below chart datum over the next six months.
7) The lack of a solid snowpack during the winter of 2011 to 2012, coupled with the very hot and dry summer of
2012, are the biggest factors leading to the lower water levels this year. Snowmelt runoff and spring precipitation are the largest contributors to the seasonal rises on all the Great Lakes. Evaporation, a major component of water loss from the system, was also well above average during the heat wave of 2012 and continuing into the autumn and winter months.
8) In an average year, Lake Michigan-Huron’s seasonal rise is close to 12 inches. Because of dry conditions throughout the basin, the lake’s rise was only about 4 inches in 2012. Lakes St. Clair and Erie have average seasonal rises of about 15 inches, but in 2012 both lakes had no seasonal rise, but rather have been either steady or declining since January 2012. This was the first time in its recorded history that Lake Erie did not have a seasonal rise.
Great Lakes low water levels 2013
U.S. ARMY CORPS OF ENGINEERS – Detroit District 477 Michigan Ave Detroit, MI 48226
9) Conditions needed for the lakes to make gains with respect to their long term averages include heavy precipitation over multiple months, abundant runoff and reduced evaporation. Snow water equivalent values across northern Ontario, the U.P. of Michigan, northern/eastern Wisconsin and the Arrowhead of Minnesota are higher than those of 2012. The official spring outlook, issued by the National Weather Service shows the potential for above average precipitation in April, May and June. These conditions may lead to an average or above average seasonal rise for the Great Lakes.
10) There are no discernible long term cycles of water levels apparent over our period of record (1918-2012) for Great
Lakes water levels. While the historical record shows periods of high and low water, it is not possible to predict with any certainty when/if water levels would return to long term average levels. Lake levels could go higher or lower from their current levels in future years.

DETROIT DISTRICT U.S. ARMY CORPS OF ENGINEERS
CELRE‐HH‐W 477 MICHIGAN AVENUE
DETROIT, MICHIGAN 48226
MARCH 2013 GREAT LAKES WATER LEVEL SUMMARY
LAKE SUPERIOR The average water level of Lake Superior for the month of March was 600.10 feet, which was 2 inches lower than February’s level. The March level was 12 inches below chart datum, 13 inches below long‐term average (LTA), and 1 inch below the level of one year ago. Lake Superior continues its 14 year stretch of below LTA water levels, the longest period of below average levels in its recorded history dating back to 1918. Precipitation on the Lake Superior basin was below average in March and has been below average over the past 12 months. The water level of Lake Superior is forecasted to be 8 to 10 inches above record low water levels over the next six months. Superior is expected to be 11 inches below chart datum in April and then gradually rise to 1 inch above chart datum by September. The water levels are forecasted to range 5 inches below to 2 inches above last year’s levels and 11 to 14 inches below LTA through September. LAKE MICHIGAN‐HURON The March monthly mean water level for Lake Michigan‐Huron was 576.21 feet, rising 1 inch from February’s level. The March level was 15 inches below datum, 15 inches below its level of last year, and 26 inches below its LTA. Lake Michigan‐Huron also continues a 14 year stretch of below average levels, the longest in its period of record. Precipitation on the Lake Michigan‐Huron basin was below average in March and has been below average over the past 12 months. The water level of Lake Michigan‐Huron is forecasted to be 2 to 4 inches above record lows through September. Michigan‐Huron is projected to be 13 inches below chart datum in April and then gradually rise to 6 to 7 inches below chart datum in June through September. The water levels are forecasted to range 1 to 13 inches below last year’s levels and expected to remain 26 to 27 inches below LTA through September. LAKE ST. CLAIR Lake St. Clair’s monthly mean water level for March of 572.97 feet was 4 inches above February’s level. During March, Lake St. Clair was 14 inches below last year’s level and 10 inches below LTA. Lake St. Clair is forecasted to be 12 inches below its levels of a year ago in April and then gradually rise to 2 inches below last year’s level in September. The lake is expected to remain 14 to 15 inches below LTA over the next six months. LAKE ERIE Lake Erie’s average water level was 570.60 feet in March, which was 2 inches above February’s level. March’s water level was 17 inches below last year’s level and 6 inches below LTA. The Lake Erie basin received below average precipitation in March and has received below average precipitation over the last 12 months. Lake Erie is forecasted to be 13 inches below its levels of a year ago in April and then gradually rise to 2 inches below last year’s level in September. The water levels are expected to be 9 to 11 inches below LTA over the next six months. LAKE ONTARIO The monthly mean water level of Lake Ontario for March was 244.69 feet, which was 2 inches above February’s level. The February water level was 15 inches below last year’s level and 4 inches below LTA. Lake Ontario received below average precipitation in March and below average precipitation over the past 12 months. The lake is forecasted to be 7 inches below its level of a year ago in April and then gradually rise to 14 inches above last year’s level in September. Lake Ontario’s water level is projected to range from 6 inches below to 5 inches above LTA over the next six months.

Useful Great Lakes Web Addresses 2013 International Lake Superior Board of Control: http://www.ijc.org/conseil_board/superior_lake/en/superior_home_accueil.htm International Niagara River Board of Control http://www.ijc.org/conseil_board/niagara/en/niagara_home_accueil.htm International St. Lawrence River Board of Control: http://www.ijc.org/conseil_board/islrbc/en/main_accueil.htm International Joint Commission: http://www.ijc.org/ International Upper Great Lakes Study http://www.iugls.org/ USACE Detroit District Web Page: http://www.lre.usace.army.mil/ USACE Buffalo District Web Page: http://www.lrb.usace.army.mil/ Detroit District Water Level Bulletin: http://www.lre.usace.army.mil/Missions/GreatLakesInformation.aspx (Click on 'Forecasts' under "Water Levels") Canadian Water Level Bulletin: http://www.waterlevels.gc.ca/C&A/bulletin_e.html Great Lakes Information Network: http://www.great-lakes.net/ Canadian Hydrographic Service (CHS): http://www.waterlevels.gc.ca/C&A/gs_selection_e.html Great Lakes Nautical Charts (U.S.) http://www.noaa.gov/charts.html CHS - Nautical Charts (Canadian): http://www.chs-shc.gc.ca/pub/en/ National Oceanic and Atmospheric Administration Water levels: http://tidesandcurrents.noaa.gov/ CHS Hourly Water Levels: http://www.waterlevels.gc.ca/C&A/gs_selection_e.html Environment Canada Weather Radar - Ontario: http://weatheroffice.ec.gc.ca/radar/index_e.html?id=ont Environment Canada Marine Weather Forecasts: http://weatheroffice.ec.gc.ca/marine/region_08_e.html National Weather Service http://www.weather.gov Environment Canada 5-Day Weather Outlooks - Ontario: http://weatheroffice.ec.gc.ca/forecast/canada/on_e.html NOAA Climatological Outlooks http://www.cpc.ncep.noaa.gov/products/predictions/ Environment Canada Climatological Outlooks: http://weatheroffice.ec.gc.ca/saisons/index_e.html U.S. Real-Time Streamflows (U.S.G.S.) http://waterdata.usgs.gov/nwis/rt Canadian Real-Time Streamflows: http://scitech.pyr.ec.gc.ca/waterweb/formnav.asp?lang=0 Crustal Movement Report: http://www.geod.nrcan.gc.ca/pdf/pgrreportnov2001.pdf Seaway: http://www.greatlakes-seaway.com/en/home.html


![[LAKES REGION WATER CO., INC. HISTORY 2001 2010] · PDF fileNovember 1, 2011 [LAKES REGION WATER CO., INC. – HISTORY 2001‐2010] 1 Lakes Region Water Company , Inc. A History 2001‐2010](https://static.fdocuments.in/doc/165x107/5aa3e2a57f8b9ae7438b4ac1/lakes-region-water-co-inc-history-2001-2010-1-2011-lakes-region-water-co.jpg)


![The Vallejo Lakes Water System [ LWS]](https://static.fdocuments.in/doc/165x107/56816977550346895de162ed/the-vallejo-lakes-water-system-lws.jpg)


