

Federal Programs Spring Directors’ Conference Developing Federal Programs of Excellence
National Highway Traffic Safety Administration
Understanding Federal Crash Programs + Program Updates
Michael D. Frenchik NCSA, Safety Systems Management Division (SSMD) Chief
Safer drivers. Safer cars. Safer roads.
This presentation will introduce recent data collection and management endeavors at the National Highway Traffic Safety Administration (NHTSA) including the: • Crash Report Sampling System (CRSS), • Crash Investigation Sampling System (CISS), • Fatality Analysis Reporting System (FARS) –
Maryland, and • NHTSA Electronic Data Transfer (EDT) programs.
Overview
2
Safer drivers. Safer cars. Safer roads.
1) Understand the purpose and structure of CRSS, CISS, and EDT
2) Identify how EDT will improve data quality
3) Describe how FARS impacts Maryland’s traffic records systems
Objectives
3
Safer drivers. Safer cars. Safer roads.
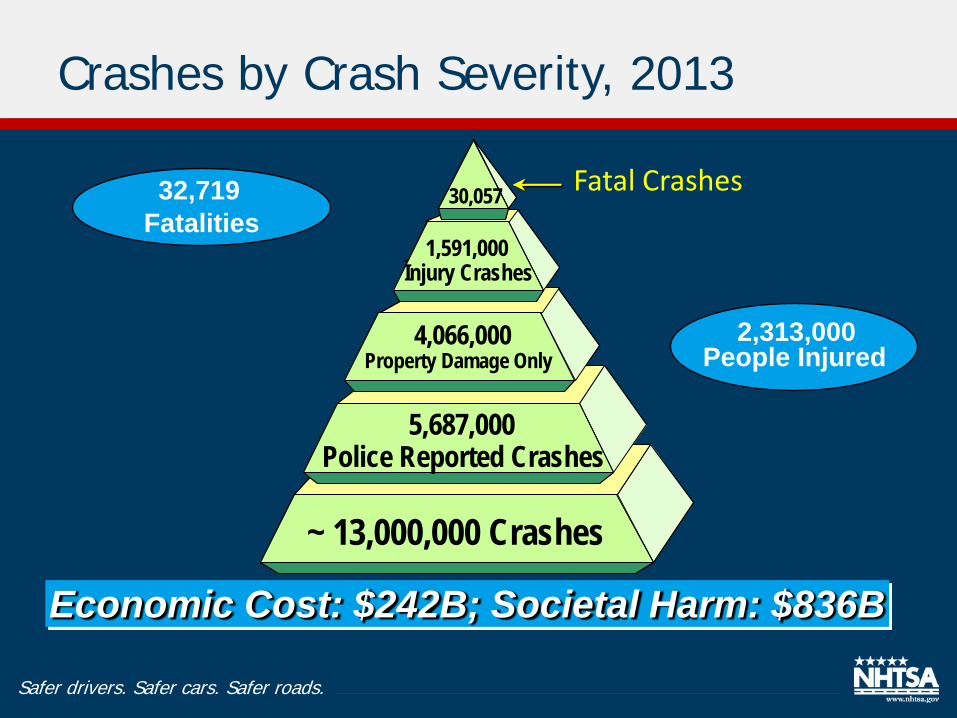
Crashes by Crash Severity, 2013
Economic Cost: $242B; Societal Harm: $836B
>16,000,000 Crashes >16,000,000 Crashes
4,348,000 Property Damage
Only
4,348,000 Property Damage
Only
1,929,000 Injury Crashes
1,929,000 Injury Crashes
38, 309 38, 38, 309 309
6,316,000 Police Reported Crashes
6,316,000 Police Reported Crashes
~ 13,000,000 Crashes
4,066,000 Property Damage Only
1,591,000 Injury Crashes
30,057
5,687,000 Police Reported Crashes
32,719 Fatalities
2,313,000 People Injured
Fatal Crashes
Safer drivers. Safer cars. Safer roads.
NHTSA’s effort to: • Upgrade the National Automotive Sampling
System (NASS) • Modernize and consolidate related information
technology systems
What is NHTSA DataMod?
5
Goal: To affirm NHTSA position as the leader in motor vehicle crash data collection and analysis, by collecting quality data to keep pace with emerging technologies and evolving policy needs.
Safer drivers. Safer cars. Safer roads.
• For Sample-based Systems: – Probability-based (needed for rulemaking) – Two independent sample systems – Completed the 3-stage sample design and selected the first and
second stage sites – No intentional overlap between “old” NASS and “new” data
collection sites – Flexibility to add special studies (Peds, Trucks, Motorcycles,…) – Sample scalability (up or down)
• For Fatality-based Analysis: – Census of all reportable fatalities that are within the roadway
Crash Data Systems - Concepts
6
Safer drivers. Safer cars. Safer roads.
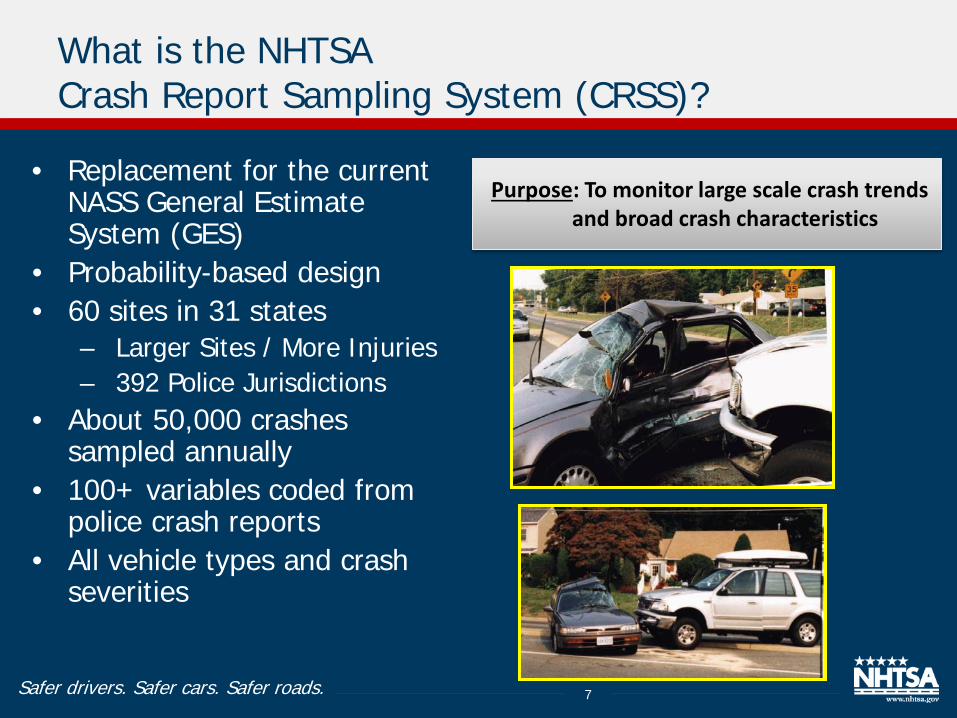
What is the NHTSA Crash Report Sampling System (CRSS)?
• Replacement for the current NASS General Estimate System (GES)
• Probability-based design • 60 sites in 31 states
– Larger Sites / More Injuries – 392 Police Jurisdictions
• About 50,000 crashes sampled annually
• 100+ variables coded from police crash reports
• All vehicle types and crash severities
7
Purpose: To monitor large scale crash trends and broad crash characteristics
Safer drivers. Safer cars. Safer roads.
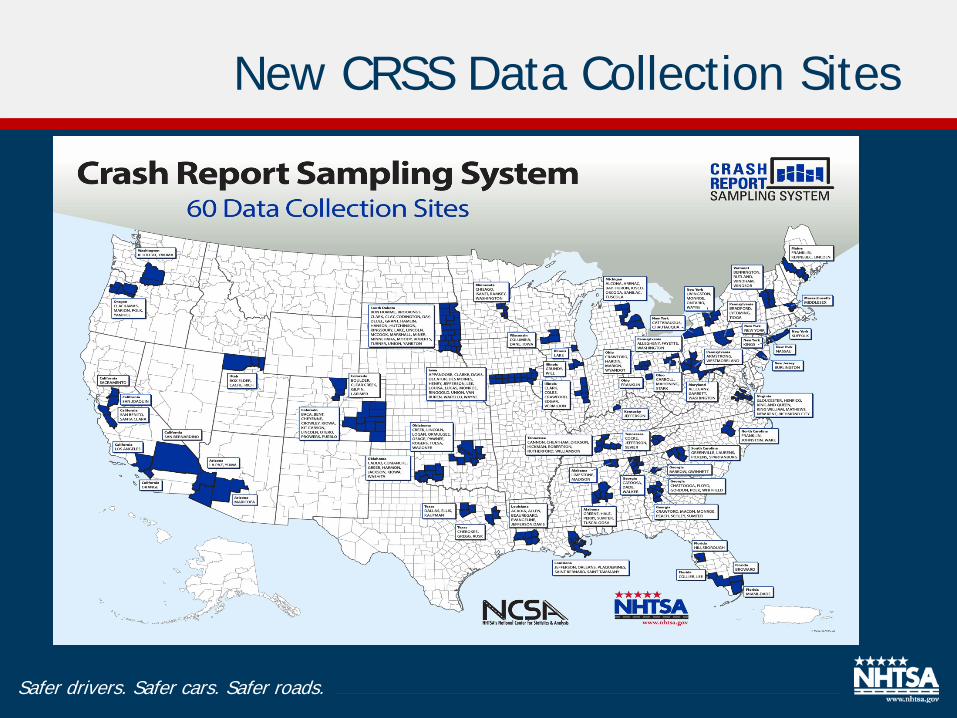
New CRSS Data Collection Sites
Safer drivers. Safer cars. Safer roads.
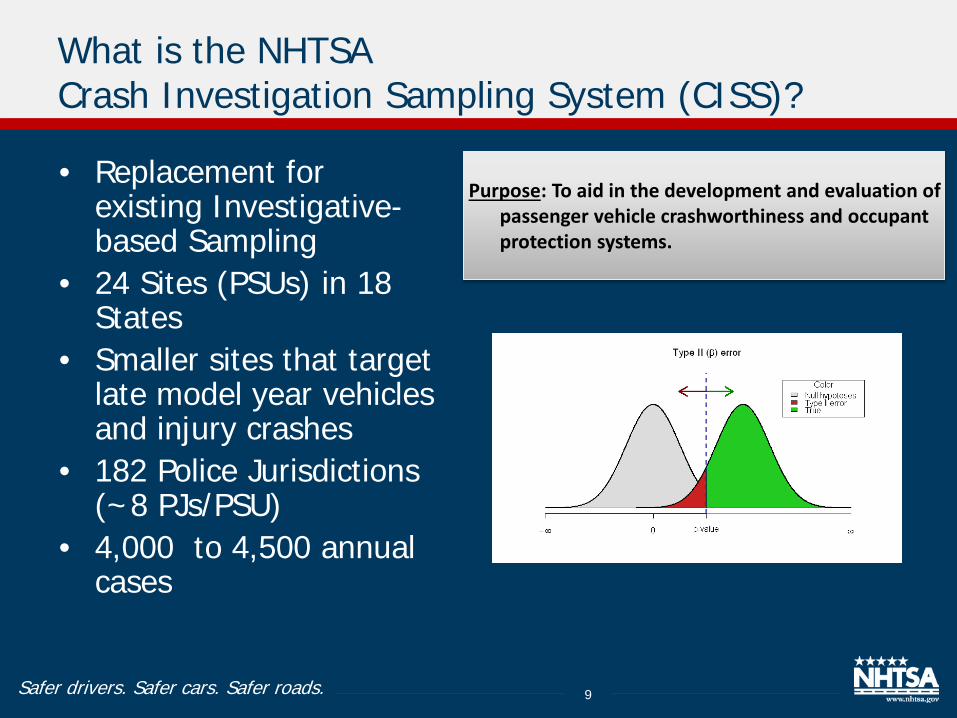
What is the NHTSA Crash Investigation Sampling System (CISS)?
• Replacement for existing Investigative-based Sampling
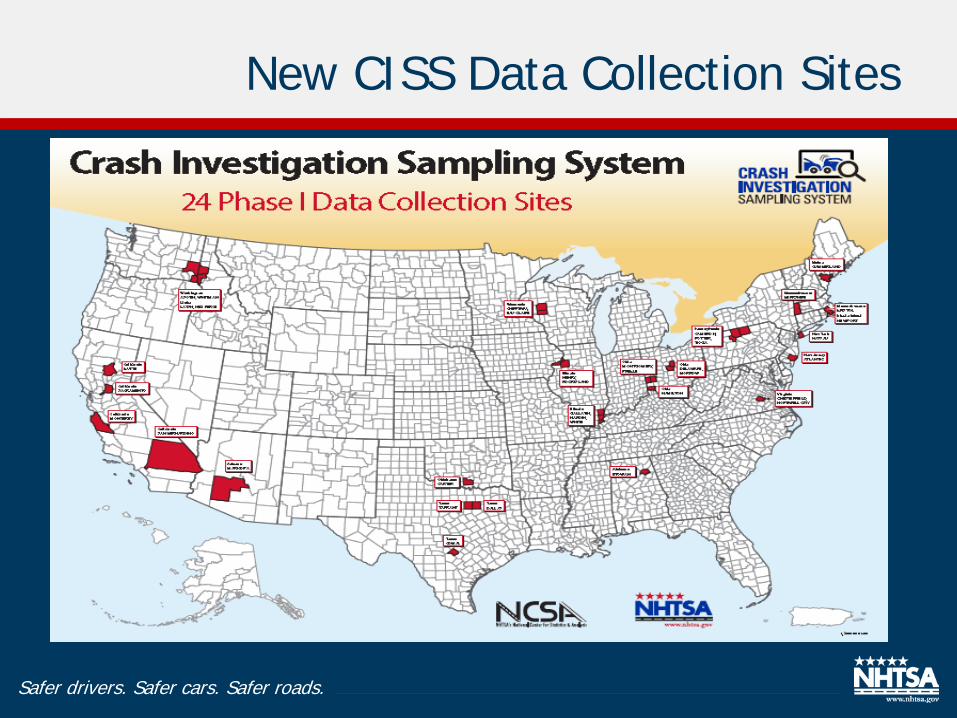
• 24 Sites (PSUs) in 18 States
• Smaller sites that target late model year vehicles and injury crashes
• 182 Police Jurisdictions (~8 PJs/PSU)
• 4,000 to 4,500 annual cases
9
Purpose: To aid in the development and evaluation of passenger vehicle crashworthiness and occupant protection systems.
Safer drivers. Safer cars. Safer roads.
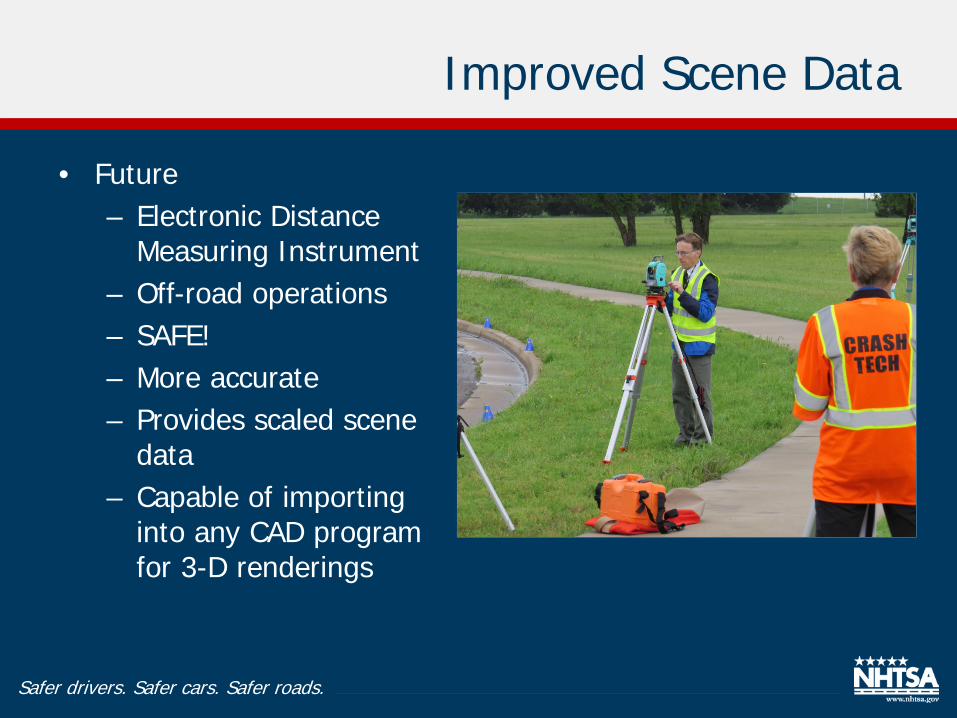
Improved Scene Data
• Future – Electronic Distance
Measuring Instrument – Off-road operations – SAFE! – More accurate – Provides scaled scene
data – Capable of importing
into any CAD program for 3-D renderings
Safer drivers. Safer cars. Safer roads.
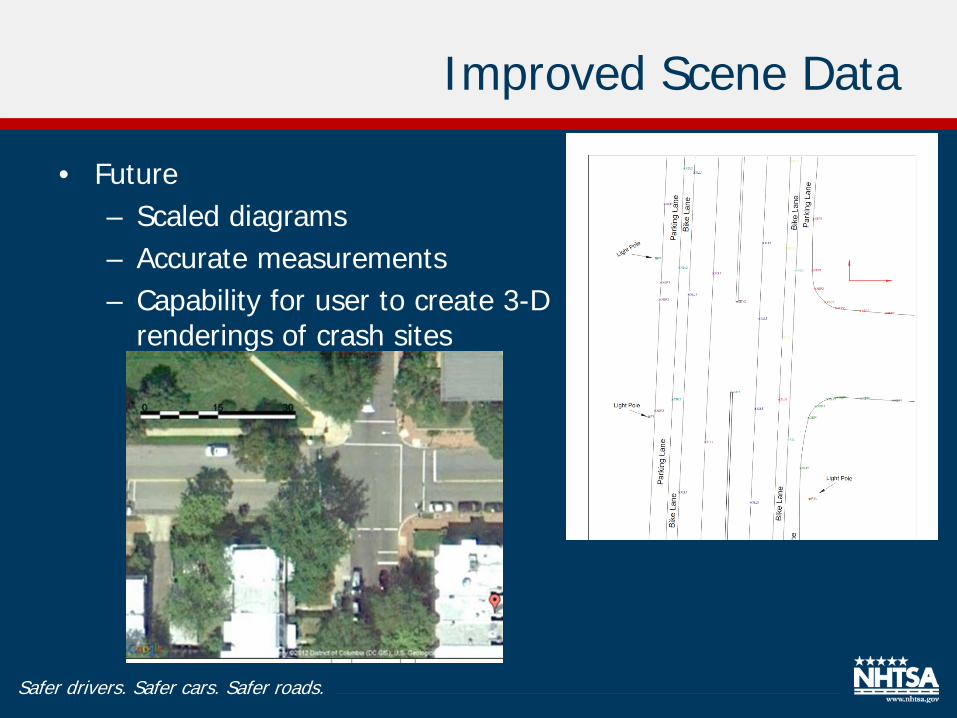
Improved Scene Data
• Future – Scaled diagrams – Accurate measurements – Capability for user to create 3-D
renderings of crash sites
Safer drivers. Safer cars. Safer roads.
New CISS Data Collection Sites
Safer drivers. Safer cars. Safer roads.
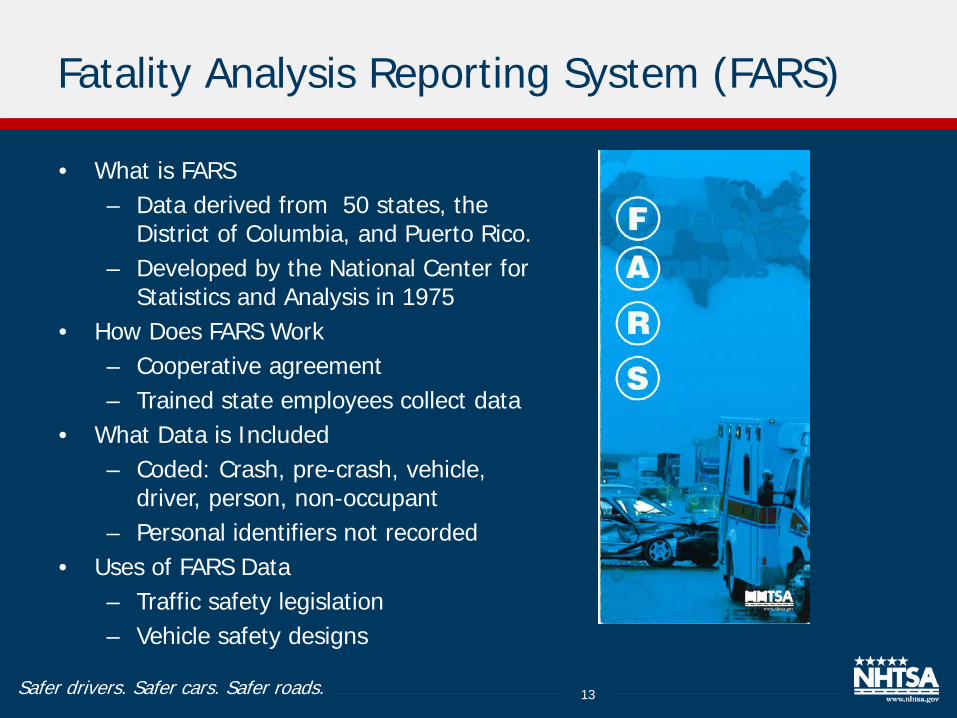
Fatality Analysis Reporting System (FARS)
• What is FARS – Data derived from 50 states, the
District of Columbia, and Puerto Rico. – Developed by the National Center for
Statistics and Analysis in 1975 • How Does FARS Work
– Cooperative agreement – Trained state employees collect data
• What Data is Included – Coded: Crash, pre-crash, vehicle,
driver, person, non-occupant – Personal identifiers not recorded
• Uses of FARS Data – Traffic safety legislation – Vehicle safety designs
13
Safer drivers. Safer cars. Safer roads.
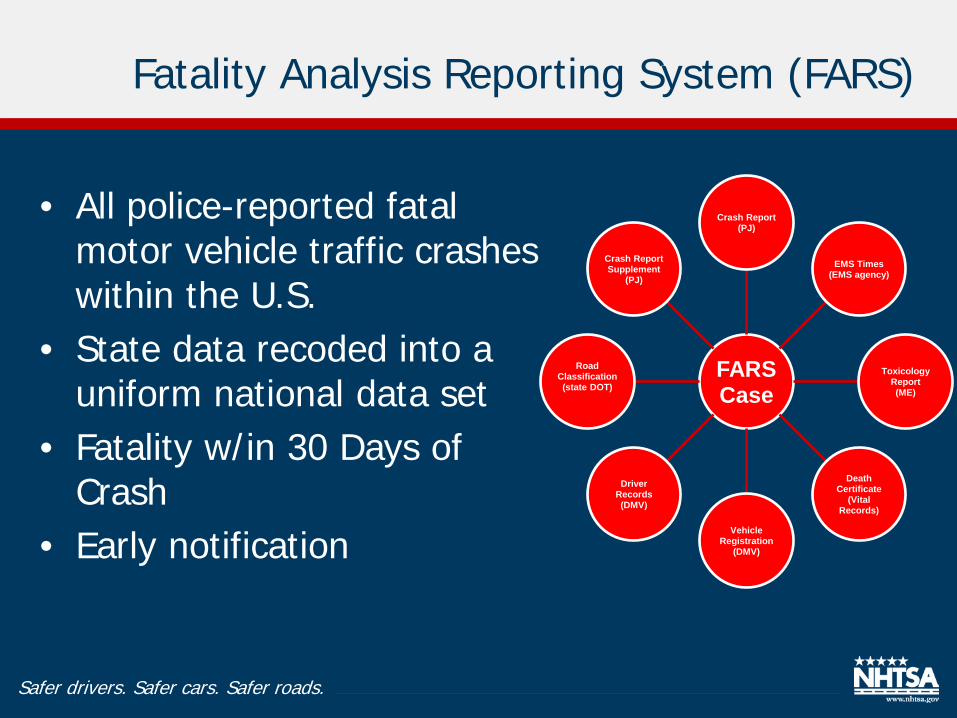
Fatality Analysis Reporting System (FARS)
• All police-reported fatal motor vehicle traffic crashes within the U.S.
• State data recoded into a uniform national data set
• Fatality w/in 30 Days of Crash
• Early notification
FARS Case
Crash Report (PJ)
EMS Times (EMS agency)
Toxicology Report (ME)
Death Certificate
(Vital Records)
Vehicle Registration
(DMV)
Driver Records (DMV)
Road Classification (state DOT)
Crash Report Supplement
(PJ)
Safer drivers. Safer cars. Safer roads.
New Platform / New Technologies (Cont’)
• Consolidated Server Platform • Data Standardization Among Studies (e.g.,
Vehicle Specifications) – Electronic Data Transfer (EDT) – Product Information Catalog and Vehicle Listing (vPIC)
• Capability of automatically pre-coding data from State-based systems
• Improved output to NHTSA website aimed at improvement of data user experience
15
Safer drivers. Safer cars. Safer roads.
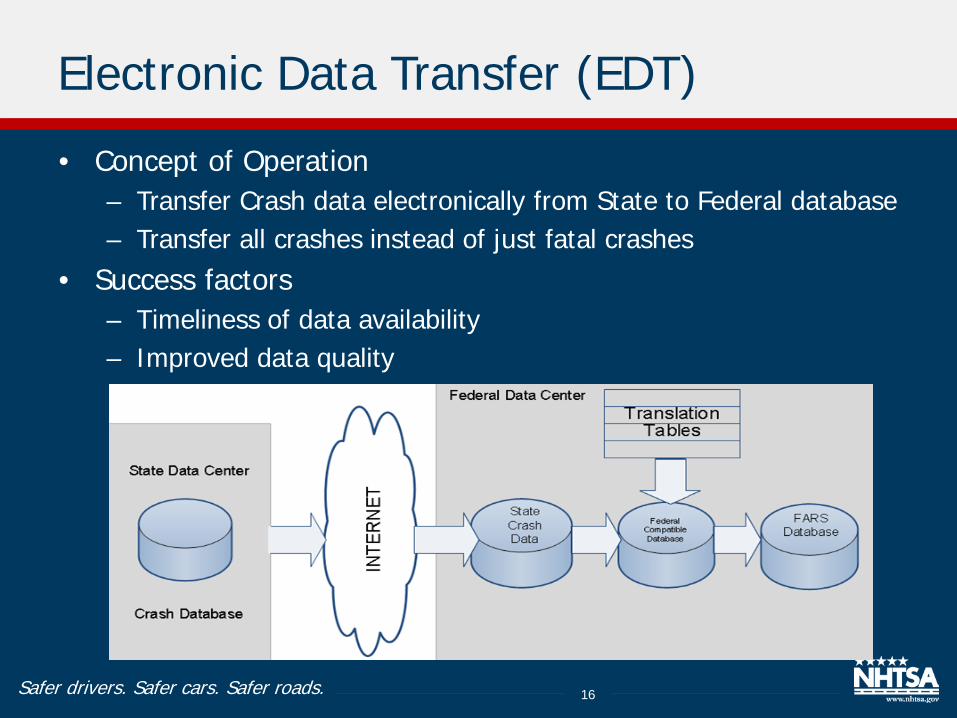
Electronic Data Transfer (EDT)
• Concept of Operation – Transfer Crash data electronically from State to Federal database – Transfer all crashes instead of just fatal crashes
• Success factors – Timeliness of data availability – Improved data quality
16
Safer drivers. Safer cars. Safer roads.
EDT Process – Concept of Operations
• Data will be transferred from the Maryland Crash Data System to NHTSA on a daily basis.
• All of the cases received by NHTSA are processed on a NIGHTLY basis. – Updates are made to data entry systems
nightly. • Each case is tagged with
– Date case received from State – Date EDT Process updated the case
17
Safer drivers. Safer cars. Safer roads.
Pre-Code of FARS Cases (EDT)
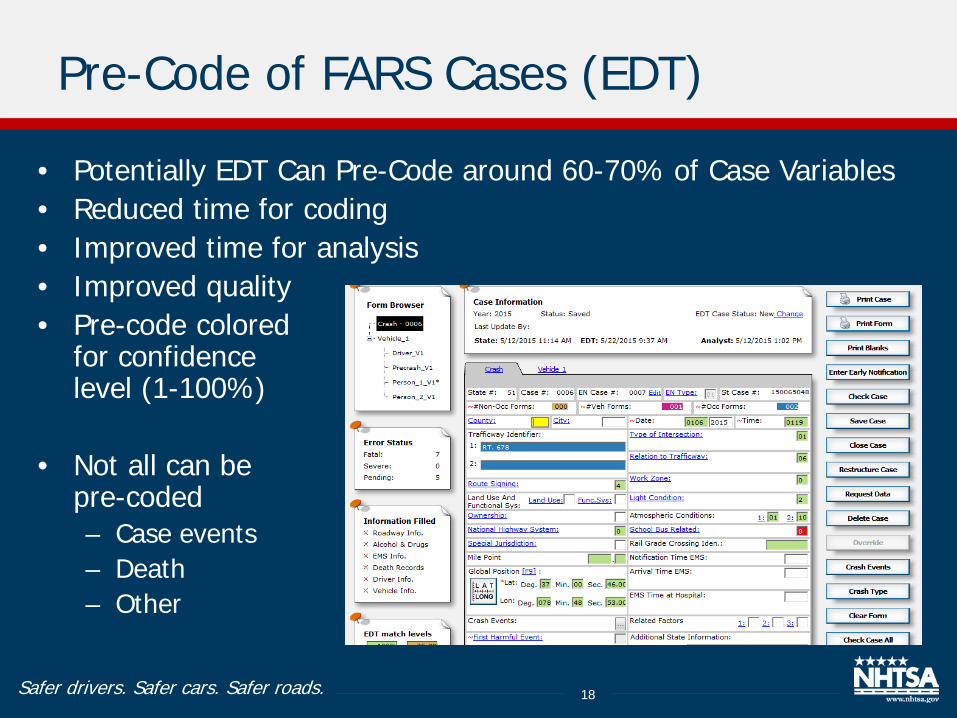
• Potentially EDT Can Pre-Code around 60-70% of Case Variables • Reduced time for coding • Improved time for analysis • Improved quality • Pre-code colored
for confidence level (1-100%)
• Not all can be pre-coded – Case events – Death – Other
18
Safer drivers. Safer cars. Safer roads.
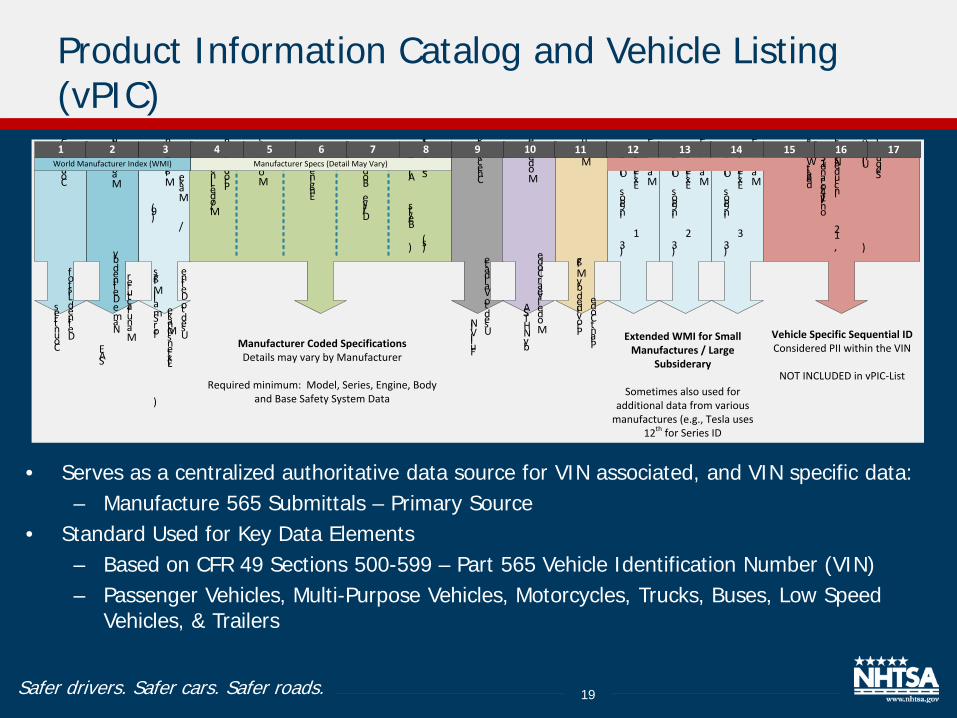
Product Information Catalog and Vehicle Listing (vPIC)
• Serves as a centralized authoritative data source for VIN associated, and VIN specific data: – Manufacture 565 Submittals – Primary Source
• Standard Used for Key Data Elements – Based on CFR 49 Sections 500-599 – Part 565 Vehicle Identification Number (VIN) – Passenger Vehicles, Multi-Purpose Vehicles, Motorcycles, Trucks, Buses, Low Speed
Vehicles, & Trailers
19
Country Code
Manufacture
Make
/
Mfg Extension
(9)
Model Series
Engine Bo
dy
/ Drive
Safety System
(s)
(Air Bags
/ Belts
)
Check Digit
Model Year
Manufacture
Extension
1
(Only if
9 in Pos
3)
Manufacture Plant
Manufacture
Extension
3
(Only if
9 in Pos
3)
Sequential ID
(Unique to Vehicle
)
NOTE
: Includes
12,
13
and
14
only for 3
digit WMIs
Production
Line
/ Model
Manufacture
Extension
2
(Only if
9 in Pos
3)
World Manufacturer Index (WMI) Manufacturer Specs (Detail May Vary)
Defined List of
Countries
Manufacturer
Name Defined by
SAE
Used to Define
Make
(Extension
for Small Mfgs
)
Manufacturer Coded SpecificationsDetails may vary by Manufacturer
Required minimum: Model, Series, Engine, Body and Base Safety System Data
Used to Validate
Full VIN M
odel Year Code
by NHTSA
Plant Code
Provided by Mfg
Extended WMI for Small Manufactures / Large
Subsiderary
Sometimes also used for additional data from various
manufactures (e.g., Tesla uses 12th for Series ID
Vehicle Specific Sequential IDConsidered PII within the VIN
NOT INCLUDED in vPIC-List
1 2 3 4 5 6 7 8 9 10 11 12 13 14 15 16 17
Safer drivers. Safer cars. Safer roads.
vPIC Public Interfaces
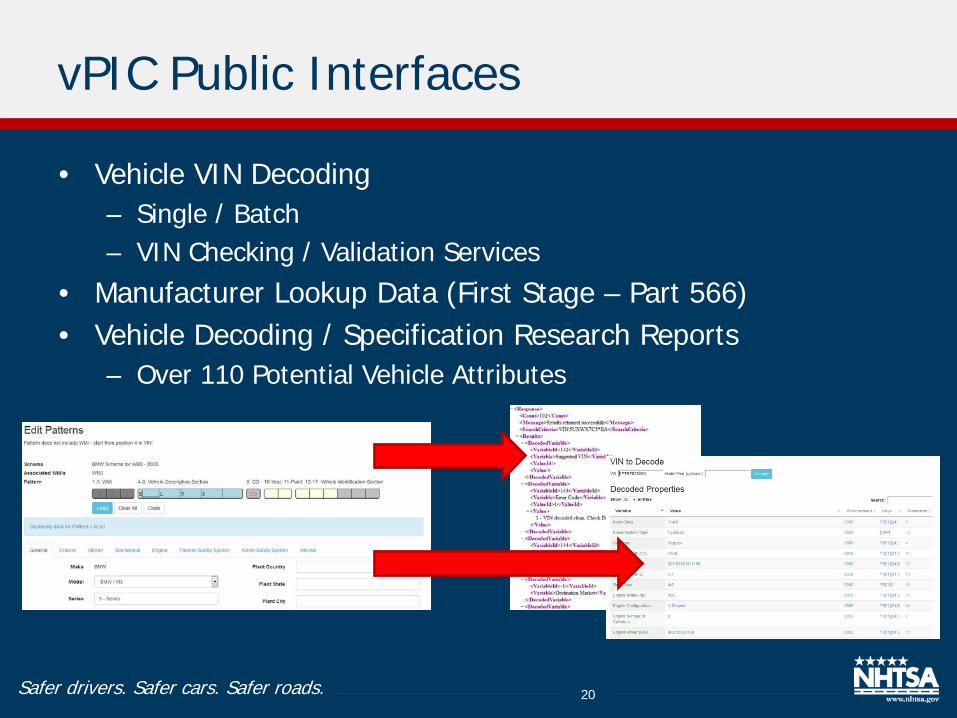
• Vehicle VIN Decoding – Single / Batch – VIN Checking / Validation Services
• Manufacturer Lookup Data (First Stage – Part 566) • Vehicle Decoding / Specification Research Reports
– Over 110 Potential Vehicle Attributes
20
Safer drivers. Safer cars. Safer roads.
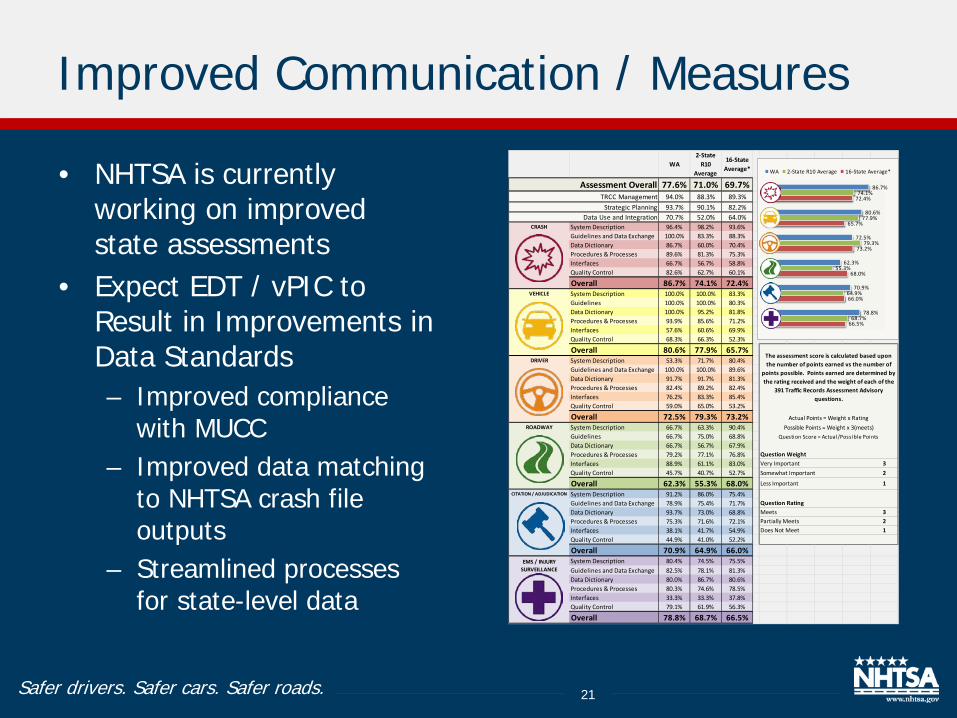
Improved Communication / Measures
• NHTSA is currently working on improved state assessments
• Expect EDT / vPIC to Result in Improvements in Data Standards – Improved compliance
with MUCC – Improved data matching
to NHTSA crash file outputs
– Streamlined processes for state-level data
21
WA2-State
R10 Average
16-State Average*
77.6% 71.0% 69.7%94.0% 88.3% 89.3%93.7% 90.1% 82.2%70.7% 52.0% 64.0%
CRASH System Description 96.4% 98.2% 93.6%Guidelines and Data Exchange 100.0% 83.3% 88.3%Data Dictionary 86.7% 60.0% 70.4%Procedures & Processes 89.6% 81.3% 75.3%Interfaces 66.7% 56.7% 58.8%Quality Control 82.6% 62.7% 60.1%
Overall 86.7% 74.1% 72.4%VEHICLE System Description 100.0% 100.0% 83.3%
Guidelines 100.0% 100.0% 80.3%Data Dictionary 100.0% 95.2% 81.8%Procedures & Processes 93.9% 85.6% 71.2%Interfaces 57.6% 60.6% 69.9%Quality Control 68.3% 66.3% 52.3%
Overall 80.6% 77.9% 65.7%DRIVER System Description 53.3% 71.7% 80.4%
Guidelines and Data Exchange 100.0% 100.0% 89.6%Data Dictionary 91.7% 91.7% 81.3%Procedures & Processes 82.4% 89.2% 82.4%Interfaces 76.2% 83.3% 85.4%Quality Control 59.0% 65.0% 53.2%
Overall 72.5% 79.3% 73.2%ROADWAY System Description 66.7% 63.3% 90.4%
Guidelines 66.7% 75.0% 68.8%Data Dictionary 66.7% 56.7% 67.9%Procedures & Processes 79.2% 77.1% 76.8%Interfaces 88.9% 61.1% 83.0% Very Important 3Quality Control 45.7% 40.7% 52.7% Somewhat Important 2
Overall 62.3% 55.3% 68.0% Less Important 1CITATION / ADJUDICATION System Description 91.2% 86.0% 75.4%
Guidelines and Data Exchange 78.9% 75.4% 71.7% Question RatingData Dictionary 93.7% 73.0% 68.8% Meets 3Procedures & Processes 75.3% 71.6% 72.1% Partially Meets 2Interfaces 38.1% 41.7% 54.9% Does Not Meet 1Quality Control 44.9% 41.0% 52.2%
Overall 70.9% 64.9% 66.0%System Description 80.4% 74.5% 75.5%Guidelines and Data Exchange 82.5% 78.1% 81.3%Data Dictionary 80.0% 86.7% 80.6%Procedures & Processes 80.3% 74.6% 78.5%Interfaces 33.3% 33.3% 37.8%Quality Control 79.1% 61.9% 56.3%
Overall 78.8% 68.7% 66.5%
Actual Points = Weight x Rating
Assessment OverallTRCC Management
Strategic PlanningData Use and Integration
The assessment score is calculated based upon the number of points earned vs the number of
points possible. Points earned are determined by the rating received and the weight of each of the
391 Traffic Records Assessment Advisory questions.
Possible Points = Weight x 3(meets)Question Score = Actual/Possible Points
Question Weight
EMS / INJURY SURVEILLANCE
66.5%
66.0%
68.0%
73.2%
65.7%
72.4%
68.7%
64.9%
55.3%
79.3%
77.9%
74.1%
78.8%
70.9%
62.3%
72.5%
80.6%
86.7%
WA 2-State R10 Average 16-State Average*
Safer drivers. Safer cars. Safer roads.
EDT Effectiveness Evaluation
• Will work with the state to determine the effectiveness of EDT
• Evaluation will include – Assessment of costs, – Activities required to bring to production, and – Cost / benefits of use
• Lessons Learned • Areas of Opportunity
– Potential reduction in reporting – Potential reduction in duplicative data
transmissions (e.g., other DOT modes)
22