Understanding ETFs - DWS...ETFs, inverse (short) and leveraged ETFs and other asset classes...
17
Deutsche Asset Management A ten-step guide to Exchange Traded Funds Understanding ETFs Marketing Document for Professional Clients only, as defined under the MiFID Directive 2004/39/EC Annex II).
Transcript of Understanding ETFs - DWS...ETFs, inverse (short) and leveraged ETFs and other asset classes...
DeutscheAsset Management
A ten-step guide to Exchange Traded Funds
Understanding ETFs
Marketing Document for Professional Clients only, as defined under the MiFID Directive 2004/39/EC Annex II).

3
ETFs have a wide range of uses, from acting as core holdings in long-term savings plans, serving as a useful tool for making tactical asset allocation changes and permitting investors to take short-term views on market movements.
Recent product enhancements have enabled investors to access many markets on an interest rate-hedged or currency-hedged basis via ETFs. Additionally certain ETFs offer exposure to markets on an inverse or leveraged basis, enabling investors to tailor their portfolio risk profiles more effectively.
Our objective in publishing this ten-step guide is to outline the key features of ETFs comprehensively, accurately and in plain language. We explain what ETFs are, how they work, which market segments they cover, how much they cost and how investors can use them to their best advantage.
For those seeking more detailed product information, please refer to the db X-trackers ETF website or speak to one of our specialists. As always, investors should consult an investment or tax advisor.
Amanda Rebello, CFAHead of Passive DistributionUK, Ireland & Channel Islands
Since the first exchange-traded funds (ETFs) were listed in North America over two decades ago, ETFs have become one of the most significant financial innovations of all time. ETFs combine the structure of a traditional savings vehicle—the mutual fund—with real-time pricing on stock exchanges, offering many different kinds of investors a powerful tool.
The use of ETFs became widespread during the 2000s and has recently accelerated. During the summer of 2015, ETF assets under management worldwide surpassed USD 3 trillion for the first time.
The rising inflows into ETFs are a consequence of the key benefits of this type of fund structure: trans-parency, liquidity and low cost.
Most ETFs have the objective of replicating the performance of an index, before fees and costs. This enables investors to buy the market, a market segment or strategy at the click of a button, creating instant exposure to a diversified portfolio of underlying securities.
As tradeable funds, ETFs are listed on exchanges around the world, enabling investors and traders to enter and exit positions at dealing prices set freely by the interaction of other market participants.
The fees for ETFs are often significantly lower than the annual management charges levied by traditional investment vehicles, making them a popular choice in an age of cost-consciousness and low returns.
Which market segments do ETFs cover?What kinds of indices do ETFs track?
How to reduce interest rate and currency risks?
54
step
01
step
01
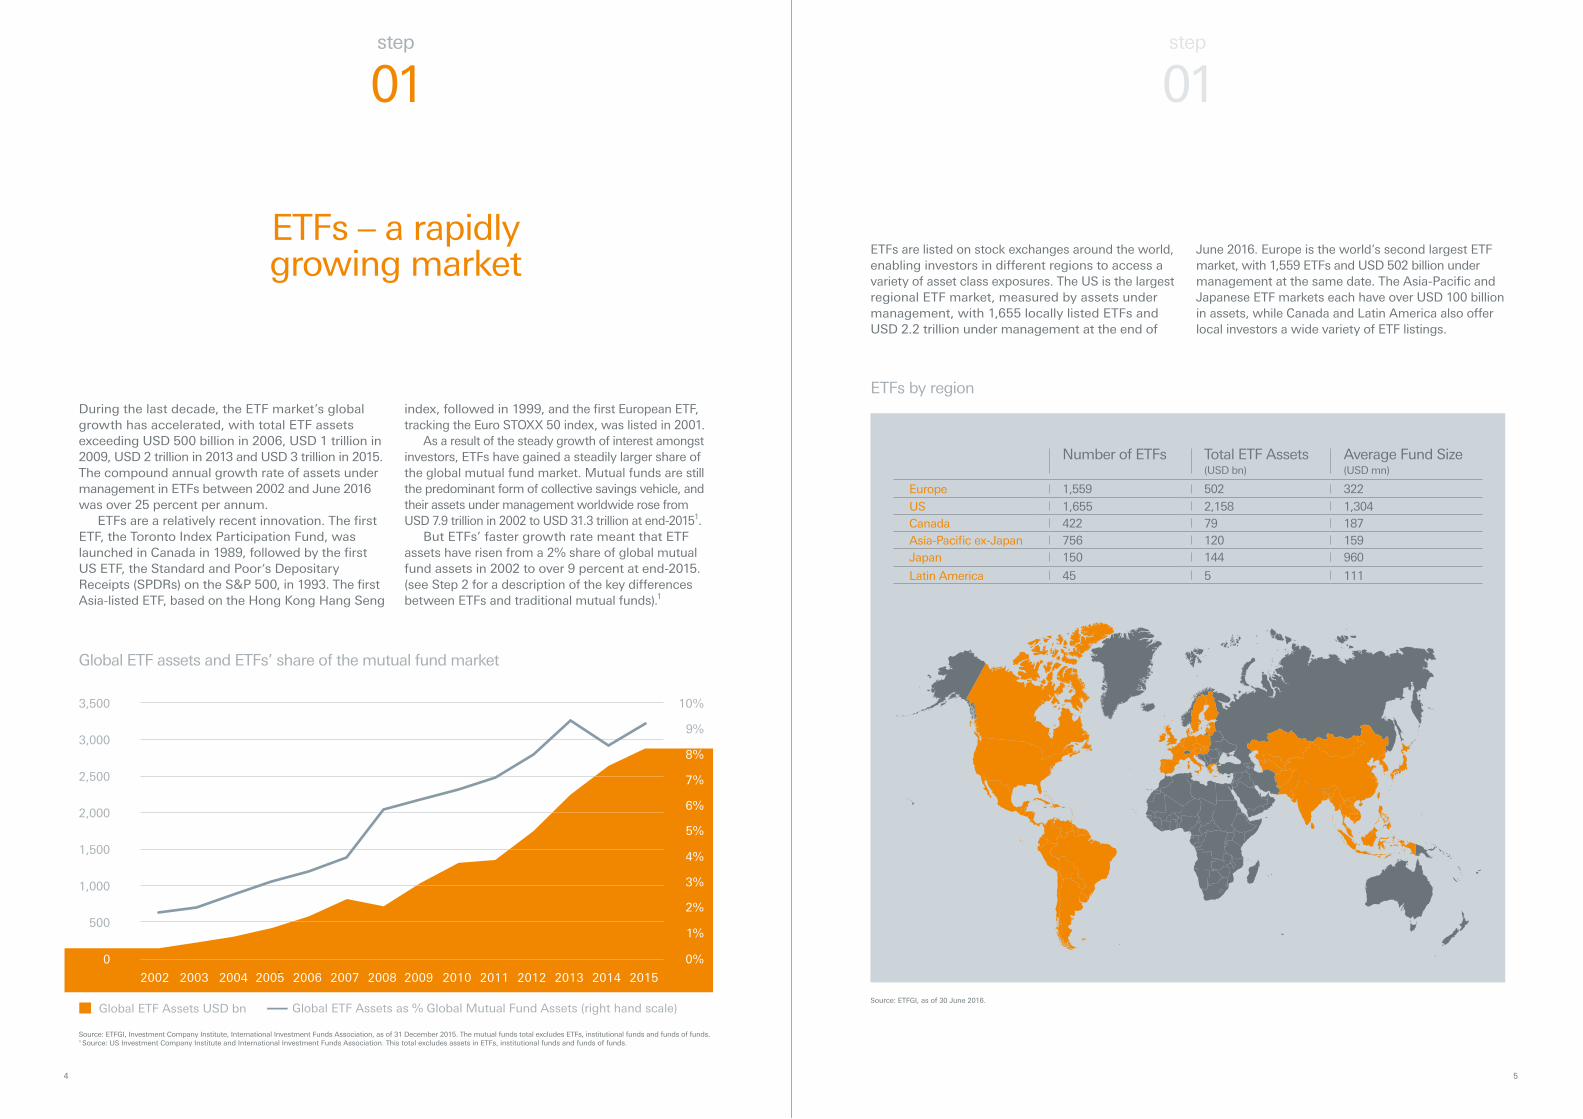
index, followed in 1999, and the first European ETF, tracking the Euro STOXX 50 index, was listed in 2001.
As a result of the steady growth of interest amongst investors, ETFs have gained a steadily larger share of the global mutual fund market. Mutual funds are still the predominant form of collective savings vehicle, and their assets under management worldwide rose from USD 7.9 trillion in 2002 to USD 31.3 trillion at end-20151.
But ETFs’ faster growth rate meant that ETF assets have risen from a 2% share of global mutual fund assets in 2002 to over 9 percent at end-2015. (see Step 2 for a description of the key differences between ETFs and traditional mutual funds).1
During the last decade, the ETF market’s global growth has accelerated, with total ETF assets exceeding USD 500 billion in 2006, USD 1 trillion in 2009, USD 2 trillion in 2013 and USD 3 trillion in 2015. The compound annual growth rate of assets under management in ETFs between 2002 and June 2016 was over 25 percent per annum.
ETFs are a relatively recent innovation. The first ETF, the Toronto Index Participation Fund, was launched in Canada in 1989, followed by the first US ETF, the Standard and Poor‘s Depositary Receipts (SPDRs) on the S&P 500, in 1993. The first Asia-listed ETF, based on the Hong Kong Hang Seng
Source: ETFGI, Investment Company Institute, International Investment Funds Association, as of 31 December 2015. The mutual funds total excludes ETFs, institutional funds and funds of funds.1 Source: US Investment Company Institute and International Investment Funds Association. This total excludes assets in ETFs, institutional funds and funds of funds.
Global ETF assets and ETFs’ share of the mutual fund market
Global ETF Assets USD bn Global ETF Assets as % Global Mutual Fund Assets (right hand scale)
500
0
1,000
1,500
2,000
2,500
3,500
3,000
1%
0%
6%
7%
8%
10%
5%
4%
3%
2%
9%
June 2016. Europe is the world’s second largest ETF market, with 1,559 ETFs and USD 502 billion under management at the same date. The Asia-Pacific and Japanese ETF markets each have over USD 100 billion in assets, while Canada and Latin America also offer local investors a wide variety of ETF listings.
ETFs are listed on stock exchanges around the world, enabling investors in different regions to access a variety of asset class exposures. The US is the largest regional ETF market, measured by assets under management, with 1,655 locally listed ETFs and USD 2.2 trillion under management at the end of
Number of ETFs Total ETF Assets (USD bn)
Average Fund Size (USD mn)
Europe 1,559 502 322
US 1,655 2,158 1,304 Canada 422 79 187 Asia-Pacific ex-Japan 756 120 159 Japan 150 144 960
Latin America 45 5 111
ETFs by region
ETFs – a rapidly growing market
Source: ETFGI, as of 30 June 2016.
'2002 2003 2004 2005 2006 2007 2008 2010 2011 2012 2013 2014 20152009
76
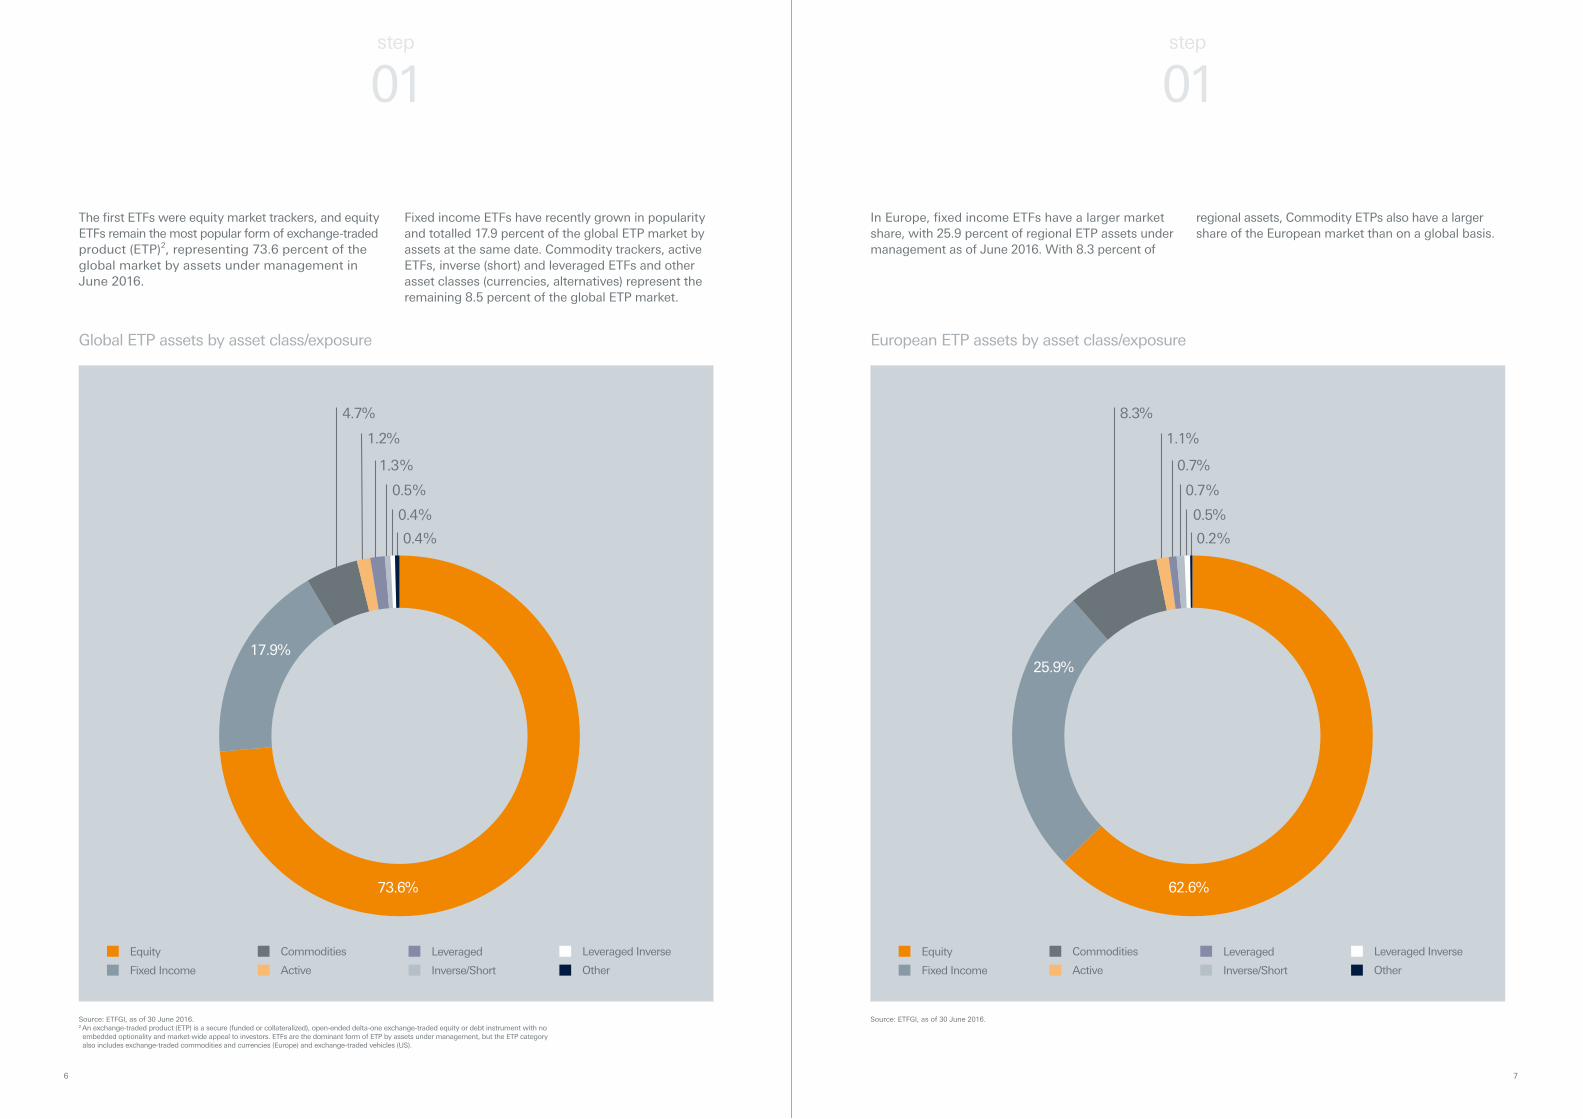
Fixed income ETFs have recently grown in popularity and totalled 17.9 percent of the global ETP market by assets at the same date. Commodity trackers, active ETFs, inverse (short) and leveraged ETFs and other asset classes (currencies, alternatives) represent the remaining 8.5 percent of the global ETP market.
regional assets, Commodity ETPs also have a larger share of the European market than on a global basis.
The first ETFs were equity market trackers, and equity ETFs remain the most popular form of exchange-traded product (ETP)2, representing 73.6 percent of the global market by assets under management in June 2016.
In Europe, fixed income ETFs have a larger market share, with 25.9 percent of regional ETP assets under management as of June 2016. With 8.3 percent of
Source: ETFGI, as of 30 June 2016.
step
01
step
01
European ETP assets by asset class/exposureGlobal ETP assets by asset class/exposure
4.7% 8.3%
0.4% 0.2%
0.4% 0.5%
0.5% 0.7%
1.3% 0.7%
1.2% 1.1%
EquityEquity CommoditiesCommodities LeveragedLeveraged Leveraged InverseLeveraged Inverse
Fixed IncomeFixed Income ActiveActive Inverse/ShortInverse/Short OtherOther
Source: ETFGI, as of 30 June 2016.2 An exchange-traded product (ETP) is a secure (funded or collateralized), open-ended delta-one exchange-traded equity or debt instrument with no embedded optionality and market-wide appeal to investors. ETFs are the dominant form of ETP by assets under management, but the ETP category also includes exchange-traded commodities and currencies (Europe) and exchange-traded vehicles (US).
73.6%
17.9%25.9%
62.6%

98
step
02
step
02
What are ETFs?
÷ =
An ETF is a type of mutual fund that is listed for trading on a stock exchange.
A mutual fund is a legal structure designed for collective investment. Mutual funds are typically open-ended, meaning that their total number of shares in issue is variable. They create fund shares (or redeem them) to reflect demand and supply from investors. In this way, the price of a single share of a mutual fund reflects its net asset value (NAV).
Traditionally, mutual funds have not been traded on stock exchanges. Instead, investors’ orders to transact in mutual fund shares are placed with the fund issuer
How a collective investment scheme NAV is calculated
ETFs combine the desirable features of mutual funds and investment trusts
Net assets USD 100 million
NAV/share USD 2
Shares in issue
50 million
at a set frequency, typically daily or weekly. Deals are struck on the basis of the fund’s NAV3.
Another pooled investment scheme is an investment trust, a popular structure since the 19th century and now found mainly in the UK market4. A typical investment trust has a fixed (rather than variable) number of shares in issue and is therefore referred to as closed-ended. Legally, investment trusts are companies and, like the shares of individual corporations, they are listed on stock exchanges, enabling investors to buy and sell them throughout the trading day.
Mutual Fund Investment Trust
ETF
Legal Structure Mutual fund Company Mutual fund Dealing Frequency Daily/weekly Intraday Intraday
Deals struck at NAV Secondary market price Secondary market price/NAV
Premium/discount to NAV None Frequent/significant Infrequent/small
3 Transactions in US mutual funds regulated under the 1940 Investment Company Act take place at the fund’s next calculated NAV. In many European mutual funds (regulated as “Undertakings for Collective Investments in Transferable Securities” or “UCITS”), the NAV may “swing” higher or lower by a small percentage to reflect investor inflows or outflows, thereby transferring the transaction costs associated with the inflows or outflows to the investors entering or leaving the fund.
4 According to the Association of Investment Companies, 401 UK-listed investment trusts had total assets of £132 billion as at 30 September 2015.
As mutual funds, ETFs comply with the relevant regulations in the jurisdictions in which they are domiciled. Most US ETFs, for example, are compliant with the 1940 US Investment Company Act, the guiding rule for the US mutual fund market. The Investment Company Act sets minimum standards for funds’ liquidity, pricing, structure and governance. Similarly, in Europe, most ETFs comply with the EU-wide “Undertakings for Collective Investments in Transferable Securities” (or “UCITS”) rules. UCITS provides a secure, well-regulated framework for retail collective investment schemes by setting minimum standards for investable assets, liquidity, pricing and disclosure.
ETFs often offer greater transparency than the minimum standards set by regulators. While mutual funds and investment trusts may disclose their portfo-lio holdings only quarterly or half-yearly, most ETF issuers voluntarily disclose their funds’ constituents daily via their websites.
Investment trusts cannot expand or contract their share capital to reflect investor demand. Therefore, new purchases of investment trust shares are likely to push up their market price. This can cause the price of an investment trust’s shares to exceed the trust’s NAV per share—a situation referred to as the trust’s shares trading at a premium to NAV. The opposite situation occurs when net selling pushes the invest-ment trust’s shares to a discount.
ETFs can be seen as a hybrid between an open-ended mutual fund and a share (see the table). ETFs’ intraday tradeability grants investors and traders significant extra flexibility by comparison with the fixed dealing window of a mutual fund. At the same time, ETFs’ unique creation and redemption mechanism (see Step 3) allows these funds to maintain a secondary market price that is close to the fund’s NAV, thereby largely eliminating an unwelcome structural feature of investment trusts—frequent and often sizeable premiums and discounts to NAV.
1110
step
03
step
03
How do ETFs work?
ETF issuer investorsauthorised participant
stock exchange
bilateral (OTC) market
ETF shares
creation basket/cash
The creation/redemption mechanism of an ETF plays another vital role. Since an ETF’s shares are freely traded in the secondary market, a prevalence of buyers over sellers could push the share price upwards, potentially exceeding the net asset value of each share. Similarly, an excess of sellers could push the ETF share price to a discount to its NAV.
If such a premium or discount occurs, it is likely to be ironed out quickly by arbitrageurs, as noted above.
If the ETF’s shares are trading at a premium to its NAV, the AP can buy the ETF’s underlying securities, supply them as a creation basket to the ETF issuer, receive ETF shares in return and sell them in the market for a risk-free profit. These transactions have the overall effect of bringing the ETF’s secondary market price back into line with its NAV.
Similarly, if an ETF’s shares are trading at a discount to its NAV, the AP can sell the ETF’s constituent securi-ties, buy ETF shares in the open market, exchange the ETF shares for the redemption basket and again end up
with a risk-free profit. In turn, the ETF’s price is brought back into line with its NAV, this time from below.
ETF arbitrage is possible only when the fund’s price moves by more than a certain amount above or below its NAV. The width of this so-called no-arbitrage or fair value band reflects the costs of creating or redeeming the ETF, including the bid-offer spreads on the underlying securi-ties, any creation or redemption fees set by the issuer, transaction taxes (where applicable) and hedging and inventory costs. The ETF’s price in secondary market trading tends to move freely within this fair value band (see the diagram).
Any costs involved in creating or redeeming ETF units are therefore borne seamlessly and indirectly by those buying or selling ETFs in the secondary market. This design feature of ETFs represents an enhancement to the traditional mutual fund structure, since mutual fund issuers face the ongoing challenge of allocating portfolio transaction costs fairly between entering or departing investors and those remaining in a fund.
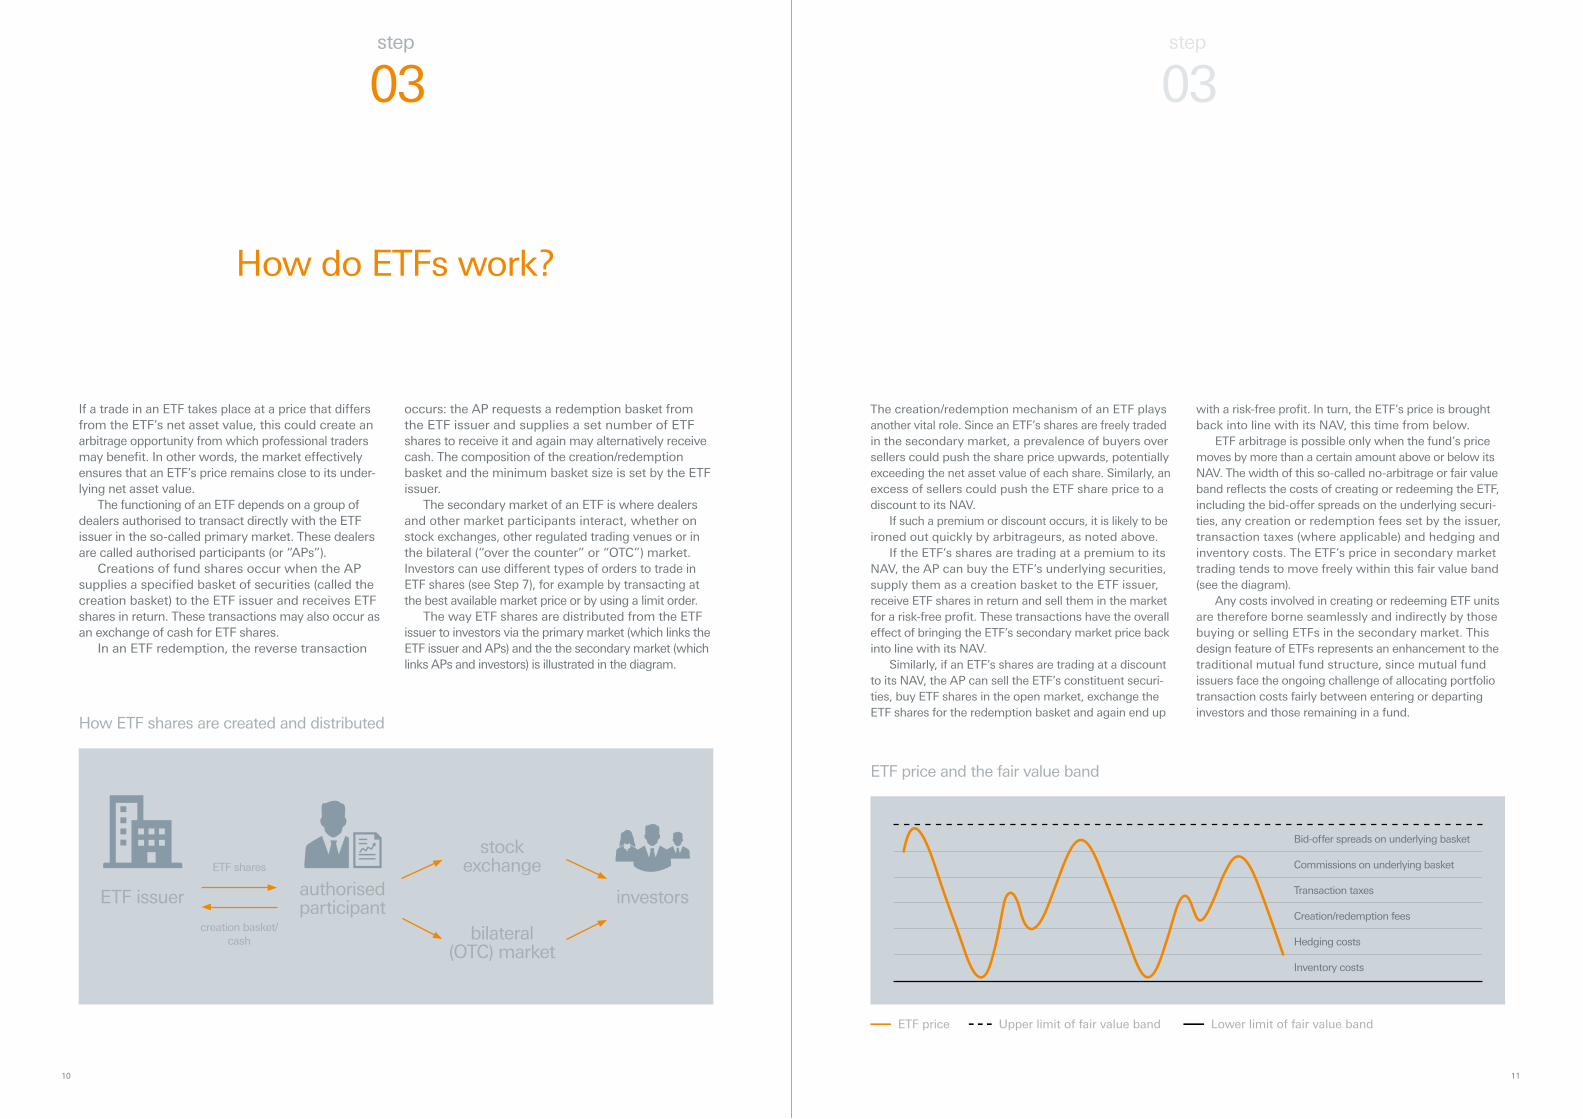
If a trade in an ETF takes place at a price that differs from the ETF’s net asset value, this could create an arbitrage opportunity from which professional traders may benefit. In other words, the market effectively ensures that an ETF’s price remains close to its under-lying net asset value.
The functioning of an ETF depends on a group of dealers authorised to transact directly with the ETF issuer in the so-called primary market. These dealers are called authorised participants (or “APs”).
Creations of fund shares occur when the AP supplies a specified basket of securities (called the creation basket) to the ETF issuer and receives ETF shares in return. These transactions may also occur as an exchange of cash for ETF shares.
In an ETF redemption, the reverse transaction
occurs: the AP requests a redemption basket from the ETF issuer and supplies a set number of ETF shares to receive it and again may alternatively receive cash. The composition of the creation/redemption basket and the minimum basket size is set by the ETF issuer.
The secondary market of an ETF is where dealers and other market participants interact, whether on stock exchanges, other regulated trading venues or in the bilateral (“over the counter” or “OTC”) market. Investors can use different types of orders to trade in ETF shares (see Step 7), for example by transacting at the best available market price or by using a limit order.
The way ETF shares are distributed from the ETF issuer to investors via the primary market (which links the ETF issuer and APs) and the the secondary market (which links APs and investors) is illustrated in the diagram.
ETF price Upper limit of fair value band Lower limit of fair value band
ETF price and the fair value band
How ETF shares are created and distributed
Bid-offer spreads on underlying basket
Commissions on underlying basket
Transaction taxes
Creation/redemption fees
Hedging costs
Inventory costs

1312
step
04
step
04
5 Data in this section are from ETFGI.
Equity ETFs (73.6% of global ETP assets under management)
Type of ETF Fund offers access to
Global Global equity markets Regional Equity markets by region (e.g., North America, Europe, Eurozone, Asia-Pacific) Country Individual countries’ equity markets Size Large/Mid/Small-Cap size segments Sector Equity market sectors by country or region
Style Investment styles (e.g., value/growth, dividend strategy)
Themes Emerging markets, Shariah, currency-hedged, portfolio strategies
Special Equity Factor, Core ETF, Strategic Beta
Short/Leveraged Short and/or leveraged daily exposure to underlying index/reference price
Which market segments do ETFs cover?
ETFs offer instant access to a wide range of markets, market segments, strategies and styles.
With nearly 6,000 ETFs and other exchange-traded products in existence worldwide at the end of September 20155, investors have a large selection of ETPs to choose from. These offer global, regional and country asset class exposure, as well as access to sectors, strategies and styles.
Most ETFs (and other ETPs) aim to track, before costs, the return on an index or a particular reference price (such as the price of a commodity or an exchange rate). A few ETFs, called active ETFs, representing 1.1% of global ETP assets under management, dispense with a benchmark and aim to outperform their rivals via manager skill.
Regulatory requirements ensure that the indices followed by index-tracking ETFs are subject to minimum diversification requirements. In many cases, particularly with broad market ETFs, the index underlying the fund may include thousands of shares or bonds.
ETFs‘ ability to provide low-cost, flexible, one-stop exposure to different asset classes makes them an increasingly popular tool in the construction of long-term portfolios and savings plans. ETFs’ tradeability also ensures their suitability for shorter-term, tactical asset allocation changes.
By asset class, the major categories of exchange- traded product are as follows:
Commodity ETPs (4.7% of global ETP assets under management)
Other ETPs (3.8% of global ETP assets under management)
Fixed Income ETFs (17.9% of global ETP assets under management)
Type of ETF Fund offers access to
Global Global fixed income markets Regional Fixed income markets by region (e.g., Europe, Eurozone, Asia-Pacific, Emerging Markets) Government Bonds issued by governments Aggregate Bonds in aggregate (e.g., governments, agencies, corporates) Corporate Bonds issued by corporations
Covered Covered (securitised) bonds
Themes Inflation-linked, interest rate-hedged, currency-hedged
Cash Money market, short-maturity government bonds
Credit Credit spreads via indices of credit default swaps (CDS)
Short/Leveraged Short and/or leveraged daily exposure to underlying index/reference price
Type of ETF Fund offers access to
Roll-optimised Yield Roll-optimised commodity indices (“Optimum Yield“)
Precious Metal Individual precious metals and precious metal baskets exchange-traded commodities (ETCs) Energy Individual energy commodity and energy commodity basket ETCs Agricultural Individual agricultural commodity and agricultural commodity basket ETCs Industrial Metal Individual industrial metal and industrial metal basket ETCs
Diversified Broad commodity index and commodity strategy ETFs and ETCs
Type of ETF Fund offers access to
Alternatives Indices of hedge funds, private equity funds, real estate investment trusts and infrastructure equities
Multi-asset Diversified portfolios of ETFs/ETPs
Source: Deutsche AM, ETFGI. Market share data as of 30 June 2016.
1514
step
05
step
05
The types of indices tracked by ETFs vary in design, making index due diligence essential.
Almost all ETFs are index trackers, meaning that a fund’s performance objective is to replicate, as closely as possible (before product fees), the return on the index specified as the ETF’s benchmark.
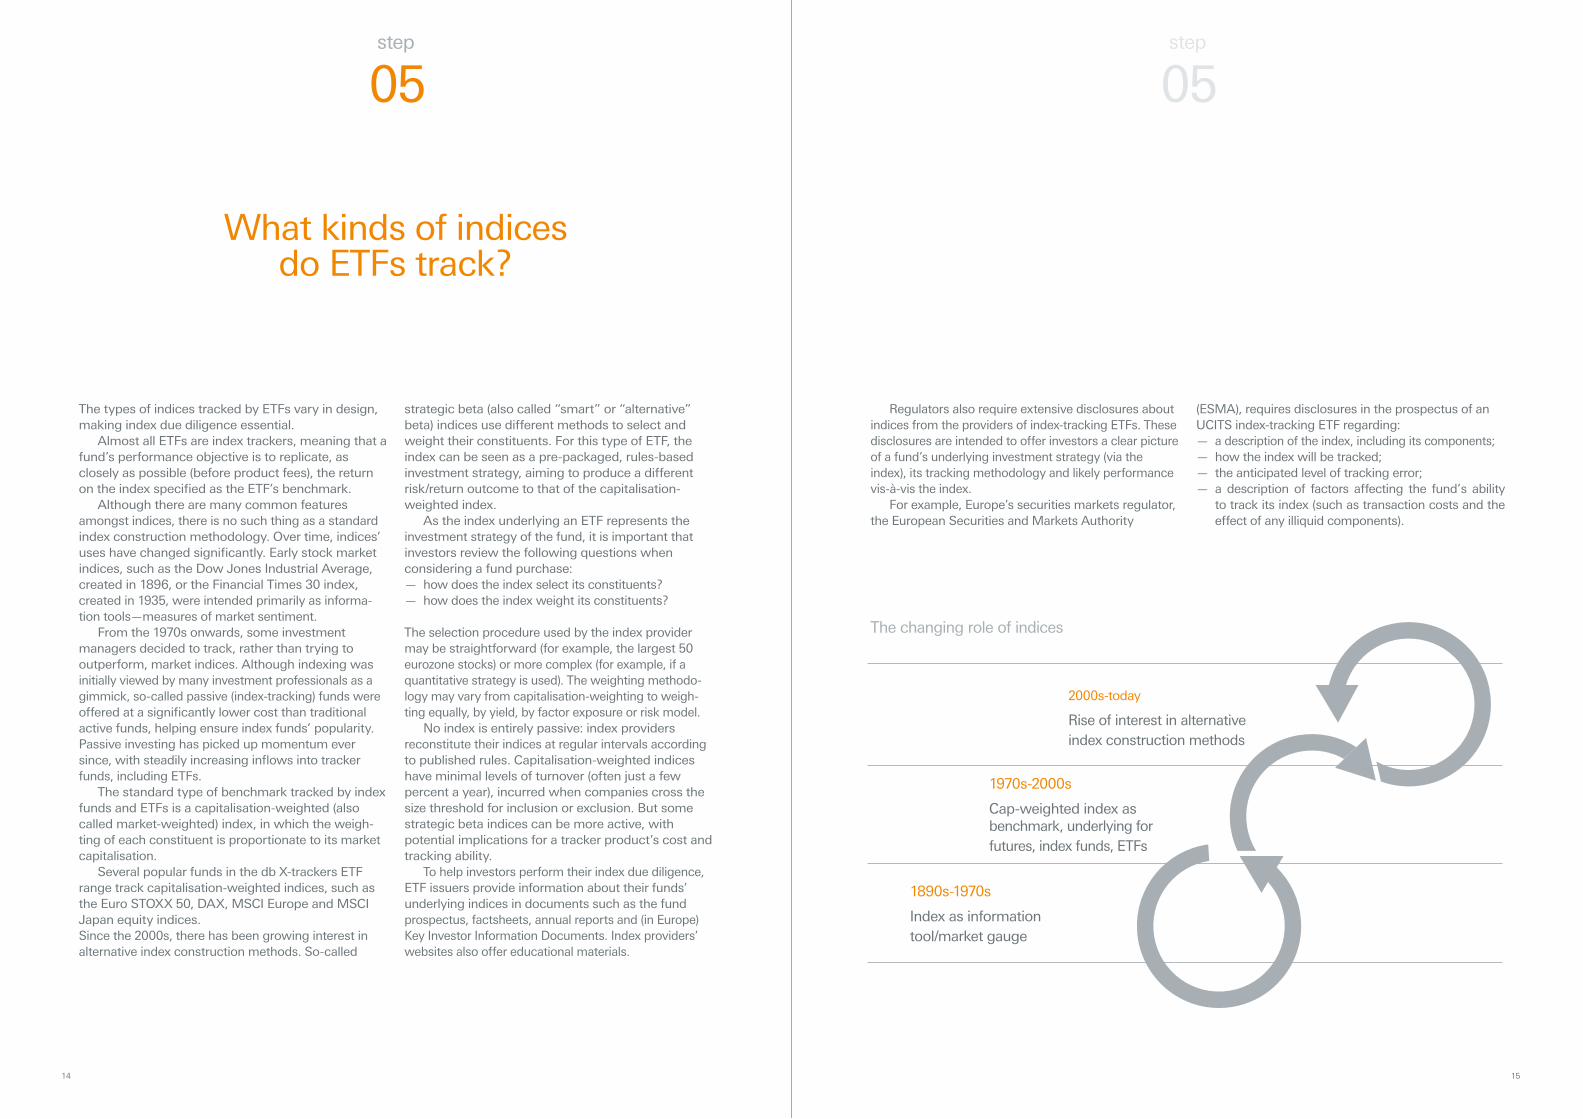
Although there are many common features amongst indices, there is no such thing as a standard index construction methodology. Over time, indices’ uses have changed significantly. Early stock market indices, such as the Dow Jones Industrial Average, created in 1896, or the Financial Times 30 index, created in 1935, were intended primarily as informa-tion tools—measures of market sentiment.
From the 1970s onwards, some investment managers decided to track, rather than trying to outperform, market indices. Although indexing was initially viewed by many investment professionals as a gimmick, so-called passive (index-tracking) funds were offered at a significantly lower cost than traditional active funds, helping ensure index funds’ popularity. Passive investing has picked up momentum ever since, with steadily increasing inflows into tracker funds, including ETFs.
The standard type of benchmark tracked by index funds and ETFs is a capitalisation-weighted (also called market-weighted) index, in which the weigh-ting of each constituent is proportionate to its market capitalisation.
Several popular funds in the db X-trackers ETF range track capitalisation-weighted indices, such as the Euro STOXX 50, DAX, MSCI Europe and MSCI Japan equity indices. Since the 2000s, there has been growing interest in alternative index construction methods. So-called
strategic beta (also called “smart” or “alternative” beta) indices use different methods to select and weight their constituents. For this type of ETF, the index can be seen as a pre-packaged, rules-based investment strategy, aiming to produce a different risk/return outcome to that of the capitalisation- weighted index.
As the index underlying an ETF represents the investment strategy of the fund, it is important that investors review the following questions when considering a fund purchase:
— how does the index select its constituents? — how does the index weight its constituents?
The selection procedure used by the index provider may be straightforward (for example, the largest 50 eurozone stocks) or more complex (for example, if a quantitative strategy is used). The weighting methodo-logy may vary from capitalisation-weighting to weigh-ting equally, by yield, by factor exposure or risk model.
No index is entirely passive: index providers reconstitute their indices at regular intervals according to published rules. Capitalisation-weighted indices have minimal levels of turnover (often just a few percent a year), incurred when companies cross the size threshold for inclusion or exclusion. But some strategic beta indices can be more active, with potential implications for a tracker product’s cost and tracking ability.
To help investors perform their index due diligence, ETF issuers provide information about their funds’ underlying indices in documents such as the fund prospectus, factsheets, annual reports and (in Europe) Key Investor Information Documents. Index providers’ websites also offer educational materials.
What kinds of indices do ETFs track?
Regulators also require extensive disclosures about indices from the providers of index-tracking ETFs. These disclosures are intended to offer investors a clear picture of a fund’s underlying investment strategy (via the index), its tracking methodology and likely performance vis-à-vis the index.
For example, Europe’s securities markets regulator, the European Securities and Markets Authority
(ESMA), requires disclosures in the prospectus of an UCITS index-tracking ETF regarding:
— a description of the index, including its components; — how the index will be tracked; — the anticipated level of tracking error; — a description of factors affecting the fund’s ability to track its index (such as transaction costs and the effect of any illiquid components).
1890s-1970s
Index as information tool/market gauge
1970s-2000s
Cap-weighted index as benchmark, underlying for futures, index funds, ETFs
2000s-today
Rise of interest in alternative index construction methods
The changing role of indices

1716
step
06
ETFs have a significant cost advantage over many traditional collective investment vehicles. For a full comparison with other products, investors should consider their total ETF holding costs.
The costs incurred by an investor in ETFs fall into two principal categories: recurring (ongoing), deducted daily from the fund’s net assets and usually expressed on an annual basis6; and one-off transac-tion charges, incurred when buying and selling the ETF.
For a long-term holder of an ETF, the annual charges levied by the ETF issuer are of primary importance. For more frequent traders, one-off transaction charges may be more relevant.
ETFs still have a considerable cost advantage over actively managed mutual funds, a key reason for ETFs’ growing market share.
At the end of 2014, the asset-weighted average
total expense ratio for US index-tracking equity ETFs was around a third that of equity mutual funds, while the asset-weighted average total expense ratio for US index-tracking fixed income ETFs was less than a half that of fixed income mutual funds.
In Europe, the cost differential in favour of ETFs is even starker. Based on end-2014 data, the asset- weighted average total expense ratio for index- tracking equity ETFs was 22% that of equity mutual funds, while the asset-weighted average total expense ratio for index-tracking fixed income ETFs was 32% that of fixed income mutual funds.
In many countries, mutual fund issuers also levy an initial charge (called a front-end load or sales fee) on purchasers, and sometimes a redemption fee on fund sellers. This represents an additional cost headwind for mutual fund holders.
Category
US index-tracking ETFs (bp)
US Mutu-al Funds(bp)
ETF TERas %MutualFund TER
European index-tracking ETFs (bp)
European Mutual Funds (bp)
ETF TER as %Mutual Fund TER
Equity 24 70 34 35 160 22
Fixed Income 23 57 40 24 75 32
step
06
What do ETFs cost?
Investors should consider the total cost of ownership over their likely holding period when assessing an ETF purchase. The total cost includes the tracking difference created by the ETF’s total expense ratio, the efficiency of the portfolio management and tax considerations, returns from securities lending or swap enhancements, as well as the bid-offer spread on the units. The tracking error is best understood as the consistency of the fund’s tracking of the benchmark index.
In the example below we assume that an investor buys an ETF with a TER of 15 basis points (bps) and holds it for a year, paying 5bps dealing commission on purchase and 5bps commission on sale. The bid-offer spread is 10bps, half of which is incurred at purchase and half at sale. The total cost of ownership is therefore 35bps.
Investors in ETFs face transaction costs when buying and selling fund shares. Transaction costs include the bid-offer spread on the ETF and (where applicable) brokerage commissions and transaction taxes.
The bid-offer spread on an ETF reflects the liquidity of the underlying securities held by the fund. For example, the secondary market spread on an ETF tracking a popular equity index is likely to be lower than the spread on an ETF tracking an index of emerging market equities or corporate bonds.
For the most liquid ETFs and in normal market conditions, bid-offer spreads can often be a fraction of the average bid-offer spread on the underlying securities held by the fund. This is because popular ETFs attract a great deal of trading activity in their own right.
Costs Basis points
Total Expense Ratio (ongoing charges) 15 Bid/offer spread 10 Brokerage commission 10 Tracking error 0 Total 35
Source: Deutsche AM, for illustrative purposes only.
Source: Deutsche Bank 2015 ETF Annual Review & Outlook, US Investment Company Institute, Morningstar, data as of end-2014 (October 2015 for Morningstar data on European mutual funds). Morningstar European Equity Mutual Fund sample includes Europe Equity Large Cap, Europe Equity Small/Mid cap, Other Europe Equity. Morningstar European Fixed Income Mutual Fund sample includes Euro Fixed Income, Other Europe Fixed Income.6 Ongoing annual charges for mutual funds, including ETFs, are usually measured by means of a total expense ratio (or „TER“). For its ETF range, Deutsche Asset Management uses the term „All-in Fee“) to express recurring annual charges. Please see page 27 for clarification of the components of the All-in Fee. Europe‘s UCITS funds are required by regulators to quote a figure for ongoing charges, which is broadly equivalent to the TER.
Basis point = bp
Asset-weighted average total expense ratios: ETFs and mutual funds
Example: total cost of ownership
1918
step
07
Investors can gain exposure to a wide range of asset classes and strategies via ETFs listed on stock exchanges.
Investors in many markets have access to a wide variety of ETFs on their regional exchanges. For example, as of June 2016, the US and European ETF markets had over 1,500 listings each.
An ETF may be cross-listed, enabling greater access and liquidity. A cross-listed ETF has listings on multiple exchanges, often with share classes denominated in different currencies. For example, db x-trackers Euro STOXX 50® UCITS ETF (DR) is listed on the Borsa Italiana and German Xetra exchanges in euros, the SIX-Swiss exchange in Swiss francs and the London Stock Exchange in pounds sterling.
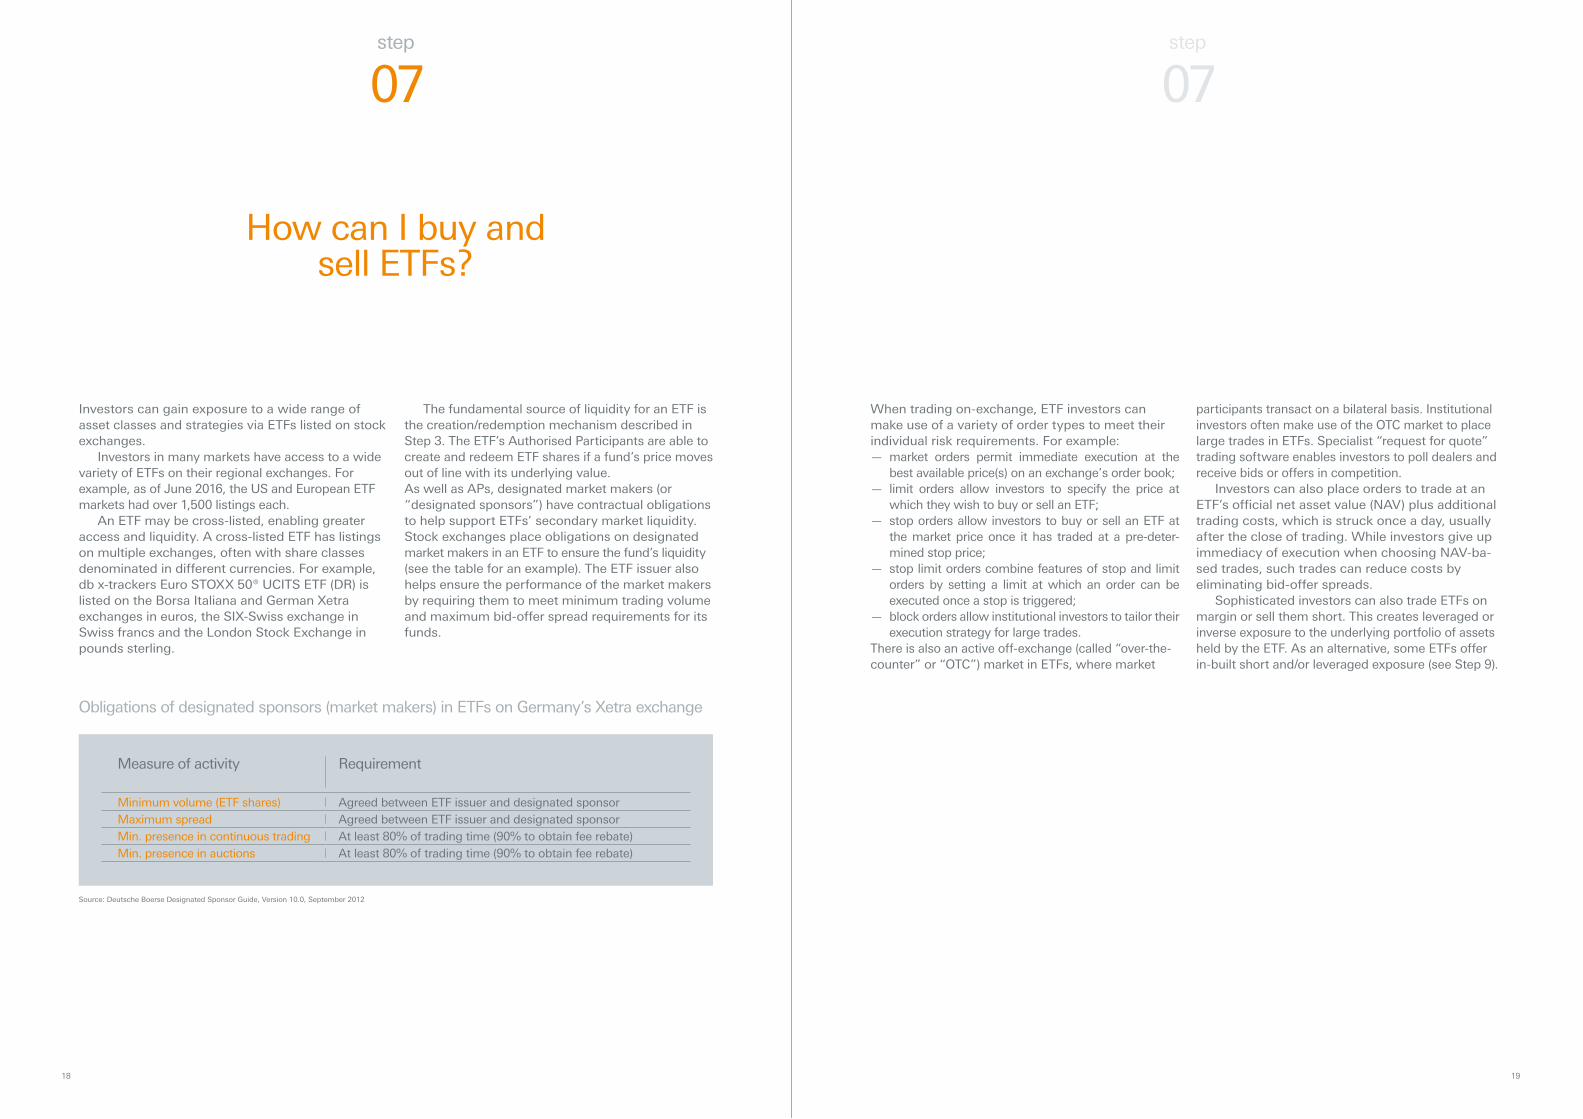
The fundamental source of liquidity for an ETF is the creation/redemption mechanism described in Step 3. The ETF’s Authorised Participants are able to create and redeem ETF shares if a fund’s price moves out of line with its underlying value.As well as APs, designated market makers (or “designated sponsors”) have contractual obligations to help support ETFs’ secondary market liquidity. Stock exchanges place obligations on designated market makers in an ETF to ensure the fund’s liquidity (see the table for an example). The ETF issuer also helps ensure the performance of the market makers by requiring them to meet minimum trading volume and maximum bid-offer spread requirements for its funds.
step
07
How can I buy and sell ETFs?
When trading on-exchange, ETF investors can make use of a variety of order types to meet their individual risk requirements. For example:
— market orders permit immediate execution at the best available price(s) on an exchange’s order book;
— limit orders allow investors to specify the price at which they wish to buy or sell an ETF;
— stop orders allow investors to buy or sell an ETF at the market price once it has traded at a pre-deter-mined stop price;
— stop limit orders combine features of stop and limit orders by setting a limit at which an order can be executed once a stop is triggered;
— block orders allow institutional investors to tailor their execution strategy for large trades.
There is also an active off-exchange (called “over-the-counter” or “OTC”) market in ETFs, where market
Obligations of designated sponsors (market makers) in ETFs on Germany’s Xetra exchange
Measure of activity Requirement
Minimum volume (ETF shares) Agreed between ETF issuer and designated sponsor Maximum spread Agreed between ETF issuer and designated sponsor Min. presence in continuous trading At least 80% of trading time (90% to obtain fee rebate) Min. presence in auctions At least 80% of trading time (90% to obtain fee rebate)
Source: Deutsche Boerse Designated Sponsor Guide, Version 10.0, September 2012
participants transact on a bilateral basis. Institutional investors often make use of the OTC market to place large trades in ETFs. Specialist “request for quote” trading software enables investors to poll dealers and receive bids or offers in competition.
Investors can also place orders to trade at an ETF’s official net asset value (NAV) plus additional trading costs, which is struck once a day, usually after the close of trading. While investors give up immediacy of execution when choosing NAV-ba-sed trades, such trades can reduce costs by eliminating bid-offer spreads.
Sophisticated investors can also trade ETFs on margin or sell them short. This creates leveraged or inverse exposure to the underlying portfolio of assets held by the ETF. As an alternative, some ETFs offer in-built short and/or leveraged exposure (see Step 9).

2120
ETFs can be considered a powerful tool for use in portfolio construction. A single ETF enables inves-tors to buy the entire market, a market segment or strategy with only one trade, allowing for instant exposure to a diversified portfolio of underlying securities.
While ETFs have a wide range of uses, including serving as a tool for tactical asset allocation changes and permitting sophisticated investors to take short-term views on market movements, they are often used core holdings in long-term savings plans, where they function as low-cost building blocks in the portfolio construction process.
For example, three ETFs in the db X-trackers range collectively provide comprehensive coverage of global
ETFs may be used in combination with actively managed funds. Many investors use passive, index-based funds as the core of a portfolio, where they aim to generate the return on the asset class as a whole (often referred to as asset class “beta”). Actively managed funds are chosen to provide alpha (excess returns derived from manager skill).
For investors interested in tactical asset allocation changes, Deutsche AM’s monthly Asset Allocation Traffic Light, available at https://etf.deutsche.am.com, provides investors with easy-to-use information on 28 equity, bond and commodity market sectors. Via three columns of colour-coded symbols, the Traffic Light illustrates:
equity and bond markets (see table below). The MSCI World and MSCI Emerging market indices include, between them, nearly 2,500 companies from 58 developed and developing markets. The Barclays Global Aggregate Bond index includes nearly 17,000 fixed rate bonds from investment-grade issuers in 72 countries.
At a more granular level, ETFs offer access to common types of securities within individual asset classes. In the table at the top of page 21 we show three ETFs offering exposure to popular segments of the global fixed income market: global sovereign bonds, higher-yielding Eurozone sovereign bonds and liquid euro-denominated corporate bonds.
Increasingly, investors choose to combine traditional asset class beta and manager alpha with strategic beta. Strategic beta is a term for rules-based strategies, offered in the form of an index, with risk-return characteristics that differ from those of the broad market. The db X-trackers ETF range includes a number of funds offering access to strategic beta, such as dividend strategy ETFs and equity factor ETFs.
— how markets performed in the previous month; — what was the level of investor demand in the previous month (via ETF flows into or out of the respective market sectors);
— what relative price movements Deutsche AM’s CIO Office forecasts for the sectors over the next 1-3 months.
step
08
step
08
Creating ETF portfolios
db X-trackers ETF
Countries in Index
Number of Constituents
Access to
Index YieldOngoing charges/TER p.a.
db x-trackers MSCI World Index UCITS ETF (DR)
32 1,639 Global Developed Market Equities 2.57% 0.19%
db x-trackers MSCI Emerging Markets Index UCITS ETF
27 834 Global Emerging Market Equities 2.63% 0.65%
db x-trackers Barclays Global Aggregate Bond UCITS ETF
74 17,461Global invest-ment grade fixed rate bonds
1.10% 0.30%
db X-trackers ETF
Countries in Index
Number of Constituents
Access to
Index YieldOngoing charges/TER p.a.
db x-trackers Global Sovereign UCITS ETF (EUR)
22 938 Global Sovereign bonds 0.52% 0.25%
db x-trackers iBoxx Sovereigns Eurozone Yield Plus UCITS ETF
5 147Higher-yielding EurozoneSovereign bonds
0.92% 0.15%
db x-trackers iBoxx EUR Liquid Corporate UCITS ETF
14 100Liquid euro-denominated Corporate bonds
0.46% 0.20%
Broad market access via equity and bond market ETFs Changing approaches to asset allocation
Access to fixed income market segments via ETFs
Source: Deutsche AM.
Portfolio
Returns
Portfolio
Returns
Manager
Alpha
Asset Class
Beta
Asset Class
Beta
Manager
Alpha
Strategic
Beta
— Actively managed funds
— Individual securities
— Dividend strategy ETFs — Equity factor ETFs — Strategic beta ETFs
— Broad market ETFs — Regional/Country ETFs — Market segment ETFs — Sector ETFs+
Source: Deutsche AM, data as of 29 July 2016.
Source: Deutsche AM, data as of 29 July 2016.
2322
step
09
step
09
Short and leveraged ETFs
Short and leveraged ETFs offer inverse or geared (leveraged) exposure to an underlying index by tracking a daily short or daily leveraged version of the index.
A daily short index provides the inverse daily performance of the corresponding long index (with dividends reinvested), subject to an adjustment for interest rates to mirror the effect of cash movements. This interest adjustment reflects both the interest earned on uninvested cash and proceeds from the short sale, and the cost of borrowing the index constituents to provide the short exposure.
A daily leveraged long (or leveraged short) index provides two times the daily performance (or two times the inverse daily performance) of the corres-ponding long index, also subject to an interest adjustment to mirror the effect of the cash movements involved in creating the leveraged long or leveraged short exposure.
Short and leveraged ETFs are a type of exchan-ge-traded fund designed for use by experienced
and financially sophisticated investors. Short ETFs can be used by investors as a way to profit from, or to hedge their exposure to, falling markets. Levera-ged ETFs can be used by investors to amplify exposure (or inverse exposure) to an index, whether for return or risk management purposes.
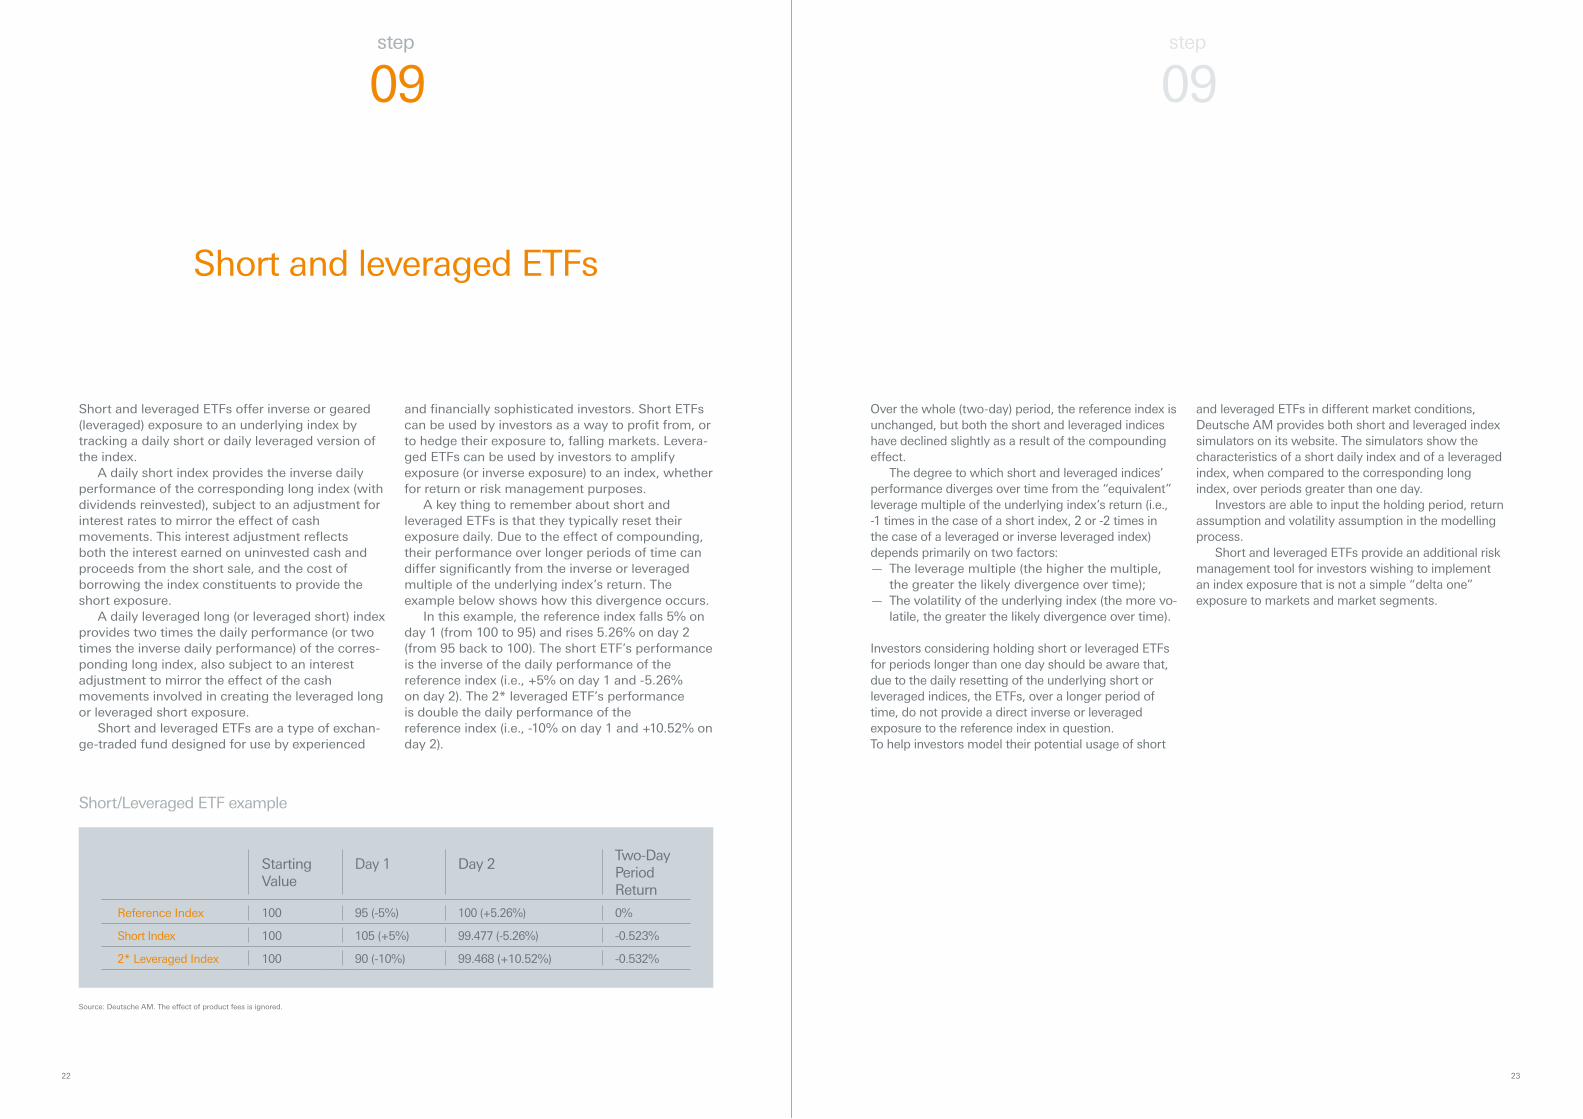
A key thing to remember about short and leveraged ETFs is that they typically reset their exposure daily. Due to the effect of compounding, their performance over longer periods of time can differ significantly from the inverse or leveraged multiple of the underlying index’s return. The example below shows how this divergence occurs.
In this example, the reference index falls 5% on day 1 (from 100 to 95) and rises 5.26% on day 2 (from 95 back to 100). The short ETF’s performance is the inverse of the daily performance of the reference index (i.e., +5% on day 1 and -5.26% on day 2). The 2* leveraged ETF’s performance is double the daily performance of the reference index (i.e., -10% on day 1 and +10.52% on day 2).
Starting Value
Day 1
Day 2
Two-Day Period Return
Reference Index 100 95 (-5%) 100 (+5.26%) 0%
Short Index 100 105 (+5%) 99.477 (-5.26%) -0.523%
2* Leveraged Index 100 90 (-10%) 99.468 (+10.52%) -0.532%
Short/Leveraged ETF example
Source: Deutsche AM. The effect of product fees is ignored.
Over the whole (two-day) period, the reference index is unchanged, but both the short and leveraged indices have declined slightly as a result of the compounding effect.
The degree to which short and leveraged indices’ performance diverges over time from the “equivalent” leverage multiple of the underlying index’s return (i.e., -1 times in the case of a short index, 2 or -2 times in the case of a leveraged or inverse leveraged index) depends primarily on two factors:
— The leverage multiple (the higher the multiple, the greater the likely divergence over time);
— The volatility of the underlying index (the more vo-latile, the greater the likely divergence over time).
Investors considering holding short or leveraged ETFs for periods longer than one day should be aware that, due to the daily resetting of the underlying short or leveraged indices, the ETFs, over a longer period of time, do not provide a direct inverse or leveraged exposure to the reference index in question. To help investors model their potential usage of short
and leveraged ETFs in different market conditions, Deutsche AM provides both short and leveraged index simulators on its website. The simulators show the characteristics of a short daily index and of a leveraged index, when compared to the corresponding long index, over periods greater than one day.
Investors are able to input the holding period, return assumption and volatility assumption in the modelling process.
Short and leveraged ETFs provide an additional risk management tool for investors wishing to implement an index exposure that is not a simple “delta one” exposure to markets and market segments.
2524
step
10
step
10
How to reduce interest rate and currency risks?
Interest rate-hedged and currency-hedged ETFs enable investors to receive the return from an underlying index net of interest rate or currency risk, respectively.
Interest rate-hedged ETFs allow investors to reduce the interest rate risk of their fixed income investments, hedging during a rising rate environment and leaving exposure mainly to the credit component of the ETF’s underlying fixed income exposure. Currency-hedged ETFs give investors access to international equity and bond market returns while minimising foreign currency risk.
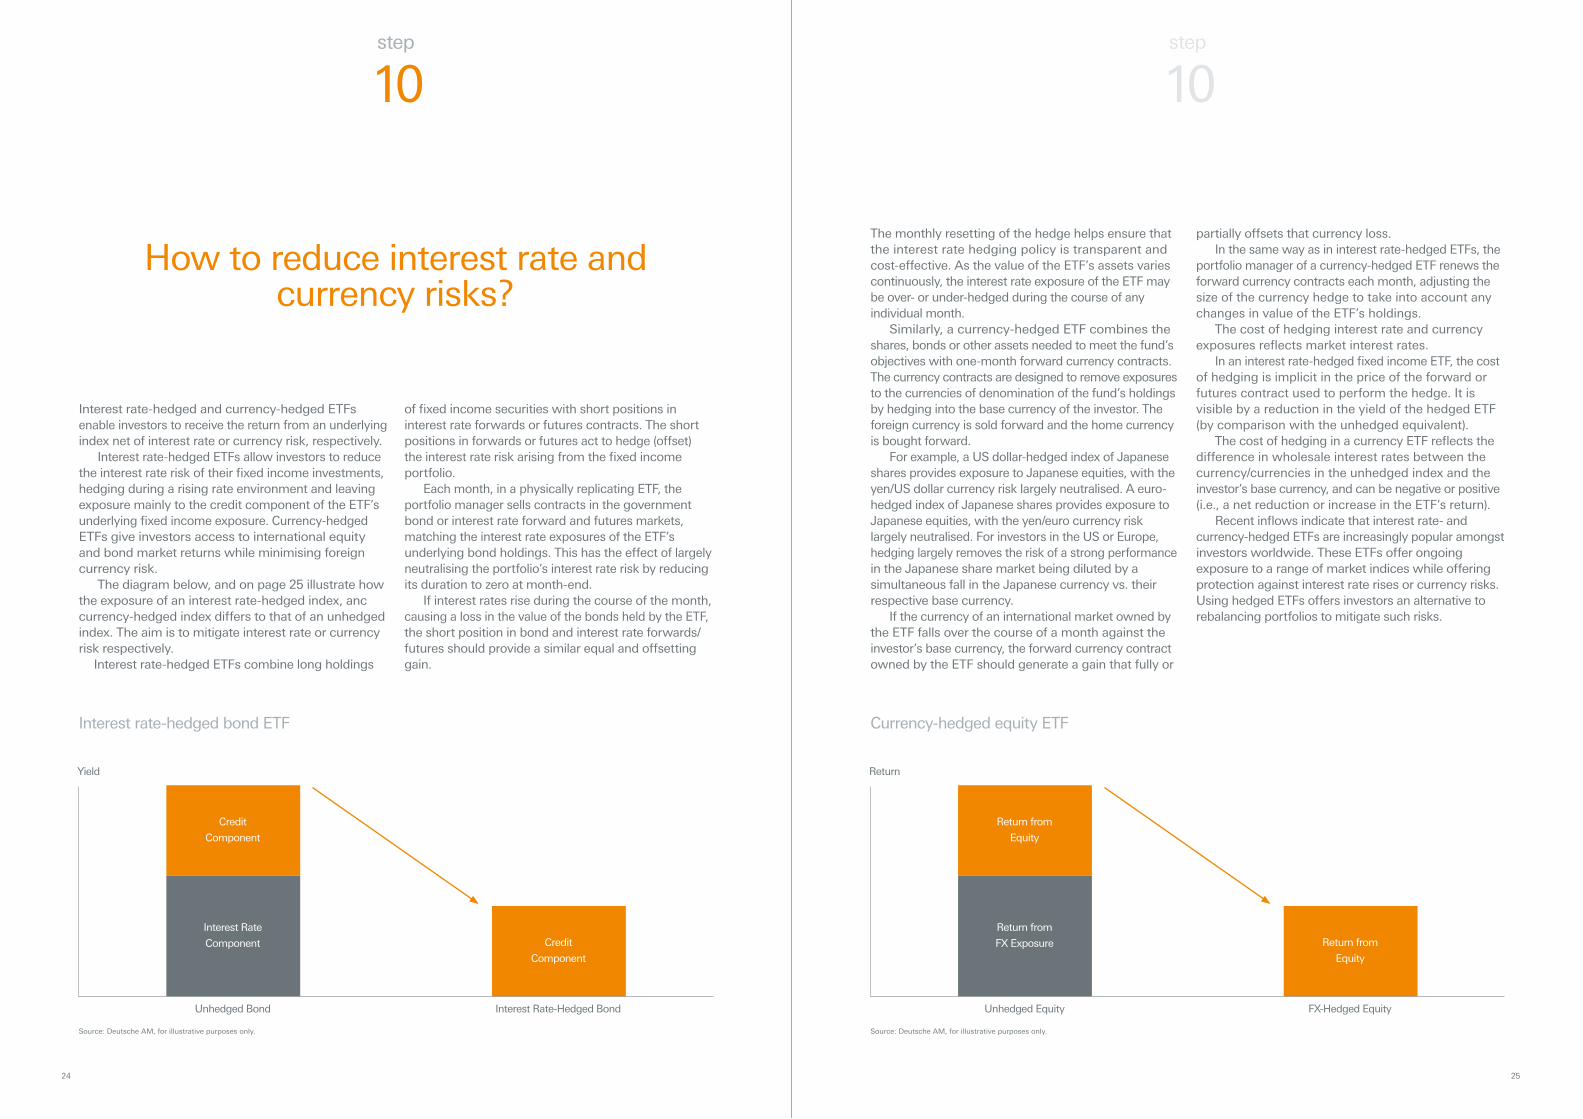
The diagram below, and on page 25 illustrate how the exposure of an interest rate-hedged index, anc currency-hedged index differs to that of an unhedged index. The aim is to mitigate interest rate or currency risk respectively.
Interest rate-hedged ETFs combine long holdings
of fixed income securities with short positions in interest rate forwards or futures contracts. The short positions in forwards or futures act to hedge (offset) the interest rate risk arising from the fixed income portfolio.
Each month, in a physically replicating ETF, the portfolio manager sells contracts in the government bond or interest rate forward and futures markets, matching the interest rate exposures of the ETF’s underlying bond holdings. This has the effect of largely neutralising the portfolio’s interest rate risk by reducing its duration to zero at month-end.
If interest rates rise during the course of the month, causing a loss in the value of the bonds held by the ETF, the short position in bond and interest rate forwards/futures should provide a similar equal and offsetting gain.
The monthly resetting of the hedge helps ensure that the interest rate hedging policy is transparent and cost-effective. As the value of the ETF’s assets varies continuously, the interest rate exposure of the ETF may be over- or under-hedged during the course of any individual month.
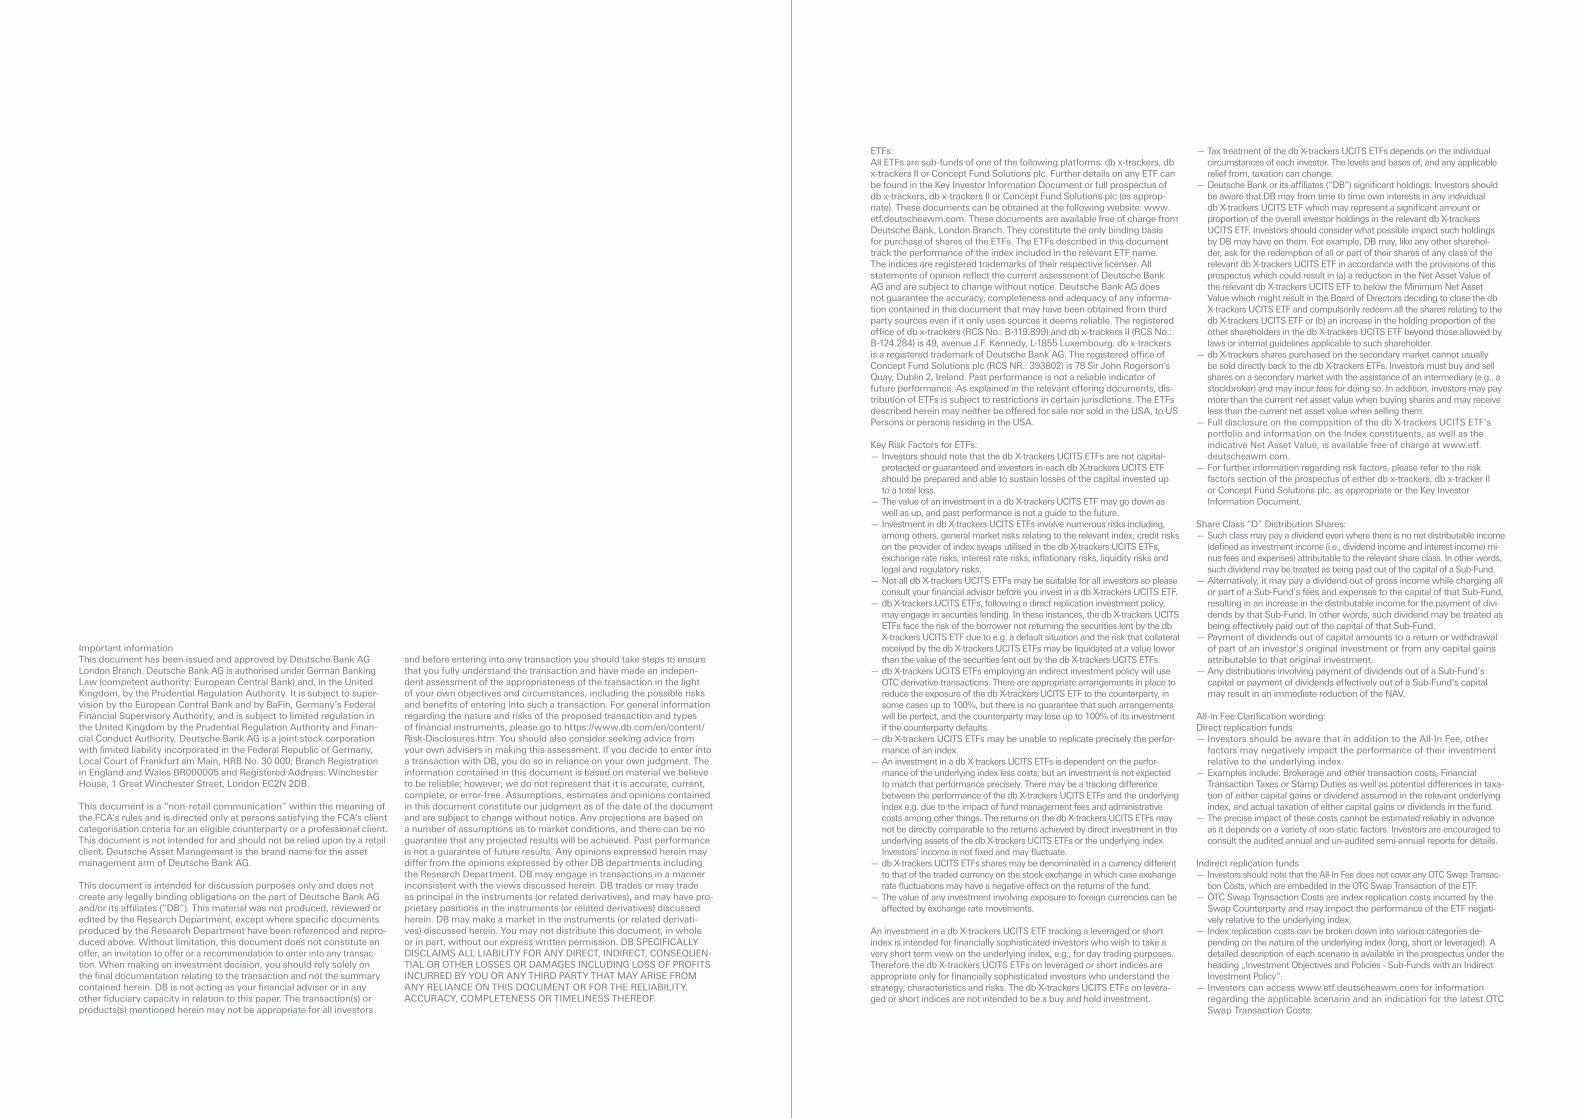
Similarly, a currency-hedged ETF combines the shares, bonds or other assets needed to meet the fund’s objectives with one-month forward currency contracts. The currency contracts are designed to remove exposures to the currencies of denomination of the fund’s holdings by hedging into the base currency of the investor. The foreign currency is sold forward and the home currency is bought forward.
For example, a US dollar-hedged index of Japanese shares provides exposure to Japanese equities, with the yen/US dollar currency risk largely neutralised. A euro- hedged index of Japanese shares provides exposure to Japanese equities, with the yen/euro currency risk largely neutralised. For investors in the US or Europe, hedging largely removes the risk of a strong performance in the Japanese share market being diluted by a simultaneous fall in the Japanese currency vs. their respective base currency.
If the currency of an international market owned by the ETF falls over the course of a month against the investor’s base currency, the forward currency contract owned by the ETF should generate a gain that fully or
partially offsets that currency loss. In the same way as in interest rate-hedged ETFs, the
portfolio manager of a currency-hedged ETF renews the forward currency contracts each month, adjusting the size of the currency hedge to take into account any changes in value of the ETF’s holdings.
The cost of hedging interest rate and currency exposures reflects market interest rates.
In an interest rate-hedged fixed income ETF, the cost of hedging is implicit in the price of the forward or futures contract used to perform the hedge. It is visible by a reduction in the yield of the hedged ETF (by comparison with the unhedged equivalent).
The cost of hedging in a currency ETF reflects the difference in wholesale interest rates between the currency/currencies in the unhedged index and the investor’s base currency, and can be negative or positive (i.e., a net reduction or increase in the ETF’s return).
Recent inflows indicate that interest rate- and currency-hedged ETFs are increasingly popular amongst investors worldwide. These ETFs offer ongoing exposure to a range of market indices while offering protection against interest rate rises or currency risks. Using hedged ETFs offers investors an alternative to rebalancing portfolios to mitigate such risks.
Portfolio Re-
turns
Portfolio Re-
turns
Credit
Component
Return from
Equity
Interest Rate
Component
Return from
FX Exposure
Unhedged Bond Unhedged Equity
Yield Return
Credit
Component
Return from
Equity
Interest Rate-Hedged Bond FX-Hedged Equity
Interest rate-hedged bond ETF Currency-hedged equity ETF
Source: Deutsche AM, for illustrative purposes only. Source: Deutsche AM, for illustrative purposes only.
— Tax treatment of the db X-trackers UCITS ETFs depends on the individual circumstances of each investor. The levels and bases of, and any applicable relief from, taxation can change. — Deutsche Bank or its affiliates (“DB”) significant holdings: Investors should be aware that DB may from time to time own interests in any individual db X-trackers UCITS ETF which may represent a significant amount or proportion of the overall investor holdings in the relevant db X-trackers UCITS ETF. Investors should consider what possible impact such holdings by DB may have on them. For example, DB may, like any other sharehol-der, ask for the redemption of all or part of their shares of any class of the relevant db X-trackers UCITS ETF in accordance with the provisions of this prospectus which could result in (a) a reduction in the Net Asset Value of the relevant db X-trackers UCITS ETF to below the Minimum Net Asset Value which might result in the Board of Directors deciding to close the db X-trackers UCITS ETF and compulsorily redeem all the shares relating to the db X-trackers UCITS ETF or (b) an increase in the holding proportion of the other shareholders in the db X-trackers UCITS ETF beyond those allowed by laws or internal guidelines applicable to such shareholder. — db X-trackers shares purchased on the secondary market cannot usually be sold directly back to the db X-trackers ETFs. Investors must buy and sell shares on a secondary market with the assistance of an intermediary (e.g., a stockbroker) and may incur fees for doing so. In addition, investors may pay more than the current net asset value when buying shares and may receive less than the current net asset value when selling them. — Full disclosure on the composition of the db X-trackers UCITS ETF’s portfolio and information on the Index constituents, as well as the indicative Net Asset Value, is available free of charge at www.etf.deutscheawm.com. — For further information regarding risk factors, please refer to the risk factors section of the prospectus of either db x-trackers, db x-tracker II or Concept Fund Solutions plc. as appropriate or the Key Investor Information Document.
Share Class “D” Distribution Shares: — Such class may pay a dividend even where there is no net distributable income (defined as investment income (i.e., dividend income and interest income) mi-nus fees and expenses) attributable to the relevant share class. In other words, such dividend may be treated as being paid out of the capital of a Sub-Fund. — Alternatively, it may pay a dividend out of gross income while charging all or part of a Sub-Fund’s fees and expenses to the capital of that Sub-Fund, resulting in an increase in the distributable income for the payment of divi-dends by that Sub-Fund. In other words, such dividend may be treated as being effectively paid out of the capital of that Sub-Fund. — Payment of dividends out of capital amounts to a return or withdrawal of part of an investor’s original investment or from any capital gains attributable to that original investment. — Any distributions involving payment of dividends out of a Sub-Fund’s capital or payment of dividends effectively out of a Sub-Fund’s capital may result in an immediate reduction of the NAV.
All-in Fee Clarification wording:Direct replication funds
— Investors should be aware that in addition to the All-In Fee, other factors may negatively impact the performance of their investment relative to the underlying index — Examples include: Brokerage and other transaction costs, Financial Transaction Taxes or Stamp Duties as well as potential differences in taxa-tion of either capital gains or dividend assumed in the relevant underlying index, and actual taxation of either capital gains or dividends in the fund. — The precise impact of these costs cannot be estimated reliably in advance as it depends on a variety of non-static factors. Investors are encouraged to consult the audited annual and un-audited semi-annual reports for details.
Indirect replication funds — Investors should note that the All-In Fee does not cover any OTC Swap Transac-tion Costs, which are embedded in the OTC Swap Transaction of the ETF. — OTC Swap Transaction Costs are index replication costs incurred by the Swap Counterparty and may impact the performance of the ETF negati-vely relative to the underlying index. — Index replication costs can be broken down into various categories de-pending on the nature of the underlying index (long, short or leveraged). A detailed description of each scenario is available in the prospectus under the heading „Investment Objectives and Policies - Sub-Funds with an Indirect Investment Policy“. — Investors can access www.etf.deutscheawm.com for information regarding the applicable scenario and an indication for the latest OTC Swap Transaction Costs.
Important informationThis document has been issued and approved by Deutsche Bank AG London Branch. Deutsche Bank AG is authorised under German Banking Law (competent authority: European Central Bank) and, in the United Kingdom, by the Prudential Regulation Authority. It is subject to super-vision by the European Central Bank and by BaFin, Germany’s Federal Financial Supervisory Authority, and is subject to limited regulation in the United Kingdom by the Prudential Regulation Authority and Finan-cial Conduct Authority. Deutsche Bank AG is a joint stock corporation with limited liability incorporated in the Federal Republic of Germany, Local Court of Frankfurt am Main, HRB No. 30 000; Branch Registration in England and Wales BR000005 and Registered Address: Winchester House, 1 Great Winchester Street, London EC2N 2DB.
This document is a “non-retail communication” within the meaning of the FCA‘s rules and is directed only at persons satisfying the FCA’s client categorisation criteria for an eligible counterparty or a professional client. This document is not intended for and should not be relied upon by a retail client. Deutsche Asset Management is the brand name for the asset management arm of Deutsche Bank AG.
This document is intended for discussion purposes only and does not create any legally binding obligations on the part of Deutsche Bank AG and/or its affiliates (“DB”). This material was not produced, reviewed or edited by the Research Department, except where specific documents produced by the Research Department have been referenced and repro-duced above. Without limitation, this document does not constitute an offer, an invitation to offer or a recommendation to enter into any transac-tion. When making an investment decision, you should rely solely on the final documentation relating to the transaction and not the summary contained herein. DB is not acting as your financial adviser or in any other fiduciary capacity in relation to this paper. The transaction(s) or products(s) mentioned herein may not be appropriate for all investors
and before entering into any transaction you should take steps to ensure that you fully understand the transaction and have made an indepen-dent assessment of the appropriateness of the transaction in the light of your own objectives and circumstances, including the possible risks and benefits of entering into such a transaction. For general information regarding the nature and risks of the proposed transaction and types of financial instruments, please go to https://www.db.com/en/content/Risk-Disclosures.htm. You should also consider seeking advice from your own advisers in making this assessment. If you decide to enter into a transaction with DB, you do so in reliance on your own judgment. The information contained in this document is based on material we believe to be reliable; however, we do not represent that it is accurate, current, complete, or error-free. Assumptions, estimates and opinions contained in this document constitute our judgment as of the date of the document and are subject to change without notice. Any projections are based on a number of assumptions as to market conditions, and there can be no guarantee that any projected results will be achieved. Past performance is not a guarantee of future results. Any opinions expressed herein may differ from the opinions expressed by other DB departments including the Research Department. DB may engage in transactions in a manner inconsistent with the views discussed herein. DB trades or may trade as principal in the instruments (or related derivatives), and may have pro-prietary positions in the instruments (or related derivatives) discussed herein. DB may make a market in the instruments (or related derivati-ves) discussed herein. You may not distribute this document, in whole or in part, without our express written permission. DB SPECIFICALLY DISCLAIMS ALL LIABILITY FOR ANY DIRECT, INDIRECT, CONSEQUEN-TIAL OR OTHER LOSSES OR DAMAGES INCLUDING LOSS OF PROFITS INCURRED BY YOU OR ANY THIRD PARTY THAT MAY ARISE FROM ANY RELIANCE ON THIS DOCUMENT OR FOR THE RELIABILITY, ACCURACY, COMPLETENESS OR TIMELINESS THEREOF.
ETFs: All ETFs are sub-funds of one of the following platforms: db x-trackers, db x-trackers II or Concept Fund Solutions plc. Further details on any ETF can be found in the Key Investor Information Document or full prospectus of db x-trackers, db x-trackers II or Concept Fund Solutions plc (as approp-riate). These documents can be obtained at the following website: www.etf.deutscheawm.com. These documents are available free of charge from Deutsche Bank, London Branch. They constitute the only binding basis for purchase of shares of the ETFs. The ETFs described in this document track the performance of the index included in the relevant ETF name. The indices are registered trademarks of their respective licenser. All statements of opinion reflect the current assessment of Deutsche Bank AG and are subject to change without notice. Deutsche Bank AG does not guarantee the accuracy, completeness and adequacy of any informa-tion contained in this document that may have been obtained from third party sources even if it only uses sources it deems reliable. The registered office of db x-trackers (RCS No.: B-119.899) and db x-trackers II (RCS No.: B-124.284) is 49, avenue J.F. Kennedy, L-1855 Luxembourg. db x-trackers is a registered trademark of Deutsche Bank AG. The registered office of Concept Fund Solutions plc (RCS NR.: 393802) is 78 Sir John Rogerson’s Quay, Dublin 2, Ireland. Past performance is not a reliable indicator of future performance. As explained in the relevant offering documents, dis-tribution of ETFs is subject to restrictions in certain jurisdictions. The ETFs described herein may neither be offered for sale nor sold in the USA, to US Persons or persons residing in the USA.
Key Risk Factors for ETFs: — Investors should note that the db X-trackers UCITS ETFs are not capital- protected or guaranteed and investors in each db X-trackers UCITS ETF should be prepared and able to sustain losses of the capital invested up to a total loss. — The value of an investment in a db X-trackers UCITS ETF may go down as well as up, and past performance is not a guide to the future. — Investment in db X-trackers UCITS ETFs involve numerous risks including, among others, general market risks relating to the relevant index, credit risks on the provider of index swaps utilised in the db X-trackers UCITS ETFs, exchange rate risks, interest rate risks, inflationary risks, liquidity risks and legal and regulatory risks. — Not all db X-trackers UCITS ETFs may be suitable for all investors so please consult your financial advisor before you invest in a db X-trackers UCITS ETF. — db X-trackers UCITS ETFs, following a direct replication investment policy, may engage in securities lending. In these instances, the db X-trackers UCITS ETFs face the risk of the borrower not returning the securities lent by the db X-trackers UCITS ETF due to e.g. a default situation and the risk that collateral received by the db X-trackers UCITS ETFs may be liquidated at a value lower than the value of the securities lent out by the db X-trackers UCITS ETFs. — db X-trackers UCITS ETFs employing an indirect investment policy will use OTC derivative transactions. There are appropriate arrangements in place to reduce the exposure of the db X-trackers UCITS ETF to the counterparty, in some cases up to 100%, but there is no guarantee that such arrangements will be perfect, and the counterparty may lose up to 100% of its investment if the counterparty defaults. — db X-trackers UCITS ETFs may be unable to replicate precisely the perfor-mance of an index.
— An investment in a db X-trackers UCITS ETFs is dependent on the perfor-mance of the underlying index less costs, but an investment is not expected to match that performance precisely. There may be a tracking difference between the performance of the db X-trackers UCITS ETFs and the underlying index e.g. due to the impact of fund management fees and administrative costs among other things. The returns on the db X-trackers UCITS ETFs may not be directly comparable to the returns achieved by direct investment in the underlying assets of the db X-trackers UCITS ETFs or the underlying index. Investors‘ income is not fixed and may fluctuate.
— db X-trackers UCITS ETFs shares may be denominated in a currency different to that of the traded currency on the stock exchange in which case exchange rate fluctuations may have a negative effect on the returns of the fund. — The value of any investment involving exposure to foreign currencies can be affected by exchange rate movements.
An investment in a db X-trackers UCITS ETF tracking a leveraged or short index is intended for financially sophisticated investors who wish to take a very short term view on the underlying index, e.g., for day trading purposes. Therefore the db X-trackers UCITS ETFs on leveraged or short indices are appropriate only for financially sophisticated investors who understand the strategy, characteristics and risks. The db X-trackers UCITS ETFs on levera-ged or short indices are not intended to be a buy and hold investment.

notes notes

notes

3811
3806
- 1