Understanding Discipline Disparities, Identifying Root ...
58
Understanding Discipline Disparities, Identifying Root Causes & Taking Action Mark McKechnie, MSW (he/him) Senior Consultant on Equity in Student Discipline Center for the Improvement of Student Learning [email protected]. us Office of Superintendent of Public Instruction Chris Reykdal, State Superintendent
Transcript of Understanding Discipline Disparities, Identifying Root ...

Understanding Discipline Disparities, Identifying Root
Causes & Taking ActionMark McKechnie, MSW (he/him)
Senior Consultant on Equity in Student Discipline
Center for the Improvement of Student Learning
Office of Superintendent of Public InstructionChris Reykdal, State Superintendent

At least annually, each school district and public charter school must review data on corrective and disciplinary actions taken against students within each school disaggregated by sex, race, limited-English proficiency (i.e., English language learners), and disability, including students protected under Section 504 of the Rehabilitation Act of 1973 and the Individuals with Disabilities Education Act. This review must include, but is not limited to, short-term suspensions, long-term suspensions, expulsions, and emergency expulsions.
In reviewing this data, each school district or public charter school must determine whether it has disciplined or applied corrective action to a substantially disproportionate number of students within any of the categories identified in this section. If a school district or public charter school finds that it has disciplined or applied corrective action to a substantially disproportionate number of students who are members of one of the categories identified in this section, the school district or charter school must take prompt action to ensure that the disproportion is not the result of discrimination.
WAC 392-190-048

Root Cause Analysis for Discipline Disparities
1. What is Happening?
2. Where, When, Why?
3. What to Do?
4. Is the Plan Working?

1. What is happening?
Discipline Rates
Disaggregated Discipline Rates
Risk Ratio/Relative Rates
Identify Disparities: Over 1.25?

1. What is happening?
• Calculate discipline rates:• District and building levels
• Compare buildings to district average
• Compare district to state averages
• Disaggregate discipline rates by student group at district and building levels based on (for example):• Race/Ethnicity
• ELL status
• Disability status (504 and Special Education eligibility)
• Poverty (Free and Reduced Lunch status)

What are the Disaggregated Discipline Rates?
• In your district?
• In your school?
This Photo by Unknown Author is licensed under CC BY-NC-ND

Risk Ratios: Relative Rate
• A Risk Ratio compares the likelihood of a risk or adverse outcome occurring to members of one group, compared to the members of another group.
• In terms of race/ethnicity, discipline rates for students of color are often compared to rates for white students.
• Risk ratios can also compare the rate for one group to the rate for all others, such as comparing discipline rates for students with disabilities to students without disabilities.

Considering Disparity Using Relative Rates
• A Relative Rate of 1.0 indicates no disparity (the numerator and denominator are equal)
• A RR<1.0 means a group is underrepresented or disparately low
• A RR>1.0 means a group is overrepresented or disparately high

How High is Too High?
•When comparing groups, rates will rarely be equal
•Comparing rates over a longer period of time (2+ years) will help determine whether disparities are more systemic
•Use the Rule of Fifths: Rates indicating low or no
disparity fall within 0.8 - 1.25Using Discipline Data within SWPBIS to Identify and Address Disproportionality: A Guide for School Teams (2014)

Relative Rates in Washington K-12 Schools, 2017-18Student Race/Ethnicity Students Excluded Exclusion
RateRelative Rate
American Indian/Native Alaskan 1,287 8.2% 2.34
Asian 988 1.1% 0.31
Black/African American 4,293 8.5% 2.43
Hispanic/Latino of any race(s) 12,647 4.8% 1.37
Native Hawaiian/Other Pacific Islander 743 5.7% 1.63
Two or More Races 4,542 5.0% 1.43
White (reference group) 21,516 3.5% 1.0
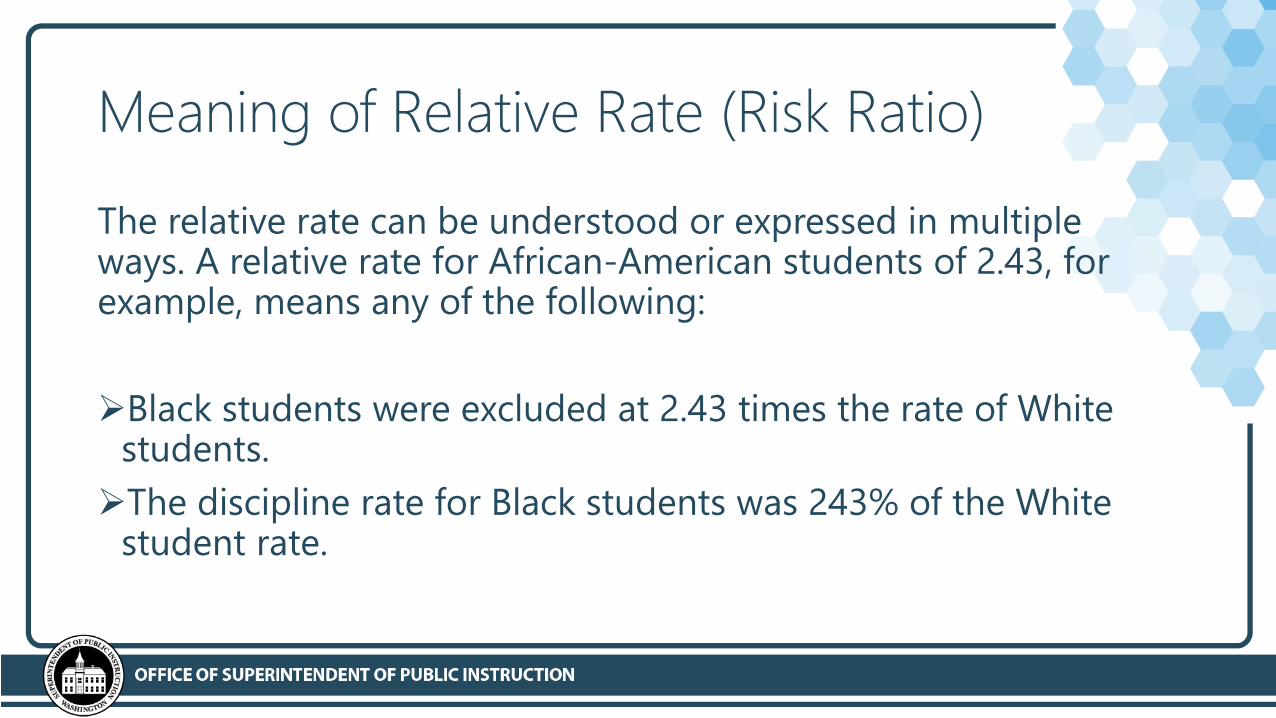
Meaning of Relative Rate (Risk Ratio)
The relative rate can be understood or expressed in multiple ways. A relative rate for African-American students of 2.43, for example, means any of the following:
➢Black students were excluded at 2.43 times the rate of White students.
➢The discipline rate for Black students was 243% of the White student rate.

12/12/2019 | 19
OSPI’s StudentInformation Office has developed this Tableau Dashboard where authorized district staff can access district and school-level discipline data from CEDARS.You can view multi-year trends and see the relative rate calculated for each group.(Example: Race/Ethnicity)

12/12/2019 | 20
Example: Students with and without Disabilities, four year trends and relative rates

12/12/2019 | 21
Racial Disparities Persist When Controlling for Income
RaceEth FRL Status
Relative to White+
Non-FRL
American Indian/Alaskan Native FRL 4.4
Black/African American FRL 4.4
Two or More Races FRL 3.7
White FRL 3.0Native Hawaiian/Other Pacific Islander FRL 2.9
American Indian/Alaskan Native Non-FRL 2.7
Hispanic/Latino of any race(s) FRL 2.6
Black/African American Non-FRL 2.5Native Hawaiian/Other Pacific Islander Non-FRL 1.5
Hispanic/Latino of any race(s) Non-FRL 1.4
Two or More Races Non-FRL 1.2
White Non-FRL 1.0
Asian FRL 1.0
Asian Non-FRL 0.4

12/12/2019 | 22
Racial Disparities Persist when Controlling for Disability
RaceEth SPED Status
Relative to White/Non-
Sped
Black/African American SPED 5.16
American Indian/Alaskan Native SPED 4.43
Two or More Races SPED 3.44
Native Hawaiian/Other Pacific Islander SPED 2.87
Hispanic/Latino of any race(s) SPED 2.72
White SPED 2.66
American Indian/Alaskan Native Non-SPED 2.52
Black/African American Non-SPED 2.35
Native Hawaiian/Other Pacific Islander Non-SPED 1.85
Hispanic/Latino of any race(s) Non-SPED 1.50
Two or More Races Non-SPED 1.42
Asian SPED 1.07
White Non-SPED 1.00
Asian Non-SPED 0.35

A Note About Measuring Progress
While the Relative Rate is important to identify when disparities exist, tracking progress over time necessarily requires looking at multiple disaggregated data points, including trends and changes in:
•Office discipline referrals
•Suspension/expulsion rates
•Duration and cumulative exclusion days
•Relative rates
•Changes year-to-year in the above

2. Problem Analysis
• After identifying disproportionately high rates of discipline for one or more student groups, the next step is to look for potential causes and develop hypotheses on the potential cause(s) of the disparity. There are likely to be multiple contributing factors.
• Note: While discipline is often framed as a problem of student behavior, the variables affecting suspension and expulsion rates are largely under the control of adults (teachers, other staff & administrators), as referral and exclusion are adult decisions.

Relative Rates > 1.25
Vulnerable Decision Points
What
Where
When
Why
Who

Vulnerable Decision Points (VDPs)
• What problem behaviors are associated with disproportionate discipline?
• Where is there disproportionate discipline occurring?
• When is there disproportionate discipline?
• Times of day, days of the week, months of the year
• What motivations are associated with disproportionate discipline?
• Perceived function of problem behavior
• Who is issuing disproportionate discipline?
• Disparities do not indicate racism, but rather contexts where additional supports are
necessary.
Using Discipline Data within SWPBIS to Identify and Address Disproportionality: A Guide for School Teams (2014)

What behaviors are associated with disproportionate discipline?• Do most of the behaviors relate to violence or other safety concerns?
• What percentage of the exclusions are for vague or subjective behaviors?• Disobedience
• Disruption
• Disrespect
• What percentage are for minor (non-violent) behaviors?• Dress code• Language• Contraband (e.g., cell phone)• Multiple minors

12/12/2019 | 28
These are behaviors resulting in suspension and expulsion statewide.Your district may have dashboards set up to view similar data at the district, school, and classroom levels. OSPI will provide access to this dashboard to authorized district personnel, which allows you to view district and school-level data.
Other
Percent of exclusions by behavior

The OSPI discipline dashboard allows your district to view disparities based upon student, group, and behavior type.
Exclusion Incidents for Disruptive Behavior(State)
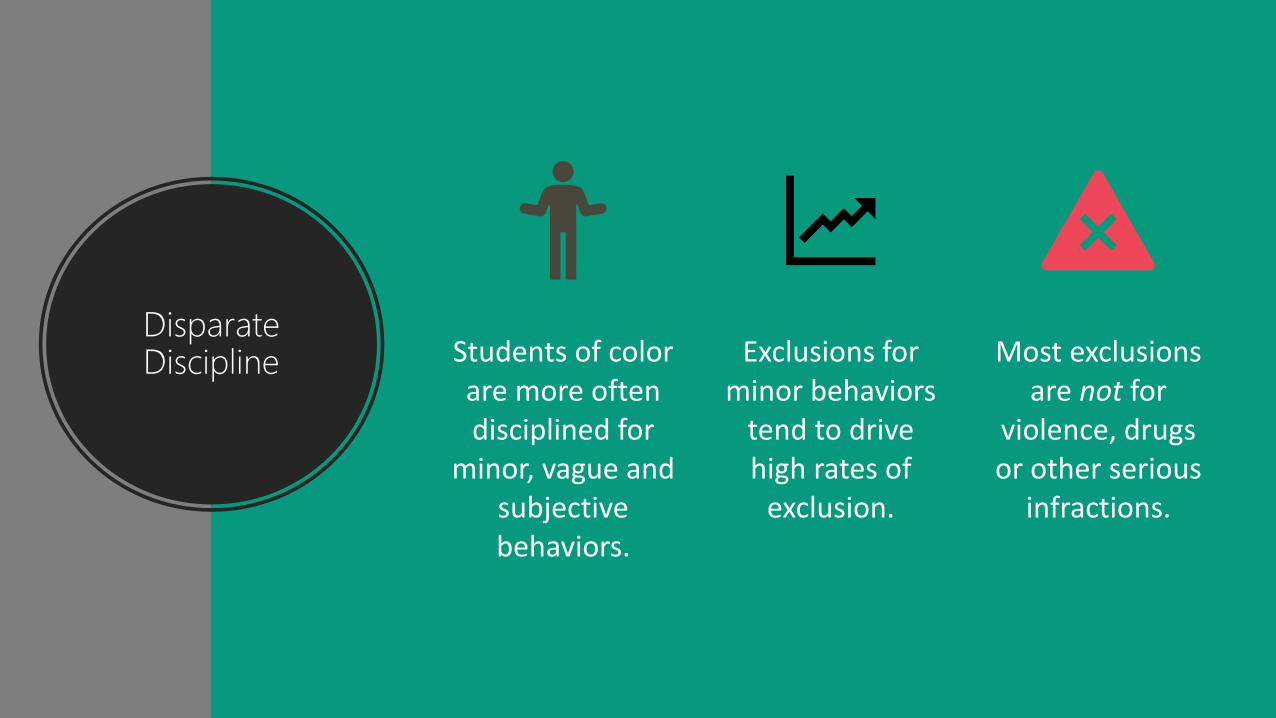
Disparate Discipline Students of color
are more often disciplined for
minor, vague and subjective behaviors.
Exclusions for minor behaviors
tend to drive high rates of
exclusion.
Most exclusions are not for
violence, drugs or other serious
infractions.

Where is there Disproportionate Discipline?
• District: Which buildings have the highest and most disproportionate rates? Which have the lowest?
• Building: Which locations account for the most referrals? • Hallways, lunchrooms, outside, in class? (Consider the rate of referrals
compared to the amount of time students spend in these settings.)

12/12/2019 | 32
Data systems such as SWIS allow districts and buildings to analyze the location and frequency of behavior referrals.
This type of dashboard can help a building team identify “hot spots” for referrals and make plans to address them.

12/12/2019 | 33
When are the Referrals Resulting in Exclusionary Discipline Occurring?
• Times of day (beginning, middle, end)
• Days of the week (beginning, middle, end)
• Months of the year (before/after breaks)
This Photo by Unknown Author is licensed under CC BY-SA

What Motivations are Associated with Disproportionate Discipline?
•Perceived functions of student problem behavior• Academic difficulties
• Avoidance
• Attention
• Peer conflicts
• Trauma reaction

What Motivations are Associated with Disproportionate Discipline?
•Possible functions or triggers of adult behavior (referrals):• Avoidance
• Frustration
• Trauma reaction
• Bias

Who is Issuing Disproportionate Discipline?
• Who is making the greatest number of office referrals?
• Notes: • While examining data on individual staff can feel uncomfortable, the
intent is not to embarrass, shame or punish.
• Disparately high referrals do not in and of themselves indicate racism or discrimination. More information is needed.
• Identifying staff involved in unusually high number of referrals helps administrators know where additional support may be needed (e.g., coaching, professional development, etc.) based upon the size and composition of the class(es).

12/12/2019 | 37Loo
k at
Cla
ssro
om
-Lev
el D
ata
Average ODRs: 1.54/classroom

12/12/2019 | 38

3. What to do?Research-based Responses to Disparities in Discipline

Research-based and High-Leverage Strategies:
Relationships: Students and Families
Modeling, Teaching and Re-Teaching Behavior Using Evidence-Based Approaches
High Expectations for All
Engaging and Culturally-Responsive Teaching
Addressing Explicit and Implicit Biases
Implementing these strategies in a Multi-Tiered System of Supports (MTSS)

12/12/2019 | 41
Relationships: Students and Families
• Who are your students?
• Who are their families?
• What are their cultural backgrounds?
• Students’ Strengths
• Students’ Needs
• Students’ Struggles (academic, social/emotional, trauma, situation)
• Does every student have a caring adult to go to?

12/12/2019 | 42
Relationships: Students and Families
• Positive student-teacher relationships are an evidence-based practice for supporting the development of the whole child.
• Relationships impact both academic progress and social-emotional development.
• The effect size of the positive teacher-student relationship is .72 (moderate to large)*, according to John Hattie’s synthesis of over 800 meta-analysis relating to achievement.
*72% of a standard deviation above the mean for a control group

12/12/2019 | 43
Modeling, Teaching and Re-Teaching Behavior Using Evidence-Based Approaches (Tier 1)
Structure environment to maximize learning
Teach classroom expectations to fluency
Consistently prompt/pre-correct for behavior
Provide high rates of specific, positive feedback (5:1)
Remind, reteach and redirect
Source: Wisconsin RtICenter (CFDA #84.027) with the support of the Wisconsin Department of Public Instruction

12/12/2019 | 44
Modeling, Teaching and Re-Teaching Behavior Using Evidence-Based Approaches (Tier 1)
Provide Corrective Feedback as Necessary (consistent, brief and respectful – similar to correction in math or reading)
Reteach, practice with the student, then have the student practice
Use higher rates of prompting until skills can be demonstrated
Provide higher rates of positive feedback until the skill can be demonstrated
Document and consider Tier 2 approaches if needed
Source: Wisconsin RtICenter (CFDA #84.027) with the support of the Wisconsin Department of Public Instruction

12/12/2019 | 45
Children are likely to meet the
expectations we set for them: High or Low
This Photo by Unknown Author is licensed under CC BY-SA
Adapted from “Growth Mindset,” Carol Dweck, Ph.D.

Culturally Responsive Teaching
“The process of using familiar cultural information and processes to scaffold learning.Emphasizes communal orientation.Focused on relationships, cognitive scaffolding, and critical social awareness.”-Zaretta Hammond, Culturally Responsive Teaching & the Brain (2015)
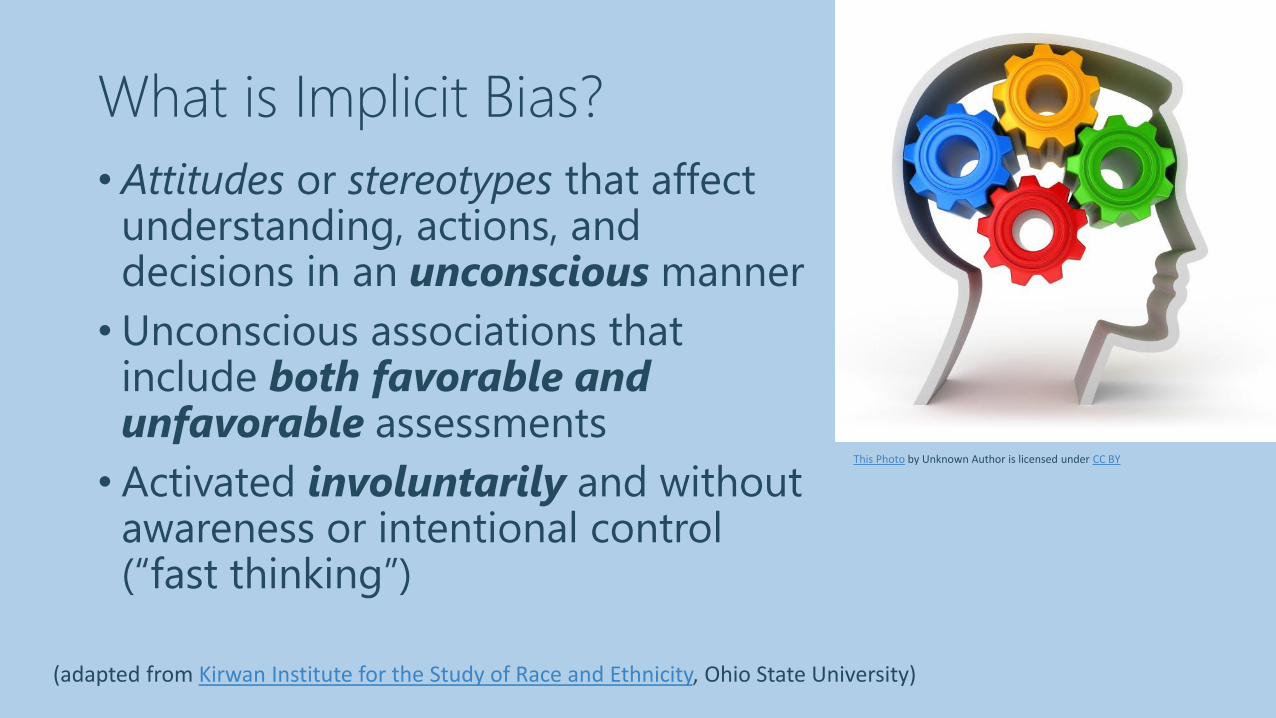
What is Implicit Bias?
• Attitudes or stereotypes that affect understanding, actions, and decisions in an unconscious manner
• Unconscious associations that include both favorable and unfavorable assessments
• Activated involuntarily and without awareness or intentional control (“fast thinking”)
(adapted from Kirwan Institute for the Study of Race and Ethnicity, Ohio State University)
This Photo by Unknown Author is licensed under CC BY-SA-NC
This Photo by Unknown Author is licensed under CC BY

What is Implicit Bias?
• Cause us to have feelings and attitudes about other people based on characteristics such as race, ethnicity, age, and appearance.
• Associations develop over the course of a lifetime through exposure to direct and indirect messages, from our families and other environmental influences, & through cultural messages via media.
(adapted from Kirwan Institute for the Study of Race and Ethnicity, Ohio State University)

12/12/2019 | 49
Recognize and Neutralize Implicit Bias
Implicit bias is a consequence of the way our brains are wired for survival.
Example: “Something glowing red/orange is probably hot. Be careful!”
This P
ho
tob
y Un
kno
wn
Au
tho
r is licensed
un
der C
C B
Y-NC
-ND
This Photo by Unknown Author is licensed under CC BY-NC
This P
ho
tob
y Un
kno
wn
Au
tho
r is licensed
u
nd
er CC
BY-SA

12/12/2019 | 50
Recognize and Neutralize Implicit Bias
Implicit bias operates at a subconscious level & faster than rational thought.
This Photo by Unknown Author is licensed under CC BY-NC
Read more about it: Blind Spot, by Mahzarin R. Banaji & Anthony G. Greenwaldor Thinking Fast and Slow, by Daniel Kahneman (YouTube summary)

12/12/2019 | 51
Recognize and Neutralize Implicit Bias (IB)
IB is most likely to influence snap decisions… or ambiguous or chaotic situations… or people when they are tired, hungry, or stressed….This Photo by Unknown Author is licensed under CC BY-NC-ND

12/12/2019 | 52
Recognize and Neutralize Implicit Bias
Implicit bias can easily mislead us in social situations that are more complex and nuanced –particularly in cross-cultural interactions.This Photo by Unknown Author is licensed under CC BY-NC-ND

12/12/2019 | 53
Recognize and Neutralize Implicit Bias
• Much of communication is non-verbal
• Communication styles reflect cultural and family norms, personality and other factors
• It’s important to understand cultural differences in communication related to:• Eye Contact
• Taking Turns
• Talking over
• Calling out/Call and response
• Code switching….

Implicit Bias Example
• Black boys as young as 10 may be perceived as being less innocent, and therefore more culpable, when compared to white children
• Black boys (age 10+) may be misperceived as up to 4.5 years older relative to peers of other races
• Misperceptions of Black children are associated with dehumanization of Black people in Western cultures
• Protect or punish? Dehumanization is related to decreased perception of innocence and, consequently, a loss of protection
See Goff, Jackson, et. al. (2014). The essence of innocence: Consequences of dehumanizing black children. Journal of Personality and Social Psychology 106, 4, 526-545. American Psychological Association
This Photo by Unknown Author is licensed under CC BY-ND

Recognize and Neutralize Implicit Bias
Once we recognize implicit biases, we can choose to act or not act on our instincts:
1. Ask questions
2. Obtain more information
3. Take time
4. Formulate reasoned responses

Multi-Tiered System of Supports
Includes strategies listed above, organized in a tiered framework to enhance the implementation and adoption of a continuum of evidence-based instruction and supports to achieve important outcomes for students

For Detail on These and Other Strategies
1. OSPI Practice Brief (2019): Reducing and Eliminating Disparities in School Discipline. The practice brief is a convenient and accessible summary of the research discussed in:Gregory, Skiba & Mediratta (2017). Eliminating Disparities in School Discipline: A Framework for Intervention
2. McIntosh, Girvan, Horner, Smolkowski & Sugai (2018). A 5-Point Intervention Approach for Enhancing Equity in School Discipline
3. Green, Nese, McIntosh, Nishioka, Eliason & Canizal Delabra (2015) Key Elements of Policies to Address Discipline Disproportionality: A Guide for District and School Teams

4. Is Our Plan Working?Regular Review of Data to Assess Progress and Course Correct

Goal Setting
Compare discipline rates to the district and state averages. Which ones are highest?
Which groups have relative rates over 1.25?
How much do you think your team can close the gap in 1-3 years?
Example: Close half of the gap each year
Y1: Reduce the relative rate from 2.25 to 1.75
Y2: Reduce the relative rate to 1.5
Y3: Reduce the relative rate to 1.375

Review Your Data Regularly
Monitor Office Discipline Referrals (ODRs) frequently (weekly-monthly)
Review disaggregated rates of exclusion regularly (monthly or more)
Review measures of disparity, such as the Relative Rate (Risk Ratio) multiple times per year, e.g., quarterly

What to look for:
Changes in overall discipline rates
Changes in disaggregated discipline rates
Comparison to the previous 2-3 school years to identify movement, direction and trends
Looking at changes in students excluded, number of exclusions by group, and average and total exclusion days by group
Changes in the relative rates and the causes of the changes based upon the data above
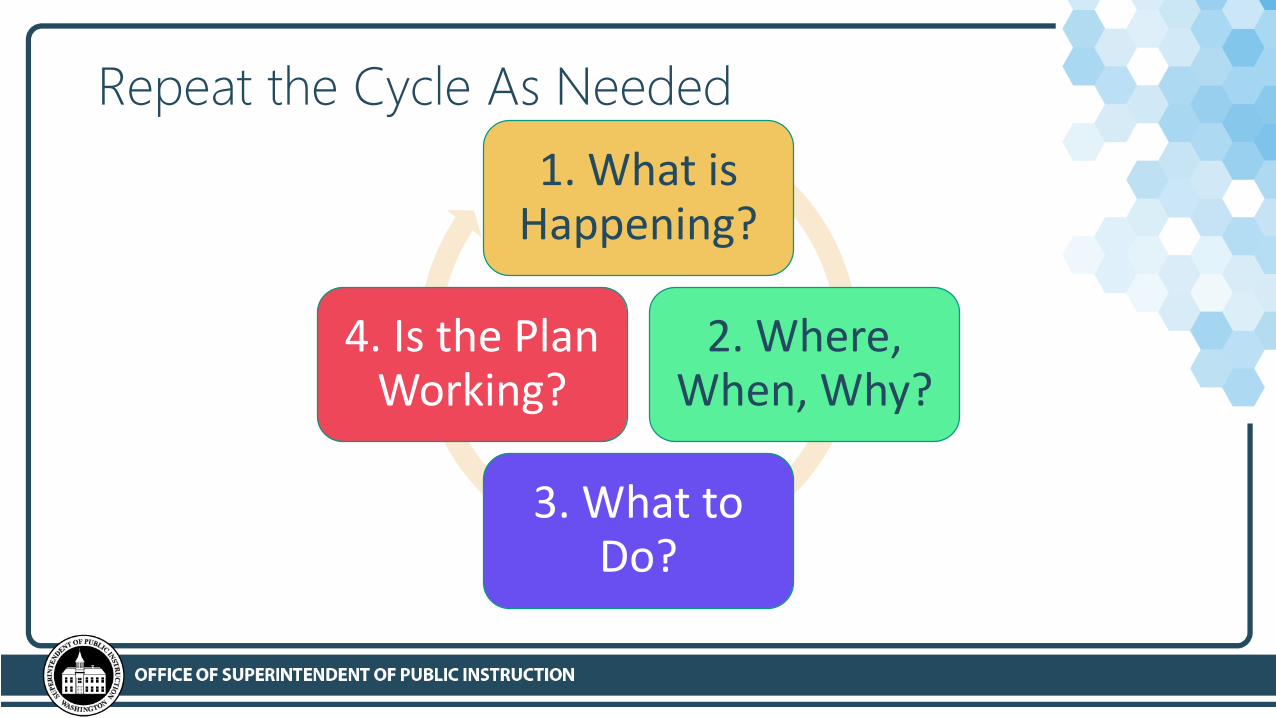
Repeat the Cycle As Needed
1. What is Happening?
2. Where, When, Why?
3. What to Do?
4. Is the Plan Working?

Contact OSPI. I’m happy to help!
• Accessing and understanding your school/district data
• Conducting a Root Cause Analysis
• Planning and coaching
• Identifying and implementing research-based practices
• Setting goals and evaluating progress
Mark McKechnie, MSW
Senior Consultant on Equity in Student Discipline
360.725.6039

ReferencesChaparro, E.A., Nese, R.N.T., & McIntosh, K. (2015). Examples of engaging instruction to increase equity in education. OSEP Technical Assistance Center on Positive Behavioral Interventions and Supports.
Gregory, A., Skiba, R.J. & Mediratta, K. (2017). Eliminating disparities in school discipline: A framework for intervention. Review of Research in Education, 41, 253-278.
Fabelo, T., Carmichael, D., Thompson, M.D., Marchbanks, M.P., Plotkin, M. & Booth, E.A. (2011). Breaking school rules: A statewide study of how school discipline relates to students’ success and juvenile justice involvement. Justice Center, The Council of State Governments & Public Policy Research Institute.
Hammond, Z. (2015). Culturally responsive teaching & the brain: Promoting authentic engagement and rigor among culturally and linguistically diverse students. Thousand Oaks, CA: Corwin.
Ispa-Landa, S. (2018). Persistently harsh punishments amid efforts to Reform: Using tools from social psychology to counteract racial bias in school disciplinary decisions. Educational Researcher, 47, 384-390.
McIntosh, K., Girvan, E. J., Horner, R. H., Smolkowski, K., & Sugai, G. (2018). A 5-point intervention approach for enhancing equity in school discipline. OSEP Technical Assistance Center on Positive Behavioral Interventions and Supports.
OSEP Technical Assistance Center for Positive Behavioral Inverventions and Supports (2014). Using Discipline Data within SWPBIS to Identify and Address Disproportionality: A Guide for School Teams
Thomas J. Mowen, John J. Brent & John H. Boman IV (2019) The Effect of School Discipline on Offending across Time, Justice Quarterly, DOI.
Office of the Superintendent of Public Instruction (website) K-12 Data and Reporting: Report Card https://washingtonstatereportcard.ospi.k12.wa.us/
Comprehensive Education Data and Research System Data Manual:
https://www.k12.wa.us/sites/default/files/public/cedars/pubdocs/2019-20CEDARSDataManual.pdf And Appendices: https://www.k12.wa.us/sites/default/files/public/cedars/pubdocs/2019-20%20CEDARS%20Appendices.pdf
Staats, C. (2014). Implicit racial bias and school discipline disparities: Exploring the connection. Kirwan Institute Special Report. http://kirwaninstitute.osu.edu/implicit-bias-training/resources/ki-ib-argument-piece03.pdf
Welsh, R.O. & Little, S. (2018). The school discipline dilemma: A comprehensive review of disparities and alternative approaches. Review of Educational Research, 88 (5), 752-794.

Resources
OSPI Resources on Discipline and Behavior
Report Card (school and district data)
Multi-Tiered System of Supports (MTSS)
WA Integrated Student Supports
Protocol (WISSP) Student Discipline
Equity in Student Discipline
Behavior Menu
National Resources
Positive Behavioral Interventions and Supports (PBIS) National Technical Assistance Center
Reducing the Effects of Implicit Bias in School Discipline (PowerPoint)
Institute of Education Sciences (IES) National Center for Education Research (NCER)
National Center on Intensive Intervention (NCII)
National Center on Safe Supportive Learning Environments (NCSSLE)