Understanding Delusions: The Role of Aberrant Salience and ...
191
Understanding Delusions: The Role of Aberrant Salience and Self-Relevant Information Processing A Dissertation Presented to The Faculty of the Graduate School At the University of Missouri In Partial Fulfillment Of the Requirements for the Degree Ph.D. BY David Cicero John Kerns, Dissertation Supervisor JULY 2012
Transcript of Understanding Delusions: The Role of Aberrant Salience and ...

Understanding Delusions: The Role of Aberrant Salience and Self-Relevant Information
Processing
A Dissertation
Presented to
The Faculty of the Graduate School
At the University of Missouri
In Partial Fulfillment
Of the Requirements for the Degree
Ph.D.
BY
David Cicero
John Kerns, Dissertation Supervisor
JULY 2012

The undersigned, appointed by the dean of the Graduate School,
have examined the dissertation entitled
Understanding Delusions: The role of Aberrant Salience and Self-Relevant Information Processing
Presented by David Cicero
A candidate for the degree of
Ph.D.
And hereby certify that, in their opinion, it is worthy of acceptance.
John Kerns, Ph.D.
Kenneth Sher, Ph.D.
Laura King, Ph.D.
Timothy Trull, Ph.D.
Philip Robbins, Ph.D.

To Lucia, who reminds me what is really important.

ii
ACKNOWLEDGEMENTS
I am indebted to my advisor, John Kerns, for his help over the past 7 years with my
development as a researcher and in the development of my program of research
examining aberrant salience and self-processing in schizophrenia. I want to thank Tim
Trull for being the co-sponsor of my National Research Service Award, which
encompassed most of my dissertation. Kenneth Sher gave me the opportunity to work on
a manuscript with him earlier in graduate school, which provided me with a valuable
learning experience in both methodology and effective writing. Laura King has also been
especially helpful in my development as a researcher. Her class on Personality inspired
many of the ideas specific to this dissertation as well as a general approach to personality,
which I aim to use to understand psychopathology. I’d like to thank Phillip Robbins for
being on my dissertation committee. In addition to my dissertation committee, my fellow
graduate students in the Cognitive and Emotional Control Lab, Theresa Becker, Anna
Docherty, and Elizabeth Martin were co-authors on a manuscript that served as a
precursor to this dissertation. Theresa, Anna, and Liz helped conduct some of the SIPS
interviews for Study. In Study 6, Theresa ran half of the schizophrenia patients and Liz
ran the control participants.
iii
TABLE OF CONTENTS
Acknowledgments…………………………………………………………………….......ii
Table of Contents ...............................................................................................................iii
List of Tables……………………………………………………………………………..iv
List of Figures…………………………………………………………………………...viii
Abstract .............................................................................................................................. ix
Introduction ......................................................................................................................... 1
Study 1…………………………………………………………………………………….7
Study 2…………………………………………………………………………………...17
Study 3…………………………………………………………………………………...21
Study 4…………………………………………………………………………………...27
Study 5…………………………………………………………………………………...37
Study 6…………………………………………………………………………………...62
General Discussion………………………………………………………………………76
References………………………………………………………………………………..81
Vita……………………………………………………………………………………...141
Appendix A……………………………………………………………………………..142
Appendix B……………………………………………………………………………..170
iv
LIST OF TABLES
Table Page
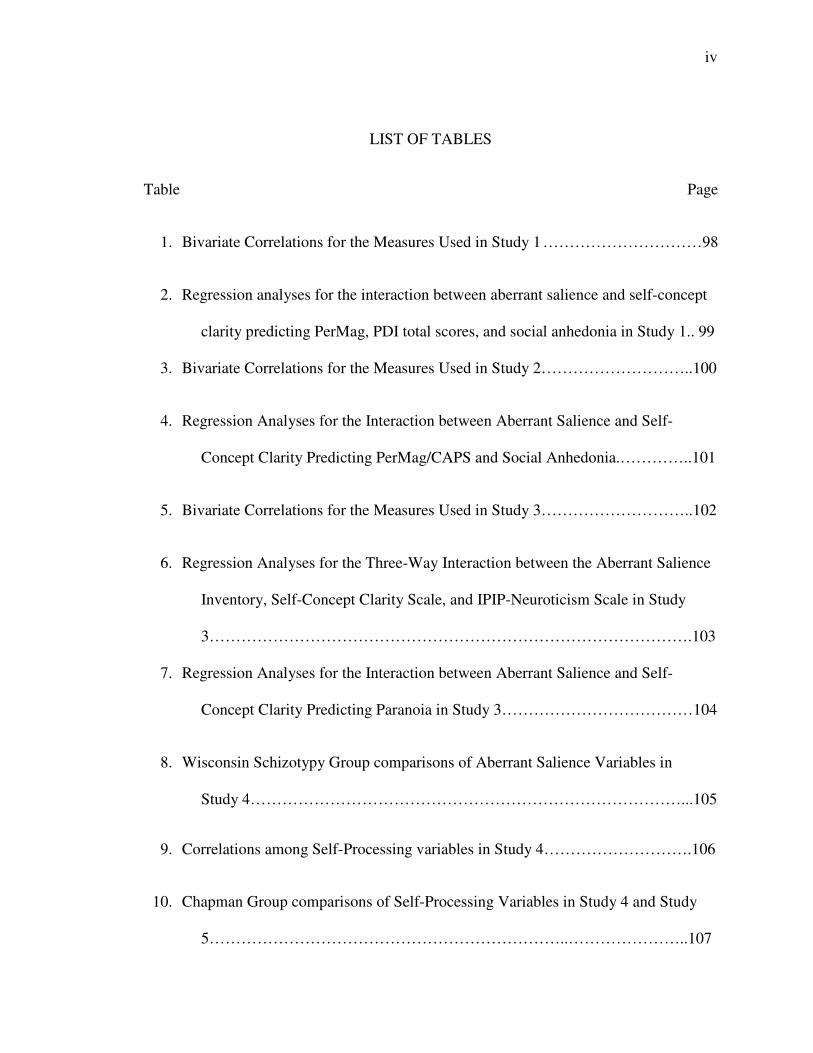
1. Bivariate Correlations for the Measures Used in Study 1 …………………………98
2. Regression analyses for the interaction between aberrant salience and self-concept
clarity predicting PerMag, PDI total scores, and social anhedonia in Study 1.. 99
3. Bivariate Correlations for the Measures Used in Study 2………………………..100
4. Regression Analyses for the Interaction between Aberrant Salience and Self-
Concept Clarity Predicting PerMag/CAPS and Social Anhedonia.…………..101
5. Bivariate Correlations for the Measures Used in Study 3………………………..102
6. Regression Analyses for the Three-Way Interaction between the Aberrant Salience
Inventory, Self-Concept Clarity Scale, and IPIP-Neuroticism Scale in Study
3……………………………………………………………………………….103
7. Regression Analyses for the Interaction between Aberrant Salience and Self-
Concept Clarity Predicting Paranoia in Study 3………………………………104
8. Wisconsin Schizotypy Group comparisons of Aberrant Salience Variables in
Study 4………………………………………………………………………...105
9. Correlations among Self-Processing variables in Study 4……………………….106
10. Chapman Group comparisons of Self-Processing Variables in Study 4 and Study
5…………………………………………………………..…………………..107

v
11. Regression Analyses for the Interaction between Aberrant Salience and Self-
Concept Clarity Predicting SIPS Positive Ratings……………………………108
12. Regression Analyses for the Interaction between Aberrant Salience and Self-
Concept Clarity Predicting SIPS Negative Ratings…………………………...109
13. Regression Analyses for the Interaction between Aberrant Salience and Self-
Concept Clarity Predicting SIPS Disorganized Ratings……………………....110
14. Regression Analyses for the Interaction between Aberrant Salience and Self-
Concept Clarity Predicting SIAPA Ratings……………………………….….111
15. Correlations among Aberrant Salience Variables from Study 5…………………112
16. Chapman Group comparisons of Aberrant Salience Variables in Study 4 and
Study 5…………………………………………………………………..…….113
17. Correlations among Self-Processing variables in Study 5…………………….....115
18. Chapman Group comparisons of Self-Processing Variables in Study 5…...…….116
19. Wisconsin Schizotypy Between Group Comparisons of Interview-Rated Positive
Symptoms in Study 5…………………………………………………….........117
20. Wisconsin Schizotypy Between Group Comparisons of Interview-Rated Negative
Symptoms in Study 5…………………………………………………….........118
21. Wisconsin Schizotypy Between Group Comparisons of Interview-Rated
Disorganized Symptoms in Study 5…………………………………………..119
22. Correspondence between Wisconsin Schizotypy Groups and SIPS Ratings
of 3 and 4 or Higher for Positive and Negative Symptoms…………………...120

vi
23. Simultaneous Regression of all Questionnaire Variables Predicting Interview-
Rated Positive Symptoms……………………………………………………..121
24. Simultaneous Regression of all Questionnaire Variables Predicting Interview-
Rated Negative Symptoms…………………………………………………....122
25. Simultaneous Regression of all Questionnaire Variables Predicting Interview-
Rated Delusional Ideation…………………………………………………….123
26. Comparisons among Wisconsin Schizotypy Groups for Self-Report Schizotypy
Scales………………………………………………………………………….124
27. Comparison between Schizophrenia and Control Groups on Aberrant Salience
Variable……………………………………………………………………….125
28. Comparison between Schizophrenia and Control Groups on Self-Relevant
Information Processing Variables…………………………………………….127
29. Correlations among Aberrant Salience Variables in Schizophrenia Patients……128
30. Correlations between Aberrant Salience Variables and Interview-Rated
Positive Symptoms in Patients with Schizophrenia in Study 6..………….......129
31. Correlations between Aberrant Salience and Negative Symptoms in People
with Schizophrenia in Study 6…………………………………………….......130
32. Correlations between Aberrant Salience and Global Impairment in People with
Schizophrenia in Study 6……………………………………………………...131
33. Correlations among Self-Relevant Information Processing Variables for People
with Schizophrenia in Study 6………………………………………………..132
34. Correlations among Self- Processing and Interview-Rated Positive Symptoms
in People with Schizophrenia in Study 6………………………………….....133

vii
35. Correlations among Self- Processing and Interview-Rated Positive Symptoms
in People with Schizophrenia in Study 6……………………………………...134
36. Correlations among Self-Relevant Information Processing and Global
Functioning in People with Schizophrenia in Study 6………………………..135
37. SAPS and BPRS Positive Symptoms as a Function of Self-Concept Clarity
and Aberrant Salience…………………………………………………………136
38. Comparison between Schizophrenia and Control Groups on Paranoia, Peters
Delusion Inventory, and Cardiff Anomalous Perceptions Scale…………...…137

viii
LIST OF FIGURES
Figure Page
1. Magical Ideation/Perceptual Aberration/CAPS as a Function of Aberrant Salience
and Self-Concept Clarity in Study 1. .................................................................138
2. Self-Concept Clarity by Aberrant Salience Interaction in Predicting Positive
Composite Scores……………………………………………………………..139
3. Moderation of Self-Concept Clarity by Aberrant Salience in Predicting SAPS-
Positive Symptoms……………………………………………………………140

ix
Abstract
The current dissertation contains six related studies that examine the roles of
aberrant salience and self-relevant information processing in the development and
maintenance of psychotic and psychotic-like experiences. Aberrant salience is the
incorrect or unusual assignment of salience, importance, or significance to stimuli. Self-
relevant information processing is individual differences in the way in which people
process information related to self-concept. The current research focuses on two aspects
of self-relevant information processing, self-concept clarity and self-esteem. Self-concept
clarity reflects the coherence of self-concept, and self-esteem can be broadly defined as
the valence with which one views oneself. The first four studies are large samples (n =
724, 667, 744, 998) of participants who were oversampled for a risk for schizophrenia.
The fifth study (n = 160), is a follow-up study including a subset of participants from
Study 1 and Study 4 who met standardized criteria for risk for psychosis. Study 6
included a group of participants with schizophrenia (n = 53) and a comparison group of
community controls without a history of mental illness (n = 33). In the first five studies,
an interaction between aberrant salience and self-concept clarity was found such that
participants with high aberrant salience and low self-concept clarity had the highest levels
of psychotic-like experiences, measured with both questionnaires and interviews. In
addition, aberrant salience and self-concept clarity interacted to predict a supplemental
measure of delusions in Study 1 and anomalous perceptual experiences in Study 2. In
Study 3, in contrast to low self-concept clarity, neuroticism did not interact with aberrant
salience to predict psychotic-like experiences, suggesting that the relationship between
low self-concept clarity and psychosis may not be due to general distress. Additionally,
x
aberrant salience and self-concept clarity did not interact to predict social anhedonia or
paranoia, which suggests the interaction is specific to psychotic-like experiences. Study 4
was in part a screening study to recruit participants for Study 5, but it also examined the
relationship between psychotic-like experiences and performance on a task that is
presumably sensitive to dysregulated dopamine, a theorized mechanism of aberrant
salience. In Study 5, I replicated the interaction between self-concept clarity and aberrant
salience in predicting psychotic-like experiences measured with a structured interview.
Finally, Study 6 found that participants with schizophrenia had higher aberrant salience
and lower self-concept clarity and that these two variables interacted (in a different
pattern from Study 1-Study 4) to predict positive--but not negative or disorganized—
symptoms of schizophrenia. Overall, these results are consistent with several social-
cognitive models of psychosis suggesting that aberrant salience and self-concept clarity
might be important mechanisms in the occurrence of psychosis and psychotic-like
experiences.

1
Understanding Delusions: The Role of Aberrant Salience and Self-Relevant Information
Processing
Psychotic symptoms include delusions and hallucinations and are a common
experience in people with schizophrenia-spectrum disorders and people at risk for
psychosis (e.g., Andreasen, Arndt, Alliger, Miller, & Flaum, 1995). Recent research
suggests that psychotic-like experiences also may be relatively common in the general
population, with estimates as high as one out of every five people reporting at least one
psychotic experience at some point in their lifetime (Kelleher & Cannon, 2010; van Os,
Hanssen, Bijl, & Vollebergh, 2001; van Os, Linscott, Myin-Germeys, Delespaul, &
Krabbendam, 2009). In addition, the presence of psychotic-like experiences is associated
with an increased risk for psychotic disorders (Chapman et al., 1994). Many theorists
who have attempted to explain the origin of psychosis and psychotic-like experiences
have posited a role for social-cognitive mechanisms in the development and maintenance
of these experiences (e.g., Beck & Rector, 2005; Bell, Halligan, & Ellis, 2006b; Bentall,
Corcoran, Howard, Blackwood, & Kinderman, 2001; Fenigstein & Vanable, 1992;
Fowler, 2000; Freeman, 2007; Garety, Kuipers, Fowler, Freeman, & Bebbington, 2001).
The current research examined the relations between psychosis and psychotic-like
experience and two social-cognitive mechanisms, aberrant salience and low self-concept
clarity.
Aberrant salience is the incorrect assignment of importance to neutral stimuli and
has been proposed to be centrally involved in psychosis (J. A. Gray, Feldon, Rawlins,
Hemsley, & Smith, 1991; Kapur, 2003; Roiser et al., 2008). Anecdotal reports of people
with psychosis suggest that they initially often go through periods in which stimuli that

2
ordinarily would not seem significant become much more salient and important (Bowers,
1968; Moller & Husby, 2000). Based in part on these phenomenological observations of
people with psychosis, Kapur (2003) suggested that occurrences of aberrant salience may
be central to the development of psychosis. Positing a role for aberrant salience in
psychosis is also derived in part from research on normal incentive salience processes.
Incentive salience refers to the “wanting” and motivational importance component of
learning as opposed to the “liking” component (Berridge, 2007). Given the role of
dopamine in incentive salience, this suggests that dopamine dysregulation should be
associated with aberrant salience (Kapur, 2003). This is consistent with a long line of
research supporting an association between psychosis and increased subcortical
dopamine (Davis, Kahn, Ko, & Davidson, 1991; Guillin, Abi-Dargham, & Laruelle,
2007; Seeman, 1987). For example, brain imaging studies have found dysregulated
dopamine activity when people with schizophrenia are actively psychotic (e.g., Abi-
Dargham et al., 2000; Laruelle & Abi-Dargham, 1999; Soares & Innis, 1999) and in the
prodromal phase of the illness (Howes et al., 2009). Therefore, both phenomenological
and neurobiological research suggests a role for aberrant salience in psychosis.
A role for aberrant salience in psychosis and psychotic-like experiences is also
consistent with most previous models of psychosis. Two social-cognitive mechanisms
that are common to nearly all models of psychosis and psychotic-like experiences are (a)
aberrant salience or anomalous experiences and (b) self-relevant information processing
(e.g., Bell et al., 2006; Bentall et al., 2001; Freeman, 2007). According to these models,
anomalous experiences contribute to psychosis because people adopt delusional beliefs in
part to account for these anomalous experiences (Maher, 1974). In addition, a number of

3
these models have also hypothesized that aberrant salience is the mechanism that
contributes to the occurrence of anomalous experiences (Freeman, 2007; Kapur, 2003) or
the mechanism by which these experiences are attributed to external sources.
Until recently, there was not a direct method for measuring aberrant salience. In a
series of studies, we recently developed the Aberrant Salience Inventory (ASI; Cicero,
Kerns, & McCarthy, 2010), and found that it can be a valid and reliable measure of
aberrant salience in people at risk for the development of psychosis. The current research
aims to further test the nomological network of the construct of aberrant salience by using
the ASI to examine theories of psychosis and psychotic-like experiences that posit a
central role for aberrant salience.
Another social-cognitive mechanism of psychosis examined in the current
research is low self-concept clarity. Self-concept clarity (SCC) refers to “to the extent to
which one’s beliefs about one’s attributes are clear, confidently held, internally
consistent, stable, and cognitively accessible” (Stinson, Wood, & Doxey, 2008, p. 1541).
People with low self-concept clarity have been found to report more fluctuating levels of
self-esteem (Kernis, Paradise, Whitaker, Wheatman, & Goldman, 2000), which is
associated with a host of negative psychological outcomes (Campbell et al., 1996).
A role for low self-concept clarity in psychosis is generally consistent with most
previous models of psychosis. As mentioned, researchers have long suggested that basic
problems with self-relevant information processing may be related to the development of
psychosis (e.g., Fabrega, 1989; Hemsley, 1998; Parnas, Handest, Saebye, & Jansson,
2003; Raballo, Saebye, & Parnas, 2009). Recently, some evidence suggests that low self-
concept clarity in particular might be related to psychosis and psychotic-like experiences.

4
One phenomenological study concluded that “disturbance of perception of self” is a core
experiential dimension of the development of psychosis (Moller & Husby, 2000), with
this disturbance described as a loss of a clear conceptualization of the self. For instance,
people in the prodromal phase of psychosis reported often feeling like they were
confused about their identities (Moller & Husby, 2000), suggesting low self-concept
clarity. Moreover, Moller and Husby (2000) concluded that these experiences represent a
broader construct than the detachment often reported in dissociative disorders, such as
depersonalization. Hemsley (1998) referred to this phenomenon as a “gradually
developing instability in the sense of personal identity (p.117).” Additionally, other
researchers have found that low coherence in autobiographical memories is related to
cognitive impairments, hopelessness and lack of insight in people with schizophrenia
(Lysaker, Clements, Plascak-Hallberg, Knipscheer, & Wright, 2002). In another recent
study, paranoia was found to be associated with frequent fluctuations in self-esteem
(Thewissen, Bentall, Lecomte, van Os, & Myin-Germeys, 2008; Thewissen et al., 2007),
which is strongly correlated with low self-concept clarity (Kernis, et al., 2000).
Therefore, it is possible that low self-concept clarity might be a specific type of self-
processing disturbance related to psychosis and psychotic-like experiences.
As previously discussed, a role for both aberrant salience and low self-concept
clarity in psychosis and psychotic-like experiences is generally consistent with nearly all
models of psychosis. However, another important feature of social-cognitive models of
psychosis is that they suggest that by themselves neither aberrant salience nor self-
processing disturbances may be sufficient to produce psychotic symptoms. Instead, these

5
models posit that the combination of aberrant salience and self-processing disturbances
results in psychosis (Bell, et al., 2006b).
Therefore, based on previous psychosis theories and research, aberrant salience
and low self-concept clarity might be two social-cognitive mechanisms that interact to
predict psychotic-like experiences and psychosis. Nevertheless, a number of important
questions have not been examined in previous research. For instance, no previous
research has actually examined whether aberrant salience and low self-concept clarity
interact to predict psychotic-like experiences. Similarly, previous research has not
examined whether aberrant salience and low self-concept clarity interact to uniquely
predict psychosis and psychotic-like experiences and do not interact to predict other
aspects of psychopathology associated with psychosis. Furthermore, although previous
research suggests that low self-concept clarity might be associated with psychosis, no
previous research has directly measured and examined whether self-concept clarity is
associated with psychosis and psychotic-like experiences. Given that self-processing
disturbances are also associated with increased neuroticism (Campbell, et al., 1996), it is
important to examine whether self-concept clarity is uniquely associated with psychotic-
like experiences or whether neuroticism would be similarly associated with psychotic-
like experiences.
In six studies, the current research examined whether aberrant salience and self-
concept clarity interacted to predict psychotic-like and full-blown psychotic symptoms.
Study 1 tested whether there was an interaction between aberrant salience and self-
concept clarity in predicting two psychotic-like experiences: magical ideation and
perceptual aberration (Chapman, Chapman, Kwapil, Eckblad, & Zinser, 1994). In

6
addition, Study 1 tested whether this interaction was specific to psychotic-like
experiences and not to another facet of schizophrenia-spectrum disorders, social
anhedonia. Study 1 also included a supplementary measure of delusion-like beliefs, the
Peters Delusion Inventory (PDI; Peters, Joseph, Day, & Garety, 2004). In Study 2, I
replicated the interaction between aberrant salience and self-concept clarity in predicting
psychotic-like experiences and included a supplementary measure of hallucinatory-like
experiences, the Cardiff Anomalous Perceptions Scale (Bell, Halligan, & Ellis, 2006a). In
Study 3, I tested whether only self-concept clarity interacted with aberrant salience to
predict psychotic-like experiences, or whether neuroticism would also interact with
aberrant salience to predict psychotic-like experiences. Study 3 also tested whether the
interaction was specific to psychotic-like experiences or whether aberrant salience and
self-concept clarity would interact to predict paranoia. The main purpose of Study 4 was
to screen participants and identify enough participants who met standardized schizotypy
criteria for positive, negative, and control groups. The goal of Study 5 was to examine the
roles of aberrant salience and self-processing variables in a sample of people at risk for
the development of schizophrenia with an in-depth structured clinical interview. Finally,
study 6 sought to extend the results of Study 1-Study6 by examining the role of aberrant
salience and self-concept clarity in a sample of people with a diagnosis of schizophrenia.

7
Study 1
The main goal of Study 1 was to test the prediction that questionnaire measures of
aberrant salience and self-concept clarity interact to predict psychotic-like experiences. In
this study, we also examined whether aberrant salience would interact with a task
measure of self-concept clarity (the Me-Not-Me-Decision Task) to predict psychotic-like
experiences. Additionally, we examined whether aberrant salience and self-concept
clarity interacted to predict specific delusional experience). Finally, we tested whether
this interaction is specific to predicting psychotic-like experiences and whether aberrant
salience and self-concept clarity would not interact to predict social anhedonia.
Method
Participants. Participants were 724 native English-speaking undergraduate
students who took part in the study as partial fulfillment of a course requirement. To
ensure adequate numbers of participants with high levels of schizotypy, participants were
prescreened from a larger pool (n=2,244). These participants completed abbreviated
versions of the Magical Ideation Scale (MagicId; Eckblad & Chapman, 1983), Perceptual
Aberration Scale (PerAb; Chapman, Chapman, & Raulin, 1978), and Social Anhedonia
Scale (SocAnh; Chapman, Chapman, & Raulin, 1976). Participants scoring two standard
deviations above the mean or higher on these scales or a combined three standard
deviations above the mean on MagicId and PerAb were recruited to the laboratory for an
individual testing session. Participants who scored less than 0.5 standard deviations
above the mean on all three scales were also recruited. When participants came to the lab,
they completed full versions of these three scales. All analyses are based on the full
version of the scales. Based on previously established cut-points (Kerns & Berenbaum,

8
2003), 60 participants met criteria for having high positive schizotypy (i.e., greater than
1.96 SD above the mean on the MagicId or PerAb or a combined three standard
deviations above the mean on both scales) and 72 met criteria for high negative
schizotypy (i.e., greater than 1.96 SDs above the mean on SocAnh). This strategy of
oversampling resulted in a wider range of scores in all three studies when compared to
unselected samples. Thirty-two participants were excluded for having Wisconsin
Infrequency Scores of three or greater. Participants ranged from 18-26 years old, with an
average age of 18.44 (SD = 0.84). Participants were 64% female, 84% White, 11%
African-American, and 5% other.
Measures. Aberrant Salience. Aberrant Salience was measured with the Aberrant
Salience Inventory (ASI; Cicero, et al., 2010). The ASI is a 29-item yes-no questionnaire
that has five subscales measuring different aspects of the experience of aberrant salience
including feelings of increased significance (e.g., Do certain trivial things suddenly seem
especially important or significant to you?), sharpening of senses (e.g., Do you senses
ever seem especially strong or clear?), impending understanding (e.g., Do you sometimes
feel like you are on the verge of something really big or important but you aren’t sure
what it is?), heightened emotionality (e.g., Do you go through periods in which you feel
over-stimulated by things or experiences that are normally manageable?), and heightened
cognition (e.g., Do you ever feel like the mysteries of the universe are revealing
themselves to you?). Previous research has found that the ASI is highly correlated with
other measures of psychosis-proneness, is elevated in participants at risk for the
development of psychotic disorders, and is elevated in inpatients with a history of
psychosis compared to inpatients without a history of psychosis (Cicero, et al., 2010).
9
Moreover, the ASI has discriminant validity from other measures of psychosis-proneness,
as the ASI has been found to be correlated with the measures reflecting increased
subcortical dopamine, whereas other psychosis-proneness measures were not (Cicero et
al., 2010).
Self-Concept Clarity (SCC). Our primary measure of self-concept clarity was the
Self-Concept Clarity Scale (SCCS; Campbell, 1990). The SCCS is a 12-item scale on
which participants rate statements on a scale from 1 Strongly Agree to 5 Strongly
Disagree (e.g., My beliefs about myself often conflict with on another). The SCCS has
been found to be correlated with other measures of self-concept clarity including
agreement of pairs of adjectives describing the self (Campbell, et al., 1996). A second
measure of self-concept clarity was the Me-Not-me Decision Task (MNMDT; Campbell
et al., 1996) in which participants are asked to decide whether 60 adjectives describe
themselves or do not describe themselves. Among these 60 adjectives are 30 pairs of
opposites (e.g., beautiful-ugly, nice-mean). SCC is conceptualized as the number of
consistent responses (e.g., responding “me” to beautiful and “not me” to ugly). Prior to
analyzing the data, the item-total correlation for each pair was examined. Six pairs had
negative item-total correlations and were dropped from the analyses. As can be seen in Table
1, the MNMDT was moderately correlated with the SCCS. Although this correlation is
consistent with previous research (Campbell et al., 1996), this moderate correlation raises
questions about the convergent validity of the MNMDT and SCCS. The MNMDT was
significantly more strongly correlated with the SCCS than with the ASI (Z = 4.22, p <
.001), PerMag (Z = 2.33, p = .02), and the PDI (Z = 5.24, p < .001), but not SocAnh (Z =

10
.48, p = .63). The high correlation with SocAnh may be explained by the high correlation
between SCCS and SocAnh.
Psychotic-like Experiences. In Study 1, magical ideation was measured with the
Magical Ideation Scale (Eckblad & Chapman, 1983), a 30-item true-false scale designed
to measure “beliefs in forms of causation that by conventional standards are invalid”
(Eckbald & Chapman, 1983, p.215). For example, “I have worried that people on other
planets may be influencing what happens on Earth.” The Perceptual Aberration Scale
(Chapman, et al., 1978) is a 35-item true-false scale that measures schizophrenic-like
distortions in perception of one’s own body (e.g., “my hearing is sometimes so sensitive
that ordinary sounds become uncomfortable”). The MagicId and PerAb have
considerable support for the reliability and validity of their scores (for a review, see
Edell, 1995). As is commonly done in schizotypy research (Chapman, et al., 1994) scores
on PerAb and MagicId were added together to form a single Perceptual
Aberration/Magical Ideation (PerMag) score.
In addition to PerMag, psychotic-like experiences were measured with the 21-
item Peters Delusion Inventory (PDI; Peters, et al., 2004), which includes yes-no
questions regarding delusion-like experiences (e.g., Have your thoughts ever been so
vivid that you were worried other people would hear them?). For each affirmative
answer, participants are asked three follow-up questions. Participants are asked, “How
distressing is this belief or experience?” answered on a Likert-type scale from 1 (Not at
all Distressing) to 5 (Extremely distressing), “How true do you believe this belief or
experience to be?” on a scale from 1 (Don’t believe it’s True) to 5 (Believe it’s absolutely
true), and “how often do you think about this belief or experience?” on a scale from 1

11
(Hardly ever think about it) to 5 (Think about it all the time). Subscale scores are
calculated for three proposed dimensions of delusional experience: Delusional
Preoccupation, Delusional Distress, and Delusional Conviction.
Social Anhedonia. Social Anhedonia was measured with the Revised Social
Anhedonia Scale (SocAnh; Chapman, et al., 1976). The SocAnh contains 40 true-false
items that measure a lack of relationships and a lack of enjoyment derived from social
interactions (e.g., “I am usually content just to sit alone, thinking and daydreaming”) and
has been found to predict future development of schizophrenia-spectrum disorders (e.g.,
Gooding, Tallent, & Matts, 2005).
Infrequency. Participants also completed the Wisconsin Infrequency Scale, which
measures invalid or careless responding. The scale includes items that should rarely be
answered in the affirmative (e.g., I have never talked to someone wearing eyeglasses).
Following convention in schizotypy research, participants who answered “true” to three
or more items were excluded from the analyses (Chmielewski, Fernandes, Yee, & Miller,
1995).
Procedure. Participants completed the study on a single occasion in an isolated
room. The entire study took approximately 60 minutes. First, participants completed the
Me-Not-me Decision Task, followed by the Aberrant Salience Inventory, Self-Concept
Clarity Scale, and then the Magical Ideation, Perceptual Aberration, Social Anhedonia
Scales, and Wisconsin Infrequency Scales mixed together and called the “Survey of
Attitudes and Experiences.” Then, participants completed the Peters Delusion Inventory.
Results
12
Zero-Order Correlations. First, we examined the correlations among aberrant
salience, self-concept clarity, and psychotic-like experiences. Due to the large number of
correlations being examined, we used the Bonferroni method of correcting the p-value for
multiple comparisons (Dunn, 1961). Thus, only correlations significant at the p < .001
level are presented and interpreted. As can be seen in Table 1, aberrant salience was
associated with magical ideation, perceptual aberration, and PDI scores. It was negatively
correlated with both measures of self-concept clarity. The SCCS was negatively
correlated with magical ideation, perceptual aberration, PDI scores, and social anhedonia.
The MNMDT was negatively correlated with magical ideation, perceptual aberration, and
social anhedonia.
Aberrant Salience, Self-Concept Clarity, and Psychotic-like Experiences. In all
of the regression analyses reported across studies, we first conducted regression
diagnostics as suggested by Pedhazur (1997) to detect outliers. In order to treat outliers
consistently across studies, data points with Cook’s Ds greater than .05 and leverage
values greater than .04 were excluded from the analyses. The specifics of excluded data
points are presented where appropriate.
We then tested the prediction of social-cognitive models of psychotic-like
experiences that an interaction between high aberrant salience and low self-concept
clarity predicts psychotic-like experiences. To test this interaction, ASI scores and SCCS
scores were centered around their means and entered as step one of a hierarchical linear
regression predicting PerMag scores. The product of ASI and SCCS scores was entered
in step two of the analysis. Following Aiken & West (2001), to interpret the interaction,
scores were calculated for +1 and -1 standard deviations from the mean for both aberrant
13
salience and self-concept clarity. Overall, there was a significant interaction between
aberrant salience and self-concept clarity predicting PerMag (t (692) = -4.36, p < .001;
See table 2). No outliers were identified. As can be seen in Figure 1, participants with
high aberrant salience but low self-concept clarity had the highest PerMag scores.
Participants with high aberrant salience tended to have extreme levels of PerMag only if
they had low levels of self-concept clarity as well, which is consistent with social-
cognitive models of psychosis. To probe the interaction, we tested the simple slope of the
relation between self-concept clarity and PerMag at high and low levels of aberrant
salience (Hayes & Matthes, 2009). Self-concept clarity was associated with PerMag
when participants were one standard deviation above the mean on the ASI (t (692) =
6.01, p < .001), but not when participants were one standard deviation below the mean on
the ASI (t (692) = -0.08, p = .93). This suggests that self-concept clarity is only related to
PerMag at high levels of aberrant salience.
In addition, we tested the same model to see if aberrant salience and self-concept
clarity interacted to predict PDI scores. There was a significant interaction between
aberrant salience and self-concept clarity in predicting PDI total scores (t (691) = 2.01, p
= .04, see Table 2). One outlier was excluded from these analyses. This participant had a
Cook’s distance value of .11 and a leverage score of .04, which suggests that the
participant was an outlier in terms of residual distance from the slope and that this
observation had an unduly large influence on the data (Pedhazur, 1997). Like PerMag,
self-concept clarity was associated with PDI when participants had high ASI scores (t
(691) = 4.26, p < .001), but not low ASI scores (t (691) = 1.37, p = .17). This suggests
that self-concept clarity is only related to PDI scores at high levels of aberrant salience.
14
Aberrant Salience, Task Self-Concept Clarity, and PerMag. The current research
also examined the relations between aberrant salience and a task measure of self-concept
clarity. There was a significant interaction between self-reported aberrant salience and
task self-concept clarity in predicting PerMag (t (691) = 1.97 p = .05, see Table 2). One
outlier was excluded from this analysis. This participant had a Cook’s distance of .05 and
a leverage score of .05. Similar to the SCCS, MNMDT scores were associated with
PerMag when participants had high ASI scores (t (691) = 4.04, p < .001), but not low ASI
scores (t (691) = 1.18, p = .24). This suggests that MNMDT scores are only related to
PerMag scores at high levels of aberrant salience.
In contrast to PerMag, there was not a significant interaction between MNMDT
scores and ASI scores in predicting PDI-total score (t (692) = 0.41, p = .69). No outliers
were identified. An analysis of the main effects revealed that ASI was significant
associated with PDI-total scores (t (692) = 16.99, p < .001), but the MNMDT was not (t
(692) = 0.25, p = .80). Specificity of Moderation. To test if interaction between aberrant
salience and self-concept clarity was specific to psychotic-like experiences, we tested
whether there was a significant interaction between the ASI and SCCS in predicting
social anhedonia. There was not a significant interaction between aberrant salience and
self-concept clarity in predicting social anhedonia (t (692) = -1.21, p = .22), which
suggests that the interaction between aberrant salience and self-concept clarity is specific
to psychotic-like experiences and not schizotypy in general. No outliers were identified.
Examining the main effects revealed that SCCS is negatively related to social anhedonia
(t (692) = -8.14, p < .001), but ASI is not (t (692) = -0.06, p = .95).
Discussion
15
The results of Study 1 are consistent with several social-cognitive models of
psychosis as well as phenomenological descriptions of psychotic-like experiences (Bell,
et al., 2006b; Freeman, 2007; Moller & Husby, 2000). Specifically, Study 1 found that
participants with a combination of high aberrant salience and low self-concept clarity had
the highest levels of psychotic-like experiences. The probe of the interaction revealed that
low self-concept clarity tended to be unrelated to psychotic-like experiences in people
with low aberrant salience, but was strongly associated with increased psychotic-like
experiences in people with high aberrant salience. This suggests that low SCC alone may
not be sufficient to produce psychotic-like experiences, but may only do so in the
presence of high aberrant salience. This finding is consistent with social-cognitive models
of psychotic-like experiences that have predicted that self-relevant information
processing interacts with aberrant salience or anomalous experiences to produce
psychotic-like experiences (Bell, et al., 2006b; Freeman, 2007).
In addition to being consistent with social-cognitive models of psychosis, Study 1
found that the interaction between aberrant salience and self-concept clarity is specific to
psychotic-like experiences. This was evident in that there was not a significant interaction
between aberrant salience and self-concept clarity in predicting social anhedonia, a
common negative symptom associated with psychosis. This, too, is consistent with
previous theoretical models of psychosis, which suggest that aberrant salience may only
be related to positive symptoms, but not to negative symptoms (Kapur, 2003).
Study 1 used two measures of self-concept clarity, including a questionnaire
measure and a task measure. It is important to note that the same pattern of results was
found for both the task and the questionnaire. This replication with different methods

16
provides further evidence for the interaction between aberrant salience and self-concept
clarity in predicting psychotic-like experiences. However, as can be seen in Table 1, the
reliability of the task measure of self-concept clarity was low. Future research could
attempt to refine or develop new implicit task measures of self-concept clarity to obtain
additional converging evidence about the role of self-concept clarity in psychotic-like
experiences.

17
Study 2
The first goal of Study 2 was to replicate the results of Study 1 in an independent
sample. This is important because Study 1 was the first study to test whether there was an
interaction between aberrant salience and self-concept clarity in predicting psychotic-like
experiences. In addition, in Study 2 we included a supplemental measure of anomalous
perceptions.
Method
Participants. Participants were 667 undergraduate students who took part in the
study as partial fulfillment of a course requirement. Just as in Study 1, participants were
prescreened from a larger pool of participants (n= 1,901), by completing abbreviated
versions of Magical Ideation, Perceptual Aberration, and Social Anhedonia Scales. As in
Study 1, participants completed full version of these three scales in the lab and all
analyses are based on the full versions of the scales. According to previous research
(Kerns & Berenbaum, 2003), 41 participants met criteria for high positive schizotypy and
70 participants met criteria for high negative schizotypy. Sixty-two participants were
excluded for having Wisconsin Infrequency scores of three or greater. Participants ranged
from 18-26 years old, with an average age of 18.47 (SD = 0.93). Participants were 63%
female, 86% White, 6% African-American, and 8% other.
Measures. Aberrant Salience. Aberrant Salience was measured with the Aberrant
Salience Inventory (Cicero, et al., 2010), like in Study 1.
Self-Concept Clarity. Self-concept clarity was measured with the Self-Concept
Clarity Scale (Campbell, 1990), like in Study 1.

18
Psychotic-Like Experiences. As in Study 1, psychotic-like experiences were
measured with the Magical Ideation Scale (Eckblad & Chapman, 1983) and the
Perceptual Aberration Scale (Chapman, et al., 1978). Another measure of psychotic-like
experiences was the Cardiff Anomalous Perceptions Scale (CAPS; Bell, et al., 2006a).
The CAPS contains 32 yes-no items that measure anomalous perceptual experiences
(e.g., Do you ever find that sounds are distorted in strange or unusual ways?). In previous
research, the CAPS has been found to be correlated with other measures of unusual
perceptual experiences and to be higher in psychotic populations than in non-psychotic
populations.
Social Anhedonia. Social Anhedonia was measured with the Revised Social
Anhedonia Scale (Chapman, et al., 1976) as in Study 1.
Infrequency. Participants completed the Wisconsin Infrequency Scale like in
Study 1.
Procedure. Like in Study 1, participants completed the study on a single occasion
in an isolated room, which took approximately 60 minutes. Participants completed the
Magical Ideation, Perceptual Aberration, Social Anhedonia, and Wisconsin Infrequency
Scales mixed together. Then participants completed a battery of questionnaires including
the Aberrant Salience Inventory, Self-Concept Clarity Scale, Cardiff Anomalous
Perceptual Experiences Scale, and filler items.
Results
Zero Order Correlations. As can be seen in Table 2, aberrant salience was associated
with increased PerMag experiences and CAPS scores. Self-concept clarity was negatively
associated with aberrant salience, PerMag, and CAPS scores.

19
Psychotic-like Experiences. The first goal of Study 2 was to replicate the results of
the interaction between aberrant salience and self-concept clarity in predicting magical
ideation and perceptual aberration. Since PerMag and CAPS scores were highly
correlated, the scores were combined to form a single PerMag/CAPS score. Z-scores
were calculated for PerMag and CAPS scores within gender and a mean was taken. Like
in Study 1, we tested whether there was a significant interaction between aberrant
salience and self-concept clarity in predicting PerMag/CAPS scores by entering mean-
centered ASI and SCCS scores in step one of a hierarchical linear regression model and
the product of these scores in step 2. Just as in Study 1, aberrant salience and self-concept
clarity interacted to predict PerMag/CAPS scores (t (605) = 7.30, p < .001; See Table 4).
As found in Study 1, participants with high aberrant salience and low self-concept clarity
had the highest levels of PerMag/CAPS scores and self-concept clarity was associated
with PerMag at one standard deviation above the mean on aberrant salience (t (605) =
9.15, p < .001), but not at one standard deviation below the mean (t (605) = 0.42, p =.67).
No outliers were identified.
Specificity of Moderation. Like Study 1, Study 2 found that there was not a
significant interaction between aberrant salience and self-concept clarity in predicting
social anhedonia (t (605) = 0.98, p < .33). As can be seen in Table 4, self-concept clarity,
but not aberrant salience, was significantly associated with social anhedonia.
Discussion
The first goal of Study 2 was to replicate the results of Study 1 in a separate
sample. It is especially important to replicate the results of Study 1 because, to my
knowledge, Study 1 was the first study to test an interaction between aberrant salience

20
and self-concept clarity. Study 2 found the same interaction as in Study 1. In addition,
Study 2 included a supplemental measure of anomalous perceptual experiences and found
the same interaction, which suggests that the aberrant salience/self-concept clarity
interaction can explain perceptual aberrations in addition to magical ideation.

21
Study 3
Although Study 2 replicated and extended the results of Study 1, one potential
explanation for the finding that self-concept clarity interacts with aberrant salience to
predict psychotic-like experiences is that the role of self-concept clarity can be explained
by its overlap with neuroticism. For example, previous research has found that low self-
concept clarity is associated with neuroticism (Campbell, et al., 1996). Similarly, there is
a great deal of literature linking psychosis with a tendency to experience negative affect,
particularly as a response to stressors (e.g., Berenbaum & Fujita, 1994; van Os, Kenis, &
Rutten, 2010). Theorists have suggested that stress sensitivity, defined as an increased
negative mood reaction to stress and assessed with measures of neuroticism, may be a
suitable endophenotype for psychosis (see Myin-Germeys & van Os, 2007, for a review).
Aberrant salience may interact with negative affect, or neuroticism, such that people with
high aberrant salience have psychotic-like experiences if they also have high neuroticism.
This would suggest that it is not disturbances in self-processing that contribute to
psychotic-like disturbances, but neuroticism. If the current result is specific to self-
disturbances, then we would expect to replicate the interaction between aberrant salience
and self-concept clarity found in Study 1 and Study 2, but not find an interaction between
aberrant salience and neuroticism in predicting psychotic-like experiences.
In addition to testing the specificity of aberrant salience interacting with self-concept
clarity to predict psychotic-like experiences, a goal of Study 3 was to test whether the
interaction between aberrant salience and self-concept clarity was specific to psychotic-
like experiences. In Study 1 and Study 2, social anhedonia was used to examine
specificity. However, previous research suggests that schizotypy is multidimensional and

22
includes a paranoid factor in addition to a positive and negative factor (Stefanis et al.,
2004). Thus, Study 3 examined whether there was a significant interaction between
aberrant salience and self-concept clarity in predicting paranoia. Paranoia serves as a
more stringent test of the specificity of the interaction because paranoia is more strongly
correlated with psychotic-like experiences than is social anhedonia (Stefanis, et al.,
2004).
The first goal of Study 3 was to replicate the results of Study 1 and Study 2 by
showing that there was a significant interaction between aberrant salience and self-
concept clarity in predicting psychotic-like experiences. The second goal of Study 3 was
to test whether this interaction is specific to self-concept clarity or whether aberrant
salience would also interact with neuroticism to predict psychotic-like experiences. The
third goal of Study 3 was to test the specificity of the interaction by testing whether
aberrant salience and self-concept clarity also interact to predict paranoia.
Method
Participants. Participants were 744 introductory psychology students who
participated in the study for partial completion of a course requirement. Like Study 1 and
Study 2, participants were prescreened from a larger pool of participants (n= 2,197), by
completing abbreviated versions of the Magical Ideation, Perceptual Aberration, and
Social Anhedonia scales. According to previous research (Kerns & Berenbaum, 2003), 81
participants met criteria for high positive schizotypy and 60 participants met criteria for
high negative schizotypy. Sixty-four participants were excluded for having Wisconsin
Infrequency scores of three or greater. Participants ranged from 18-24 years old, with an

23
average age of 18.47 (SD = 0.77). Participants were 61% female, 88% White, 4%
African-American, and 10% other.
Measures. Aberrant Salience. Aberrant Salience was measured with the Aberrant
Salience Inventory (Cicero, et al., 2010), like in Study 1 and Study 2.
Self-Concept Clarity. Self-concept clarity was measured with the Self-Concept
Clarity Scale (Campbell, 1990), like in Study 1 and Study 2.
Psychotic-Like Experiences. As in Study 1 and Study 2, psychosis proneness was
measured with the Magical Ideation Scale (Eckblad & Chapman, 1983), the Perceptual
Aberration Scale (Chapman, et al., 1978)
Social Anhedonia. Like in Study 1 and Study 2, participants completed the
Revised Social Anhedonia Scale (Chapman, et al., 1976).
Neuroticism. Neuroticism was measured with the 10-item subscale of the
International Personality Item Pool (IPIP; Goldberg, 1999). Participants rate items on a
scale from 1 (very accurate) to 5 (very inaccurate). An example item is, “I get stressed
out easily.” Previous research has found that the 10-item neuroticism subscale of the IPIP
is highly correlated with other measures of neuroticism and has high internal consistency.
Paranoia. Paranoia was measured with the eight--item yes-no Suspiciousness
subscale of the Schizotypal Personality Questionnaire (SQP-S; Raine, 1991; e.g., Do you
sometimes get concerned that friends or coworkers are not really loyal or trustworthy?).
In previous research, the SPQ-S has consistently been found to load with other measures
of paranoia on a factor distinct from PerMag scales (e.g., Cicero & Kerns, 2010b).
Infrequency. Participants completed the Wisconsin Infrequency Scale like in
Study 1 and Study 2.

24
Procedure. As part of a larger study that included filler items, participants
completed the Magical Ideation, Perceptual Aberration, Social Anhedonia, and
Wisconsin Infrequency Scales mixed together and called the “Survey of Attitudes and
Experiences.” Then participants completed the Aberrant Salience Inventory, the Self-
Concept Clarity Scale, the Neuroticism subscale of the International Personality Item
Pool, and the Suspiciousness subscale of the Schizotypal Personality Questionnaire.
Results
First, we tested whether there was a significant three-way interaction between
ASI, SCC, and Neuroticism scores in predicting PerMag scores (see Table 6). Mean
centered ASI, SCC, and Neuroticism scores were entered in step 1 of a hierarchical linear
regression. The three two-way interactions were entered in step 2, and the three-way
interaction was entered in step 3. There was not a significant three-way interaction (t
(675) = .72, p = .47). However, as in Study 1 and Study 2, there was a significant
interaction between ASI and SCC scores in predicting PerMag (t (675) = 3.73, p <.001)
such that participants with high aberrant salience and low self-concept clarity had the
highest levels of PerMag. There was not a significant interaction between aberrant
salience and neuroticism in predicting PerMag (t (680) = 0.94, p = .34). Since there was
not a significant two-way interaction between aberrant salience and neuroticism, we
tested whether there were significant main effects for aberrant salience and neuroticism.
Both aberrant salience (t (680) = 18.45, p < .001) and neuroticism (t (680) = 3.98, p =
.03) uniquely contributed to the prediction of PerMag. Similarly, there was not a
significant interaction between neuroticism and self-concept clarity in predicting PerMag
(t (680) = 1.86, p = .06), but both SCC (t (680) = 9.14, p < .001) and neuroticism (t (680)

25
= 2.35, p = .02) uniquely contributed to the prediction of PerMag. This suggests that the
interaction between aberrant salience and self-concept clarity is specific to self-concept
clarity, and not related to an interaction between aberrant salience and negative
affectivity.
Additionally, there was not a significant interaction between self-concept clarity
and aberrant salience in predicting paranoia (t (680) = 0.54, p = .59). However, there
were main effects for both self-concept clarity and aberrant salience in predicting
paranoia (see Table 7).
Discussion
Study 3 replicated the results of Study 1 and Study 2 by finding that there was a
significant interaction between aberrant salience and self-concept clarity in predicting
psychotic-like experiences. In addition, Study 3 found that there was not a significant
interaction between aberrant salience and neuroticism in predicting psychotic-like
experiences. Although neuroticism is associated with psychotic-like experiences, this
association remains constant at all levels of aberrant salience. Thus, it appears that there
is something specific about self-concept clarity that is distinct from negative affect that
interacts with aberrant salience to predict psychotic-like experiences. This is consistent
with previous theoretical models and phenomenological descriptions of psychosis, which
suggest that it is a specific disturbance in the processing of self-relevant information that
results in psychosis, rather than just a general feeling of negative affect (Freeman, 2007;
Moller & Husby, 2000). The current research also found that self-concept clarity and
aberrant salience did not interact to predict paranoia, which provides a more stringent test

26
for the specificity of the interaction between aberrant salience and self-concept clarity in
predicting PerMag.
Study 1 –Study 3 included unselected samples of college students oversampled
for a risk for schizophrenia. Moreover, these studies relied on self-report as the primary
measure of psychotic-like experiences. Research has suggested that interview measures,
while still partially self-report, may provide a better indicator of psychotic-like
experiences than self-report alone (Kendler, Lieberman, & Walsh, 1989; Kendler,
Thacker, & Walsh, 1996). The first goal of Study 4 was to screen a large number of
participants to identify a sample of people with high positive schizotypy and negative
schizotypy, as well as 50 control participants for participation in Study 5, which included
an in-depth interview assessment of psychotic-like experiences, the Structured Interview
for Prodromal Syndromes (Miller et al., 2003). In addition, a second goal of Study 4 was
to include an additional task measure associated with dopamine function, the
Probabilistic Selection Task (Frank, Seeberger, & O'Reilly R, 2004). I hypothesized that
scores on this task would be correlated with measures of psychotic-like experiences and
would be elevated in a group of participants with high positive schizotypy.

27
Study 4
The primary goal of Study 4 was to screen participants for high positive and
negative schizotypy. Study 4 includes the 724 participants in Study 1 and an additional
274 participants. In the current research, this is reported as a separate study for ease of
presentation. The second goal of Study 4 was to test whether people with positive
schizotypy had higher levels of aberrant salience than negative and control participants.
This study also included a task measure that is sensitive to differences in subcortical
dopamine, which I hypothesized would be higher in positive than negative and control
participants. The third goal of Study 4 was to examine between group differences in self-
relevant information processing. I expected to find that participants with high positive
schizotypy would have lower self-esteem and self-concept clarity than would negative
schizotypy and control participants. As described below, participants were recruited for
Study 4 from a larger pool of undergraduate students using abbreviated versions of the
Wisconsin Schizotypy Scales, following convention. Participants who met criteria for
Positive, Negative, and Control groups, as described below were invited to participate in
Study 5. Study 5 included the Structured Interview for Prodromal Syndromes, which is a
more in-depth and time-consuming measure of psychotic-like experiences.
Method
Participants. Participants were recruited in a two-step process. First, participants
were recruited from a larger pool of undergraduate students (n=2,244). These participants
completed abbreviated versions of the Magical Ideation Scale (Eckblad & Chapman,
1983), the Perceptual Aberration Scale (Chapman, et al., 1978), and the Revised Social
Anhedonia Scale (Eckblad, Chapman, Chapman, & Mishlove, 1982). Following previous
28
research (e.g., Chapman, et al., 1994; Edell, 1995; Lenzenweger, 1994), participants were
recruited to take part in the second screening phase if they scored above two standard
deviations above the mean on the Magical Ideation Scale, Perceptual Aberration Scale, or
Revised Social Anhedonia Scale, or if they scored a combined three standard deviations
above the mean on the Magical Ideation and Perceptual Aberration Scales. In addition, a
comparison group of participants scoring less than 0.5 standard deviations above the
mean on all three scales were recruited to participate in the second screening phase.
In the second screening phase, participants completed the full versions of the
Magical Ideation, Perceptual Aberration, and Social Anhedonia Scales and were
categorized into a Positive, Negative, or control group based on norms established in
previous research (Kerns & Berenbaum, 2003) in the manner described above.
Positive Schizotypy Group. Participants in the positive schizotypy (n = 85)
group scored two standard deviations above the mean on the Magical Ideation Scale or
the Perceptual Aberration Scale or a combined three standard deviations above the mean
on both scales. Participants were 48% Female, 80% White, 9% African-American, 3%
Asian American, 5% Biracial, and 4% Other. The mean age was 18.53 (SD = 0.79).
Negative Schizotypy Group. Participants in the negative schizotypy group (n =
91) scored above two standard deviations above the mean on the Revised Social
Anhedonia Scale. Participants were 71% female, 71% White, 18% African-American,
3% Asian-American, 3% biracial, and 4% other. The mean age was 18.72 (SD = 1.23).
Control Group. Participants in the control group (n = 441) scored below 0.5
standard deviations above the mean on the Magical Ideation Scale, Perceptual Aberration
Scale, and Revised Social Anhedonia Scale. Participants were 60% female, 89% White,
29
6% African-American, 2% Asian American, 1% Hispanic, 1% Biracial, and 1% other.
The mean age was 18.60 (SD = 1.09).
Materials
Positive Schizotypy. Like in Study 1, Study 2, and Study 3, magical ideation was
measured with the Magical Ideation Scale (Eckblad & Chapman, 1983), and perceptual
aberration was measured with the Perceptual Aberration Scale (Chapman, et al., 1978).
Negative Schizotypy. As described in Study 1, Study 2, and Study 3, negative
schizotypy was measured with the Revised Social Anhedonia Scale (Eckblad, et al.,
1982).
Aberrant Salience. Like in Study 1, Study 2, and Study 3, aberrant salience was
measured with the Aberrant Salience Inventory (Cicero, et al., 2010).
Reward Processing. The Probabilistic Selection Task (PST; Frank, et al., 2004)
was used to measure individual differences in reward processing style. In particular, the
PST assesses preference for approaching rewards versus avoiding punishment. In this
task, participants choose the correct stimulus among pairs of stimuli (unfamiliar Hiragana
characters). These stimuli are reinforced probabilistically. In the AB pair, A is rewarded
80% of the time, while B is rewarded only 20% of the time. In the CD pair, C is rewarded
70% of the time while D is rewarded only 30% of the time, and in the EF pair, E is
rewarded 60% of the time while F is rewarded 40% of the time. Participants complete the
first block of the task until they learn to reliably choose A over B (at least 70% of the
time), C over D (at least 60% of the time), and E over F (at least 50% of the time).
Participants are then presented with novel combinations of stimuli (e.g., AD, AF, BC,
BF) and asked to choose a stimulus in the absence of feedback. The dependent variable is

30
the individual difference in preference for choosing stimulus A vs. avoiding stimulus B.
We chose to include the PST in the current research because it has been found to be
associated with levels of dopamine (Frank, et al., 2004), delusions in people with
schizophrenia (Waltz & Gold, 2007), and brain regions that are associated with dopamine
activity, including the nucleus accumbens (Frank, 2005).
Self-Concept Clarity (SCC). Like in Study 1, Study 2, and Study 3, self-concept
clarity was measured with the Self-Concept Clarity Scale (SCCS; Campbell, 1990). A
second measure of self-concept clarity was the Me-Not-Me Decision Task (MNMDT;
Campbell et al., 1996), also described in Study 1.
Self-Esteem. Explicit self-esteem was measured with the Rosenberg Self-Esteem
Scale (RSES; Rosenberg, 1965). The RSES has been shown to have high internal
consistency and test-retest reliability (Rosenberg, 1965) and may be the most commonly
used measure of trait self-esteem (Leary, Tambor, Terdal, & Downs, 1995).
Results
Participant Recruitment. The first goal of Study 4 was to screen participants and
identify people who meet Wisconsin Schizotypy criteria for high positive schizotypy,
high negative schizotypy, and control. Of the 998 participants who participated in Study
4, 85 met criteria for positive schizotypy, 91 met criteria for negative schizotypy, and 441
met criteria for the control group. All participants meeting criteria for positive
schizotypy, all meeting criteria for negative schizotypy, and a subset of the participants
meeting criteria for the control group were invited to participate in Study 5. Following
convention (Chapman, et al., 1994), if participants met criteria for both the positive and
31
negative group, they were assigned to the group that for the scale on which they had the
highest z-score.
Between Groups Comparisons for Aberrant Salience Variables. The second goal
of Study 4 was to examine whether the positive group displayed increased aberrant
salience, impaired approach or avoidance learning, and an increased preference for
approach over avoidance learning. Prior to examining this, I tested whether aberrant
salience, as measured with the ASI, was associated with PST scores. This was done to see
if the PST and ASI were highly correlated enough to create a composite aberrant salience
variable. Clearly, they were not, as the ASI was not significantly correlated with
approach learning (r = .01), avoidance learning (r =.02), or a preference for approach
over avoidance learning (r = .03).
To test for differences between groups in aberrant salience, I used a one-way
ANOVA to examine group differences, followed by planned independent samples t-tests
for the three comparisons between groups (i.e., positive vs. control, positive vs. negative,
and negative vs. control). As can be seen in Table 8, the positive group had higher ASI
scores than both the negative group (t (605) = 22.99, p < .001) and the control group (t
(605) = 10.20, p < .001), while the negative group had higher scores than the control
group (t (605) = 5.00, p < .001).
The second measure of aberrant salience was the Probabilistic Selection Task
(Frank, et al., 2004). I hypothesized that positive participants would display a tendency to
approach rewards more than to avoid punishments, reflecting an increase in subcortical
dopamine. As can be seen in Table 8, the positive group showed deficits in both
approaching rewards (t (605) = 2.24, p = .03) and avoiding punishments (t (605) = 2.31, p

32
= .03) when compared to the control group. The negative group was also impaired in
approach (t (605) = 2.23, p = .03) and avoidance (t (605) = 2.31, p = .03) compared to the
control group. However, the positive and the negative group did not differ in terms of
approach (t (605) = 0.12, p = .91) or avoidance learning (t (605) = 1.20, p = .91). In
contrast to my hypothesis, there were no significant differences among groups in terms of
a preference for approach vs. avoidance learning (F (2, 603) = 0.54, p = .58).
Between Group Comparisons in Self-Relevant Information Processing. The
third goal of Study 4 was to test between group differences in self-esteem and self-
concept clarity. Prior to conducting these analyses, I examined how strongly the self-
relevant information processing variables were correlated with each other. As expected,
the Self-Concept Clarity Scale was positively correlated with the MNMDT and
negatively correlated with the reaction time measure, which suggests that as self-concept
clarity increased participants made me not-me decisions faster. Moreover, self-esteem
was positively correlated with the MNMDT and negatively correlated with MNMDT
reaction times (see Table 9).
As can be seen in Table 10, participants in the positive (t (605) = 9.24, p < .001)
and negative (t (605) = 8.99, p < .001) group had lower SCCS scores than control group,
but did not significant differ from each other (t (605) = 0.66, p = .51). Participants in the
positive (t (605) = 2.68, p = .01) and negative (t (605) = 4.79, p < .001) group had lower
SCCS scores than control group, but did not significant differ from each other (t (605) =
1.42, p = .16). Participants in the negative group were slower to rate words as “me” or
“not me” than were participants in the control group (t (605) = 2.21, p = .03), but did not
differ from the positive group (t (605) = 0.47, p = .64). The positive group did not differ

33
from the control group in MNMDT reaction times (t (605) = 1.47, p = .14). Finally,
participants in the positive (t (605) = 5.12, p = .01) and negative (t (605) = 7.86, p < .001)
group had lower SCCS scores than control group, but did not significantly differ from
each other (t (605) = 1.47, p = .15).
Study 4 Discussion
The first goal of Study 4 was to identify enough participants who meet criteria for
Wisconsin Schizotypy Positive, Negative, and Control groups. Of the nearly 1,000
participants in this study, 85 met criteria for positive schizotypy, 91 met criteria for
negative schizotypy, and 441 met criteria for the control group. Thus, roughly 8.5% of
the sample met criteria for high positive schizotypy and 9.2% met criteria for high
negative schizotypy. This percentage of participants with high positive schizotypy
exceeds the rate of participants with positive schizotypy (3.0%) that I have found in
previous research that made no effort to specifically recruit participants with high
positive schizotypy (Cicero & Kerns, 2010b). This suggests that the strategy of
prescreening participants was successful in increasing the number of positive schizotypy
participants in the study.
Study 4 also showed that participants with positive schizotypy had elevated scores
on the Aberrant Salience Inventory. This finding is consistent with previous research
using the ASI in college student populations with high-risk designs (Cicero, et al., 2010)
and with other research on aberrant salience in schizotypy (Schmidt & Roiser, 2009).
However, Study 4 did not find the expected preference for approach versus avoidance
learning in participants with high positive schizotypy, and PST scores were not
significantly associated with aberrant salience scores. One potential reason for not finding

34
a significant result in this study was that the study was limited by time constraints. In the
PST, participants repeat the initial trial until they meet criterion. Essentially, participants
continue on the first block until they successfully learn the reward contingencies,
demonstrated by choosing the rewarded stimuli and avoiding the non-rewarded stimuli.
However, due to time constraints, participants moved on to the second block after ten
tries, even if they did not meet criterion. Some participants may not have successfully
learned the contingencies and the approach-minus-reward variable may not actually
reflect a preference for approach learning in these participants. If participants who did not
meet criterion were excluded from the study, the pattern of results did not change.
Instead of finding an elevated preference for approach versus avoidance learning
in Study 4, I found that participants with both high positive and high negative schizotypy
chose the rewarded stimulus and avoided the non-rewarded stimulus less than did control
participants. This suggests that people with high schizotypy have impairments in learning
reward contingencies, and that this effect is not specific to positive schizotypy as
hypothesized. However, this finding is consistent with some previous research, which
suggests that schizotypy and schizophrenia are associated with impaired associative
learning (Martins Serra, Jones, Toone, & Gray, 2001). Moreover, previous research has
found that schizotypy is associated with a reduction in learned irrelevance, which may be
associated with general impairments in learning (e.g., N. S. Gray & Snowden, 2005; Le
Pelley, Schmidt-Hansen, Harris, Lunter, & Morris, 2010; Schmidt-Hansen, Killcross, &
Honey, 2009).
Study 4 also found that both the positive and negative groups had lower Self-
Concept Clarity Scale, Me Not-Me Decision Task, Rosenberg Self-Esteem Scale scores

35
and slower Me Not-Me Decision Task reaction times than the control group. These
findings are consistent with social-cognitive models of psychotic-like experiences that
posit a central role for self-relevant information processing (e.g., Freeman, 2007; Garety,
et al., 2001). The schizotypy groups consistently had lower self-concept clarity scores
with the self-report measure, the consistency of their responses on the MNMDT and the
speed with which they made these responses. This suggests that participants have low
self-concept clarity both in their explicit judgments of their personalities, as well as with
measures that may be outside of conscious awareness (Campbell, et al., 1996).
The finding that the positive and negative schizotypy groups have lower self-
esteem than the control group is consistent with some previous research that suggests low
self-esteem is associated with facets of schizotypy, including paranoia (Cicero & Kerns,
2010a; Combs & Penn, 2004; Thewissen, et al., 2008) and referential thinking (Cicero &
Kerns, 2011). However, to my knowledge, no published research has shown that magical
ideation or perceptual aberration is associated with self-esteem, despite several studies
showing that magical ideation and perceptual aberration are associated with constructs
highly correlated with self-esteem such as neuroticism (Ross, Lutz, & Bailley, 2002),
depression (Rey, Jouvent, & Dubal, 2009), and low positive affect (Watson & Naragon-
Gainey, 2009).
One limitation of Study 1-Study 4 is that they used largely unselected college
student samples and relied primarily on self-report instruments. Although, Study 1 and
Study 4 included a task measure of self-concept clarity and Study 4 included a task
measure of dopamine functioning. The reliance on subclinical samples raises questions
about the generalizability of the results to samples that include people with clinically

36
meaningful psychotic-like and psychotic symptoms. In Study 5, these limitations were
addressed by recruiting only participants who met criteria for positive, negative, and
control groups and using an interview measure of psychotic-like experiences.

37
Study 5
The main finding of Study 1, Study 2, and Study 3 was that there was a significant
interaction between aberrant salience and self-concept clarity in predicting psychotic-like
experiences. The first goal of Study 5 was to replicate this result with interview-rated
psychotic-like experiences. The second goal of Study 5 was to examine whether the
positive schizotypy group would show more aberrant salience on other questionnaire and
task measures of aberrant salience compared to the negative schizotypy and control
groups. Additionally, Study 5 examined whether aberrant salience was associated with
interview-rated psychotic-like experiences. The third goal of Study 5 was to test whether
the positive group had lower self-concept clarity and self-esteem than the negative and
control groups, and whether self-concept clarity was negatively correlated with
interview-rated psychotic-like experiences.
In addition to examining the relations among aberrant salience, self-concept
clarity, and interview-rated psychotic-like experiences, the fourth goal of Study 5 was to
compare the effectiveness of several schizotypy questionnaire measures in identifying
people who would be rated as having clinically meaningful interview assessed psychotic-
like experiences. There has been a debate in recent research about the best methodology
for identifying people at risk for developing schizophrenia (Kulhara, Banerjee, & Dutt,
2008; Phillips, Yung, & McGorry, 2000). Research suggests that interview measures are
generally more accurate than self-report questionnaire measures (Kendler, et al., 1989;
Kendler, et al., 1996). By far, the most commonly used measures for identifying
undergraduate college students at risk for the development of psychosis is the Wisconsin
Schizotypy Scales. This has been referred to as the psychometric high-risk strategy

38
(Lenzenweger, 1994). A goal of the current research was to examine how well
participants identified with this strategy correspond to participants identified as having
clinically significant psychotic-like experiences on the Structured Interview for
Prodromal Syndromes. In addition to the Wisconsin Schizotypy Scales, several other
scales have more recently been developed to measure schizotypy. Another goal of the
current research was to examine which of these measures were the best predictors of
interview-rated psychotic-like experiences.
Method
Participants. Participants who met criteria for positive, negative, or comparison
groups in Study 4 were asked to participate in Study 5, which took about approximately
two hours to complete. Thus, participants’ group membership was based on their scores
on the Wisconsin Schizotypy Scales in Study 4. In addition, participants’ scores on the
ASI and SCCS in Study 4 were used to examine the interaction between aberrant salience
and self-concept clarity in predicting interview-rated psychotic-like experiences. Like in
Study 4, if a participant met criteria for both the positive and negative group, they were
assigned to the group for the scale on which they had the highest Z-score.
Positive Group. Like in Study 4, participants in the positive group scored 1.96
standard deviations above the mean or higher on the Magical Ideation or Perceptual
Aberrant Scale, or a combined 3.0 standard deviations above the mean on both scales.
There were 51 participants in the positive group who had a mean age of 18.56, (SD =
0.85), were 43% female, 76% White, 10% African-American, 4% Asian American, and
8% other.

39
Negative Group. Like in Study 4, participants in the negative group scored more
than 1.96 standard deviations above the mean on the Revised Social Anhedonia Scale.
There were 61 participants in the negative schizotypy group who had a mean age of 18.96
(SD = 1.53), were 65% female, 72% White, 19% African-American, 4% biracial, and 6%
other.
Control Group. Like in Study 4, participants in the control group scored less than
.5 standard deviations above the mean on the Magical Ideation Scale, Perceptual
Aberration Scale, and Revised Social Anhedonia Scale. There were 44 participants in the
comparison group who had a mean age of 18.58 (SD = 1.03), were 54% female, 94%
White, 2% African-American, and 2% Asian American.
Materials. Symptom Assessment and Ratings. The Structured Interview for
Prodromal Syndromes (SIPS; Miller, et al., 2003) was used to assess for risk for
psychosis and to obtain ratings for positive, negative, and disorganized symptoms of the
prodromal syndrome. The SIPS is a semi-structured interview designed to assess the
prodromal stage of the development of schizophrenia. The SIPS, and the accompanying
Scale of Prodromal Syndromes (SOPS), were designed to be similar to the Positive and
Negative Syndrome Scales (PANNS; Kay, Fiszbein, & Opler, 1987) but to assess
prodromal symptoms rather than full-fledged clinical symptoms. The SIPS was designed
to measure the three main factors of schizophrenia symptoms: positive, negative, and
disorganized. The SIPS was chosen for the current study because it contains
modifications to the positive symptom scales in order to access a wider variety of
symptoms in more detail and to extend these assessments into less severe, pre-psychotic
ranges.

40
Prior to conducting Study 5, I was trained in the administration and scoring of the
interview by one of the creators of the SIPS, Barbara Walsh, at the Psychosis Prodrome
Research Clinic (PRIME Clinic) at Yale University. I met criteria for certification in the
administration of the SIPS by meeting a standard for inter-rater reliability with clinicians
and researchers at the PRIME Clinic.
Anomalous Perceptual Experiences. The Structured Interview of Assessing
Perceptual Anomalies (SIAPA; Bunney et al., 1999) was used to assess anomalous
perceptual experiences. Participants are asked open-ended questions about their
perceptual experiences in the last week, and ratings are made on a Likert scale. The
SIAPA contains three subscales for perceptual hypersensitivity, inundation, and selective
attention to external sensory stimuli. These ratings are made on a scale of 1 (Never), 2
(Rarely), 3 (Half the time), 4 (Often), and 5 (Always). Previous research has found that
the SIAPA has high inter-rater reliability, and patients with schizophrenia had higher
scores than control participants on all three rating scales (Bunney, et al., 1999).
A second measure of anomalous perceptual experiences was the Cardiff
Anomalous Perception Scale (CAPS; Bell et al., 2006b). The CAPS contains 32 items
that measure anomalous perceptual experiences (e.g., do you ever find that sounds are
distorted in strange or unusual ways?). Participants answer “yes” or “no” to each
question. For each affirmative answer, they answer three follow-up questions about how
distressing the experience was (1 not at all distressing to 5 very distressing), how
distracting the experience was (1 not at all distracting to 5 completely distracting), and
how frequently the experience occurs (1 happens hardly at all to 5 happens all the time).
Thus, subscale scores can be calculated for distress, distraction, and frequency. In

41
previous research the CAPS has been found to be correlated with other measures of
unusual perceptual experiences and to be higher in psychotic populations than in non-
psychotic populations.
Aberrant Salience. One measure of aberrant salience was the Salience Attribution
Test (SAT; Roiser, et al., 2008). The SAT was designed to assess impaired learning of
task-relevant stimulus-reinforcement associations in the presence of task-irrelevant cues.
In the task, participants make a speeded response to a probe in order to earn money. Cues
appear just before the onset of the probe and signal the probability that the participant
will earn money on that trial. Cues vary on two dimensions: Color (red or blue) and
Shape (chair or animal). The probability of earning money on a given trial is only related
to one stimulus dimension (e.g., chair cues signal the probability of being rewarded
87.5% of the time, while animal cues signal being rewarded 12.5% of the time; color is
not relevant to whether the participant is rewarded). The task-relevant dimension was
counterbalanced to avoid the possibility that one type of stimuli is inherently more salient
than others. Implicit and explicit aberrant salience scores were calculated. Implicit
aberrant salience reflects the extent to which participants do not speed up their reaction
times for the high probability of reward in comparison to the low probability of reward
cues (i.e., the absolute value of the difference in reaction times for the high probability of
reward cues and the low probability of reward cues). After the task, participants were
asked to estimate how frequently they think the stimuli were rewarded. Explicit aberrant
salience refers to the absolute value of the difference between estimates of the reward
level for the task irrelevant stimuli. The SAT contains two blocks of 64 trials each.

42
In addition to implicit and explicit aberrant salience, the SAT provides
information about how well participants are actually learning the reward contingencies.
This is referred to as adaptive salience. Implicit Adaptive Salience refers to how much
faster participants are for the rewarded stimuli, in which faster responses result in earning
more points, than they are for non-reward stimuli, in which participants do not earn
points regardless of the speed of their responses. For example, if red chairs and red cats
are the rewarded variables and blue chairs and blue cats are the non-rewarded variables,
Implicit Adaptive Salience is the difference score between reaction times for the mean of
the blue stimuli and the mean of the red stimuli.
Similarly, Explicit Adaptive Salience is the difference score between the
participants’ estimates of the how often the truly rewarded stimuli were rewarded minus
their estimates of how often the truly non-rewarded stimuli were rewarded. This
represents how well the participants explicitly learned the reward contingencies.
In addition to these four scores (implicit aberrant salience, implicit adaptive
salience, explicit aberrant salience, and explicit adaptive salience), I examined group
differences for the implicit reaction times and explicit ratings for the rewarded and non-
reward stimuli. This allowed for the examination of whether there were group differences
in estimates of the reward stimuli that were not also dependent on estimates of non-
rewarded stimuli, and vice versa.
A second measure of aberrant salience in Study 5 was a modified version of the
ASI used in Study 1-Study 4. Participants were presented with the same items as in
previous studies, but were instructed to respond only for experiences they had in the last
two weeks. This allowed for us to examine the relations between current, as opposed to
43
lifetime, aberrant salience and other variables in Study 5. Additionally, if participants
answered affirmatively to an item, they were instructed to answer a follow-up question
about how frequently it happened in the last two weeks. Two scores were calculated
based on this version of the ASI. First, the affirmative answers were summed for an ASI
last-two-weeks score. Second, the frequency scores were summed to create an ASI-
Frequency score.
Self-Concept Clarity. Self-concept clarity was measured with the Self-Concept
Clarity Scale as in Study 1 – Study 4. A second measure of self-concept clarity in Study
5 was a modified version of the MNMDT from Study 4. Participants were not asked to
respond as quickly as possible. Instead, participants were asked follow-up questions
about how sure they were about their responses. If the participant answered “me” to the
adjective, they were asked, “How sure are you that this word describes you?” on a scale
from 1 (Not at all sure) to 7 (Completely sure). Conversely, if they answered “not me” to
the adjective, they were asked “How sure are you that this word does not describe you?”
on the same 1-7 scale. This allowed for the calculation of a self-concept clarity
confidence score in addition to the score of consistent responding like in Study 1.
Paranoia. Like in Study 3, paranoia was measured with the Suspiciousness
Subscale of the Schizotypal Personality Questionnaire (SPQ-S; Raine, 1991).
Results
Aberrant Salience, Self-Concept Clarity, and Interview-Rated Psychotic-Like
Experiences. The first goal of Study 5 was to replicate the interaction from Study 1-
Study 3 with interview measures of psychotic-like experiences. Prior to conducting the
regression analysis, I examined a scatter plot of the interaction term (ASI X SCCS) and
44
positive symptom ratings. One participant was identified as an outlier. This participant
had very high ASI (27) and SCC (51) scores, which lead to the participant having the
highest ASI X SCC product score in the sample. Removing this participant from the
study did not change the pattern of results. Since this participant was identified as an
outlier based on ASIXSCC scores, this participant was removed from all moderator
analyses.
To test the interaction between ASI and SCC, mean centered ASI scores and
mean centered SCCS scores were entered in step one of a hierarchical linear regression
predicting a composite positive rating score (the mean of the five positive ratings). The
product of ASI and SCCS scores was entered in step 2. As can be seen in Table 11, there
was a significant interaction between aberrant salience and self-concept clarity such that
participants with high aberrant salience and low self-concept clarity had the highest levels
of interview rated positive symptoms (t (159) = 2.64, p = .02; see Figure 2). Like in Study
1-Study 3, self-concept clarity was negatively associated with positive symptoms at high
levels of aberrant salience (t (159) = 3.13, p < .01), but not at low levels of aberrant
salience (t (159) = 0.16, p = .87). Similarly, there was a significant interaction between
aberrant salience and self-concept clarity in predicting delusional ideation (t (159) = 2.00,
p < .05) and Grandiosity (t (159) = 2.43, p = .02), but not paranoia (t (159) = 4.45, p =
.15), perceptual anomalies (t (159) = 1.50, p = .14), or disorganized communication (t
(159) = 1.34, p = .18). Like the composite positive score, SCCS was negatively correlated
with delusional ideation at high levels of aberrant salience (t (159) = 2.03, p = .04), but
not at low levels of aberrant salience (t (159) = 0.70, p = .48). The SCCS was negatively
correlated with grandiosity at high levels of aberrant salience (t (159) = 2.79, p < .01), but

45
not at low levels of aberrant salience (t (159) = 0.25, p = .80). As can be seen in Table
11, there were main effects for both aberrant salience and self-concept clarity in
predicting paranoia. However, SCCS was unrelated to perceptual anomalies and
disorganized communication at all levels of aberrant salience.
Aberrant Salience, Self-Concept Clarity, and Negative Symptoms. As can be
seen in Table 12, there was not a significant interaction between aberrant salience and
self-concept clarity in predicting negative composite scores (t (159) = -0.45, p = .66),
social anhedonia (t (159) = 1.11, p = .27), avolition (t (159) = -0.32, p = .75), impaired
expression of emotion (t (159) = -0.69, p = .49), impaired experience of emotions and self
(t (159) = -1.49, p = .14), ideational richness (t (159) = 0.26, p = .79), or impaired
occupational function (t (159) = -0.45, p = .66). Since these interaction effects were not
significant, main effects were examined. There was not a significant main effect for
aberrant salience in predicting negative composite (t (159) = -0.86, p = .39), social
anhedonia (t (159) = -1.63, p = .11), avolition (t (159) = 0.93, p = .35), impaired
expression of emotion (t (159) = -0.04, p = .68), impaired experience of emotions and self
(t (159) = -0.10, p = .24), ideational richness (t (159) = -0.14, p = .89), or impaired
occupational function (t (159) = .07, p = .94). Conversely, self-concept clarity was
negatively associated with negative composite (t (159) = -4.26 p < .001), social
anhedonia (t (159) = -2.35, p = .02), avolition (t (159) = -.295, p = .004), impaired
expression of emotion (t (159) = -2.58, p = .01), impaired experience of emotions and self
(t (159) = -4.30, p < .001), or impaired occupational function (t (159) = -1.04, p = .30),
but not ideational richness (t (159) = -1.40, p = .17) ratings.

46
Aberrant Salience, Self-Concept Clarity, and Disorganized Symptoms. As can
be seen in Table 13, there was not a significant interaction between aberrant salience and
self-concept clarity in predicting disorganized composite scores (t (159) = -0.65, p = .52),
odd behavior (t (159) = -0.21, p = .84), bizarre thinking (t (159) = -1.82, p = .07), or
impaired focus and attention (t (159) = 0.13, p = .13). Since these interactions were not
significant, main effects were examined. As can also be seen in Table 13, aberrant
salience was associated with disorganized composite scores (t (159) = 3.13, p < .01), odd
behavior (t (159) = 2.04, p = .04), bizarre thinking (t (159) = 3.09, p = .002), and
impaired focus and attention (t (159) = 2.31, p = .02). Additionally, self-concept clarity
was negatively associated with disorganized composite scores (t (159) = -2.11, p = .04)
and impaired focus and attention (t (159) = -3.70, p < .001), but not odd behavior (t (159)
= -0.94, p = .35), or bizarre thinking (t (159) = -0.66, p = .51).
Aberrant Salience, Self-Concept Clarity, and Interview-Rated Anomalous
Perceptual Experiences. As can be seen in Table 14, there was a significant interaction
between aberrant salience and self-concept clarity in predicting SIAPA total scores (t
(159) = -3.10, p = .002). The probe of the interaction showed that self-concept clarity was
associated with SIAPA scores at 1 SD above the mean on aberrant salience (t (159) = -
3.88, p < .001), but not at -1 SD below the mean (t (159) = 0.12, p = .91). Similarly, there
was a significant interaction between aberrant salience and self-concept clarity in
predicting all three subscales of the SIAPA. Self-concept clarity was associated with
SIAPA Hypersensitivity, Inundation, and Selective Attention scores at high levels of
aberrant salience but not at low levels of aberrant salience.

47
Between Group Comparison for Aberrant Salience. The second goal of Study 5
was to examine whether there were group differences in aberrant salience variables. I
hypothesized that the positive group would display more aberrant salience in both the
questionnaire and task measures of aberrant salience. Prior to testing group differences
in aberrant salience, I examined the bivariate correlations among the aberrant salience
variables. As can be seen in Table 15, the non-modified ASI administered in Study 4
was positively correlated with the modified ASI (Last 2 weeks) in Study 5 and the ASI
last-two-weeks frequency scores from the follow-up question. ASI frequency scores
were positively correlated with Implicit Aberrant Salience on the Salience Attribution
Task. Explicit Aberrant Salience scores were negatively correlated with Implicit
Aberrant Salience Scores.
To test for group comparisons in aberrant salience variables, I used a one-way
ANOVA, followed by planned independent samples t-tests for the three comparisons
between groups (i.e., positive vs. control, positive vs. negative, and negative vs. control).
As predicted, the positive group had higher ASI scores compared to the negative (t (159)
= 6.62, p < .001) and control group (t (159) = 5.29 p < .001) when participants were
instructed to restrict their responses to just the past two weeks (see Table 16). There was
a trend for the negative group to have higher scores than the control group (t (159) =
1.85, p = .07). As expected, participants in the positive group reported that these
experiences of aberrant salience occurred more frequently than the experiences of
aberrant salience reported by negative (t (159) = 6.06, p < .001) and control participants
(t (159) = 4.98, p < .001), and there was a trend for the negative group to report a higher
frequency of aberrant salience experiences than the control group (t (159) = 6.62, p = .07)

48
The other measure of aberrant salience in Study 5 was the Salience Attribution
Task. The Salience Attribution Task provides both explicit and implicit ratings of
aberrant salience as well as implicit and explicit ratings of rewarded and non-rewarded
stimuli. As can be seen in Table 16, there was a trend for the positive group to rate the
rewarded stimuli as more rewarding than did the negative group (t (159) = 1.89, p = .06),
and the control group rated the rewarded stimuli are more rewarding than did the negative
group (t (159) = 2.76, p < .01). In contrast to my hypothesis, there was a trend for the
negative group to display more explicit aberrant salience than did the positive group (t
(159) = 1.89, p = .06) and there were no group differences in implicit aberrant salience (F
(2, 147), 1.00, p = .37), reaction times for rewarded trials (F (2, 147), 0.61, p = .54), or
reaction times for non-rewarded trials (F (2, 147), 0.42, p = .66).
Group Differences in Self-Relevant Information Processing. The third goal of
Study 5 was to examine whether there were differences between Wisconsin Schizoytpy
groups in self-concept clarity and self-esteem. I hypothesized that the positive group
would have lower self-concept clarity and self-esteem than the negative and control
groups. Prior to testing for group differences, I examined the correlations among the self-
processing variables in the studies. As can be seen in Table 17, nearly all of the self-
processing variables were strongly positively correlated with each other. Notably, the
modified MNMDT, in which participants were not instructed to go as quickly as possible,
was more strongly correlated with the self-report measure of self-concept clarity than was
the original MNMDT in which participants are instructed to go as quickly as possible in
Study 4 (r = .33 vs. .20, respectively). This suggests that allowing people to take their

49
time and make ratings increases the correspondence between the consistency of their
responses and their explicit opinions of the clarity of their self-concepts.
As can be seen in Table 18, the positive (t (159) = 7.12, p < .001) and negative
groups (t (159) = 5.58, p < .001) had lower SCCS scores than the control group, and there
was a trend for the positive group to have lower SCCS scores than the negative group (t
(159) = 1.87, p = .06). The second measure of self-concept clarity was the modified
MNMDT in which participants did not have to respond quickly and were asked follow-up
questions about the “confidence” of their responses. Positive participants had lower
modified MNMDT scores than the control group (t (159) = 4.78, p < .001), and there was
a trend for positive participants to have lower scores than the control group (t (159) =
1.84, p = .07). Negative participants had lower modified MNMDT scores than the control
group (t (159) = 3.16, p < .01). The negative group had less confidence in their ratings
than the control group (t (159) = 2.40, p = .02), but the positive group did not differ from
the negative group (t (159) = 1.31, p = .19) or the control group (t (159) = 1.06, p = .29).
Like in Study 4, both the positive (t (159) = 3.46, p < .001) and negative (t (159) = 3.85,
p < .001) groups had lower self-esteem scores than the control groups, but the positive
and negative groups did not differ from each other (t (159) = 0.24, p = .81).
Group Comparisons of Interview-Rated Psychotic-Like Experiences. If the
Wisconsin Schizotypy groups are valid indicators of psychotic-like experiences, then I
would expect to find that the positive group had more interview-rated positive symptom
than the negative and control group. Moreover, the Wisconsin negative group should
have higher interview-rated negative symptoms than the positive and control groups. As
can be seen in Table 19, the positive group had higher global interview-rated positive

50
scores than the negative (t (155) = 5.45, p < .001) and control (t (155) = 8.43, p < .001)
group, and the negative group was significantly higher than the control group (t (155) =
3.54, p < .001). The positive group had higher interview-rated delusional ideation than
the negative (t (155) = 5.92, p < .001) and control groups (t (155) = 7.76, p < .001), while
the negative group was higher than the control group (t (155) = 2.39, p = .02). Similarly,
the positive group had higher paranoia scores than the control group (t (155) = 7.19, p <
.001) and the negative group (t (155) = 2.80, p = .01), which was higher than the control
group (t (155) = 5.10, p < .001). The positive group had higher grandiosity scores than
the control group (t (155) = 5.44, p < .001) and the negative group (t (155) = 4.68, p <
.001), but there was not a significant difference between the control and negative groups
(t (155) = 1.17, p = .24). The positive group had higher interview-rated perceptual
anomalies than the control group (t (155) = 5.82, p < .001) and the negative group (t
(155) = 2.80, p = .01), which was higher than the control group (t (155) = 5.10, p < .001).
Finally, the positive (t (155) = 5.10, p < .001) and negative (t (155) = 3.42, p = .001)
groups had higher disorganized communication scores than the control group, but the
positive group did not differ from the negative group (t (155) = 1.34, p = .18).
Group Comparisons of Interview-Rated Negative Symptoms. As can be seen in
Table 20, the negative group had higher global negative ratings than the control group (t
(155) = 6.99, p < .001) and the positive group (t (155) = 3.24, p = .001), which was
higher than the control group (t (155) = 3.73 p < .001). Additionally, the negative group
had higher interview-rated social anhedonia than the control (t (155) = 8.87, p < .001)
and positive group (t (155) = 7.02, p < .001), which had higher scores than the control
group (t (155) = 2.06, p = .04). Both the negative (t (155) = 2.91, p = .004) and positive (t

51
(155) = 3.29, p = .001) had higher interview-rated avolition scores than the control group,
but they did not significantly differ from each other (t (155) = 0.54, p = .59). The
negative group had higher interview-rated impairment in the expression of emotion than
the control (t (155) = 2.93, p = .004) and positive group (t (155) = 4.90, p < .001), which
was higher than the control group (t (155) = 2.00, p = .05). Both the negative group (t
(155) = 4.48, p < .001) and the positive group (t (155) = 2.78, p = .01) had higher
interview-rated impairments in the experience of emotions and self scores than the
control group, but the positive and negative groups did not differ significantly from each
other (t (155) = 1.68, p = .10). None of the groups differed significantly from each other
on interview-rated ideational richness (F (2, 153) = 0.83, p = .44), and only the positive
group differed from the control group on impairment in occupational functioning (t (155)
= 2.27, p = .03).
Group Comparisons of Interview-Rated Disorganized Symptoms. As can be seen
in Table 21, the positive group had higher global disorganized ratings than the control
group (t (155) = 5.90, p < .001) and the negative group (t (155) = 2.52, p = .03), which
was higher than the control group (t (155) = 3.22 p = .002). Both the positive (t (155) =
3.65, p < .001) and negative (t (155) = 2.73, p = .007) groups had higher odd behavior
ratings than the control group but did not differ from each other (t (155) = 1.12, p = .27).
The positive group had higher bizarre thinking ratings than the control group (t (155) =
4.32, p < .001) and the negative group (t (155) = 2.52, p = .01), which was higher than
the control group (t (155) = 2.08 p = .04). Similarly, the positive group had higher
impairment in attention/focus ratings than the control group (t (155) = 5.32, p < .001) and
the negative group (t (155) = 3.16, p = .002), which was higher than the control group (t

52
(155) = 2.50 p = .01). There were no significant difference among groups for impairment
in personal hygiene (F (2, 153) = 1.962, p = .14).
Correspondence between Wisconsin Schizotypy Groups and Interview-Rated
Psychotic-Like Experiences. On the SIPS, ratings of 3 or higher represent clinically
meaningful psychotic-like experiences. One major goal of most schizotypy research is to
provide insight into psychosis, and researchers have questioned how similar
psychometrically identified people with schizotypy are to people who experience
clinically meaningful psychotic-like symptoms. If the Wisconsin Schizotypy Scales
identify people with clinically relevant symptoms, then we would expect these
participants to have ratings of three or higher on the SIPS. Thus, I created groups to
mirror the Wisconsin Schizotypy groups for interview-rated psychotic-like experiences.
Participants with at least one rating of 3 or higher on any of the five positive symptom
scales (i.e., delusional ideation, perceptual anomalies, paranoia, grandiosity, and
disorganized communication) were assigned to the Positive SIPS Group. Participants
with at least one negative symptom rating of 3 or higher were assigned to the Negative
group. Participants with no ratings over 3 were assigned to the Control group. For these
analyses, participants were allowed to belong to both the Positive and Negative groups.
Next, I tested how well the Wisconsin and SIPS groups corresponded with each
other. As can be seen in Table 22, 75.4% of participants who were in the Wisconsin
Positive group were also in the SIPS positive group, 22.8% met criteria for the negative
SIPS group, and 27.5% met criteria for the SIPS control group (i.e., no rating of 3 or
higher). Wisconsin Negative participants were more spread out, with 58.1% in the SIPS
negative group, 43.5% in the SIPS positive group, and the remaining 24.6% in the SIPS

53
control group. Eighty-four percent of participants in the Wisconsin control group were in
the SIPS control group, with 11.4% in the positive group and 4.5% in the negative group.
These results suggest good agreement between groups created by Wisconsin
scores and by SIPS scores. However, a much higher percentage of participants met
criteria for clinically meaningful symptoms than was found in previous research using a
structured interview (Chapman et al., 1994). Although this may be attributable to
differences in sensitivity between the interview used by Chapman et al. and the SIPS, I
tested the same analysis, but with more stringent criteria for SIPS group membership
(i.e., ratings of 4 or higher). As can be seen in Table 22, 38.6% of Wisconsin Positive
Participants had SIPS positive scores of 4 or greater, while 52.6% met criteria for the
SIPS control group, and 10.2% did not have any ratings of 4 or greater. In the Wisconsin
Negative Schizotypy Group, 21% had SIPS negative ratings of 4 or above, while 14.5%
had SIPS positive ratings of 4 or greater, and 67.7% did not have any ratings of 4 or
greater. For the Wisconsin Control Participants, 93.2% did not have SIPS ratings of 4 or
greater, and only 4.5% and 2.3% had positive and negative ratings of 4 or greater,
respectively. These results suggest that the Wisconsin Schizotypy Scales may not be as
sensitive in measuring more severe psychotic-like experiences.
Comparison of the Predictive Power of Self-Report Schizotypy Scales for
Interview-Rated Psychotic-Like Experiences. In addition to the Wisconsin Schizotypy
Scales, the current research included measures of delusion-like beliefs (e.g., PDI),
anomalous perceptions (e.g., CAPS), aberrant salience (e.g., ASI), and paranoia (e.g.,
SPQ-S). In the current research, all of these measures were correlated with each other,
and all of them were correlated with interview ratings of psychotic-like experiences. To

54
test which questionnaire measures were the strongest predictors of interview-rated
psychotic-like experiences, I ran a series of simultaneous regressions with the Magical
Ideation Scale, Perceptual Aberration Scale, Social Anhedonia Scale, PDI-Total Score,
CAPS-Total Score, Aberrant Salience Inventory, and SPQ-Suspiciousness subscale
predicting each interview rated psychotic-like experience. As can be seen in Table 23,
when these variables were entered into a simultaneous regression predicting composite
positive scores, only the CAPS was a significant predictor, and there was a trend for
Magical Ideation. Similarly, only the CAPS was a significant predictor of delusional
ideation, and there was a trend for PDI scores. The CAPS, SPQ-S, and Magical Ideation
scales were significant predictors of interview-rated paranoia. Both the CAPS and PDI
were significant predictors of interview-rated grandiosity, while the CAPS and SocAnh
scales were significant predictors of interview-rated perceptual anomalies. There was a
trend for Magical Ideation in predicting perceptual anomalies. None of these scales was a
significant predictor of disorganized communication, but there was a trend for the CAPS
to predict it.
In addition to the positive ratings, I tested the same simultaneous regression
models predicting the negative ratings. As can be seen in Table 24, social anhedonia was
the only significant predictor for the negative composite, social anhedonia, expression of
emotion, and experiences of emotion and self scores. There was a trend for social
anhedonia in predicting avolition, and for SPQ-Suspiciousness in predicting expression
of emotion. There were no significant predictors of Ideational Richness or Occupational
Functioning.

55
Using the same simultaneous regression, both PerAb and CAPS were significant
predictors of the disorganized composite score and there was a trend for SocAnh (see
Table 25). PerAb and Social Anhedonia predicted odd behavior while suspiciousness was
negatively related to odd behavior. CAPS significantly predicted bizarre thinking, while
suspiciousness was negatively associated with bizarre thinking and there was a trend for
PerAb and SocAnh. Both CAPS and SPS-Suspiciousness were significant predictors of
impairment in focus/attention and PerAb was a significant predictor of impairments in
personal hygiene.
Wisconsin Schizotypy between Groups Comparisons for Self-Reported
Psychotic-Like Experiences. As can be seen in Table 26, the positive group had higher
scores than the negative and control groups for PDI-Total, Distress, Preoccupation, and
Conviction subscale scores. The negative group had higher scores than the control group
on all four measures as well. The positive group had higher CAPS-Total scores, Distress,
Distraction, and Frequency subscale scores compared to the negative and control groups.
The negative and control group did not differ from each other on any of these subscales.
Finally, the positive group had higher SPQ-Suspiciousness scores than the negative and
control groups and the negative group had higher scores than the control group.
Study 5 Discussion
Study 5 replicated the results of Study 1-Study 3 in that there was an interaction
between aberrant salience and self-concept clarity in predicting interview-rated positive
symptoms, including a composite of all positive scales, delusional ideation, and
grandiosity. Study 5 also replicated the results of Study-1-Study 3 in that this interaction
was specific to positive psychotic-like experiences and not negative symptoms,

56
disorganized symptoms, or paranoia. Instead, like in Study 1-3, there was a main effect
for self-concept clarity being negatively associated with negative symptoms, but no main
effect for aberrant salience. Both aberrant salience and self-concept clarity uniquely
contributed to the prediction of paranoia, but they did not interact. In contrast to my
hypothesis and the results of Study 1- Study 3, there was not a significant interaction
between aberrant salience and self-concept clarity in predicting hallucination-like
experiences. As mentioned, this makes some sense because theories of the role of
aberrant salience and self-concept clarity may better explain delusion-like experiences
than hallucination-like experiences. However, most of these models posit that a
combination of aberrant salience/anomalous experiences and self-processing are involved
in the development of hallucinations in addition to delusions (e.g., Garety, et al., 2001;
Kapur, 2003).
Perhaps the most important aspect of Study 5 is that the results were replicated
with an interview measure of psychotic-like experiences. To my knowledge, this is the
first study to use the Structured Interview for Prodromal Syndromes in a large sample of
college students. Given that the majority of schizotypy research has been done with
college students, the current study provides valuable information about the psychotic-like
experiences among this population. Study 5 may help to bridge the gap between
schizotypy research done with college students (e.g., Chapman, et al., 1994; Gooding, et
al., 2005; Kwapil, Chapman, & Chapman, 1999; Lenzenweger, 1994) and prodromal
research done with people at “ultra-high risk” (e.g., Seidman et al., 2010; Woods et al.,
2009).

57
There may be meaningful differences between these two high-risk strategies. For
example, researchers have suggested that the participants identified as “at risk” in college
student samples may be higher functioning than participants with similar schizotypy
scores in the general population because they are functioning well enough to be enrolled
in college (e.g., Lenzenweger, 2006). Conversely, participants in ultra-high risk studies
are typically patients already experiencing symptoms (Addington et al., 2007), and many
are seeking treatment for psychotic-like or related symptoms. For example, in the North-
American Prodrome Longitudinal Study (NAPLS), more than 80 percent of the
participants had sought help for treatment prior to participating in the study and receiving
specialized treatment for prodromal symptoms (Cadenhead et al., 2010). This suggests
that individuals identified as prodromal in clinics may have more severe symptoms than
do participants identified as at risk in college student samples.
The DSM-V Psychosis Work Group is considering adding an “Attenuated
Psychosis Syndrome (APS)” diagnostic category to the next edition of the DSM
(Carpenter & van Os, 2011; Woods, Walsh, Saksa, & McGlashan, 2010). The first
criterion of the proposed syndrome is the presence of attenuated delusions,
hallucinations, or disorganized speech “…with intact reality testing, but of sufficient
severity and/or frequency that it is not discounted or ignored (Carpenter & Van Os, 2011,
p.2).” On the SIPS, this is conceptualized as ratings of 3 or greater on the positive rating
scales. Study 5 found that 75% percent of the Wisconsin Positive Schizotypy group met
this criterion for the proposed syndrome. This suggests that a large percentage of
participants with high positive schizotypy are experiencing clinically meaningful
psychotic-like symptoms. This result is in contrast to previous research that has reported

58
only 66 out of 191 (35%) participants with high PerMag had psychotic-like experiences
at the initial interview (Chapman, et al., 1994). However, these results may be attributed
to differences in the interviews used to access psychotic-like experiences. Chapman et al.
used the Personality Disorders Examination (PDE; Loranger, 1988), in which participants
are rated 0, 1, or 2 on schizotypal personality disorder symptoms, and clinically relevant
scores are operationalized as a sum of 4 or greater. This rating system may be less
sensitive than the SIPS, in which participants are rated on a scale from 0-7, and
meaningful ratings are operationalized as 3 or greater. A score of 4 or greater on the SIPS
may be more analogous to a score of 4 or greater on the PDE. The current research found
that 38% of positive schizotypy participants had scores of 4 or greater on a SIPS positive
item, which is consistent with the rates found by Chapman et al.
Despite 75% of positive participants in Study 5 having clinically meaningful
psychotic-like experiences, it is unclear how many of these participants would actually
meet proposed DSM-V criteria for APS. This diagnostic category would also require
these experiences to occur at least once a week in the past month, begun or significantly
worsened in the past year, and involve enough distress for the person to seek treatment.
One area for future research/data analysis is to calculate how many of the current
participants would meet all the criteria for APS. It is expected that very few of the
participants who were rated as a 3 or greater on the SIPS ratings would meet the other
criteria for APS.
Another goal of Study 5 was to test which self-report scales are the best predictors
of SIPS-rated psychotic-like symptoms. There is an abundance of scales purporting to
measure psychotic-like experiences or psychosis-proneness. As researchers have noted,

59
many of these scales do not have discriminant validity from each other (e.g., Watson,
2001). Thus, in Study 5, I examined which of these scales independently predicted
psychotic-like experiences. Surprisingly, the strongest predictor of the positive
composite, delusional ideation, paranoia, perceptual anomalies, and disorganized
communication was the Cardiff Anomalous Perceptions Scale, which is used much less
commonly than the Wisconsin Schizotypy Scales. This suggests that the CAPS may be a
better predictor of psychotic-like experiences than more commonly used scales.
Potentially, future research could use the CAPS to identify people at risk for psychosis
and closer approximate psychotic-like experiences. As expected, the Revised Social
Anhedonia Scale appeared to be the strongest predictor of negative symptoms. Another
area for future research could be to include additional measures of schizotypy to test for
stronger predictors of psychotic-like experiences. For example, recent research has found
that the Prodromal Questionnaire (Loewy, Bearden, Johnson, Raine, & Cannon, 2005;
Loewy, Pearson, Vinogradov, Bearden, & Cannon, 2011), a combination of Schizotypal
Personality Questionnaire items and the probes from the SIPS, can be used with 91%
sensitivity and 49% specificity to diagnose people as prodromal in help seeking
individuals referred to a prodromal specialty clinic. Future research could test whether
existing measures have incremental validity over and above the prodromal questionnaire
in predicting SIPS ratings.
One potential limitation of Study 1 – Study 5 is that they involved college student
samples. However, one methodological problem in examining social-cognitive models of
psychosis is that people with psychotic disorders typically take antipsychotic medications
that block dopamine. This might be especially important for examining the construct of
60
aberrant salience, as aberrant salience is thought to be related to dysregulated dopamine
(Kapur, 2003). Kapur has argued that, since antipsychotic medications block dopamine,
their main function in reducing psychotic-like experiences is to eliminate occurrences of
aberrant salience. The current research over-sampled participants with a high level of
psychotic-like experiences that are associated with future psychotic disorder (Chapman et
al., 1994). This allowed us to examine the social-cognitive mechanisms associated with
psychotic-like experiences while removing some of the confounds associated with
research on patient populations (Neale & Oltmanns, 1980).
Although the current research examined psychotic-like experiences and not full-
blown psychosis, the current studies can provide useful information on the nature of
psychosis. Previous research has found that measures of positive schizotypy are strongly
correlated with ratings of positive symptoms in people with schizophrenia (Cochrane,
Petch, & Pickering, 2010), and that psychotic-like experiences measured with the
Perceptual Aberrant/Magical Ideation Scales are very similar to psychotic experiences in
individuals who go on to develop psychotic-disorders (see Kwapil, et al., 1999, for a
review). In addition to not including people with full-blown psychosis, one limitation
could be that the participants in the current research were undergraduates. However,
research suggests that the level of psychotic-like experiences in undergraduate
populations is similar to that of the general population (Lenzenweger, Lane, Loranger, &
Kessler, 2007). Despite these findings in previous research, there may be meaningful
differences between subclinical psychotic-like experiences in college students and
psychotic experiences in people diagnosed with a psychotic disorder. For example,
college students may be higher functioning than other people with schizotypy or

61
psychosis by virtue of functioning well enough to be enrolled in college. Thus, Study 6
examined the same hypotheses, but in a sample of patients with schizophrenia and a
group of community controls without a history of mental illness. Study 6 aimed to test
whether the experience of high aberrant salience and low self-concept clarity are specific
to the pre-psychotic or prodromal phase of the disorder or whether these relations hold
true in people with schizophrenia or with other psychotic disorders as well.

62
Study 6
The findings of Study 1-Study 5 support a role for the combination of aberrant
salience and self-concept clarity in predicting delusion-like beliefs. Studies 1-4 involved
college students who were oversampled for a risk for psychosis. Study 5 involved a
subset of participants in Study 4 who were at elevated risk for psychosis. Theorists have
suggested that psychotic-like experiences only become psychotic symptoms, when either
a delusional explanation is adopted for an anomalous experience or when the anomalous
perceptual experience is judged to be originating from an external source (e.g., Garety, et
al., 2001; Maher, 1974, 2003). Studies 1-5 provide strong support that high aberrant
salience and low self-concept clarity are related to psychotic-like experiences, and the
overarching goal of Study 6 is to examine whether high aberrant salience and low self-
concept clarity are also related to psychotic symptoms.
The first goal of Study 6 was to examine whether participants with schizophrenia
had higher levels of aberrant salience compared to a control group. The second goal of
Study 6 was to test whether patients with schizophrenia had lower self-esteem and lower
self-concept clarity than the control group. The third goal was to examine whether
aberrant salience and self-concept clarity were specifically associated with positive
symptoms of psychosis, including delusions and hallucinations. The fourth goal of Study
6 was to examine the interaction between aberrant salience and self-concept clarity in
predicting positive symptoms.
Method
Participants. Participants in Study 6 were 54 people with schizophrenia and 32
non-psychiatric controls. Participants in the schizophrenia group all met criteria for either
schizophrenia or schizoaffective disorder and were recruited from a state mental hospital
63
with a largely forensic population. They were 49.1% White, 36.4% African-American,
and 10% mixed ethnicities. 87.3 % of these participants where male. Participants in the
control group were recruited via online advertisements on Craigslist and a university-
wide email. Participants with a current or history of any Axis I mental disorder were
excluded from the control group. Participants were 93.9% White, 3% African-American,
and 3% other. 90.9% of the control group was male. All participants received $30 for
participating in the study and an additional $5-10 based on performance on the Salience
Attribution Task (described below).
Materials. Aberrant Salience. As in Study 1-Study 4, aberrant salience was
measured with the Aberrant Salience Inventory. In previous research, I found that
inpatients with a history of psychosis had elevated scores compared to inpatients without
a history of psychosis (Cicero, et al., 2010).
Like in Study 5, aberrant salience was also measured with the Salience
Attribution Task. However, the salience attribution task was modified for use in Study 6
in two ways. First, participants earned money based on how quickly they responded to
the stimulus instead of points. Second, I tailored the amount of money participants
received to their specific reaction time because I expected to see a wider range of reaction
times. The mean and standard deviations of responses were calculated for each
participant during the practice trial. The e-prime program was then modified so that
participants were rewarded based on their reaction times. For each trial, participants
received $.15 if they responded faster than one SD below their mean during the practice
block, $.14 if they responded between 8/9 SD and one SD below their mean, $.13 if they
responded between 7/8 and 8/9 below their mean, etc., down to $.05 if they responded

64
below their mean or did not respond before the probe disappeared. Thus, the strength of
the reward for rewarded trials was specifically matched to each participant’s baseline
reaction time.
Reward Processing. Like Study 4, reward processing was measured with the
Probabilistic Selection Task (PST; Frank, et al., 2004). Following previous research
(Waltz, Frank, Wiecki, & Gold, 2011), the PST was modified for use in patients with
schizophrenia. Instead of using unfamiliar Hiragana characters, more familiar pictures
were used (i.e., an egg, school bus, wrench, clock, leaf, and cow). Familiar characters
were used due to reports in the literature that patients had difficulty learning reward
contingencies with unfamiliar symbols (Waltz, Frank, Robinson, & Gold, 2007). The rest
of the task was the same as in Study 1.
Self-Concept Clarity (SCC). Like in Study 1-Study 5, the primary measure of
self-concept clarity was the Self-Concept Clarity Scale (SCCS; Campbell, 1990). Also
like in Study 1 and Study 4, the Me-Not-Me Decision Task (MNMDT; Campbell et al.,
1996) was used to measure self-concept clarity. Like in Study 5, participants also
completed the modified untimed MNMDT with follow-up questions about how confident
they were in their me/not-me ratings.
Self-Esteem. Like in Study 4 and Study 5, self-esteem was measured with the
Rosenberg Self-Esteem Scale (RSES; Rosenberg, 1965).
Diagnosis and General Symptom Ratings. Diagnoses were made with the
Structured Clinical Interview for the DSM-IV (SCID; First, Spitzer, Gibbon, & Williams,
1998). The SCID has high test-retest and inter-rater reliability (Zanarini & Frankenburg,
2001; Zanarini et al., 2000). General levels of symptoms were measured with the Brief

65
Psychiatric Rating Scale (BPRS; Overall & Gorham, 1962), the Scale for the Assessment
of Negative Symptoms (SANS; Andreasen, 1984), and the Scale for the Assessment of
Positive Symptoms (SAPS; Andreasen, 1982). Global functioning was assessed with the
Strauss-Carpenter Outcome Scale (Strauss & Carpenter, 1972; Strauss, Kokes, Klorman,
& Sacksteder, 1977), which contains subscales for duration of time hospitalized, social
functioning, employment functioning, and severity of Symptoms. Global functioning was
also measured with the Global Assessment Scale (GAS).
Anomalous Perceptual Experiences. Like in Study 1 and Study 5, anomalous
perceptual experiences were measured with the Cardiff Anomalous Perception Scale
(Bell, et al., 2006a).
Paranoia. Like in Study 3 and Study 5, paranoia was measured with the
Suspiciousness subscale of the Schizotypal Personality Questionnaire (SPQ-S; Raine,
1991).
Mental Status. Participants completed the Mini-Mental Status Exam (MMSE).
The MMSE is one of the most commonly used screening measures for cognitive
impairment and dementia (Hodges, 1994; Manning et al., 2007). MMSE scores have been
found to have high inter-rater reliability (Tombaugh & McIntyre, 1992), internal
consistency, and well-established normative data (Tombaugh, McDowell, Kristjansson,
& Hubley, 1996). In the current research, the MMSE was used to screen for and exclude
participants with dementia.
Procedure. First, participants read and signed the informed consent form. Then,
they were given the Mini Mental Status Exam. All participants exceeded the cutoff of 22
on the Mini Mental Status Exam, which suggests that all participants did not have
66
dementia. Participants then completed a series of questionnaires including the Aberrant
Salience Inventory, the Self-Concept Clarity Task, and the Rosenberg Self-Esteem Scale.
Then participants completed the Probabilistic Selection Task. Next, the Structured
Clinical Interview for the DSM-IV was conducted, which was videotaped. Participants
then completed the Peters Delusion Inventory, the first half of the Word Recognition
Psychometric Task, a group of questionnaires including the modified Me Not-Me
Decision Task with confidence follow-up questions, the Cardiff Anomalous Perceptions
Scale, and the Suspiciousness subscale of the Schizotypal Personality Questionnaire.
Then, participants completed the second half of the Word Recognition Psychometric
Task, the Me Not-me Decision Task, and the Salience Attribution Task.
Results
Group Comparisons for Aberrant Salience. The first goal of Study 6 was to test
whether the schizophrenia group had higher aberrant salience than the control group. To
test for these differences, I conducted independent samples t-tests comparing the group of
participants with schizophrenia to the control group. As can be seen in Table 27,
participants in the schizophrenia group had higher ASI scores than participants in the
control group (t (85) = 2.69, p = .01). Participants with schizophrenia were impaired in
the number of times they choose the rewarded stimuli (t (85) = -2.05, p = .04), but not in
the number of times they avoided the non-rewarded stimuli (t (85) = -1.25, p = .22).
There was not a significant difference between groups in the choose-minus avoid variable
(t (85) = -.42, p = .68). This suggests that there was not a significant difference in
learning preference between the two groups. With respect to the SAT, there were not
significant differences between groups in explicit reward ratings, non-reward ratings, and

67
adaptive salience. In contrast to my hypothesis, the control group displayed higher levels
of explicit aberrant salience (t (85) = -3.65 p < .001). There were no significant
differences between groups on the reaction time variables from the SAT.
Group Comparisons for Self-Relevant Information Processing. The second goal
of Study 6 was to examine whether the schizophrenia group had low self-esteem and self-
concept clarity than did the control group. As can be seen in Table 28, people with
schizophrenia had lower self-esteem than control participants, as measured with the
Rosenberg Self-Esteem Scale (t (86) = -11.79, p < .001). Additionally, participants with
schizophrenia had lower self-concept clarity as measured with the Self-Concept Clarity
Scale (t (86) = -2.26 p = .03), the Me Not-Me Decision Task consistency score (t (85) = -
6.13, p < .001), and the Me Not-Me Decision Task reaction time measure (t (85) = -3.79,
p < .001). Patients also had lower MNMDT consistency scores for the modified version
of the task (t (85) = -5.29, p < .001), but did not differ in the self-reported confidence of
these decisions (t (85) = -.31, p = .76). However, patients took longer to make their
confidence ratings than did controls (t (85) = 3.085 p < .01). Taken together, these results
suggest that patients with schizophrenia have lower self-concept clarity than do controls.
Correlations among Aberrant Salience Variables. The third goal of Study 6 was
to examine the correlations between aberrant salience variables and the positive
symptoms of schizophrenia. As can be seen in Table 29, there was a significant
correlation between the Probabilistic Selection Task Approach Minus Avoid score and
Explicit Adaptive Salience scores on the Salience Attribution Task. Additionally, there
was a trend for a significant relation between Implicit Aberrant Salience scores on the
SAT and the tendency to choose the rewarded stimulus on the PST. However, there were

68
not significant correlations between the ASI and other variables in the study, and there
were not significant correlations between explicit aberrant salience on the SAT and
aberrant salience as measured by other variables.
Correlations between Aberrant Salience Variables and Interview-Rated Positive
Symptoms. The correlations between aberrant salience variables and Scale for the
Assessment of Positive Symptoms can be found in Table 30. Correlations among aberrant
salience and all BPRS ratings can be found in Appendix B. The ASI was positive
correlated with a composite Delusions/Hallucinations score, and separately with
hallucinations. Additionally, there was a trend for a negative relationship between reward
learning and SAPS bizarre behavior, and a significant correlation between SAPS bizarre
behavior and preference for reward learning over punishment learning. Correlations
among aberrant salience variables and specific SAPS-rated delusions can be found in
Appendix B.
Correlations between Aberrant Salience and Negative Symptoms. As can be
seen in Table 31, avoidance learning was associated with affective flattening and there
was a trend for a correlation between avoidance learning an alogia. There was a trend for
a negative relationship between a preference for approach vs. avoidance learning and
affective flattening.
Correlations between Aberrant Salience and Global Functioning. As can be
seen in Table 32, there was a trend for a positive relation between avoidance learning and
social functioning. Global Assessment Scale scores were positively correlated with a
preference for approach vs. avoidance learning.

69
Correlations among Self-Relevant Information Processing Variables. The
fourth goal of Study 6 was to examine the correlations between self-relevant information
processing variables and positive symptoms of schizophrenia. Prior to testing these
correlations, I examined the correlations among the self-processing variables in Study 6.
As can be seen in Table 33, in patients with schizophrenia, self-esteem was positively
correlated with the Self-Concept Clarity Scale and the modified MNMDT confidence
ratings, but negatively correlated with reaction times on the MNMDT and reaction times
for confidence ratings on the modified version of the task. There was a trend for a
negative correlation between the SCCS and reaction times on the MNMDT. The
MNMDT was strongly correlated with the modified version of the task and reaction times
for the MNMDT were positively correlated with reaction times for confidence ratings
during the modified version of the task. Confidence ratings on the modified version of the
task were significantly correlated with modified MNMDT scores.
Correlations between Self-Relevant Information Processing Variables and
Interview Rated Positive Symptoms. I hypothesized that self-concept clarity would be
negatively correlated with positive symptoms of schizophrenia. As can be seen in Table
34, there was a trend for a negative correlation between the SCCS and SAPS-rated
hallucinations. Additionally, the unmodified MNMDT task was negatively correlated
with the composite delusions/ hallucinations variable and with global ratings of
delusions. Similarly, there was a trend for negative correlations between MNMDT scores
Hallucinations. There was a significant correlation between the modified MNMDT
confidence ratings and bizarre behavior. Finally, there was a trend for hallucinations to be

70
negatively correlated with the time it took participants to make confidence ratings on the
modified MNMDT.
Correlations between Self-Relevant Information Processing Variables and
Interview-Rated Negative Symptoms. Previous research suggests that negative symptoms
of schizophrenia may be related to low self-esteem and self-concept clarity. As can be
seen in Table 35, the MNMDT was negatively correlated with the composite negative
symptom score and there was a trend for a negative correlation between MNMDT and
anhedonia. MNMDT confidence rating reaction times were associated with composite
negative symptoms, affective flattening, and alogia.
Correlations between Self-Relevant Information Processing and Global
Functioning. As can be seen in Table 36, MNMDT scores were associated with
increased social functioning scores and with increased GAS scores.
Aberrant Salience, Self-Concept Clarity, and Interview-Rated Delusions. To test
whether there was an interaction between aberrant salience and self-concept clarity in
predicting interview-rated positive symptoms of schizophrenia, I entered mean-centered
ASI and SCCS values in step 1 of a hierarchical linear regression predicting interview-
rated positive symptoms. I entered the product of aberrant salience and self-concept
clarity in step 2. This analysis was done only with the schizophrenia group because the
overwhelming majority of controls received the lowest possible ratings on all positive
symptoms.
Like in Studies 1-5, there was a significant interaction between aberrant salience
and self-concept clarity in predicting the composite positive symptom score. However, as
can be seen in Table 37 and Figure 4, the interaction showed a different pattern. For the

71
delusions/ hallucinations composite score (t (52) = 2.36, p =.02), SAPS Global Delusions
(t (52) = 2.20, p = .03) and BPRS Unusual Thought Content (t (52) = 2.09, p = .04),
participants with high ASI scores tended to have high levels of positive symptoms
regardless of their level of SCC, but participants with low ASI only tended to have high
positive symptoms if they had low SCC.
Probes of the interaction revealed that aberrant salience was unrelated to
delusions/hallucinations at low levels of SCC (t (52) = .20, p = .85) and strongly
positively associated with delusions/hallucinations (t (52) = 3.24, p < .01) at high levels
of SCC. As can be seen in Table 38, ASI and SCCS did not interact to predict SAPS or
BPRS rated hallucinations.
Group Differences in SPQ, PDI, and CAPS Scores. As can be seen in Table 38,
patients had higher SPQ suspiciousness (t (85) = 7.05, p < .001), CAPS Total (t (85) =
4.92, p < .001), Distress (t (85) = 6.24, p < .001), Distraction (t (85) = 6.28, p < .001), and
Frequency Scores (t (85) = 6.56, p < .001), and PDI Total (t (85) = 5.02, p < .001),
Distress (t (85) = 4.96, p < .001), Preoccupation (t (85) = 5.77, p < .001), and Conviction
Scores (t (85) = 4.53, p < .001).
Study 6 Discussion
The results of Study 6 provide further evidence that aberrant salience and self-
relevant information processing may be important mechanisms in psychosis. Consistent
with previous research, patients with schizophrenia had higher ASI scores than did
control participants. In a previous study, I found that inpatients with a history of
psychosis had higher ASI scores than inpatients without a history of schizophrenia

72
(Cicero, et al., 2010). The current research provides further evidence for the construct
validity of the ASI.
In contrast to my hypothesis, patients with schizophrenia did not show an elevated
preference to approach over avoidance learning. Instead, people with schizophrenia
showed deficits in approach but not avoidance. One explanation for this result could be
that patients were all taking antipsychotic medications, which lower the levels of
subcortical dopamine (Kapur, 2004). In previous research, Frank et al. (2004) found that
patients with Parkinson’s Disease, who have low levels of dopamine, showed a
preference for approach vs. avoidance learning if they were taking dopamine agonists. In
contrast, they found that participants with Parkinson’s displayed a preference for
avoidance learning if they were not taking dopamine agonists. It is possible that patients
with schizophrenia show deficits in reward learning because they are taking dopamine
antagonists that are in effect dampening salience. Thus, patients with schizophrenia may
display a preference for approach vs. avoidance learning only if they are not medicated.
The finding that the schizophrenia group was impaired in approach but not avoidance
learning is consistent with other studies that have used the PST in similar populations
(Waltz, et al., 2007; Waltz, et al., 2011).
In Study 6, I hypothesized that aberrant salience would be elevated in patients
with schizophrenia, but also that it would be related to positive symptoms specifically.
This hypothesis was partially supported. ASI scores were positively correlated with the
delusions/hallucinations composite variable and with hallucinations specifically. The task
measures of aberrant salience were not correlated with positive symptoms. There may
have been problems with one task measure, the Salience Attribution Task. This task was

73
calibrated to the participants’ mean reaction times in a practice version of the task.
Participants had to respond faster than their mean reaction times on the practice block in
order to earn more than the minimum reward. However, participants’ reaction times in
the practice block may have created a “ceiling effect,” such that participants were not
capable of reliably responding faster than their mean. Thus, many of the rewarded trials
may have felt like non-rewarded trials since participants often received the message
“missed/too slow + $.05.” Both groups of participants in Study 6 judged the rewarded
stimuli to be rewarded much less than they were rewarded in reality, and much less than
did participants in Study 5. This suggests that the rewarded trials may not have seemed
rewarding to participants in Study 6.
In addition to positive symptoms, I examined the correlations among aberrant
salience variables and negative symptoms of schizophrenia. Consistent with previous
research, avoidance learning was associated with negative symptoms (Kasanova, Waltz,
Strauss, Frank, & Gold, 2011). This preference for avoidance learning may be related to a
failure to use positive reinforcement to guide behavior, and is consistent with neuro-
computational models that suggest negative symptoms are associated with impairments in
D1 pathways in the basal ganglia but relatively intact D2 pathways (Kasanova, et al.,
2011). In other words, participants with high negative symptoms may avoid punishments
more than approach rewards because they have deficits in learning from rewards but
intact punishment learning.
Study 6 also provided evidence that people with schizophrenia have lower self-
concept clarity and self-esteem than do community controls. This finding was replicated
with self-report and behavioral measure of self-concept clarity. This is consistent with

74
previous research suggesting that disturbances the sense of self are central to the
phenomenology of schizophrenia (Fabrega, 1989; Lysaker & Lysaker, 2010; Parnas &
Handest, 2003; Raballo, et al., 2009).
In addition to hypothesizing that people with schizophrenia would have lower
self-concept clarity than did controls, I expected to find that self-concept clarity would be
negatively correlated with positive symptoms in people with schizophrenia. Interestingly,
the self-report measure of self-concept clarity was not associated with the interview-rated
positive symptoms but the MNMDT scores were negatively correlated with positive
symptoms. Moreover, the SCCS was not correlated with the MNMDT in this sample,
despite them being significantly correlated in Study 1 and Study 4. The MNMDT might
reflect an aspect of self-concept clarity that is not accessible to introspection (Campbell,
1990). Researchers have often suggested that people with delusions do not present
themselves accurately on self-report measures (Bentall, et al., 2001). Rather, they are
especially motivated to present themselves in a positive light, which may explain the
difference between MNMDT and SCCS findings.
Finally, Study 6 attempted to replicate the results of Study 1-Study 5: an
interaction between aberrant salience and self-concept clarity in predicting positive
symptoms. There was a significant interaction, but the pattern was not the same as in
Studies 1-5. Aberrant salience was associated with positive symptoms only at high levels
of self-concept clarity. One potential explanation for the difference in findings for the
schizophrenia group in Study 6, the at-risk group in Study 5, and the unselected samples
in Studies 1-4, could be that people with schizophrenia tend to have more conviction in
their delusional beliefs. In Study 1, I found that aberrant salience and self-concept clarity

75
interacted to predict PDI-Total scores as well as the distress and preoccupation subscales,
but not the conviction subscale. Since psychotic-like experiences only become psychotic
symptoms when delusional explanations are adopted, I hypothesized that this finding was
a result of participants with psychotic-like experiences lacking the conviction that is
common among people with psychotic-symptoms. As mentioned, participants may not be
accurate in their assessments of the coherence of their self-concepts, given that MNMDT
scores are not correlated with SCCS scores in this sample. In people with schizophrenia,
high self-concept clarity may represent conviction in delusional beliefs, driving up
positive symptom ratings in people who have high aberrant salience.
Another potential explanation for the difference in these results could be that it is
a methodological artifact. Participants with schizophrenia had lower self-concept clarity
and higher aberrant salience than the control group. Thus, in examining the interaction
between aberrant salience and self-concept clarity in this sample, I am examining the
interaction between these two variables in only one-quadrant of the data. Methodologists
have suggested that this restriction of range on the independent variables (i.e., high
aberrant salience and low self-concept clarity) may make it difficult to detect moderations
or contribute to a spurious results (Preacher, Rucker, MacCallum, & Nicewander, 2005).
Hence, in the current research, this result should be interpreted with caution.

76
General Discussion
In five separate samples, the current research found that there was an interaction
between aberrant salience and self-concept clarity. In the four non-clinical samples
(Study 1- Study 5), participants with high aberrant salience and low self-concept clarity
had the highest levels of psychotic-like experiences. In contrast, in the sample of patients
with schizophrenia in Study 6, participants with high aberrant salience and low self-
concept clarity had the highest levels of positive symptoms. These findings are broadly
consistent with social-cognitive models and phenomenological descriptions of psychotic
experiences that have suggested a prominent role for both aberrant salience and self-
concept clarity in psychosis and psychotic-like experiences (e.g., Bell, et al., 2006b;
Bentall, et al., 2001; Freeman, 2007; Moller & Husby, 2000). These results were specific
to positive psychotic-like experiences and not related to social anhedonia, paranoia, or
negative symptoms of schizophrenia. Additionally, the results of Study 3 suggest that the
interaction with aberrant salience is specific to self-concept clarity because aberrant
salience did not interact with neuroticism to predict psychotic-like experiences.
As previously discussed, several researchers have suggested a central role for
aberrant salience in psychosis (e.g., Kapur, 2003; Roiser, et al., 2008). In my own work,
we have found that the ASI is correlated with psychotic-like experiences in unselected
samples, is elevated in people at-risk for developing psychosis, and is higher in inpatients
with a history of psychosis compared to inpatients without a history of psychosis (Cicero,
et al., 2010). The current research extends these previous findings to suggest that aberrant
salience alone may not be sufficient to produce psychosis. Rather, the current research
found that high levels of aberrant salience produced more extreme levels of psychotic-

77
like experiences when those individuals also had unclear self-concepts. Study 6 found a
different pattern, with aberrant salience being associated with positive symptoms only
when participants had high levels of self-concept clarity. This is consistent with previous
social-cognitive models, which suggest that beliefs about the self and the world frame the
response of the individual to an occurrence of aberrant salience (Freeman, 2007). Thus,
an unclear self-concept may make an individual more likely to develop a psychotic-like
explanation for an occurrence of aberrant salience. In contrast, high self-concept clarity in
psychosis may lead someone to develop conviction in their delusional explanations.
The current research also has implications for the role of disturbances of self-
relevant information processing in psychotic-like experiences. Recently, self-disturbances
have received attention in the schizophrenia literature, particularly with respect to the
prodrome (Lysaker & Lysaker, 2010). However, much of this research has been
phenomenological or qualitative (e.g., Davidsen, 2009; Moller & Husby, 2000). As
mentioned, one recent phenomenological study concluded that self-disturbances and
aberrant salience were the two core variables associated with the development of
psychosis (Moller & Husby, 2000). One strength of the current research is that self-
disturbance was measured with a quantitative measure while most research in this area
has been qualitative in nature. The probe of the interaction suggests that self-concept
clarity is only related to psychotic-like experiences at high levels of aberrant salience.
One area for future research could be to examine self-disturbances in other
quantitative ways. For example, previous research suggests that people with psychosis
show a lack of coherence in personal narratives of their life stories (Lysaker, et al., 2002).
Additionally, psychosis has been linked to other deficits in the processing of self-relevant
78
information such as monitoring of internally vs. externally generated speech (Johns,
Gregg, Allen, & McGuire, 2006), impaired sense of self agency (Lysaker, Wickett,
Wilke, & Lysaker, 2003), and insight into mental illness (e.g., Baier, 2010). Future
research could examine whether these impairments in self-processing also interact with
aberrant salience to predict psychotic-like experiences.
In addition to being consistent with models of psychosis and psychotic-like
experiences, the current research is consistent with models of normal belief formation.
For example, the Meaning Maintenance Model (Heine, Proulx, & Vohs, 2006) posits that
people reinstate meaning after a threat to meaning. A meaning threat may include a threat
to a person’s worldview or self-esteem. Consistent with this, aberrant salience involves
irrelevant stimuli being imbued with significance and is thought to trigger a search for an
explanation (Kapur, 2003). At the same time, low self-concept clarity may itself be a
threat to meaning that could result in people being more likely to seek meaning for
experiences. In one study, Proulx and Heine (2009) had participants write an essay
arguing against the unity of their self-concepts, which may be analogous to
experimentally causing low self-concept clarity. They found that participants in this
condition were more likely to perceive meaning in stimuli following this manipulation.
This suggests that occurrences of aberrant salience might be especially likely to be
perceived as meaningful if people also have low self-concept clarity, which may lead to
psychotic symptoms.
The current research suggests several areas for future research. One limitation of
the current research is that it is correlational and thus could not establish whether the
combination of high aberrant salience and low self-concept clarity actually causes

79
psychotic-like experiences. This could be addressed in at least two ways. For example,
future research could follow participants longitudinally and establish the temporal
precedence of aberrant salience and low self-concept clarity before the development of
psychotic-like experiences. If having high aberrant salience and low self-concept clarity
causes psychotic-like experiences, then we would expect participants to report this them
to reporting psychotic-like experiences. Moreover, a longitudinal study with participants
at risk for schizophrenia would enable researchers to test whether the interaction between
aberrant salience and self-concept clarity changes when participants “convert” from the
prodrome to full-blown psychosis.
A second way to examine whether aberrant salience and self-concept clarity cause
psychotic-like experiences could be to experimentally manipulate aberrant salience and
or self-concept clarity. For example, future research could use Proulx and Heine’s (2009)
procedure to experimentally induce low self-concept clarity and test whether participants
with high aberrant salience were more likely to report psychotic-like experiences than
people with low aberrant salience. Similarly, future research could experimentally
manipulate aberrant salience and test whether people with low self-concept clarity
experienced more psychotic-like experiences than people with high self-concept clarity.
These studies could potentially establish whether high aberrant salience and low self-
concept clarity actually produce psychotic-like experiences. In addition, future research
could use a similar paradigm to test whether aberrant salience could actually cause an
increase in anomalous experiences.
The proposed interaction between aberrant salience and self-concept clarity may
make more intuitive sense when explaining delusion-like beliefs than hallucination-like

80
experiences. However, Kapur (2003) suggested that hallucinations may arise on a similar
path in which salience is aberrantly attributed to perceptual aberrations or anomalous
experiences. Such experiences, which may be ephemeral in people with low aberrant
salience, capture attention and continue to occur more frequently in people with high
aberrant salience. Garety et al. (2001) suggest that psychotic-like experiences only
become psychotic symptoms when the individual misattributes the source of the
experience to something external. Similarly, low self-concept clarity may exacerbate this
source misattribution. Thus, high aberrant salience and low self-concept clarity may fuel
a feedback loop in which hallucination-like experiences capture attentional resources, in
turn leading to more hallucination-like experiences. In contrast, the results of Study 5 and
Study 6 suggest that aberrant salience and self-concept clarity may interact only to
predict delusion-like beliefs (Study 5) and delusions (Study 6), but not hallucination-like
experiences and hallucinations. Future research could continue to examine the
applicability of the interaction between aberrant salience and self-concept clarity to
hallucination-like experiences in addition to delusion-like experiences.

81
References
Abi-Dargham, A., Rodenhiser, J., Printz, D., Zea-Ponce, Y., Gil, R., Kegeles, L. S., . . .
Laruelle, M. (2000). Increased baseline occupancy of D2 receptors by dopamine
in schizophrenia. Proceedings of the National Academy of Sciences of the United
States of America, 97, 8104-8109. doi: 97/14/8104
Addington, J., Cadenhead, K. S., Cannon, T. D., Cornblatt, B., McGlashan, T. H.,
Perkins, D. O., . . . Heinssen, R. (2007). North American Prodrome Longitudinal
Study: a collaborative multisite approach to prodromal schizophrenia research.
Schizophrenia Bulletin, 33(3), 665-672. doi: 10.1093/schbul/sbl075
Andreasen, N. C. (1982). Scale for the Asssessment of Positive Symptoms. Iowa City:
University of Iowa, Department of Psychiatry.
Andreasen, N. C. (1984). Scale for the assessment of negative symptoms Iowa City:
University of Iowa College of Medicine.
Andreasen, N. C., Arndt, S., Alliger, R., Miller, D., & Flaum, M. (1995). Symptoms of
schizophrenia. Methods, meanings, and mechanisms. Archives of General
Psychiatry, 52, 341-351.
Baier, M. (2010). Insight in schizophrenia: a review. Current Psychiatry Reports, 12(4),
356-361. doi: 10.1007/s11920-010-0125-7
Beck, A. T., & Rector, N. A. (2005). Cognitive approaches to schizophrenia: theory and
therapy. Annual Review of Clinical Psychology, 1, 577-606. doi:
10.1146/annurev.clinpsy.1.102803.144205

82
Bell, V., Halligan, P. W., & Ellis, H. D. (2006a). The Cardiff Anomalous Perceptions
Scale (CAPS): a new validated measure of anomalous perceptual experience.
Schizophrenia Bulletin, 32(2), 366-377. doi: 10.1093/schbul/sbj014
Bell, V., Halligan, P. W., & Ellis, H. D. (2006b). Explaining delusions: a cognitive
perspective. Trends in Cognitive Science, 10(5), 219-226. doi:
10.1016/j.tics.2006.03.004
Bentall, R. P., Corcoran, R., Howard, R., Blackwood, N., & Kinderman, P. (2001).
Persecutory delusions: a review and theoretical integration. Clinical Psychology
Review, 21, 1143-1192. doi: S0272-7358(01)00106-4 [pii]
Berenbaum, H., & Fujita, F. (1994). Schizophrenia and personality: exploring the
boundaries and connections between vulnerability and outcome. Journal of
Abnormal Psychology, 103(1), 148-158.
Berridge, K. C. (2007). The debate over dopamine's role in reward: the case for incentive
salience. Psychopharmacology, 191, 391-431. doi: 10.1007/s00213-006-0578-x
Bowers, M. B., Jr. (1968). Pathogenesis of acute schizophrenic psychosis. An
experimental approach. Archives of General Psychiatry, 19, 348-355.
Bunney, W. E., Jr., Hetrick, W. P., Bunney, B. G., Patterson, J. V., Jin, Y., Potkin, S. G.,
& Sandman, C. A. (1999). Structured Interview for Assessing Perceptual
Anomalies (SIAPA). Schizophrenia Bulletin, 25(3), 577-592.
Cadenhead, K. S., Addington, J., Cannon, T., Cornblatt, B., McGlashan, T., Perkins, D., .
. . Heinssen, R. (2010). Treatment history in the psychosis prodrome:
characteristics of the North American Prodrome Longitudinal Study Cohort. Early
Intervention in Psychiatry, 4(3), 220-226. doi: 10.1111/j.1751-7893.2010.00183.x

83
Campbell, J. D. (1990). Self-esteem and clarity of the self-concept. Journal of
Personality and Social Psychology, 59(3), 538-549. doi: 10.1037/0022-
3514.59.3.538
Campbell, J. D., Trapnell, P. D., Heine, S. J., Katz, I. M., Lavallee, L. F., & Lehman, D.
R. (1996). Self-concept clarity: Measurement, personality correlates, and cultural
boundaries. Journal of Personality and Social Psychology, 70, 141-156. doi:
10.1037/0022-3514.70.1.141
Carpenter, W. T., & van Os, J. (2011). Should Attenuated Psychosis Syndrome Be a
DSM-5 Diagnosis? American Journal of Psychiatry, 168(5), 460-463. doi:
10.1176/appi.ajp.2011.10121816
Chapman, L. J., Chapman, J. P., Kwapil, T. R., Eckblad, M., & Zinser, M. C. (1994).
Putatively psychosis-prone subjects 10 years later. Journal of Abnormal
Psychology, 103, 171-183. doi: 10.1037/0021-843X.103.2.171
Chapman, L. J., Chapman, J. P., & Raulin, M. L. (1976). Scales for physical and social
anhedonia. Journal of Abnormal Psychology, 85, 374-382. doi: 10.1037/0021-
843X.85.4.374
Chapman, L. J., Chapman, J. P., & Raulin, M. L. (1978). Body-image aberration in
Schizophrenia. Journal of Abnormal Psychology, 87, 399-407. doi: 10.1037/0021-
843X.87.4.399
Chmielewski, M., Fernandes, L. O., Yee, C. M., & Miller, G. A. (1995). Ethnicity and
gender in scales of psychosis proneness and mood disorders. Journal of Abnormal
Psychology, 104, 464-470. doi: 10.1037/0021-843X.104.3.464

84
Cicero, D. C., & Kerns, J. G. (2010a). Is paranoia a defense against or an expression of
low self-esteem? European Journal of Personality. doi: 10.1002/per.794
Cicero, D. C., & Kerns, J. G. (2010b). Multidimensional factor structure of positive
schizotypy. Journal of Personality Disorders, 24(3), 327-343. doi:
10.1521/pedi.2010.24.3.327
Cicero, D. C., & Kerns, J. G. (2011). Unpleasant and pleasant referentialt thinking:
relations with self-processing, paranoia, and other schizotypal traits. Journal of
Research in Personality, 45(2), 208-218. doi: 10.1016/j.jrp.2011.02.002
Cicero, D. C., Kerns, J. G., & McCarthy, D. M. (2010). The Aberrant Salience Inventory:
A new measure of psychosis proneness. Psychological Assessment, 22(3), 688-
701. doi: 10.1037/a0019913
Cochrane, M., Petch, I., & Pickering, A. D. (2010). Do measures of schizotypal
personality provide non-clinical analogues of schizophrenic symptomatology?
Psychiatry Research, 176(2-3), 150-154. doi: 10.1016/j.psychres.2009.01.031
Combs, D. R., & Penn, D. L. (2004). The role of subclinical paranoia on social
perception and behavior. Schizophrenia Research, 69, 93-104. doi:
10.1016/S0920-9964(03)00051-3
Davidsen, K. A. (2009). Anomalous self-experience in adolescents at risk of psychosis.
Clinical and conceptual elucidation. Psychopathology, 42(6), 361-369. doi:
10.1159/000236907
Davis, K. L., Kahn, R. S., Ko, G., & Davidson, M. (1991). Dopamine in schizophrenia: a
review and reconceptualization. American Journal of Psychiatry, 148, 1474-1486.

85
Dunn, O. J. (1961). Multiple comparisons among means. Journal of the American
Statistical Association, 56, 52-64.
Eckblad, M., & Chapman, L. J. (1983). Magical ideation as an indicator of schizotypy.
Journal of Consulting and Clinical Psychology, 51, 215-225. doi: 10.1037/0022-
006X.51.2.215
Eckblad, M., Chapman, L. J., Chapman, J. P., & Mishlove, M. (1982). The revised social
anhedonia scale. (Available from L.J. Chapman, Department of Psychology, 1202
West Johnson Street, University of Wisconsin, Madison, WI 53706).
Edell, W. S. (1995). The psychometric measurement of schizotypy using the Wisconsin
Scales of Psychosis-Proneness. In G. Miller (Ed.), The behavioral high-risk
paradigm in psychopathology (pp. 1-46). New-York: Pringer-Verlag.
Fabrega, H., Jr. (1989). The self and schizophrenia: a cultural perspective. Schizophrenia
Bulletin, 15(2), 277-290.
Fenigstein, A., & Vanable, P. A. (1992). Paranoia and self-consciousness. Journal of
Personality and Social Psychology, 62, 129-138. doi: 10.1037/0022-
3514.62.1.129
First, M. B., Spitzer, R. L., Gibbon, M., & Williams, J. B. W. (1998). Structured Clinical
Interview for DSM-IV Axis I Disorders. . New York: New York State Psychiatric
Institute.
Fowler, D. (2000). Psychological formulation of early episodes of psychosis: A cognitive
model. In D. Birchwood, D. Fowler & C. Jackson (Eds.), Early intervention in
psychosis: A guide to concepts, evidence, and interventions (pp. 101-127).
Chichester, England: Wiley.

86
Frank, M. J. (2005). Dynamic dopamine modulation in the basal ganglia: a
neurocomputational account of cognitive deficits in medicated and nonmedicated
Parkinsonism. Journal of Cognitive Neuroscience, 17(1), 51-72. doi:
10.1162/0898929052880093
Frank, M. J., Seeberger, L. C., & O'Reilly R, C. (2004). By carrot or by stick: cognitive
reinforcement learning in parkinsonism. Science, 306(5703), 1940-1943. doi:
10.1126/science.1102941
Freeman, D. (2007). Suspicious minds: the psychology of persecutory delusions. Clinical
Psychology Review, 27, 425-457. doi: 10.1016/j.cpr.2006.10.004
Garety, P. A., Kuipers, E., Fowler, D., Freeman, D., & Bebbington, P. E. (2001). A
cognitive model of the positive symptoms of psychosis. Psychological Medicine,
31(2), 189-195.
Goldberg, L. R. (1999). A broad-bandwidth, public health domain, personality inventory
measuring the lower-level facets of several five-factor models. In I. Mervielde, I.
Deary, F. De Fruyt & F. Ostendorf (Eds.), Personality psychology in Europe (Vol.
77, pp. 7-28).
Gooding, D. C., Tallent, K. A., & Matts, C. W. (2005). Clinical status of at-risk
individuals 5 years later: further validation of the psychometric high-risk strategy.
Journal of Abnormal Psychology, 114, 170-175. doi: 10.1037/0021-
843X.114.1.170
Gray, J. A., Feldon, J., Rawlins, J. N., Hemsley, D. R., & Smith, A. D. (1991). The
neuropsychology of schizophrenia. Behavior and Brain Research, 14, 1-20.

87
Gray, N. S., & Snowden, R. J. (2005). The relevance of irrelevance to schizophrenia.
Neuroscience and Biobehavioral Reviews, 29(6), 989-999. doi:
10.1016/j.neubiorev.2005.01.006
Guillin, O., Abi-Dargham, A., & Laruelle, M. (2007). Neurobiology of dopamine in
schizophrenia. International Review of Neurobiology, 78, 1-39. doi:
10.1016/S0074-7742(06)78001-1
Hayes, A. F., & Matthes, J. (2009). Computational procedures for probing interactions in
OLS and logistic regression: SPSS and SAS implementations. Behavior Reseach
Methods, 41(3), 924-936. doi: 10.3758/BRM.41.3.924
Heine, S. J., Proulx, T., & Vohs, K. D. (2006). The meaning maintenance model: on the
coherence of social motivations. Personality and Social Psychology Review,
10(2), 88-110. doi: 10.1207/s15327957pspr1002_1
Hemsley, D. R. (1998). The disruption of the 'sense of self' in schizophrenia: potential
links with disturbances of information processing. British Journal of Medical
Psychology, 71 ( Pt 2), 115-124.
Hodges, J. R. (1994). Cognitive Assessment for Clinicians. Oxford: Oxford University
Press.
Howes, O. D., Montgomery, A. J., Asselin, M. C., Murray, R. M., Valli, I., Tabraham, P.,
. . . Grasby, P. M. (2009). Elevated striatal dopamine function linked to prodromal
signs of schizophrenia. Archives of General Psychiatry, 66(1), 13-20. doi:
10.1001/archgenpsychiatry.2008.514
88
Johns, L. C., Gregg, L., Allen, P., & McGuire, P. K. (2006). Impaired verbal self-
monitoring in psychosis: effects of state, trait and diagnosis. Psychological
Medicine, 36(4), 465-474. doi: 10.1017/S0033291705006628
Kapur, S. (2003). Psychosis as a state of aberrant salience: a framework linking biology,
phenomenology, and pharmacology in schizophrenia. American Journal of
Psychiatry, 160, 13-23. doi: 10.1176/appi.ajp.160.1.13
Kapur, S. (2004). How antipsychotics become anti-"psychotic"--from dopamine to
salience to psychosis. Trends in Pharmacological Science, 25(8), 402-406. doi:
10.1016/j.tips.2004.06.005
Kasanova, Z., Waltz, J. A., Strauss, G. P., Frank, M. J., & Gold, J. M. (2011). Optimizing
vs. matching: response strategy in a probabilistic learning task is associated with
negative symptoms of schizophrenia. Schizophrenia Research, 127(1-3), 215-222.
doi: 10.1016/j.schres.2010.12.003
Kay, S. R., Fiszbein, A., & Opler, L. A. (1987). The positive and negative syndrome
scale (PANSS) for schizophrenia. Schizophrenia Bulletin, 13(2), 261-276.
Kelleher, I., & Cannon, M. (2010). Psychotic-like experiences in the general population:
characterizing a high-risk group for psychosis. Psychological Medicine, 1-6. doi:
10.1017/S0033291710001005
Kendler, K. S., Lieberman, J. A., & Walsh, D. (1989). The Structured Interview for
Schizotypy (SIS): a preliminary report. Schizophrenia Bulletin, 15(4), 559-571.
Kendler, K. S., Thacker, L., & Walsh, D. (1996). Self-report measures of schizotypy as
indices of familial vulnerability to schizophrenia. Schizophrenia Bulletin, 22(3),
511-520.

89
Kernis, M. H., Paradise, A. W., Whitaker, D. J., Wheatman, S. R., & Goldman, B. N.
(2000). Master of one's psychological domain? Not likely if one's self-esteem is
unstable. Personality and Social Psychology Bulletin, 26, 1297-1305. doi:
10.1177/0146167200262010
Kerns, J. G., & Berenbaum, H. (2003). The relationship between formal thought disorder
and executive functioning component processes. Journal of Abnormal
Psychology, 112, 339-352. doi: 10.1037/0021-843X.112.3.339
Kulhara, P., Banerjee, A., & Dutt, A. (2008). Early intervention in schizophrenia. Indian
Journal of Psychiatry, 50(2), 128-134. doi: 10.4103/0019-5545.42402
Kwapil, T. R., Chapman, L. J., & Chapman, J. (1999). Validity and usefulness of the
Wisconsin Manual for Assessing Psychotic-like Experiences. Schizophrenia
Bulletin, 25, 363-375.
Laruelle, M., & Abi-Dargham, A. (1999). Dopamine as the wind of the psychotic fire:
new evidence from brain imaging studies. Journal of Psychopharmacology, 13,
358-371. doi: 10.1177/026988119901300405
Le Pelley, M. E., Schmidt-Hansen, M., Harris, N. J., Lunter, C. M., & Morris, C. S.
(2010). Disentangling the attentional deficit in schizophrenia: pointers from
schizotypy. Psychiatry Research, 176(2-3), 143-149. doi:
10.1016/j.psychres.2009.03.027
Leary, M. R., Tambor, E. S., Terdal, S. K., & Downs, D. L. (1995). Self-esteem as an
interpersonal monitor: The sociometer hypothesis. Journal of Personality and
Social Psychology, 68, 518-530. doi: 10.1037/0022-3514.68.3.518
Lenzenweger, M. F. (1994). Psychometric high-risk paradigm, perceptual aberrations,
and schizotypy: an update. Schizophrenia Bulletin, 20, 121-135.

90
Lenzenweger, M. F. (2006). Schizotaxia, schizotypy, and schizophrenia: Paul E. Meehl's
blueprint for the experimental psychopathology and genetics of schizophrenia.
Journal of Abnormal Psychology, 115, 195-200. doi: 10.1037/0021-
843X.115.2.195
Lenzenweger, M. F., Lane, M. C., Loranger, A. W., & Kessler, R. C. (2007). DSM-IV
personality disorders in the National Comorbidity Survey Replication. Biological
Psychiatry, 62, 553-564. doi: 10.1016/j.biopsych.2006.09.019
Loewy, R. L., Bearden, C. E., Johnson, J. K., Raine, A., & Cannon, T. D. (2005). The
prodromal questionnaire (PQ): preliminary validation of a self-report screening
measure for prodromal and psychotic syndromes. Schizophrenia Research, 79(1),
117-125.
Loewy, R. L., Pearson, R., Vinogradov, S., Bearden, C. E., & Cannon, T. D. (2011).
Psychosis risk screening with the Prodromal Questionnaire - Brief Version (PQ-
B). Schizophrenia Research. doi: 10.1016/j.schres.2011.03.029
Loranger, A. W. (1988). Personality Disorder Examination (PDE) manual. Yonkers,
NY: DV Communications.
Lysaker, P. H., Clements, C. A., Plascak-Hallberg, C. D., Knipscheer, S. J., & Wright, D.
E. (2002). Insight and personal narratives of illness in schizophrenia. Psychiatry,
65(3), 197-206.
Lysaker, P. H., & Lysaker, J. T. (2010). Schizophrenia and alterations in self-experience:
a comparison of 6 perspectives. Schizophrenia Bulletin, 36(2), 331-340. doi:
10.1093/schbul/sbn077

91
Lysaker, P. H., Wickett, A. M., Wilke, N., & Lysaker, J. (2003). Narrative incoherence in
schizophrenia: the absent agent-protagonist and the collapse of internal dialogue.
American Journal of Psychotherapy, 57(2), 153-166.
Maher, B. A. (1974). Delusional thinking and perceptual disorder. Journal of Individual
Psychology, 30(1), 98-113.
Maher, B. A. (2003). Psychopathology and delusions: Reflections on methods and
models. In M. F. Lenzenweger & J. M. Hooley (Eds.), Principles of experimental
psychopathology: Essays in honor of Brendan A. Maher (pp. 9-28). Washington:
American Psychological Association.
Manning, V., Wanigaratne, S., Best, D., Strathdee, G., Schrover, I., & Gossop, M.
(2007). Screening for cognitive functioning in psychiatric outpatients with
schizophrenia, alcohol dependence, and dual diagnosis. Schizophrenia Research,
91(1-3), 151-158. doi: 10.1016/j.schres.2006.11.019
Martins Serra, A., Jones, S. H., Toone, B., & Gray, J. A. (2001). Impaired associative
learning in chronic schizophrenics and their first-degree relatives: a study of latent
inhibition and the Kamin blocking effect. Schizophrenia Research, 48(2-3), 273-
289. doi: S0920996400001419 [pii]
Miller, T. J., McGlashan, T. H., Rosen, J. L., Cadenhead, K., Cannon, T., Ventura, J., . . .
Woods, S. W. (2003). Prodromal assessment with the structured interview for
prodromal syndromes and the scale of prodromal symptoms: predictive validity,
interrater reliability, and training to reliability. Schizophrenia Bulletin, 29(4), 703-
715.

92
Moller, P., & Husby, R. (2000). The initial prodrome in schizophrenia: searching for
naturalistic core dimensions of experience and behavior. Schizophrenia Bulletin,
26, 217-232.
Myin-Germeys, I., & van Os, J. (2007). Stress-reactivity in psychosis: evidence for an
affective pathway to psychosis. Clinical Psychology Review, 27(4), 409-424. doi:
10.1016/j.cpr.2006.09.005
Neale, J. M., & Oltmanns, T. F. (1980). Schizophrenia. New York: Wiley.
Overall, J. E., & Gorham, D. R. (1962). The Brief Psychiatric Rating Scale.
Psychological Reports, 10, 799-803.
Parnas, J., & Handest, P. (2003). Phenomenology of anomalous self-experience in early
schizophrenia. Comprehensive Psychiatry, 44(2), 121-134. doi:
10.1053/comp.2003.50017
Parnas, J., Handest, P., Saebye, D., & Jansson, L. (2003). Anomalies of subjective
experience in schizophrenia and psychotic bipolar illness. Acta Psychiatrica
Scandinavica, 108, 126-133. doi: 105 [pii]
Pedhazur, E. J. (1997). Multiple regression in behavioral research: explanation and
prediction (3rd ed.). Toronto, Ontario: Wadsworth Publishing.
Peters, E. R., Joseph, S., Day, S., & Garety, P. (2004). Measuring delusional ideation: the
21-item Peters et al. Delusions Inventory (PDI). Schizophrenia Bulletin, 30(4),
1005-1022.
Phillips, L. J., Yung, A. R., & McGorry, P. D. (2000). Identification of young people at
risk of psychosis: validation of Personal Assessment and Crisis Evaluation Clinic

93
intake criteria. Australia and New Zealand Journal of Psychiatry, 34 Suppl, S164-
169.
Preacher, K. J., Rucker, D. D., MacCallum, R. C., & Nicewander, W. A. (2005). Use of
the extreme groups approach: a critical reexamination and new recommendations.
Psychological Methods, 10(2), 178-192. doi: 10.1037/1082-989X.10.2.178
Proulx, T., & Heine, S. J. (2009). Connections from Kafka: exposure to meaning threats
improves implicit learning of an artificial grammar. Psychological Science, 20(9),
1125-1131. doi: 10.1111/j.1467-9280.2009.02414.x
Raballo, A., Saebye, D., & Parnas, J. (2009). Looking at the Schizophrenia Spectrum
Through the Prism of Self-disorders: An Empirical Study. Schizophrenia Bulletin.
doi: 10.1093/schbul/sbp056
Raine, A. (1991). The SPQ: a scale for the assessment of schizotypal personality based
on DSM-III-R criteria. Schizophrenia Bulletin, 17, 555-564.
Rey, G., Jouvent, R., & Dubal, S. (2009). Schizotypy, depression, and anxiety in physical
and social anhedonia. Journal of Clinical Psychology, 65(7), 695-708. doi:
10.1002/jclp.20577
Roiser, J. P., Stephan, K. E., Ouden, H. E., Barnes, T. R., Friston, K. J., & Joyce, E. M.
(2008). Do patients with schizophrenia exhibit aberrant salience? Psychological
Medicine, 1-11. doi: 10.1017/S0033291708003863
Rosenberg, M. (1965). Society and the adolescent self-image. . Princeton, New Jersey:
Princeton University Press. .

94
Ross, S. R., Lutz, C. J., & Bailley, S. E. (2002). Positive and negative symptoms of
schizotypy and the Five-factor model: a domain and facet level analysis. Journal
of Personality Assessment, 79, 53-72.
Schmidt-Hansen, M., Killcross, A. S., & Honey, R. C. (2009). Latent inhibition, learned
irrelevance, and schizotypy: assessing their relationship. Cognitive
Neuropsychiatry, 14(1), 11-29. doi: 10.1080/13546800802664539
Schmidt, K., & Roiser, J. P. (2009). Assessing the construct validity of aberrant salience.
Frontiers in Behavioral Neuroscience, 3, 58. doi: 10.3389/neuro.08.058.2009
Seeman, P. (1987). Dopamine receptors and the dopamine hypothesis of schizophrenia.
Synapse, 1, 133-152. doi: 10.1002/syn.890010203
Seidman, L. J., Giuliano, A. J., Meyer, E. C., Addington, J., Cadenhead, K. S., Cannon,
T. D., . . . Cornblatt, B. A. (2010). Neuropsychology of the prodrome to psychosis
in the NAPLS consortium: relationship to family history and conversion to
psychosis. Archives of General Psychiatry, 67(6), 578-588. doi:
10.1001/archgenpsychiatry.2010.66
Soares, J. C., & Innis, R. B. (1999). Neurochemical brain imaging investigations of
schizophrenia. Biological Psychiatry, 46, 600-615. doi: S0006-3223(99)00015-3
[pii]
Stefanis, N. C., Smyrnis, N., Avramopoulos, D., Evdokimidis, I., Ntzoufras, I., &
Stefanis, C. N. (2004). Factorial composition of self-rated schizotypal traits
among young males undergoing military training. Schizophrenia Bulletin, 30,
335-350.

95
Stinson, D. A., Wood, J. V., & Doxey, J. R. (2008). In search of clarity: self-esteem and
domains of confidence and confusion. Personality and Social Psychology
Bulletin, 34(11), 1541-1555. doi: 10.1177/0146167208323102
Strauss, J. S., & Carpenter, W. T., Jr. (1972). The prediction of outcome in schizophrenia.
I. Characteristics of outcome. Archives of General Psychiatry, 27(6), 739-746.
Strauss, J. S., Kokes, R. F., Klorman, R., & Sacksteder, J. L. (1977). Premorbid
adjustment in schizophrenia: concepts, measures, and implications. Part I. The
concept of premorbid adjustment. Schizophrenia Bulletin, 3(2), 182-185.
Thewissen, V., Bentall, R. P., Lecomte, T., van Os, J., & Myin-Germeys, I. (2008).
Fluctuations in self-esteem and paranoia in the context of daily life. Journal of
Abnormal Psychology, 117, 143-153. doi: 10.1037/0021-843X.117.1.143
Thewissen, V., Myin-Germeys, I., Bentall, R., de Graaf, R., Vollebergh, W., & van Os, J.
(2007). Instability in self-esteem and paranoia in a general population sample.
Social Psychiatry and Psychiatric Epidemiology, 42(1), 1-5. doi: 10.1007/s00127-
006-0136-1
Tombaugh, T. N., McDowell, I., Kristjansson, B., & Hubley, A. M. (1996). Mini-Mental
State Examination and the Modified MMSE: psychometric comparison and
normative data. Psychological Assessment, 1, 48-59.
Tombaugh, T. N., & McIntyre, N. J. (1992). The mini-mental state examination: a
comprehensive review. Journal of the American Geriatrics Society, 40, 922-935.
van Os, J., Hanssen, M., Bijl, R. V., & Vollebergh, W. (2001). Prevalence of psychotic
disorder and community level of psychotic symptoms: an urban-rural comparison.
Archives of General Psychiatry, 58, 663-668. doi: yoa20258 [pii]

96
van Os, J., Kenis, G., & Rutten, B. P. (2010). The environment and schizophrenia.
Nature, 468(7321), 203-212. doi: 10.1038/nature09563
van Os, J., Linscott, R. J., Myin-Germeys, I., Delespaul, P., & Krabbendam, L. (2009). A
systematic review and meta-analysis of the psychosis continuum: evidence for a
psychosis proneness-persistence-impairment model of psychotic disorder.
Psychological Medicine, 39, 179-195. doi: 10.1017/S0033291708003814
Waltz, J. A., Frank, M. J., Robinson, B. M., & Gold, J. M. (2007). Selective
reinforcement learning deficits in schizophrenia support predictions from
computational models of striatal-cortical dysfunction. Biological Psychiatry,
62(7), 756-764. doi: 10.1016/j.biopsych.2006.09.042
Waltz, J. A., Frank, M. J., Wiecki, T. V., & Gold, J. M. (2011). Altered probabilistic
learning and response biases in schizophrenia: behavioral evidence and
neurocomputational modeling. Neuropsychology, 25(1), 86-97. doi:
10.1037/a0020882
Waltz, J. A., & Gold, J. M. (2007). Probabilistic reversal learning impairments in
schizophrenia: further evidence of orbitofrontal dysfunction. Schizophrenia
Research, 93(1-3), 296-303. doi: 10.1016/j.schres.2007.03.010
Watson, D. (2001). Dissociations of the night: individual differences in sleep-related
experiences and their relation to dissociation and schizotypy. Journal of
Abnormal Psychology, 110, 526-535.
Watson, D., & Naragon-Gainey, K. (2009). On the specificity of positive emotional
dysfunction in psychopathology: Evidence from the mood and anxiety disorders
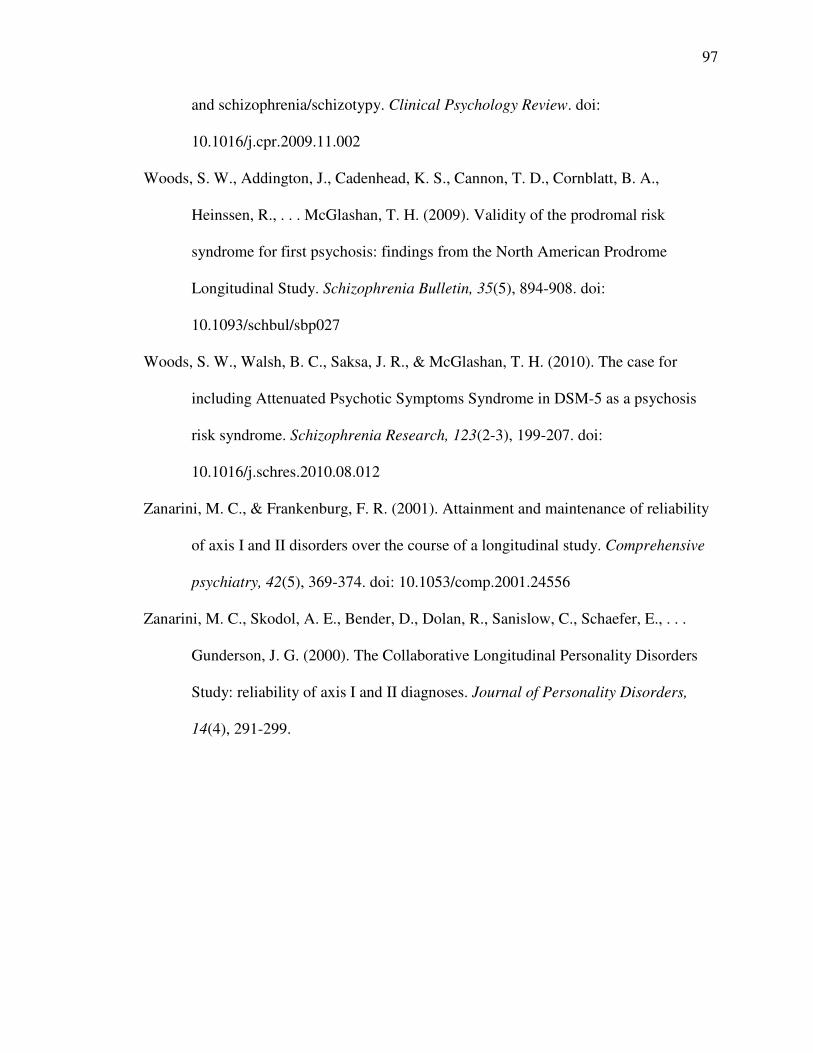
97
and schizophrenia/schizotypy. Clinical Psychology Review. doi:
10.1016/j.cpr.2009.11.002
Woods, S. W., Addington, J., Cadenhead, K. S., Cannon, T. D., Cornblatt, B. A.,
Heinssen, R., . . . McGlashan, T. H. (2009). Validity of the prodromal risk
syndrome for first psychosis: findings from the North American Prodrome
Longitudinal Study. Schizophrenia Bulletin, 35(5), 894-908. doi:
10.1093/schbul/sbp027
Woods, S. W., Walsh, B. C., Saksa, J. R., & McGlashan, T. H. (2010). The case for
including Attenuated Psychotic Symptoms Syndrome in DSM-5 as a psychosis
risk syndrome. Schizophrenia Research, 123(2-3), 199-207. doi:
10.1016/j.schres.2010.08.012
Zanarini, M. C., & Frankenburg, F. R. (2001). Attainment and maintenance of reliability
of axis I and II disorders over the course of a longitudinal study. Comprehensive
psychiatry, 42(5), 369-374. doi: 10.1053/comp.2001.24556
Zanarini, M. C., Skodol, A. E., Bender, D., Dolan, R., Sanislow, C., Schaefer, E., . . .
Gunderson, J. G. (2000). The Collaborative Longitudinal Personality Disorders
Study: reliability of axis I and II diagnoses. Journal of Personality Disorders,
14(4), 291-299.

98
Table 1: Bivariate Correlations for the Measures Used in Study 1
1 2 3 4 5 6
Aberrant Salience
1) Aberrant Salience .86
Self-Concept Clarity
2) SCCS -.34* .86
3) MNMDT -.09 .27* .32
Psychotic-Like Experiences
4) PerMag .59* -.32* -.17* .88
5) PDI-Total .55* -.31* -.04 .61* .74
Social Anhedonia
6) Social Anhedonia .12* -.29* -.29* .23* .19* .85
Mean 15.63 37.82 17.87 12.82 6.10 7.34
Standard Deviation 6.12 9.42 2.67 9.61 3.18 5.70
* p < .001, numbers on the diagonal represent Cronbach’s alpha. SCCS = Self-Concept
Clarity Scale. MNMDT = Me Not-me Decision Task, PDI = Peters Delusion Inventory.
PerMag = Combined Perceptual Aberration and Magical Ideation Scales.

99
Table 2
Regression analyses for the interaction between aberrant salience and self-concept clarity
predicting PerMag, PDI total scores, and social anhedonia in Study 1.
PerMag PDI-Total Score SocAnh
Aberrant Salience by Self-Concept Clarity Scale
Step 1 (∆R2) .36*** .33*** .09***
ASI (β) .55*** .52*** .03
SCCS (β) -.13*** -.12*** -.28***
Step 2 (∆R2) .02*** .01* .00
ASI X SCCS (β) -.13*** -.07* -.05
Aberrant Salience by Me Not-Me Decision Task
Step 1 (∆R2) .37*** .30*** .09***
ASI (β) .58*** .55*** .10*
MNMDT (β) -.12** -.01 -.28***
Step 2 (∆R2) .01* .00 .00
ASI X MNMDT (β) -.07* -.01 .01
*** p < .001, ** p < .01, * p <.05. ASI = Aberrant Salience Inventory, PerMag =
combined Perceptual Aberration Scale and Magical Ideation Scale, PDI = Peters
Delusion Inventory, SocAnh = the Revised Social Anhedonia Scale.
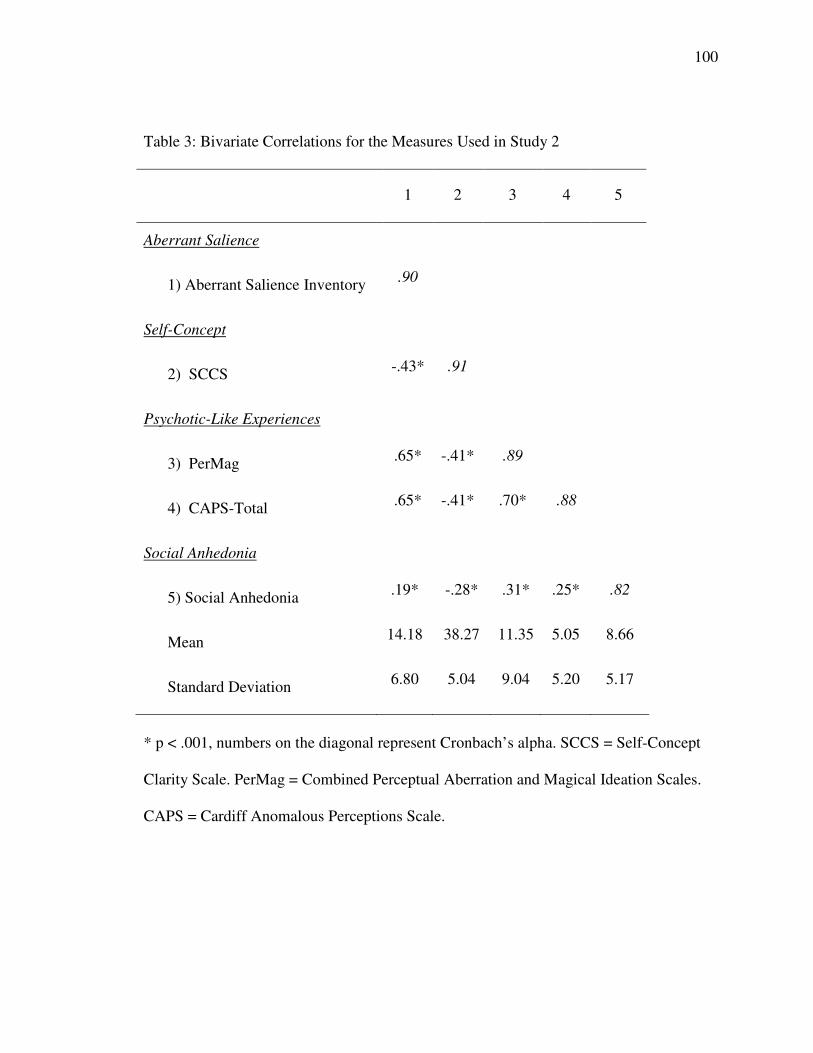
100
Table 3: Bivariate Correlations for the Measures Used in Study 2
1 2 3 4 5
Aberrant Salience
1) Aberrant Salience Inventory .90
Self-Concept
2) SCCS -.43* .91
Psychotic-Like Experiences
3) PerMag .65* -.41* .89
4) CAPS-Total .65* -.41* .70* .88
Social Anhedonia
5) Social Anhedonia .19* -.28* .31* .25* .82
Mean 14.18 38.27 11.35 5.05 8.66
Standard Deviation 6.80 5.04 9.04 5.20 5.17
* p < .001, numbers on the diagonal represent Cronbach’s alpha. SCCS = Self-Concept
Clarity Scale. PerMag = Combined Perceptual Aberration and Magical Ideation Scales.
CAPS = Cardiff Anomalous Perceptions Scale.

101
Table 4
Regression Analyses for the Interaction between Aberrant Salience and Self-Concept
Clarity Predicting PerMag/CAPS and Social Anhedonia.
PerMag/CAPS SocAnh
Step 1 (∆R2) .54*** .08***
ASI (β) .65*** .07
SCCS (β) -.17*** -.25***
Step 2 (∆R2) .04*** .01
ASI X SCCS (β) -.20*** -.03
*** p < .001, ASI = Aberrant Salience Inventory, SCCS = Self-Concept Clarity Scale,
PerMag/CAPS = combined Perceptual Aberration Scale, Magical Ideation Scale, and
Cardiff Anomalous Perceptions Scale, SocAnh = the Revised Social Anhedonia Scale.

102
Table 5: Bivariate Correlations for the Measures Used in Study 3
1 2 3 4 5 6
1) Aberrant Salience Inventory .90
2) SCCS -.33* .91
3) PerMag .59* -.37* .85
4) Neuroticism .09 -.30* .19* .88
5) SPQ-S .46* -.40* .45* .24* .72
6) SocAnh .17* -.26* .41* .15* .39* .81
Mean 13.94 37.32 13.77 30.24 2.62 7.24
Standard Deviation 7.11 8.10 10.15 7.08 2.21 5.28
*p < .001, Neuroticism = the neuroticism subscale of the International Personality Item
Pool, SPS-S = Suspiciousness subscale of the Schizotypal Personality Questionnaire.

103
Table 6
Regression Analyses for the Three-Way Interaction between the Aberrant Salience
Inventory, Self-Concept Clarity Scale, and IPIP-Neuroticism Scale in Study 3.
PerMag
Step 1 (∆R2) .37***
ASI (β) .51***
SCC (β) -.18**
Neuroticism (β) -.08*
Step 2 (∆R2) .01
ASI X SCC (β) -.12***
ASI X Neuroticism (β) .04
Neuroticism X SCC (β) .04
Step 3 (∆R2) .01
ASI X SCC X Neuroticism (β) -.03
*** p < .001, ** p < .01, PerMag = combined Perceptual Aberration and Magical
Ideation Scales, Neuroticism = the Neuroticism Subscale of the International Personality
Item Pool.

104
Table 7
Regression Analyses for the Interaction between Aberrant Salience and Self-Concept
Clarity Predicting Paranoia in Study 3.
SPQ-S
Step 1 (∆R2) .29***
ASI (β) .37***
SCC (β) -.28**
Step 2 (∆R2) .00
ASI X SCC (β) .01
*** p < .001, ** p < .01, SPQ-S = The Suspiciousness subscale of the Schizotypal
Personality Questionnaire.

105
Table 8
Wisconsin Schizotypy Group comparisons of Aberrant Salience Variables in Study 4
Positive Group
Mean (SD)
Negative Group
Mean (SD)
Control Group
Mean (SD)
Aberrant Salience Inventory 24.01 (3.28)a 16.70 (5.76)b 13.35 (5.68)c
PST Avoid 45.81 (14.47)a 46. 05 (12.80)a 49.56 (12.71)b
PST Approach 42.17 (11.44)a 42.41 (12.08)a 45.51 (11.59)b
PST Approach minus Avoid -3.64 (3.91)a -3.65 (4.14)a -4.05 (4.24)a
Means that share a superscript letter do not significantly differ from each other.

106
Table 9
Correlations among Self-Processing variables in Study 4
SCCS MNMDT MNMDT-RT
MNMDT .20***
MNMDT-RT -.15*** .05
RSES .62*** .19*** -.16***
*** p < .001, SCCS = Self-Concept Clarity Scale, MNMDT = Me Not-Me Decision
Task, MNMDT-RT = Me Not-Me Decision Task Reaction Time, RSES = Rosenberg
Self-Esteem Scale.

107
Table 10
Wisconsin Group comparisons of Self-Processing Variables in Study 4 and Study 5
Positive Group
Mean (SD)
Negative Group
Mean (SD)
Control Group
Mean (SD)
Self-Concept Clarity Scale 30.83 (8.25)a 31.73 (9.34)a 40.94 (8.80)b
Me Not-me Decision Task 19.75 (2.94)a 19.15 (3.00)a 20.65 (2.60)b
Me Not-me Decision Task (RT) 1534.01 (576.37)ab 1568.45 (527.40)a 1446.97 (443.12)b
Rosenberg Self-Esteem Scale 29.67 (5.11)a 28.36 (6.38)a 32.88 (4.57)b
Means that share a superscript letter do not significantly differ from each other.

108
Table 11
Regression Analyses for the Interaction between Aberrant Salience and Self-Concept Clarity Predicting SIPS Positive Ratings
Positive
Composite
Delusional
Ideation
Paranoia Grandiosity Perceptual
Aberration
Disorganized
Communication
Step 1 (∆R2) .30*** .27*** .24*** .13*** .17*** .12***
ASI (β) .43*** .46*** .35*** .24*** .33*** .28***
SCC (β) -.11 -.04 -.18* -.10** -.08 -.06
Step 2 (∆R2) .03* .02* .01 .03* .01 .02*
ASI X SCC (β) -.17* -.15* -.11 -.19* -.12 -.11
*** p < .001, ** p < .01, * p < .05, ASI = Aberrant Salience Inventory, SCC = Self-Concept Clarity Scale.

109
Table 12
Regression Analyses for the Interaction between Aberrant Salience and Self-Concept Clarity Predicting SIPS Negative Ratings
Negative
Composite
Social
Anhedonia
Avolition Expression of
Emotion
Experience of
Emotions and self
Ideational
Richness
Occupational
Functioning
Step 1 (∆R2) .12*** .03 .10*** .06* .14*** .01 .05*
ASI (β) -.07 -.14 .08 -.04 .10 -.01 .01
SCC (β) -.37*** -.21* -.26** -.23* -.37*** -.13 -.20*
Step 2 (∆R2) .00 .01 .00 .00 .01 .00 .01
ASI X SCC (β) -.04 .09 -.03 -.06 -.12 .02 -.09
*** p < .001, ** p < .01, * p < .05, ASI = Aberrant Salience Inventory, SCC = Self-Concept Clarity Scale.

110
Table 13
Regression Analyses for the Interaction between Aberrant Salience and Self-Concept Clarity Predicting SIPS Disorganized
Ratings
Disorganized
Composite
Odd
Behavior
Bizarre
Thinking
Impaired
Focus/Attention
Impaired
Personal Hygiene
Step 1 (∆R2) .15*** .05* .11*** .18*** .02
ASI (β) .26** .18* .26** .19* .12
SCC (β) -.18* -.08 -.06 -.30*** -.05
Step 2 (∆R2) .00 .00 .02+ .00 .00
ASI X SCC (β) -.05 -.02 -.15+ .01 .03
*** p < .001, ** p < .01, * p < .05, ASI = Aberrant Salience Inventory, SCC = Self-Concept Clarity Scale.

111
Table 14
Regression Analyses for the Interaction between Aberrant Salience and Self-Concept Clarity Predicting SIAPA Ratings
SIAPA Total Hypersensitivity Inundation Selective Attention
Step 1 (∆R2) .13*** .18*** .15*** .13***
ASI (β) .24** .30*** .24** .24**
SCC (β) -.08* -.11 -.15+ -.08
Step 2 (∆R2) .04** .04** .03* .04
ASI X SCC (β) -.22** -.21* -.18* -.22**
*** p < .001, ** p < .01, * p < .05, + p < .10, ASI = Aberrant Salience Inventory, SCC = Self-Concept Clarity Scale.

112
Table 15
Correlations among Aberrant Salience Variables from Study 5
ASI Last
2 weeks
ASI
Frequency
ABSAL-
Implicit
ASI Frequency .91***
ABSAL-Implicit .07 .19*
ABSAL-Explicit -.01 -.01 -.17*
* p < .05, ** p < .01, *** p < .001
ASI-Last 2 weeks = modified ASI limiting response to the last 2 weeks, ASI Frequency =
Follow-up questions for frequency of aberrant salience experiences, ABSAL Implicit =
Aberrant salience reaction times on the Salience Attribution Task, ABSAL Explicit =
Explicit ratings of aberrant salience on the Salience Attribution Task.
113
Table 16
Wisconsin Group comparisons of Aberrant Salience Variables in Study 4 and Study 5
Positive Group
Mean (SD)
Negative Group
Mean (SD)
Control Group
Mean (SD)
Last 2 weeks ASI 9.49 (7.23) 4.09 (4.67)a 2.32 (2.46)a
ASI Frequency 34.85 (31.18) 14.09 (17.40)a 8.04 (9.69)a
SAT-Reward Explicit 74.87 (22.13)a 66.35 (24.53)a 78.86 (20.20)a
SAT Non-Reward Explicit 20.50 (16.49) 15.12 (12.63) 19.66 (21.55)
Adaptive Salience Explicit 54.37 (29.84)a 51.24 (30.70)a 59.20 (35.36)a
Aberrant Salience Explicit 7.04 (7.98)a 10.87 (11.08)b 8.67 (10.91)ab
SAT-Reward RT 223.46 (59.97)a 219.85 (79.52)a 233.89 (51.07)a
SAT-Non Reward RT 242.96 (73.62)a 219.52 (79.52)a 244.90 (61.89)a
SAT-Adaptive Salience RT 19.50 (51.26)a 9.71 (29.94)a 11.72 (29.84)a
SAT-Aberrant Salience RT 20.90 (29.92)a 16.09 (15.2)a 14.89 (18.85)a
SAT = Salience Attribution Task. RT = Reaction Time. Last 2 weeks ASI = Modified
ASI in which participants were asked specifically about the last 2 weeks, ASI Frequency
= Frequency of Aberrant Salience Experiences in the Last 2 weeks. SAT-Reward Explicit
= Explicit Ratings of the Rewarded Stimuli. SAT Non-Reward Explicit = Explicit
Ratings of the Non-Rewarded Stimuli, Adaptive Salience Explicit = Difference between
ratings for rewarded stimuli vs. non-rewarded stimuli. Aberrant Salience Explicit =
Absolute value of the difference between ratings for reward-irrelevant stimulus
dimension. SAT Reward RT = Reaction time for rewarded stimuli. SAT-Non Reward RT

114
= reaction times for non-rewarded stimuli. SAT-Adaptive Salience RT = difference in
reaction times between the rewarded and non-rewarded stimuli. SAT Aberrant Salience
RT = Absolute value of the difference in reaction times between the reward-irrelevant
stimulus dimension.
Means that share a superscript letter do not significantly differ from each other.

115
Table 17
Correlations among Self-Processing variables in Study 5
*** p < .001, * p < .05, SCCS = Self-Concept Clarity Scale, Modified MNMDT =
untimed MNMDT with follow-up confidence questions. MNMDT Confidence = mean
confidence ratings on follow up questions.
SCCS
Time 2
Modified
MNMDT
MNMDT
Confidence
Modified MNMDT .33***
MNMDT Confidence .32*** .29*
RSES .61*** .35*** .35***

116
Table 18
Wisconsin Group comparisons of Self-Processing Variables in Study 5
Positive Group
Mean (SD)
Negative Group
Mean (SD)
Control Group
Mean (SD)
Rosenberg Self-Esteem Scale 30.23 (4.67)a 29.93 (6.61)a 33.96 (4.98)b
Self-Concept Clarity Scale 31.57 (9.45)a 34.60 (9.84)a 44.30 (9.17)b
Modified MNMDT (Untimed) 18.04 (3.38)a 19.14 (2.57)b 20.96 (2.62)c
Modified MNMDT Confidence Ratings 5.16 (0.71)ab 5.02 (0.67)a 5.31 (0.62)b
SCCS = Self-Concept Clarity Scale, Modified MNMDT = untimed MNMDT with
follow-up confidence questions. MNMDT Confidence = mean confidence ratings on
follow up questions.
Means that share a superscript letter do not significantly differ from each other.

117
Table 19
Wisconsin Schizotypy between Group Comparisons of Interview-Rated Positive
Symptoms in Study 5
Positive Group
Mean (SD)
Negative Group
Mean (SD)
Control Group
Mean (SD)
Global Positive Rating 9.94 (5.18)a 5.33 (4.56)b 2.20 (3.26)c
Delusional Ideation 2.80 (1.54)a 1.25 (1.45)b 0.59 (1.09)c
Paranoia 2.14 (1.11)a 1.56 (1.20)b 0.53 (0.88)c
Grandiosity 1.78 (1.71)a 0.64 (1.23)b 0.34 (0.65)b
Perceptual Anomalies 2.00 (1.52)a 0.97 (1.35)b 0.43 (0.93)b
Disorganized Communication 1.22 (1.19)a 0.92 (1.14)a 0.32 (0.64)b
Means that share a superscript letter do not significantly differ from each other.

118
Table 20
Wisconsin Schizotypy between Group Comparisons of Interview-Rated Negative
Symptoms in Study 5
Positive Group
Mean (SD)
Negative Group
Mean (SD)
Control Group
Mean (SD)
Global Negative Rating 3.59 (3.56)a 5.74 (4.22)b 0.90 (1.95)c
Social Anhedonia 0.53 (0.92)a 2.05 (1.61)b 0.05 (0.21)c
Avolition 0.86 (1.00)a 0.77 (0.97)a 0.25 (0.65)b
Expression of Emotion 0.67 (0.97)a 1.23 (1.24)b 0.25 (0.61)c
Experience of Emotion and Self 0.69 (1.16)a 1.03 (1.35)a 0.07 (0.33)b
Ideational Richness 0.33 (0.71)a 0.31 (0.76)a 0.16 (0.64)a
Occupational Functioning 0.51 (0.90)a 0.34 (0.90)b 0.13 (0.35)b
Means that share a superscript letter do not significantly differ from each other.

119
Table 21
Wisconsin Schizotypy between Group Comparisons of Interview-Rated Disorganized
Symptoms in Study 5
Positive Group
Mean (SD)
Negative Group
Mean (SD)
Control Group
Mean (SD)
Global Disorganized Rating 3.06 (2.81)a 2.00 (2.30)b 0.59 (0.94)c
Odd Behavior 0.67 (0.99)a 0.49 (0.94)a 0.05 (0.21)b
Bizarre Thinking 0.84 (1.22)a 0.43 (0.78)b 0.07 (0.33)c
Focus/Attention 1.38 (0.94)a 0.87 (0.87)b 0.45 (0.66)c
Personal Hygiene 0.18 (0.56)a 0.21 (0.61)a 0.02 (0.15)b
Means that share a superscript letter do not significantly differ from each other.

120
Table 22
Correspondence between Wisconsin Schizotypy Groups and SIPS Ratings of 3 and 4 or
Higher for Positive and Negative Symptoms
Wisconsin
Control
(n = 44)
Wisconsin
Positive
(n = 57)
Wisconsin
Negative
(n = 62)
Total
(n = 156)
SIPS Control (3) 84.1% 27.5% 24.6% 42.5%
SIPS Positive (3) 11.4% 75.4% 43.5% 44.4%
SIPS Negative (3) 4.5% 22.8% 58.1% 29.4%
SIPS Control (4) 93.2% 52.6% 67.7% 71.3%
SIPS Positive (4) 4.5%a 38.6% 14.5% 20.0%
SIPS Negative (4) 2.3%a 10.5% 21.0% 11.3%
Note: Numbers in Positive, Negative, and Total Columns add up to more than 100%
because some participants met criteria for the positive and the negative SIPS and/or
positive and negative Wisconsin schizotypy group. SIPS Control (3) = No ratings of 3 or
more on any of the SIPS positive and negative ratings, SIPS Positive (3) = at least one
rating of 3 or more on a positive SIPS item, SIPS Negative (3) = at least one ratings of 3
or more on a negative SIPS item. SIPS Control (4) = No ratings of 3 or more on any of
the SIPS positive and negative ratings, SIPS Positive (4) = at least one rating of 3 or more
on a positive SIPS item, SIPS Negative (4) = at least one ratings of 3 or more on a
negative SIPS item.

121
Table 23
Simultaneous Regression of all Questionnaire Variables Predicting Interview-Rated Positive Symptoms.
Positive
Composite
Delusional
ideation
Perceptual
Anomalies
Disorganized
Communication
Paranoia Grandiosity
Cardiff Anomalous Perceptions Scale (β) .51*** .50*** .67*** .20+ .29** .24*
Magical Ideation (β) .18+ .17 .19+ -.07 .27* .11
Perceptual Aberration (β) .02 -.05 .04 .08 .00 .02
Aberrant Salience Inventory (β) .04 .08 .02 .13 .03 -.09
Peters Delusion Inventory (β) .12 .18+ -.14 .10 .01 .32**
SPQ-Suspiciousness (β) -.01 -.11 -.17* -.01 .23** .07
Social Anhedonia (β) .08 .06 .14* .11 .09 -.09
*** p < .001, ** p < .01, * p < .05, + < .10

122
Table 24
Simultaneous Regression of all Questionnaire Variables Predicting Interview-Rated Negative Symptoms
Negative
Composite
Social
Anhedonia
Avolition Expression
of Emotion
Experiences of
Emotion and
Self
Ideational
Richness
Occupational
Functioning
Magical Ideation (β) .10 -.04 .20 .10 .01 .03 .14
Perceptual Aberration (β) .06 .10 -.02 -.16 .06 .20 .07
Social Anhedonia (β) .52*** .65*** .15+ .44*** .32*** .14 .05
Aberrant Salience Inventory (β) -.12 -.15 .01 .04 -.14 -.09 -.09
Peters Delusion Inventory (β) .03 .06 -.03 .01 .20 -.17 -.07
Cardiff Anomalous Perceptions
Scale (β)
.13 -.01 .07 .20+ .10 .15 .04
SPQ-Suspiciousness (β) -.03 -.05 .05 -.18+ -.01 -.04 .15
*** p < .001, ** p < .01, * p < .05, + < .10

123
Table 25
Simultaneous Regression of all Questionnaire Variables Predicting Interview-Rated Delusional Ideation.
Disorganized
Composite
Odd Behavior Bizarre
Thinking
Impairment in
Focus/Attention
Impairments in
Personal Hygiene
Magical Ideation (β) -.03 -.08 -.06 .17 -.16
Perceptual Aberration (β) .26* .35* .23+ -.09 .37*
Social Anhedonia (β) .14+ .18* .14+ -.01 .10
Aberrant Salience
Inventory (β)
.03 -.04 .05 .04 .05
Peters Delusion
Inventory (β)
.05 .09 .17 -.05 -.13
Cardiff Anomalous
Perceptions Scale (β)
.30** .16 .38*** .27* -.01
SPQ-Suspiciousness (β) -.12 -.20* -.32*** .20* .01
*** p < .001, ** p < .01, * p < .05, + < .10

124
Table 26
Comparisons among Wisconsin Schizotypy Groups for Self-Report Schizotypy Scales
Positive Group
Mean (SD)
Negative Group
Mean (SD)
Control Group
Mean (SD)
Peters Delusion Inventory
PDI-Total 11.12 (3.64)a 6.90 (3.39)b 4.34 (2.21)c
PDI-Distress 32.97 (14.98)a 19.88 (10.68)b 10.79 (6.75)c
PDI-Preoccupation 35.48 (14.89)a 20.27 (10.64)b 12.34 (7.43)c
PDI-Conviction 38.36 (15.59)a 23.48 (12.65)b 15.26 (8.25)c
Cardiff Anomalous Perceptions Scale
CAPS-Total 10.68 (6.98)a 3.90 (4.40)b 2.95 (3.37)b
CAPS-Distress 28.21 (22.51)a 8.76 (10.28)b 5.91 (7.71)b
CAPS-Distraction 30.79 (24.67)a 9.69 (12.93)b 7.07 (9.18)b
CAPS-Frequency 27.68 (24.32)a 8.93 (11.83)b 5.22 (6.02)b
Paranoia
SPQ-Suspiciousness 4.45 (2.50)a 3.62 (2.22)b 1.52 (1.80)c
Means that share a superscript letter do not significantly differ from each other

125
Table 27
Comparison between Schizophrenia and Control Groups on Aberrant Salience Variable
Schizophrenia
Mean (SD)
Control
Mean (SD)
Self-Report Aberrant Salience
Aberrant Salience Inventory 15.20 (7.78)* 10.94 (6.00)
Probabilistic Selection Task
Choose Rewarded Stimulus 35.56 (11.27)* 40.70 (11.56)
Avoid Punished Stimulus 38.59 (12.07) 43.55 (12.99)
Preference for Reward Learning -3.19 (3.68) -2.85 (3.62)
Salience Attribution Task-Explicit Ratings
Explicit Reward 38.90 (20.22) 44.31 (21.69)
Explicit Non-Reward 35.90 (20.97) 35.73 (19.11)
Explicit Adaptive Salience 3.0 (21.75) 8.58 (35.69)
Explicit Aberrant Salience 14.49 (15.98)* 32.80 (26.94)
Salience Attribution Task- Reaction Time Measures
Adaptive Salience RT 0.58 (26.38) -6.633 (44.57)
Aberrant Salience RT 20.49 (17.04) 17.96 (12.66)
* p < .05, Reward Explicit = Explicit Ratings of the Rewarded Stimuli, SAT Non-Reward
Explicit = Explicit Ratings of the Non-Rewarded Stimuli, Explicit Adaptive Salience =
Difference between ratings for rewarded stimuli vs. non-rewarded stimuli. Explicit

126
Aberrant Salience = Absolute value of the difference between ratings for reward-
irrelevant stimulus dimension. SAT Reward RT = Reaction time for rewarded stimuli,
SAT Aberrant Salience RT = Absolute value of the difference in reaction times between
the reward-irrelevant stimulus dimension.

127
Table 28
Comparison between Schizophrenia and Control Groups on Self-Relevant Information
Processing Variables.
Schizophrenia
Mean (SD)
Control
Mean (SD)
Self-Esteem
Rosenberg Self-Esteem Scale 19.53 (4.67)* 31.79 (4.82)
Self-Report Self-Concept Clarity
Self-Concept Clarity Scale 40.64 (7.89)* 44.49 (7.44)
Me Not-me Decision Task
Me Not-me Decision Task 17.61 (3.73)* 22.21(2.69)
MNMDT_RT 4264.24 (3023.37)* 2173.42 (3023.57)
Modified Me Not-me Decision Task
Modified MNMDT 18.08 (4.14)* 22.57 (2.96)
SCC-Confidence 5.37 (1.14) 5.30 (0.69)
Confidence RT Mean 4005.18 (2364.70)* 2639.34 (1017.17)
* p < .05

128
Table 29
Correlations among Aberrant Salience Variables in Schizophrenia Patients.
ASI PST
Approach
PST
Avoid
Approach -
Avoid
ABSAL-
RT
ADAPT-
RT
ABSAL-
Explicit
Adapt-
Explicit
PST Approach -.07
PST Avoid -.09 .27*
Approach minus Avoid .04 .53*** -.67***
ABSAL-RT .01 .25+ -.02 .21
ADAPT-RT .01 -.15 -.08 -.03 .23
ABSAL-Explicit -.16 -.09 .10 -.16 -.06 .09
ADAPT-Explicit -.19 .23 -.16 .35* .22 .07 -.09
*** p < .001, * p < .05

129
Table 30
Correlations between Aberrant Salience Variables and Interview-Rated Positive Symptoms in Patients with Schizophrenia in
Study 6.
ASI PST
Approach
PST
Avoid
Approach
- Avoid
ABSAL
-RT
ADAPT
-RT
ABSAL
-Explicit
Adapt-
Explicit
Delusions/Hallucinations .36** -.16 -.08 -.21 .14 -.22 -.15 .08
Hallucinations .40** -.10 -.12 .03 .15 -.20 -.23 .04
Global Rating of Delusions .19 -.12 .13 -.20 .07 -.16 .01 .11
Bizarre Behavior .24+ -.27+ .15 -.35* -.20 -.05 -.19 -.08
Formal Thought Disorder .15 -.04 -.02 -.02 -.16 -.28+ .15 -.08
** p < .01, p < .05, + p < .10
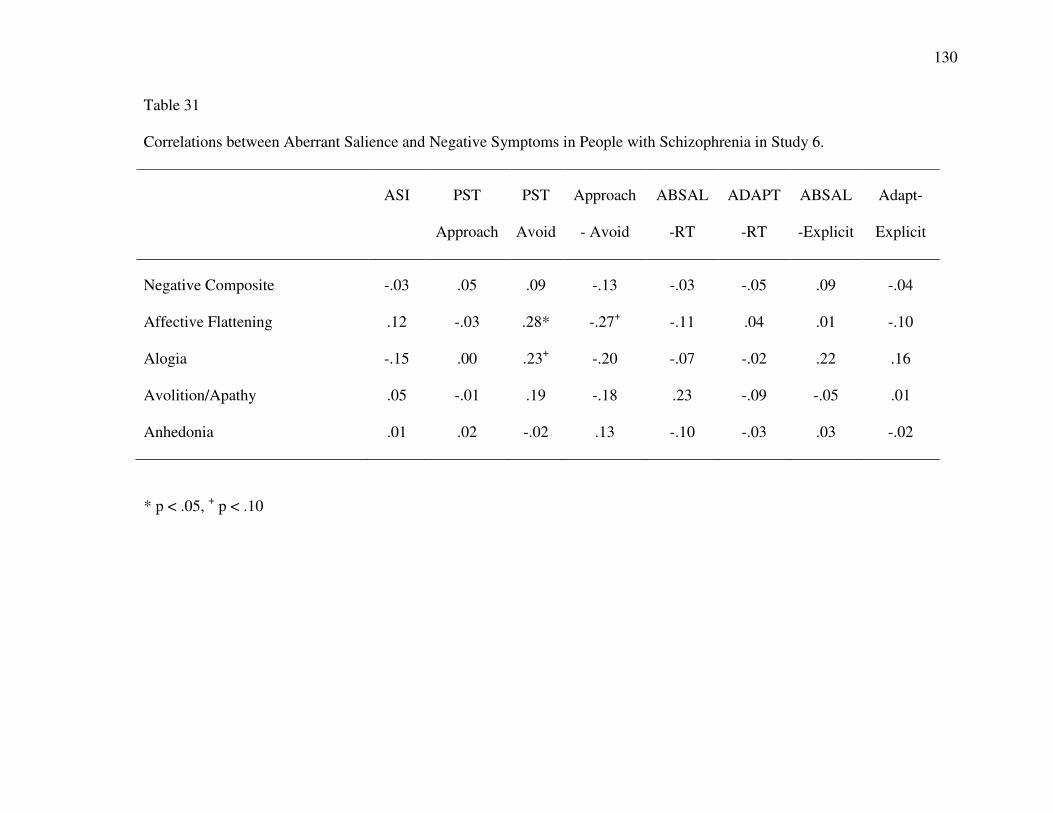
130
Table 31
Correlations between Aberrant Salience and Negative Symptoms in People with Schizophrenia in Study 6.
ASI PST
Approach
PST
Avoid
Approach
- Avoid
ABSAL
-RT
ADAPT
-RT
ABSAL
-Explicit
Adapt-
Explicit
Negative Composite -.03 .05 .09 -.13 -.03 -.05 .09 -.04
Affective Flattening .12 -.03 .28* -.27+ -.11 .04 .01 -.10
Alogia -.15 .00 .23+ -.20 -.07 -.02 .22 .16
Avolition/Apathy .05 -.01 .19 -.18 .23 -.09 -.05 .01
Anhedonia .01 .02 -.02 .13 -.10 -.03 .03 -.02
* p < .05, + p < .10

131
Table 32
Correlations between Aberrant Salience and Global Impairment in People with Schizophrenia in Study 6.
ASI PST
Approach
PST
Avoid
Approach
- Avoid
ABSAL
-RT
Adapt-
RT
ABSAL-
Explicit
Adapt-
Explicit
Strauss-Carpenter
Hospitalization -.07 .19 -.10 .23 .11 .10 .09 .05
Social Functioning -.06 .12 .25+ -.11 .01 .02 .07 -.06
Employment .06 .05 -.17 .17 -.13 .01 .04 -.20
Symptom Severity -.09 .06 -.08 .12 -.14 .21 -.05 -.10
Global Assessment Scale -.21 .20 -.16 .29* -.13 .04 -.12 .07

132
Table 33
Correlations among Self-Relevant Information Processing Variables for People with
Schizophrenia in Study 6.
RSES SCCS MNMDT MNMDT
-RT
MNMDT-
Modified
MNMDT-
Confidence
SCCS .61***
MNMDT .15 .22
MNMDT-RT -.32* -.26+ -.21
MNMDT-Modified .03 -.04 .55* -.08
MNMDT-Confidence .47*** .16 .19 -.11 .41*
MNMDT-Confidence RT -.30* .18 -.09 .49*** .11 -.12

133
Table 34
Correlations among Self- Processing and Interview-Rated Positive Symptoms in People with Schizophrenia in Study 6
RSES SCCS MNMDT MNMD
T-RT
MNMDT-
Modified
MNMDT-
Confidence
MNMDT
-Conf-RT
Delusions/Hallucinations .01 -.22 -.35*** -.08 -.21 .02 -.19
Hallucinations -.07 -.25+ -.26+ -.11 -.15 -.04 -.27+
Global Rating of Delusions .08 -.09 -.36** -.02 -.26+ .01 -.02
Bizarre Behavior -.09 .17 -.12 -.01 .04 .29* -.09
Formal Thought Disorder .14 -.05 -.08 -.01 -.05 .10 .18
* p < .05, p < .10
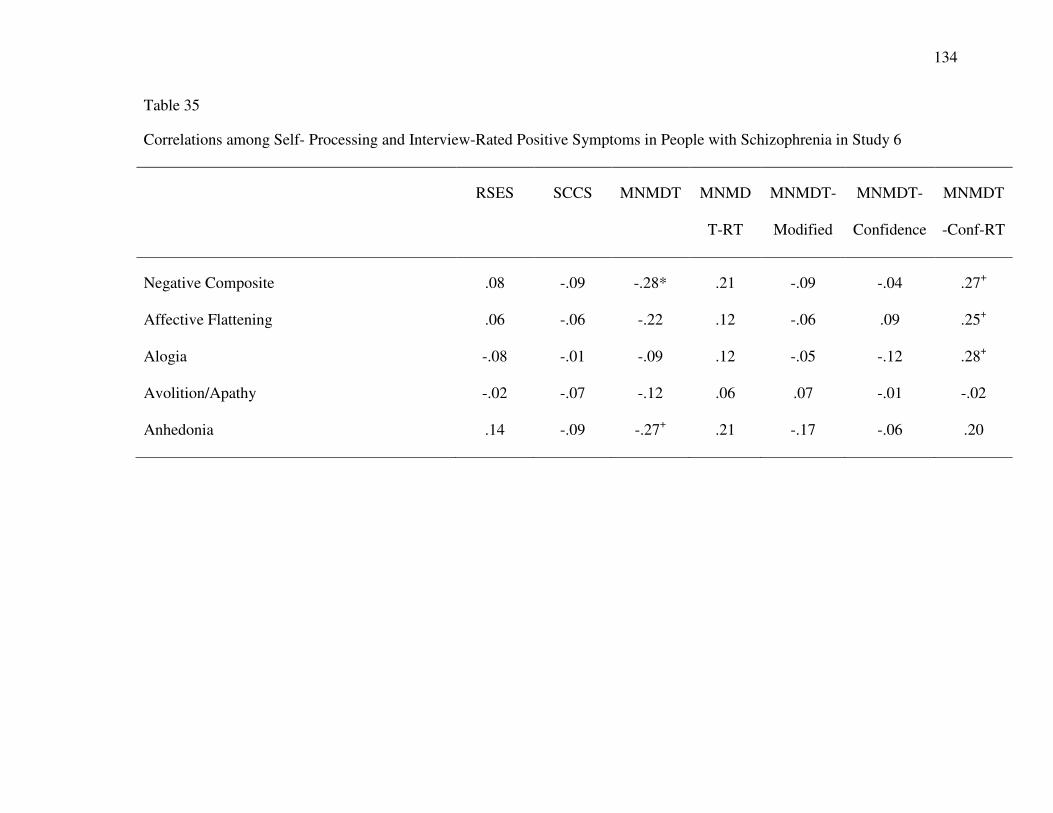
134
Table 35
Correlations among Self- Processing and Interview-Rated Positive Symptoms in People with Schizophrenia in Study 6
RSES SCCS MNMDT MNMD
T-RT
MNMDT-
Modified
MNMDT-
Confidence
MNMDT
-Conf-RT
Negative Composite .08 -.09 -.28* .21 -.09 -.04 .27+
Affective Flattening .06 -.06 -.22 .12 -.06 .09 .25+
Alogia -.08 -.01 -.09 .12 -.05 -.12 .28+
Avolition/Apathy -.02 -.07 -.12 .06 .07 -.01 -.02
Anhedonia .14 -.09 -.27+ .21 -.17 -.06 .20
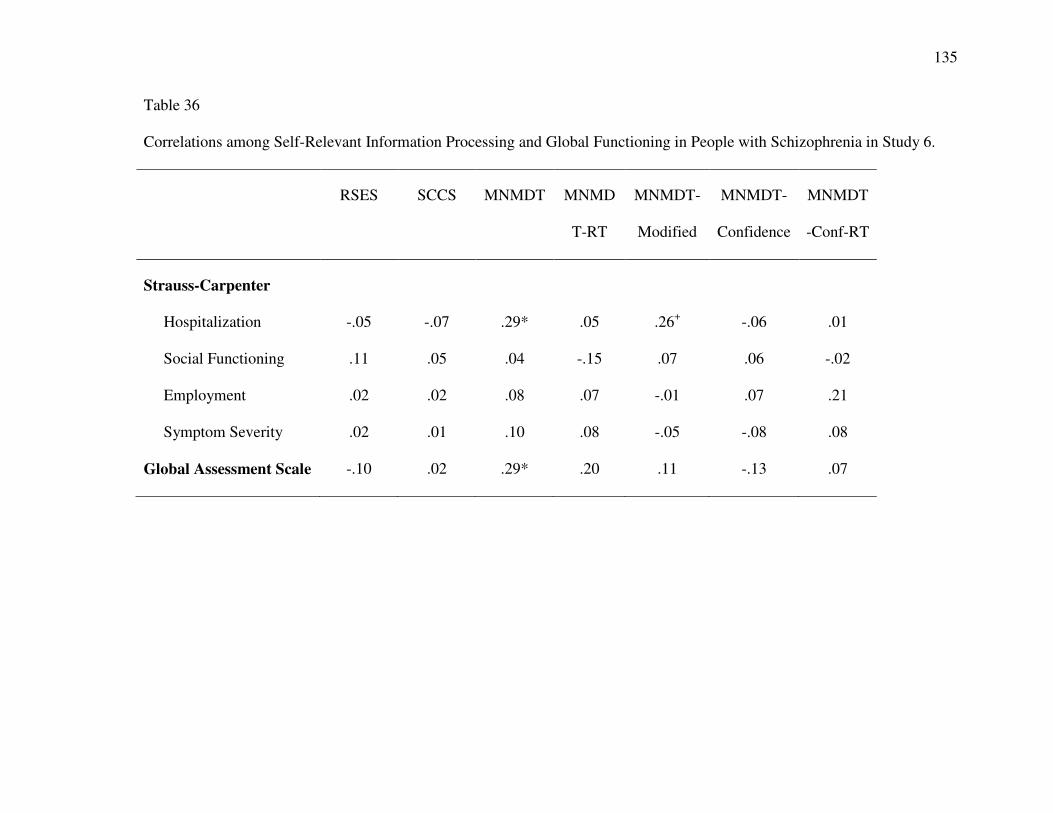
135
Table 36
Correlations among Self-Relevant Information Processing and Global Functioning in People with Schizophrenia in Study 6.
RSES SCCS MNMDT MNMD
T-RT
MNMDT-
Modified
MNMDT-
Confidence
MNMDT
-Conf-RT
Strauss-Carpenter
Hospitalization -.05 -.07 .29* .05 .26+ -.06 .01
Social Functioning .11 .05 .04 -.15 .07 .06 -.02
Employment .02 .02 .08 .07 -.01 .07 .21
Symptom Severity .02 .01 .10 .08 -.05 -.08 .08
Global Assessment Scale -.10 .02 .29* .20 .11 -.13 .07

136
Table 37
SAPS and BPRS Positive Symptoms as a Function of Self-Concept Clarity and Aberrant
Salience.
SAPS-
Delusions/
Hallucinations
SAPS-
Delusions
SAPS-
Hallucinations
BPRS-Unusual
Thought
Content
BPRS-
Hallucinations
Step 1 (∆R2) .12* .04 .04 .10+ .18**
ASI (β) .35* .20 .19 .39* .50**
SCC (β) -.02 .02 ..30 .06 .10
Step 2 (∆R2) .09* .09* .01 .07* .02
ASI X SCC (β) .37* .37* .01 .33* .16
** p < .01, * p < .05

137
Table 38
Comparison between Schizophrenia and Control Groups on Paranoia, Peters Delusion
Inventory, and Cardiff Anomalous Perceptions Scale
Schizophrenia
Mean (SD)
Control
Mean (SD)
Paranoia
SPQ-Suspiciousness 4.81 (2.15)* 1.79 (1.50)
Cardiff Anomalous Perceptions Scale
CAPS Total 11.25 (7.77)* 3.67 (5.30)
CAPS-Distress 33.13 (23.46)* 6.15 (9.64)
CAPS-Distract 33.62 (22.88)* 6.16 (9.64)
CAPS-Frequency 33.92 (23.90)* 5.39 (8.41)
Peters Delusions Inventory
PDI-Total 9.88 (4.09)* 5.30 (4.12)
PDI-Distress 26.63 (15.90)* 10.70 (11.71)
PDI-Preoccupation 28.79 (16.08)* 10.79 (9.91)
PDI-Conviction 34.98 (16.53)* 18.27 (14.97)
* p < .05

138
Figure 1: Magical Ideation/Perceptual Aberration as a Function of Aberrant Salience and
Self-Concept Clarity in Study 1.
-0.6
-0.4
-0.2
0.0
0.2
0.4
0.6
0.8
1.0
High SCC Low SCC
Sta
nd
ard
ized
PerM
ag
Sco
re
Low ASI
High ASI
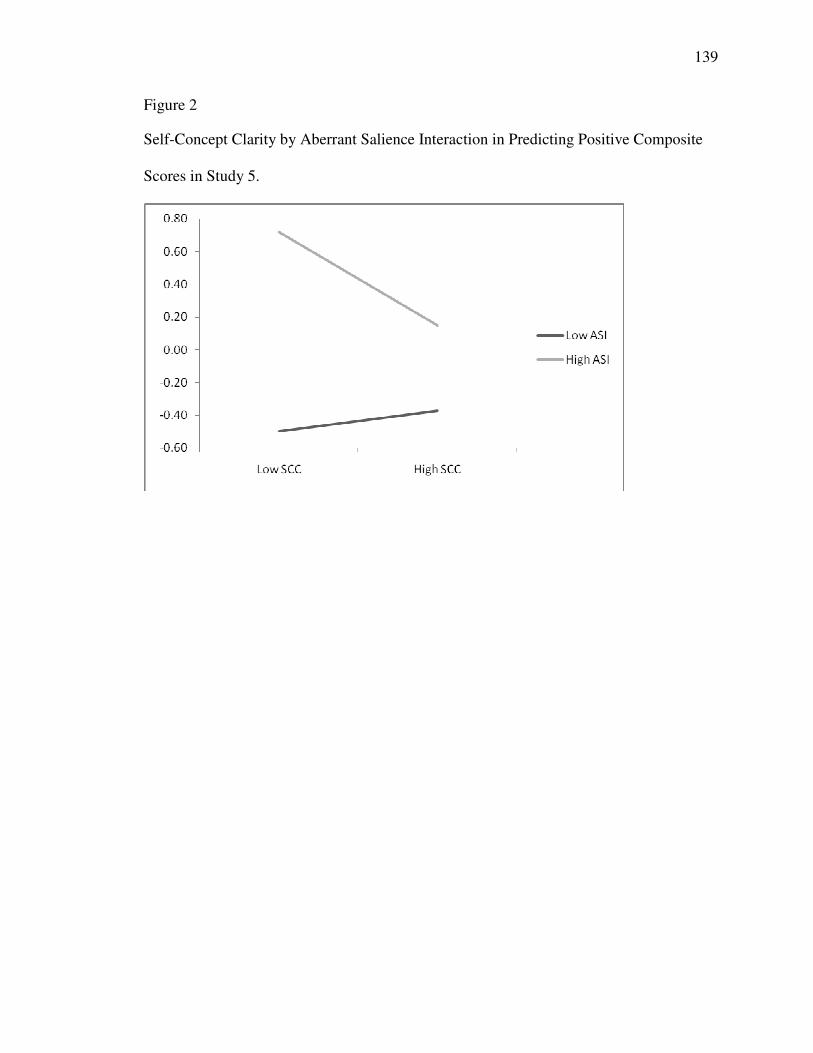
139
Figure 2
Self-Concept Clarity by Aberrant Salience Interaction in Predicting Positive Composite
Scores in Study 5.
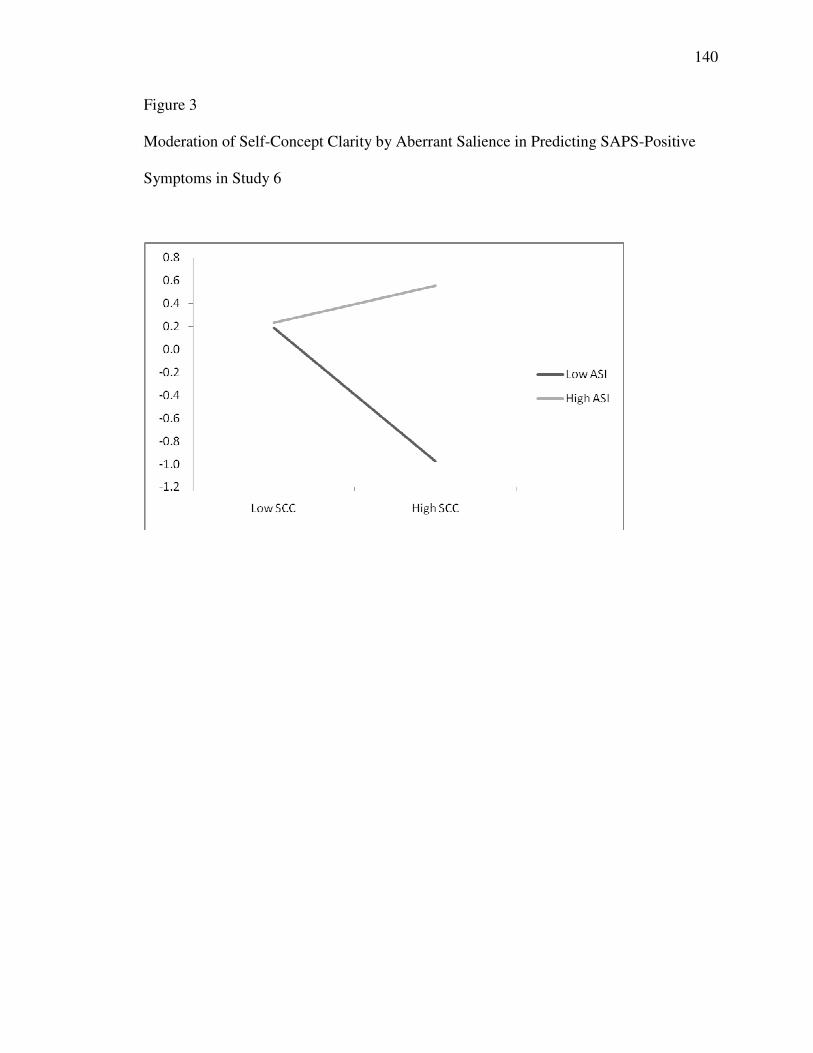
140
Figure 3
Moderation of Self-Concept Clarity by Aberrant Salience in Predicting SAPS-Positive
Symptoms in Study 6

141
Vita
David Cicero is a graduate student in the clinical psychology Ph.D. program at the
University of Missouri in Columbia where he resides with his wife and daughter. David
graduated from the University of Virginia with a BA in Psychology in 2003. Following a
year in Washington, DC, David moved to Columbia, Missouri in 2004. He obtained a
Master of Arts in 2007, and plans to finish a Ph.D. in 2012. He will do his clinical
predoctoral internship at the VA Maryland Health System/University of Maryland School
of Medicine beginning in June, 2011.

142
Appendix A

143
Table 1A
Frequencies of Ratings for all Participants in Study 5.
Total 0 1 2 3 4 5 6 7
Positive Ratings
Delusional Ideation 69 26 22 23 18 10 0 0
Paranoia 48 47 39 26 5 3 0 0
Grandiosity 99 22 29 6 2 9 1 0
Perceptual Anomalies 87 22 24 23 8 3 1 0
Disorganized Communication 90 36 24 12 5 0 0 0
Negative Ratings
Social Anhedonia 105 16 16 20 7 4 0 0
Avolition 102 36 21 8 1 0 0 0
Expression of Emotion 98 32 19 18 1 0 0 0
Experience of Emotions and
Self
117 21 13 10 6 1 0 0
Ideational Richness 140 13 10 3 1 0 0 0
Occupational Functioning 134 23 3 5 3 0 0 0
Disorganized Ratings
Odd Behavior 128 16 18 5 1 0 0 0
Bizarre Thinking 124 21 14 5 4 0 0 0
Impairment in Focus/Attention 68 54 41 3 2 0 0 0
Impaired Personal Hygiene 150 14 1 3 0 0 0 0

144
Table 2A
Frequencies of Ratings for Wisconsin Positive Participants in Study 5 (n = 61)
Total 0 1 2 3 4 5 6 7
Positive Ratings
Delusional Ideation 6 7 10 16 13 9 0 0
Paranoia 4 12 23 17 2 3 0 0
Grandiosity 20 9 17 6 2 6 1 0
Perceptual Anomalies 13 9 15 13 7 3 1 0
Disorganized Communication 21 16 12 7 4 0 0 0
Negative Ratings
Social Anhedonia 42 6 7 5 1 0 0 0
Avolition 28 17 12 3 1 0 0 0
Expression of Emotion 34 13 8 6 0 0 0 0
Experience of Emotions and
Self
36 14 3 5 2 1 0 0
Ideational Richness 47 7 5 1 0 0 0 0
Occupational Functioning 40 15 2 1 3 0 0 0
Disorganized Ratings
Odd Behavior 36 8 14 3 0 0 0 0
Bizarre Thinking 33 11 9 4 4 0 0 0
Impairment in Focus/Attention 13 23 21 2 2 0 0 0
Impaired Personal Hygiene 52 6 1 2 0 0 0 0

145

146
Table 3A
Frequencies of SIPS Ratings for Negative Participants in Study 5 (n = 64)
Total 0 1 2 3 4 5 6 7
Positive Ratings
Delusional Ideation 29 11 10 8 4 2 0 0
Paranoia 13 21 16 11 2 1 0 0
Grandiosity 42 8 11 0 0 3 0 0
Perceptual Anomalies 35 12 7 7 2 0 1 0
Disorganized Communication 31 15 10 5 2 0 0 0
Negative Ratings
Social Anhedonia 19 7 10 17 7 4 0 0
Avolition 33 18 8 5 0 0 0 0
Expression of Emotion 25 14 11 13 1 0 0 0
Experience of Emotions and
Self
34 10 9 6 5 0 0 0
Ideational Richness 53 3 5 2 0 0 0 0
Occupational Functioning 54 4 1 4 1 0 0 0
Disorganized Ratings
Odd Behavior 47 7 7 2 1 0 0 0
Bizarre Thinking 46 10 5 2 0 0 0 0
Impairment in Focus/Attention 26 19 18 1 0 0 0 0
Impaired Personal Hygiene 54 8 0 2 0 0 0 0

147
Table 4A
Frequencies of Ratings for all Control Participants in Study 5.
Total 0 1 2 3 4 5 6 7
Positive Ratings
Delusional Ideation 33 8 2 2 2 0 0 0
Paranoia 30 13 2 1 1 0 0 0
Grandiosity 36 7 4 0 0 0 0 0
Perceptual Anomalies 38 2 4 3 0 0 0 0
Disorganized Communication 37 6 4 0 0 0 0 0
Negative Ratings
Social Anhedonia 44 3 0 0 0 0 0 0
Avolition 40 4 2 1 0 0 0 0
Expression of Emotion 38 7 1 1 0 0 0 0
Experience of Emotions and
Self
45 1 1 0 0 0 0 0
Ideational Richness 43 3 1 0 0 0 0 0
Occupational Functioning 41 6 0 0 0 0 0 0
Disorganized Ratings
Odd Behavior 45 2 0 0 0 0 0 0
Bizarre Thinking 45 1 1 0 0 0 0 0
Impairment in Focus/Attention 31 12 4 0 0 0 0 0
Impaired Personal Hygiene 46 1 0 0 0 0 0 0

148
Levels of Aberrant Salience, Self-Concept Clarity and Wisconsin Groups.
Methodologists have suggested that it may be difficult to test an interaction with extreme
groups (Preacher, et al., 2005), especially when the groups were selected on a variable
(e.g., PerMag) that is related to the dependent variable (e.g., delusional ideation). As an
alternative analysis, I examined the proportion of participants in each Wisconsin group
who were high on aberrant salience, but low on self-concept clarity. First, I ranked
ordered the participants into quartiles based on their ASI scores and SCC scores. This
created four groups of participants for ASI scores and 4 groups of participants for SCC
scores. Then, I merged the groups together to form all possible 16 combinations of
quartile ranks (e.g., ASI 4th quartile/SCCS 1st quartile, ASI 4th quartile/SCCS 2nd quartile,
etc…). Next, I used a chi-square to test whether the proportion of participants in each of
the 16 groups differed by their Wisconsin Group membership. This chi-square value
indicated that there is a different distribution of participants by group than would be
expected by chance (χ2 (28) = 278.12, p < .001). Additionally, a Z-test with a Bonferroni
adjustment for multiple comparisons was used to compare the proportion of people in
each ASI/SCC group by Wisconsin group membership.
As can be seen in Figure 3 and Table A5, 39.3% of the positive group was in
highest quartile in aberrant salience and the lowest quartile in self-concept clarity, and an
additional 24.3% were in the highest quartile in aberrant salience and the second highest
quartile in self-concept clarity. There was a significantly higher proportion of participants
in the positive group in the highest quartile ASI/Lowest Quartile SCC group compared to
both negative and control groups. Additionally, this proportion was higher for the
positive group in the 75-100 quartile ASI/50-75 SCC group compared to the negative and

149
control groups. Participants in the negative group tended to be in the lowest quartile of
self-concept clarity, but this was spread across the range of the aberrant salience
quartiles. The negative group had a higher proportion it the lowest SCC quartile
compared to the control group for 3 of the 4 ASI quartile groups. Finally, the highest
percentage of participants in the control group was in the lowest aberrant salience quartile
and the highest self-concept clarity quartile (18.6%), and this was significantly higher
than both the positive and negative groups. This suggests that positive participants do
seem to be the participants with extreme levels of aberrant salience and self-concept
clarity, which provides further support for the interaction between aberrant salience and
self-concept clarity in predicting psychotic-like experiences.

150
Table A5
Quartile Rankings based on ASI and SCCS in Study 5
Control
(n = 441)
Positive
(n = 74)
Negative
(n = 80)
Total
(n = 595)
ASI 0-25%
SCC 0-25% 1.8%a 0.0%a 10.0%b 2.7%
SCC 26-50% 6.3%a 0.0%a 1.3%a 4.9%
SCC 51-75% 9.3%a 0.0%b 7.5%a 6.7%
SCC 76-100% 18.6%a 0.0%b 3.8%b 14.3%
SCC 0-25% 5.0%a 2.7%a 8.8%a 5.2%
SCC 26-50% 7.9%a 0.0%b 8.8%a 7.1%
ASI 26-50% SCC 51-75% 10.0%a 0.0%b 6.3%ab 8.2%
SCC 76-100% 10.4%a 0.0%b 1.3%b 7.9%
SCC 0-25% 3.4%a 6.8%ab 13.8%b 5.2%
SCC 26-50% 4.8%a 4.1%a 8.8%a 5.2%
ASI 51-75% SCC 51-75% 7.5%a 2.7%a 2.5%a 8.2%
SCC 76-100% 6.1%a 5.4%a 5.0%a 5.9%
SCC 0-25% 2.3%a 39.2%b 13.8%c 8.4%
SCC 26-50% 3.6%a 24.3%b 7.5%a 6.7%
ASI 76-100% SCC 51-75% 2.9%a 14.9%b 1.3%a 4.2%
SCC 76-100% 0.0%a 0.0%a 0.0%a 0.0%
Total 100% 100% 100% 100%

151
Correlations among Aberrant Salience and Schizotypy Measures. As can be
seen in A6, Magical Ideation was positively correlated with ASI scores, modified ASI
scores, and ASI Frequency scores. There was a trend for a significant relationship
between magical ideation and Implicit Aberrant Salience. Magical Ideation was
negatively correlated with tendency to avoid punished variables on the PST. Similarly,
perceptual aberration was positive correlated with all 3 ASI variables and negatively
correlated with avoiding punished variables on the PST. Social Anhedonia was
positively correlated the ASI, but was negatively correlated with both choosing rewards
and avoiding punishments. PDI total and subscale scores were positively correlated with
all three ASI variables. Additionally, there was a positive correlation between PDI
distress and preoccupation scores with implicit aberrant salience, and a trend for a
correlation between implicit aberrant salience and PDI total scores. The CAPS-Total
Score and all subscales were positively correlated with all three ASI measures. The
SPQ-Suspiciousness subscale was correlated with all three ASI measures and there was
a trend for a positive correlation between SPQ-S scores and implicit aberrant salience.
Correlations among Aberrant Salience and Interview-Rated Psychotic-Like
Experiences. As can be seen in Table X, SIPS-Rated Delusional Ideation and Paranoia
were both correlated with all three ASI measured. SIPS-Rated Grandiosity was
correlated with all three ASI measures and with implicit aberrant salience on the SAT,
and SIPS-Rated Perceptual Anomalies was positively correlated with the three ASI
measures. SIPS-Rated Disorganized communication was also correlated with all three
ASI measures, albeit less strongly than were Delusional Ideation, Paranoia, Grandiosity,
and Perceptual Anomalies.

152
Correlations among Aberrant Salience and Interview-Rated Negative
Symptoms. Social Anhedonia was uncorrelated with all measures of aberrant salience,
but there was a trend for a negative correlation with avoidance learning as measured
with the PST. Avolition was positively correlated with Study 1 ASI scores. There was a
trend for impairment in the expression of emotion to be negative correlated with reward
learning on the PST, while experiences of emotion and the self was correlated with
aberrant salience in the last 2 weeks and the frequency of these experiences. Impairment
in occupational functioning was negatively correlated with a preference for reward over
avoidance learning.
Correlations among Aberrant Salience and Interview-Rated Disorganized
Symptoms. As can be seen in Table A6, Odd behavior, bizarre thinking, and
impairment in focus and attention all were positively correlated with the three ASI
measures. In addition, there was a trend for a positive correlation between odd behavior
and explicit aberrant salience was measured with the SAT.
Correlations among Aberrant Salience and Interview Rated Perceptual
Anomalies. As can be seen in A6, all three SIAPA subscales were positively correlated
with all three ASI scales.
Correlations among Aberrant Salience and Self-Processing Variables. As can
be seen in Table A7, the Rosenberg Self-Esteem Scale was negatively correlated with
the ASI in Study 1. The SCCS administered in both Study 1 and Study 4 was negatively
correlated with all three ASI measures, and the Study 1 administration was positively
correlated with avoidance learning. The MNMDT score from study 1 was weakly
negatively correlated with ASI scores, and there was a trend for this score to be

153
correlated with explicit aberrant salience. There was a trend for a correlation between
MNMDT reaction times and implicit aberrant salience. The Modified MNMDT in Study
4 was negatively correlated with all three ASI measures.
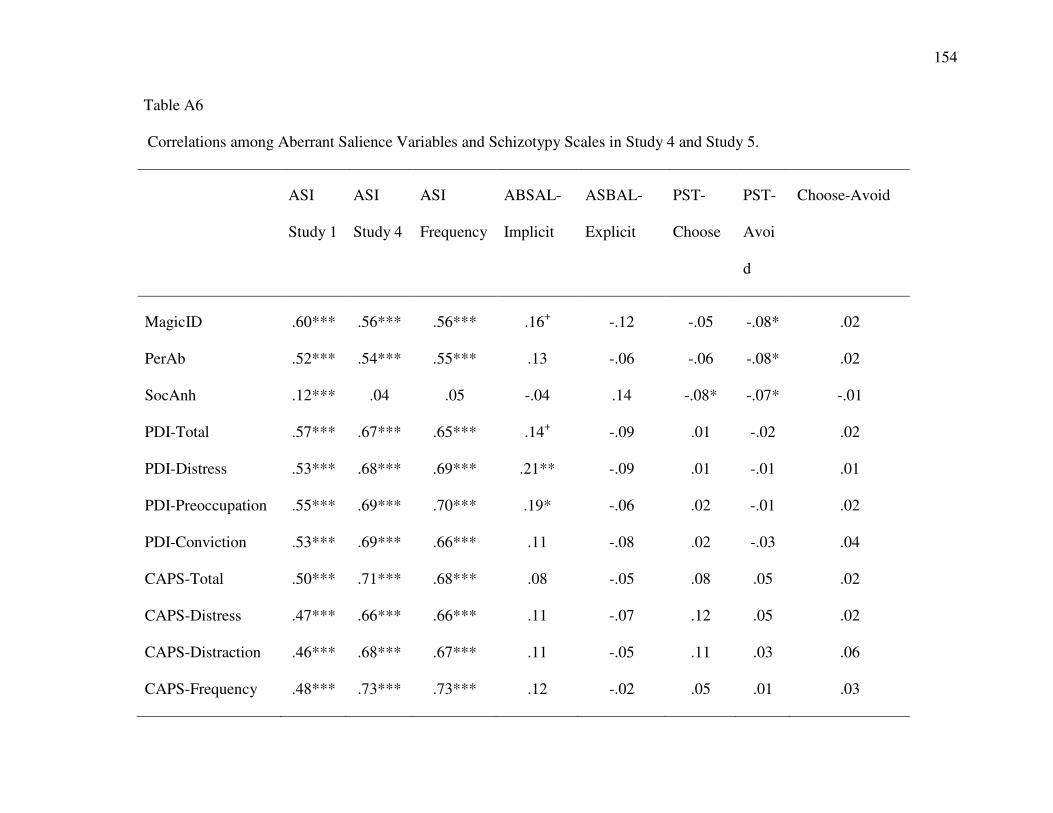
154
Table A6 Correlations among Aberrant Salience Variables and Schizotypy Scales in Study 4 and Study 5.
ASI
Study 1
ASI
Study 4
ASI
Frequency
ABSAL-
Implicit
ASBAL-
Explicit
PST-
Choose
PST-
Avoi
d
Choose-Avoid
MagicID .60*** .56*** .56*** .16+ -.12 -.05 -.08* .02
PerAb .52*** .54*** .55*** .13 -.06 -.06 -.08* .02
SocAnh .12*** .04 .05 -.04 .14 -.08* -.07* -.01
PDI-Total .57*** .67*** .65*** .14+ -.09 .01 -.02 .02
PDI-Distress .53*** .68*** .69*** .21** -.09 .01 -.01 .01
PDI-Preoccupation .55*** .69*** .70*** .19* -.06 .02 -.01 .02
PDI-Conviction .53*** .69*** .66*** .11 -.08 .02 -.03 .04
CAPS-Total .50*** .71*** .68*** .08 -.05 .08 .05 .02
CAPS-Distress .47*** .66*** .66*** .11 -.07 .12 .05 .02
CAPS-Distraction .46*** .68*** .67*** .11 -.05 .11 .03 .06
CAPS-Frequency .48*** .73*** .73*** .12 -.02 .05 .01 .03
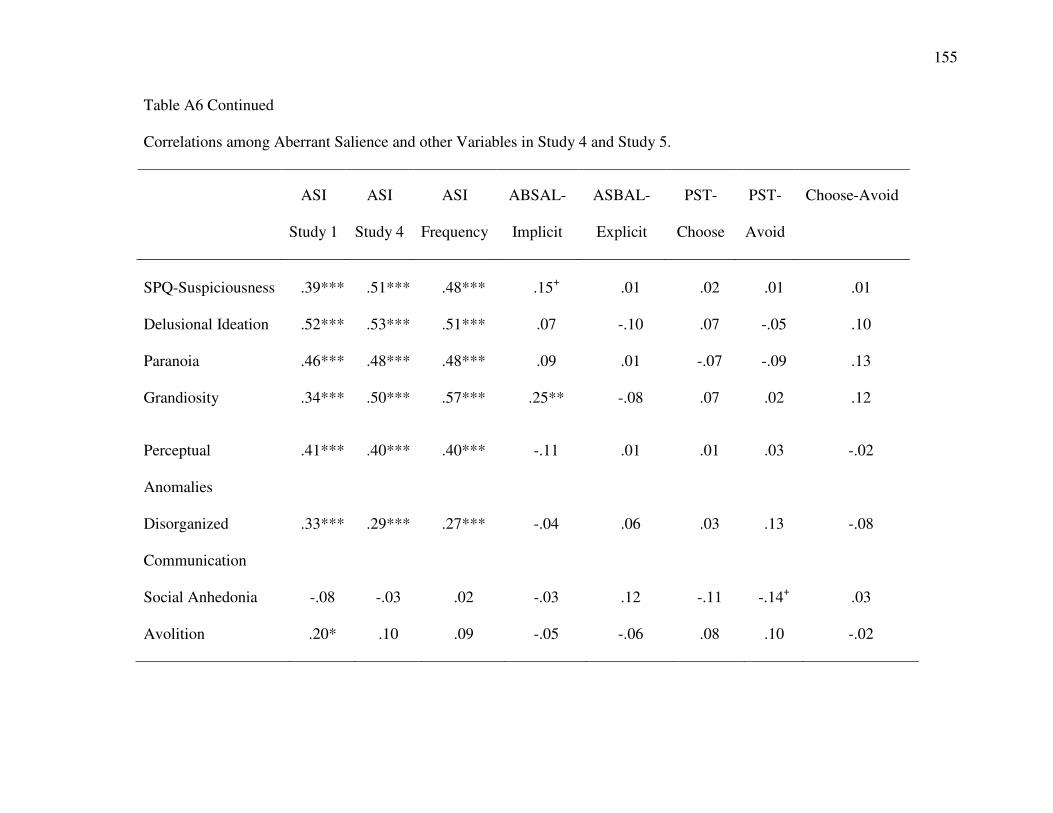
155
Table A6 Continued Correlations among Aberrant Salience and other Variables in Study 4 and Study 5.
ASI
Study 1
ASI
Study 4
ASI
Frequency
ABSAL-
Implicit
ASBAL-
Explicit
PST-
Choose
PST-
Avoid
Choose-Avoid
SPQ-Suspiciousness .39*** .51*** .48*** .15+ .01 .02 .01 .01
Delusional Ideation .52*** .53*** .51*** .07 -.10 .07 -.05 .10
Paranoia .46*** .48*** .48*** .09 .01 -.07 -.09 .13
Grandiosity .34*** .50*** .57*** .25** -.08 .07 .02 .12
Perceptual
Anomalies
.41*** .40*** .40*** -.11 .01 .01 .03 -.02
Disorganized
Communication
.33*** .29*** .27*** -.04 .06 .03 .13 -.08
Social Anhedonia -.08 -.03 .02 -.03 .12 -.11 -.14+ .03
Avolition .20* .10 .09 -.05 -.06 .08 .10 -.02

156
Table A6 continued Correlations among Aberrant Salience and other Variables in Study 4 and Study 5.
ASI
Study 1
ASI
Study 4
ASI
Frequency
ABSAL-
Implicit
ASBAL-
Explicit
PST-
Choose
PST-
Avoid
Choose-Avoid
Expression of
Emotion
.07 .04 .09 .16+ -.05 -.14+ -.04 -.02
Experience of
emotion/self
.08 .17* .22** -.05 .11 .04 -.01 .03
Ideational Richness .03 .01 .03 .03 .05 -.11 .05 -.13
Occupational
Functioning
.12 .04 .10 .02 -.03 -.10 .13 -.18*
Odd Behavior .21** .23** .25** .06 .14+ .08 .01 -.06
Bizarre Thinking .32*** .34*** .34*** -.06 .07 -.02 -.01 .03
Focus/Attention .33*** .31*** .32*** -.02 .06 .04 .07 -.03
Personal Hygiene .13 .10 .15+ -.02 .11 -.04 .05 -.07

157
A6 Continued Correlations among Aberrant Salience and other Variables in Study 4 and Study 5.
ASI
Study 1
ASI
Study 4
ASI
Frequency
ABSAL-
Implicit
ASBAL-
Explicit
PST-
Choose
PST-
Avoid
Choose-Avoid
Intensity .41*** .63*** .59*** .06 .02 .04 -.03 .06
Flooding .36*** .59*** .56*** -.01 .07 .02 .05 -.03
Focus .34*** .40*** .39*** .07 -.06 -.01 -.04 .08

158
Table A7 Correlations among Aberrant Salience and Self-Relevant Information Processing Variables in Study 4 and Study 5
ASI
Study 1
ASI
Study 4
ASI
Frequency
ABSAL-
Implicit
ASBAL-
Explicit
PST-
Choose
PST-
Avoid
Choose-Avoid
Rosenberg SES (study 1) -.15*** -.08 -.11 -.11 -.03 .02 .04 -.02
Rosenberg SES (Study 4) -.13 -.08 -.05 -.10 -.05 .10 .02 .07
SCCS (Study 1) -.36*** -.24** -.30** -.10 -.01 .01 .07* -.05
SCCS (study 4) -.36*** -.30*** -.33*** -.11 .01 .03 .03 -.01
MNMDT Score (Study 1) -.09** .04 .01 -.02 .15+ .03 .05 -.02
MNMDT RT .01 -.01 .01 .15+ -.01 -.01 -.04 .03
MNMDT Score (Study 1) -.22** -.14+ -.16* -.12 .01 .04 .03 .02
SCC Confidence .06 .03 .03 -.12 .01 -.01 -.01 .01

159
Table A8
Correlations between Positive, Negative, and Disorganized Interview Ratings and
Aberrant Salience Variables.
Positive Negative Disorganized
Aberrant Salience Inventory .53*** .09 .35***
Modified ASI Last 2 Weeks .58*** .08 .35***
ASI Frequency .59*** .14+ .37***
Frank Task Avoid -.03 -.03 .03
Frank Task Choose .01 -.10 .04
Frank Task Choose minus Avoid .04 -.07 .01
SAT-Reward Explicit -.05 -.13 .02
SAT Non-Reward Explicit -.03 -.09 -.05
Adaptive Salience Explicit -.02 -.04 .04
Aberrant Salience Explicit -.04 .05 .13
SAT-Reward RT -.05 -.02 -.02
SAT-Non Reward RT .01 -.02 .01
SAT-Adaptive Salience RT -.13 .06 -.03
SAT-Aberrant Salience RT .07 .02 -.01

160
Table A9
Correlations between Positive, Negative, and Disorganized Interview Ratings and Self-
Processing Variables.
Positive Negative Disorganized
Rosenberg Self-Esteem Scale Time 1 -.17* -.27* -.19*
Rosenberg Self-Esteem Scale Time 2 -.19* -.25** -.20*
Self-Concept Clarity Scale (Study 1) -.33*** -.35*** -.30***
SCCS Study 2 -.39*** -.35*** -.32***
Me Not-me Decision Task .03 -.06 -.03
Me Not-me Decision Task (RT) .10 .23* .16*
Me Not-me Decision Task (SD) -.08 .04 .01
MNMDT Study 2 -.18* -.17* -.23*
SCC Confidence -.09 .21** -.22**

161
Table A10
Correlations between Positive, Negative, and Disorganized Interview Ratings and Self-
Processing Variables.
Positive Negative Disorganized
Peters Delusions Inventory
PDI-Total .59*** .19* .35***
PDI-Distress .62*** .25** .39***
PDI-Preoccupation .60*** .16* .34***
PDI-Conviction .59*** .15+ .33***
Cardiff Anomalous Perceptions Scale
CAPS-Total .70*** .12 .44***
CAPS-Distress .71*** .20* .44***
CAPS-Distraction .69*** .16+ .44***
CAPS-Frequency .69*** .13 .44***
Paranoia
SPQ-Suspiciousness .40*** .18* .17*
Wisconsin Schizotypy Scales
Magical Ideation .60*** .13+ .37***
Perceptual Aberration .59*** .11 .45***
Social Anhedonia .02 .48*** .05

162
Table A11
Correlations among Self-Processing and Aberrant Salience Variables in Study 4.
SCCS
Study 1
SCCS
Study 2
MNMDT
Study 1
MNMDT-
RT
MNMDT
Study 2
SCCS
Confidence
RSES
Study 1
RSES
Study 2
ASI Study 1 -.36*** -.36*** -.09* .01 -.22** .06 -.15*** -.13
Frank Choose .04 -.03 .01 -.01 -.01 -.10 .03 .03
Frank-Avoid .06 -.01 .01 -.02 .01 -.07 .03 .03
Frank Score -.05 -.07 -.01 .01 -.03 -.08 -.01 -.01
ASI Study 2 -.24** -.30*** .04 -.01 -.14+ .03 -.08 -.08
ASI-Frequency -.30*** -.33*** .01 .01 -.16* .03 -.11 -.05
Implicit Adaptive .06 .06 -.09 .10 .02 .06 .10 .09
Implicit ABSAL -.10 -.11 -.02 .15+ -.12 -.12 -.11 -.10
Explicit Adaptive -.01 .02 .01 .02 -.02 .05 -.02 -.03
Explicit Aberrant -.01 .01 .15+ -.01 .01 .01 -.03 -.05

163
Table A12
Correlations among Self-Processing and Schizotypy Scales in Study 4.
SCCS
Study 1
SCCS
Study 2
MNMDT
Study 1
MNMDT-
RT
MNMDT
Study 2
SCCS
Confidence
RSES
Study 1
RSES
Study 2
MagicID -.31*** -.37*** -.14*** -.06+ -.35*** .02 -.18*** -.20*
PerAb -.36*** -.37*** -.16*** .02 -.31*** -.07 -.24*** -.19*
SocAnh -.32*** -.26** -.20*** .07* -.08 -.12 -.27*** -.17*
PDI-Total -.34*** -.38*** -.05 .04 -.14+ -.02 -.19*** -.13
PDI-Distress -.40*** -.42*** -.11** .03 -.15+ -.03 -.26*** -.17*
PDI-Preoccupation -.34*** -.39*** -.05 .01 -.11 .04 -.17*** -.12
PDI-Conviction -.27*** -.33*** -.02 -.01 -.08 .09 -.12*** -.09
CAPS-Total -.23** -.37*** .06 .07 -.14+ -.06 -.11 -.15+
CAPS-Distress -.26** -.38*** .06 .11 -.12 -.08 -.11 -.14+
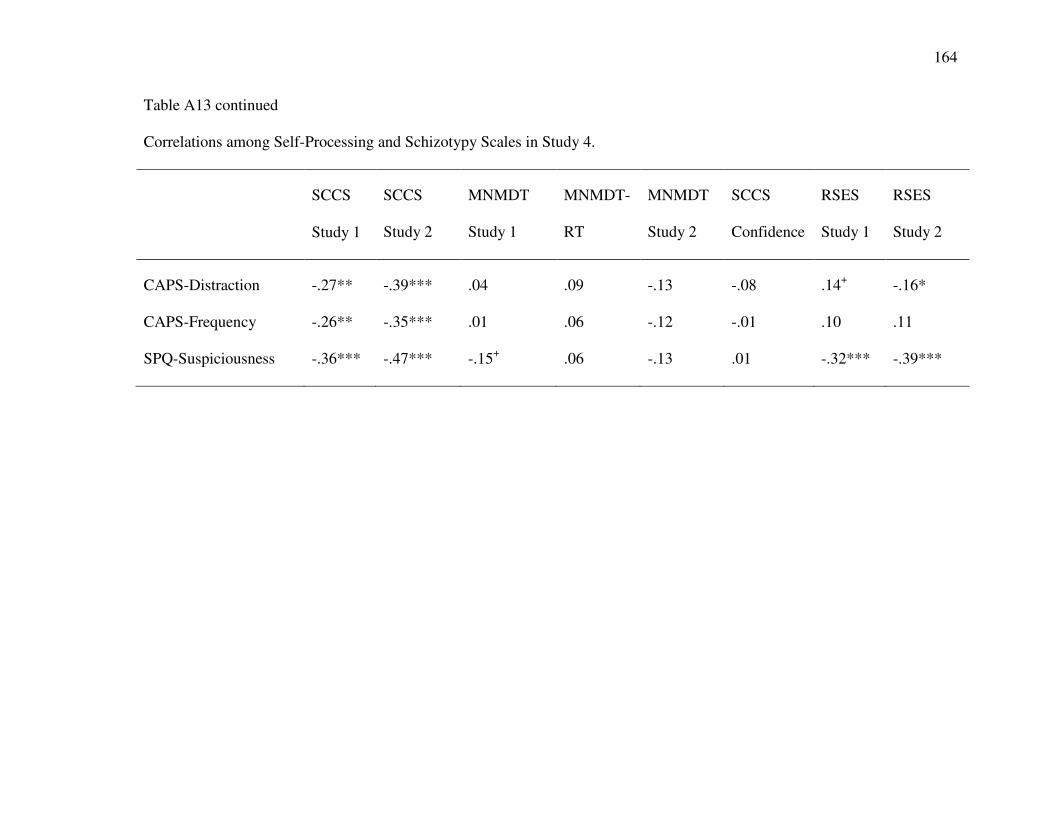
164
Table A13 continued
Correlations among Self-Processing and Schizotypy Scales in Study 4.
SCCS
Study 1
SCCS
Study 2
MNMDT
Study 1
MNMDT-
RT
MNMDT
Study 2
SCCS
Confidence
RSES
Study 1
RSES
Study 2
CAPS-Distraction -.27** -.39*** .04 .09 -.13 -.08 .14+ -.16*
CAPS-Frequency -.26** -.35*** .01 .06 -.12 -.01 .10 .11
SPQ-Suspiciousness -.36*** -.47*** -.15+ .06 -.13 .01 -.32*** -.39***
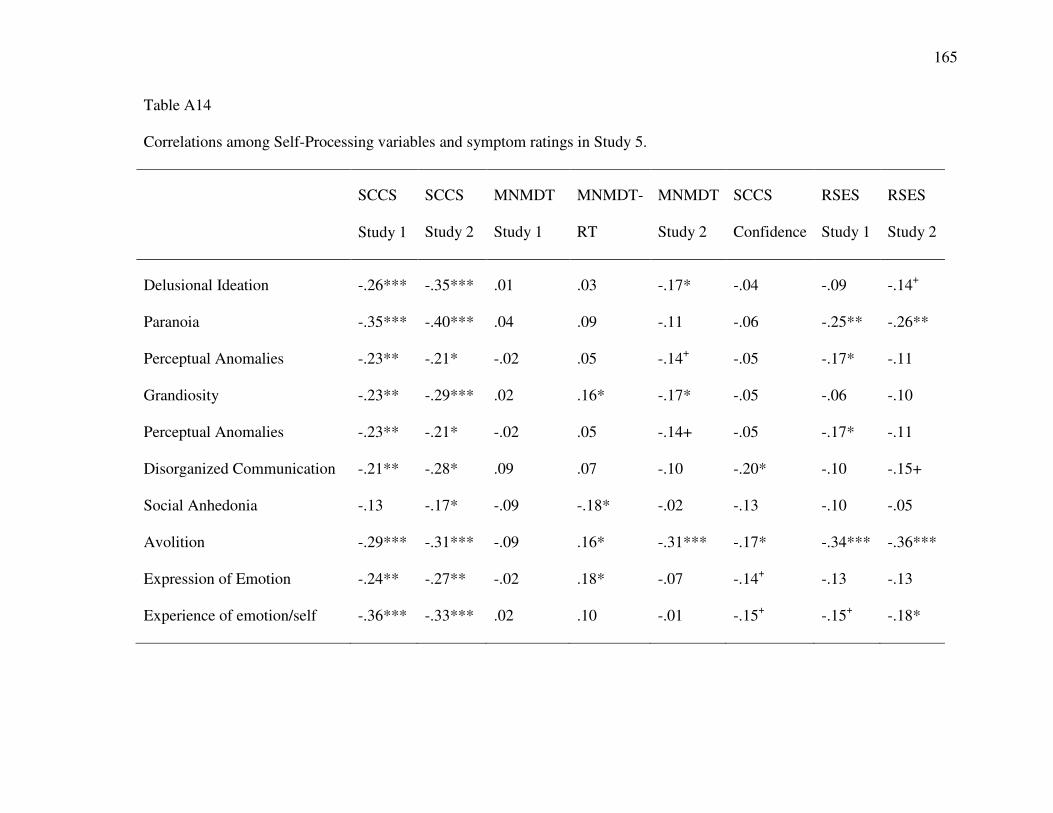
165
Table A14
Correlations among Self-Processing variables and symptom ratings in Study 5.
SCCS
Study 1
SCCS
Study 2
MNMDT
Study 1
MNMDT-
RT
MNMDT
Study 2
SCCS
Confidence
RSES
Study 1
RSES
Study 2
Delusional Ideation -.26*** -.35*** .01 .03 -.17* -.04 -.09 -.14+
Paranoia -.35*** -.40*** .04 .09 -.11 -.06 -.25** -.26**
Perceptual Anomalies -.23** -.21* -.02 .05 -.14+ -.05 -.17* -.11
Grandiosity -.23** -.29*** .02 .16* -.17* -.05 -.06 -.10
Perceptual Anomalies -.23** -.21* -.02 .05 -.14+ -.05 -.17* -.11
Disorganized Communication -.21** -.28* .09 .07 -.10 -.20* -.10 -.15+
Social Anhedonia -.13 -.17* -.09 -.18* -.02 -.13 -.10 -.05
Avolition -.29*** -.31*** -.09 .16* -.31*** -.17* -.34*** -.36***
Expression of Emotion -.24** -.27** -.02 .18* -.07 -.14+ -.13 -.13
Experience of emotion/self -.36*** -.33*** .02 .10 -.01 -.15+ -.15+ -.18*

166
Table A14 Continued
Correlations among Self-Processing variables and symptom ratings in Study 5
SCCS
Study 1
SCCS
Study 2
MNMDT
Study 1
MNMDT-
RT
MNMDT
Study 2
SCCS
Confidence
RSES
Study 1
RSES
Study 2
Ideational Richness -.12 -.01 .04 .20* -.07 -.08 -.11 -.05
Occupational Functioning -.22** -.25** -.03 .08 -.28** -.15+ -.29*** -.27**
Odd Behavior -.17* -.21** -.01 .06 -.12 -.19* -.07 -.11
Bizarre Thinking -.21** -.23** -.01 .15+ -.15+ -.17* -.08 -.09
Focus/Attention -.37*** -.40*** -.02 .12 -.24** -.15+ -.29*** -.32***
Personal Hygiene -.09 -.07 -.06 .18* .15+ -.14+ -.12 -.03
Intensity -.25** -.25** .09 .06 -.04 .01 -.05 -.02
Flooding -.28*** -.31*** .13 .16* -.03 -.04 -.07 -.06
Focus -.25*** -.32*** .11 .09 -.07 -.01 -.06 -.10
Positive -.33*** -.39*** .03 .10 -.18* -.09 -.17* -.19*
Negative -.35*** -.35*** -.06 .23** -.17* -.21* -.27** -.25**
Disorganized -.30** -.32*** -.03 -.03 .19* .03 -.17*** -.17*

167
Table A15
Group comparisons for Aberrant Salience Variables based on SIPS Ratings.
Positive Group
Mean (SD)
Negative Group
Mean (SD)
Control Group
Mean (SD)
Aberrant Salience Inventory 21.90 (5.65)a 14.58 (5.19)b 15.98 (5.93)b
Last 2 weeks ASI 8.65 (6.83)a 2.54 (3.44)b 3.25 (3.98)b
ASI Frequency 32.84 (30.33)a 13.26 (2.60)b 9.43 (12.53)b
Frank Task Avoid 45.38 (10.89)a 40.72 (14.83)a 49.67 (14.24)b
Frank Task Choose 42.38 (10.58)ab 37.82 (14.04)a 45.38 (13.12)b
Frank Task Choose minus Avoid -3.00 (4.13)a -3.00 (3.57)ab -4.29 (4.10)b
SAT-Reward Explicit 71.82 (23.97)a 69.20 (23.80)a 74.38 (22.24)a
SAT Non-Reward Explicit 19.02 (16.41)a 14.94 (15.92)a 20.23 (18.94)a
Adaptive Salience Explicit 52.80 (31.90)a 54.26 (33.04)a 54.15 (33.15)a
Aberrant Salience Explicit 8.59 (9.01)a 11.06 (12.55)a 8.49 (9.78)a
SAT-Reward RT 221.63 (59.36)a 227.97 (84.26)a 232.90 (61.88)a
SAT-Non Reward RT 240.08 (75.46)a 241.60 (64.00)a 243.31 (68.75)a
SAT-Adaptive Salience RT 17.47 (49.23)a 5.73 (25.35)a 11.05 (27.50)a
SAT-Aberrant Salience RT 17.20 (29.31)a 12.75 (12.50)a 12.45 (11.03)a

168
Table A16
Group comparisons for Schizotypy Scales based on SIPS Ratings
Positive Group
Mean (SD)
Negative Group
Mean (SD)
Control Group
Mean (SD)
Wisconsin Schizotypy Scales
Magical Ideation 1.45 (1.24)a -0.24 (.81)b 0.07 (1.21)b
Perceptual Aberration 1.65 (1.71)a -0.16 (0.71)b 0.04 (1.13)b
PerMag 3.10 (2.66)a -0.40 (2.66)b 0.11 (2.19)b
Social Anhedonia 1.21 (1.48)a 3.25 (1.42)b 0.56 (1.58)c
Peters Delusion Inventory
PDI-Total 10.18 (4.27)a 5.20 (2.44)b 6.10 (3.44)b
PDI-Distress 30.35 (16.08)a 14.88 (8.78)b 15.21 (11.73)b
PDI-Preoccupation 31.66 (16.52)a 14.20 (7.63)b 12.56 (1.49)b
PDI-Conviction 35.82 (17.66)a 16.68 (8.40)b 19.93 (12.22)b
Cardiff Anomalous Perceptions Scale
CAPS-Total 10.32 (7.00)a 2.38 (3.21)b 3.01 (3.09)b
CAPS-Distress 26.30 (22.84)a 6.46 (9.47)b 6.49 (7.32)b
CAPS-Distraction 29.05 (24.97)a 6.38 (9.24)b 7.59 (8.87)b
CAPS-Frequency 266.16 (23.63)a 5.38 (8.13)b 5.97 (6.93)b
Paranoia
SPQ-Suspiciousness 4.13 (2.31)a 3.42 (2.51)a 2.36 (2.24)b

169
Table A17
Group comparisons for Self-Processing based on SIPS Ratings.
Positive Group
Mean (SD)
Negative Group
Mean (SD)
Control Group
Mean (SD)
Rosenberg Self-Esteem Scale 29.25 (5.68)a 29.77 (6.14)b 31.86 (4.82)a
Self-Concept Clarity Scale 30.70 (9.42)a 32.92 (10.01)a 38.55 (9.33)
Me Not-me Decision Task 19.29 (2.94)a 19.46 (2.96)a 19.83 (3.08)a
Me Not-me Decision Task (RT) 1523.91 (463.90)a 1621.53 (411.55)a 1456.87 (525.41)a
Me Not-me Decision Task (SD) 793.50 (373.59)a 786.95 (334.00)a 998.00 (525.41)a
MNMDT Study 2 18.44 (3.23)a 19.39 (2.42)ab 19.96 (3.01)b
SCC Confidence 5.11 (0.66)a 5.12 (0.68)a 5.26 (0.69)a
SCCS Study 2 32.06 (9.94)a 36.50 (10.30)b 41.36 (9.94)c
Rosenberg Self-Esteem Scale
(Study 2)
29.92 (5.92)a 30.31 (6.03)a 32.97 (5.04)c

170
Appendix B

171
Table B1
Correlations among Aberrant Salience Variables and BPRS ratings in Study 6.
ASI Frank
Choose
Frank
Avoid
Choose
-Avoid
ABSAL
-RT
ADAPT
-RT
ABSAL
-Explicit
Adapt-
Explicit
Somatic Concern -.03 -.08 .09 -.13 .20 -.09 .08 .26+
Anxiety .09 -.14 .22 -.29* -.12 -.04 -.08 -.12
Depression .02 -.09 .04 -.09 .07 .25+ -.01 -.13
Suicidality .05 -.03 -.12 .09 .39** -.40** .15 .01
Guilt .04 -.05 -.12 .08 .25+ .26+ .15 .15
Hostility .22 .12 .12 -.02 .02 .11 .16 -.09
Elevated Mood .10 .13 .08 -.01 .10 -.14 .09 -.23
Grandiosity .26+ -.08 .09 -.13 .04 -.06 .17 -.11
Suspiciousness .04 .06 .12 -.05 -.16 -.20 -.08 .12
Hallucinations .40** -.05 -.07 .03 .05 -.24+ -.01 -.17
Unusual Thought
Content
.31* -.09 .10 -.15 .12 -.09 .09 -.05
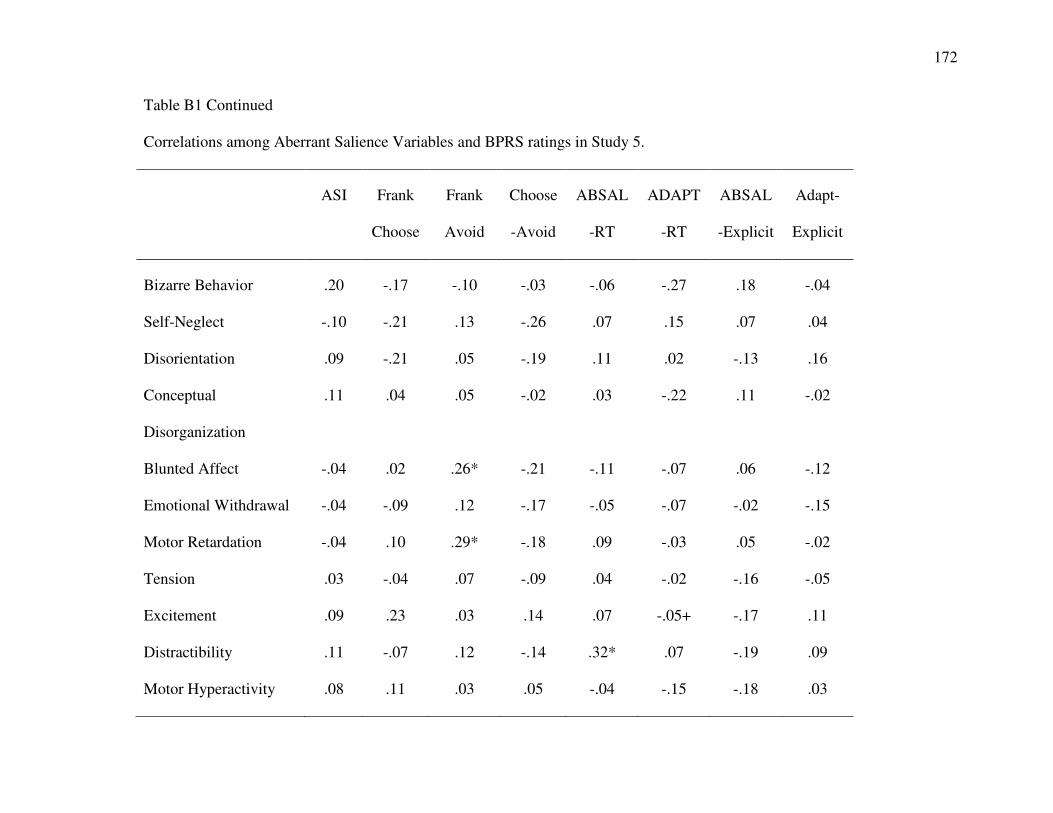
172
Table B1 Continued
Correlations among Aberrant Salience Variables and BPRS ratings in Study 5.
ASI Frank
Choose
Frank
Avoid
Choose
-Avoid
ABSAL
-RT
ADAPT
-RT
ABSAL
-Explicit
Adapt-
Explicit
Bizarre Behavior .20 -.17 -.10 -.03 -.06 -.27 .18 -.04
Self-Neglect -.10 -.21 .13 -.26 .07 .15 .07 .04
Disorientation .09 -.21 .05 -.19 .11 .02 -.13 .16
Conceptual
Disorganization
.11 .04 .05 -.02 .03 -.22 .11 -.02
Blunted Affect -.04 .02 .26* -.21 -.11 -.07 .06 -.12
Emotional Withdrawal -.04 -.09 .12 -.17 -.05 -.07 -.02 -.15
Motor Retardation -.04 .10 .29* -.18 .09 -.03 .05 -.02
Tension .03 -.04 .07 -.09 .04 -.02 -.16 -.05
Excitement .09 .23 .03 .14 .07 -.05+ -.17 .11
Distractibility .11 -.07 .12 -.14 .32* .07 -.19 .09
Motor Hyperactivity .08 .11 .03 .05 -.04 -.15 -.18 .03

173
Table B1 Continued
Correlations among Aberrant Salience Variables and BPRS ratings in Study 5.
ASI Frank
Choose
Frank
Avoid
Choose
-Avoid
ABSAL
-RT
ADAPT
-RT
ABSAL
-Explicit
Adapt-
Explicit
Mannerisms and
Posturing
.03 .13 .11 .01 -.10 .03 .21 .10
* p < .05, + p < .10

174
Table B2
Correlations among Self-Relevant Information Processing Variables BPRS Ratings.
RSES SCCS MNMDT MNMD
T-RT
MNMDT-
Modified
MNMDT-
Confidence
MNMDT
-Conf-RT
BPRS/Somatic
Concern
.07 -.06 -.15 -.09 -.10 -.08 -.04
BPRS/Anxiety -.16 -.14 -.12 .10 -.16 -.07 -.02
BPRS/Depression -.24+ -.19 .01 .14 .01 -.16 .02
BPRS/Suicidality -.13 -.20 .13 .13 -.20 .03
BPRS/Guilt -.10 -.20 .32* .01 .11 -.12 -.16
BPRS/Hostility .17 .06 .11 -.19 .14 .43** -.28+
BPRS/Elevated Mood .13 .05 .18 -.10 -.01 .18 -.18
BRPS/Grandiosity .18 -.20 -.10 -.19 -.04 .24+ -.19
BPRS/Suspiciousness .03 .06 -.30* .28* -.14 .01 .04
BPRS/Hallucinations -.07 -.11 -.25+ -.07 -.16 -.04 -.23

175
Table B2 Continued
Correlations among Self-Relevant Information Processing Variables and BPRS Ratings
RSES SCCS MNMDT MNMD
T-RT
MNMDT-
Modified
MNMDT-
Confidence
MNMDT
-Conf-RT
BPRS/Unusual
Thought Content
.10 -.14 -.30* .01 -.12 .05 .06
Bizarre Behavior -.01 -.03 -.15 .01 -.20 .13 .07
Self-Neglect .04 -.03 .07 -.05 .14 .02 .10
Disorientation .01 -.08 -.10 .06 -.04 .01 .19
Conceptual
Disorganization
.01 .04 -.10 -.19 .09 .13 -.01
Blunted Affect .05 .01 -.18 .14 -.07 .04 .24+
Emotional
Withdrawal
-.15 -.09 -.13 .40** -.17 -.12 .38**
Motor Retardation -05 -.01 -.20 .10 -.10 .12 .15
Tension .04 -.14 -.05 -.10 -.06 .31* -.31*
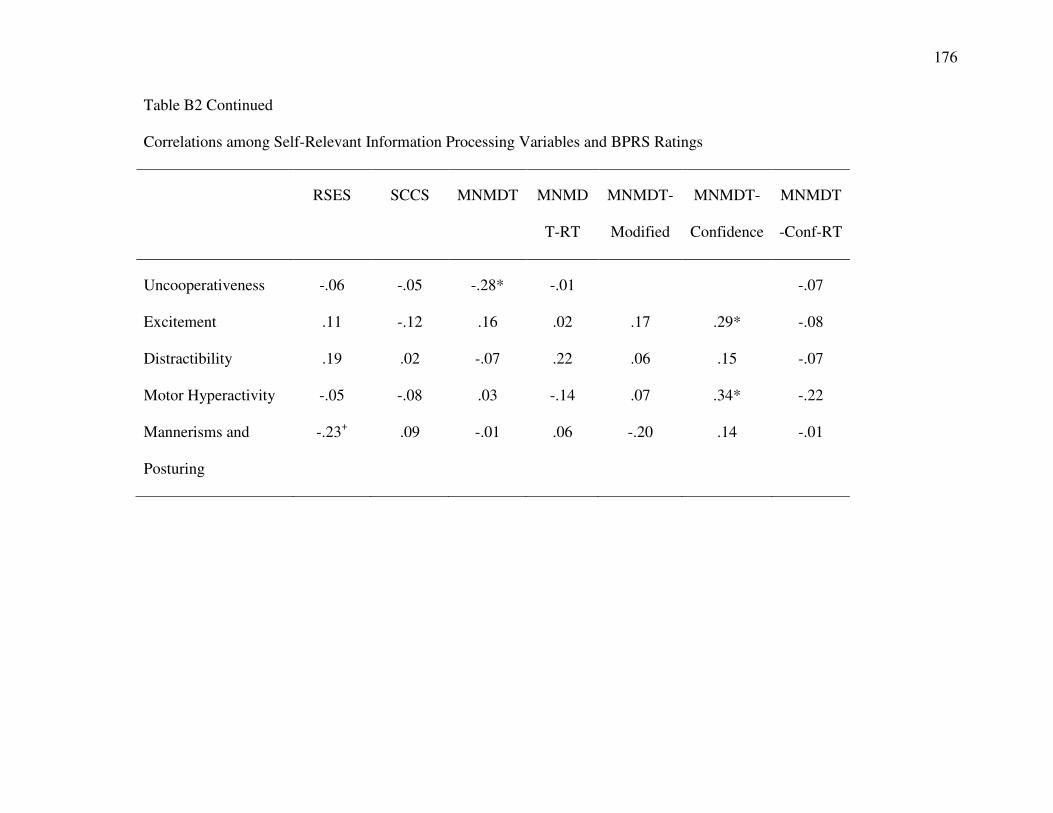
176
Table B2 Continued
Correlations among Self-Relevant Information Processing Variables and BPRS Ratings
RSES SCCS MNMDT MNMD
T-RT
MNMDT-
Modified
MNMDT-
Confidence
MNMDT
-Conf-RT
Uncooperativeness -.06 -.05 -.28* -.01 -.07
Excitement .11 -.12 .16 .02 .17 .29* -.08
Distractibility .19 .02 -.07 .22 .06 .15 -.07
Motor Hyperactivity -.05 -.08 .03 -.14 .07 .34* -.22
Mannerisms and
Posturing
-.23+ .09 -.01 .06 -.20 .14 -.01

177
Table B3
Correlations between Aberrant Salience Variables and Specific Delusions in People with Schizophrenia.
ASI Frank
Choose
Frank
Avoid
Choose
-Avoid
ABSAL
-RT
ADAPT
-RT
ABSAL
-Explicit
Adapt-
Explicit
Persecutory Delusions .08 .01 .08 -.06 -.10 -.15 .01 -.11
Delusions of Guilt .02 -.09 -.17 .09 .39** .40** .01 .15
Grandiose Delusions .16 -.01 .01 .01 -.14 -.15 .05 .02
Religious Delusions .22 -.01 .01 .01 -.14 -.15 .05 .02
Somatic Delusions -.01 .01 .10 -.08 .11 -.01 .32* .20
Delusions of Reference .21 -.02 .05 -.05 .05 -.31* -.19 .04
Delusions of Being Controlled .23 -.12 -.01 -.08 .10 -.16 -.15 .11
Mind Reading .20 .01 .14 -.12 .14 -.12 -.22 .11
Thought Broadcasting .27+ -.11 -.05 -.03 .05 -.17 -.19 .10
Thought Insertion .23 -.06 .01 -.04 .32* -.09 -.19 .18
Thought Withdrawal
* p < .05, + < .10

178
Table B4
Correlations among Self- Processing and Interview-Rated Positive Symptoms in People with Schizophrenia in Study 6
RSES SCCS MNMDT MNMD
T-RT
MNMDT-
Modified
MNMDT-
Confidence
MNMDT
-Conf-RT
Persecutory Delusions .04 .11 -.38** .24+ -.18 -.07 0.01
Delusions of Guilt -.14 -.19 .14 .16 .01 -.20 0.01
Grandiose Delusions .22 -.15 -.20 -.05 -.17 .15 -.14
Religious Delusions .16 .10 -.10 -.11 -.16 -.13 -.11
Somatic Delusions .11 .06 .05 -.08 -.12 -.04 -.10
Delusions of Reference .01 -.19 -.15 -.06 -.15 .05 .05
Delusions of Being Controlled -.14 -.09 -.11 -.04 -.04 .16 -.06
Mind Reading .05 -.03 -.14 .03 -.13 -.02 .21
Thought Broadcasting -.15 -.14 -.13 .11 -.10 -.04 .18
Thought Insertion -.16 -.16 -.04 -.07 .03 -.17 .14
Thought Withdrawal -.15 -.19 -.18 .01 .01 -.04 .26+

179
Table B5
Correlations among Aberrant Salience Variables and Self-Processing Variables in Study 6.
RSES SCCS MNMDT MNMD
T-RT
MNMDT-
Modified
MNMDT-
Confidence
MNMDT
-Conf-RT
ASI -.28* -.57*** -.18 .09 -.01 -.12 .16
Frank Choose .12 .15 .23 -.26+ -.05 -.06 -.10
Frank Avoid .19 .11 -.07 -.08 -.07 .02 -.05
Choose-Avoid -.07 .01 .23+ -.12 .03 -.06 -.02
ABSAL-RT .20 -.03 .29+ -.20 .17 -.08 -.08
ADAPT-RT .14 -.08 .32* .07 .41** .10 .16
ABSAL-Explicit .04 .16 .04 .14 .05 -.06 .12
ADAPT-Explicit -.03 .10 .39** -.29* .12 .09 -.13