Understanding Barriers To Genetic Testing For Sickle Cell ...
88
University of South Carolina University of South Carolina Scholar Commons Scholar Commons Theses and Dissertations 2018 Understanding Barriers To Genetic Testing For Sickle Cell Trait: Understanding Barriers To Genetic Testing For Sickle Cell Trait: The African-American Male Perspective The African-American Male Perspective Shandrea Foster University of South Carolina Follow this and additional works at: https://scholarcommons.sc.edu/etd Part of the Genetic Phenomena Commons Recommended Citation Recommended Citation Foster, S.(2018). Understanding Barriers To Genetic Testing For Sickle Cell Trait: The African-American Male Perspective. (Master's thesis). Retrieved from https://scholarcommons.sc.edu/etd/4698 This Open Access Thesis is brought to you by Scholar Commons. It has been accepted for inclusion in Theses and Dissertations by an authorized administrator of Scholar Commons. For more information, please contact [email protected].
Transcript of Understanding Barriers To Genetic Testing For Sickle Cell ...

University of South Carolina University of South Carolina
Scholar Commons Scholar Commons
Theses and Dissertations
2018
Understanding Barriers To Genetic Testing For Sickle Cell Trait: Understanding Barriers To Genetic Testing For Sickle Cell Trait:
The African-American Male Perspective The African-American Male Perspective
Shandrea Foster University of South Carolina
Follow this and additional works at: https://scholarcommons.sc.edu/etd
Part of the Genetic Phenomena Commons
Recommended Citation Recommended Citation Foster, S.(2018). Understanding Barriers To Genetic Testing For Sickle Cell Trait: The African-American Male Perspective. (Master's thesis). Retrieved from https://scholarcommons.sc.edu/etd/4698
This Open Access Thesis is brought to you by Scholar Commons. It has been accepted for inclusion in Theses and Dissertations by an authorized administrator of Scholar Commons. For more information, please contact [email protected].
UNDERSTANDING BARRIERS TO GENETIC TESTING FOR SICKLE CELL TRAIT:
THE AFRICAN-AMERICAN MALE PERSPECTIVE
by
Shandrea Foster
Bachelor of Science
University of South Carolina, 2015
Submitted in Partial Fulfillment of the Requirements
For the Degree of Master of Science in
Genetic Counseling
School of Medicine
University of South Carolina
2018
Accepted by:
Debera Zvejnieks, Director of Thesis
Yvonne Donald, Reader
Christopher Mazoue, Reader
Cheryl L. Addy, Vice Provost and Dean of the Graduate School

ii
© Copyright by Shandrea Foster, 2018
All Rights Reserved

iii
ACKNOWLEDGEMENTS
Firstly, I would like to thank my thesis advisor, Debera Zvejnieks, MS, CGC for
being the mastermind behind this thesis proposal. She was always there when I needed
her guidance and encouragement throughout this project. I would like to thank my thesis
committee members, Yvonne Donald, MA, CSCEC for assisting with participant
recruitment through her role as the Deputy Director of the James R. Clark Memorial
Sickle Cell Foundation, and Christopher Mazoue, MD for giving advice and editing the
final thesis project.
Thank you to all the respondents that participated in this project, because without
them, this research would not have been possible. I would also like to thank the faculty of
the University of South Carolina for always believing in me and for their support
throughout the completion of this thesis project.
Moreover, I would like to thank the individuals who have always been by my
side, my parents and family. I truly would not have made it this far without your support.
Lastly, I would like to thank my best-friends and my classmates for the being there
through the good times and the stressful times throughout this whole process. I can truly
say I have been blessed to have each one of you by my side.

iv
ABSTRACT
Research has shown a reluctance in African-American males to pursue testing for sickle
cell trait. Few studies have tried to discern what barriers are contributing to this issue
within the African-American male community. Research suggests a lack of knowledge
may be the biggest contributing factor. This study hypothesized there would be a
significant difference in knowledge of sickle cell trait based on educational level, age,
and health beliefs. African-America male participants (N=116), ages 18 and over,
completed a questionnaire assessing knowledge, risk perception, health beliefs, barriers,
and motivating factors within the context of sickle cell trait. One-way and two-way
analysis of variance identified age as an influential factor. Results showed a significant
interaction between age and knowledge of sickle cell trait and sickle cell disease (p =
.009). Factors including perceived discrimination, perceived risk of sickle cell trait based
on parent report, and sentiments on playing sports with sickle cell trait were all
influenced by age (all p < 0.05). Health beliefs such as having tattoos or piercings and
getting annual check-ups with a primary care physician were also influenced by age (both
p < 0.02). The most significant barrier identified was a lack of information about testing
options from primary care physicians, while the largest motivating factor for testing was
for personal health reasons. Findings from this study could aid genetic counselors with
strategies to increase sickle cell trait testing in African-American men. Thereby,
increasing awareness of sickle cell trait in the community for informative health and
reproductive outlook.

v
TABLE OF CONTENTS
ACKNOWLEDGEMENTS ............................................................................................... iii
ABSTRACT ....................................................................................................................... iv
LIST OF TABLES ............................................................................................................ vii
LIST OF FIGURES ......................................................................................................... viii
CHAPTER 1: INTRODUCTION ........................................................................................1
CHAPTER 2: UNDERSTANDING BARRIERS TO GENETIC TESTING FOR
SICKLE CELL TRAIT: THE AFRICAN-AMERICAN MALE PERSPECTIVE .............3
2.1 INTRODUCTION TO SICKLE CELL DISEASE ...............................................4
2.2 CLINICAL FEATURES .......................................................................................5
2.3 ETIOLOGY ...........................................................................................................6
2.4 INCIDENCE .........................................................................................................7
2.5 NEWBORN SCREENING ...................................................................................8
2.6 POPULATION SCREENING ............................................................................10
2.7 SIGNIFICANCE OF THE STUDY ....................................................................12
2.8 HYPOTHESIS .....................................................................................................16
CHAPTER 3: MATERIALS AND METHODS ...............................................................19
3.1 POPULATION ....................................................................................................19
3.2 AREAS OF RECRUITMENT ............................................................................19
3.3 SURVEY MATERIALS .....................................................................................20

vi
3.4 SURVEY METHODS .........................................................................................20
3.5 DATA ANALYSIS .............................................................................................22
CHAPTER 4: RESULTS ...................................................................................................23
4. 1 DEMOGRAPHIC INFORMATION ..................................................................23
4.2 SPECIFIC AIM I: ASSESSING AFRICAN-AMERICAN MEN’S
KNOWLEDGE AND PERCEPTIONS ON GENETIC TESTING, RISK, AND
HEALTH WITHIN THE CONTEXT OF SCT ........................................................23
4.3 SPECIFIC AIM II: UNDERSTAINDING BARRIERS AND MOTIVATING
FACTORS IN TESTING FOR SCT.........................................................................38
CHAPTER 5: DISCUSSION .............................................................................................44
5.1 SPECIFIC AIM I: ASSESSING AFRICAN-AMERICAN MEN’S
KNOWLEDGE AND PERCEPTIONS ON GENETIC TESTING, RISK, AND
HEALTH WITHIN THE CONTEXT OF SCT ........................................................44
5.2 SPECIFIC AIM II: UNDERSTAINDING BARRIERS AND MOTIVATING
FACTORS IN TESTING FOR SCT.........................................................................47
5.3SPECIFIC AIM III: RECOGNIZING THE PRACTICE IMPLICATIONS FOR
GENETIC COUNSELORS ......................................................................................48
5.4 LIMITATIONS ...................................................................................................49
5.5 CONCLUSION ...................................................................................................50
REFERENCES ..................................................................................................................52
APPENDIX A: INSTITUTIONAL REVIEW BOARD APPROVAL LETTER ..............58
APPENDIX B: SUPPLEMENTARY DATA ANALYSIS TABLES ...............................59
APPENDIX C: SUPPLEMENTARY FIGURES ..............................................................74
APPENDIX D: STUDY QUESTIONNAIRE ...................................................................75

vii
LIST OF TABLES
Table 4.1 Survey Demographics ........................................................................................24
Table 4.2 Chart of Knowledge Based Questions with Percent Correct Frequencies.........32
Table B.1 Two-Way ANOVA for Sickle Cell Quiz vs. Age Groups ................................59
Table B.2 Two-Way ANOVA for Sickle Cell Quiz vs. Newly Defined Age Groups ......60
Table B.3 Two-Way ANOVA for Sickle Cell Quiz vs. Education Level .........................61
Table B.4 One-Way Repeated Measures with ANOVA-Multiple Comparisons for Sickle
Cell Quiz vs. Education Level ...........................................................................................62
Table B.5 Independent Samples Test for Sickle Cell Quiz vs. Educational Level (High
school vs. College) .............................................................................................................64
Table B.6 Pearson’s Product Moment Correlation for Yearly Income vs. Education
Level .................................................................................................................................65
Table B.7 One-Way ANOVA for Perceived Risk and Discrimination vs. Age ................66
Table B.8 One-Way ANOVA for Health and Perceived Risk vs. Education Level 3.5 ....68
Table B.9 One-Way ANOVA for SCT Health Beliefs vs. Age.........................................70
Table B. 10 One Way ANOVA for SCT Health Beliefs vs. Education Level ..................72

viii
LIST OF FIGURES
Figure 2.1 Depiction of Malaria vs. HbS Correlation ..........................................................9
Figure 4.1 Participant Report of Testing for Sickle Cell Trait ..........................................25
Figure 4.2 Participant Report of Seeing a Genetic Counselor for Sickle Cell Trait
Testing................................................................................................................................26
Figure 4.3 Participant Response to Refusal of Testing for Sickle Cell Trait .....................27
Figure 4.4 Participant's Selected Reasons for Being Tested for Sickle Cell Trait .............29
Figure 4.5 Participant Responses to Sickle Cell Trait Documentation, Status, and Partner
Awareness ..........................................................................................................................30
Figure 4.6 Mean Score of Total Correct on Sickle Cell Quiz Based on Age Group .........31
Figure 4.7 Box-and-Whisker Plot of Likert Scale Responses of Risk Perception for Sickle
Cell Trait and Sickle Cell Disease in Participants Age 18 to 30 .......................................34
Figure 4.8 Box-and-Whisker Plot of Likert Scale Responses of Risk Perception for Sickle
Cell Trait and Sickle Cell Disease in Participants Age 31 to 49 .......................................35
Figure 4.9 Box-and-Whisker Plot of Likert Scale Responses of Risk Perception for Sickle
Cell Trait and Sickle Cell Disease in Participants Age 50.................................................36
Figure 4.10 Observation of Statistically Significant Health and Risk Perception Questions
about Sickle Cell Trait vs. Age ..........................................................................................37
Figure 4.11 Participant Responses to Health Belief Questions Regarding Sickle Cell Trait
and General Health ............................................................................................................39
Figure 4.12 Observation of Statistically Significant Health Beliefs vs. Age .....................40
Figure 4.13 Barriers to Genetic Testing for Sickle Cell Trait ............................................42
Figure 4.14 Motivating Factors to Genetic Testing for Sickle Cell Trait ..........................43
Figure C.1 Breakdown of Study Participant's Ages ..........................................................74

1
CHAPTER 1
INTRODUCTION
Sickle cell disease (SCD) is a genetic condition that was first included on
newborn screening (NBS) in the 1970s and is currently included on NBS panels in all 50
United States (Pitt, 2010). A nationwide initiative for universal and population screening
was implemented with the signing of the National SCD Control Act Law in 1972, which
was predominately geared towards African-Americans. The goals of the law were to
educate and prevent new occurrences of SCD within the population, given the increased
carrier frequency of sickle cell trait (SCT) in African-Americans. The carrier frequency is
1 in 12 to 1 in 13 with the median life span for individuals with SCD being 42 in males
and 48 in females (Housten, Abel, Lindsey, & King, 2016; Sickle Cell Disease: Data &
Statistics, 2017; Platt et al., 1994).
Many felt anger and resentment towards the sickle cell screening initiatives,
which birthed the long history of stigmatization of SCD within the African-American
community. During this time-period, many African-Americans felt forced to undergo
sickle cell screening for employment, health insurance, and marriage purposes, which
ultimately lead to discrimination in each of those areas (Naik & Haywood, 2015).
Although the laws were changed to assuage the situation, the damage had already been
done (Markel, 1992). Presently, the health and social stigma of SCD may be lessened in
the African-American female community due to routine testing for SCT in pregnant
women (Long, Thomas, Grubs, Gettig, & Krishnamurti, 2011).

2
Research has shown that African-American women have a better understanding of
the importance of genetic testing and counseling and are most often the participants in
studies involving SCD and SCT (Gustafson, Gettig, Watt-Morse, & Krishnamurti, 2007).
Participation from African-American men in these types of studies has been low, leaving
researchers with only half of the complete picture on how to increase health literacy of
SCD within the community (Boyd, Watkins, Price, Fleming, & DeBaun, 2005). Male
participation in these studies has been described as “infrequent” and “difficult” with no
literature explicitly stating why uptake, or incidence, of African-American males
pursuing testing of SCT is low, making it hard for health care professionals, such as
genetic counselors, to appropriately counsel at-risk couples when the male partner refuses
to have testing for SCT (Gustafson et al., 2007). Emerging evidence shows there may be
health related complications involved with SCT in cases of extreme heat, dehydration,
and high altitudes. This signifies it may be of the upmost importance for individuals at
risk for SCT to know their status for reasons other than reproductive decisions (Aloe,
Krishnamurti, & Kladny, 2011).
The purpose of this study is to understand the contributing factors behind the low
uptake and/or refusal of testing for SCT in African-American men. It is hypothesized that
there is a significant difference in knowledge of SCT based on educational level, age, and
health beliefs within the African-American male community, thereby perpetuating this
reluctance to testing for SCT. There are several factors the present study will hopefully
address to discern the barriers, or challenges, that exist when testing this population for
SCT. This information will be useful for genetic counselors who discuss SCT with
African-American men and women during the genetic counseling session.

3
CHAPTER 2
UNDERSTANDING BARRIERS TO GENETIC TESTING FOR SICKLE CELL
TRAIT: THE AFRICAN-AMERICAN MALE PERSPECTIVE1
1 Foster, S. D., Zvejnieks, D., Donald, Y., & Mazoue, C. To be submitted to the Journal
of Health Psychology.

4
2.1 INTRODUCTION TO SICKLE CELL DISEASE
Sickle cell disease, SCD, is a collective term for a group of inherited single-gene
disorders affecting hemoglobin, the oxygen-transporting molecule found in red blood
cells. The condition results from a structural change in red blood cells that causes them to
become hard and sickle shaped, which makes it difficult for hemoglobin to circulate
oxygen to different tissues within the body (Jenerette & Brewer, 2010). SCD occurs
when two pathogenic variants of the beta-hemoglobin gene are inherited, one from each
parent. Individuals with sickle cell trait, SCT, have inherited a normal copy and a
pathogenic variant of the beta-hemoglobin gene, making them carriers for SCD, one of
the most common types of hemoglobinopathies (Bender & Douthitt, 2014).
SCD affects multiple body systems, with the main clinical manifestations
resulting from the effects of deoxygenation, vaso-occlusion, and tissue necrosis (Jenerette
& Brewer, 2010). In 1910, James B. Herrick published the first article on the disease
where he observed the sickle shaped cells taken from a Grenadian dental student who
displayed complications of what would become known as SCD. Several years after the
initial discovery, many scientists sought out to conduct experiments to better understand
the nature and etiology of the condition. By 1949, Dr. James V. Neel uncovered SCD was
inherited through an autosomal recessive pattern (Frenette & Atweh, 2007). More recent
studies have been geared towards understanding the pathophysiology of SCD and its
prevalence in certain populations. The most commonly affected populations include
individuals with sub-Saharan African, South American, Saudi Arabian, Indian, and
Mediterranean origins (Gallo et al., 2010). Each SCD subtype is classified by its effect on
beta-hemoglobin, with the most common form being sickle cell anemia (HbSS), which

5
accounts for 60-70% of all cases of SCD. Sickle cell anemia is followed in incidence by
sickle-hemoglobin C (HbSC), sickle cell beta-thalassemia (HbSB+ and HbSBo), and
more rare forms that result from an interaction between HbS with HbD-Punjab, Hb O-
Arab, and Hb E, and Hb Lepore (Serjeant, 2013; Bender & Douthitt, 2014).
2.2 CLINICAL FEATURES
With the inclusion of SCD on the mandatory newborn screening panels in all 50
United States, most babies with SCD are detected 1-2 weeks after birth (Gallo et al.,
2010). Typically, symptoms appear before the first year of life, making it imperative for
children with SCD to be identified, monitored, and treated before symptoms can manifest
(Jenerette & Brewer, 2010). Those symptoms are characterized by “vaso-occlusive events
and chronic hemolytic anemia [that] can affect multiple organs in the body including:
bones, liver, kidneys, brain, eyes, and joints” (Bender & Douthitt, 2014, p.1). The first
recognized clinical manifestation in infants and young children is dactylitis, which is pain
or swelling of the hands and feet. Often splenomegaly occurs in younger patients due to
sequestration of blood cells within the spleen, which increases the risk of bacterial
infections. If two or more of these splenic attacks occur before age 2, a splenectomy is
ideal followed by life-long treatment with penicillin as a prophylactic (Serjeant, 2013).
Depending on the severity of chronic hemolysis, it can cause a multitude of symptoms
including: anemia, jaundice, delayed growth and/or sexual maturation, and cholelithiasis.
The more severe spectrum of hemolysis can result in pulmonary artery hypertension,
priapism, leg ulcers, septicemia, rhabdomyolysis, and even death (Bender & Douthitt,
2014). Sickle cell anemia, HbSS, and beta-thalassemia, HbSBo, are the more clinically

6
severe phenotypes where the onset of anemia and hemolysis develop by 6–12 months of
age (Bender & Douthitt, 2014).
Since SCD was first described over 100 year ago, morbidity and mortality remain
high with a median survival range estimated to be 42 years in men and 48 years in
women; however, more recent articles have quoted the median age as 45–55 years old
(Platt et al., 1994; Serjeant, 2013). There are many clinics and organizations geared
towards caring for individuals with SCD to help properly manage the effects of the
condition as they age. In the early childhood years, acute chest syndrome is the most
common cause of death in children with SCD after the age of 2 with symptoms
characterized by pulmonary chest pain, cough, dyspnea, and pleuritic pain of avascular
necrosis (Serjeant, 2013). There is also an increased risk of hemorrhagic strokes that
occur at the peak ages of 6 and 25 years old, which are associated with a poor prognosis.
For adults with SCD, acute chest syndrome continues to have an effect, coupled with a
risk of congestive heart failure and deteriorating renal function, possibly due to the
decline in total hemoglobin after the age of 40 years old (Serjeant, 2013).
2.3 ETIOLOGY
SCD is caused by pathogenic variants in the HBB, hemoglobin subunit beta, gene
which produces a protein called beta-globin that makes up two out of the four protein
subunits of the larger adult hemoglobin protein located in red blood cells. Mutations in
the HBB gene cause abnormal versions of beta-globin to be produced and distorts the red
blood cells into sickled shaped cells that die prematurely and can lead to anemia (Bender
& Douthitt, 2014). The Glu6Val pathogenic variant is the most well-known of the point
mutations that leads to SCD. These cells are often hard and inflexible, making them more

7
susceptible to getting stuck in the small blood vessels in the body, leading to many of the
disease’s clinical manifestations. The beta-like globin genes are located on chromosome
11 and are expressed in the order in which they develop. During fetal development,
hemoglobin F and gamma (Y) are expressed and after birth, the infant’s hemoglobin
makes the transition to hemoglobin alpha and hemoglobin beta. During this switch from
fetal to adult hemoglobin, these disorders of the beta hemoglobin genes will begin to
manifest themselves, explaining why newborns with SCD do not have immediate
complications after birth (Frenette & Atweh, 2007).
2.4 INCIDENCE
Per the Center for Disease Control, SCD affects 100,000 Americans with an
occurrence of 1 out of every 365 African-American children having the condition. HbSS,
or sickle cell anemia, is the most common form of SCD and most often affects those of
African descent. Approximately 1 in 12 to 1 in 13 African-Americans are carriers of an S
beta-globin mutation (Jenerette & Brewer, 2010; Housten et al., 2016; Sickle Cell
Disease: Data & Statistics, 2017; Boyd et al., 2005). Given the autosomal recessive
inheritance of this condition, we can accurately predict the chance of an affected
pregnancy in individuals who are known heterozygotes of an HBB pathogenic variant.
Using the example of parents with the HbAS genotype, we know that each pregnancy has
a 25% chance of having sickle cell anemia, a 50% chance of being a carrier for S beta-
globin, and a 25% chance of having normal hemoglobin.
The prevalence of SCT has been well studied and may have developed as a part of
a heterozygote advantage in Africa as a protective mechanism against malaria. Malaria,
which is caused by the bacterium plasmodium falciparum, is an infectious disease that is

8
common in African countries. Researchers believe that heterozygotes for the sickle gene
(HbAS) are protected against the harmful effects of malaria. The proposed theory is that
AS heterozygotes have less red blood cells that are parasitized in their blood, meaning
they are less likely to develop the more life-threatening forms of malaria, cerebral
malaria, and malaria with severe anemia. AS heterozygotes often survive malarial
infections while those with sickle cell anemia, HbSS, do not and are more susceptible to
the lethal effects of malaria due to hyposplenism, which causes a lower clearance of
infected red blood cells (Luzzatto, 2012; Grosse et al., 2011). A study by Elion et al. in
1992, stated that sickle hemoglobin, HbS, has undergone evolutionary selection at least 5
times because of its malarial protective effects (Naik & Haywood, 2015) (Figure 2.1).
2.5 NEWBORN SCREENING
Understanding more about the severity and early onset of SCD led to its inclusion
onto many of the newborn screening (NBS) panels in the United States. SCD was first
added to newborn screening panels in the US around the 1970s (Pitt, 2010; Benson &
Therrell, 2010). The most common screening techniques include: sickle solubility testing,
hemoglobin electrophoresis, high performance liquid chromatography, and isoelectric,
focusing (Naik & Haywood, 2015). The follow-up and communication of NBS results for
SCT and SCD vary across state, which has caused some disconnect in the disclosure of
positive results to families. A study done in 2010 showed that sickle cell “stakeholders”,
such as hematologists, hospitals, and families are not being properly informed of the
results. Specifically, for SCT, the study reported that an average of only 37% of families
were notified about positive results. This study highlighted a potential need to make

9
Figure 2.1 Depiction of Malaria vs. HbS Correlation

10
changes within the follow-up and communication of NBS results (Kavanagh, Wang,
Therrell, Sprinz, & Bauchner, 2008).
2.6 POPULATION SCREENING
Prior to the late 1960s, there were hardly any established programs bringing
awareness of SCD to African-American communities. In 1972, the National SCD Control
Act was signed into law by President Richard Nixon to start a nationwide initiative for
universal newborn screening, population screening, and counseling by providing more
education and genetic counseling to patients with SCD and SCT. For most of the 1970s,
this law focused on identifying at-risk individuals, research, and increasing community
awareness and education (Naik & Haywood, 2015).
Ultimately, population screening became a normalized part of healthcare because
many healthcare professionals began to recommend testing for SCT when status was
unknown (Boyd et al., 2005). In 1972, The Department of Defense developed guidelines
for mandatory and universal SCT screening for all Army, Air Force, and Navy recruits
after adverse effects in individuals with SCT were observed. During that time, the
adverse effects observed included sudden death and exertional rhabdomyolysis at high
altitudes. Without enough evidence to support claims of the adverse effects, The
Department of Defense decided to withdraw their mandatory requirement in 1985.
Currently, individuals in the Navy, Air Force, and Marines are still subject to universal
SCT screening; however, the Army discontinued this health measure in 1996. The same
mandates were made by the National Collegiate Athletic Association, NCAA, in the late
1970s before being thrown out and reinstated in 2010 with an opt-out option (Naik &
Haywood, 2015).
11
Although many saw the benefit of learning their SCT status, it did not take long
for many to associate SCD with the black community, despite its occurrence in other
diverse populations. The stigmatization of SCT carriers occurred with the national
population screening efforts put forth by the National SCD Control Act in 1972. When
President Nixon spoke about the initiatives, he used language that may have propagated
ideals that negatively associated African-American individuals with SCD. In his speech,
he stated: “This disease is especially pernicious because it strikes only blacks and no one
else… these actions make it clear, I believe, the urgency with which this country is
working to alleviate and arrest the suffering from this disease.” (Naik & Haywood, 2015,
p. 5). Many African-American men and women began to feel forced into undergoing
testing for several different reasons including employment, health insurance, and even for
marriage purposes. It ultimately led to discrimination in each of those areas (Naik &
Haywood, 2015). The “fear” of SCD was cultivated mainly because of the eugenics
movement during the advent of population screening and contributed to individuals being
denied life insurance and barred from entering the U.S. Air Force Academy. It caused
much anger within the community, further stigmatizing carriers of sickle cell. Although
laws were changed to assuage the situation, the damage was already done (Markel, 1992).
In more recent years, one study has shown that perceived discrimination in SCD
happens in all aspects of society and in healthcare professions. Most of the
discrimination that has been documented is disease-based and not race-based and is
associated with the presenting severity of the condition (Haywood et al., 2014). In a study
by Lawrence et al. in 2014, they sought out to understand athletes’ perceptions of SCT
screening and examined the possibilities for discrimination. Most athletes believed being

12
a known SCT carrier could lead to potential discrimination, resulting in a reduction in
playing time, current or future athletic opportunities, and a denial of health insurance
(Haywood et al., 2014). Perhaps, the reason sickle cell stigmatization is so strong within
the community stems from some of the outward physical effects of SCD like jaundiced
eyes and leg ulcers (Bediako et al., 2016). Some fear the prospects of SCD and are
uncomfortable with talking about it, which could contribute to at-risk individuals not
wanting to know their status (Gallo et al., 2010).
2.7 SIGNIFICANCE OF THE STUDY
The health-related stigma attached to SCD is still relevant. Those with the
condition are still looked upon as weaker and are discriminated against by employers and
family members (Jenerette & Brewer., 2010). However, routine testing for SCT in
pregnant women may have lessened the stigma in recent years, specifically in African-
American women. Many studies on the subject have confirmed that although the barriers
of knowledge about sickle cell testing and perceived discrimination are still present,
African-American women understand the importance of genetic testing to help them
determine their trait status (Long et al., 2011). In a study performed 10 years ago, the
participants, who were all African-American women, discussed their health beliefs
regarding genetic testing and counseling for SCD. While most of the participants gained a
better understanding of the severity and benefits to screening, many still did not believe
they were at risk for having a child with SCD even when their status was unknown
(Gustafson et al., 2007). Although multiple efforts have been made to increase awareness
and education on SCT and SCD, there is still a low uptake or acceptance for screening in
the African-American population. It appears a lack of education and stigma are still

13
driving forces behind the low uptake given that a study in 2005 showed that overall,
African- American women are poorly informed on the genetics, inheritance, and
variability of SCD. The data from this study was comparable to those conducted in the
late 1960s (Boyd et al., 2005).
Health literacy within the African-American community regarding SCT or SCD is
still a common issue. One interesting study in 2014, set out to examine the accuracy of
self-reporting in SCD juxtaposed to genetic confirmation. Their research showed that of
the fifty-one individuals who reported they had SCD, only 5.9% were confirmed to have
SCD, 67.2% were confirmed with SCT, 5.9% with hemoglobin C trait, and 25.5% with
having normal hemoglobin. Oppositely, of the 75% of individuals who reported not
having SCD, 100% were concordant with their self-report (Bean et al., 2014). These
results are most striking as they support the conclusions of many other articles that
highlight improving education of adults about their status is paramount, given the marked
differences in the background knowledge of SCD and SCT. Bean et al. (2014) argued that
education should be done within the public health or primary care setting since those
healthcare professionals have more opportunities to educate the patient.
Gustafson et al.’s study showed one interesting detail, which is the current basis
for the present study, where they identified that one barrier for the female participants
was convincing their male partner to get screening for SCT (Gustafson et al., 2007). Of
the multiple studies that have been published in the past, most have only been able to
capture one half of the story since African-American male participation has been low for
both undergoing testing and participating in studies involved with SCT testing. Currently,
there is no literature explicitly stating the reasons why uptake continues to be low in

14
African-American men (Housten et al., 2016). Whenever male participation occurs, it is
often described as “infrequent” and the lack of participation makes it difficult for health
care professionals, such as genetic counselors, to understand the barriers in testing for
SCT. The only reassuring way to decrease a mother’s worry about the risk to their
unborn child for SCD is to test the father (Gustafson et al., 2007). Anecdotally, some
genetic counselors have noticed the reluctance of African-American men to have genetic
testing as well. Using the example of African-American participation in clinical trials,
many of the same reasons could be extrapolated to testing for SCT. In this study, many of
the men cited their reluctance to participating stems from the past exploitation and
treatment of those in the Tuskegee syphilis experiment, which may also contribute to the
mistrust that many people of color have with health care professionals and to their refusal
of testing for SCT (Jacobs, Rolle, Ferrans, Whitaker, & Warnecke, 2006; BeLue, Taylor-
Richardson, Lin, Rivera, & Grandison, 2006).
Addressing this issue has become more relevant since the NCAA (National
Collegiate Athletic Association) established their genetic screening program that included
mandatory SCT screening as a part of the medical exam for all its division 1, 2, and 3
players in 2010. The decision was made after a string of African-American students died
from complications of SCT in 2009. Studies were conducted that confirmed dehydration,
high altitudes, low oxygen, and increased blood viscosity were some of the factors that
could lead to sudden deaths in athletes with SCT (Aloe et al., 2011).
Researchers have observed an increase in sickled cells, or exertional sickling, in
individuals with SCT when exposed to extreme physical activity. Exertional sickling
refers to an increase in sickled cells with exertion or increased exercise, which could

15
potentially lead to blockages of red blood cells in the blood vessels and sudden death
(Ferrari, Parker, Grubs, & Krishnamurti, 2015). The NCAA guidelines explained that
students should be screened for SCT so that students and coaches are more aware of their
status in case extra precautions should be taken to avoid health-related problems (Harris,
Haas, Eichner, & Maron, 2012). They explained that coaches should not train students
with SCT as hard; however, the Army stated that treating everyone the same would be
more beneficial to avoid ostracizing those with SCT. For example, the Army
recommended that everyone, not just those with SCT, should be kept cool and hydrated
to avoid health issues on especially hot days (Tarini, Brooks, & Bundy, 2012).
The recent NCAA policy change on SCT has not gone without backlash from
other organizations because of the ethical implications of testing student athletes. Ferrari
et al. examined some of the implications of this type of health reform and stated they
oppose the mandatory screening rule because organizations such as the American Society
of Hematology and the Sickle Cell Disease Associations of America believe testing all
athletes for SCT is unwarranted because the link to sudden death has not been confirmed.
The recommendations from the article state that including genetic counseling as a part of
the screening program without testing would insure student athletes are being properly
educated on the natural history of SCT, its reproductive implications, along with potential
health and psychosocial concerns (Ferrari et al., 2015).
Although there are laws preventing discrimination against someone because of
their genetic make-up, the risk of discrimination, perceived or real, is a palpable fear in
the African-American community, especially for men, whenever there is disclosure of
SCT status within the military, job force, and recently in sports (Ferrari e al, 2015). Since

16
most individuals with SCT 1) do not experience any complications and 2) are not aware
of their status and 3) are reluctant in wanting to know their status, it has become even
more important for African-American men and women to know their trait status, not just
for the risk of SCD in potential pregnancies but also for the potential risk it poses to their
health (Harris et al., 2012). Apart from sudden cardiac death, ongoing research shows
SCT may be associated with hematuria, glaucoma-post hyphema, renal disease, and
splenic ischemia (Westerman et al., 2002; Kiryluk, Jadoon, Gupta, & Radhakrishnan,
2007; Harris et al., 2012; Pandey, 2015; Naik et al., 2016). The NCAA ruling has made
genetic counselors more aware of some of these issues testing for SCT can pose for
athletes but has not presently been studied in African-American men who are non-
athletes (Aloe et al., 2011).
2.8 HYPOTHESIS
Therefore, the questions proposed in this study revolve around uncovering if
African-American men more likely not to be tested for SCT and understanding the
reasons why. It is hypothesized that there is a significant difference in knowledge of SCT
based on educational level, age, and health beliefs within the African-American male
community, thereby perpetuating this reluctance to testing for SCT. There are several
areas the present study will hopefully address to discern which barriers or challenges,
besides education, exist when testing for SCT. Several examples include stigma,
perceived discrimination, and a fear of needles. Grosse et al., who conducted a study on
African-American women, also pointed out that there is a lot of uncertainty about male
partner’s trait status because of a decreased risk perception along with a lack of
understanding about the inheritance and natural history of SCD and SCT. The study also

17
cited a fear of needles as another interesting but rarely talked about barrier in the
literature. This fear stems from the pain often associated with phlebotomy, which is
potentially strong enough for some men to refuse testing (Gallo et al., 2010; Gustafson et
al., 2007). A similar study looked at the health beliefs, barriers, and motivations that exist
within African-American women, but not in men (Gustafson et al., 2007).
The current aims of this study include:
I. Assessing African-American men’s knowledge and perceptions on genetic
testing, risk, and health within the context of SCT
II. Understanding barriers and motivating factors in testing for SCT
III. Recognizing the practice implications for genetic counselors
Understanding these factors in African-American men, helps to gather the full
picture of why this issue exists within genetic counseling and how to address these
concerns appropriately. From a health literacy standpoint, it is most important to learn
more about what African-American men already know and understand their perspectives
on genetic testing for SCT because it is an important health issue within the community
that is not discussed.
For genetic counselors, this information is important to know because it will
increase awareness amongst this population that is most at risk for SCT and SCD and
help to fill in gaps surrounding why this issue exists and what we as genetic counselors
can do about it. Knowing more about the barriers, health beliefs, and motivating factors
will assist genetic counselors in addressing some of these issues during counseling
sessions. It could open a dialogue between African-American families and their genetic
counselors so that they can reduce myths surrounding SCT and SCD and increase

18
community awareness of the potential health risks associated with SCT. Gaining the
African-American male perspective will be one of the first steps in figuring out what
genetic counselors can do to improve uptake of men pursuing testing so that we can give
accurate risk assessment to expecting couples and reduce the anxiety that is commonly
seen when there is a risk of SCD in a pregnancy. More importantly, genetic counselors
could be on the forefront of informing patients about the potential risks associated with
SCT for their own health.

19
CHAPTER 3
MATERIALS AND METHODS
3.1 POPULATION
African-American, or black, males over the age of 18 were invited to participate
in the study, with the target population being 18 to 45, the most common childbearing
ages. Most participants that were invited to take the survey were physically located in the
greater Columbia, South Carolina area. All females and non-African American, or black
male participants were excluded from participating in the study. There were no
exclusions based on age, religious affiliation, educational background, or socioeconomic
status.
3.2 AREAS OF RECRUITMENT
The participants were recruited from many areas within Columbia, South
Carolina. The following places were provided paper surveys: James R. Clark Memorial
Sickle Cell Foundation events (i.e. 12th annual SCD walk, Sickle Cell Family Day, The
Giving Tree), a Friendship Baptist Church homeless group meeting, University Specialty
Clinics Genetic Counseling suite at Palmetto Health-Richland Hospital System, and an
African-American Shriner’s group meeting. For the online survey, participants were
recruited through postings of an online link to the survey from the primary investigator’s
Facebook page and the University of South Carolina’s Facebook pages.

20
3.3 SURVEY MATERIALS
The protocol for this study was approved by the University of South Carolina
Institutional Review Board under the title of “Understanding Barriers to Genetic Testing
for SCT: The African-American Male Perspective”. In the appendix, a copy of the
Institutional Review Board’s approval letter for protocol Pro00067778 can be found. The
survey was initially created in a printed version, with an online copy being created on
surveymonkey.com. For the online survey, two additional exclusion criteria questions
based on gender and ethnicity were added to vet out participants who would otherwise
not meet the in-person participant criteria (i.e. non-black and female individuals). They
are listed below:
1. What is your gender?
a) male b) female
2. What is your ethnicity/race?
a) African-American/Black b) European-American/White c) Latino/Hispanic
All participants were instructed to read the letter of participation before continuing to the
survey and were told their contribution would be anonymous, confidential, and optional.
3.4 SURVEY METHODS
Using survey methodology, a questionnaire containing themes about health
literacy regarding SCD and SCT, perspectives on genetic testing, health perceptions,
barriers, and motivations was formulated and distributed to all willing participants
beginning on September 9, 2017. The questionnaire consisted of 31 questions with five
additional demographic questions. A copy of the survey is provided in Appendix D. All
participants were invited to answer Questions 1- 20 of the survey. Questions 1-9 asked

21
knowledge based questions regarding SCT and SCD and consisted of multiple choice and
true/false answer. Questions 6-7 were utilized from a previous survey constructed for a
similar study by Gustafson et al. (2007). Questions 10-18 were used to assess risk and
health perception using a Likert scale. Participants were asked to rate their level of
agreement with each statement (1= strongly disagree, 5= strongly agree).
Participants were then asked about their perceptions on genetic testing in
questions 19-20 using yes/no answer. Only participants who answered yes to question 20
were invited to complete questions 21-24 which asked participants questions about the
nature in which they underwent genetic testing for SCT. Question 21 was multiple choice
while questions 22-24 were yes/no answer. All participants were invited to answer
questions 25-31. Questions 25 -29 were used to assess health beliefs using yes/no answer.
Questions 30 and 31 asked participants about barriers and motivating factors to genetic
testing for SCT respectively. Both questions were multiple answer. Questions 32-36 were
demographic, multiple-choice, questions that asked participants about their age,
educational level, yearly income, relationship status, and number of children,
respectively.
An incentive was offered in the form of an in-person or online drawing for gift
cards ranging from $5 to $10 from various chain restaurants (i.e. McDonald’s, Chic Fil-
A). No more than 7 gift cards per month were given. Each participant was entered into
the drawing within the same month the survey was completed in. The names and/or
phone numbers were taken for the drawing and winners were either physically present to
receive their gift card or they were mailed to them. All identifying information collected
from the drawings was destroyed once the winners were contacted and their gift cards

22
were mailed. The participants were all told this information before completing the survey
to establish trust and confidentiality.
3.5 DATA ANALYSIS
For the knowledge based questions detonated as the “sickle cell quiz”, answers
were split into two variables with correct answers coded as 1 and incorrect answers coded
as 0. If a respondent did not answer one of the knowledge based questions, their answer
was coded as incorrect. There was a maximum score of 9 possible for knowledge of SCD
and SCT. The grand mean knowledge scores were calculated based on group and
educational level. Using SPSS Statistical Software, two-way, one-way repeated, and
one-way ANOVAs was used to assess statistical differences in age, educational level,
knowledge, health beliefs, and perceived risk and discrimination. Statistical differences in
education level and knowledge were analyzed using an independent samples t-test.

23
CHAPTER 4
RESULTS
4.1 DEMOGRAPHIC INFORMATION
One hundred and sixteen of the 124 surveys collected were used in the data
analysis because they were 80% or more completed. Of the participants that answered the
demographic questions, all identified as black and/ or African-American (100%), were
primarily between the ages of 31 to 49 (41.0%), with some college education (31.9%),
married (36.2%), with no children (34.5%), and making less than $10,000 dollars a year
(23.3%) (Table 4.1).
4.2 SPECIFIC AIM I: ASSESSING AFRICAN AMERICAN MEN’S KNOWLEDGE
AND PERCEPTIONS ON GENETIC TESTING, RISK, AND HEALTH WITHIN THE
CONTEXT OF SCT
Overall, approximately 41% of participants reported getting tested for SCT within
their lifetime with the other 59% reported never being tested for SCT (Figure 4.1).
Twenty-one percent reported seeing a genetic counselor for SCT testing with only 2%
having refused testing within their lifetime (Figure 4.2 & Figure 4.3).
Of the 49 (42.2%) people that had SCT testing, 13 (11.2%) participants were
tested at birth, which made up the largest category. Nine participants (7.8%) reported
being tested in the military, and another 9 (7.8%) reported getting tested for an unknown
reason that was not listed within the survey choices. The third largest category, made up

24
Table 4.1 Survey Demographics
Variable Population (n= 116)
Number Percentage
Age Intervals
18-19 y 4 3.5
20-24 y 12 10.5
25-30 y 17 14.9
31-36 y 13 11.4
37-42 y 11 9.6
43-49 y 23 20.2
50+ y 34 29.8
Education Level
Some high school 8 7.2
High school graduate 27 24.3
Some college 37 33.3
College graduate 23 20.7
Graduate/professional school 16 14.4
Yearly Income
less than $10,000 27 25.5
$10,000- $20,000 9 8.5
$20,000- $30,000 16 15.1
$30,000- $40,000 10 9.4
$40,000- $50,000 13 12.3
$50,000- $100,000 23 21.7
$100,000 + 8 7.5
Relationship Status
Married 42 38.9
Single 41 38
In a relationship 25 23.1
Number of Children
0 40 36.7
1 13 11.9
2 25 22.9
3 14 12.8
4 8 7.3
5 or more 9 8.3

25
Figure 4.1 Participant Report of Testing for SCT
Yes
41%
No
59%

26
Figure 4.2 Participant Report of Seeing a Genetic Counselor for Sickle Cell Trait Testing
21%
79%
Yes No

27
Figure 4.3 Participant Response to Refusal of Testing for Sickle Cell Trait
2%
98%
Yes No

28
of 8 (6.9%) participants, reported getting testing for personal health reasons. The fourth
largest category of participants stated they were tested for SCT for sports (n=6, 5.2%).
The smallest category, made up of 4 (3.4%) participants, reported getting tested for SCT
during their partner’s pregnancy (Figure 4.4).
When asked if the participant had documentation stating their SCT status, 20
(46.5%) participants had documentation while the other 23 (53.4%) respondents did not
(n=43). Thirty-two (76.2%) respondents were told they were negative for SCT, while 10
(23.8%) were told that they did have SCT (n=42). When asked if partners would be
aware of their positive SCT status, 33 (80.5%) participants agreed their partner would be
aware while 8 (19.5%) participants said their partners would not be aware of their
positive SCT status (n=41, Figure 4.5).
On the sickle cell quiz, the grand mean knowledge score was 6.206 (69.55%
correct) with a maximum of 9 correct answers possible. The 18 -19 age group scored the
highest with a mean knowledge score of 7, while the 50+ age group scored the lowest
with a mean knowledge score of 5.53 (Figure 4.6).Of the knowledge based questions,
participants were most likely to guess incorrectly on the carrier frequency of SCT in
African-Americans (31% correct). Participants were most likely to guess correctly that
black people are predominantly affected by SCD (92.2% correct). Using descriptive
statistics, the percent correct for each question on the sickle cell quiz were calculated and
the correct answers were compiled into a table (Table 4.2).
A two-way ANOVA was conducted to look for any statistically significant
differences between age and knowledge based on the total answers correct on the sickle
cell quiz. Results showed there was a statistically significant negative association

29
Figure 4.4 Participant's Selected Reasons for Being Tested for Sickle Cell Trait
4
6
8
9
13
9
0
2
4
6
8
10
12
14
During
partner's
pregnancy
Sports Personal
health reasons
Military Tested at birth Other
Num
ber
of
Par
tici
pan
ts (
n=
49
)
Testing Reasons

30
Figure 4.5 Participant Responses to Sickle Cell Trait Documentation, Status, and Partner
Awareness
20
10
33
23
32
8
0
5
10
15
20
25
30
35
Do you have
documentation stating you
do not have SCT?
n= 43
Were you told you have
SCT?
n = 42
If you had SCT, would
your partner be aware of
it?
n= 41
Num
ber
of
Par
tici
pan
ts
Questions
Yes
No

31
Figure 4.6 Mean Score of Total Correct on Sickle Cell Quiz Based on Age Group
7
5.92
6.946.62
5.91
6.57
5.53
0
1
2
3
4
5
6
7
8
9
18-19 20-24 25-30 31-36 37-42 43-49 50+
Quiz
Sco
re
Age Groups

32
Table 4.2 Chart of Knowledge Based Questions with Percent Correct Frequencies
between age and knowledge of SCD and SCT, F (6, 107) = 3.007, p = .009, partial η2 =
.144 (Table B.1). To strengthen significance values, all other results were tabulated with
the following adjusted age groups: 18-30, 31-49, and 50+ age groups. There was a
statistically significant positive association between the newly defined age groups and the
knowledge score on the sickle cell quiz, F (2, 111) = 5.739, p = .004, partial η2 = .094
(Table B.2).
A two-way ANOVA was conducted between education level and the correct score
on the sickle cell quiz. There was no statistically significant association between
education and knowledge of SCD and SCT, F (4, 106) =1.611, p=.177, partial η2 = .057
(Table B.3). A one-way repeated measures ANOVA was conducted to determine whether
there were statistically significant differences in the total correct on the sickle cell quiz
based on education level. Analysis showed there were no statistically significant
Population
(n=116)
Knowledge Based Questions: Answer:
% Correct
(Frequency)
Sickle cell disease (SCD) is caused by...
b) 2 altered genes
passed from parents 56% (65)
Sickle cell trait (SCT) is caused by...
c) 1 altered gene
passed from the parent 64.7% (75)
Individuals with sickle cell disease... d) all of the above 78.% (91)
Sickle cell disease most often occurs in... c) black people 92.2% (107)
One out of every _______ African-Americans has
sickle cell trait.
a) 1 out of every 12
people 31% (36)
Sickle cell disease makes red blood cells...
d) hard and sickle
shaped 50% (58)
How can you tell if someone carries the gene for sickle
cell trait or sickle cell disease? c) with a blood test 81% (94)
Individuals with sickle cell trait can have symptoms
under extreme conditions, such as when dehydrated or
in low oxygen environments. a) True 76.7% (89)
Sickle cell trait and sickle cell disease can be cured? b) False 87.1% (101)

33
differences in the mean scores on the sickle cell quiz when compared to education levels
(p >0.05) (Table B.4). An independent-samples t-test was run to determine if there were
differences in the total correct on the sickle cell quiz between participants who had an
educational level of high school or below and college level or higher. For the scores on
the sickle cell quiz for each educational category, there was homogeneity of variances, as
assessed by Levene’s test for equality of variances (p= .877). There was no statistically
significant difference between the two educational categories for the total correct on the
sickle cell quiz (95% CI, -1.1 to .02), t (109) = -1.899, p=0.60 (Table B.5).
To assess risk and health perception of the study participants, several statistical
tests were run to look for significant differences within the data. A one-way ANOVA was
conducted to determine whether there were statistically significant differences in health
and risk perception questions regarding SCT status and age groups. There was a
statistically significant difference between the age group’s answers on questions
regarding perceived discrimination (p = 0.040), perceived risk based on parent report of
SCT (p= 0.008), and playing sports (p=0.016). All other questions were not statistically
significant between the age groups (p>0.05) (Table B.7).
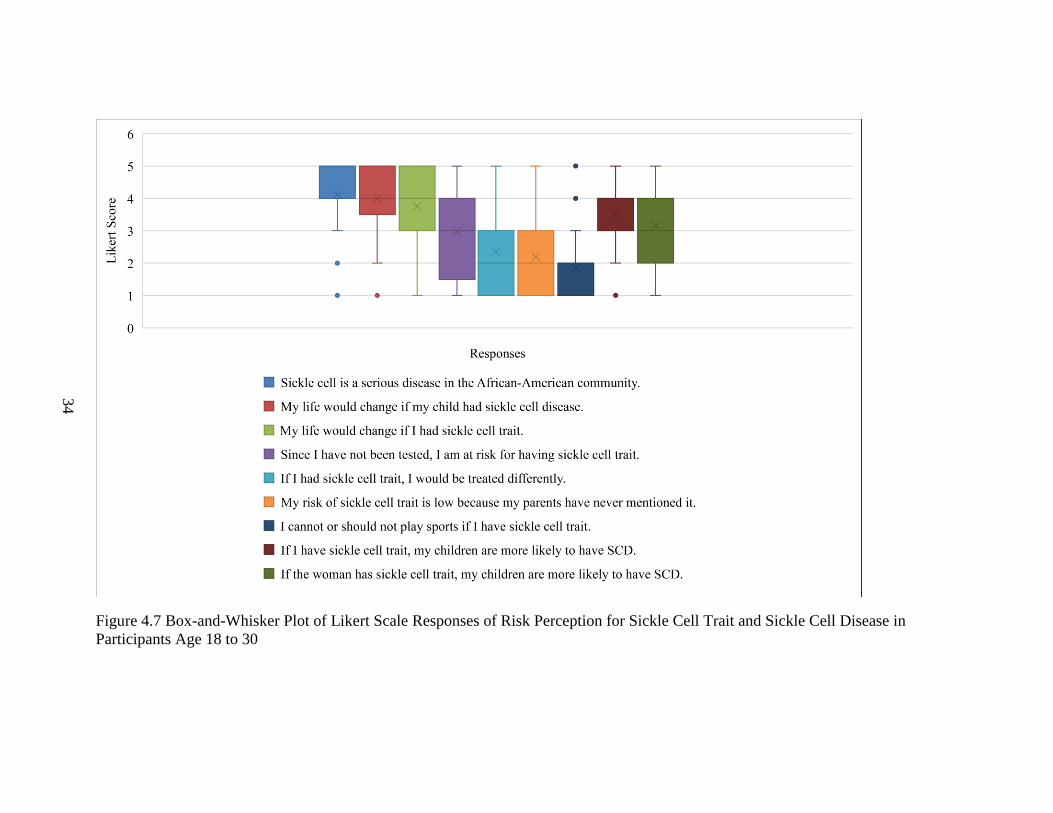
Two figures were constructed with the first displaying the risk and health
perception questions using box-and-whisker plot for each of the three age groups, and the
second figure displaying the statistically significant questions along with their p-values
(Figure 4.7, Figure 4.8, Figure 4.9, & Figure 4.10). A one-way ANOVA was conducted
to determine whether there were statistically significant differences in health and risk
perception questions and educational level. There were no statistically significant
34
Figure 4.7 Box-and-Whisker Plot of Likert Scale Responses of Risk Perception for Sickle Cell Trait and Sickle Cell Disease in
Participants Age 18 to 30

35
Figure 4.8 Box-and-Whisker Plot of Likert Scale Responses of Risk Perception for Sickle Cell Trait and Sickle Cell Disease in
Participants Age 31 to 49
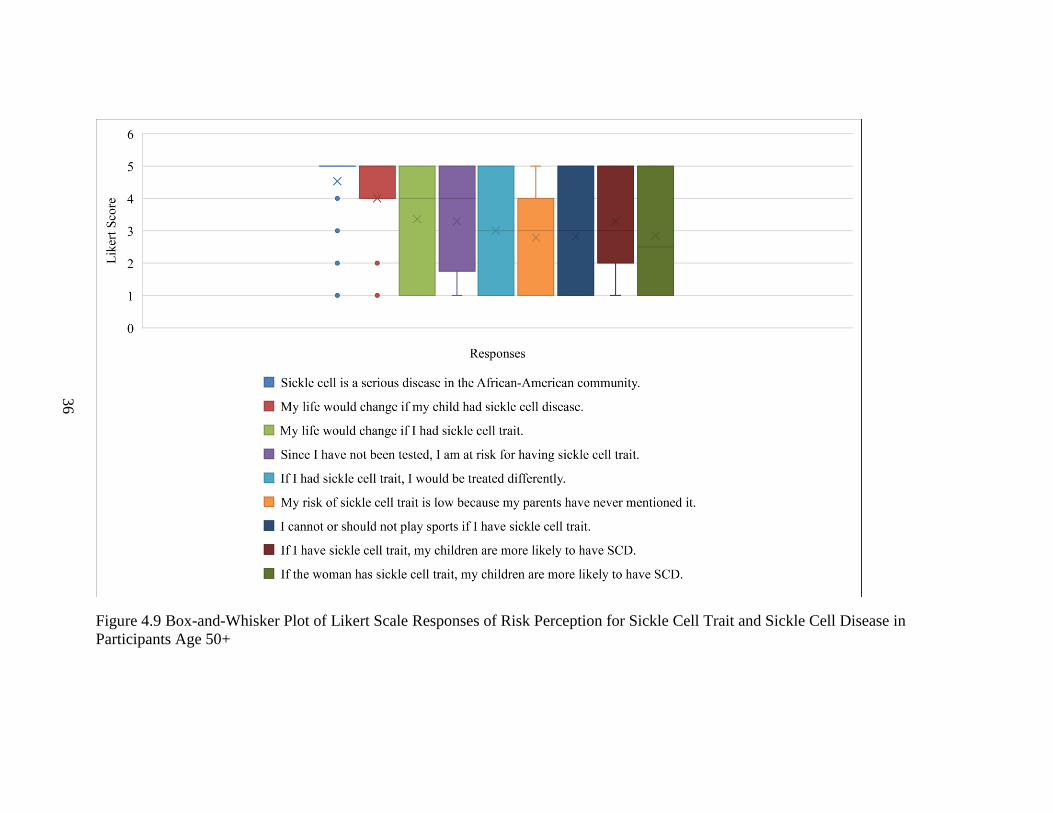
36
Figure 4.9 Box-and-Whisker Plot of Likert Scale Responses of Risk Perception for Sickle Cell Trait and Sickle Cell Disease in
Participants Age 50+

37
Figure 4.10 Observation of Statistically Significant Health and Risk Perception Questions
about Sickle Cell Trait vs. Age
0.05
0.04
0.008
0.016
0
0.01
0.02
0.03
0.04
0.05
P-value If I had sickle cell
trait, I would be
treated differently
My risk of sickle cell
trait is low because
my parents have
nevere mentioned it.
I cannot or should
not play sports if I
have sickle cell trait.
P-v
alues

38
differences in the way participants answered the questions based on education level
(p>0.05). (Table B.8).
Of the over 112 participants who answered survey questions on health beliefs,
87.6% of respondents agreed with the NCAA decision to test all college athletes for SCT
due to health concerns. Those same participants also agreed that any persons at risk for
SCT should be tested (95.6%). Approximately 76.8% of participants reported getting
annual check-ups with a physician. Overall, only 40.7% of participants reported having
tattoos or piercings (Figure 4.11).
A one-way ANOVA was conducted to determine whether there were statistically
significant differences in age groups and health beliefs regarding SCT and general health.
There was a statistically significant difference between the groups on questions regarding
having tattoos or piercings (p = 0.019) and getting annual check-ups with a physician (p=
0.010). All other questions were not statistically significant between the age groups
(p>0.05) (Table B.9 & Figure 4.12).
Lastly, a one-way ANOVA was conducted to determine whether there were
statistically significant differences in educational level and health beliefs regarding SCT
and general health. Analysis showed there were no statistically significant differences in
the way the participants answered based on their educational level (p>0.05) (Table B.10).
4.3 SPECIFIC AIM II: UNDERSTANDING BARRIERS AND MOTIVATING
FACTORS IN TESTING FOR SCT
Overall, the “Not applicable” category was chosen the most by participants when
asked about barriers to genetic testing (36.2%). The second largest barrier to testing was
reported to be doctors never mentioning SCT testing during health visits (29.3%). The

39
Figure 4.11Participant Responses to Health Belief Questions Regarding Sickle Cell Trait and General Health
Yes No
Do you agree with the National Collegiate
Athletic Association's decision to test
college athletes for SCT because of heath
concerns? n= 113
86.7 13.3
If a person is at risk for having sickle cell
trait, they should be tested? n= 11395.6 4.4
Do you have tattoos or piercings? n= 113 40.7 59.3
I get annual check-ups with a physician. n=
11276.8 23.2
0
20
40
60
80
100
120
Per
centa
ges
Answer

40
Figure 4.12 Observation of Statistically Significant Health Beliefs vs. Age
0.05
0.019
0.01
0
0.01
0.02
0.03
0.04
0.05
0.06
p-value Do you have tattoos or
piercings?
I get annual check-ups
(physical exam, bloodwork,
dental cleanings) with a
physician.
P-v
alues

41
third largest barrier reported was participants not feeling they were at risk based on their
family history (16.4%). Respondent reported the fourth largest barrier to testing involving
cost of SCT testing (11.2%). The other 27.5% of participants chose barriers including:
work time constraints (3.4%), a fear of needles (6.0%), no interest in testing (6.9%), fear
of discrimination from job or insurance companies (4.3%), and distrust of SCT testing
laboratories (6.9%) (Figure 4.13).
The largest motivating factor for genetic testing for SCT was reported to be
respondents wanting to know their status for their own health (58.6%). The second
largest motivator reported by participants was getting testing for their own or future
children’s health (31.9%). Approximately 23.3% of the participants when asked about
motivating factors cited they had already been tested. The fourth largest motivating factor
for genetic testing for SCT was being at a sickle cell health event (11.2%). The other
15.5% of participants chose motivating factors including: family history of SCT (6.9%),
pressure from partner or health professional to have testing (1.7%), and positive SCT
status of partner (6.9%) (Figure 4.14).

42
Figure 4.13 Barriers to Genetic Testing for Sickle Cell Trait
11.2
6.9
4.3
16.4
6.9
29.3
3.4
6
36.2
0 5 10 15 20 25 30 35 40
I could not afford it
Laboratories could use it for something without my knowledge
I do not want my insurance/job to know if I have sickle cell trait
No one in my family has it/ I am not at risk
I am not interested
My doctor has never mentioned it to me
I am too busy/cannot get time off from my job
I am afraid of needles
Not applicable
Percentages
Bar
rier
s

43
Figure 4.14 Motivating Factors to Genetic Testing for Sickle Cell Trait
58.6
31.9
6.9
1.7
6.9
11.2
23.3
0 10 20 30 40 50 60 70
I wanted to know for my own health
For my children’s/ future children’s health
Because my partner has sickle cell trait
I was pressured to do it by my partner or a medical professional
I am at risk because it runs in my family
I was at a sickle cell health event
I have already been tested
Percentages
Mo
tivat
ions

44
CHAPTER 5
DISCUSSION
5.1 SPECIFIC AIM I: ASSESSING AFRICAN-AMERICAN MEN’S KNOWLEDGE
AND PERCEPTIONS ON GENETIC TESTING, RISK, AND HEALTH WITHIN THE
CONTEXT OF SCT
Based on this study, it was hypothesized that there would be statistical differences
in knowledge of SCD and SCT based on age and education level. However, this research
can only accept part of the hypothesis since there was only a statistically significant
difference in the age groups and knowledge (Table B.1; Table B.2). There were no
statistically significant differences in knowledge, risk perception, and health beliefs based
on educational level (Table B.3; Table B.4; Table B.5). In Figure 4.6, there is a clear
downward trend in the data showing that younger participants are more knowledgeable
about SCT and SCD than their older counterparts. This could mean that healthcare
professionals and educators are getting better at communicating this information than
they have in the past.
When looking at the percent-correct on the “sickle cell quiz” there was one
striking feature. Over 92.2% of men knew that African-American/black people are more
often affected by SCD, while only 31% of men knew the national carrier frequency of
SCT was 1 in 12 (Table 4.2). This highlights there may be a discordance in perceived risk
versus the actual risk for SCT within this study population (Figure 4.2; Figure 4.11). It
seems as if the perceived risk for these individuals is being lessened by some unknown
45
factor. Given that none of the participants scored a 9 out of 9 on the sickle cell quiz,
perhaps this difference in perceived risk could be driven by the low health literacy on the
topic that still exists within the African-American male population, thus affecting the
reluctance, or refusal, to be tested for SCT, because these participants do not feel they are
at a high risk for being SCT carriers.
Overall, this study showed that African-American men are more likely to have not
been tested for SCT, which gives validity as to why this study was pursued (Figure 4.1).
However, the data shows that African-American men may be more willing to be tested
than previously thought because 98% of men in this study had never refused to be tested
for SCT (Figure 4.2). A majority of those who had been tested stated that they were
tested at birth or through the military, which makes sense given the historical background
of SCT testing. When observing the breakdown of the reasons participants had been
tested, it was interesting that participants were more likely not to have documentation
stating their status. The participants in this testing cohort stated they would tell their
partners their status; however, eight participants would not, or will not tell their partner
about their positive status. This could be evidence that there is still stigma within the
community about others knowing a person’s SCT status, as there are still feelings of fear
and rejection that could come from having a positive status. There is cause for
concern within NBS given the low number of individuals who could produce
documentation of their SCT status.
The main purpose of NBS for SCD, and ultimately SCT, was to identify and treat
individuals born with SCD and to bring awareness to carriers of SCT for their own
reproductive knowledge. Given that a majority of NBS programs began in the later 1980s

46
to early 1990s, it was expected that more participants would have known their status.
This highlights that there may need to be changes made in how we report and follow-up
with individuals who screen positive for SCT. In this study, a major influence uncovered
was that there was a significant difference between the age groups in their perceived risk
based on the parent report of SCT. This was mainly observed in the 31 to 49 age group
with those participants more likely to disagree that their risk of SCT was low because
their parents never mentioned their SCT status to them (Figure 4.6). The 18 to 30 and
50+ age groups were more likely to be neutral or agree with that statement respectively
(Figure 4.7 & Figure 4.8). The Kavanagh et. al. study in 2010 discussed the need to make
changes with how we follow-up with SCT and this present study adds to that sentiment. It
is more paramount than ever for people to be aware of their status with the associated
health concerns that have been discovered in recent years.
When comparing the other significant results from the Box and Whisker plots,
there was a significant difference in the ages when comparing perceived discrimination
with a positive test for SCT or SCD. It seems as if the 50+ age group trended more
towards agreeing that they would be treated differently if they had SCT, which could be
explained by those individuals being more likely to have been subjected to population
screening in the early 1970s (Figure 4.8). The 18 to 30 age groups were more likely to
disagree that they could not or should not play sports if they have SCT. This may be
explained by these individuals being subjected to the NCAA’s ruling on testing for SCT,
however, more research would be needed to make this proposed correlation (Figure 4.7).
When comparing the differences between other health beliefs, results showed that
age seemed to be the factor playing the most significant role (Table B.9). The questions

47
regarding getting annual checkups and having tattoos and/or piercings could be explained
by the beliefs held by the younger versus the older participants. Older participants may be
more likely to disagree with having tattoos and/or piercings and may go to the doctor
more regularly than the younger men in this study (Figure 4.12).
5.2 SPECIFIC AIM II: UNDERSTADING BARRIERS AND MOTIVATING
FACTORS IN TESTING FOR SCT
Overall, the barriers observed in this study highlight that over a third of
participants did not feel there were any barriers stopping them from being tested for SCT.
One interesting result from this section of the study shows that perhaps the men are
interested in pursuing testing, but have not been approached about it from their primary
healthcare provider. Normally, genetic counselors would be the individuals to order
genetic testing for SCT in adult patients, but primary healthcare providers, PCP, could be
another way to access testing. In Bean et. al’s (2014) study, they mention this exact
thought given that PCPs are more available to discuss and educate patients on SCT. It
was expected that a significant barrier would be participants not feeling as if they are at
risk given the observed disconnect in perceived risk versus actual risk of SCT in African-
Americans (Figure 4.13).
Perhaps negative family history is driving the risk perception as well, or these
participants are more knowledgeable about the inheritance of SCT and are not concerned
about the risk of SCD during a pregnancy. This could explain why more participants
were knowledgeable about the inheritance of SCT than they were about the inheritance of
SCD on the “sickle cell quiz” (Table 4.2). With motivating factors, it was surprising that
approximately 58.6% of participants were motivated to have testing for their own health

48
purposes. Perhaps this group of participants were more aware of the health concerns
related to SCT, given that 76.7% answered that they knew about the adverse events
associated with SCT. Most participants were concerned about the risk to pass on SCT to
their children and cited reproductive health as another motivating factor (Figure 4.14).
5.3 SPECIFIC AIM III: RECOGNIZING THE PRACTICE IMPLICATIONS FOR
GENETIC COUNSELORS
There are several different areas that seem to be more important in how to discuss
testing for SCT with African-American men, which has practice implications for genetic
counselors. Several of the barriers that were identified in this study could be assuaged
overall by tailoring the sessions in several ways including discussions on: G.I.N.A.
(Genetic Information Nondiscrimination Act) to lessen fears of discrimination at work or
through insurance companies, providing logistical information about the laboratory and
the testing process to decrease mistrust of SCT testing laboratories, and offering low cost
ways to be tested, such as through a local Sickle Cell Disease foundation. Some other
ways that genetic counselors may also want to tailor their sessions include explaining
more on the proposed evolutionary mechanism behind SCT to increase knowledge about
why it is so prevalent in the African-American population. Having a more developed
background knowledge about the disease may lessen the feeling of being targeted to have
testing that some African-Americans have expressed.
Focusing more on the potential health risks associated with SCT may also
increase the uptake of SCT testing as this study shows that there may be a desire to know
this information if it has an impact on their heath, or the health of their future children.
Overall, 21% of individuals in this study had seen a genetic counselor for SCT. Genetic

49
counselors have a special skill set that could be utilized to address the physical and
psychosocial barriers and motivating factors discussed within this study. Prenatal genetic
counselors would have a role in educating and increasing the knowledge of their African-
American patients regarding SCT and SCD. It highlights that if genetic counselors want
to work to improve the uptake of genetic testing for SCT, there may have to be changes
made in how African-American males are approached because they have different needs
that may need to be considered as a part of the decision-making process.
5.4 LIMITATIONS
This study has several limitations. Most of the participants who participated in
this study were in South Carolina and may not reflect those of African-American men in
other states. Additionally, the goal of this research was to study the beliefs of males aged
18 to 45, childbearing ages, but the study design was altered as there was difficulty
recruiting younger participants. Therefore, the results obtained from this study could be
skewed because it included the 50+ age group, who may have different views based on
the era they grew up in (i.e. during the civil rights movement when discrimination was a
more common occurrence). Most of the participants were recruited from sickle cell
events, which produces a major bias in the data collected from this study. It is possible
that those participants were more educated on SCD and SCT themselves as they may
have been carriers of SCT or had an affected family member, meaning it may not reflect
the true knowledge base level of African-American men who are not a part of that cohort.
This may explain why “not applicable” was the highest category chosen when asked if
participants had any barriers to genetic testing for SCT.

50
5.5 CONCLUSION
This study set out to understand the physical and psychosocial barriers that exist
within the African-American community in respect to genetic testing for SCT. Through
this research, some insightful information was identified that has implications for genetic
counselors who counsel patients on SCT. The knowledge obtained from this research
may aid genetic counselors in increasing the uptake of testing for SCT by tailoring their
sessions to focus on the needs of this group. Although there is still an issue with low
health literacy in the African-American community regarding SCD and SCT, there are
other confounding factors such as age, health beliefs, and perceived risk, which could
influence the decision-making for this population. Genetic counselors are going to be
vital in correcting and demystifying any misinformation in the community and educating
individuals on the potential health concerns regarding SCT.
This study identified public health concerns stemming from the follow-up and
communication of SCT results to those who screen positive for SCT. From this study, it
seems the needs of those individuals are not being met and may contribute to why some
African-Americans are unaware of their trait status. This study suggests a call to action
should be considered towards making changes to increase awareness of SCT and SCD
within the African-American community. Future research may include recreating this
study in states that have similar or different methods of communicating NBS results to
see how they compare to the results of this study. It may also be helpful to recreate this
study in different states to see if the results are comparable between African-American
men in other areas of the United States.

51
In conclusion, the hope is for this research to have an impact on understanding
what barriers exist within the African-American male community in genetic testing for
SCT and to provide representation to a population of vulnerable individuals whose voice
is often too weak to be heard. This study will likely assist genetic counselors and their
African-American patients with opening a dialogue that helps address their needs and
increase the uptake of SCT testing in African-Americans, not just for their reproductive
risk knowledge but for their overall health as well.

52
REFERENCES
Aloe, A., Krishnamurti, L., & Kladny, B. (2011). Testing of collegiate athletes for sickle
cell trait: what we, as genetic counselors should know. Journal of Genetic
Counseling, 20(4), 337-340. doi:10.1007/s10897-011-9366-9
Bean, C. J., Hooper, W. C., Ellingsen, D., DeBaun, M. R., Sonderman, J., & Blot, W. J.
(2014). Discordance between self-report and genetic confirmation of sickle cell
disease status in African-American adults. Public Health Genomics, 17(3), 169-
172. doi:10.1159/000360260
Bediako, S. M., Lanzkron, S., Diener-West, M., Onojobi, G., Beach, M. C., & Haywood,
C. (2016). The Measure of Sickle Cell Stigma: Initial findings from the Improving
Patient Outcomes through Respect and Trust study. Journal of Health
Psychology, 21(5), 808–820. http://doi.org/10.1177/1359105314539530
BeLue, R., Taylor-Richardson, K. D., Lin, J., Rivera, A. T., & Grandison, D. (2006).
African Americans and participation in clinical trials: differences in beliefs and
attitudes by gender. Contemporary Clinical Trials, 27(6), 498-505.
Bender, M.A., & Douthitt, S. G. Sickle Cell Disease. 2003 Sep 15 [Updated 2014 Oct
23]. In: Pagon RA, Adam MP, Ardinger HH, et al., editors. GeneReviews®
[Internet]. Seattle (WA): University of Washington, Seattle; 1993-2017. Available
from: https://www.ncbi.nlm.nih.gov/books/NBK1377/
Benson, J.M., & Therrell, B.L. (2010) History and current status of newborn screening
for hemoglobinopathies. Semin Perinatol. 34:134–44.

53
Boyd, J. H., Watkins, A. R., Price, C. L., Fleming, F., & DeBaun, M. R. (2005).
Inadequate community knowledge about sickle cell disease among African-
American women. Journal of The National Medical Association, 97(1), 62-67.
Ferrari, R., Parker, L. S., Grubs, R. E., & Krishnamurti, L. (2015). Sickle Cell Trait
Screening of Collegiate Athletes: Ethical Reasons for Program Reform. Journal
Of Genetic Counseling, 24(6), 873-877. doi:10.1007/s10897-015-9849-1
Frenette, P. S., & Atweh, G. F. (2007). Sickle cell disease: old discoveries, new concepts,
and future promise. Journal of Clinical Investigation, 117(4), 850–858.
http://doi.org/10.1172/JCI30920
Gallo, A. M., Wilkie, D., Suarez, M., Labotka, R., Molokie, R., Thompson, A., … &
Johnson, B. (2010). Reproductive decisions in people with sickle cell disease or
sickle cell trait. Western Journal of Nursing Research, 32(8), 1073–1090.
http://doi.org/10.1177/0193945910371482
Grosse, S. D., Odame, I., Atrash, H. K., Amendah, D. D., Piel, F. B., & Williams, T. N.
(2011). Sickle Cell Disease in Africa: A Neglected Cause of Early Childhood
Mortality. American Journal of Preventive Medicine, 41(6), S398–S405.
http://doi.org/10.1016/j.amepre.2011.09.013
Gustafson, S. L., Gettig, E. A., Watt-Morse, M., & Krishnamurti, L. (2007). Health
beliefs among African-American women regarding genetic testing and counseling
for sickle cell disease. Genetics in Medicine, 9, 303-310.
doi:10.1097/GIM.0b013e3180534282

54
Harris, K. M., Haas, T. S., Eichner, E. R., & Maron, B. J. (2012). Sickle cell trait
associated with sudden death in competitive athletes. The American Journal of
Cardiology, 110(8), 1185-1188. doi:10.1016/j.amjcard.2012.06.004
Haywood, C., Diener-West, M., Strouse, J., Carroll, C. P., Bediako, S., Lanzkron, S., …
& Beach, M. C. (2014). Perceived Discrimination in Health Care is Associated
with a Greater Burden of Pain in Sickle Cell Disease. Journal of Pain and
Symptom Management, 48(5), 934–943.
http://doi.org/10.1016/j.jpainsymman.2014.02.002
Housten, A. J., Abel, R. A., Lindsey, T., & King, A. A. (2016). Feasibility of a
Community-Based Sickle Cell Trait Testing and Counseling Program. Journal of
Health Disparities Research And Practice, 9(3), 1.
Jacobs, E. A., Rolle, I., Ferrans, C. E., Whitaker, E. E., & Warnecke, R. B. (2006).
Understanding African Americans' views of the trustworthiness of
physicians. Journal Of General Internal Medicine, 21(6), 642-647.
Jenerette, C. M., & Brewer, C. (2010). Health-Related Stigma in Young Adults with
Sickle Cell Disease. Journal of the National Medical Association, 102(11), 1050–
1055.
Jordan, L. B., Smith-Whitley, K., Treadwell, M. J., Telfair, J., Grant, A. M., & Ohene-
Frempong, K. (2011). Screening U.S. college athletes for their sickle cell disease
carrier status. American Journal of Preventive Medicine, 41(6 Suppl 4), S406-
S412. doi:10.1016/j.amepre.2011.09.014
Kavanagh, P.L., Wang, C.J., Therrell, B.L., Sprinz, P.G., Bauchner, H. (2008).
Communication of positive newborn screening results for sickle cell disease and

55
sickle cell trait: Variation across states. Am J Med Genet Part C Semin Med
Genet, 148C:15–22.
Kiryluk, K., Jadoon, A., Gupta, M., & Radhakrishnan, J.(2007). Sickle cell trait and gross
hematuria. Kidney International, 71(7), 706-10.
doi:http://dx.doi.org/10.1038/sj.ki.5002060
Lawrence, R. H., & Shah, G. H. (2014). Athletes' perceptions of National Collegiate
Athletic Association-mandated sickle cell trait screening: insight for academic
institutions and college health professionals. Journal of American College Health:
J Of ACH, 62(5), 343-350. doi:10.1080/07448481.2014.902840
Laerd Statistics (2017). Statistical tutorials and software guides. Retrieved from
https://statistics.laerd.com/
Luzzatto, L. (2012). Sickle Cell Anaemia and Malaria. Mediterranean Journal of
Hematology and Infectious Diseases, 4(1), e2012065.
http://doi.org/10.4084/MJHID.2012.065
Long, K. A., Thomas, S. B., Grubs, R. E., Gettig, E. A., & Krishnamurti, L. (2011).
Attitudes and beliefs of African-Americans toward genetics, genetic testing, and
sickle cell disease education and awareness. Journal of Genetic
Counseling, 20(6), 572-592. doi:10.1007/s10897-011-9388-3
Markel, H. (1992). The Stigma of Disease: Implications of Genetic Screening. Am J
Med, 93(2), 209-215.
Naik, R. P., & Haywood, C. (2015). Sickle cell trait diagnosis: clinical and social
implications. Hematology / the Education Program of the American Society of

56
Hematology. American Society of Hematology. Education Program, 2015(1),
160–167. http://doi.org/10.1182/asheducation-2015.1.160
Naik RP, Irvin MR, Judd S, et al: Sickle cell trait and the risk of ESRD in blacks. J Am
Soc Nephrol. 28(7), 2180-2187. doi: 10.1681/ASN.2016101086
Oliver, S., Dezateux, C., Kavanagh, J., Lempert, T., & Stewart, R. (2004). Disclosing to
parents newborn carrier status identified by routine blood spot screening. The
Cochrane Database of Systematic Reviews, (4), doi: CD003859
Pandey, N. (2015). Unusual presentation of ocular trauma in sickle cell trait. Indian
Journal of Ophthalmology, 63(9), 738–740. http://doi.org/10.4103/0301-
4738.170985
Piel, F. B., Patil, A. P., Howes, R. E., Nyangiri, O. A., Gething, P. W., Williams, T. N.,
… & Hay, S. I. (2010). Global distribution of the sickle cell gene and
geographical confirmation of the malaria hypothesis. Nature Communications, 1,
104. http://doi.org/10.1038/ncomms1104
Pitt, J. J. (2010). Newborn Screening. The Clinical Biochemist Reviews, 31(2), 57–68.
Platt, O. S., Brambilla, D. J., Rosse, W. F., Milner, P. F., Castro, O., Steinberg, M. H.,
Klug, & P. P. (1994). Mortality in Sickle Cell Disease—Life Expectancy and Risk
Factors for Early Death. New England Medical Journal, 330, 1639-1644. doi:
10.1056/NEJM199406093302303
Serjeant, G. R. (2013). The Natural History of Sickle Cell Disease. Cold Spring Harbor
Perspectives in Medicine, 3(10), http://doi.org/10.1101/cshperspect.a011783

57
Shavers, V. L., Lynch, C. F., & Burmeister, L. F. (2002). Racial differences in factors
that influence the willingness to participate in medical research studies. Annals of
Epidemiology, 12(4), 248-256.
Sickle Cell Disease (SCD): Data & Statistics. (2017). Retrieved from
https://www.cdc.gov/ncbddd/sicklecell/data.html
Spence, C. T., & Oltmanns, T. F. (2011). Recruitment of African-American men:
overcoming challenges for an epidemiological study of personality and
health. Cultural Diversity & Ethnic Minority Psychology, 17(4), 377-380.
doi:10.1037/a0024732
Tarini, B. A., Brooks, M. A., & Bundy, D. G. (2012). A policy impact analysis of the
mandatory NCAA sickle cell trait screening program. Health Services
Research, 47(1 Pt 2), 446-461. doi:10.1111/j.1475-6773.2011.01357.x
Treadwell, M. J., McClough, L., & Vichinsky, E. (2006). Using qualitative and
quantitative strategies to evaluate knowledge and perceptions about sickle cell
disease and sickle cell trait. Journal of The National Medical Association, 98(5),
704-710.
Westerman, M.P., Green, D., Gilman-Sachs, A., Beaman, K., Freels, S., Boggio, L.,
Allen, S., Schlegel, R. & Williamson, P. (2002), Coagulation changes in
individuals with sickle cell trait. Am. J. Hematol., 69: 89– 94.
doi:10.1002/ajh.10021

58
APPENDIX A
INSTITUTIONAL REVIEW BOARD APPROVAL LETTER

59
APPENDIX B
SUPPLEMENTARY DATA ANALYSIS TABLES
Table B. 1 Two-way ANOVA for Sickle Cell Quiz vs. Age Groups
Tests of Between-Subjects Effects
Dependent Variable: Total Correct on Sickle Cell Quiz
Source Type III Sum of
Squares df
Mean
Square F Sig.
Partial
Eta
Squared
Corrected Model 34.393a 6 5.732 3.007 0.009 0.144
Intercept 3125.714 1 3125.714 1639.736 0 0.939
q0034 34.393 6 5.732 3.007 0.009 0.144
Error 203.967 107 1.906
Total 4623 114
Corrected Total 238.36 113

60
Table B. 2 Two-Way ANOVA for Sickle Cell Quiz vs. Newly Defined Age Groups
Tests of Between-Subjects Effects
Dependent Variable: Total Correct on Sickle Cell Quiz
Source
Type III
Sum of
Squares
df Mean
Square F Sig. Partial Eta Squared
Corrected
Model 22.339a 2 11.17 5.739 0.004 0.094
Intercept 4239.795 1 4239.795 2178.576 0 0.952
AGE 22.339 2 11.17 5.739 0.004 0.094
Error 216.021 111 1.946
Total 4623 114
Corrected
Total 238.36 113

61
Table B. 3 Two-Way ANOVA for Sickle Cell Quiz vs. Education Level
Tests of Between-Subjects Effects
Dependent Variable: Total Correct on Sickle Cell Quiz
Source
Type III
Sum of
Squares
df Mean Square F Sig. Partial Eta
Squared
Corrected Model 13.127a 4 3.282 1.611 0.177 0.057
Intercept 3263.928 1 3263.928 1602.481 0 0.938
q0035 13.127 4 3.282 1.611 0.177 0.057
Error 215.9 106 2.037
Total 4481 111
Corrected Total 229.027 110

62
Table B. 4 One-Way Repeated Measures with ANOVA-Multiple Comparisons for Sickle Cell Quiz vs. Education Level
One-Way Repeated Measures with ANOVA-Multiple Comparisons
Dependent Variable: Total Correct on Sickle Cell Quiz
Bonferroni
(I) Education Level: (J) Education Level:
Mean
Difference
(I-J)
Std.
Error Sig.
95% Confidence
Interval
Lower
Bound
Upper
Bound
Some high school
High school graduate 0.3333 0.57449 1 -1.3137 1.9804
Some college -0.2432 0.55646 1 -1.8386 1.3521
College graduate -0.4348 0.5858 1 -2.1142 1.2447
Graduate/professional
school -0.6875 0.61798 1 -2.4592 1.0842
High school graduate
Some high school -0.3333 0.57449 1 -1.9804 1.3137
Some college -0.5766 0.36123 1 -1.6122 0.4591
College graduate -0.7681 0.40496 0.606 -1.9291 0.3929
Graduate/professional
school -1.0208 0.45026 0.254 -2.3117 0.2701
Some college
Some high school 0.2432 0.55646 1 -1.3521 1.8386
High school graduate 0.5766 0.36123 1 -0.4591 1.6122
College graduate -0.1915 0.37895 1 -1.278 0.8949
Graduate/professional
school -0.4443 0.42702 1 -1.6685 0.78
College graduate
Some high school 0.4348 0.5858 1 -1.2447 2.1142
High school graduate 0.7681 0.40496 0.606 -0.3929 1.9291
Some college 0.1915 0.37895 1 -0.8949 1.278

63
Graduate/professional
school -0.2527 0.4646 1 -1.5847 1.0793
Graduate/professional
school
Some high school 0.6875 0.61798 1 -1.0842 2.4592
High school graduate 1.0208 0.45026 0.254 -0.2701 2.3117
Some college 0.4443 0.42702 1 -0.78 1.6685
College graduate 0.2527 0.4646 1 -1.0793 1.5847

64
Table B. 5 Independent Samples Test for Sickle Cell Quiz vs. Educational Level (High school vs. College)
Independent Samples Test
Levene's Test for
Equality of Variances t-test for Equality of Means
F Sig. t df Sig. (2-tailed)
Total Correct
on Sickle Cell
Quiz
Equal
variances
assumed
0.024 0.877 -1.899 109 0.06*
Equal
variances
not assumed
-1.968 86.412 0.052
Independent Samples Test
t-test for Equality of Means
Mean
Difference
Std. Error
Difference
95% Confidence
Interval of the
Difference
Lower Upper
Total Correct
on Sickle Cell
Quiz
Equal
variances
assumed
-0.5385 0.28355 -1.10044 0.02352
Equal
variances
not assumed
-0.5385 0.27357 -1.08227 0.00535

65
Table B. 6 Pearson’s Product Moment Correlation for Yearly Income vs. Education Level
Pearson's Correlation
Education Level: Yearly
Income:
Education Level:
Pearson Correlation 1 .402**
Sig. (2-tailed) 0
N 111 102
Yearly Income:
Pearson Correlation .402** 1
Sig. (2-tailed) 0
N 102 106

66
Table B. 7 One-Way ANOVA for Perceived Risk and Discrimination vs. Age
ANOVA Table
Sum of Squares df Mean
Square
Sickle cell is a serious disease in the
African American community. *
Age
Between Groups (Combined) 3.935 2 1.967
Within Groups 115.688 111 1.042
Total 119.623 113
My life would change if my child
had sickle cell disease. * Age
Between Groups (Combined) 0.447 2 0.224
Within Groups 209.234 110 1.902
Total 209.681 112
My life would change if I had sickle
cell trait. * Age
Between Groups (Combined) 5.605 2 2.802
Within Groups 242.165 110 2.202
Total 247.77 112
Since I have not been tested, I am at
risk for having sickle cell trait. *
Age
Between Groups (Combined) 2.431 2 1.216
Within Groups 253.007 111 2.279
Total 255.439 113
If I had sickle cell trait, I would be
treated differently. * Age
Between Groups (Combined) 14.146 2 7.073
Within Groups 236.275 111 2.129

67
Total 250.421 113
My risk of sickle cell trait is low
because my parents have never
mentioned it. * Age
Between Groups (Combined) 17.034 2 8.517
Within Groups 184.335 108 1.707
Total 201.369 110
I cannot or should not play sports if
I have sickle cell trait. * Age
Between Groups (Combined) 16.676 2 8.338
Within Groups 212.386 110 1.931
Total 229.062 112
If I had sickle cell trait, my children
are more likely to have Sickle Cell
Disease. * Age
Between Groups (Combined) 1.123 2 0.562
Within Groups 193.131 111 1.74
Total 194.254 113
If a woman has sickle cell trait, my
children are more likely to develop
SCD. * Age
Between Groups (Combined) 3.006 2 1.503
Within Groups 200.933 111 1.81
Total 203.939 113

68
Table B. 8 One-Way ANOVA for Health and Perceived Risk vs. Education Level
ANOVA Table
Sum of Squares df Mean
Square F Sig.
Sickle cell is a serious disease
in the African American
community. * Education
Level
Between Groups (Combined) 0.053 1 0.053 0.048 0.827
Within Groups 118.138 108 1.094
Total 118.191 109
My life would change if my
child had sickle cell disease. *
Education Level
Between Groups (Combined) 0.001 1 0.001 0 0.983
Within Groups 203.669 107 1.903
Total 203.67 108
My life would change if I had
sickle cell trait. * Education
Level
Between Groups (Combined) 3.051 1 3.051 1.366 0.245
Within Groups 241.167 108 2.233
Total 244.218 109
Since I have not been tested,
I am at risk for having sickle
cell trait. * Education Level
Between Groups (Combined) 1.491 1 1.491 0.649 0.422
Within Groups 248.181 108 2.298
Total 249.673 109
If I had sickle cell trait, I
would be treated differently.
* Education Level
Between Groups (Combined) 3.759 1 3.759 1.695 0.196
Within Groups 239.514 108 2.218
Total 243.273 109
My risk of sickle cell trait is
low because my parents have
Between Groups (Combined) 1.715 1 1.715 0.889 0.348
Within Groups 204.535 106 1.93

69
never mentioned it. *
Education Level Total 206.25 107
I cannot or should not play
sports if I have sickle cell
trait. * Education Level
Between Groups (Combined) 0.514 1 0.514 0.254 0.615
Within Groups 216.202 107 2.021
Total 216.716 108
If I had sickle cell trait, my
children are more likely to
have Sickle Cell Disease. *
Education Level
Between Groups (Combined) 0.243 1 0.243 0.141 0.708
Within Groups 186.63 108 1.728
Total 186.873 109
If a woman has sickle cell
trait, my children are more
likely to develop SCD. *
Education Level
Between Groups (Combined) 0.013 1 0.013 0.008 0.931
Within Groups 191.841 108 1.776
Total 191.855 109

70
Table B. 9 One-Way ANOVA for SCT Health Beliefs vs. Age
ANOVA Table
Sum of
Squares df
Mean
Square F Sig.
If yes, do you have
documentation stating you
do not have sickle cell
trait? * Age
Between Groups (Combined) 1.179 2 0.589 2.472 0.098
Within Groups 9.298 39 0.238
Total 10.476 41
Were you told that you
have sickle cell trait? *
Age
Between Groups (Combined) 0.237 2 0.119 0.615 0.546
Within Groups 7.324 38 0.193
Total 7.561 40
If you had sickle cell trait,
would your partner be
aware of it? * Age
Between Groups (Combined) 0.027 2 0.014 0.087 0.917
Within Groups 5.748 37 0.155
Total 5.775 39
Have you ever refused
testing for sickle cell trait?
* Age
Between Groups (Combined) 0.016 2 0.008 0.444 0.642
Within Groups 1.949 111 0.018
Total 1.965 113
Have you or your partner
ever been to a genetic
counselor to test for sickle
cell trait? * Age
Between Groups (Combined) 0.445 2 0.223 1.323 0.271
Within Groups 17.657 105 0.168
Total 18.102 107

71
Do you agree with the
National Collegiate
Athletic Association's
decision to test college
athletes for sickle cell trait
because of health
concerns? * Age
Between Groups (Combined) 0.009 2 0.004 0.038 0.963
Within Groups 12.982 109 0.119
Total 12.991 111
If a person is at risk for
having sickle cell trait,
they should be tested? *
Age
Between Groups (Combined) 0.033 2 0.017 0.38 0.685
Within Groups 4.744 109 0.044
Total 4.777 111
Do you have tattoos or
piercings? * Age
Between Groups (Combined) 1.883 2 0.941 4.098 0.019
Within Groups 25.037 109 0.23
Total 26.92 111
I get annual check-ups
(physical exam,
bloodwork, and dental
cleanings) with a
physician. * Age
Between Groups (Combined) 1.629 2 0.815 4.812 0.01
Within Groups 18.281 108 0.169
Total 19.91 110

72
Table B. 10 One Way ANOVA for SCT Health Beliefs vs. Education Level
ANOVA Table
Sum of Squares df Mean Square F Sig.
If yes, do you have documentation
stating you do not have sickle cell
trait? * Education Level
Between Groups (Combined) 0.354 1 0.354 1.405 0.243
Within Groups 9.841 39 0.252
Total 10.195 40
Were you told that you have sickle
cell trait? * Education Level
Between Groups (Combined) 0.07 1 0.07 0.383 0.54
Within Groups 6.905 38 0.182
Total 6.975 39
If you had sickle cell trait, would
your partner be aware of it? *
Education Level
Between Groups (Combined) 0.001 1 0.001 0.004 0.952
Within Groups 6.358 37 0.172
Total 6.359 38
Have you or your partner ever
been to a genetic counselor to test
for sickle cell trait? * Education
Level
Between Groups (Combined) 0.407 1 0.407 2.637 0.107
Within Groups 15.747 102 0.154
Total 16.154 103
Do you agree with the National
Collegiate Athletic Association's
decision to test college athletes for
sickle cell trait because of health
concerns? * Education Level
Between Groups (Combined) 0.007 1 0.007 0.057 0.811
Within Groups 12.91 106 0.122
Total 12.917 107

73
If a person is at risk for having
sickle cell trait, they should be
tested? * Education Level
Between Groups (Combined) 0.097 1 0.097 2.742 0.101
Within Groups 3.755 106 0.035
Total 3.852 107
Do you have tattoos or piercings?
* Education Level
Between Groups (Combined) 0.032 1 0.032 0.129 0.72
Within Groups 26.042 106 0.246
Total 26.074 107
I get annual check-ups (physical
exam, bloodwork, and dental
cleanings) with a physician. *
Education Level
Between Groups (Combined) 0.038 1 0.038 0.21 0.648
Within Groups 19.175 106 0.181
Total 19.213 107

74
APPENDIX C
SUPPLEMENTARY FIGURES
Figure C.1 Breakdown of Study Participants’ Ages
3%
11%
15%
11%
10%
20%
30%18-19
20-24
25-30
31-36
37-42
43-49
50+

75
APPENDIX D
STUDY QUESTIONNAIRE
Greetings,
My name is Shandrea Foster and I am a genetic counseling student in the University of
South Carolina Genetic Counseling Program. You are being asked to participate in this
survey because you are an 18 year, or older, African-American/black male. The purpose
of this research is to gather insight into the challenges, health beliefs, and attitudes
towards sickle cell trait testing within the African-American male community.
If you decide to participate, this survey will take approximately 5 to 7 minutes to
complete. All survey responses collected are voluntary and anonymous, meaning no
information collected can be traced back to you. If there is a question you are
uncomfortable with answering, please skip it and continue on to the next question. By
completing this survey, you are consenting to its use within this study and any other
future academic meetings, presentations, or publications.
Each participant has the option to participate in a drawing which will include a chance to
win 1 of the 2 gift cards (Chick-Fil-A, Wal-Mart, Amazon, etc.) offered every month
from September to December of 2017.
To enter into the drawing, please write down your email address on the small sheet
attached to the survey. Return the small slip of paper with your email address and the
paper survey to the suite’s front desk or to the person who presented the survey to you.
Please tear this sheet away and keep it for your records. If you are a winner, look for an
email with the heading titled “USC SICKLE CELL SURVEY WINNER” from this email
address: [email protected].
If you have any questions, you may contact me at [email protected], or my
faculty supervisor at [email protected], or us both at (803) 545-5775. If
you have any questions about your rights as a participant, please contact the University of
South Carolina’s Office of Research Compliance at 803-777-7095.
Thank you for your consideration,
Shandrea Foster
(803) 545-5775

76
Assessing Health Literacy
Please circle the answer you think is correct.
1. Sickle cell disease (SCD) is caused by…
a) sexual transmission b) 2 altered genes passed from parents c) 1 altered gene passed
from the parent
d) a virus
2. Sickle cell trait (SCT) is caused by…
a) sexual transmission b) 2 altered genes passed from the parent c) 1 altered gene
passed from the parent
d) a virus
3. Individuals with sickle cell disease…
a) have pain crises b) get more infections c) can have organ damage
d) all of the above
4. Sickle cell disease most often occurs in….
a) boys b) girls c) black people d) white people
5. One out of every ______ African-Americans has sickle cell trait.
a) 1 out of every 12 people b) 1 out of every 60 people c) 1 out of every 1000
people
6. Sickle cell disease makes red blood cells…
a) round and soft b) stiff and round c) soft and sickle shaped d) hard
and sickle shaped
7. How can you tell if someone carries the gene for sickle cell trait or sickle cell disease?
a) they look sick b) they will eventually have sickle cell disease c) with a blood test
d) there is no way of e) none of the above
8. Individuals with sickle cell trait can have symptoms under extreme conditions, such as
when dehydrated or in low oxygen environments. a) True b) False
9. Sickle cell trait and sickle cell disease can be cured? a) True b) False
Risk and Health Perceptions:
On a scale of 1 to 5, please rate your level of agreement with the following statement.
1= strongly disagree; 2= mostly disagree; 3= neutral; 4= mostly agree; 5= strongly agree

77
Questions: Strongly Disagree 1 2 3 4 5 Strongly Agree
10. Sickle cell is a serious disease in the African-American community. 1 2 3 4 5
11. My life would change if my child had sickle cell disease. 1 2 3 4 5
12. My life would change if I had sickle cell trait. 1 2 3 4 5
13. Since I have not been tested, I am at risk for having sickle cell trait. 1 2 3 4 5
14. If I had sickle cell trait, I would be treated differently. 1 2 3 4 5
15. My risk of sickle cell trait is low because my parents have never mentioned it 1 2 3 4 5
16. I cannot or should not play sports if I have sickle cell trait. 1 2 3 4 5
17. If I have sickle cell trait, my children are more likely to have SCD. 1 2 3 4 5
18. If the woman has sickle cell trait, my children are more likely to have SCD. 1 2 3 4 5
Healthcare Aspects and Healthcare Professionals
Please answer yes or no to the following questions.
19. Have you ever refused testing for sickle cell trait? Yes No
20. Have you ever been tested for sickle cell trait? Yes No
If you answered no to question 20, please skip questions 21, 22, 23, and 24. Then continue to
question 25.
If you answered yes to question 20, please answer questions 21, 22, 23, and 24. Then continue
to question 25.
21. If yes, why were you tested? Please circle all that apply.
During partner’s pregnancy Sports Personal health reasons Military Tested at birth
Other
22. If yes, do you have documentation stating you do not have sickle cell trait? Yes No
23. Were you told that you have sickle cell trait? Yes No
24. If you had sickle cell trait, would your partner be aware of it? Yes No
25. Have you or your partner ever been to a genetic counselor to test for sickle cell trait? Yes
No
26. Do you agree with the National Collegiate Athletic Association’s decision to test college
athletes for sickle cell trait because of health concerns? Yes No

78
27. If a person is at risk for having sickle cell trait, they should be tested? Yes No
28. Do you have tattoos or piercings? Yes No
29. I get annual check-ups (physical exam, bloodwork, and dental cleanings) with a physician.
Yes No
Barriers to Testing
30. I refused in the past or will not get testing because: Circle all that apply
a) I could not afford it
b) Laboratories could use it for something without my knowledge
c) I do not want my insurance/job to know if I have sickle cell trait
d) No one in my family has it/ I am not at risk
e) I am not interested
f) My doctor has never mentioned it to me
g) I am too busy/cannot get time off from my job
h) I am afraid of needles
i) Not applicable
Motivations to Testing
31. I received genetic testing or will in the future because: Circle all that apply
a) I wanted to know for my own health
b) For my children’s/ future children’s health
c) Because my partner has sickle cell trait
d) I was pressured to do it by my partner or a medical professional
e) I am at risk because it runs in my family
f) I was at a sickle cell health event
g) I have already been tested
Demographic Information of Questionnaire:
Please circle the one that most represents you.
32. Age: 18-19 20-24 25-30 31-36 37-42 43-49 50+
33. Education Level:
Some high school High school graduate Some college
College graduate Graduate/professional school
34. Yearly Income:
less than $10,000 $10,000- $20,000 $20,000- $30,000
$30,000- $40,000 $40,000- $50,000 $50,000- $100,000 $100,000 +

79
35. Relationship Status: Married Single In a relationship
36. Number of Children: 0 1 2 3 4 5 or more