Understanding Bank Runs: Do Depositors Monitor...
30
Understanding Bank Runs: Do Depositors Monitor Banks? Rajkamal Iyer, Manju Puri and Nicholas Ryan * August 27 th , 2012 Abstract We use unique, depositor-level data for a bank that faced a run due to a shock to its solvency to study whether depositors monitor banks. Exploiting the timing of both private and public information releases, we examine the importance of private monitoring by depositors. We find that depositors with uninsured balances, depositors with loan linkages and staff of the bank are the first to withdraw. Depositors are also more likely to withdraw if other depositors in their network have already done so. However, most of the depositor response is coordinated just around regulatory actions. Our results give sharp empirical evidence on the importance of fragility in a bank’s capital structure and have important implications for bank regulation. * Rajkamal Iyer: MIT, 50 Memorial Drive, Cambridge02142. Email: [email protected]. Manju Puri: Fuqua School of Business, Duke University, 1 Towerview Drive, Durham NC27708, and NBER. Email: [email protected]. Nicholas Ryan: MIT, 50 Memorial Drive, Cambridge02142. Email: [email protected]. We are grateful to Mr. Gokul Parikh and the staff of the bank for all their help.
Transcript of Understanding Bank Runs: Do Depositors Monitor...

Understanding Bank Runs: Do Depositors Monitor Banks?
Rajkamal Iyer, Manju Puri and Nicholas Ryan*
August 27th, 2012
Abstract
We use unique, depositor-level data for a bank that faced a run due to a shock to its
solvency to study whether depositors monitor banks. Exploiting the timing of both private
and public information releases, we examine the importance of private monitoring by
depositors. We find that depositors with uninsured balances, depositors with loan
linkages and staff of the bank are the first to withdraw. Depositors are also more likely to
withdraw if other depositors in their network have already done so. However, most of the
depositor response is coordinated just around regulatory actions. Our results give sharp
empirical evidence on the importance of fragility in a bank’s capital structure and have
important implications for bank regulation.
* Rajkamal Iyer: MIT, 50 Memorial Drive, Cambridge-‐02142. Email: [email protected]. Manju Puri: Fuqua School of Business, Duke University, 1 Towerview Drive, Durham NC-‐27708, and NBER. Email: [email protected]. Nicholas Ryan: MIT, 50 Memorial Drive, Cambridge-‐02142. Email: [email protected]. We are grateful to Mr. Gokul Parikh and the staff of the bank for all their help.
I. Introduction
Do depositors monitor banks? Are some depositors better at monitoring than others? To
what extent do depositors distinguish fundamental shocks to bank solvency from
irrelevant noise? Answering these questions is important to understanding the role of
fragility in the bank capital structure and making sound regulation. Leading theories of
banking emphasize the importance of fragility—the possibility of liquidation by
depositors—as a commitment mechanism for banks (Calomiris and Kahn, 1991;
Diamond and Rajan, 2001). Calomiris and Kahn (1991) argue that the ability of
depositors to withdraw deposits on demand provides incentive for informed depositors to
monitor banks and trigger a run if the bank is likely to expropriate depositor funds.
Diamond and Rajan (2001) argue that the threat of runs commits banks to share rents that
accrue through their loan-collection skills, facilitating liquidity creation. While these
theories emphasize how bank fragility solves agency problems, bank runs may be costly
ex post for an individual bank or even ex ante, from the perspective of the whole financial
system (Kaufman, 1994; Calomiris and Mason, 2003). Fragility allows panics,
unjustified runs that lead to the failure of solvent but illiquid banks (Diamond and
Dybvig, 1983).
In this paper, we study bank fragility using micro-level depositor data for a bank in India
that experienced runs after a shock to its solvency. The bank experienced a deterioration
in asset quality over time and was subject to runs during and after a regulatory
intervention that ultimately placed the bank in receivership. We exploit the release of
private and public information during this failure to examine the behavior of different
classes of depositors and the timing of their withdrawals. The time line we exploit is the
following. The bank has a build-up of bad loans. This build-up is followed by an audit
by the central bank, which is private information and documented the bank’s negative net
worth. This audit is followed, after several months, by public regulatory action wherein
the central bank imposes severe restrictions on the bank’s activity. We first examine
what classes of depositors run when there is a public release of information regarding
regulatory action. We particularly focus on the behavior of depositors with balances

above the deposit insurance limit. We also examine whether other depositor
characteristics like the length of the relationship with the bank or loan linkages with the
bank affect behavior. Finally we study the strength and timing of liquidation by insiders.
We find that there is larger run by depositors immediately following the disclosure of
regulatory action against the bank. Uninsured depositors are far more likely to run than
insured depositors. The magnitude of runs by depositors that are insured is modest,
despite the fact that there are large delays in settlement of deposit insurance claims. We
also find that depositors that have loan linkages with the bank or who are bank staff, i.e.
insiders, are more likely to run. Depositors are more likely to run if a member of their
network has already done so; the effect of having a network member run on own
liquidation is as large as the effect of being on the bank staff. Depositors with a longer
relationship with the bank are less likely to run.
We then examine the behavior of depositors before the public release of information. We
find that there is a silent run prior to regulatory action that is driven by uninsured
depositors, depositors with loan linkages and staff members. The overall magnitude of
this advance run, which begins immediately after the regulatory audit, is smaller than that
after the public release of information. A regulatory audit can be a precursor to
regulatory action and the conduct of this audit was information only available, in
principle, to the bank. Note that though the financial information about non-performing
assets was available in the prior annual report of the bank, we do not find any significant
withdrawals before the regulatory audit. The observed depositor monitoring is strictly
complementary to regulatory intervention.
The results show that uninsured depositors and depositors with loan linkages are the most
responsive to information regarding bank solvency. The important question that arises is:
would depositors have taken the same action in response to a non-fundamental shock or
panic? If these depositors, simply run because they have more to lose, in response to any
shock, it would be difficult to argue that they monitor the bank.
We examine this question by studying a prior, non-fundamental shock at the same bank.
Eight years prior to the fundamental shock, the bank we are studying faced a run due to
the failure of another large bank in the same city, which had illegally loaned money to a
stock trader for a great loss. Our bank had no fundamental linkages to the failed bank
and experienced a run for only a few days following this prior shock. We use this shock
as the counter-factual of a panic or non-fundamental shock and examine whether the
behavior of uninsured depositors and depositors with loan linkages differed across the
two shocks. We find weaker runs by uninsured depositors immediately after the non-
fundamental shock, as compared to the fundamental shock. Depositors with loan linkages
are actually less likely to run than other depositors in the non-fundamental shock.
Uninsured depositors and depositors with loan linkages are thus more likely to run when
there is a shock to a banks’ solvency as against a non-fundamental shock or panic.
To address the concern that unobservable characteristics of depositors may be correlated
with being uninsured or with loan linkages, we estimate the determinants of running
amongst the pool of depositors that held accounts during both shocks. We find that
uninsured depositors are much more likely to run in a fundamental shock and that this
difference is robust to adding depositor fixed effects. In the same constant sample we
also find that depositors with loan linkages are more likely to run in a fundamental shock.
This constant sample is subject to a survivorship bias, in that any depositor present in the
constant sample saw the bank survive the first, non-fundamental shock and still kept
some deposits at the bank. We expect this bias would in fact make these depositors less
likely to run in the later shock, but we estimate both uninsured and loan-linked depositors
as more likely to do so.
Our results can inform banking regulation. Deposit insurance policies across the world
have been primarily set up to reduce fragility in the banking system. While these policies
help in mitigating depositor panic, our results suggest that insurance reduces the extent of
monitoring. For banks, such as many community or cooperative banks, where a large
fraction of depositors are small, the monitoring role of depositors is limited and the task
of ensuring bank solvency may lie entirely with regulators.

Our results also hold relevance for the debate on narrow banking proposals and
regulatory policies regarding cross-selling products. We find that loan relationships help
depositors monitor banks somewhat better. Thus having banks perform both deposit
taking and lending under the same umbrella could improve monitoring.
Our results contribute to the literature on banking by providing empirical evidence on the
effects of fragility. Models of banking highlight the fragile bank capital structure as
necessary to induce depositor monitoring and to overcome agency problems (e.g.,
Calomiris and Kahn, 1991; Diamond and Rajan, 2001). Fragility can have aggregate
consequences (Allen and Gale, 2000). We find monitoring by uninsured depositors,
consistent with the canonical models of banking, but it is driven by regulatory action and
limited in extent; even uninsured depositors do not approach complete liquidation. We
do not observe what monitoring would have been in a laissez faire environment where
depositors had to gather information themselves.
On the extent of monitoring, the run in response to the fundamental shock was somewhat
narrower but deeper than during the panic. The overall difference between the events is
small despite distinct responses to the shocks for some depositor classes. Even after the
public release of information about solvency risk, we find that a large fraction of
depositors do not run. This suggests that depositors’ signals are very coarse and the costs
of fragility high (Diamond and Dybvig, 1983). The majority of depositors rely on public
release of regulatory action as a coordination mechanism, as in the global games
literature on bank runs and currency attacks (Morris and Shin, 1998, 2002; Angeletos,
Hellwig and Pavan, 2007).
The rest of the paper is structured as follows. Section II discusses the bank and the
timing of the shocks studied. Section III introduces the data on depositors and defines
variables used in the empirical analysis. Section IV contains the empirical results on how
depositor characteristics relate to liquidation during the fundamental shock, both before
and after the public release of information, and during the non-fundamental shock.

Section V concludes by discussing how the results of this study bear on theories of
banking.
II. Institutional Environment and Event Description
A. Institutional Details
The Indian banking system consists mainly of public sector banks, private banks and
cooperative banks. The Reserve Bank of India (RBI) is the main regulatory authority of
the banking system and monitors bank portfolios and capital requirements for all three
types. Cooperative banks, additionally, are supervised by the state government on
matters of governance.
Deposit insurance exists but coverage is incomplete and claims can be difficult to make.
The Deposit Insurance and Credit Guarantee Corporation, part of the RBI, provides
deposit insurance up to INR 100,000 (roughly USD 2,500) for each depositor at a bank.
The deposit insurance is funded by a flat premium charged on insured deposits and
required to be borne by the banks themselves. Though deposit insurance is present, there
are several delays in processing the claims of depositors. The central bank first suspends
convertibility when a bank approaches failure and then takes a decision of whether to
liquidate a bank or arrange a merger with another bank. During this period depositors are
allowed a one-time nominal withdrawal up to a maximum amount that is stipulated by the
central bank.1 If a bank fails, the deposits held by a depositor cannot be adjusted against
loans outstanding. The stipulated cash reserve ratio and statutory liquidity ratio to be
maintained by the banks are 5.5% and 25% respectively.2
Cooperative banks are not different in kind than banks with other ownership structures.
Depositors of cooperative banks are not required to hold an equity claim in the bank. Any 1 In most cases, depositors are allowed a withdrawal of up to Rs. 1,000 (25$) per account. 2 The Statutory Liquidity Ratio (SLR) is the minimum allowable ratio of liquid assets, given by cash, gold and unencumbered approved securities, to the total of demand and time liabilities.

depositor can avail of a loan from the bank and potential borrowers are not required to
open a deposit account when taking a loan. Shareholders of cooperative banks have
limited liability and generally do not receive dividends.3 Thus the nature of cooperative
banks does not select depositors with different characteristics than at banks with other
ownership structures. Community banks are the closest analogues to cooperative banks
in the United States and play an important role in the U.S. economy (Kroszner, 2007).4
B. Event Description
We now turn to the description of the event that we study in this paper. The Bank we
study functioned well until 2005. Thereafter, the management changed and the bank took
heedless and possibly corrupt risks. In May 2007 an RBI inspection privately noted that
the bank had introduced proscribed insurance products and made two unsecured loans far
in excess of the exposure ceiling. These two loans totaled INR 230 million (USD 6m) or
60% of the bank’s total non-performing assets as of March 31, 2008. The main
precipitating event for the bank’s collapse was the non-performance of these large loans.
After a routine inspection for the financial year showed the poor state of the bank’s
finances, the RBI brought the bank under greater scrutiny and conducted a further audit
of the bank’s books in November, 2008. In response to the findings of the audit, in a
letter received by the bank on January 5, 2009, the central bank ordered restrictions on
3 The bank issues shares at face value. To be a borrower the bank, the bank asks a depositor to buy shares worth 2% of loan amount which can be redeemed at face value at the end of the loan. In general dividends are not paid by the bank as reserves are used to build up capital to meet capital-adequacy requirements. 4 In a speech on March, 5, 2007, Federal Reserve Governor, Randall Kroszner states, “Community banks play an important role in the United States economy, as they have throughout our history…many community banks continue to thrive by providing traditional relationship banking services to members of their communities. Their local presence and personal interactions give community bankers an advantage in providing financial services to those customers for whom, despite technological advances, information remains difficult and costly to obtain...I believe that the most significant characteristics of community banks are: 1) their importance in small-business lending; 2) their tendency to lend to individuals and businesses in their local areas; 3) their tendency to rely on retail deposits for funding; and 4) their emphasis on personal service.” Cooperative banks display the same four significant characteristics as community banks.
bank activity including the partial suspension of convertibility. Depositors were
prevented from prematurely liquidating their term deposits. There was no restriction on
withdrawals from transaction accounts. The bank was also forbidden to take new
deposits, make new loans or pay dividends. Note that the audit by the central bank was
private information and not revealed to the depositors. However, the balance sheets of
the bank in 2007 and 2008 reflected the deteriorating condition of its loans. On May
13th, 2009, the central bank finally decided that the bank should be placed under
receivership and mandated a withdrawal limit of INR 1,000 for all depositors. There were
long delays in processing the deposit insurance claims. This crisis occurred in an
otherwise good economic environment. The state economy grew by just over 9% during
the year the bank was under scrutiny. No other banks that failed during the event
window. Other banks in the region were gaining deposits. The failure was idiosyncratic
in nature and not due to weak economic fundamentals.
The aggregate pattern of withdrawals by depositors is presented in Figure 1. Prior to the
RBI inspection on November 4, 2008, transaction balances had been largely stable over
the fiscal year to date. After the regulatory audit by the central bank there is a gradual but
significant run, in which deposits decline 16% from November 4th, the date of the audit,
to January 27th. On January 28th, newspapers reported on the regulatory action against
the bank including partial suspension of convertibility. In the week following this public
release of information there is a large run on the bank and transaction balances decline by
a further 25%. In Section IV we study the behavior of individual depositors over this
event window using micro data
III. Data
We obtain administrative data from the bank that experienced the above crisis in 2009
and had also been subject to a prior run, not related to its fundamentals, in 2001. This
bank had seven branches around the city at the time of the 2001 shock and had opened
one more by 2009. The data record all deposit balances, transactions and loans from
January 2000 through December 2005 and from April 2007 through June 2009. The

bank changed its database format and computer system in the interval between these
periods and so identifiers and variable definitions do not necessarily line-up across the
two events. We note the few instances when this change may affect the analysis in the
Section [Empirical Results].
Transaction accounts are defined as current (checking) or savings account types, both of
which hold demandable deposits. Daily transaction-account balances are directly
available from the bank’s database for the later period. For the earlier period, daily
balances are calculated from monthly balance and daily transactions files at the account
level. We test the reliability of this calculation by matching balances at month-end to the
opening balance the next month for the same account.
Liquidation in the cross-section is defined as the withdrawal of 50% of transaction
balances over the 7 days beginning the day before the shock. (We will often refer to this
group as “runners,” as opposed to “stayers,” and will vary this definition as a robustness
check.) We also estimate hazard models, at a daily frequency, in which liquidation is
defined as the withdrawal of 50% of transaction balances in any single day. Transaction
balances 90 days prior to the shock (120 days in hazard specifications) are used to
measure ex ante depositor liquid assets and to group depositors into asset categories. To
measure past account activity, we use the share of days over the year prior to the
information release, excluding the 90 days immediately prior, on which the depositor had
a transaction. Account age is defined as the duration an account has been opened in years
as on the date of the shock, (either March 13th, 2001, for the non-fundamental shock or
January 27th, 2001 for the fundamental shock). We top-code account age at seven years,
as the age of accounts older than seven years were apparently not recorded or missing
when the bank computerized its records.
Family identifiers and depositor loan linkages are defined based on depositor surnames
and addresses. We compare each depositor to all others based on surname and address to

classify them as belonging to families.5 We also have data on borrowers from the bank.
We define loan linkages for depositors by matching on customer surname and address.
Accounts are compared on surname and address using the same criteria as the family
match and taken as belonging to the same customer if there is a match. Depositors
matched in this manner are defined as having a loan linkage in each crisis if they, or any
member of their family, have a loan outstanding with the bank on the date of each run.
The definition of loan linkage excludes overdraft accounts against fixed deposits as such
accounts may impose restrictions on the withdrawal of deposits. Staff members hold
distinct account types. We define depositors as having a staff linkage if either they
themselves or a member of their family holds a staff account type.
We define the introducer network of depositors based on depositor references when
opening an account. It is commonplace in India for banks to ask a person opening
account to be introduced by an acquaintance who already holds an account with the same
bank (Iyer and Puri, 2012). The main purpose of the introduction is to establish the
identity of the new depositor, in the absence of widespread proof of identity, and the
introducer does not incur liability or receive any incentives from the bank. We define a
depositor’s introducer network as consisting of anyone who introduced that depositor,
anyone introduced by the same person as that depositor, and anyone that the depositor
himself or herself introduced. This definition is undirected or reciprocal in that each
depositor is a member of the network of those who belong to their network. During the
long event window of 90 days before to 30 days after each run we define a dummy
variable equal to one if any member of a depositor’s introducer network has liquidated
their balance to date.
5 We calculate the ratio R = 1 – L / MaxOps, where L is the Levenshtein edit distance between strings, the minimal number of character operations required to change one string into another, and MaxOps the maximum number of character operations that could be required to change one string into another given the lengths of each. Accounts are declared as linked if RSurname > 0.75 and RAddress > 0.80 for the surname and address, respectively; we consider this criteria fairly conservative.

Some specifications use data on depositors present during both runs. This constant
sample is determined using a match on depositor name, surname and address. This match
uses the same principle as described above.
IV. Empirical Results
A. Liquidation After the Public Information Release
The tendency of depositors to withdraw after the public information release depends
strongly on depositor characteristics. Table [1] shows summary statistics for all
depositors and by liquidation status, comparing the characteristics of those depositors that
withdrew more than 50% of their transaction balance over the week beginning at the
information release to those that did not. Amongst all 29,852 depositors, 3.9% liquidate
their accounts during the run week. This share of runners is similar to that reported by
Iyer and Puri (2012). On average, depositors hold a transaction balance of Rs. 5,460 and
about one percent have a balance above the deposit insurance limit of Rs. 100,000. With
respect to additional relationships with the bank, 1.5% of depositors have a loan linkage
and 3.2% of depositors have a staff linkage. Account activity is generally modest, with
any transaction on 1.5% of days and an unconditional mean transaction size of about Rs.
140.
Runners and stayers differ significantly on all observable dimensions. Runners have
transaction balances seven times larger than stayers, are ten times more likely to have
balances above the deposit insurance limit, and are much more active in terms of number
and size of transactions. Runners have held their accounts for about a year less. Runners
are much more likely to have a loan or a staff linkage. That depositors with loan linkages
are more likely to run is different from that reported in Iyer and Puri (2012). The run
studied in this paper was precipitated by a fundamental shock to the solvency of the bank
studied, in contrast to that studied by Iyer and Puri, which studies a panic. We
investigate below the extent to which the difference in the nature of the shock may cause
the differences in withdrawal behavior by depositors with loan linkages.
Table [2] shows the magnitude of the run broken out by the level of transaction balance
during the fundamental shock in 2009, where balance is defined 90 days prior to the
public release of information. Panel A shows the share of depositors liquidating and the
mean amount of their withdrawals during the run week, from the public release of
information until 7 days after. Of depositors with balances above the insurance limit,
29% ran during the run week, withdrawing an average of Rs. 54,283, as compared to 9%
of depositors with balances above Rs. 1,000 but below the insurance limit of Rs. 100,000.
Panel B broadens the event window to include the 90 days leading up to the run. In this
broader window, which includes the regulatory inspection of the bank, fully 65% of
depositors above the insurance limit liquidate, on average taking Rs. 155,146 out of the
bank. Again, this is far higher than the 17% of depositors with middling balances that
liquidate.
During the run week, we use both linear probability and probit models for the likelihood
of liquidation to test the relationships suggested by Tables [1] and [2] in a multivariate
framework. We apply the linear probability model, though liquidation is a binary
outcome, in part because it allows the inclusion of a large number of fixed effects in later
specifications that use data on depositors present in both shocks.
The estimates in Table [3] support the conclusions of the earlier tables. Columns (1) and
(2) show linear probability models, and (3) and (4) the marginal effects from comparable
probit models. The earlier column in each pair has a linear control for transaction
balances and the latter column has dummies for balance categories. Looking at column
(1), depositors with loan linkages are 4.4 percentage points more likely to run, which is
significant at the five-percent level. Recall that about four percent of depositors run, so
this is an effective doubling of the tendency to liquidate. Each additional year of a
depositor having an account with the bank decreases the tendency to run by about 0.66
percentage points. Being a staff member increases the tendency to run by over two
percentage points, consistent with staff having better information about the fundamentals
of the bank. A one-standard deviation (About Rs. 32,000) increase in transaction

balances prior to the run increases the tendency to liquidate by 0.00055 x 32 = 1.8
percentage points, comparable to the effect of being a member of bank staff. The
magnitude of these effects is generally steady across the specifications shown and in
alternative specifications where liquidation is defined as withdrawal of 25 or 75 percent
of balances instead of 50 percent (not shown).
Columns (2) and (4) show that the effect of balance is coming largely through depositors
with balances above the insurance limit, who are about twenty percentage points more
likely to run than the omitted category of depositors holding less than Rs. 1,000 in
balance. Depositors with high balances may be better informed and also stand to lose
more in the event of a failure due to temporary loss of funds below the insurance limit
and permanent loss above the limit. The incentive to withdraw is in principle continuous
around Rs. 100,000, as depositors with balances just above the limit remain mostly
insured. Alternative specifications (not shown) test for a discontinuity at the insurance
limit and indeed do not find evidence that liquidation changes discretely at that point.
Depositor balances and relationships with the bank are important, robust correlates of the
tendency to run. The decision to withdraw is a function of the probability of failure and
how much depositors stand to lose in such a failure. Consistent with their relationships
providing more information about the bank, depositors with loan linkages and staff
linkages are more likely to withdraw during the run. Depositors with higher balances,
who may also have better information about fundamentals and have stronger incentives to
withdraw, are far more likely to run. Recall that balances above Rs. 1,000 may receive
insurance payouts only after a significant delay and that balances above Rs. 100,000 are
not insured. Exposure above this insurance limit is the single strongest predictor of
liquidation.
B. Liquidation Prior to the Public Information Release
The models above considered liquidation in cross-section after the public release of
information. As balances, shown in Figure [1], declined significantly prior to the public

release of information, it is important to consider withdrawals over a broader window
leading up to the run.
To measure how depositors react to the release of information over time, we estimate
Cox hazard models, both strictly proportional and with time-varying coefficients. Failure
is defined as withdrawal of 50% of balances during any given day. As the likelihood of
transactions on any given day is very low, this definition in practice is not dissimilar to
the definition employed in the cross-section of withdrawal of 50% over the run week.
We exclude depositors with balances less than Rs. 100 as of 120 days before the run to
make the model easier to estimate by maximum likelihood. As these accounts have low
activity, we expect the omission to have little effect, but the omitted category for balances
in the hazard models should be taken as Rs. [100,1000). The model with time-varying
coefficients holds the ex ante characteristics of depositors fixed over the event window,
from 120 days before to 30 days after the shock, and estimates how the effects of these
characteristics change over time. This model specifies the hazard as:
Λi(t) = Λ0(t) exp{ β1(t) AccountAgei + β2(t) StaffLinkagei + β3(t) LoanLinkagei +β4(t)
NetworkMemberHasRunit + β5(t) Bal1kTo100ki + β6(t) BalAbove100ki + β7(t)
DailyTransactionsi }.
The only difference from the baseline Cox proportional hazard model is that each
coefficient is allowed to vary over time. Each time-varying coefficient is modeled with a
basis of cubic B-splines with knots every 30 days from 120 days before to 30 days after
the day of the public information release, for a total of eight parameters. This
specification allows the coefficient to change smoothly as a cubic function within each
30-day window and constrains the first and second derivatives of each β(t) to be constant
at each knot.
Hazard ratios from the base hazard model, reported in Table [4] Column (1), agree with
the cross-sectional models that focused on the week of the run. Having an older account
decreases the likelihood of liquidation. Staff linkages roughly triple the propensity to
liquidate and loan linkages increase it by a factor of 1.58. The relative strength of these
effects is reversed, as compared to the cross-sectional analysis, where loan linkages were
more powerful than staff linkages. The hazard model covers a broader window than just
the run week and staff were more likely to move earlier in this period than other
depositors, so the staff effect is larger in the hazard model. A network member having
run by a given date increases the likelihood that a depositor will run by nearly three-fold,
the same increase in hazard as being a member of the bank staff. Having a balance, prior
to the event window, above the insurance limit increases liquidation hazard by a factor of
four. This very large magnitude is generally consistent with the magnitude from the
cross-sectional regressions, where members of the highest balance bin had a propensity to
withdraw 17 to 23 percentage points greater than the overall average of 3.9%. Daily
transactions are highly predictive of liquidation.
Table [4] Column (2) reports hazard ratios from the time-varying hazard model as on the
day of the public information release. These are formally the exponentiated coefficients
on the constant value for each characteristic, which are interpretable as the effect of that
characteristic on the run date, as the B-spline corresponding to the knot at that date has
been omitted from each coefficient basis. Staff are more likely to liquidate around the
run, relative to the hazard ratio estimated over the event window. High-balance
depositors are far more likely to liquidate relative to the proportional specifications. The
hazard ratio for depositors above the deposit insurance limit, relative to those in the
omitted balance bin Rs. [100,1000), is twenty-five. This ratio is far larger than the ratio
of four reported in the proportional hazard model, and captures that high balance
depositors, like staff, become more likely to liquidate around times when information
about the bank’s solvency is revealed. As this coefficient difference suggests, a
likelihood-ratio test of the alternative time-varying model against the null proportional
hazards model rejects the null model with a p-value of 0.000 (χ2(42) = 261.74).
Looking at the full path of coefficients over the event window shows that staff and high-
balance depositors are both more responsive to releases of information. For the same
time-varying hazard specification as shown in Table [4] Column (2), Figures [5] through

[7] show three coefficients of interest, on staff linkages, loan linkages and high balances,
continuously on each date over the event window. The hazard ratio corresponding to the
staff linkage, shown in Figure [5], is around four and significantly different from one
both at the time that RBI inspected the bank and around the public release of information,
whereas staff are no more likely to run than other depositors in the middle of the event
window. This camel-backed pattern is strongly suggestive that staff are responding to
releases of information about the fundamentals of the bank. Figure [6] shows that, while
depositors with loan linkages are generally more likely to withdraw over the event
window, this effect is not any stronger during periods of information release. Figure [7]
shows the time-varying hazard of liquidation for depositors above the insurance limit.
These depositors, like staff, are significantly more likely to withdraw during the period
after the RBI inspection. After a lull in the middle of the event window, the hazard
associated with high balance increases enormously around the date of the public release
of information to reach the factor of 25 reported in Table [4], Column (2). Finally Figure
8 shows the time-varying hazard ratio for having had a member of a household’s
introducer network run. This hazard shows a similar shape to the staff hazard, being
significantly greater than one around both the public release of information and the prior,
regulatory inspection of the bank but smaller and insignificant for some time in between.
The network member effect appears to lead the public release of information, in that
having a network member run is as strong an influence on a depositor one month before
the run as on the run date.
The hazard specifications show significant effects of balance and depositor ties to the
bank, via staff and loan linkages. The non-monotonic patterns of coefficients on staff and
high balances, with much higher liquidation hazards around information events, suggest
these depositors may have better access to information. Depositors above the insurance
cover have greater incentives to act on any information that is released and may therefore
be more responsive to any given information than other depositors.
C. Comparison to Non-Fundamental Shock

The finding that loan linkages increase the tendency of depositors to withdraw is a
striking contrast to Iyer and Puri (2012). We attribute this contrast to the differential
nature of the shocks that precipitated the two runs. Iyer and Puri (2012) study a run
triggered by a fraud at a bank other than the bank for which they had data, and to which
their bank had no direct exposure. They find that depositors with loan linkages are less
likely to run, and offered several possible reasons, including that depositors fear the
withdrawal of credit in the future, or that they have better information about the
fundamentals of the bank. To the extent that the explanation is due to better information,
it is logical that in this paper, where the bank under study itself [committed the fraud], we
find that depositors with loan linkages are more likely to run. Depositors who are also
borrowers may not be blindly loyal but simply more responsive due to better information
that allows them to react to fundamental shocks but not panics.
To test that the differential nature of the shock is what shifted borrower behavior, we first
compare the magnitude of runs by different categories of depositors across the shocks.
We obtain depositor data in 2001 at the time of the shock as reported in Iyer and Puri
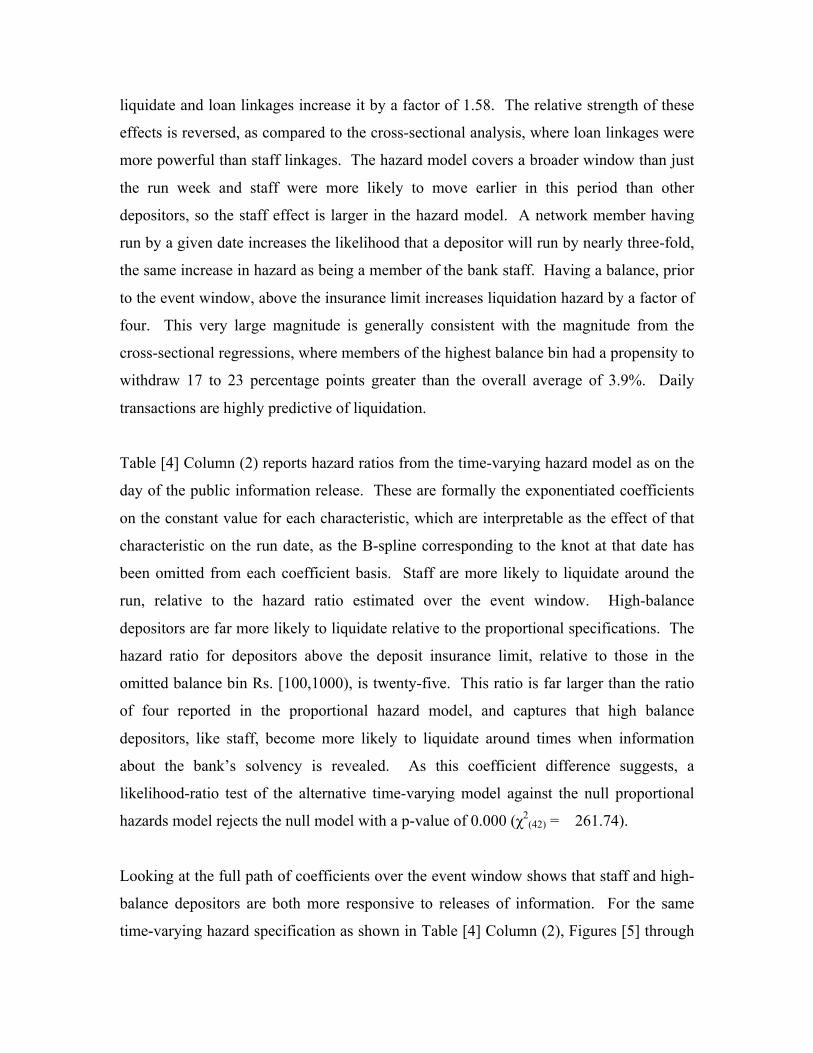
(2012). In 2001, the bank we study is located in the same area and also experienced a run
when a neighboring bank failed (see figure 2). Our bank had no fundamental linkages
with the failed bank in terms of interbank linkages or loans outstanding with the failed
bank. Furthermore, our bank faced depositor withdrawals for a few days after the date of
failure of the large bank, with activity returning to pre-run levels in the subsequent
period.6
The Table [2], Panel B shows the same comparisons as the fundamental shock for
depositors during the non-fundamental shock, in 2001. Note that the differential
tendency of depositors above the deposit insurance limit to run is more pronounced in the
fundamental shock, in Panel A, than in the non-fundamental shock. Comparison of
Figure 3 and 4 also presents a similar picture. These high-balance depositors are 3.2 times
more likely to liquidate during the run following the fundamental shock but only 1.5
times more likely to liquidate after the non-fundamental shock, relative to the moderate
6 See Iyer and Puri (2012) for a detailed description of the shock.

balance category. The mean withdrawal during the run week for high-balance depositors,
moreover, is roughly twice as large after the fundamental shock. High-balance depositors
may be better informed about the seriousness of the fundamental shock than others. The
fundamental shock is narrower, in that fewer depositors withdraw during the run, but
deeper, as those depositors withdraw more.
We then estimate several liquidation regressions in a sample of depositors present both
during the fundamental shock of 2009 and during the earlier, non-fundamental shock of
2001 studied by Iyer and Puri (2012). To be present in this constant sample a depositor
must have stayed with the bank after the initial shock. Table [5] presents coefficients
from linear probability models analogous to those shown in Table [3] but estimated in
this constant sample. Columns (1) and (2) estimate the propensity to liquidate as a
function of depositor characteristics in the fundamental and non-fundamental shocks,
respectively. The loan linkage coefficient in the constant sample during the fundamental
shock is somewhat smaller than that reported in the full sample. The coefficient during
the non-fundamental shock is -0.012, not significantly different than zero and very close
to the -0.014 reported by Iyer and Puri (2012) (Table 2, Column 2). Column (3)
estimates a pooled regression across both runs with interaction terms for the fundamental
shock. The coefficient on loan linkages is positive and similar in magnitude to that in
Table [3], but insignificant (p-value 0.16). Notably, the effect of being above the
insurance limit is large and positive, but only in the fundamental shock. The main effect
for being above the insurance limit in the pooled sample is not statistically different than
zero. Finally, column (4) adds fixed effects to the pooled regression in column (3), so
that the interaction terms reflect the different in the behavior of individual borrowers
across the two shocks. The loan linkage interaction term with the fundamental shock is
positive and different from zero in this specification, though not very precisely estimated.
The effect of being above the insurance limit does not change appreciably after adding
fixed effects.
The difference in the behavior of depositors with loan linkages appears to be due to the
nature of the shock. Prior to the non-fundamental shock, the failure of a large

cooperative bank, depositors of the bank with loan linkages are neither more nor less
likely than others to liquidate, but they are significantly less likely to do so at the time of
the shock. Depositors with loan linkages may not be only loyal to the bank or fearful of
losing access to credit, but more responsive to information about the bank’s
fundamentals.
V. Conclusion
This paper examines the importance of fragility in the bank capital structure. We examine
the extent to which depositors can monitor banks and whether some depositors are better
at monitoring than others. Finally, we study whether depositors can distinguish
fundamental shocks to bank solvency from irrelevant noise. While we find monitoring by
depositors that are uninsured, we find that the extent of monitoring is limited. We also
find that most of the depositor response is coordinated around regulatory actions.
Contrasting the extent of runs by uninsured depositors in case of panic, we find that while
the runs are lower in magnitude as compared to a fundamental shock, however, the
difference in magnitude is not high. These results hold important policy implications.
A central debate regarding the extension of deposit insurance cover has been the loss in
incentive of depositors to monitor banks. Our results suggest that especially for smaller
banks the monitoring role played by depositors is limited. In the light of the costs
imposed by fragility, our results suggest that extending the deposit insurance cover (with
proper pricing of the deposit insurance) to smaller banks with tighter regulatory
supervision could be more effective.

VI. References
Allen, F. & Gale, D. Financial contagion . Journal of political economy, JSTOR, 2000, Vol. 108(1), pp. 1-33 Angeletos, G., Hellwig, C. & Pavan, A. Dynamic global games of regime change: Learning, multiplicity, and the timing of attacks. Econometrica, Wiley Online Library, 2007, Vol. 75(3), pp. 711-756 Calomiris, C. & Kahn, C. The role of demandable debt in structuring optimal banking arrangements. The American Economic Review, JSTOR, 1991, pp. 497-513 Calomiris, C. & Mason, J. Consequences of bank distress during the Great Depression. The American Economic Review, JSTOR, 2003, Vol. 93(3), pp. 937-947 Diamond, D. & Dybvig, P. Bank runs, deposit insurance, and liquidity. The Journal of Political Economy, JSTOR, 1983, pp. 401-419 Diamond, D. & Rajan, R. Banks and liquidity. The American economic review, JSTOR, 2001, Vol. 91(2), pp. 422-425. Iyer, R. & Puri, M. Understanding Bank Runs: The Importance of Depsoitor-Bank Relationships and Networks. American Economic Review, 2012, Vol. 102(4), pp. 1414-1445 Kaufman, G. Bank contagion: A review of the theory and evidence. Journal of Financial Services Research, Springer, 1994, Vol. 8(2), pp. 123-150 Kroszner, R. Community Banks: The Continuing Importance of Relationship Finance. Speech At America's Community Bankers Government Affairs Conference, 2007 Morris, S. & Shin, H. Social value of public information. The American Economic Review, American Economic Association, 2002, Vol. 92(5), pp. 1521-1534 Morris, S. & Shin, H. Unique equilibrium in a model of self-fulfilling currency attacks American Economic Review, JSTOR, 1998, pp. 587-597

1 Figures
Figure 1:
The figure shows aggregate transaction account balances for depositors in the bank from 300 days before the public releaseof information on the bank’s finances and restrictions on account activity, which occurred on January 27, 2009, through 150days after. The vertical lines indicate the dates of the Reserve Bank of India’s (RBI; i.e., the primary regulator) inspectionof the bank’s finances and the public release of information on RBIs actions following this inspection.
1
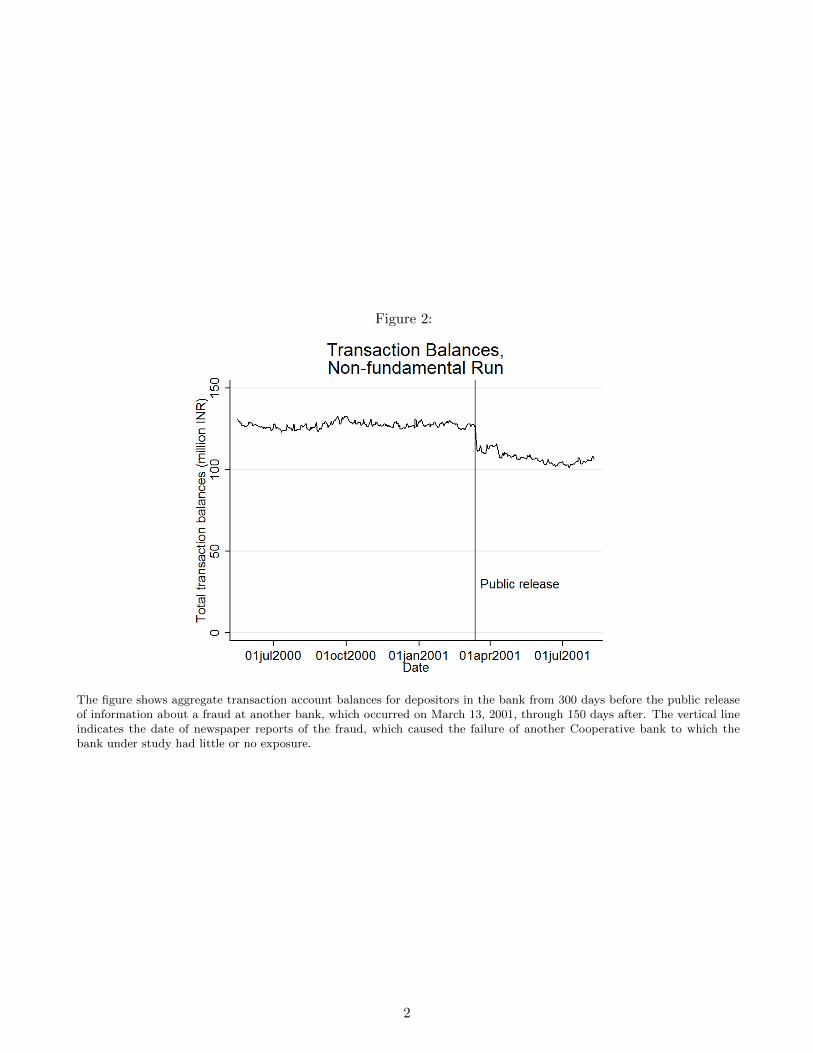
Figure 2:
The figure shows aggregate transaction account balances for depositors in the bank from 300 days before the public releaseof information about a fraud at another bank, which occurred on March 13, 2001, through 150 days after. The vertical lineindicates the date of newspaper reports of the fraud, which caused the failure of another Cooperative bank to which thebank under study had little or no exposure.
2

Figure 3:
The figure shows aggregate transaction account balances for depositors in the bank from 90 days before the public releaseof information on the bank’s finances and restrictions on account activity, which occurred on January 27, 2009, through 30days after, broken out by depositor’s initial balance. Depositors are grouped into balance categories depending on whethertheir balance was less than INR 1,000, greater than INR 1,000 but less than INR 100,000, or greater than INR 100,000 andthe aggregate balance for each group is normalized to one on the date of the public release of information.
Figure 4:
The figure shows aggregate transaction account balances for depositors in the bank from 90 days before the public release ofinformation about a fraud at another bank, which occured on March 13, 2001, through 30 days after. Depositors are groupedinto balance categories depending on whether their initial balance was less than INR 1,000, greater than INR 1,000 but lessthan INR 100,000, or greater than INR 100,000 and the aggregate balance for each group is normalized to one on the dateof the public release of information.
3

Figure 5:
The figure shows estimated hazard ratios for staff status (= 1) from a Cox proportional hazard model of liquidation (with-drawal of 50% of transaction balance) on depositor characteristics. The event window is 90 days before the public release ofinformation on January 27, 2009 through 30 days after. The coefficient on each depositor characteristic is allowed to varysmoothly over time according to a cubic spline with knots at 30-day intervals. The resulting hazard ratio and confidenceintervals for the coefficient on staff status are plotted here.
Figure 6:
See notes to Figure ?? for description of model. The hazard ratio and confidence intervals for the coefficient on whether thedepositor has a loan linkage are plotted here.
4

Figure 7:
See notes to Figure ?? for description of model. The hazard ratio and confidence intervals for the coefficient on whether thedepositor has an initial balance above the deposit insurance limit of INR 100,000 are plotted here.
Figure 8:
See notes to Figure ?? for description of model. The hazard ratio and confidence intervals for the coefficient on whether amember of the depositor’s introducer network has run are plotted here.
5

2 Tables
Table 1: Summary Statistics by Liquidation, Fundamental Shock
Sample mean [sd]All Run Stay Run-Stay
Liquidation dummy (Withdraw 50%=1) 0.039 1 0 1[0.19] [0] [0] (0)
Trans. balance, ’000s, 90 days prior 5.46 31.1 4.43 26.6∗∗∗
[32.6] [77.7] [28.9] (0.97)Balance above 100k, 90 days prior 0.0093 0.068 0.0069 0.061∗∗∗
[0.096] [0.25] [0.083] (0.0029)Age of account in years at run 6.30 5.29 6.34 -1.05∗∗∗
[1.70] [2.31] [1.66] (0.051)Depositor or family has loan 0.015 0.048 0.014 0.034∗∗∗
[0.12] [0.21] [0.12] (0.0037)Depositor or family is staff 0.032 0.059 0.031 0.028∗∗∗
[0.17] [0.24] [0.17] (0.0052)Daily transactions, year prior to run 0.015 0.093 0.012 0.081∗∗∗
[0.054] [0.13] [0.046] (0.0016)Daily withdrawal, year prior to run 142.3 996.7 107.8 888.9∗∗∗
[1332.6] [3883.5] [1099.6] (39.6)Daily deposit, year prior to run 140.9 1011.7 105.7 906.0∗∗∗
[1318.2] [3762.1] [1098.0] (39.2)
Observations 29852 1157 28695
Summary statistics for depositor characteristics for all depositors (column 1) and by whether or not thedepositor liquidated during the run (column 2) or did not (column 3). Liquidation is a dummy for withdrawing50% of transaction balances on any one day. Daily transactions is a dummy for whether or not the transactionbalance changed on a given day, whereas daily withdrawal and daily deposit are the withdrawal and depositamounts.
6

Table 2: Liquidation by Balance Bin, Fundamental Shock
Initial transaction balancelt Rs 1k in Rs [1k,100k) ge Rs 100k
Panel A. During Run Week (Public release to 7 days after)Liquidation (Withdraw 50%=1) 0.01 0.09 0.29
Withdrawal (Amount) 32.25 1,701.56 54,283.26
Panel B. Including Pre-period (90 days before to 7 days after)Liquidation (Withdraw 50%=1) 0.01 0.17 0.65
Withdrawal (Amount) -146.20 1,672.06 155,146.08
Observations 29852
The table shows summary statistics for liquidation (withdrawal of 50% of transaction bal-ances) wnd withdrawals by balance bin for depositors whose initial balance was less thanINR 1,000, greater than INR 1,000 but less than INR 100,000, or greater than INR 100,000.Withdrawal is the change in balance in either direction with a negative withdrawal indicat-ing a deposit.
7

Table 3: Models for Liquidation, Fundamental
(1) (2) (3) (4)LPM LPM Probit Probit
Depositor or family has loan (d) 0.044∗∗ 0.038∗ 0.033∗∗ 0.017∗∗
(0.020) (0.020) (0.014) (0.0086)Age of account in years at run −0.0066∗∗∗ −0.0043∗∗∗ −0.0055∗∗∗ −0.0026∗∗∗
(0.0010) (0.0010) (0.00050) (0.00036)Depositor or family is staff (d) 0.022∗∗ 0.027∗∗∗ 0.023∗∗∗ 0.027∗∗∗
(0.0091) (0.0091) (0.0077) (0.0074)Mean daily trans. dummy, year prior 0.90∗∗∗ 0.82∗∗∗ 0.29∗∗∗ 0.14∗∗∗
(0.055) (0.053) (0.016) (0.010)Trans. balance, ’000s, 90 days prior 0.00055∗∗∗ 0.00016∗∗∗
(0.00014) (0.000038)Bal in Rs [1k,100k) (d) 0.053∗∗∗ 0.059∗∗∗
(0.0028) (0.0028)Bal ge Rs 100k (d) 0.17∗∗∗ 0.23∗∗∗
(0.030) (0.034)Observations 29852
The table shows coefficient estimates for linear-probability and probit models of the probability of liquidation during theweek following the public release of information on January 27, 2009. Estimates from probit models are marginal effectsand (d) indicates a discrete change of dummy variable from 0 to 1. Standard errors in parentheses with ∗ p < 0.10, ∗∗
p < 0.05 and ∗∗∗ p < 0.01.
8
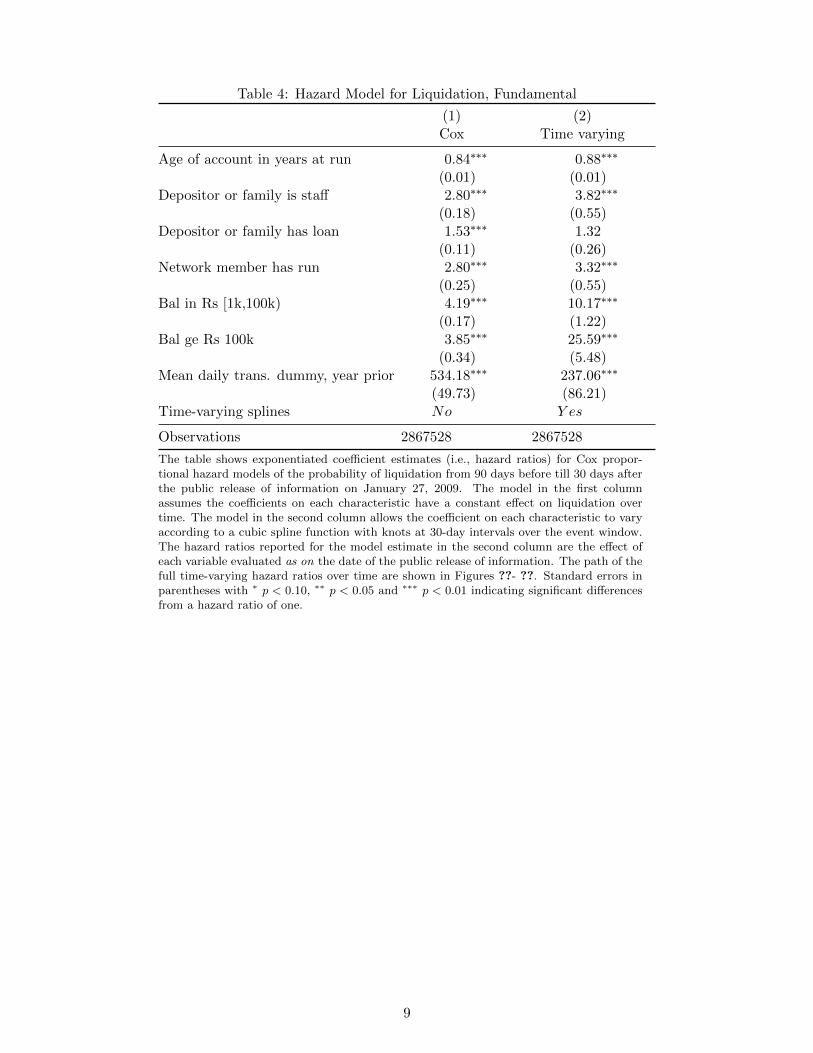
Table 4: Hazard Model for Liquidation, Fundamental
(1) (2)Cox Time varying
Age of account in years at run 0.84∗∗∗ 0.88∗∗∗
(0.01) (0.01)Depositor or family is staff 2.80∗∗∗ 3.82∗∗∗
(0.18) (0.55)Depositor or family has loan 1.53∗∗∗ 1.32
(0.11) (0.26)Network member has run 2.80∗∗∗ 3.32∗∗∗
(0.25) (0.55)Bal in Rs [1k,100k) 4.19∗∗∗ 10.17∗∗∗
(0.17) (1.22)Bal ge Rs 100k 3.85∗∗∗ 25.59∗∗∗
(0.34) (5.48)Mean daily trans. dummy, year prior 534.18∗∗∗ 237.06∗∗∗
(49.73) (86.21)Time-varying splines No Y es
Observations 2867528 2867528
The table shows exponentiated coefficient estimates (i.e., hazard ratios) for Cox propor-tional hazard models of the probability of liquidation from 90 days before till 30 days afterthe public release of information on January 27, 2009. The model in the first columnassumes the coefficients on each characteristic have a constant effect on liquidation overtime. The model in the second column allows the coefficient on each characteristic to varyaccording to a cubic spline function with knots at 30-day intervals over the event window.The hazard ratios reported for the model estimate in the second column are the effect ofeach variable evaluated as on the date of the public release of information. The path of thefull time-varying hazard ratios over time are shown in Figures ??- ??. Standard errors inparentheses with ∗ p < 0.10, ∗∗ p < 0.05 and ∗∗∗ p < 0.01 indicating significant differencesfrom a hazard ratio of one.
9
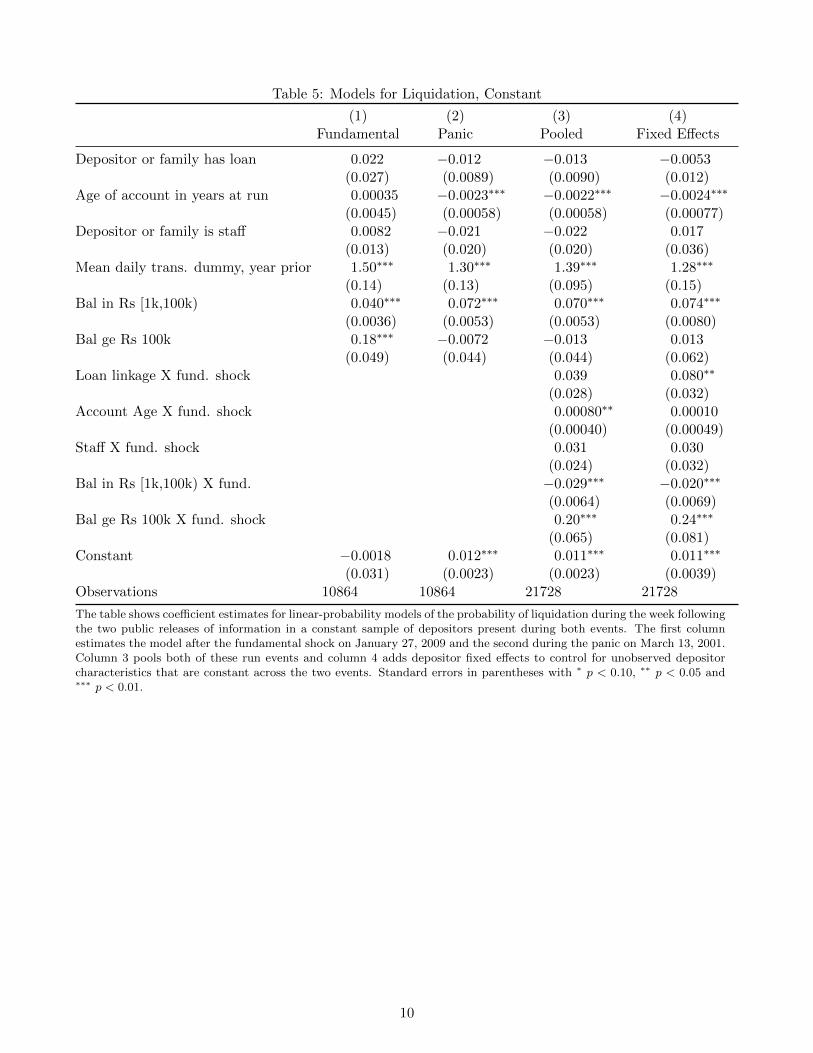
Table 5: Models for Liquidation, Constant
(1) (2) (3) (4)Fundamental Panic Pooled Fixed Effects
Depositor or family has loan 0.022 −0.012 −0.013 −0.0053(0.027) (0.0089) (0.0090) (0.012)
Age of account in years at run 0.00035 −0.0023∗∗∗ −0.0022∗∗∗ −0.0024∗∗∗
(0.0045) (0.00058) (0.00058) (0.00077)Depositor or family is staff 0.0082 −0.021 −0.022 0.017
(0.013) (0.020) (0.020) (0.036)Mean daily trans. dummy, year prior 1.50∗∗∗ 1.30∗∗∗ 1.39∗∗∗ 1.28∗∗∗
(0.14) (0.13) (0.095) (0.15)Bal in Rs [1k,100k) 0.040∗∗∗ 0.072∗∗∗ 0.070∗∗∗ 0.074∗∗∗
(0.0036) (0.0053) (0.0053) (0.0080)Bal ge Rs 100k 0.18∗∗∗ −0.0072 −0.013 0.013
(0.049) (0.044) (0.044) (0.062)Loan linkage X fund. shock 0.039 0.080∗∗
(0.028) (0.032)Account Age X fund. shock 0.00080∗∗ 0.00010
(0.00040) (0.00049)Staff X fund. shock 0.031 0.030
(0.024) (0.032)Bal in Rs [1k,100k) X fund. −0.029∗∗∗ −0.020∗∗∗
(0.0064) (0.0069)Bal ge Rs 100k X fund. shock 0.20∗∗∗ 0.24∗∗∗
(0.065) (0.081)Constant −0.0018 0.012∗∗∗ 0.011∗∗∗ 0.011∗∗∗
(0.031) (0.0023) (0.0023) (0.0039)Observations 10864 10864 21728 21728
The table shows coefficient estimates for linear-probability models of the probability of liquidation during the week followingthe two public releases of information in a constant sample of depositors present during both events. The first columnestimates the model after the fundamental shock on January 27, 2009 and the second during the panic on March 13, 2001.Column 3 pools both of these run events and column 4 adds depositor fixed effects to control for unobserved depositorcharacteristics that are constant across the two events. Standard errors in parentheses with ∗ p < 0.10, ∗∗ p < 0.05 and∗∗∗ p < 0.01.
10