Understanding Anemia - A User's Guide to the Landscape ... · PDF fileUNDERSTANDING ANEMIA: A...
16
UNDERSTANDING ANEMIA A USER’S GUIDE TO THE LANDSCAPE ANALYSIS TOOL
Transcript of Understanding Anemia - A User's Guide to the Landscape ... · PDF fileUNDERSTANDING ANEMIA: A...
UNDERSTANDING ANEMIA
A USER’S GUIDE TO THE LANDSCAPE ANALYSIS TOOL
ABOUT SPRINGThe Strengthening Partnerships, Results, and Innovations in Nutrition Globally (SPRING) project is a five-year USAID-funded Cooperative Agreement to strengthen global and country efforts to scale up high-impact nutrition practices and policies and improve maternal and child nutrition outcomes. The project is managed by JSI Research & Training Institute, Inc., with partners Helen Keller International, The Manoff Group, Save the Children, and the International Food Policy Research Institute.
ACKNOWLEDGMENTSThe excel-based Landscape Analysis Tool was developed by SPRING staff Teemar Fisseha and Alexis D’Agostino, together with Ben Hatch, a SPRING consultant through John Snow, Inc. Sorrel Namaste and Christina Nyhus Dhillon provided conceptual guidance on the tool. Special thanks go to the authors of the District Assessment Tool for Anemia—from which the Landscape Analysis Tool was modeled—Phil Harvey, Robin Houston, Denish Moorthy, Teemar Fisseha, Barbara Knittel, Emma Stewart, Sorrel Namaste, and Danya Sarkar. Finally, we extend our appreciation to the USAID staff in Washington for their continued support of this work and helpful feedback throughout the process.
RECOMMENDED CITATION
SPRING. 2016. Understanding Anemia: A User’s Guide to the Landscape Analysis Tool. Arlington, VA: Strengthening Partnerships, Results, and Innovations in Nutrition Globally (SPRING) project.
SPRINGJSI Research & Training Institute, Inc.1616 Fort Myer Drive, 16th FloorArlington, VA 22209 USA
Tel: 703-528-7474Fax: 703-528-7480
Email: [email protected]: www.spring-nutrition.org
Photo courtesy of USAID and Feed the Future
This guide is made possible by the generous support of the American people through the United States Agency for International Development (USAID) under the terms of the Cooperative Agreement No. AID-OAA-A-11-00031 (SPRING), managed by JSI Research & Training Institute, Inc. (JSI). The contents are the responsibility of JSI, and do not necessarily reflect the views of USAID or the United States Government.
UNDERSTANDING ANEMIAA USER’S GUIDE TO THE LANDSCAPE ANALYSIS TOOL

ContentsAcronyms - - - - - - - - - - - - - - - - - - - - - - - - - - - - - - - - - - - - - - - - - - - - - - - - - - - - - - - - - - - - - - - - - - - - - - - - - - - - - - - - - - - - iv
Part I: Structure - - - - - - - - - - - - - - - - - - - - - - - - - - - - - - - - - - - - - - - - - - - - - - - - - - - - - - - - - - - - - - - - - - - - - - - - - - - - - - - -1
Introduction - - - - - - - - - - - - - - - - - - - - - - - - - - - - - - - - - - - - - - - - - - - - - - - - - - - - - - - - - - - - - - - - - - - - - - - - - - - - - - - -1
General Orientation - - - - - - - - - - - - - - - - - - - - - - - - - - - - - - - - - - - - - - - - - - - - - - - - - - - - - - - - - - - - - - - - - - - - - - - - - -1
Part II: Using the Landscape Analysis Tool - - - - - - - - - - - - - - - - - - - - - - - - - - - - - - - - - - - - - - - - - - - - - - - - - - - - - - - - - - 2
Step 1: Understanding the anemia situation and its causes: completing the Prevalence Questionnaire - - - - - - - - - 2
Step 2: Tracking interventions to address anemia: completing the Program Questionnaire - - - - - - - - - - - - - - - - - - 2
Step 3: Identifying the anemia-related strategies or policies in place: completing the Strategy/Policy Questionnaire - 3
Step 4: Putting it all together: reviewing outputs - - - - - - - - - - - - - - - - - - - - - - - - - - - - - - - - - - - - - - - - - - - - - - - - - - - 3
Part III: Entering Data in the Landscape Analysis Tool - - - - - - - - - - - - - - - - - - - - - - - - - - - - - - - - - - - - - - - - - - - - - - - - - - 4
Navigating the Landscape Analysis Tool - - - - - - - - - - - - - - - - - - - - - - - - - - - - - - - - - - - - - - - - - - - - - - - - - - - - - - - - - 4
Entering Data - - - - - - - - - - - - - - - - - - - - - - - - - - - - - - - - - - - - - - - - - - - - - - - - - - - - - - - - - - - - - - - - - - - - - - - - - - - - - - 5
Outputs - - - - - - - - - - - - - - - - - - - - - - - - - - - - - - - - - - - - - - - - - - - - - - - - - - - - - - - - - - - - - - - - - - - - - - - - - - - - - - - - - - 7
Part IV: Frequently Asked Questions - - - - - - - - - - - - - - - - - - - - - - - - - - - - - - - - - - - - - - - - - - - - - - - - - - - - - - - - - - - - - - - 9
UNDERSTANDING ANEMIA: A USER’S GUIDE TO THE LANDSCAPE ANALYSIS TOOL iii
AcronymsANC antenatal care
DHS Demographic and Health Surveys
FP family planning
HMIS health management information system
IFA iron–folic acid
IPTp intermittent preventive treatment in pregnancy
SPRING Strengthening Partnerships, Results, and Innovations in Nutrition Globally
USAID U.S. Agency for International Development
WASH water, sanitation, and hygiene
WHO World Health Organization
iv UNDERSTANDING ANEMIA: A USER’S GUIDE TO THE LANDSCAPE ANALYSIS TOOL
1UNDERSTANDING ANEMIA: A USER’S GUIDE TO THE LANDSCAPE ANALYSIS TOOL
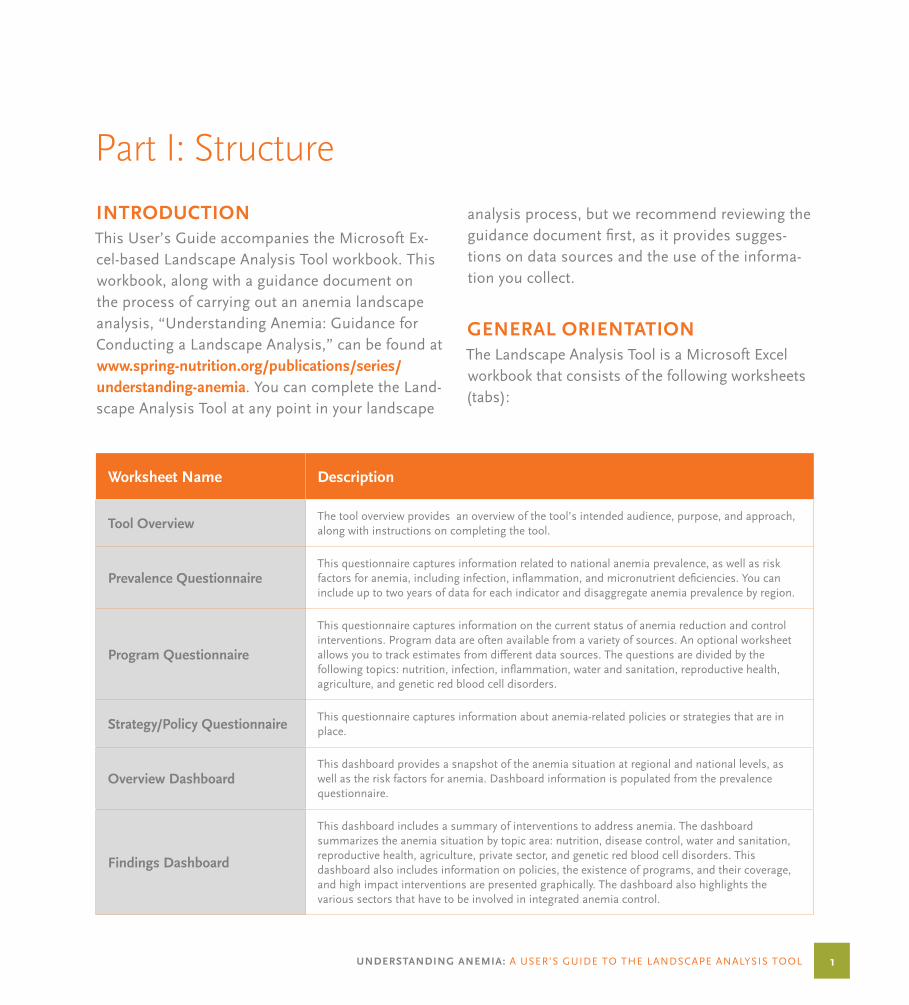
Part I: StructureINTRODUCTION analysis process, but we recommend reviewing the This User’s Guide accompanies the Microsoft Ex- guidance document first, as it provides sugges-cel-based Landscape Analysis Tool workbook. This tions on data sources and the use of the informa-workbook, along with a guidance document on tion you collect.the process of carrying out an anemia landscape analysis, “Understanding Anemia: Guidance for GENERAL ORIENTATIONConducting a Landscape Analysis,” can be found at
The Landscape Analysis Tool is a Microsoft Excel www.spring-nutrition.org/publications/series/
workbook that consists of the following worksheets understanding-anemia. You can complete the Land-
(tabs):scape Analysis Tool at any point in your landscape
Worksheet Name Description
The tool overview provides an overview of the tool’s intended audience, purpose, and approach, Tool Overview along with instructions on completing the tool.
This questionnaire captures information related to national anemia prevalence, as well as risk Prevalence Questionnaire factors for anemia, including infection, inflammation, and micronutrient deficiencies. You can
include up to two years of data for each indicator and disaggregate anemia prevalence by region.
This questionnaire captures information on the current status of anemia reduction and control interventions. Program data are often available from a variety of sources. An optional worksheet
Program Questionnaire allows you to track estimates from different data sources. The questions are divided by the following topics: nutrition, infection, inflammation, water and sanitation, reproductive health, agriculture, and genetic red blood cell disorders.
This questionnaire captures information about anemia-related policies or strategies that are in Strategy/Policy Questionnaire place.
This dashboard provides a snapshot of the anemia situation at regional and national levels, as Overview Dashboard well as the risk factors for anemia. Dashboard information is populated from the prevalence
questionnaire.
This dashboard includes a summary of interventions to address anemia. The dashboard summarizes the anemia situation by topic area: nutrition, disease control, water and sanitation, reproductive health, agriculture, private sector, and genetic red blood cell disorders. This Findings Dashboard dashboard also includes information on policies, the existence of programs, and their coverage, and high impact interventions are presented graphically. The dashboard also highlights the various sectors that have to be involved in integrated anemia control.
2 UNDERSTANDING ANEMIA: A USER’S GUIDE TO THE LANDSCAPE ANALYSIS TOOL
Part II: Using the Landscape Analysis Tool
The following section provides a systematic overview of how the Landscape Analysis Tool should be used to illustrate the anemia situation in a country and prioritize interventions for anemia reduction.
Step 1: Understanding the anemia of these programs. Within the Program Question-naire, interventions are separated by sector. After situation and its causes: completing the identifying whether a specific program exists in
Prevalence Questionnaire your country, enter coverage data for the program. When there is a specific indicator for program cov-Ideally, you will have access to anemia data from erage, e.g. “percentage of women given IFA supple-national and subnational levels from two time mentation,” the questionnaire will request data for points to complete this questionnaire. Make sure that indicator. When globally-recognized indicators that you note the year for your data, and include do not exist or there are multiple options, the any notes regarding the source of the data in the request will be more general, e.g. “what is the cov-space provided. When available, include subnation-erage of this program?” Review the guidance docu-al data for anemia prevalence rates. Replace the ment for recommendations on which indicators to region headings in the Prevalence Questionnaire report. Make use of the data source cell to define with your region names. Populate all data fields for all indicators and list the sources of the data.which you have information.
Often, program coverage data are available
Step 2: Tracking interventions to address from multiple sources. The worksheet within the
anemia: completing the Program Program Questionnaire provides space to list all reported coverage rates by source, before filling
Questionnaire in this section of the Questionnaire. If you have multiple data sources, you can enter all of them The Program Questionnaire includes a list of into the Questionnaire, but you will need to select questions to capture information on the status of which data source you would like to be presented programs that have the potential to prevent and in the Findings Dashboard. control anemia, as well as estimate the coverage
3UNDERSTANDING ANEMIA: A USER’S GUIDE TO THE LANDSCAPE ANALYSIS TOOL
Step 3: Identifying the anemia- part of their national strategy and/or policy, while
related strategies or policies in place: other countries may be missing some of the inter-ventions and related policies and/or strategies.
completing the Strategy/Policy Questionnaire
Step 4: Putting it all together: reviewing The existence of a supportive strategy and/or outputspolicy for interventions is important, since without strategies and/or policies, interventions are unlike- This analysis should help you understand the ly to be implemented. The list of policies in this prevalence of anemia and its risk factors (in the questionnaire reflects currently accepted World Overview Dashboard) as well as the summary of Health Organization (WHO) recommendations re- policies as well as interventions by topic area to lated to anemia programming. Some countries will reduce anemia prevalence in women and children have all current WHO-accepted interventions as (in the Findings Dashboard).
4 UNDERSTANDING ANEMIA: A USER’S GUIDE TO THE LANDSCAPE ANALYSIS TOOL
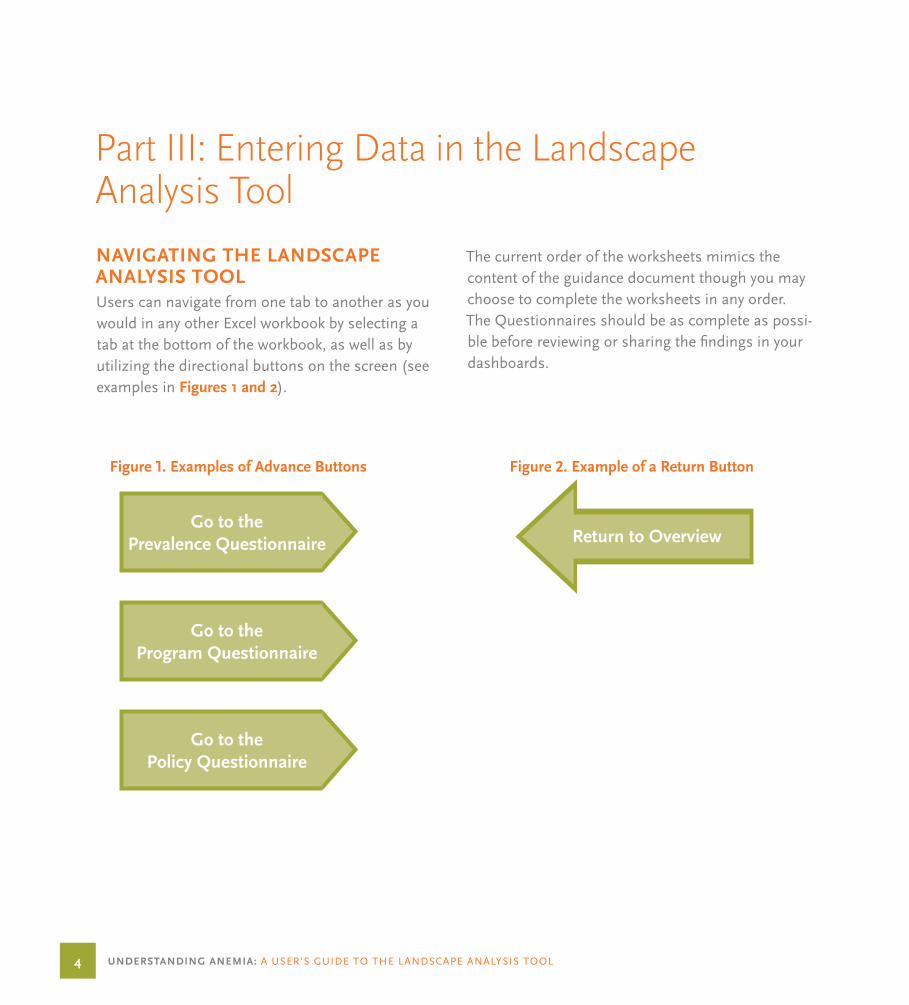
Part III: Entering Data in the Landscape Analysis ToolNAVIGATING THE LANDSCAPE The current order of the worksheets mimics the ANALYSIS TOOL content of the guidance document though you may Users can navigate from one tab to another as you choose to complete the worksheets in any order. would in any other Excel workbook by selecting a The Questionnaires should be as complete as possi-tab at the bottom of the workbook, as well as by ble before reviewing or sharing the findings in your utilizing the directional buttons on the screen (see dashboards. examples in Figures 1 and 2).
Go to the Prevalence Questionnaire
Go to the Program Questionnaire
Go to the Policy Questionnaire
Figure 1. Examples of Advance Buttons
Return to Overview
Figure 2. Example of a Return Button
5UNDERSTANDING ANEMIA: A USER’S GUIDE TO THE LANDSCAPE ANALYSIS TOOL
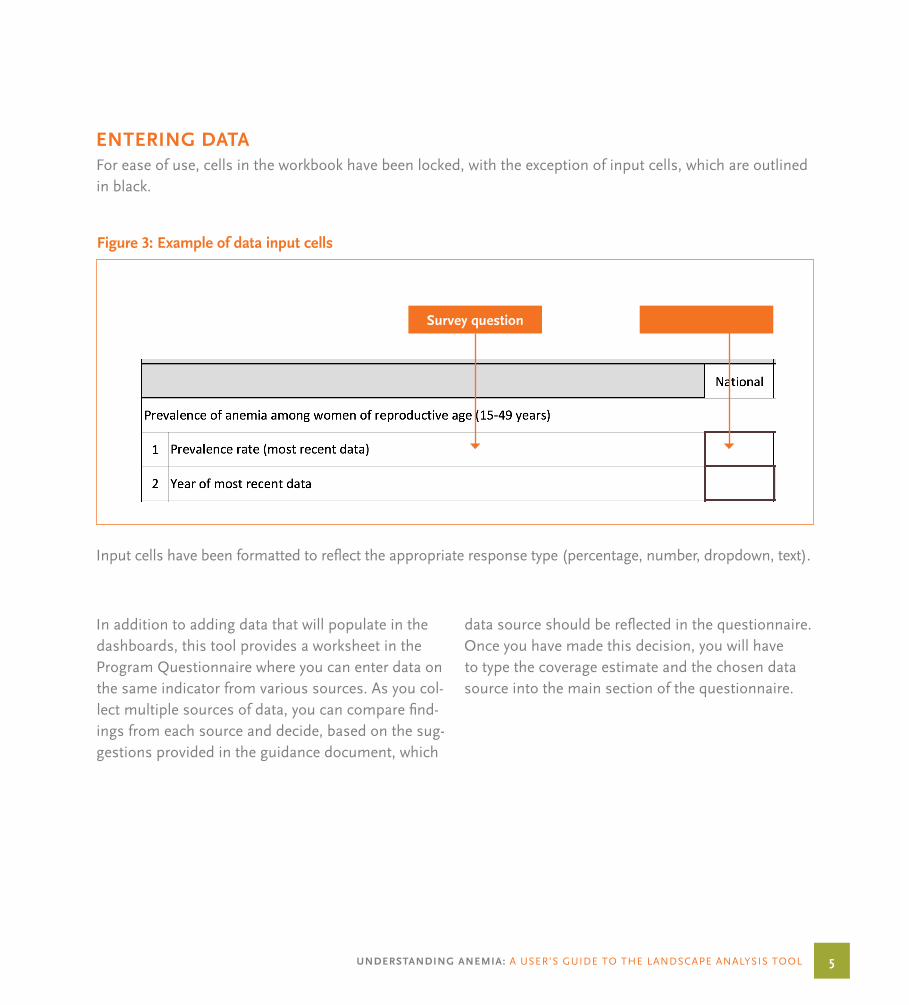
ENTERING DATAFor ease of use, cells in the workbook have been locked, with the exception of input cells, which are outlined in black.
Input cells have been formatted to reflect the appropriate response type (percentage, number, dropdown, text).
In addition to adding data that will populate in the dashboards, this tool provides a worksheet in the Program Questionnaire where you can enter data on the same indicator from various sources. As you col-lect multiple sources of data, you can compare find-ings from each source and decide, based on the sug-gestions provided in the guidance document, which
data source should be reflected in the questionnaire. Once you have made this decision, you will have to type the coverage estimate and the chosen data source into the main section of the questionnaire.
Figure 3: Example of data input cells
Survey question Input cells
6 UNDERSTANDING ANEMIA: A USER’S GUIDE TO THE LANDSCAPE ANALYSIS TOOL
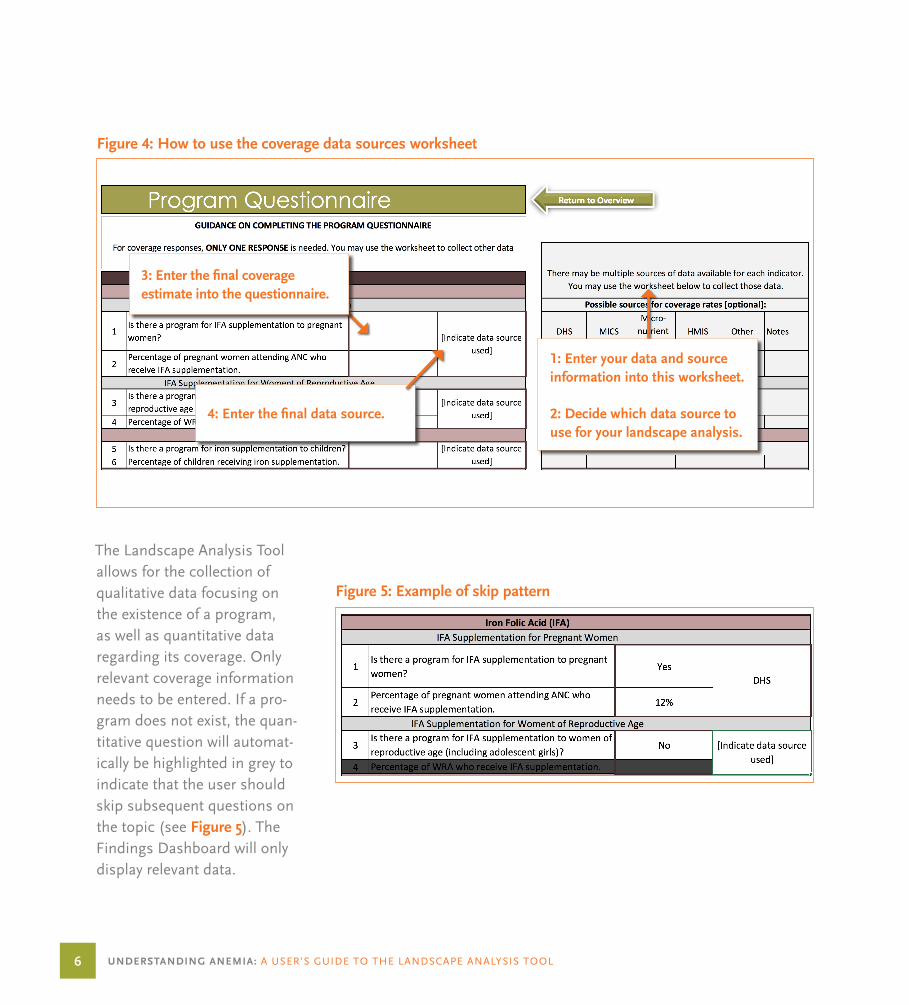
The Landscape Analysis Tool llows for the collection of ualitative data focusing on he existence of a program, s well as quantitative data egarding its coverage. Only elevant coverage information eeds to be entered. If a pro-ram does not exist, the quan-itative question will automat-cally be highlighted in grey to ndicate that the user should kip subsequent questions on he topic (see Figure 5). The indings Dashboard will only isplay relevant data.
aqtarrngtiistFd
Figure 4: How to use the coverage data sources worksheet
3: Enter the final coverage estimate into the questionnaire.
1: Enter your data and source information into this worksheet.
4: Enter the final data source. 2: Decide which data source to use for your landscape analysis.
Figure 5: Example of skip pattern
7UNDERSTANDING ANEMIA: A USER’S GUIDE TO THE LANDSCAPE ANALYSIS TOOL
Please note that the format of the Excel tool allows you to print off questionnaires and complete them in paper version. While you will still need to enter the data into the Excel file for the dashboards to work, working from a paper copy could be helpful during meetings with collaborators. After you have entered data into the paper questionnaires, use the information in this User’s Guide to input data into the Excel tool and populate the dashboards (which you can also then print).
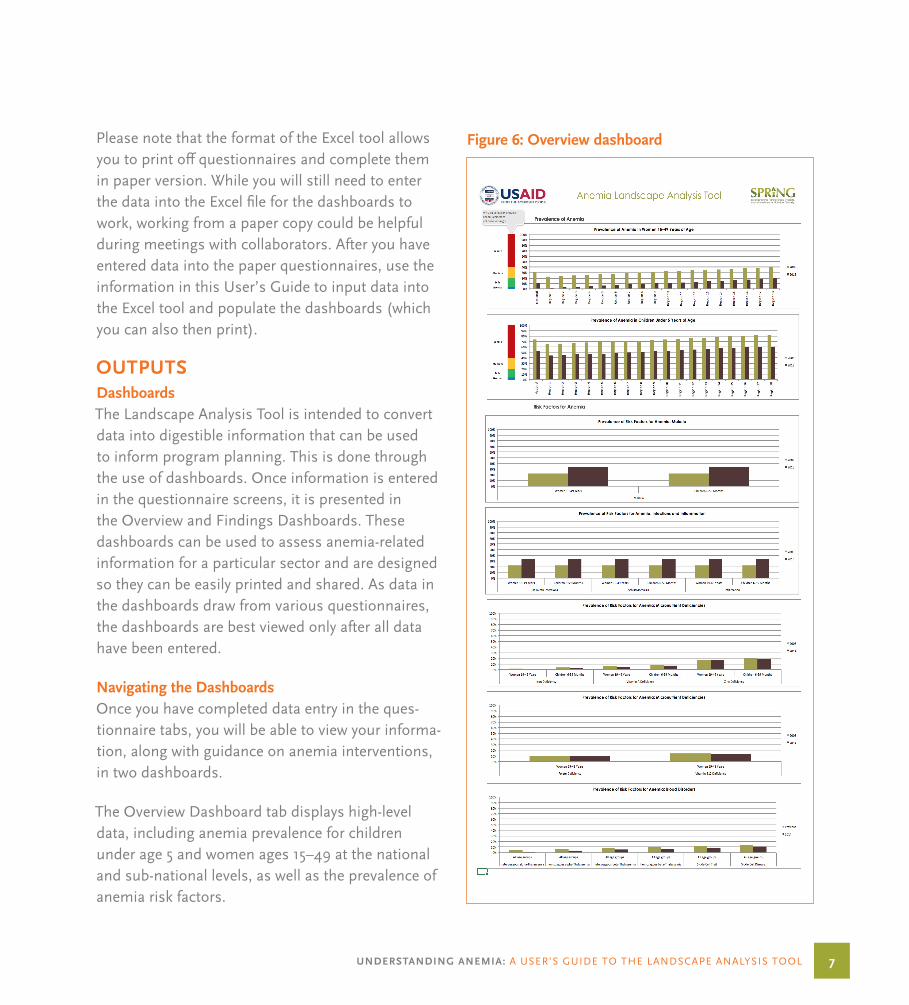
OUTPUTSDashboardsThe Landscape Analysis Tool is intended to convert data into digestible information that can be used to inform program planning. This is done through the use of dashboards. Once information is entered in the questionnaire screens, it is presented in the Overview and Findings Dashboards. These dashboards can be used to assess anemia-related information for a particular sector and are designed so they can be easily printed and shared. As data in the dashboards draw from various questionnaires, the dashboards are best viewed only after all data have been entered.
Navigating the DashboardsOnce you have completed data entry in the ques-tionnaire tabs, you will be able to view your informa-tion, along with guidance on anemia interventions, in two dashboards.
The Overview Dashboard tab displays high-level data, including anemia prevalence for children under age 5 and women ages 15–49 at the national and sub-national levels, as well as the prevalence of anemia risk factors.
Figure 6: Overview dashboard
8 UNDERSTANDING ANEMIA: A USER’S GUIDE TO THE LANDSCAPE ANALYSIS TOOL
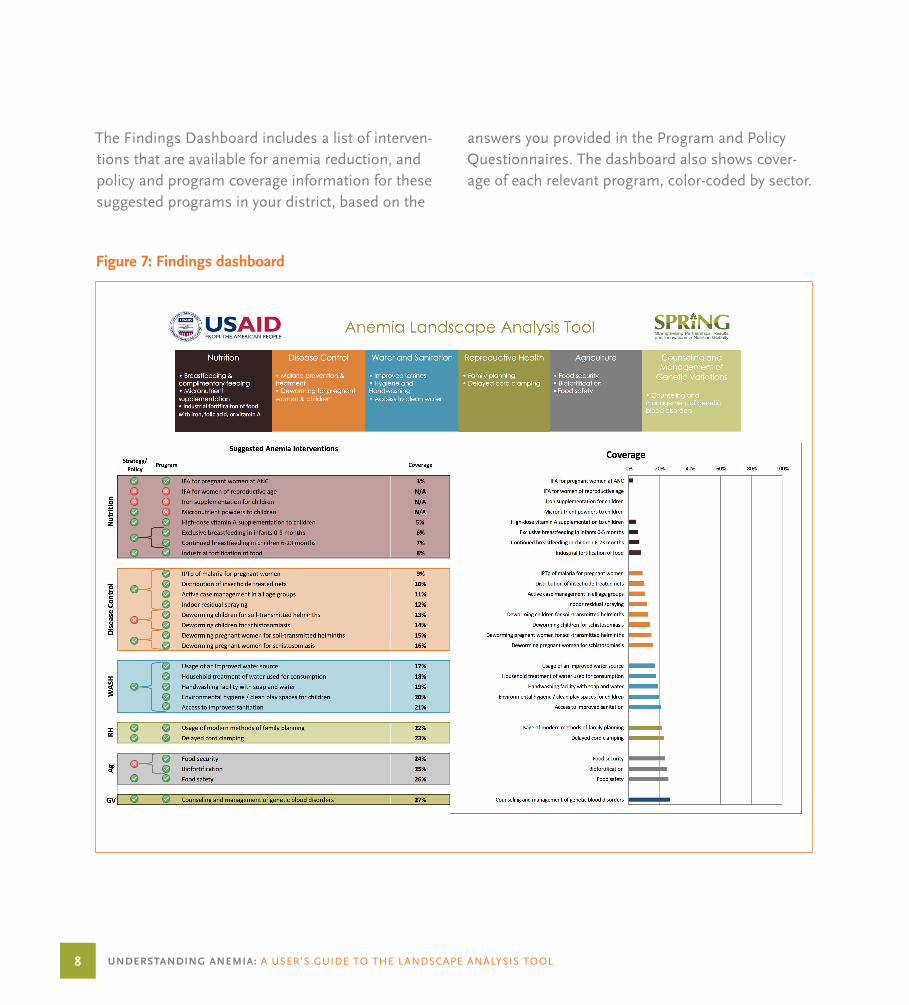
The Findings Dashboard includes a list of interven-tions that are available for anemia reduction, and policy and program coverage information for these suggested programs in your district, based on the
answers you provided in the Program and Policy Questionnaires. The dashboard also shows cover-age of each relevant program, color-coded by sector.
Figure 7: Findings dashboard
9UNDERSTANDING ANEMIA: A USER’S GUIDE TO THE LANDSCAPE ANALYSIS TOOL
Part IV: Frequently Asked Questions
Why are the dashboards empty?The information on the dashboards will populate only after the questionnaires have been completed. If you are seeing blank areas on a dashboard, return to that portion of the questionnaire and ensure you have com-pleted all of the questions.
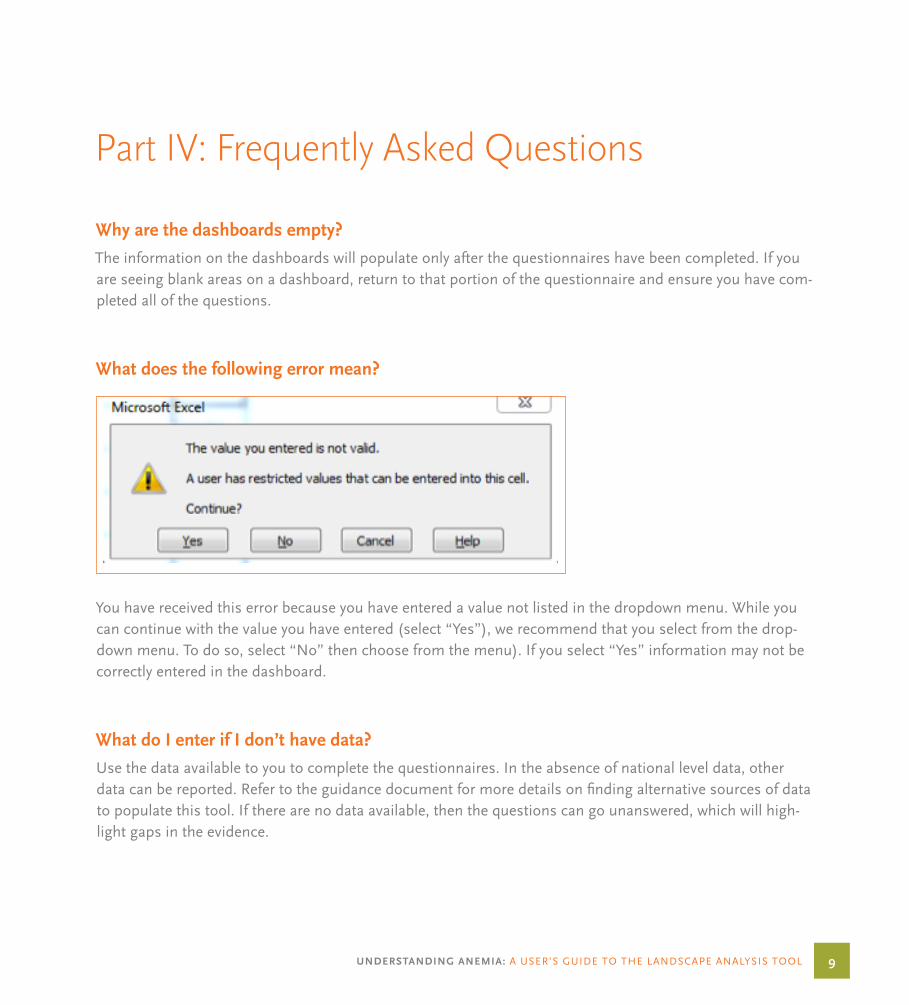
What does the following error mean?
You have received this error because you have entered a value not listed in the dropdown menu. While you can continue with the value you have entered (select “Yes”), we recommend that you select from the drop-down menu. To do so, select “No” then choose from the menu). If you select “Yes” information may not be correctly entered in the dashboard.
What do I enter if I don’t have data?Use the data available to you to complete the questionnaires. In the absence of national level data, other data can be reported. Refer to the guidance document for more details on finding alternative sources of data to populate this tool. If there are no data available, then the questions can go unanswered, which will high-light gaps in the evidence.

SPRINGJSI Research & Training Institute, Inc.1616 Fort Myer Drive, 16th FloorArlington, VA 22209 USA
Tel: 703-528-7474Fax: 703-528-7480
Email: [email protected]: www.spring-nutrition.org