Understanding And Using Custom Queries - Nagios · Understanding And Using Custom Queries....
14
Purpose This document describes how to use the full flexibility of Nagios Network Analyzer to get the most out of your network flow data. Target Audience Network admins performing forensic analysis on a network's flow data to drill directly to the information they need. Terminology The following terms will be used throughout this document: • src - Source • dst - Destination • srcip - Source IP is the IP Address the traffic originated from • dstip - Destination IP is the IP Address the traffic is going to • srcport - Source Port is the network port the traffic is transmitted on • dstport - Destination Port is the network port the traffic is received on Introduction This documentation will show you how to use Nagios Network Analyzer to turn existing flow data into meaningful information. This manipulation will not destroy your data at all, so feel free to experiment, as there is no chance at all that you will break anything. You will need to have an existing source with flow data to be able to follow the examples in this documentation. 1295 Bandana Blvd N, St. Paul, MN 55108 [email protected] US: 1-888-624-4671 INTL: 1-651-204-9102 © 2017 Nagios Enterprises, LLC. All rights reserved. Nagios, the Nagios logo, and Nagios graphics are the servicemarks, trademarks, or registered trademarks owned by Nagios Enterprises. All other servicemarks and trademarks are the property of their respective owner. www.nagios.com Page 1 / 14 Updated – June, 2017 Network Analyzer The Industry Standard In Infrastructure Monitoring Understanding And Using Custom Queries
Transcript of Understanding And Using Custom Queries - Nagios · Understanding And Using Custom Queries....

Purpose
This document describes how to use the full flexibility of Nagios Network Analyzer to get the
most out of your network flow data.
Target Audience
Network admins performing forensic analysis on a network's flow data to drill directly to the information they
need.
Terminology
The following terms will be used throughout this document:
• src - Source
• dst - Destination
• srcip - Source IP is the IP Address the traffic originated from
• dstip - Destination IP is the IP Address the traffic is going to
• srcport - Source Port is the network port the traffic is transmitted on
• dstport - Destination Port is the network port the traffic is received on
Introduction
This documentation will show you how to use Nagios Network Analyzer to turn existing flow data into
meaningful information. This manipulation will not destroy your data at all, so feel free to experiment, as there
is no chance at all that you will break anything. You will need to have an existing source with flow data to be
able to follow the examples in this documentation.
1295 Bandana Blvd N, St. Paul, MN 55108 [email protected] US: 1-888-624-4671 INTL: 1-651-204-9102
© 2017 Nagios Enterprises, LLC. All rights reserved. Nagios, the Nagios logo, and Nagios graphics are the servicemarks, trademarks, or registered trademarks owned by Nagios Enterprises. All other servicemarks and trademarks are the property of their respective owner.
www.nagios.comPage 1 / 14
Updated – June, 2017
Network Analyzer
The Industry Standard In Infrastructure Monitoring
Understanding And Using Custom Queries

Performing A Query
Click Sources on the top menu and then click one of your sources. Click the Queries tab to bring up the
query options.
This is where we will be doing the majority of work and explanation in this document, and will most likely be
the entry point for any deep-diving you do into the flow data. On this page, you'll see many fields. This section
will give a description what each one is for, and how to use it.
Aggregate By - This is how the flows will be associated with each other. This field should be a comma
delimited list of aggregate values such as dstip, srcip, dstport and srcport. When the flows get
aggregated, it groups all like values for that aggregate value together. For instance, if we simply specify
dstip for our value, all unique values of dstip will be grouped together.
Try it out, type dstip in the Aggregate By field, leave the "Raw Query" field blank and click the Run Query
button. The screenshot on the following page is an example of what you might get.
1295 Bandana Blvd N, St. Paul, MN 55108 [email protected] US: 1-888-624-4671 INTL: 1-651-204-9102
© 2017 Nagios Enterprises, LLC. All rights reserved. Nagios, the Nagios logo, and Nagios graphics are the servicemarks, trademarks, or registered trademarks owned by Nagios Enterprises. All other servicemarks and trademarks are the property of their respective owner.
www.nagios.comPage 2 / 14
Updated – June, 2017
Network Analyzer
The Industry Standard In Infrastructure Monitoring
Understanding And Using Custom Queries
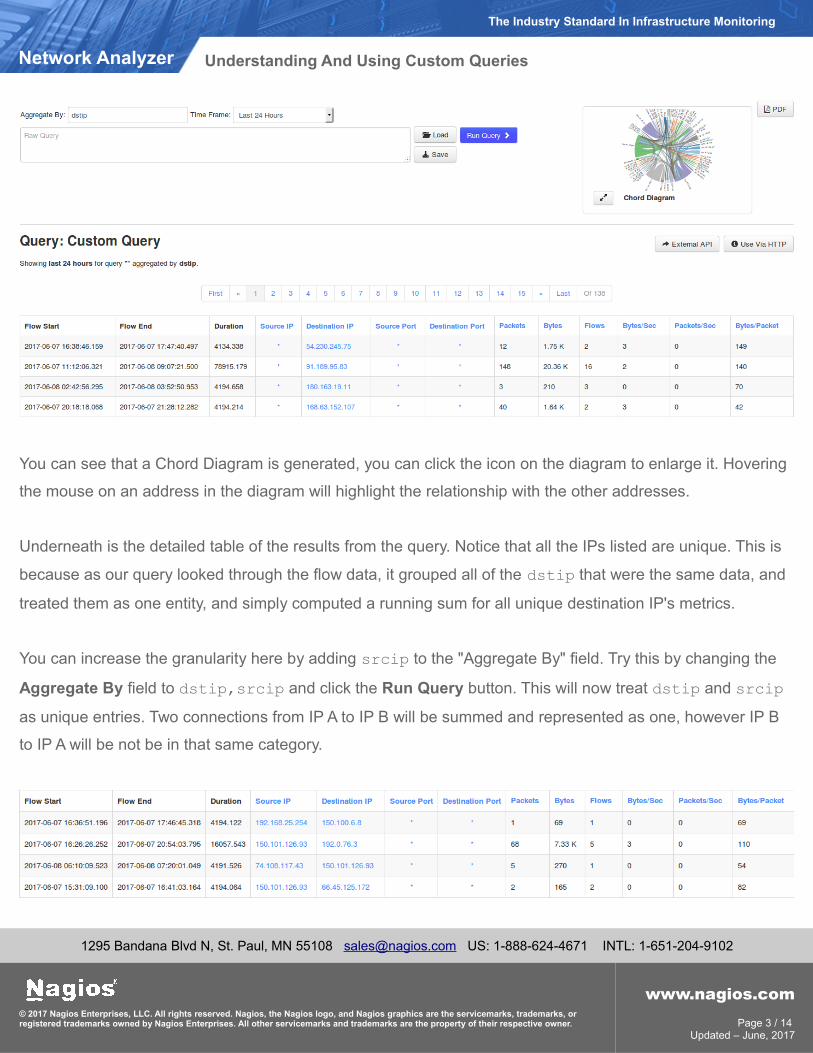
You can see that a Chord Diagram is generated, you can click the icon on the diagram to enlarge it. Hovering
the mouse on an address in the diagram will highlight the relationship with the other addresses.
Underneath is the detailed table of the results from the query. Notice that all the IPs listed are unique. This is
because as our query looked through the flow data, it grouped all of the dstip that were the same data, and
treated them as one entity, and simply computed a running sum for all unique destination IP's metrics.
You can increase the granularity here by adding srcip to the "Aggregate By" field. Try this by changing the
Aggregate By field to dstip,srcip and click the Run Query button. This will now treat dstip and srcip
as unique entries. Two connections from IP A to IP B will be summed and represented as one, however IP B
to IP A will be not be in that same category.
1295 Bandana Blvd N, St. Paul, MN 55108 [email protected] US: 1-888-624-4671 INTL: 1-651-204-9102
© 2017 Nagios Enterprises, LLC. All rights reserved. Nagios, the Nagios logo, and Nagios graphics are the servicemarks, trademarks, or registered trademarks owned by Nagios Enterprises. All other servicemarks and trademarks are the property of their respective owner.
www.nagios.comPage 3 / 14
Updated – June, 2017
Network Analyzer
The Industry Standard In Infrastructure Monitoring
Understanding And Using Custom Queries

The more aggregate values you have, the more unique values show up, so the queries will generally take
longer to run the more aggregate values you have. You are not limited to only aggregating by similar values,
for example you could have a query like dstip,dstport and get results like the following screenshot.
Time Frame - This is where you set the time frame for the query. This section is largely self-explanatory, but
you can set either hard date times to search between, or you can set soft date times. Hard date times would
be exact times, like from 1:00PM on January 1st until 2:00PM on January 1st. You can also set elapsed time
frames, to specify something like 3 hours ago until now.
Raw Query - This field is the most powerful tool when querying data. In this field you will enter a query string
to sort through the data, and if you have ever used tcpdump before, this section will be familiar.
In this query string you can specify quite a few parameters to limit what is shown to you and chain parameters
together to isolate exactly what you'd like to see.
1295 Bandana Blvd N, St. Paul, MN 55108 [email protected] US: 1-888-624-4671 INTL: 1-651-204-9102
© 2017 Nagios Enterprises, LLC. All rights reserved. Nagios, the Nagios logo, and Nagios graphics are the servicemarks, trademarks, or registered trademarks owned by Nagios Enterprises. All other servicemarks and trademarks are the property of their respective owner.
www.nagios.comPage 4 / 14
Updated – June, 2017
Network Analyzer
The Industry Standard In Infrastructure Monitoring
Understanding And Using Custom Queries

Let us assume that we would only like to see traffic on port 80. It doesn't matter if its coming from port 80, or if
its going to port 80. In our query box you would type:
port 80
Here is an example of what that looks like:
This shows all dstip,srcip aggregates that are talking on port 80. Now change the Aggregate By field to
dstip,srcip,dstport,srcport and click the Run Query button, you will get results like the following.
1295 Bandana Blvd N, St. Paul, MN 55108 [email protected] US: 1-888-624-4671 INTL: 1-651-204-9102
© 2017 Nagios Enterprises, LLC. All rights reserved. Nagios, the Nagios logo, and Nagios graphics are the servicemarks, trademarks, or registered trademarks owned by Nagios Enterprises. All other servicemarks and trademarks are the property of their respective owner.
www.nagios.comPage 5 / 14
Updated – June, 2017
Network Analyzer
The Industry Standard In Infrastructure Monitoring
Understanding And Using Custom Queries

Notice how many pages of entries this returns, 918 pages times 20 entries per page gives us 18,360 entries!
If you scroll through them you'll notice they all have port 80 as one of their ports, this is because you are
seeing traffic in both directions. If you only want to see when the source port is 80 amend the query to:
src port 80
Now the query will be limited to the source port:
You can also click any of the hyperlinks in the table of data to drill down further into the query. This will
populate the Raw Query field with a new query based on what you clicked on. In the screenshot above this is
the Source IP, Destination IP, Source Port and Destination Port columns.
Save Query
You can save a query to use again at a later stage. Click the Save button to the right
of the Raw Query window.
You will need to provide a Name and Description.
Click the Save Query button to save.
1295 Bandana Blvd N, St. Paul, MN 55108 [email protected] US: 1-888-624-4671 INTL: 1-651-204-9102
© 2017 Nagios Enterprises, LLC. All rights reserved. Nagios, the Nagios logo, and Nagios graphics are the servicemarks, trademarks, or registered trademarks owned by Nagios Enterprises. All other servicemarks and trademarks are the property of their respective owner.
www.nagios.comPage 6 / 14
Updated – June, 2017
Network Analyzer
The Industry Standard In Infrastructure Monitoring
Understanding And Using Custom Queries

Load Query
To load a query that you previously saved click the Load button to the right of the
Raw Query window.
Select a query from the Name list.
Click the Load Query button to load it.
Delete Query
If you want to delete an existing query, click the
Delete icon to the right of the Loaded Query field.
You will need to click OK on the window that appears to delete
the query.
Advanced Queries
So far you've seen some basic queries. The following sections explain how you can make a query more
specific depending on what information you are after.
1295 Bandana Blvd N, St. Paul, MN 55108 [email protected] US: 1-888-624-4671 INTL: 1-651-204-9102
© 2017 Nagios Enterprises, LLC. All rights reserved. Nagios, the Nagios logo, and Nagios graphics are the servicemarks, trademarks, or registered trademarks owned by Nagios Enterprises. All other servicemarks and trademarks are the property of their respective owner.
www.nagios.comPage 7 / 14
Updated – June, 2017
Network Analyzer
The Industry Standard In Infrastructure Monitoring
Understanding And Using Custom Queries
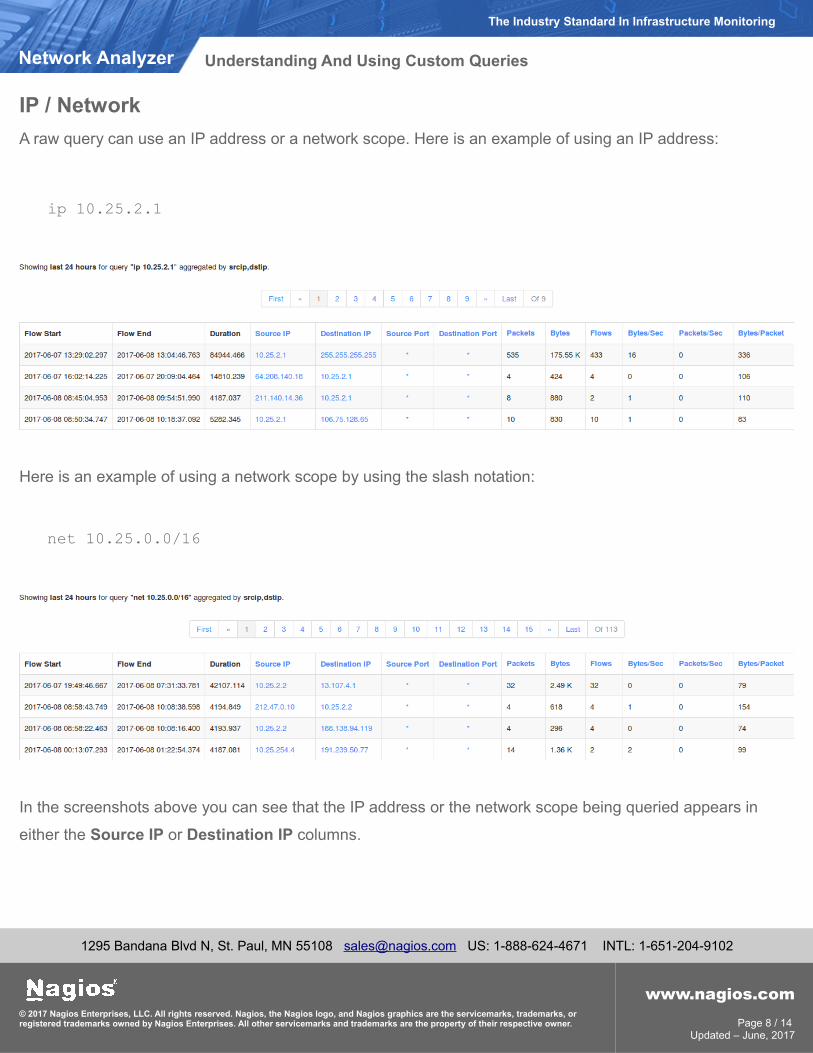
IP / Network
A raw query can use an IP address or a network scope. Here is an example of using an IP address:
ip 10.25.2.1
Here is an example of using a network scope by using the slash notation:
net 10.25.0.0/16
In the screenshots above you can see that the IP address or the network scope being queried appears in
either the Source IP or Destination IP columns.
1295 Bandana Blvd N, St. Paul, MN 55108 [email protected] US: 1-888-624-4671 INTL: 1-651-204-9102
© 2017 Nagios Enterprises, LLC. All rights reserved. Nagios, the Nagios logo, and Nagios graphics are the servicemarks, trademarks, or registered trademarks owned by Nagios Enterprises. All other servicemarks and trademarks are the property of their respective owner.
www.nagios.comPage 8 / 14
Updated – June, 2017
Network Analyzer
The Industry Standard In Infrastructure Monitoring
Understanding And Using Custom Queries

Defining Source Or Destination
Queries can be prepended by using src or dst to target a specific traffic direction. Here is a net example:
src net 10.25.0.0/16
You can see in the screenshot above that all the 10.25.0.0/16 addresses are in the Source IP column.
Here is a port example:
dst port 80
You can see in the screenshot above that port 80 is only in the Destination Port column.
1295 Bandana Blvd N, St. Paul, MN 55108 [email protected] US: 1-888-624-4671 INTL: 1-651-204-9102
© 2017 Nagios Enterprises, LLC. All rights reserved. Nagios, the Nagios logo, and Nagios graphics are the servicemarks, trademarks, or registered trademarks owned by Nagios Enterprises. All other servicemarks and trademarks are the property of their respective owner.
www.nagios.comPage 9 / 14
Updated – June, 2017
Network Analyzer
The Industry Standard In Infrastructure Monitoring
Understanding And Using Custom Queries

Logic Operator: AND
Using the AND operator can allow you to have more granular queries, for example:
src ip 10.25.254.50 AND dst port 80
Logic Operator: OR
Using the OR operator can allow you to have more flexible queries, for example:
src ip 10.25.254.50 OR dst ip 10.25.2.1
1295 Bandana Blvd N, St. Paul, MN 55108 [email protected] US: 1-888-624-4671 INTL: 1-651-204-9102
© 2017 Nagios Enterprises, LLC. All rights reserved. Nagios, the Nagios logo, and Nagios graphics are the servicemarks, trademarks, or registered trademarks owned by Nagios Enterprises. All other servicemarks and trademarks are the property of their respective owner.
www.nagios.comPage 10 / 14
Updated – June, 2017
Network Analyzer
The Industry Standard In Infrastructure Monitoring
Understanding And Using Custom Queries

Logic Operator: NOT
Using the NOT operator can allow you to have queries that exclude data, for example:
NOT dst port 53
Metrics
You can create queries on the amount of traffic that went through for each flow.
dst port 80 AND bytes > 1m
You are not limited to < and > operators either, you can use = as well. The query above was for bytes, but
you can also use packets and flows.
1295 Bandana Blvd N, St. Paul, MN 55108 [email protected] US: 1-888-624-4671 INTL: 1-651-204-9102
© 2017 Nagios Enterprises, LLC. All rights reserved. Nagios, the Nagios logo, and Nagios graphics are the servicemarks, trademarks, or registered trademarks owned by Nagios Enterprises. All other servicemarks and trademarks are the property of their respective owner.
www.nagios.comPage 11 / 14
Updated – June, 2017
Network Analyzer
The Industry Standard In Infrastructure Monitoring
Understanding And Using Custom Queries

Using Parenthesis To Group Expressions
You can add parenthesis to your expression to make it clear how the query will be executed, this allows for
more complex queries. Here is a simple example:
src ip 2001:44b8:3132:25:10:25:254:50 AND (dst port 80 OR dst port 443)
You can see that the example provided results for port 80 OR 443. This was also an example to demonstrate
that IPv6 addresses can also be queried. Here is a more complex example:
(src ip 10.25.254.50 OR src ip 10.25.14.10 OR src net
2001:44b8:3132:25:0:0:0:0/64) AND (dst port 80 OR dst port 443) AND NOT src ip
2001:44b8:3132:25:10:25:14:52 AND bytes > 10m
While a lot more complicated, you can see only one result was returned which can be very useful when
interrogating flow data. The first parenthesis targeted two IP addresses or an entire IPv6 subnet (using
multiple ORs). The second parenthesis allowed port 80 OR 443. Then two more conditions were defined.
1295 Bandana Blvd N, St. Paul, MN 55108 [email protected] US: 1-888-624-4671 INTL: 1-651-204-9102
© 2017 Nagios Enterprises, LLC. All rights reserved. Nagios, the Nagios logo, and Nagios graphics are the servicemarks, trademarks, or registered trademarks owned by Nagios Enterprises. All other servicemarks and trademarks are the property of their respective owner.
www.nagios.comPage 12 / 14
Updated – June, 2017
Network Analyzer
The Industry Standard In Infrastructure Monitoring
Understanding And Using Custom Queries

Source Groups
Queries can also be performed on Source Groups via the Source Groups menu on the navigation bar.
Click the desired Source Group and then click the Queries tab. The functionality is the same as for Sources.
Managing Queries
Queries can be managed via the Queries menu on the navigation bar.
You can delete multiple queries by checking the boxes in the left column and then clicking the Delete button.
1295 Bandana Blvd N, St. Paul, MN 55108 [email protected] US: 1-888-624-4671 INTL: 1-651-204-9102
© 2017 Nagios Enterprises, LLC. All rights reserved. Nagios, the Nagios logo, and Nagios graphics are the servicemarks, trademarks, or registered trademarks owned by Nagios Enterprises. All other servicemarks and trademarks are the property of their respective owner.
www.nagios.comPage 13 / 14
Updated – June, 2017
Network Analyzer
The Industry Standard In Infrastructure Monitoring
Understanding And Using Custom Queries
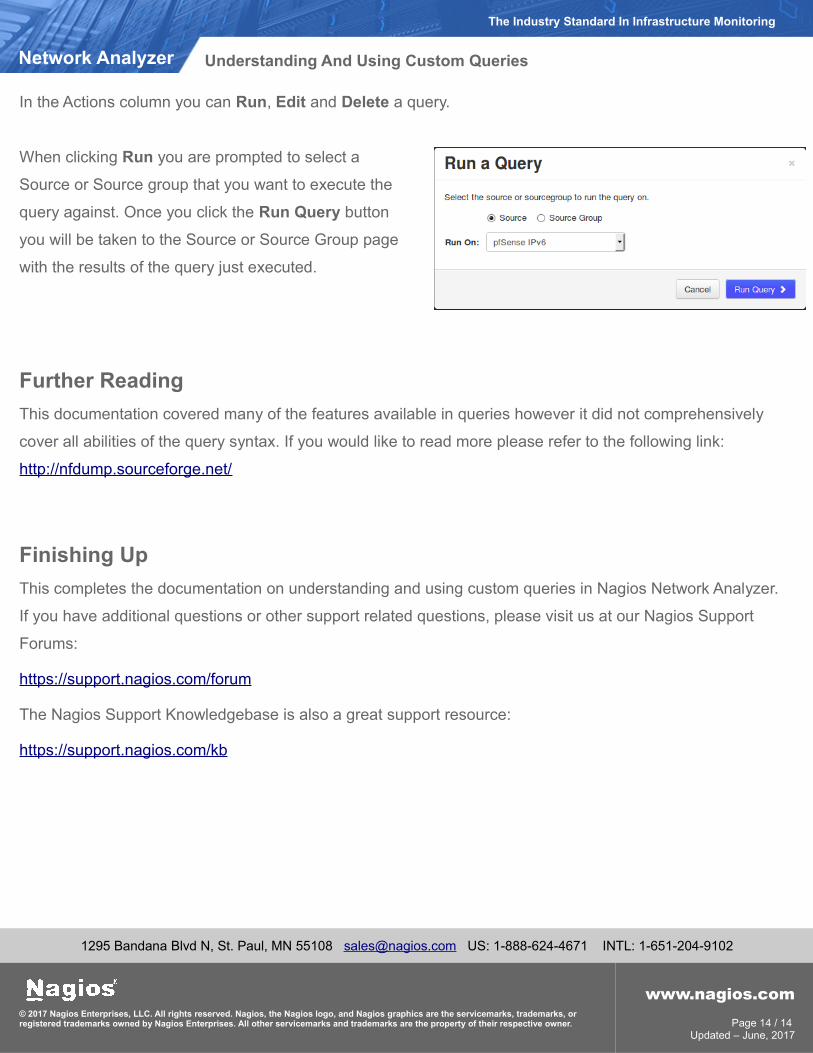
In the Actions column you can Run, Edit and Delete a query.
When clicking Run you are prompted to select a
Source or Source group that you want to execute the
query against. Once you click the Run Query button
you will be taken to the Source or Source Group page
with the results of the query just executed.
Further Reading
This documentation covered many of the features available in queries however it did not comprehensively
cover all abilities of the query syntax. If you would like to read more please refer to the following link:
http://nfdump.sourceforge.net/
Finishing Up
This completes the documentation on understanding and using custom queries in Nagios Network Analyzer.
If you have additional questions or other support related questions, please visit us at our Nagios Support
Forums:
https://support.nagios.com/forum
The Nagios Support Knowledgebase is also a great support resource:
https://support.nagios.com/kb
1295 Bandana Blvd N, St. Paul, MN 55108 [email protected] US: 1-888-624-4671 INTL: 1-651-204-9102
© 2017 Nagios Enterprises, LLC. All rights reserved. Nagios, the Nagios logo, and Nagios graphics are the servicemarks, trademarks, or registered trademarks owned by Nagios Enterprises. All other servicemarks and trademarks are the property of their respective owner.
www.nagios.comPage 14 / 14
Updated – June, 2017
Network Analyzer
The Industry Standard In Infrastructure Monitoring
Understanding And Using Custom Queries