Understanding and Predicting Graded Search Satisfaction Tang Yuk Yu 1.
23
Understanding and Predicting Graded Search Satisfaction Tang Yuk Yu 1
-
Upload
naomi-johnston -
Category
Documents
-
view
216 -
download
1
Transcript of Understanding and Predicting Graded Search Satisfaction Tang Yuk Yu 1.
1
Understanding and Predicting Graded Search Satisfaction
Tang Yuk Yu

2
Current Problem: Binary classification
Research to date has modeled and predicted search satisfaction on a binary scale
3
Solution: multi-level measurement
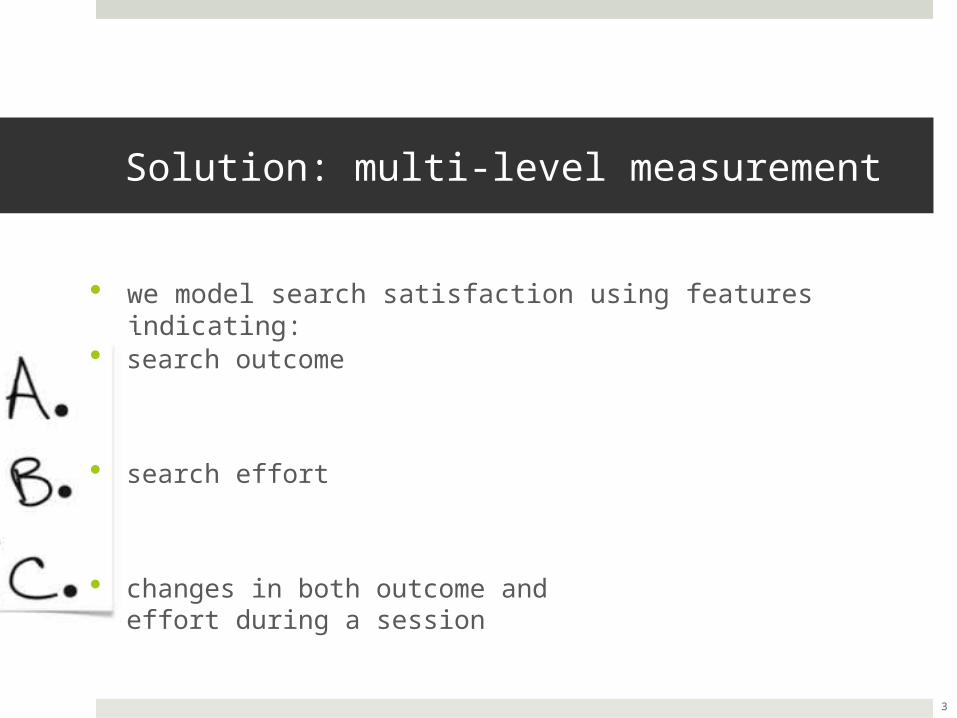
we model search satisfaction using features indicating:
search outcome
search effort
changes in both outcome and effort during a session

4
Current Problem: Results are not explained
Black box techniques:
Input: search interaction data
Output: predictions of outcomes such as satisfaction, frustration, and success.
=>we do not understand why searchers are satisfied, frustrated, or successful.

5
Solution: in-depth analysis
We show the value of search outcome compared with search effort best explains and most strongly correlates with search satisfaction.
There are rich and non-monotonous differences in search behavior in sessions with different satisfaction levels.

6
What is Satisfaction?
A subjective measure of search experience. Kelly: “satisfaction can be understood as the fulfillment of a specified desire or goal.”
In economics, we explain satisfaction in terms of utility. For example, Su [34] defined utility as a measure of worth of search results versus time, physical effort, and mental effort expended. This suggests that we can consider searcher satisfaction as a com- pound measure of multiple factors, including search outcome and search effort. In a recent study, Yilmaz et al. [37] also confirmed the impact of searcher effort on document relevance and utility.
=>The comparison of search outcomes and search effort.

7
How to collect data?
We sampled and annotated search tasks from the search logs of consenting users of the Microsoft Bing search engine in April, 2014.
These logs were collected through a widely-distributed browser toolbar. These log entries included a unique identifier for each searcher, a timestamp for each page view, a unique browser window identifier, and the URL of the Web page visited. Intranet and secure (https) URL visits were excluded at the source.

8
Data preprocessing
From these logs we extracted raw search sessions.
Every raw session began with a search query and could contain further queries and visits to clicked search results.
A session ended if the searcher was idle for more than 30 minutes
We use the term search session to refer to queries and other search activity belonging to the same search task throughout the paper
We excluded single-query sessions

9
Data Processing
The search sessions in our dataset were annotated with session search satisfaction and query result quality by crowd workers.
We assign sessions into four satisfaction levels as follows: very high (4.33 < s ≤ 5, 11.1% of the sessions); high (4.0 ≤ s ≤ 4.33, 39.7%); medium (3.33 ≤ s ≤ 3.67, 33.4%); low (s ≤ 3, 15.8%).
=>The grouping strategy ensures that there are sufficient sessions at each of the four satisfaction levels to perform statistical analysis.

10
GRADED SEARCH SATISFACTION
Satisfaction: measured as the average rating of three annotators on session satisfaction. (higher is better)
Search outcome (gain): the value of search results to the searcher, i.e., the quantity of useful information found. (higher is better)
Search effort (cost): the cost of acquiring information from the search engine, e.g., issuing queries, examining result snippets on SERPs, reading clicked results, etc.(lower is better)
11
Relationship between satisfaction and search outcome and effort
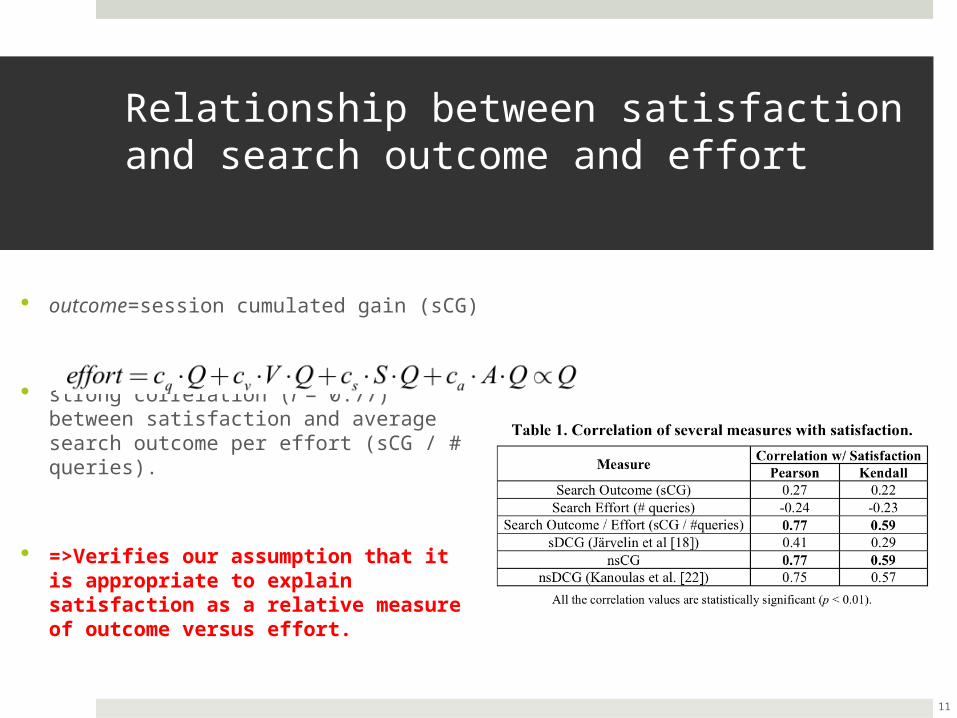
outcome=session cumulated gain (sCG)
strong correlation (r = 0.77) between satisfaction and average search outcome per effort (sCG / # queries).
=>Verifies our assumption that it is appropriate to explain satisfaction as a relative measure of outcome versus effort.

12
Prediction
Poisson regression yielded the best results and report its results in this section.

13
Conclusion
Given the presence of these differences, we developed a predictive model that can more accurately estimate graded search satisfaction than existing satisfaction modeling methods by considering search outcomes and searcher effort, both independently and in combination

14
Toward Predicting the Outcome of an A/B Experiment for Search Relevance

15
Old Method
Estimating online click-based metrics of a ranking function is to run it in a controlled experiment on live users.
=>configuring and running an online experiment is cumber- some and time-intensive.
16
New method
Uses historical search log to reliably predict online click-based metrics of a new ranking function, without actually running it on live users.
17
1st approach
Take advantage of diversified behavior of a search engine over a long period of time to simulate randomized data collection
=>our approach can be used at very low cost.

18
2nd approach
Replace exact matching (of recommended items in previous work) by fuzzy matching (of search result pages) to increase data efficiency, via a better trade-off of bias and variance.

19
Principle of A/B experiment
Incoming users are randomly split into two groups, where the control group is served by a baseline system and the treatment group by a variant.
Run the experiment for a period of time (often ranging from one week to a few weeks)
Online metrics of the two systems are compared
=>the one with higher metric values wins.

20
Limitations
The search log is not exploratory enough to cover all possible rankings for any query.
Source of bias of our approach is introduced by potential confounding in the data
=>Randomized data collection can remove these two biases, hence should be attempted whenever possible.

21
FUZZY MATCHING
Fuzzy matching searches a translation memory database for a query’s phrases or words, finding derivatives by suggesting words with approximate matching in meanings as well as spellings.
The fuzzy matching technique applies a matching percentage. The database returns possible matches for the queried word between a certain percentage (the threshold percentage) and 100 percent.

22
Scatterplot

23
Conclusion
The fuzzy matching technique based on Top-3 results can predict actual metric values
The prediction of experimental results between control and treatment ranking techniques shows reasonably high accuracy up to 58.5% – significantly higher than chance results (33.3%).


![Yuk Mendongeng Yuk [Compatibility Mode]](https://static.fdocuments.in/doc/165x107/577c78141a28abe0548ea308/yuk-mendongeng-yuk-compatibility-mode.jpg)


![DEP 5202 IT in Education [Presentation Package] Choy Sau Ying Denise (98239230) Ng Yuk Ying Becky (98239150) Wong Yuk Han Amy (98238810)](https://static.fdocuments.in/doc/165x107/56649cdf5503460f949a8cec/dep-5202-it-in-education-presentation-package-choy-sau-ying-denise-98239230.jpg)