Understanding and Modeling Organizational Systems Systems Analysis and Design, 8e Kendall & Kendall...
75
Understanding and Modeling Organizational Systems Systems Analysis and Design, 8e Kendall & Kendall 2
-
Upload
blaze-dennis -
Category
Documents
-
view
357 -
download
7
Transcript of Understanding and Modeling Organizational Systems Systems Analysis and Design, 8e Kendall & Kendall...
Understanding and
Modeling Organizational Systems
Systems Analysis and Design, 8e
Kendall & Kendall
2
Kendall & Kendall
Copyright © 2011 Pearson Education, Inc. Publishing as Prentice Hall
2-2
Three Main Forces Interacting to Shape Organizations
• Levels of management• Design of organizations• Organizational cultures
Kendall & Kendall
Copyright © 2011 Pearson Education, Inc. Publishing as Prentice Hall
2-3
Organizations Are Composed of Interrelated Subsystems
• Influenced by levels of management decision makers that cut horizontally across the organizational system• Operations• Middle management• Strategic management
• Influenced by organizational cultures and subcultures
Kendall & Kendall
Copyright © 2011 Pearson Education, Inc. Publishing as Prentice Hall
2-4
Major Topics
• Organizations as systems• Depicting systems graphically
• Data flow diagram• Entity-relationship model• Use case modeling
• Levels of management• Organizational culture
Kendall & Kendall
Copyright © 2011 Pearson Education, Inc. Publishing as Prentice Hall
2-5
Organizations as Systems
• Conceptualized as systems designed to accomplish predetermined goals and objectives
• Composed of smaller, interrelated systems serving specialized functions
• Specialized functions are reintegrated to form an effective organizational whole.
Kendall & Kendall
Copyright © 2011 Pearson Education, Inc. Publishing as Prentice Hall
2-6
Interrelatedness and Independence of Systems
• All systems and subsystems are interrelated and interdependent.
• All systems process inputs from their environments.
• All systems are contained by boundaries separating them from their environments.
• System feedback is used for planning and control
• An ideal system self-corrects or regulates itself.
Kendall & Kendall
Copyright © 2011 Pearson Education, Inc. Publishing as Prentice Hall
2-7
Organizational Environments• Community
• Physical location• Demographic profile (education, income)
• Economic• Market factors• Competition
• Political• State and local government
• Legal• Federal, state, regional, local laws, and
guidelines
Kendall & Kendall
Copyright © 2011 Pearson Education, Inc. Publishing as Prentice Hall
2-8
Openness and Closedness
• Open• Free flow of information• Output from one system becomes
input to another• Closed
• Restricted access to information• Limited by numerous rules• Information only on a “need to know”
basis
Kendall & Kendall
Copyright © 2011 Pearson Education, Inc. Publishing as Prentice Hall
2-9
Virtual Organizations and Virtual Teams
• A virtual organization has parts of the organization in different physical locations.
• Computer networks and communications technology are used to bring virtual teams together to work on projects.
Kendall & Kendall
Copyright © 2011 Pearson Education, Inc. Publishing as Prentice Hall
2-10
Benefits of Virtual Organizations and Teams
• Possibility of reducing costs of physical facilities
• More rapid response to customer needs
• Helping virtual employees to fulfill their familial obligations to children or aging parents
Kendall & Kendall
Copyright © 2011 Pearson Education, Inc. Publishing as Prentice Hall
2-11
Taking a Systems Perspective• Allows system analyst to understand
businesses before they begin their tasks • It is important that members of
subsystems realize that they are interrelated with other subsystems.
• Problems occur when each manager thinks that his/her department is the most important.
• Bigger problems may occur when that manager rises through the ranks.
Kendall & Kendall
Copyright © 2011 Pearson Education, Inc. Publishing as Prentice Hall
2-12
Enterprise Resource Planning• Enterprise Systems or Enterprise
Resource Planning (ERP) describes an integrated organizational information system.
• Software that helps the flow of information between the functional areas within the organization
Kendall & Kendall
Copyright © 2011 Pearson Education, Inc. Publishing as Prentice Hall
2-13
Context-Level Data Flow Diagrams
• Focus is on the data flowing into and out of the system and the processing of the data.
• Shows the scope of the system:• What is to be included in the system.• The external entities are outside the
scope of the system.

Kendall & Kendall
Copyright © 2011 Pearson Education, Inc. Publishing as Prentice Hall
2-14
The Basic Symbols of a Data Flow Diagram (Figure 2.4)
Kendall & Kendall
Copyright © 2011 Pearson Education, Inc. Publishing as Prentice Hall
2-15
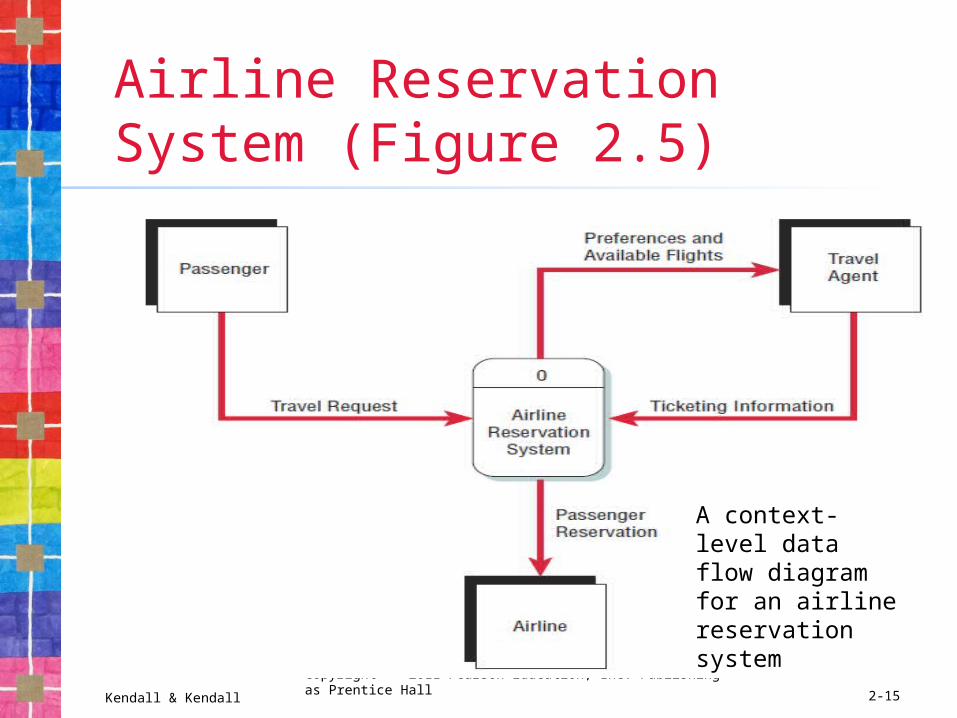
Airline Reservation System (Figure 2.5)
A context-level data flow diagramfor an airline reservation system
Kendall & Kendall
Copyright © 2011 Pearson Education, Inc. Publishing as Prentice Hall
2-16
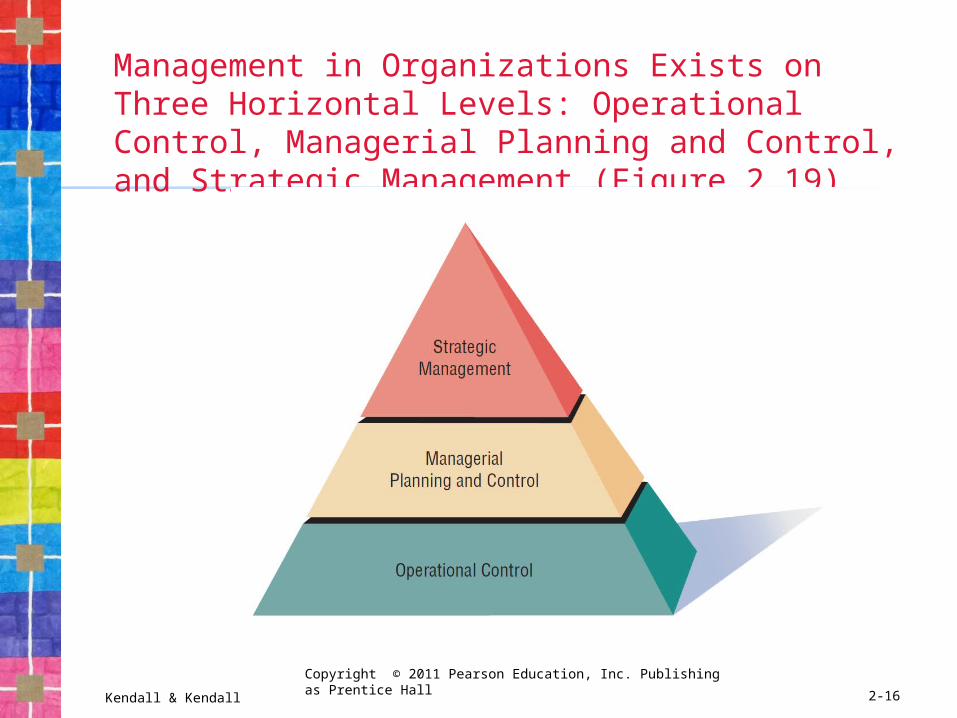
Management in Organizations Exists on Three Horizontal Levels: Operational Control, Managerial Planning and Control, and Strategic Management (Figure 2.19)
Kendall & Kendall
Copyright © 2011 Pearson Education, Inc. Publishing as Prentice Hall
2-17
Operations Control
• Make decisions using predetermined rules that have predictable outcomes.
• Oversee the operating details of the organization.
Kendall & Kendall
Copyright © 2011 Pearson Education, Inc. Publishing as Prentice Hall
2-18
Managerial Planning and Control• Make short-term planning and
control decisions about resources and organizational objectives.
• Decisions may be partly operational and partly strategic.
Kendall & Kendall
Copyright © 2011 Pearson Education, Inc. Publishing as Prentice Hall
2-19
Strategic Management
• Look outward from the organization to the future.
• Make decisions that will guide middle and operations managers.
• Work in highly uncertain decision-making environment.
• Define the organization as a whole.
Kendall & Kendall
Copyright © 2011 Pearson Education, Inc. Publishing as Prentice Hall
2-20
Managerial Levels
• Different organization structure• Leadership style• Technological considerations• Organization culture• Human interaction• All carry implications for the analysis
and design of information systems
Kendall & Kendall
Copyright © 2011 Pearson Education, Inc. Publishing as Prentice Hall
2-21
Organizational Culture
• Organizations have cultures and subcultures.
• Learn from verbal and nonverbal symbolism.
Project Management
Systems Analysis and Design, 8e
Kendall & Kendall
3
Kendall & Kendall
Copyright © 2011 Pearson Education, Inc. Publishing as Prentice Hall
3-23
Project Management Fundamentals
• Project initiation• Determining project feasibility• Activity planning and control• Project scheduling• Managing systems analysis team
members
Kendall & Kendall
Copyright © 2011 Pearson Education, Inc. Publishing as Prentice Hall
3-24
Major Topics
• Project initiation• Determining feasibility• Determining resources• Activity planning and control
• Gantt charts• PERT diagrams
• Managing analysis and design activities
Kendall & Kendall
Copyright © 2011 Pearson Education, Inc. Publishing as Prentice Hall
3-25
Project Initiation
• Problems in the organization• Problems that lend themselves to
systems solutions
• Opportunities for improvement• Caused through upgrading, altering,
or installing new systems
Kendall & Kendall
Copyright © 2011 Pearson Education, Inc. Publishing as Prentice Hall
3-26
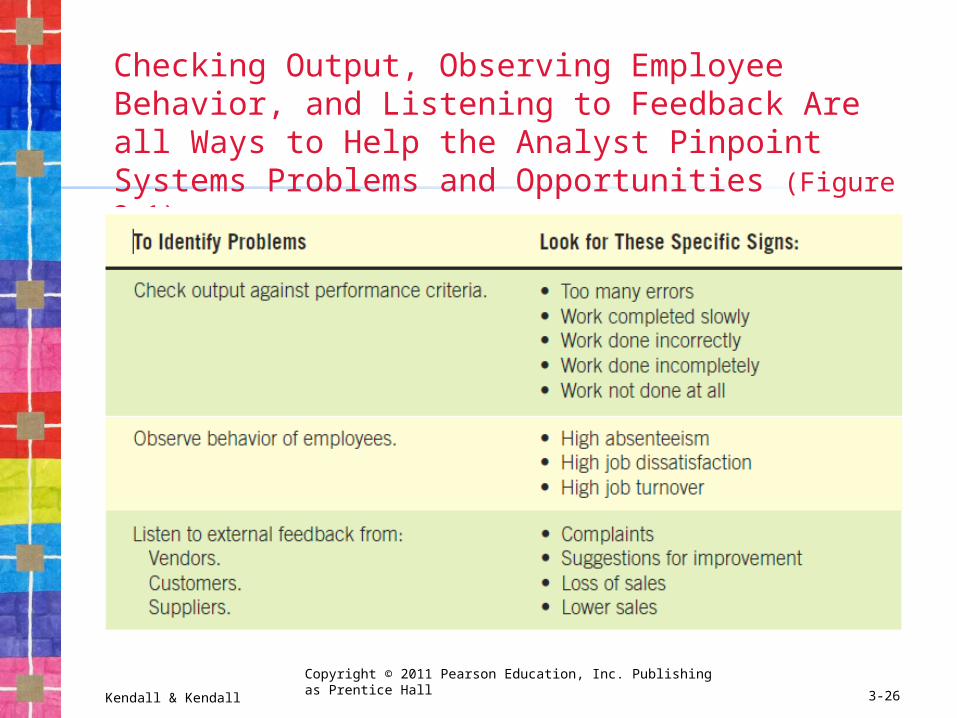
Checking Output, Observing Employee Behavior, and Listening to Feedback Are all Ways to Help the Analyst Pinpoint Systems Problems and Opportunities (Figure 3.1)
Kendall & Kendall
Copyright © 2011 Pearson Education, Inc. Publishing as Prentice Hall
3-27
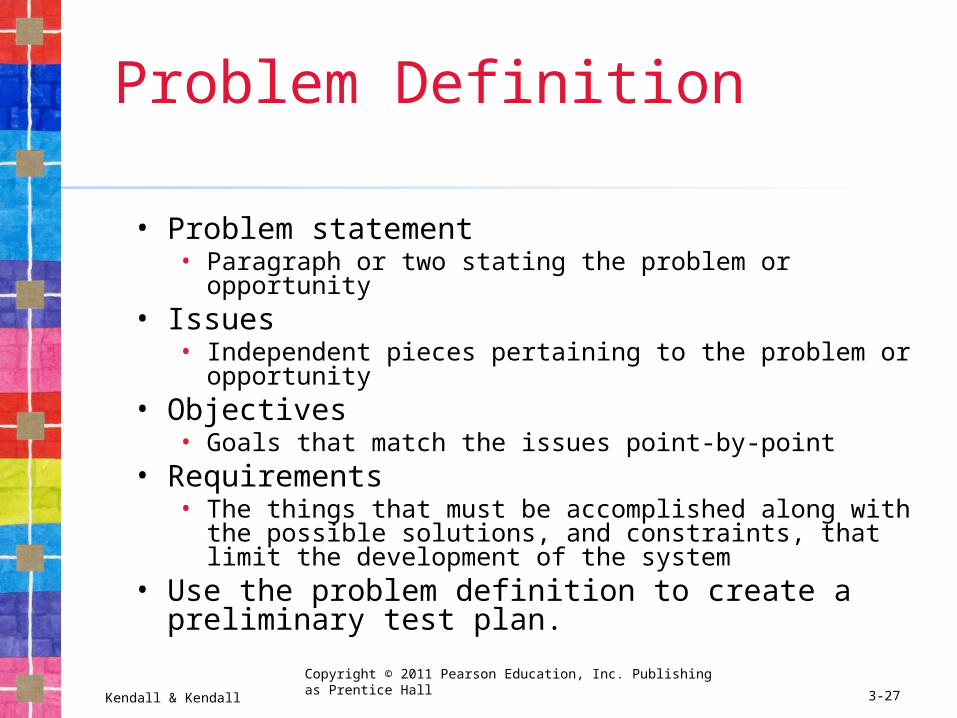
Problem Definition
• Problem statement• Paragraph or two stating the problem or opportunity
• Issues• Independent pieces pertaining to the problem or
opportunity• Objectives
• Goals that match the issues point-by-point• Requirements
• The things that must be accomplished along with the possible solutions, and constraints, that limit the development of the system
• Use the problem definition to create a preliminary test plan.
Kendall & Kendall
Copyright © 2011 Pearson Education, Inc. Publishing as Prentice Hall
3-28
Problem Definition Steps
• Find a number of points that may be included in one issue.
• State the objective.• Determine the relative importance
of the issues or objectives.• Identify which objectives are most
critical.
Kendall & Kendall
Copyright © 2011 Pearson Education, Inc. Publishing as Prentice Hall
3-29
Selection Of Projects
• Backing from management• Appropriate timing of project commitment• Possibility of improving attainment of
organizational goals• Practical in terms of resources for the
system analyst and organization• Worthwhile project compared with other
ways the organization could invest resources
Kendall & Kendall
Copyright © 2011 Pearson Education, Inc. Publishing as Prentice Hall
3-30
Selection of Projects: Improving Attainment of Organizational Goals• Improving corporate profits• Supporting the competitive strategy of
the organization• Improving cooperation with vendors and
partners• Improving internal operations support • Improving internal decision support so
that decisions are more effective• Improving customer service• Increasing employee morale
Kendall & Kendall
Copyright © 2011 Pearson Education, Inc. Publishing as Prentice Hall
3-31
Defining Objectives
Many possible objectives exist including:• Speeding up a process• Streamlining a process• Combining processes• Reducing errors in input• Reducing redundant storage• Reducing redundant output• Improving system and subsystem integration
Kendall & Kendall
Copyright © 2011 Pearson Education, Inc. Publishing as Prentice Hall
3-32
Determining Feasibility
• Defining objectives• Determining resources
• Operationally• Technically• Economically
Kendall & Kendall
Copyright © 2011 Pearson Education, Inc. Publishing as Prentice Hall
3-33
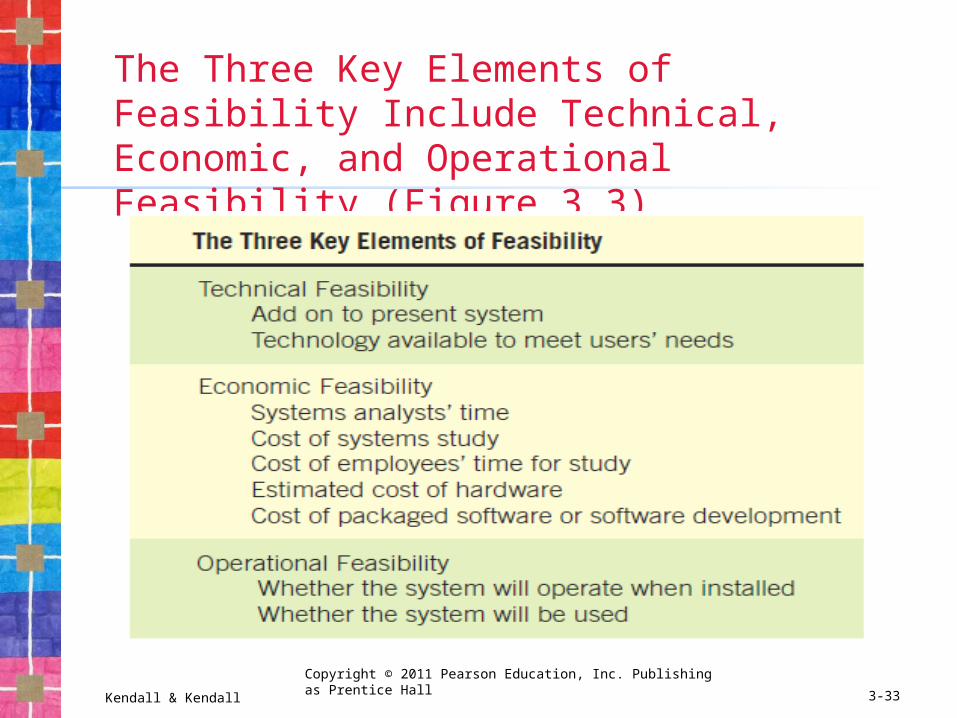
The Three Key Elements of Feasibility Include Technical, Economic, and Operational Feasibility (Figure 3.3)
Kendall & Kendall
Copyright © 2011 Pearson Education, Inc. Publishing as Prentice Hall
3-34
Technical Feasibility
• Can current technical resources be upgraded or added to in a manner that fulfills the request under consideration?
• If not, is there technology in existence that meets the specifications?
Kendall & Kendall
Copyright © 2011 Pearson Education, Inc. Publishing as Prentice Hall
3-35
Economic Feasibility
• Economic feasibility determines whether value of the investment exceeds the time and cost.
• Includes: • Analyst and analyst team time• Business employee time• Hardware• Software• Software development
Kendall & Kendall
Copyright © 2011 Pearson Education, Inc. Publishing as Prentice Hall
3-36
Operational Feasibility
• Operational feasibility determines if the human resources are available to operate the system once it has been installed.
• Users that do not want a new system may prevent it from becoming operationally feasible.
Kendall & Kendall
Copyright © 2011 Pearson Education, Inc. Publishing as Prentice Hall
3-37
Ascertaining Hardware and Software Needs• Steps used to determine hardware
and software needs:• Inventory computer hardware currently
available• Estimate current and future system
workloads• Evaluate available hardware and
software • Choose the vendor• Acquire the computer equipment
Kendall & Kendall
Copyright © 2011 Pearson Education, Inc. Publishing as Prentice Hall
3-38
Inventorying Computer Hardware
• Type of equipment• Operation status of the equipment• Estimated age of equipment• Projected life of equipment• Physical location of equipment• Department or person responsible for
equipment• Financial arrangement for equipment
Kendall & Kendall
Copyright © 2011 Pearson Education, Inc. Publishing as Prentice Hall
3-39
Estimating Workloads
• Systems analysts formulate numbers that represent both current and projected workloads for the system so that any hardware obtained will possess the capability to handle current and future workloads.
Kendall & Kendall
Copyright © 2011 Pearson Education, Inc. Publishing as Prentice Hall
3-40
Evaluating Hardware• Time required for average transactions• Total volume capacity of the system• Idle time of the CPU or network• Size of memory provided
People to evaluate hardware• Management• Users• Systems analysts
Kendall & Kendall
Copyright © 2011 Pearson Education, Inc. Publishing as Prentice Hall
3-41
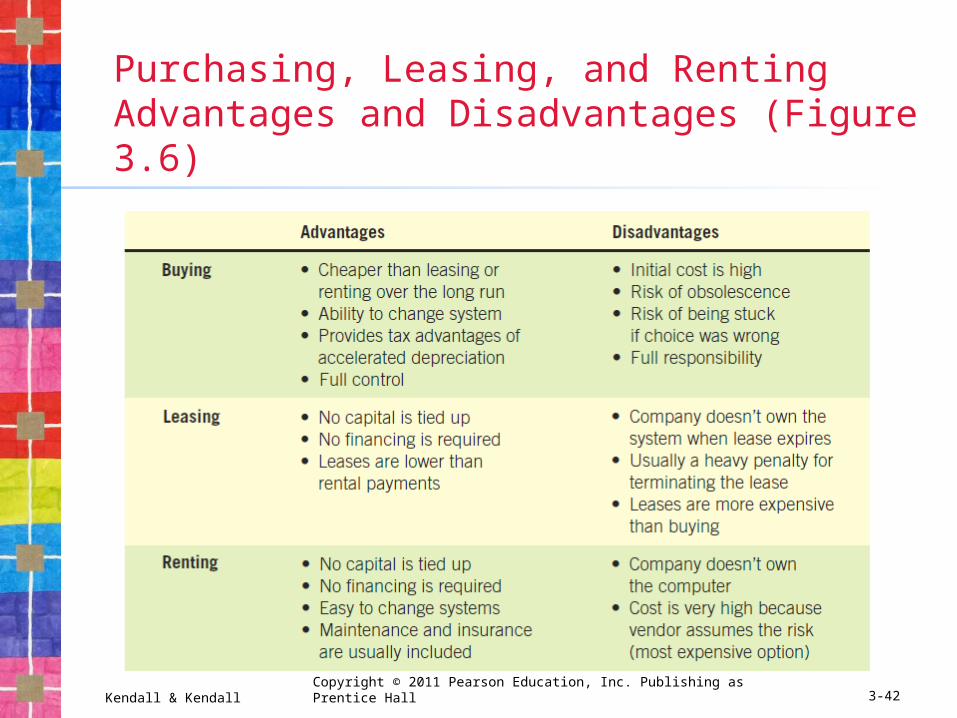
Acquisition of Computer Equipment• Purchasing• Leasing• Rental
Kendall & Kendall Copyright © 2011 Pearson Education, Inc. Publishing as Prentice Hall 3-42
Purchasing, Leasing, and Renting Advantages and Disadvantages (Figure 3.6)
Kendall & Kendall
Copyright © 2011 Pearson Education, Inc. Publishing as Prentice Hall
3-43
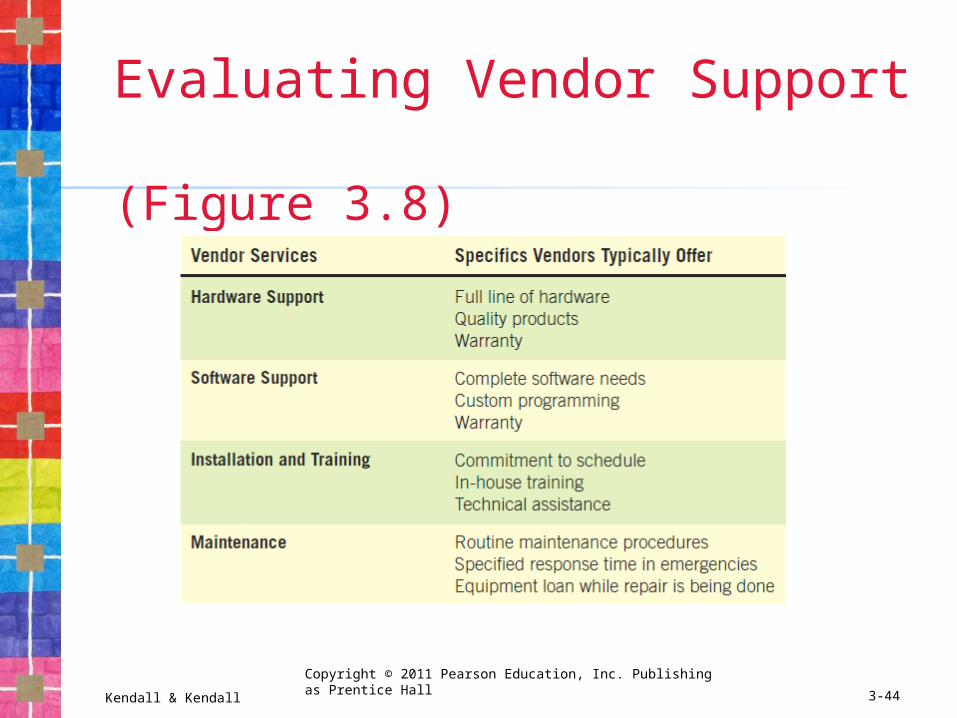
Evaluating Vendor Support
• Hardware support• Software support• Installation and training support• Maintenance support
Kendall & Kendall
Copyright © 2011 Pearson Education, Inc. Publishing as Prentice Hall
3-44
Evaluating Vendor Support (Figure 3.8)
Kendall & Kendall
Copyright © 2011 Pearson Education, Inc. Publishing as Prentice Hall
3-45
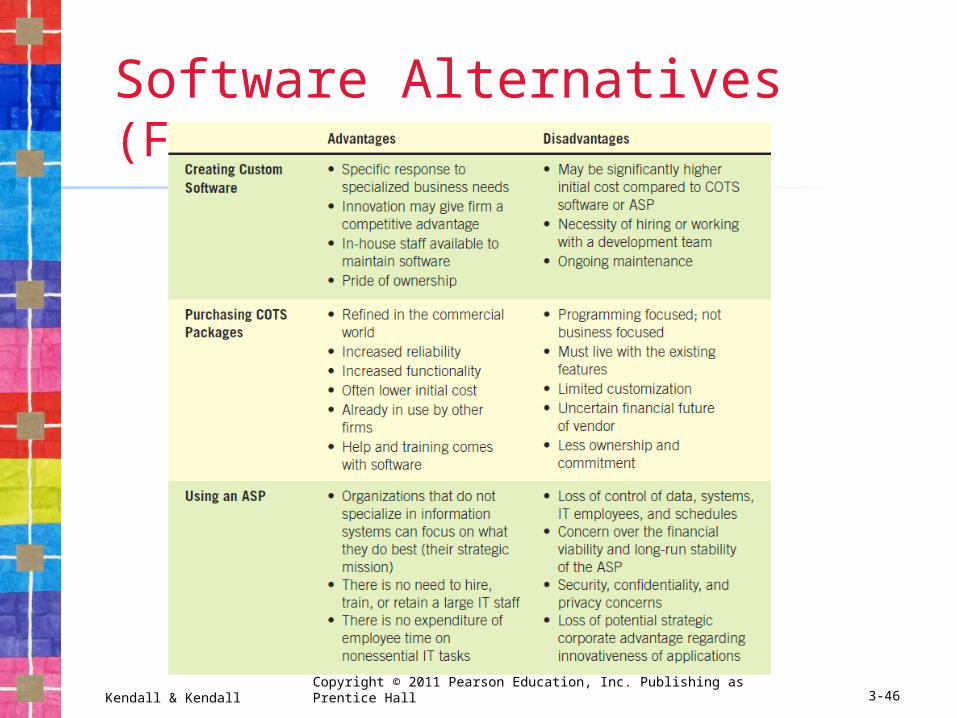
Software Alternatives
• Custom-built software• Purchased as COTS (commercial
off-the-shelf) software• Provided by an outsourced
application service provider (ASP)
Kendall & Kendall Copyright © 2011 Pearson Education, Inc. Publishing as Prentice Hall 3-46
Software Alternatives (Figure 3.9)
Kendall & Kendall
Copyright © 2011 Pearson Education, Inc. Publishing as Prentice Hall
3-47
Software Evaluation
• Performance effectiveness• Performance efficiency• Ease of use• Flexibility• Quality of documentation• Manufacturer support
Kendall & Kendall
Copyright © 2011 Pearson Education, Inc. Publishing as Prentice Hall
3-48
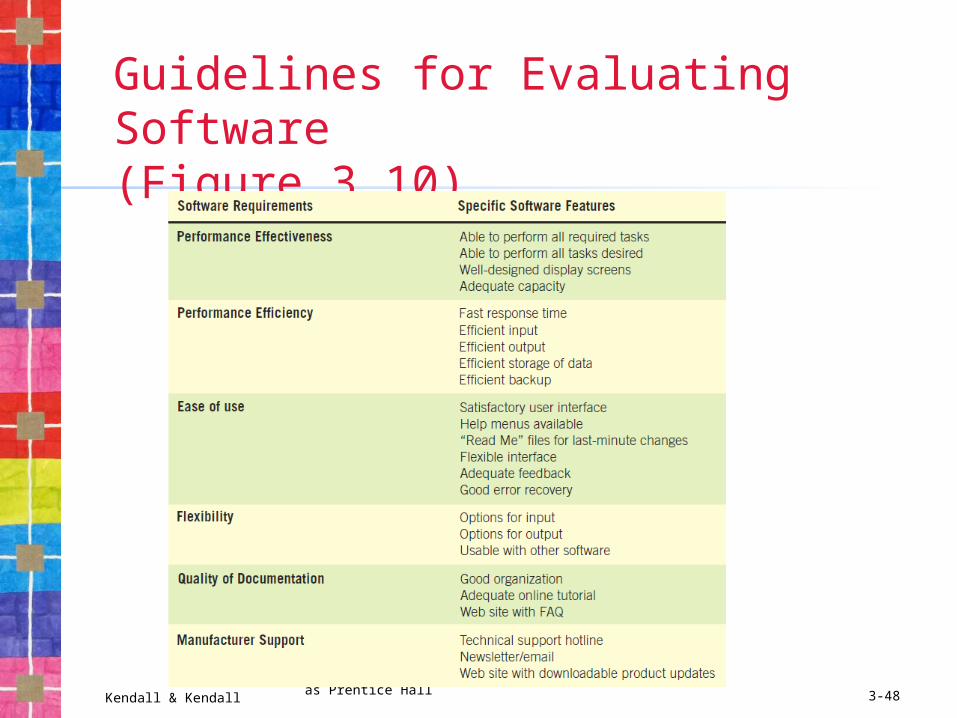
Guidelines for Evaluating Software(Figure 3.10)
Kendall & Kendall
Copyright © 2011 Pearson Education, Inc. Publishing as Prentice Hall
3-49
Activity Planning and Control• Planning includes:
• Selecting a systems analysis team• Estimating time required to complete each
task• Scheduling the project
• Control includes:• Comparing the plan for the project with its
actual evolution• Taking appropriate action to expedite or
reschedule activities
Kendall & Kendall
Copyright © 2011 Pearson Education, Inc. Publishing as Prentice Hall
3-50
Identifying Benefits and Costs• Tangible benefits are advantages
measurable in dollars through the use of the information system.
• Intangible benefits are difficult to measure.
• Tangible costs are accurately projected by the systems analyst and accounting personnel.
• Intangible costs are difficult to estimate and may not be known.
Kendall & Kendall
Copyright © 2011 Pearson Education, Inc. Publishing as Prentice Hall
3-51
Tangible Benefits
• Advantages measurable in dollars that accrue to the organization through the use of the information system
• Examples:• Increase in the speed of processing• Access to otherwise inaccessible information• Access to information on a more timely basis• The advantage of the computer’s superior
calculating power• Decreases in the amount of employee time
needed to complete specific tasks
Kendall & Kendall
Copyright © 2011 Pearson Education, Inc. Publishing as Prentice Hall
3-52
Intangible Benefits
• Intangible benefits are benefits from use of the information system that are difficult to measure.
• Examples:• Improving the decision-making process• Enhancing accuracy• Becoming more competitive in customer
service• Maintaining a good business image• Increasing job satisfaction
Kendall & Kendall
Copyright © 2011 Pearson Education, Inc. Publishing as Prentice Hall
3-53
Tangible Costs
• Those that can be accurately projected by systems analysts and the business’ accounting personnel
• Examples:• Cost of equipment• Cost of resources• Cost of systems analysts’ time• Cost of programmers’ time• Employees’ salaries
Kendall & Kendall
Copyright © 2011 Pearson Education, Inc. Publishing as Prentice Hall
3-54
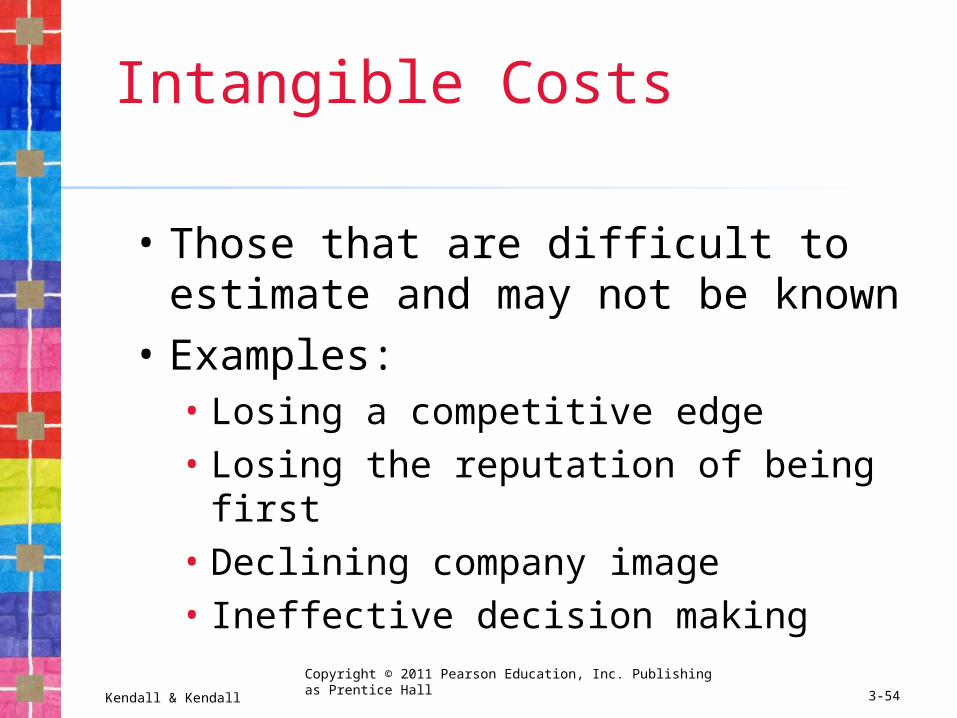
Intangible Costs
• Those that are difficult to estimate and may not be known
• Examples:• Losing a competitive edge• Losing the reputation of being first• Declining company image• Ineffective decision making
Kendall & Kendall
Copyright © 2011 Pearson Education, Inc. Publishing as Prentice Hall
3-55
Comparing Costs and Benefits• Break-even analysis• Payback• Cash-flow analysis• Present value analysis
Kendall & Kendall
Copyright © 2011 Pearson Education, Inc. Publishing as Prentice Hall
3-56
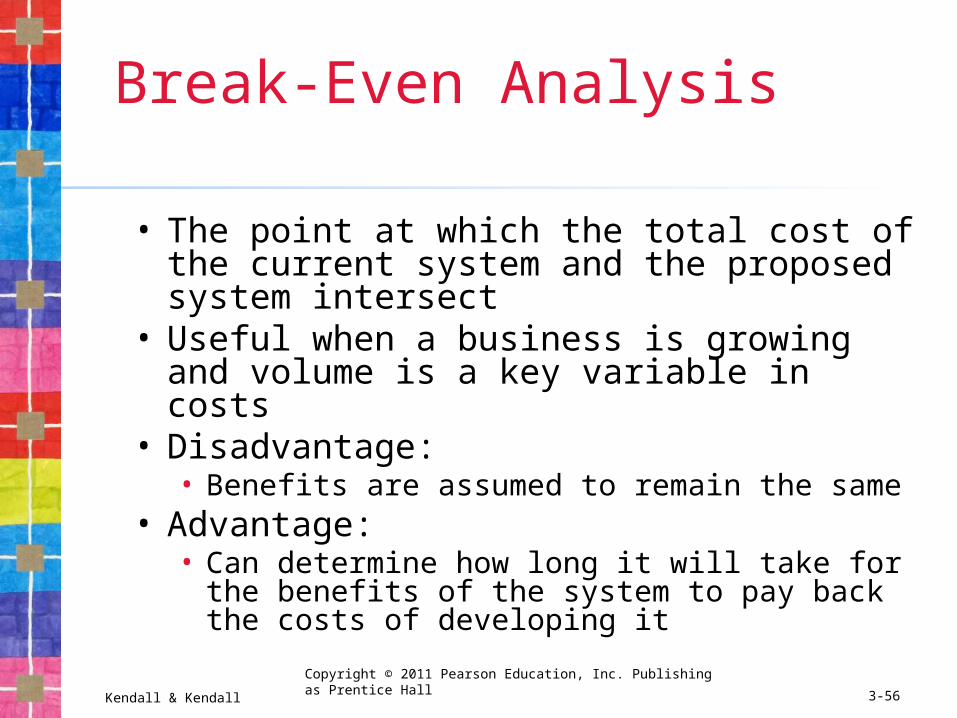
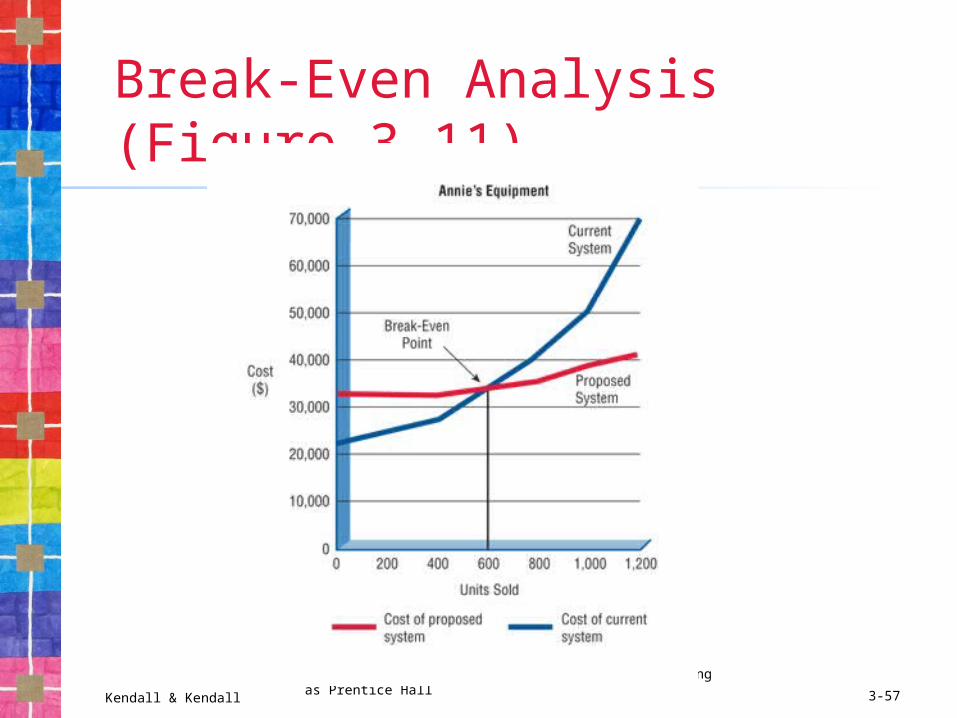
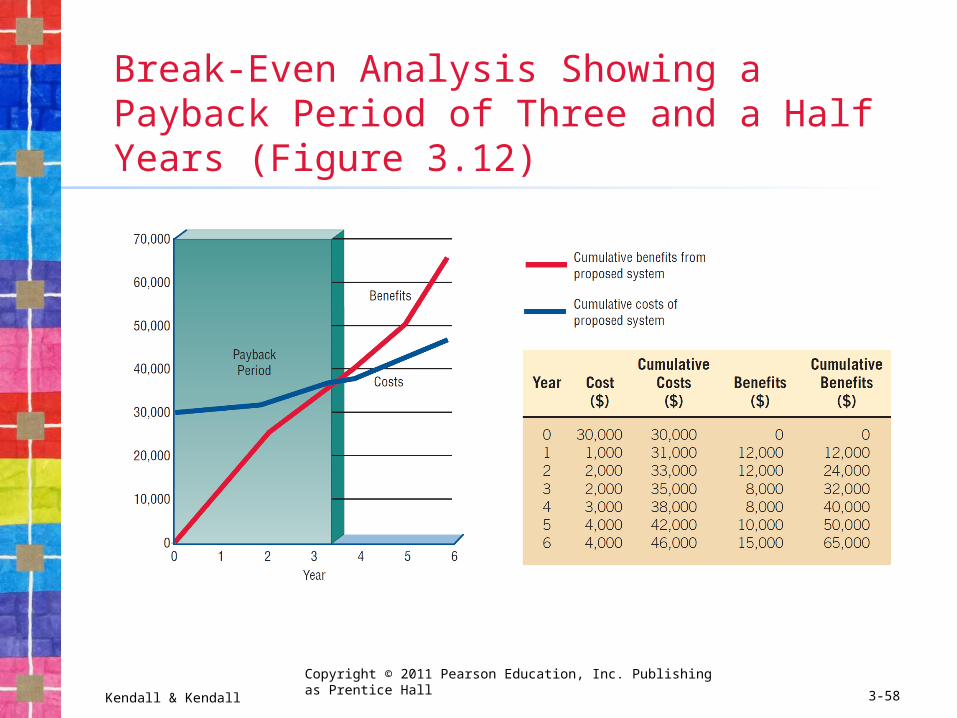
Break-Even Analysis
• The point at which the total cost of the current system and the proposed system intersect
• Useful when a business is growing and volume is a key variable in costs
• Disadvantage:• Benefits are assumed to remain the same
• Advantage:• Can determine how long it will take for the
benefits of the system to pay back the costs of developing it
Kendall & Kendall
Copyright © 2011 Pearson Education, Inc. Publishing as Prentice Hall
3-57
Break-Even Analysis (Figure 3.11)
Kendall & Kendall
Copyright © 2011 Pearson Education, Inc. Publishing as Prentice Hall
3-58
Break-Even Analysis Showing a Payback Period of Three and a Half Years (Figure 3.12)
Kendall & Kendall
Copyright © 2011 Pearson Education, Inc. Publishing as Prentice Hall
3-59
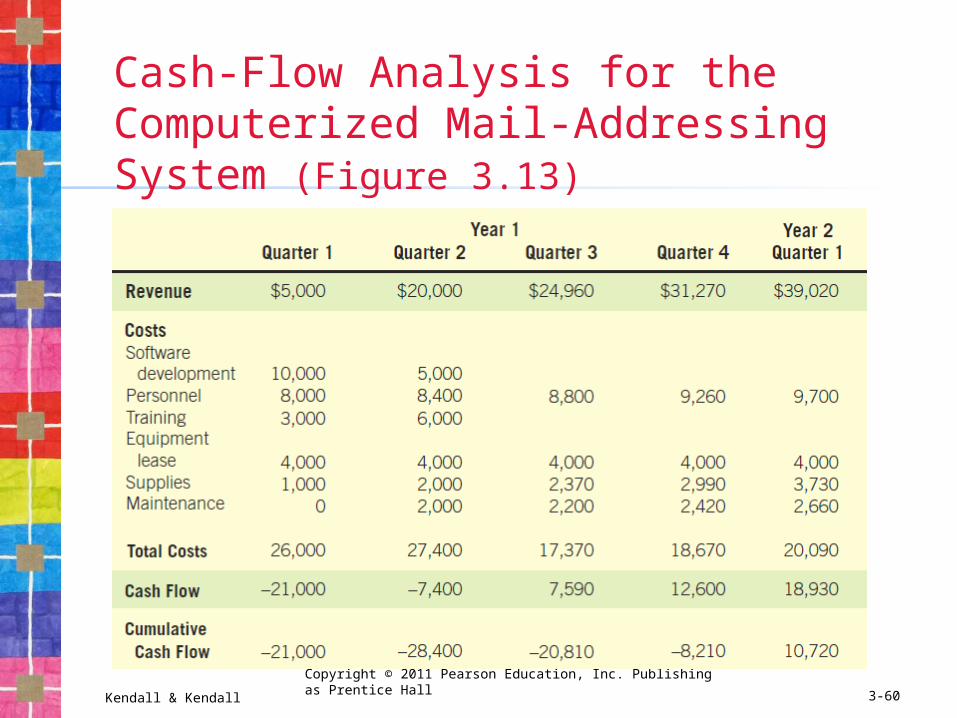
Cash-Flow Analysis
• Examines the direction, size, and pattern of cash flow that is associated with the proposed information system
• Determines when cash outlays and revenues will occur for both; not only for the initial purchase, but over the life of the information system
Kendall & Kendall
Copyright © 2011 Pearson Education, Inc. Publishing as Prentice Hall
3-60
Cash-Flow Analysis for the Computerized Mail-Addressing System (Figure 3.13)
Kendall & Kendall
Copyright © 2011 Pearson Education, Inc. Publishing as Prentice Hall
3-61
Present Value Analysis
• Way to assess all the economic outlays and revenues of the information system over its economic life, and to compare costs today with future costs and today’s benefits with future benefits
• Presents the time value of the investment in the information system as well as the cash flow
Kendall & Kendall Copyright © 2011 Pearson Education, Inc. Publishing as Prentice Hall 3-62
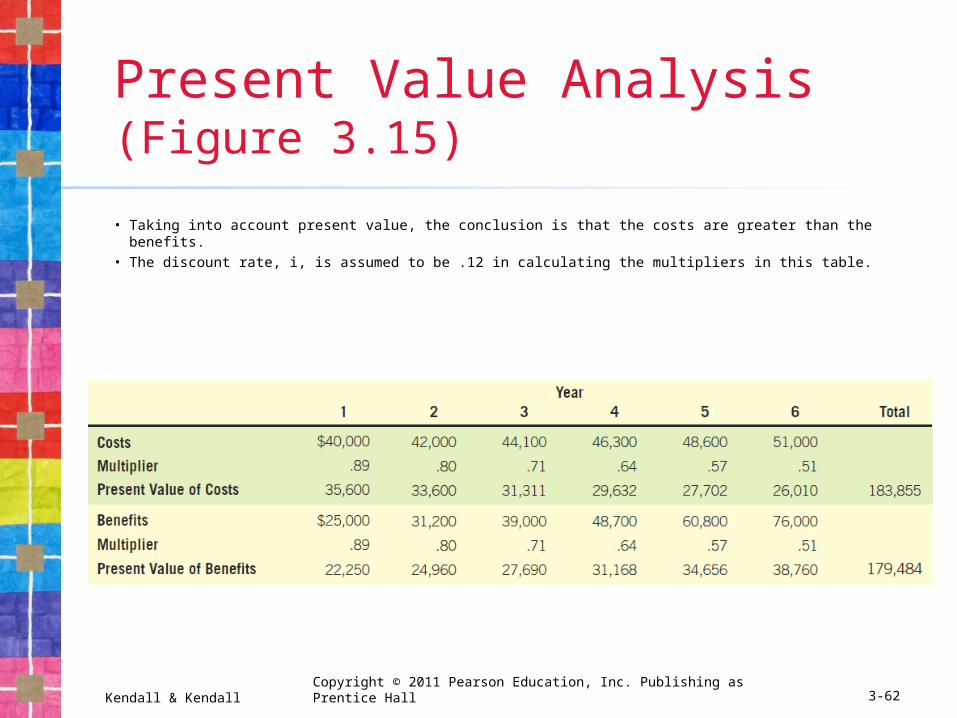
Present Value Analysis (Figure 3.15)
• Taking into account present value, the conclusion is that the costs are greater than the benefits.
• The discount rate, i, is assumed to be .12 in calculating the multipliers in this table.
Kendall & Kendall
Copyright © 2011 Pearson Education, Inc. Publishing as Prentice Hall
3-63
Guidelines for Analysis
• Use break-even analysis if the project needs to be justified in terms of cost, not benefits.
• Use payback when the improved tangible benefits form a convincing argument for the proposed system.
• Use cash-flow analysis when the project is expensive, relative to the size of the company.
• Use present value when the payback period is long or when the cost of borrowing money is high.
Kendall & Kendall
Copyright © 2011 Pearson Education, Inc. Publishing as Prentice Hall
3-64
Estimating Time
• Project is broken down into phases.• Further project is broken down into
tasks or activities.• Finally project is broken down into steps
or even smaller units.• Time is estimated for each task or
activity.• Most likely, pessimistic and optimistic
estimates for time may be used.
Kendall & Kendall
Copyright © 2011 Pearson Education, Inc. Publishing as Prentice Hall
3-65
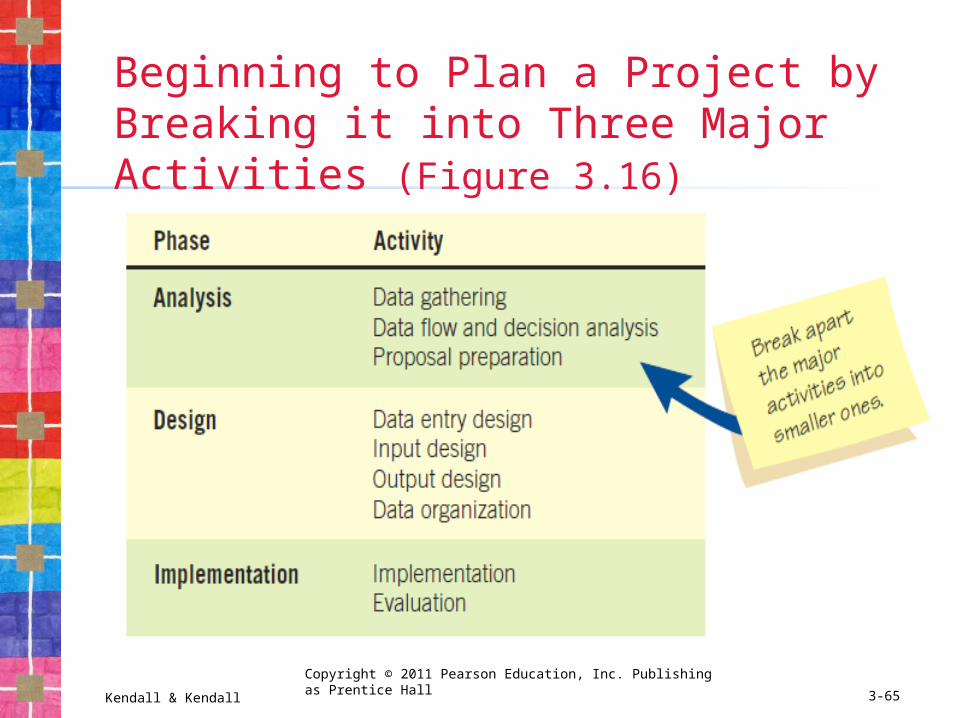
Beginning to Plan a Project by Breaking it into Three Major Activities (Figure 3.16)
Kendall & Kendall
Copyright © 2011 Pearson Education, Inc. Publishing as Prentice Hall
3-66
Project Scheduling Tools
• Gantt Charts• Simple• Lends itself to end user
communication• Drawn to scale
• PERT diagrams• Useful when activities can be done in
parallel
Kendall & Kendall
Copyright © 2011 Pearson Education, Inc. Publishing as Prentice Hall
3-67
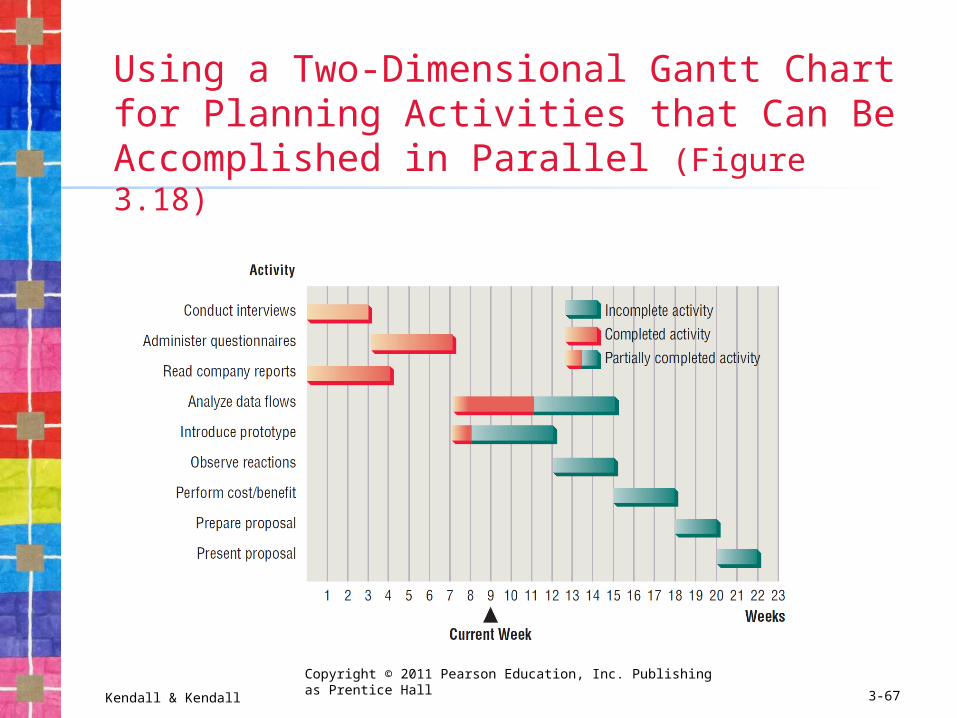
Using a Two-Dimensional Gantt Chart for Planning Activities that Can Be Accomplished in Parallel (Figure 3.18)
Kendall & Kendall
Copyright © 2011 Pearson Education, Inc. Publishing as Prentice Hall
3-68
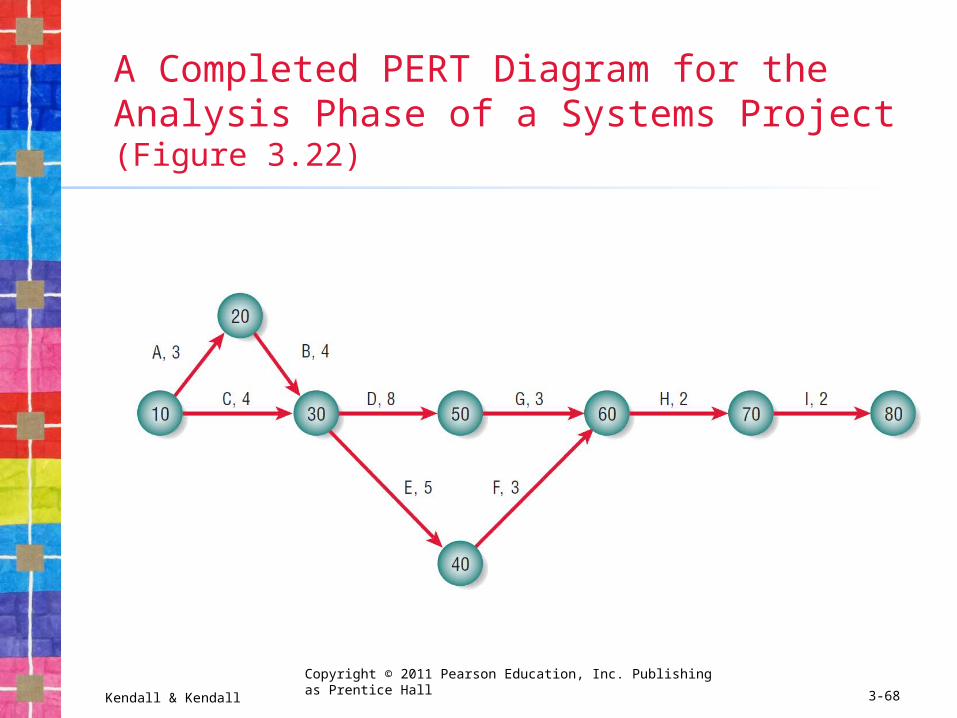
A Completed PERT Diagram for the Analysis Phase of a Systems Project (Figure 3.22)
Kendall & Kendall
Copyright © 2011 Pearson Education, Inc. Publishing as Prentice Hall
3-69
PERT Diagram Advantages
• Easy identification of the order of precedence
• Easy identification of the critical path and thus critical activities
• Easy determination of slack time
Kendall & Kendall
Copyright © 2011 Pearson Education, Inc. Publishing as Prentice Hall
3-70
Estimating Project Complexity• Estimating models
• Costar• Construx
• Function point analysis• Helps the analyst quantitatively
estimate the overall length of software development efforts
Kendall & Kendall
Copyright © 2011 Pearson Education, Inc. Publishing as Prentice Hall
3-71
Managing Analysis and Design Activities
• Team management• Assembling a team• Team communication strategies• Project productivity goals• Team member motivation
Kendall & Kendall
Copyright © 2011 Pearson Education, Inc. Publishing as Prentice Hall
3-72
Ecommerce Project Management Ecommerce and traditional software
project management differences:• The data used by ecommerce systems
is scattered across the organization.• Ecommerce systems need a staff with a
wide variety of skills.• Partnerships must be built externally
and internally well ahead of implementation.
• Data security is of utmost importance.
Kendall & Kendall
Copyright © 2011 Pearson Education, Inc. Publishing as Prentice Hall
3-73
Project Charter
• Written document describing the expected results and time frame for delivery of the project:• What does the user expect of the project?• What is the scope of the project? • What analysis methods are used to interact with users?• What are the project deliverables?• What is the estimated project timeline?• Who are the key participants?• Who will evaluate the system and how will they
evaluate it?• Who will train the users?• Who will maintain the system?
Kendall & Kendall
Copyright © 2011 Pearson Education, Inc. Publishing as Prentice Hall
3-74
Project Failures
• Project failures may be prevented by:• Training• Experience• Learning why other projects have failed
• Fishbone diagram systematically lists all of the possible problems that can occur
Kendall & Kendall
Copyright © 2011 Pearson Education, Inc. Publishing as Prentice Hall
3-75
The Systems Proposal
• Cover letter• Title page of project• Table of contents• Executive summary • Outline of systems study with appropriate
documentation• Detailed results of the systems study• Systems alternatives • Systems analysts recommendations• Summary• Appendices