Understanding and Improving the H-1B Visa Program · Understanding and Improving the H-1B Visa...
32
Understanding and Improving the H-1B Visa Program APRIL 2015 BRIEFING PREPARED BY CompeteAmerica Partnership for a New American Economy U.S. Chamber of Commerce
Transcript of Understanding and Improving the H-1B Visa Program · Understanding and Improving the H-1B Visa...
Understanding and Improving the H-1B Visa Program
APRIL 2015 BRIEFING
PREPARED BY
CompeteAmerica
Partnership for a New American Economy
U.S. Chamber of Commerce

ABOUT THE HOSTS
The Compete America coalition is the leading advocate for reform of U.S. immigration policy for highly educated foreign professionals. Our members include corporations, universities, research institutions and trade associations.
Learn more at CompeteAmerica.org
The Partnership for a New American Economy brings together more than 500 Republican, Democratic and Independent mayors and business leaders who support immigration reforms that will help create jobs for Americans today. The Partnership’s members include mayors of more than 35 million people nationwide and business leaders of companies that generate more than $1.5 trillion and employ more than 4 million people across all sectors of the
economy, from Agriculture to Aerospace, Hospitality to High Tech and Media to Manufacturing. Partnership members understand that immigration is essential to maintaining the productive, diverse and flexible workforce that America
needs to ensure prosperity over the coming generations. Learn more at RenewOurEconomy.org
The U.S. Chamber of Commerce is the world’s largest business federation, representing the interests of more than three million businesses and organizations of every size, sector, and region, as well as state and local chambers and
industry associations, and dedicated to promoting, protecting, and defending America’s free enterprise system.Learn more at USChamber.com/immigration
PARTNERS

In a Nutshell
IN A
NU
TSHELL
1
There are two parts to understanding and improving the H-1B visa program:
• Part I – Understanding the Data: The Economics of the Scarcity in STEM and the Benefits of H-1B workers
• Part II – Understanding How the H-1B System Works in Practice: How American Employers Recruit and How They Actually Use H-1Bs
PART ONE: Understanding the Data: How the Scarcity in STEM Slows Economic Growth and How the H-1B Visa Program Grows the Economy and Creates American Jobs
1. There is a large and growing scarcity of STEM students:
• Census Bureau data show that only about 19 percent of U.S.-born students earning a bachelor’s degree complete a major in a core STEM field, a rate roughly half of that found in many developed nations.
• The Government Accountability Office (GAO) found that during the decade between the 2002–2003 academic year and the 2011–2012 academic year, foreign students in the United States earned graduate degrees in core STEM fields ten times more frequently than U.S. citizens and green card holders.
2. There is a large and growing scarcity of STEM workers:
• By 2018, the United States will face a shortfall of more than 223,000 workers in STEM fields.
• Even during the worst years of the Great Recession, from 2009 to 2011, 1.9 STEM jobs were posted online for every unemployed STEM worker looking for work in the United States.
• Immigration restrictionists base their claim that there is no STEM shortage on the fact that many STEM graduates do not work in STEM fields, but this claim relies on misleading or misused STEM employment data, counting medieval history degree holders as STEM graduates, and finding that STEM graduates who go into medicine, finance, or management are not using their STEM degree.

3. Foreign, highly skilled workers who come to the United States on the H-1B visa benefit the U.S. economy and create American jobs:
• For every H-1B worker, 1.83 jobs for native-born Americans are created.
• An increase in foreign STEM workers of 1 percent of total employment increased wages of native-born college educated workers (STEM and non-STEM by 4 to 6 percent.)
• Highly skilled foreign-born STEM workers in the United States may explain up to a quarter of productivity growth in the country over the last 20 years.
• The Congressional Budget Office (CBO) says increasing highly skilled immigration will improve economic growth by more than $100 billion over the next decade.
PART TWO: Understanding How the H-1B System Works in Practice: How American Employers Recruit and How They Actually Use H-1Bs
1. The H-1B process is complicated, complex, and costly:
• Employers hire H-1Bs only when they are willing to settle for uncertainty.
2. The requirement to pay fair market wages protects against job displacement of U.S. workers:
• Employers pay competitive wages based on all available options.
• Congress should update and modernize the prevailing wage construct it established 25 years ago.
IN A
NU
TSH
ELL
2

Executive Summary
The United States is home to many of the best universities in the world. They are the cradles of the U.S. innovation economy, drawing not only the brightest minds from around the country but also many of the most talented individuals from all over the globe. Our universities are a magnet for top talent and are an enormous competitive advantage for the United States. However, we increasingly squander this advantage with immigration policies that make it extremely difficult for foreign students to remain in the country and work after they graduate.
This makes little sense for the U.S. economy, especially at a time when we face a growing scarcity of highly skilled students and workers in the United States. STEM jobs grew three times faster than the rest of the economy over the last decade and are projected to continue to outpace job growth in non-STEM fields. This has already led to a situation where there are nearly two open STEM jobs for every STEM applicant nationwide. By 2018, even if every single American master’s or Ph.D. graduate in science, technology, engineering, and math (“STEM”) were to take a job in their field, the United States would still face a shortfall of more than 200,000 advanced degree STEM workers. Job postings for STEM jobs take longer to fill than in non-STEM occupations and U.S. companies face an immediate, ongoing, and growing inability to fill open jobs with solely U.S.-born talent.
At the same time, other countries have begun to take dramatic steps to try and lure talented individuals away from the United States. Canada has created shortcuts for highly skilled workers and entrepreneurs to get fast-track entrance and residence and has even been so brazen as to place a billboard in the heart of Silicon Valley that reads “H-1B Problems? PIVOT to Canada” to flaunt how much easier it is for these valued workers to live and work in Canada than in the United States. The U.K., Australia, Singapore, Chile, and other countries have all instituted “startup visa” programs to attract foreign entrepreneurs and spur new industry growth and job creation. China now offers advanced degree graduates of U.S. universities money, titles, access to prestigious incubators, and even special residency permits in Beijing if they return home after graduation.
It is imperative that the United States improve STEM education and create a more viable STEM pipeline here at home. But along with investing in STEM education, it is equally important to ensure our immigration system allows employers to attract and retain the talent needed to drive our economy forward and create more jobs. Given that foreign-born and temporary resident students are far more likely to earn university degrees in STEM fields than U.S.-born students today, passing immigration reform to attract and retain international talent is critical if the United States is to address the growing STEM scarcity and stay globally competitive. Nearly all other developed economies recognize the benefits of welcoming highly skilled immigrants and retaining the international students they educate at their universities, leaving America’s status as a leader in the global innovation economy in jeopardy.
EXEC
UTIV
E SUM
MA
RY
3

The current process for hiring foreign STEM workers is complicated, complex, and costly. Bureaucratic hassles, uncertainty, processing and compliance expenses, and an insufficient number of visas make hiring foreign workers a painful and expensive endeavor for U.S. companies. Fortunately, solutions exist. Congress needs to increase the number of H-1B visas and green cards, exempt the advanced degree STEM graduates we train in our universities from the caps, set the visa cap every year so that it reflects the needs of the U.S. economy, give work authorization to spouses of highly skilled workers, and otherwise provide flexibility and incentives to attract the talented workers our companies need to compete and grow.
The case for H-1B visa reform is strong:
1. STEM students and workers are an increasingly scarce resource:
a. The number of U.S. students pursuing STEM university degrees is not growing sufficiently to meet demand.
b. By 2018, the United States will face a shortfall of more than 223,000 advanced degree workers in STEM fields.1
2. The H-1B program addresses STEM scarcity by creating American jobs and promoting U.S. economic growth:
a. Adding 100 H-1B workers results in an additional 183 jobs among U.S. natives in the state where the H-1B workers are hired.2
b. A 10 percent growth in a firm’s H-1B population corresponds with a 3.3 percent increase in the number of patents awarded to the firm, keeping U.S. business innovative and ahead of the pack in a competitive global economy.3
3. The H-1B process is complicated, complex, and costly:
a. Our system requires companies to spend thousands of dollars and countless hours per highly skilled worker that could otherwise be going into growing their businesses and creating jobs.
4. There is a vastly insufficient number of visas to meet demand:
a. This year, the Department of Homeland Security received 233,000 H-1B petitions, a record high, and almost three times the number of available visas, in the first week alone.4
b. Even holding aside the lost productivity, growth, and job creation from turning away 148,000 highly skilled workers, the loss to the U.S. government in application fees alone from these 148,000 applicants is at least $233 million and likely far in excess of $344 million.5
5. Companies that participate in the H-1B program aggressively recruit American workers:
a. In each of the 100 largest metro areas across the United States, the occupations that companies most frequently request H-1Bs to help fill are also those the jobs that take the longest to fill, indicating a short supply relative to demand.6
EXEC
UTI
VE
SUM
MA
RY
4

6. Involving the Department of Labor in hiring decisions would render the H 1B program unworkable, make it harder for U.S. companies to recruit the talent they need to compete and grow, hurting American workers:
a. Under our current system, Congress requires employers hiring H-1Bs to attest to and document payment of fair market wages and identical terms and conditions as those provided to similarly situated American workers. This ensures the hire is purely based on the foreign worker’s skills and the company’s need.
b. Every hiring decision is based on multiple personal factors. Having the Department of Labor attempt to evaluate each hire based on a government-mandated litmus test is neither practical nor advisable.
7. Legislation like the Immigration Innovation Act (“I-Squared”) (S.153 in the 114th Congress) would improve the H-1B system, boost economic growth, and create American jobs:
a. I-Squared would improve both the functioning and the predictability of our high-skilled immigration system by creating a market-based escalator and de-escalator for H-1Bs, and also establish a reliable means for foreign STEM students to stay after earning a U.S. graduate degree in those situations where all the existing law requirements to have a job offer have been met, where the company has been subject to a Labor Certification request, and where approval has been granted for an Immigrant Visa Petition. It would also improve and expand policies for worker mobility.
EXEC
UTIV
E SUM
MA
RY
5
Sources: Derived from Integrated Postsecondary Education Data System, Department of Education, 2009.; Help Wanted: A Projection of Jobs and their Education Requirements, The Georgetown Center on Education and the Workforce
By 2018, the U.S. Will Face a Projected Shortfall of 223,800 STEM Workers
SUPPLY: By 2018, the
US will have
an estimated
555,200 advanced
degree holders
in STEM fields...
DEMAND:
But there will
be an estimated
779,000 job
openings requiring
STEM degrees.
2,000 STEMDEGREE HOLDERS
2,000 UNFILLED STEM POSITIONS

PART ONE
Understanding the Data: How the Scarcity in STEM Slows Economic Growth and How the H-1B Visa Program Grows the Economy and Creates American JobsThe STEM Student and Workforce Scarcity
Talent is the driving force of an innovation economy and increasing evidence suggests that the United States faces a large and growing scarcity of students and workers in the fields of science, technology, engineering, and math (STEM) at great cost to our nation’s economic growth and to American jobs.
Our nation faces a scarcity of STEM workers, and it’s likely to get worse.
• By 2018, the United States will face a shortfall of more than 223,000 workers in STEM fields. There will be 779,000 STEM job openings, but only 555,200 qualified U.S. workers to fill them.7
• Meanwhile, studies have projected that STEM occupations will see the fastest growth of any field between 2010 and 2020. Some 2.6 million jobs will open in STEM fields, as Baby Boomers retire and U.S. firms continue to expand.8
• STEM jobs take significantly longer to fill. Nationally, 43 percent of job vacancies for STEM occupations with H-1B requests were still posted after one month, as opposed to 38 percent of vacancies in non-STEM occupations requiring a bachelor’s degree, and 32 percent of non-STEM vacancies.9
Labor market data suggest that the scarcity of STEM workers is greater than the scarcity of workers in the broader economy.
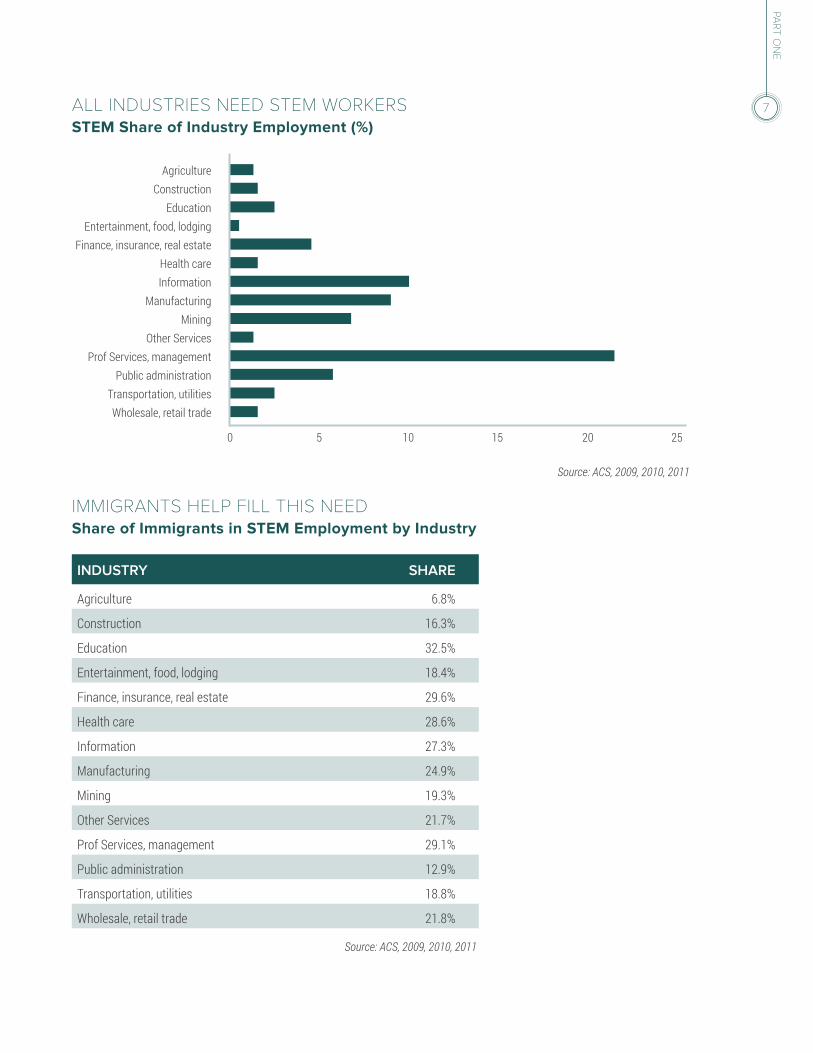
Labor market experts across the board interpret a job opening of longer than a month as an indicator that qualified candidates are hard to find, and studies have shown that STEM jobs are more likely to go unfilled than in other professions. When researchers from the Brookings Institution looked at data on job openings for the 100 largest metropolitan areas they concluded that H-1B STEM job vacancies are harder to fill than other job openings: STEM occupations with H-1B requests had 7 percent more vacancies unfilled for more than a month than any other jobs,10 and the most commonly requested H-1B occupations in each metro area took the longest to fill.11 In other words, the American workforce does not have enough STEM professionals to meet the needs of our businesses. And our economy increasingly needs STEM workers, across all industries. In 2013, the Census Bureau found that all 14 major sectors of the U.S. economy have a need for STEM workers.12
PART
ON
E
6
PART O
NE
7
INDUSTRY SHARE
Agriculture 6.8%
Construction 16.3%
Education 32.5%
Entertainment, food, lodging 18.4%
Finance, insurance, real estate 29.6%
Health care 28.6%
Information 27.3%
Manufacturing 24.9%
Mining 19.3%
Other Services 21.7%
Prof Services, management 29.1%
Public administration 12.9%
Transportation, utilities 18.8%
Wholesale, retail trade 21.8%
IMMIGRANTS HELP FILL THIS NEED Share of Immigrants in STEM Employment by Industry
ALL INDUSTRIES NEED STEM WORKERS STEM Share of Industry Employment (%)
Source: ACS, 2009, 2010, 2011
Source: ACS, 2009, 2010, 2011
AgricultureConstruction
EducationEntertainment, food, lodging
Finance, insurance, real estateHealth careInformation
ManufacturingMining
Other ServicesProf Services, management
Public administrationTransportation, utilitiesWholesale, retail trade
0 10 205 15 25
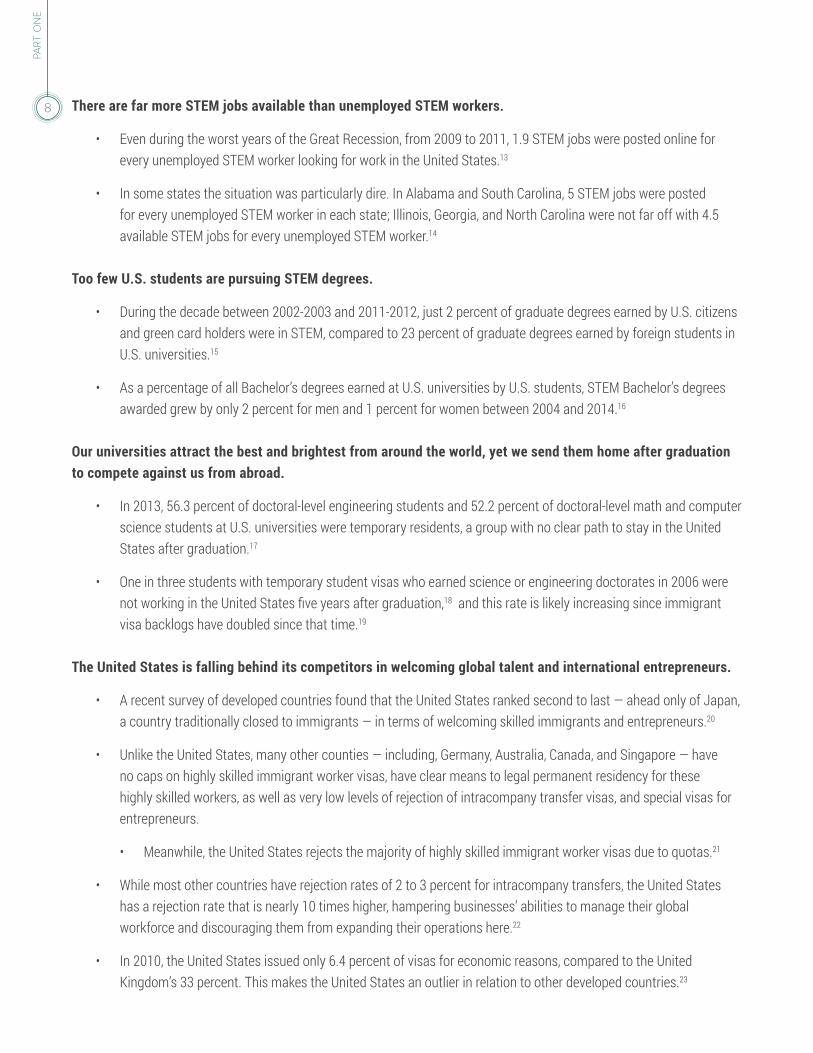
There are far more STEM jobs available than unemployed STEM workers.
• Even during the worst years of the Great Recession, from 2009 to 2011, 1.9 STEM jobs were posted online for every unemployed STEM worker looking for work in the United States.13
• In some states the situation was particularly dire. In Alabama and South Carolina, 5 STEM jobs were posted for every unemployed STEM worker in each state; Illinois, Georgia, and North Carolina were not far off with 4.5 available STEM jobs for every unemployed STEM worker.14
Too few U.S. students are pursuing STEM degrees.
• During the decade between 2002-2003 and 2011-2012, just 2 percent of graduate degrees earned by U.S. citizens and green card holders were in STEM, compared to 23 percent of graduate degrees earned by foreign students in U.S. universities.15
• As a percentage of all Bachelor’s degrees earned at U.S. universities by U.S. students, STEM Bachelor’s degrees awarded grew by only 2 percent for men and 1 percent for women between 2004 and 2014.16
Our universities attract the best and brightest from around the world, yet we send them home after graduation to compete against us from abroad.
• In 2013, 56.3 percent of doctoral-level engineering students and 52.2 percent of doctoral-level math and computer science students at U.S. universities were temporary residents, a group with no clear path to stay in the United States after graduation.17
• One in three students with temporary student visas who earned science or engineering doctorates in 2006 were not working in the United States five years after graduation,18 and this rate is likely increasing since immigrant visa backlogs have doubled since that time.19
The United States is falling behind its competitors in welcoming global talent and international entrepreneurs.
• A recent survey of developed countries found that the United States ranked second to last — ahead only of Japan, a country traditionally closed to immigrants — in terms of welcoming skilled immigrants and entrepreneurs.20
• Unlike the United States, many other counties — including, Germany, Australia, Canada, and Singapore — have no caps on highly skilled immigrant worker visas, have clear means to legal permanent residency for these highly skilled workers, as well as very low levels of rejection of intracompany transfer visas, and special visas for entrepreneurs.
• Meanwhile, the United States rejects the majority of highly skilled immigrant worker visas due to quotas.21
• While most other countries have rejection rates of 2 to 3 percent for intracompany transfers, the United States has a rejection rate that is nearly 10 times higher, hampering businesses’ abilities to manage their global workforce and discouraging them from expanding their operations here.22
• In 2010, the United States issued only 6.4 percent of visas for economic reasons, compared to the United Kingdom’s 33 percent. This makes the United States an outlier in relation to other developed countries.23
PART
ON
E
8
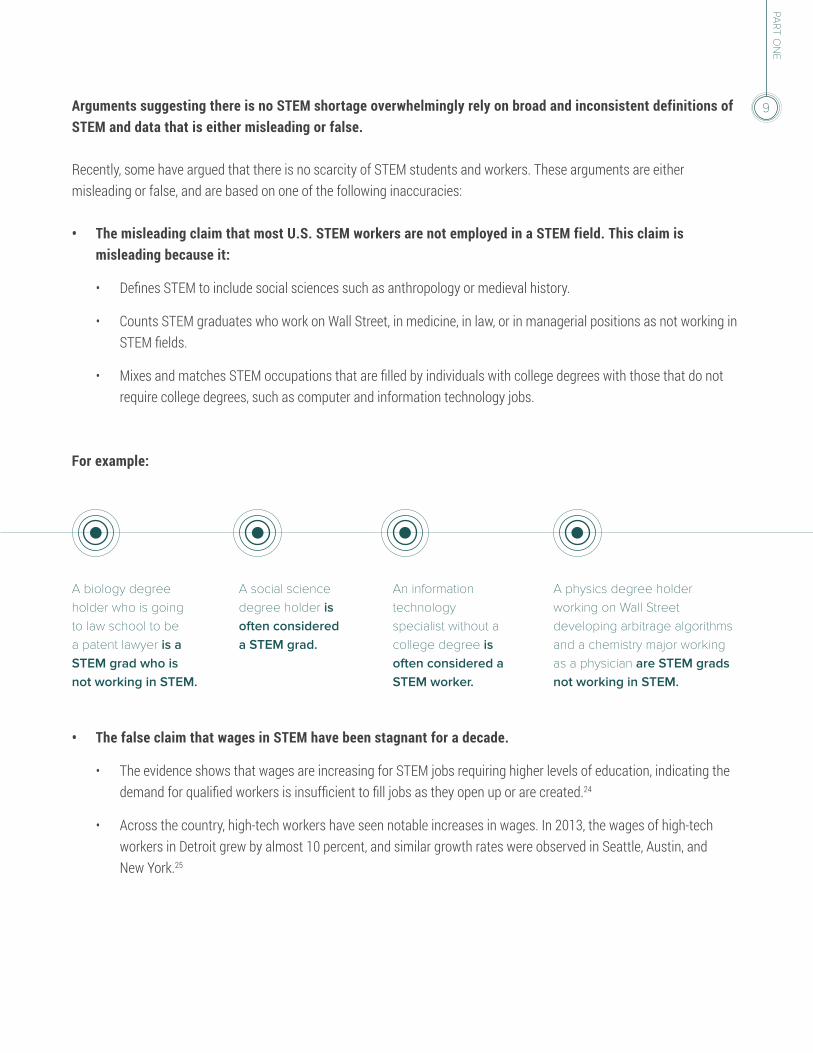
Arguments suggesting there is no STEM shortage overwhelmingly rely on broad and inconsistent definitions of STEM and data that is either misleading or false.
Recently, some have argued that there is no scarcity of STEM students and workers. These arguments are either misleading or false, and are based on one of the following inaccuracies:
• The misleading claim that most U.S. STEM workers are not employed in a STEM field. This claim is misleading because it:
• Defines STEM to include social sciences such as anthropology or medieval history.
• Counts STEM graduates who work on Wall Street, in medicine, in law, or in managerial positions as not working in STEM fields.
• Mixes and matches STEM occupations that are filled by individuals with college degrees with those that do not require college degrees, such as computer and information technology jobs.
For example:
• The false claim that wages in STEM have been stagnant for a decade.
• The evidence shows that wages are increasing for STEM jobs requiring higher levels of education, indicating the demand for qualified workers is insufficient to fill jobs as they open up or are created.24
• Across the country, high-tech workers have seen notable increases in wages. In 2013, the wages of high-tech workers in Detroit grew by almost 10 percent, and similar growth rates were observed in Seattle, Austin, and New York.25
PART O
NE
9
A biology degree holder who is going to law school to be a patent lawyer is a STEM grad who is not working in STEM.
A social science degree holder is often considered a STEM grad.
An information technology specialist without a college degree is often considered a STEM worker.
A physics degree holder working on Wall Street developing arbitrage algorithms and a chemistry major working as a physician are STEM grads not working in STEM.

Myth: There are ample numbers of qualified
Americans to fill STEM jobs.
Myth: There is a huge surplus of Americans
trained in STEM who cannot find jobs. Data from the
Census Bureau shows that 3 in 4 Americans with a
STEM degree do not hold a job in a STEM field, which
means there are 11 million Americans with STEM
qualifications who are not working in STEM fields.
Fact: There are far more STEM jobs open than unemployed STEM workers and unemployment for U.S.-born workers with advanced degrees in STEM fields has been low enough to be virtually nonexistent.
• From 2009 to 2011, during a time of depressed employment, 1.9 STEM jobs were posted online for every one unemployed STEM worker looking for work in the United States.26
• In 2011, while the national unemployment rate hovered at about 8 percent nationwide, U.S. citizens with a Ph.D, in STEM had an unemployment rate of 3.2 percent, and those with master’s level degrees in STEM fields had an unemployment rate of 3.4 percent.27
• For many STEM occupations, including computer engineers, chemists, and network and computer systems administrators, there is full employment for native-born workers.28
Fact: Many Americans who study STEM wind up working in non-STEM jobs. But this is due to strong opportunities in other fields, rather than a lack of opportunities in STEM. In reality, foreign-born workers and U.S.-born workers often have complementary skills, and the availability of foreign-born workers helps keep and create jobs in the United States.
• In 2013, the U.S. Census found that more than one in five U.S. STEM graduates not employed in STEM fields were employed in managerial or business occupations.
• More than one in eight STEM graduates not actively employed in STEM were working in healthcare — including 594,000 who were working as physicians.
• Another 522,000 individuals were teaching at U.S. universities, educating the next generation of potential STEM workers.29
PART
ON
E
10

The Positive Impact of H-1B Workers on the U.S. Economy and U.S. Workers
Counter to the claims that H-1B workers steal jobs, depress wages, and crowd American workers out of the job market, evidence shows that H-1B workers have a positive and profound impact on U.S. economic growth and job creation. Studies show that our job economy is not a fixed pie: H-1Bs create jobs for U.S. workers, raise wages overall, and complement — rather than substitute for — American workers. The potential job-creating effects of additional H-1B visas to meet our market needs are enormous. Studies overwhelmingly show that H-1B workers help create American jobs, with estimates ranging from 1.8 to 7.5 American jobs created for each H-1B worker hired. Without meaningful legislation to widen the pathway for much-needed skilled and innovative manpower, the United States faces the loss of its competitive edge to countries that have already recognized the vital role these workers play in a technologically advanced economy.
H-1B visas create jobs for American workers and help American businesses innovate.
• States with greater numbers of H-1B workers were found to have had higher rates of employment among U.S. natives. Specifically, the data shows that adding 100 H-1B workers results in an additional 183 jobs among U.S. natives in the state where the H-1B workers are hired.30
• At the firm-level, in businesses that recently hired young (under-40) skilled immigrant workers, the hiring of one young skilled immigrant worker was associated with the hiring of an additional 3.5 workers over the following 14 years.31
• For smaller businesses, studies have found the job-creating effects of hiring H-1B workers to be even more pronounced: For each H-1B worker hired, firms with fewer than 5,000 employees added an additional 7.5 additional workers.32
• In 2011, more than 3 out of every 4 patents (76 percent) awarded to the top 10 U.S. patent-producing universities had at least one foreign-born inventor.33
• A 10 percent growth in a firm’s H-1B population corresponds with a 3.3 percent increase in the number of patents awarded to that firm, keeping U.S. businesses innovative and ahead of the pack in the competitive global economy.34
PART O
NE
11
76%of patents awarded to the top 10 U.S. patent-producing universities had at
least one foreign-born inventor

H-1B visas have a positive impact on wages overall.
• Foreign-born STEM workers are paid the same — and in some cases more — than their U.S.-born counterparts. In fact, overall, foreign-born STEM workers were found to earn over $3,000 more on average per year than U.S.-born STEM workers.35
• A nationwide study of 219 cities found that H-1B-driven increases in STEM workers were associated with wage increases of 7 to 8 percent for college-educated native-born workers, while non-college educated workers saw a wage increase of 3 to 4 percent.36
• Wage growth for workers in occupations with large numbers of H-1B petitions was substantially higher than for workers in low H-1B dense occupations. For example, engineers saw their wages rise by 2.1 percent between 2009 and 2011.37
• No studies have conclusively shown that wages for STEM professionals are stagnant because of the very presence of H-1B workers. In 2014, the American Institute for Economic Research concluded that no difference in wages could be attributed to H-1B visa status.
• The H-1B program can explain a quarter of the wage growth of U.S. college-educated workers between 1990 and 2010. An enlargement of the H-1B program could generate an extra 2 percentage points of wage growth for highly educated natives over the following 20 years.38
The denial of H-1B applications under our current system results in lost wages and lost revenue for U.S.-born workers.
• From 2005 to 2010, wages for college-educated, U.S.-born workers with computer-related jobs could have grown 3.2 percent more than they did were it not for the application denials in the H-1B lotteries.39
• From 1990 to 2007, immigration to the United States was associated with a 6.6 percent to 9.9 percent increase in real income per worker. A 2010 report found no evidence that immigrants crowd out U.S.-born workers in either the short or long run.40
H-1B workers complement — instead of displace — U.S. workers.
• A 2010 study found that there were no significant effects on U.S.-born worker rates of employment in the short-run. The same study found that in the long run there were small positive effects for U.S.-born workers.41
• Hiring immigrants often raises wages for U.S.-born STEM workers due to foreign-born and U.S.-born workers specializing in different roles. As employers use foreign-born workers to fill more technical or lower level jobs, firms are able to expand, often allowing U.S.-born employees to assume managerial and leadership positions.42
• STEM fields with high percentages of foreign-born workers have low unemployment rates for U.S. workers, often significantly lower than the national unemployment rate.43
PART
ON
E
12

• For example, in 2012, although nearly 25 percent of medical scientists were foreign-born, U.S.-born medical scientists had an unemployment rate of just 3.4 percent, five percentage points lower than the non-STEM unemployment rate of 8.4 percent.43
The Congressional Budget Office found that increasing H-1B visa numbers would generate more than $100 billion in revenue.
In the 113th Congress, the House Judiciary Committee voted in favor of a highly skilled immigration bill, H.R. 2131 (SKILLS Visa Act), that would have increased H-1B numbers to 195,000 in total, with 40,000 set aside for STEM graduates of U.S. universities. There was no increase to the overall number of green cards. In 2014, the CBO and Joint Committee on Taxation (JCT) found that that the bill would both reduce budget deficits and increase revenue by about $110 billion over the next decade.44 Since the SKILLS Act focuses entirely on high-skilled immigration, this assessment serves as a good indicator of the impact of H-1B reform.
“On balance, CBO and JCT estimate that enacting H.R. 2131 would reduce budget deficits through the changes in revenues and direct spending by about $110 billion over the 2014-2024 period. Pay-as-you-go procedures apply to the bill because it would affect direct spending and revenues.”
- COST ESTIMATE OF H.R. 2131 SKILLS VISA ACT (CBO, MARCH 2014)
Further, when the CBO and JCT extended their analysis for another decade, they estimated that enacting the SKILLS Act would reduce federal deficits by about $400 billion between 2025 and 2034, an effect almost entirely attributable to higher income and payroll taxes stemming from a larger workforce, and all without significant increases to direct spending.
PART O
NE
13
233,000H-1B petitions were received by DHS this year in the first week – a record high and almost three times the number of available visas
Adding 100 H-1B workers in a community
results inan additional
183 JOBS

PART TWO
Understanding How the H-1B System Works in Practice: How American Employers Recruit and How They Actually Use H-1BsThe H-1B Process
The H-1B visa classification is designed to provide a means for U.S. businesses to timely hire foreign-born professionals in specialty occupations. These workers must have a four-year bachelor’s degree or its equivalent, and their field of study must pertain directly to the job. Today’s laws set a cap at 65,000 for new H-1B workers every year, with an additional 20,000 for foreign workers with a master’s or higher degree from a U.S. university. Typically, H-1B visas are valid for two or three years, with a six-year maximum total stay. In recent years, H-1B visas have most commonly been awarded for science and engineering jobs, or other positions requiring quantitative skills, in sectors like manufacturing, financial services, and computing technology.
With hundreds of thousands of jobs postings in STEM fields, and scarcity in fields from healthcare to manufacturing to technology, H-1B workers complement our workforce, and grow our businesses. But our system is costly, burdensome, and woefully insufficient to meet our needs in a global and technology-driven economy. This section explains how employers use the system, where it falls short, and how to improve it.
Employers are filling open jobs, not displacing American workers with cheaper foreign labor.
Fact: Overall, highly skilled, foreign-born workers are not taking away jobs from U.S.- born workers. Instead, by filling the positions that our country’s cutting edge firms would be unable to fill otherwise, they allow companies to continue to expand and hire more workers at all skill levels.
• From 2000 to 2007, the addition of 100 foreign-born workers trained in STEM fields at U.S. universities to a given state’s economy resulted in 262 additional jobs there for U.S.-born workers.
• Similarly, having more H-1B workers also boosted native-born employment. Adding 100 additional H-1B workers to a state’s workforce created 183 additional jobs for American workers in the years that followed.45
PART
TW
O
14
Myth: Foreign STEM workers
displace American STEM workers.
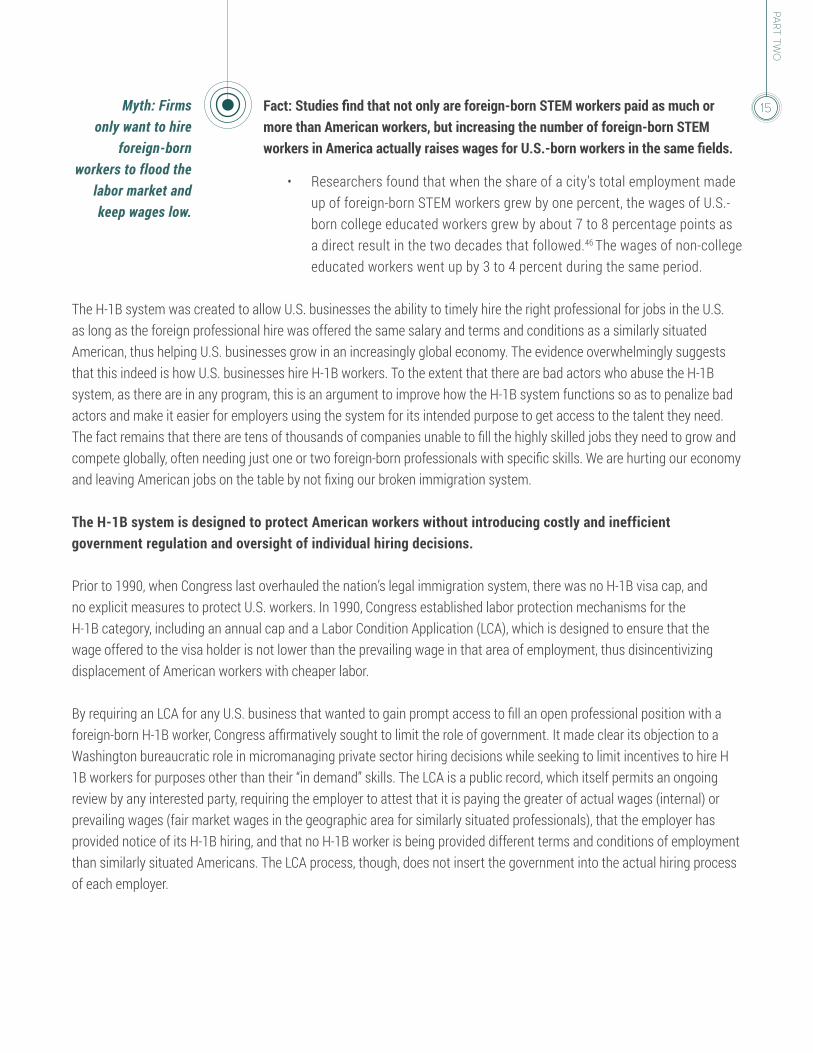
Fact: Studies find that not only are foreign-born STEM workers paid as much or more than American workers, but increasing the number of foreign-born STEM workers in America actually raises wages for U.S.-born workers in the same fields.
• Researchers found that when the share of a city’s total employment made up of foreign-born STEM workers grew by one percent, the wages of U.S.-born college educated workers grew by about 7 to 8 percentage points as a direct result in the two decades that followed.46 The wages of non-college educated workers went up by 3 to 4 percent during the same period.
The H-1B system was created to allow U.S. businesses the ability to timely hire the right professional for jobs in the U.S. as long as the foreign professional hire was offered the same salary and terms and conditions as a similarly situated American, thus helping U.S. businesses grow in an increasingly global economy. The evidence overwhelmingly suggests that this indeed is how U.S. businesses hire H-1B workers. To the extent that there are bad actors who abuse the H-1B system, as there are in any program, this is an argument to improve how the H-1B system functions so as to penalize bad actors and make it easier for employers using the system for its intended purpose to get access to the talent they need. The fact remains that there are tens of thousands of companies unable to fill the highly skilled jobs they need to grow and compete globally, often needing just one or two foreign-born professionals with specific skills. We are hurting our economy and leaving American jobs on the table by not fixing our broken immigration system.
The H-1B system is designed to protect American workers without introducing costly and inefficient government regulation and oversight of individual hiring decisions.
Prior to 1990, when Congress last overhauled the nation’s legal immigration system, there was no H-1B visa cap, and no explicit measures to protect U.S. workers. In 1990, Congress established labor protection mechanisms for the H-1B category, including an annual cap and a Labor Condition Application (LCA), which is designed to ensure that the wage offered to the visa holder is not lower than the prevailing wage in that area of employment, thus disincentivizing displacement of American workers with cheaper labor.
By requiring an LCA for any U.S. business that wanted to gain prompt access to fill an open professional position with a foreign-born H-1B worker, Congress affirmatively sought to limit the role of government. It made clear its objection to a Washington bureaucratic role in micromanaging private sector hiring decisions while seeking to limit incentives to hire H 1B workers for purposes other than their “in demand” skills. The LCA is a public record, which itself permits an ongoing review by any interested party, requiring the employer to attest that it is paying the greater of actual wages (internal) or prevailing wages (fair market wages in the geographic area for similarly situated professionals), that the employer has provided notice of its H-1B hiring, and that no H-1B worker is being provided different terms and conditions of employment than similarly situated Americans. The LCA process, though, does not insert the government into the actual hiring process of each employer.
PART TW
O
15Myth: Firms only want to hire
foreign-born workers to flood the
labor market and keep wages low.
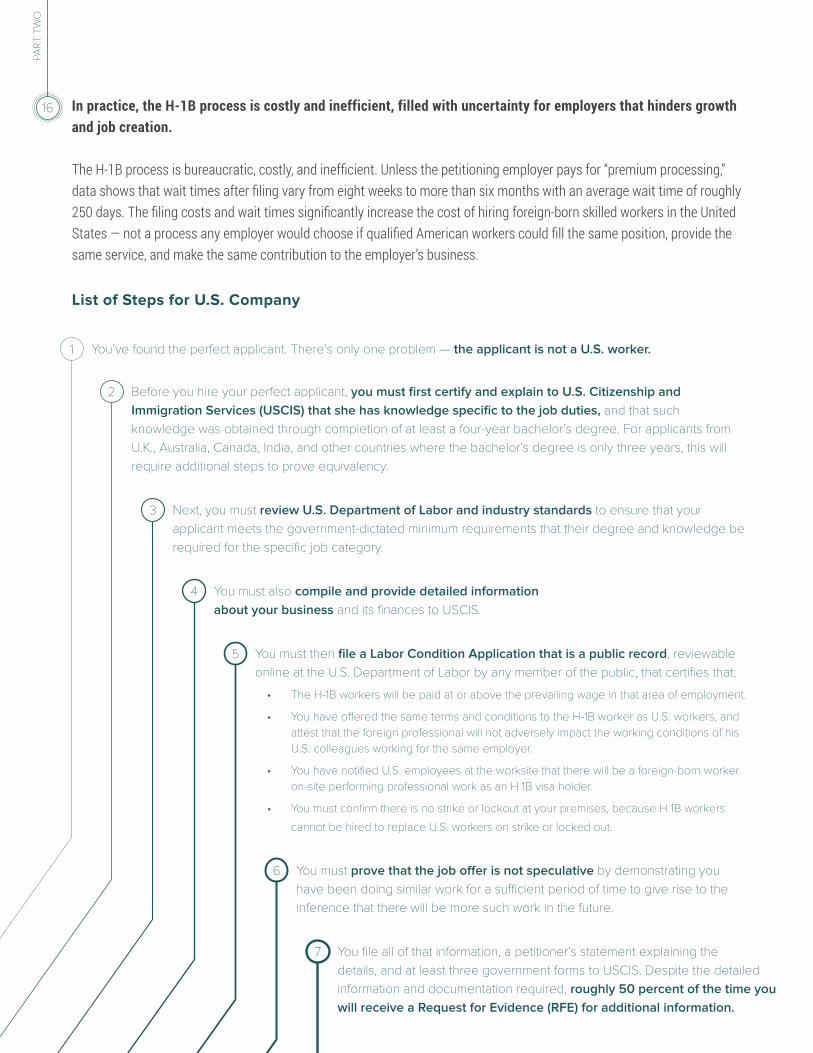
In practice, the H-1B process is costly and inefficient, filled with uncertainty for employers that hinders growth and job creation.
The H-1B process is bureaucratic, costly, and inefficient. Unless the petitioning employer pays for “premium processing,” data shows that wait times after filing vary from eight weeks to more than six months with an average wait time of roughly 250 days. The filing costs and wait times significantly increase the cost of hiring foreign-born skilled workers in the United States — not a process any employer would choose if qualified American workers could fill the same position, provide the same service, and make the same contribution to the employer’s business.
List of Steps for U.S. Company
1
2
3
4
5
6
7
You’ve found the perfect applicant. There’s only one problem — the applicant is not a U.S. worker.
Before you hire your perfect applicant, you must first certify and explain to U.S. Citizenship and Immigration Services (USCIS) that she has knowledge specific to the job duties, and that such knowledge was obtained through completion of at least a four-year bachelor’s degree. For applicants from U.K., Australia, Canada, India, and other countries where the bachelor’s degree is only three years, this will require additional steps to prove equivalency.
Next, you must review U.S. Department of Labor and industry standards to ensure that your applicant meets the government-dictated minimum requirements that their degree and knowledge be required for the specific job category.
You must also compile and provide detailed information about your business and its finances to USCIS.
You must then file a Labor Condition Application that is a public record, reviewable online at the U.S. Department of Labor by any member of the public, that certifies that:
• The H-1B workers will be paid at or above the prevailing wage in that area of employment.
• You have offered the same terms and conditions to the H-1B worker as U.S. workers, and attest that the foreign professional will not adversely impact the working conditions of his U.S. colleagues working for the same employer.
• You have notified U.S. employees at the worksite that there will be a foreign-born worker on-site performing professional work as an H 1B visa holder.
• You must confirm there is no strike or lockout at your premises, because H 1B workers
cannot be hired to replace U.S. workers on strike or locked out.
You must prove that the job offer is not speculative by demonstrating you have been doing similar work for a sufficient period of time to give rise to the inference that there will be more such work in the future.
You file all of that information, a petitioner’s statement explaining the details, and at least three government forms to USCIS. Despite the detailed information and documentation required, roughly 50 percent of the time you will receive a Request for Evidence (RFE) for additional information.
PART
TW
O
16
1
2
3
4
5
6
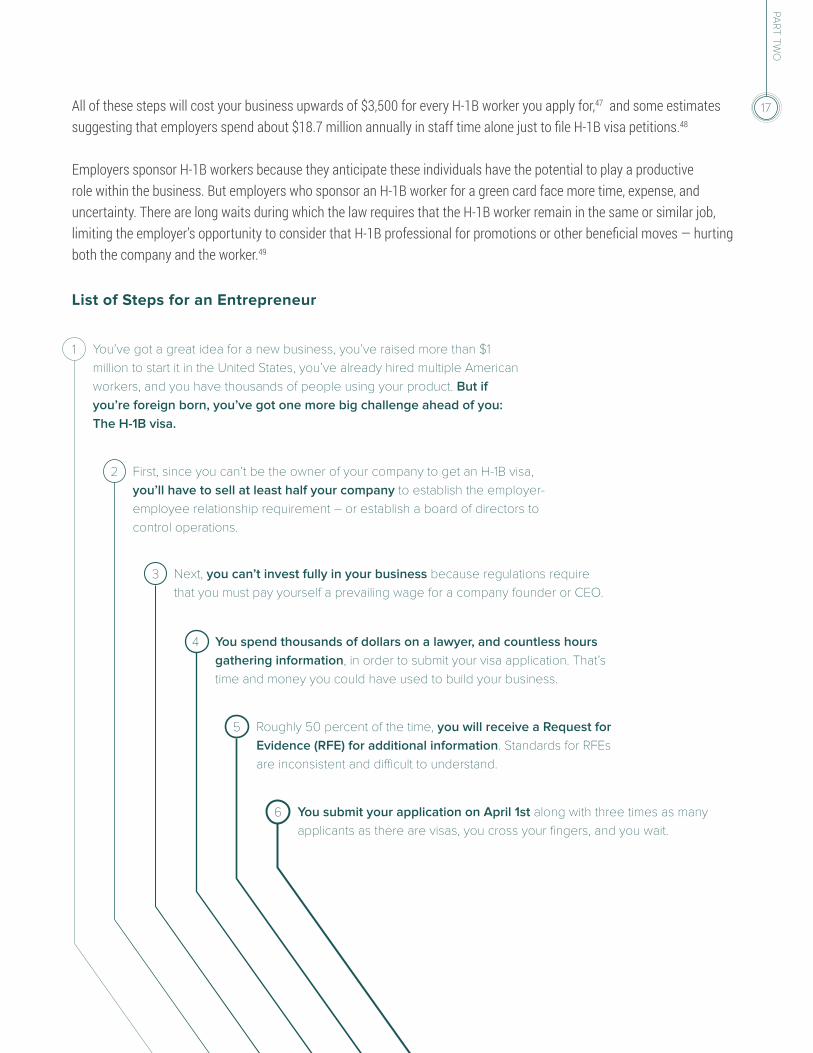
You’ve got a great idea for a new business, you’ve raised more than $1 million to start it in the United States, you’ve already hired multiple American workers, and you have thousands of people using your product. But if you’re foreign born, you’ve got one more big challenge ahead of you:The H-1B visa.
First, since you can’t be the owner of your company to get an H-1B visa, you’ll have to sell at least half your company to establish the employer-employee relationship requirement – or establish a board of directors to control operations.
Next, you can’t invest fully in your business because regulations require that you must pay yourself a prevailing wage for a company founder or CEO.
You spend thousands of dollars on a lawyer, and countless hours gathering information, in order to submit your visa application. That’s time and money you could have used to build your business.
Roughly 50 percent of the time, you will receive a Request for Evidence (RFE) for additional information. Standards for RFEs are inconsistent and difficult to understand.
You submit your application on April 1st along with three times as many applicants as there are visas, you cross your fingers, and you wait.
All of these steps will cost your business upwards of $3,500 for every H-1B worker you apply for,47 and some estimates suggesting that employers spend about $18.7 million annually in staff time alone just to file H-1B visa petitions.48
Employers sponsor H-1B workers because they anticipate these individuals have the potential to play a productive role within the business. But employers who sponsor an H-1B worker for a green card face more time, expense, and uncertainty. There are long waits during which the law requires that the H-1B worker remain in the same or similar job, limiting the employer’s opportunity to consider that H-1B professional for promotions or other beneficial moves — hurting both the company and the worker.49
List of Steps for an Entrepreneur
PART TW
O
17

For an entrepreneur, the H-1B visa is the path to starting a business and creating jobs. But our system makes it incredibly difficult to do that here, while other countries have fast tracks to residency. For example, no matter how much venture capital funding has been committed, or how much good press a new product or company has received; an H-1B applicant must show that their university degree is required to perform the job duties at the new venture. Often USCIS decides that a Stanford MBA or degree from Harvard Business School is not relevant to running a start-up.50 There is also a required employer-employee relationship between a business and an H-1B beneficiary, so entrepreneurs must take steps to show that they are employed by their own business. That might mean selling half of the company so that the entrepreneur owns a minority share or establishing a board of directors that controls operations. These requirements simply do not make sense for an entrepreneur, and they come at great cost to the startup, which needs as much time and money as a founder can give it in order succeed.
The H-1B Caps are Disconnected From the Demands of the U.S. Economy
The U.S. economy and the U.S. population have expanded dramatically since green card caps were set in 1990. Gross Domestic Product (GDP) for the country is almost three times as large as it was then, and we have 66 million more people in our population. Similarly, the GDP per capita has more than doubled.51 52 Meanwhile, with the rise of computing and technology as a central feature of businesses in every industry, the demand for highly skilled workers has increased greatly. That increased demand is reflected in the H-1B application process every year. The following chart shows H-1B petition data from 1992 to the present; the visa cap has been hit for the past 13 consecutive fiscal years, and in the last three years the cap was reached within a week of the application window opening.
PART
TW
O
18
1 IN 3students with temporary student visas who earned science or engineering doctorates in 2006 were not working in the United States five years after graduation
The addition of 100 foreign-born workers trained in STEM fields at U.S. universities to a given state’s economy resulted in an additional
262 JOBS

FY CAP # USED53 DATE CAP REACHED
1992 65,000 48,600 Not reached
1993 65,000 61,600 Not reached
1994 65,000 60,300 Not reached
1995 65,000 54,200 Not reached
1996 65,000 55,100 Not reached
1997 65,000 65,000 September 1, 1997
1998 65,000 65,000 May 11, 1998
1999 115,000 115,000 June 15, 1999
2000 115,000 115,000 July 21, 2000
2001 195,000 163,600 Not reached
2002 195,000 79,100 Not reached
2003 195,000 78,000 Not reached
2004 65,000 65,000 February 17, 2004
2005 85,000 (65,000 + 20,000 Masters or higher)
65,000 54 H-1B: October 10, 2004Masters: Unknown
2006 85,000 (65,000 + 20,000 Masters or higher)
85,000 H-1B: August 10, 2005Masters: January 17, 2006
2007 85,000 (65,000 + 20,000 Masters or higher)
85,000 H-1B: May 26, 2006 Masters: July 26, 2006
2008 85,000 (65,000 + 20,000 Masters or higher)
85,000Received 150,000 day one
H-1B: April 2, 2007Masters: April 30, 2007
2009 85,000 (65,000 + 20,000 Masters or higher)
85,000Received 163,00 1st five days (of which 31,200 were Masters)
H-1B: April 5, 2008Masters: April 5, 2008
2010 85,000 (65,000 + 20,000 Masters or higher)
85,000 H-1B: December 21, 2009Masters: July 9, 2009
2011 85,000 (65,000 + 20,000 Masters or higher)
85,000 H-1B: January 26, 2011 Masters: December 22, 2010
2012 85,000 (65,000 + 20,000 Masters or higher)
85,000 H-1B: November 22, 2011Masters: October 19, 2011
2013 85,000 (65,000 + 20,000 Masters or higher)
85,000 H-1B: June 11, 2012Masters: June 7, 2012
2014 85,000 (65,000 + 20,000 Masters or higher)
85,000Received 124,000 1st five days
H1-B: April 5, 2013Masters: April 5, 2013
2015 85,000 (65,000 + 20,000 Masters or higher)
85,000Received 172, 500 1st five days
H-1B: April 7, 2014Masters: April 7, 2014
2016 85,000 (65,000 + 20,000 Masters or higher)
85,000Received 233,000 1st five days
H-1B: April 7, 2015Masters: April 7, 2015
H-1B Petition Data FY1992 – FY2016
PART TW
O
19

The Solution: Reforming the H-1B Visa Program
The U.S. economy needs an H-1B visa system that activates growth, stimulates job creation, matches our economic needs, and is flexible with a changing global marketplace. Legislation like the Immigrant Innovation Act of 2015, or “I-Squared” (S. 153) seeks to reform our system in order to meet the needs of America’s businesses, while developing STEM talent here at home. The following policy changes would create a system that prioritizes economic growth and American competitiveness:
• Increase the number of H-1B visas and green cards to meet our current economic needs, with annual adjustments to the cap, determined by demand for H-1Bs.
• Let any foreign student with a U.S. advanced degree stay and work after graduation if there are insufficient numbers of qualified Americans to fill open jobs and the individual has a job offer.
• Allow dual intent for foreign students at U.S. colleges or universities, to permit labor market tests and other assessment of possible paths to stay after graduation.
• Authorize employment for spouses of H-1B holders.
• Increase worker mobility for visa holders by allowing H-1B workers a grace period to leave jobs at their own choice and change jobs without losing their status.
• Eliminate per country caps for employment-based visas, and adjust for family-based visas.
• Deference to prior decisions regarding petitions for H-1B workers or L-1 intracompany transfers.
• Increase H-1B and employment-based green card fees if the money will be used to fund STEM education in the U.S.
PART
TW
O
20
Further Reading and Resources
On the Economic Impact of Immigration:
1. Lays out and refutes the most common myths about immigrants in the United States. U.S. Chamber of Commerce. 2015. “Immigration Myths and Facts.” Available at: https://www.uschamber.com/sites/default/files/legacy/reports/Immigration_MythsFacts.pdf
2. Provides data on immigrants in the labor force and points out where immigrants are particularly vital for the economy. Singer, Audrey. 2012. “Immigrant Workers in the US Labor Force.” The Partnership for a New American Economy and the Brookings Institution. Available at: http://www.brookings.edu/~/media/research/files/papers/2012/3/15%20immigrant%20workers%20singer/0315_immigrant_workers_singer.pdf
3. Investigates foreign temporary workers’ impact on U.S.-born workers employment and their contributions to the United States. Zavodny, Madeline. 2011. “Immigration and American Jobs.” The Partnership for a New American Economy and the American Enterprise Institute. Available at: http://www.renewoureconomy.org/wp-content/uploads/2011/12/NAE_Im-AmerJobs.pdf
4. Shows the number Fortune 500 companies that were founded by immigrants and second-generation immigrants. The Partnership for a New American Economy. 2011. “The ‘New American’ Fortune 500.” Available at: http://www.renewoureconomy.org/wp-content/uploads/2013/07/new-american-fortune-500-june-2011.pdf
5. Provides findings on the economic benefits of legalization and of comprehensive immigration reform. American Immigration Council. 2011. “Immigration Reform and Job Growth.” Immigration Policy Center. Available at: http://www.immigrationpolicy.org/just-facts/immigration-reform-and-job-growth
6. Provides evidence that immigrants improve the living standards of Americans. Greenstone, Michael, and Adam Looney. 2010.“Ten Economic Facts About Immigration.” The Hamilton Project. Available at: http://www.brookings.edu/~/media/research/files/reports/2010/9/immigration-greenstone-looney/09_immigration.pdf#page=7
On H-1B Visas and U.S. Economic Growth:
1. Quantifies how many new jobs were created by H-1Bs in each state from 2010 to 2013. The Partnership for a New American Economy. 2015. “The H-1B Employment Effect.” Available at: http://www.renewoureconomy.org/wp-content/uploads/2015/04/H1B_Effect.pdf
2. Lays out the elements of the current, outdated immigration system and puts forward solutions supported by U.S. employers to modernize it. Council for Global Immigration and Society for Human Resource Management. 2015. “2015 Guide: Moving Forward on Immigration: How the U.S. Employment-Based System Works – and How It Can Work Better.” Available at: http://www.councilforglobalimmigration.org/guide-emp-based-immigration
RESOU
RCES
21
3. Cities whose employers faced large numbers of denials in the H-1B visa lotteries experienced considerably less job creation and wage growth for American-born computer workers in the two years that followed. Peri, Giovanni et al. 2014. “Closing Economic Windows.” The Partnership for a New American Economy. Available at: http://www.renewoureconomy.org/wp-content/uploads/2014/06/pnae_h1b.pdf
4. H-1B-driven increases in STEM workers are associated with significant increases in wages paid to college-educated natives. Peri, Giovanni et al. 2013. “Foreign STEM Workers and Native Wages and Employment in U.S. Cities,” National Bureau for Economic Research Working Paper, No. 20093. Available at: http://www.nber.org/papers/w20093
5. The H-1B program can explain a quarter of the wage growth of U.S. college-educated workers between 1990 and 2010. Peri, G., Shih, K., and Sparber, C. (2014) “Foreign Scientists and Engineers and Economic Growth,” Cato Papers on Public Policy, Vol. 3, Cato Institute, 2014. Available at: http://object.cato.org/sites/cato.org/files/serials/files/cato-papers-public-policy/2014/6/cppp-3-3.pdf
On the Contributions of High-skilled Immigrants:
1. Examines the contribution of foreign-born inventors to the American economy. The Partnership for a New American Economy. 2012. “Patent Pending: How immigrants are Reinventing the American Economy.” Available at: http://www.renewoureconomy.org/research/patent-pending-how-immigrants-are-reinventing-the-american-economy-2/
2. Finds the fact that a one percentage point rise in the share of immigrant college graduates in the population increases patents per capita by 6%. The National Bureau of Economic Research. 2008. “How Much Does Immigration Boost Innovation?” http://www.nber.org/papers/w14312
3. Confirms that advanced education in STEM is correlated with high rates of entrepreneurship and innovation among both immigrant and U.S.-born founder populations. Wadhwa, Vivek et al. 2008. “Skilled Immigration and Economic Growth,” Applied Research in Economic Development, Vol. 5, No. 1, p. 6-14. Available at: http://papers.ssrn.com/sol3/papers.cfm?abstract_id=1141190
On STEM Skills Gaps and Scarcity in the Workforce in the United States:
1. Manufacturing sector expects by 2020 a 15% increase in the shortfall in engineers and 9% increase in the shortfall in research scientists. National Association of Manufacturers. 2015. “2015 Skills Gap Report.” Available at: http://www.themanufacturinginstitute.org/Research/Skills-Gap-in-Manufacturing/Skills-Gap-in-Manufacturing.aspx
2. STEM job openings take longer to fill than openings in other fields. Rothwell, Jonathan. 2014. “Still Searching: Job Vacancies and STEM Skills.” Brookings Institution. Available at: http://www.brookings.edu/research/interactives/2014/job-vacancies-and-stem-skills#/M10420
3. Offers data on the supply and demand for STEM workers. “Science, Technology, Engineering, and Mathematics Education: Assessing the Relationship between Education and the Workforce.” GAO-14-374, General Accountability Office, 2014. Available at: http://www.gao.gov/assets/670/663079.pdf
RESO
URC
ES
22

4. Provides evidence that H-1B program helps to fill a shortage of workers in STEM occupations. Rothwell, Jonathan, and Neil G. Ruiz. 2013. “H-1B Visas and the STEM Shortage,” Brookings Institution. Available at: http://www.brookings.edu/research/papers/2013/05/10-h1b-visas-stem-rothwell-ruiz
5. STEM employment includes much more than just professional jobs in core STEM requiring a Bachelors or higher, but core STEM requiring a Bachelors or higher is in demand across the economy. Rothwell, Jonathan. 2013. “The Hidden STEM Economy.” Brookings Institution. Available at: http://www.brookings.edu/~/media/research/files/reports/2013/06/10-stem-economy-rothwell/thehiddenstemeconomy610.pdf
6. Presents a new and more rigorous way to define STEM occupations while presenting a new portrait of the STEM economy. The Partnership for a New American Economy, Information Technology Industry Council, and the U.S. Chamber of Commerce. 2012. “Help Wanted: The Role of Foreign Workers in the Innovation Economy.” Available at: http://www.renewoureconomy.org/wp-content/uploads/2013/07/stem-report.pdf
7. Papademetriou, Demetrios G., and Madeleine Sumption. 2011. “The Role of Immigration in Fostering Competitiveness in the United States.” Migration Policy Institute. Available at: http://www.migrationpolicy.org/pubs/competitiveness-us.pdf
8. Manyika, James et al. 2011. “An Economy that Works,” McKinsey. Available at: http://www.mckinsey.com/insights/employment_and_growth/an_economy_that_works_for_us_job_creation
On the Global Competition for Talent:
1. Ranks developed countries based on their immigration system. The United States finished 9th out of 10 due to its burdensome immigration system. Business Roundtable. 2015. “State of Immigration: How the United States Stacks Up in the Global Talent Competition.” Available at: http://businessroundtable.org/sites/default/files/immigration_reports/BRT%20immigration%20report.pdf
2. Estimates the stay rate of foreign nationals who receive doctorates in science and engineering from U.S. universities. Finn, Michael G. 2014. “Stay Rates of Foreign Doctorate Recipients from U.S. Universities” Oak Ridge Institute for Science and Education, U.S. Department of Energy. Available at: http://orise.orau.gov/files/sep/stay-rates-foreign-doctorate-recipients-2011.pdf
3. Demonstrates what America must do to win the global race for the skills it needs to stay competitive by comparing America’s immigration policies with those of other nations, ultimately finding U.S. policies irrational and undirected. The Partnership for a New American Economy and the Partnership for New York City. 2012. “Not Coming to America: Why the U.S. Is Falling Behind in the Global Race for Talent.” Available at: http://www.renewoureconomy.org/wp-content/uploads/2013/07/not-coming-to-america.pdf
4. Examines the possible positive economic impacts of immigration reform and highlights how U.S. immigration policy turns away potentially economically beneficial immigrants. Douglas Holtz-Eakin (2013) “Immigration Reform, Economic Growth, and the Fiscal Challenge,” American Action Forum, April 2013. Available at: http://americanactionforum.org/sites/default/files/Immigration%20and%20the%20Economy%20and%20Budget.pdf
RESOU
RCES
23
On immigration reform and the medical sector:
1. To reflect future uncertainties in health policy and care use and delivery patterns, this study presents ranges for the projected shortage of physicians. Association of American Medical Colleges. 2015. “Physician Supply and Demand Through 2025: Key Findings.” Available at: https://www.aamc.org/download/426260/data/physiciansupplyanddemandthrough2025keyfindings.pdf
2. Examines current physician supply, medical school enrollment, and graduate medical education in the United States. Association of American Medical Colleges. 2013. “2013 State Physician Workforce Data Book” Center for Workforce Studies, AAMC. Available at: https://members.aamc.org/eweb/upload/State%20Physician%20Workforce%20Data%20Book%202013%20(PDF).pdf
3. Provides projections for the supply, demand, and the shortages of registered nurses until the year 2020. U.S. Department of Health and Human Services. 2002. “Projected Supply, Demand and Shortages of Registered Nurses; 2000-2020.” The Health Resources and Service Administration, Bureau of Health Professions, National Center for Health Workforce Analysis. Available at: http://www.ahcancal.org/research_data/staffing/Documents/Registered_Nurse_Supply_Demand.pdf
RESO
URC
ES
24

Endnotes
1. Partnership for a New American Economy, “Not Coming to America: Why the U.S. is Falling Behind in the Race for Talent” (May 2012), Page 7. Available here: http://www.renewoureconomy.org/wp-content/uploads/2013/07/not-coming-to-america.pdf.
2. Madeline Zavodny (2011) “Immigration and American Jobs,” American Enterprise Institute and the Partnership for a New American Economy, December 15, 2011. Available at: http://www.renewoureconomy.org/wp-content/uploads/2011/12/NAE_Im-AmerJobs.pdf
3. William Kerr and William Lincoln (2010) “The Supply Side of Innovation: H-1B Visa Reforms and U.S. Ethnic Invention,” Journal of Labor Economics, July 2010. Available at: http://bit.ly/1F1w8ZS
4. “USCIS Completes the H-1B Cap Random Selection Process for FY 2016.” (U.S. Citizenship and Immigration Services, April 2015). Available here: http://www.uscis.gov/news/alerts/uscis-completes-h-1b-cap-random-selection-process-fy-2016
5. If all of the 148,000 cap-subject H-1B nonimmigrant worker petitions filed but not selected by random lottery were from businesses with 25 or fewer employers than the regular filing fees would total $233,100,000. If all of the 148,000 petitions were from businesses with more than 25 employees than the regular filing fees would total $344,100,000. This excludes the $1,225 filing fee per petition for premium processing, paid by any business that does not want to wait the up to six months for regular processing (or other filing surcharges that might apply).
6. See, “H-1B Visas and the STEM Shortage: A Research Brief” (Jonathan T. Rothwell and Neil G. Ruiz, May 2013) at p. 3. Accessible at: http://papers.ssrn.com/sol3/papers.cfm?abstract_id=2262872
7. The Partnership for a New American Economy and the Partnership for New York City (2012) “Not Coming to America,” May 2012. Available at: http://www.renewoureconomy.org/wp-content/uploads/2013/07/not-coming-to-america.pdf
8. Anthony P. Carnevale, Nicole Smith, and Jeff Strohl (2013) “Recovery 2020: Job Growth and Education Requirements Through 2020,” June 2013. Available at: https://georgetown.app.box.com/s/tll0zkxt0puz45hu21g6
9. Jonathan Rothwell and Neil G. Ruiz (2013) “H-1B Visas and the STEM Shortage,” Brookings Institution, May 10, 2013. Available at: http://www.brookings.edu/research/papers/2013/05/10-h1b-visas-stem-rothwell-ruiz
10. 43 percent of H-1B STEM jobs as compared to 36 percent of other job openings were unfilled for more than one month.
11. “H-1B Visas and the STEM Shortage: A Research Brief” (Jonathan T. Rothwell and Neil G. Ruiz, May 2013) at p. 3. Accessible at: http://papers.ssrn.com/sol3/papers.cfm?abstract_id=2262872
12. See figures from “Talent, Immigration, and U.S. Economic Competitiveness,” (Gordon Hanson and Matthew Slaughter, May 2013) analyzing data from the American Community Survey of the Census Bureau, 2009, 2010, 2011 at pp. 7 and 18. Accessible at: http://irps.ucsd.edu/assets/001/504703.pdf
13. Change The Equation (2014) “Vital Signs.” Available at: http://vitalsigns.changetheequation.org/
14. Ibid.
15. “Science, Technology, Engineering, and Mathematics Education: Assessing the Relationship between Education and the Workforce” (GAO-14-374, General Accountability Office, May 2014). Available at: http://www.gao.gov/assets/670/663079.pdf
16. “Science & Engineering Degree Attainment: 2004-2014” (National Student Clearinghouse Research Center, January 2015). Available at: http://nscresearchcenter.org/wp-content/uploads/SnapshotReport15-DegreeAttainment.pdf.
17. Integrated Postsecondary Education Data System (IPEDS), National Center for Education Statistics (NCES), Department of Education, 2013. Available at: https://nces.ed.gov/ipeds/
18. Michael G. Finn (2014) “Stay Rates of Foreign Doctorate Recipients from U.S. Universities” Oak Ridge Institute for Science and Education, U.S. Department of Energy, January 2014. Available at: http://orise.orau.gov/files/sep/stay-rates-foreign-doctorate-recipients-2011.pdf
END
NO
TES
25

19. Wait times have doubled since then. In 2006, wait times for a native of India who had completed a U.S. doctorate was 3½ years (July 2006) and today it is 7 years (May 2015) per the State Department’s Visa Bulletin. Accessible at: http://travel.state.gov/content/visas/english/law-and-policy/bulletin.html.
20. Business Roundtable (2015) “State of Immigration: How the United States Stacks Up in the Global Talent Competition,” March 2015. Available at: http://businessroundtable.org/sites/default/files/immigration_reports/BRT%20immigration%20report.pdf
21. Ibid.
22. Ibid.
23. Douglas Holtz-Eakin (2013) “Immigration Reform, Economic Growth, and the Fiscal Challenge,” American Action Forum, April 2013. Available at: http://americanactionforum.org/sites/default/files/Immigration%20and%20the%20Economy%20and%20Budget.pdf
24. Bureau of Labor Statistics (2014) “Occupational Employment Statistics,” May 2014. Available at: http://www.bls.gov/oes/current/oes_nat.htm
25. Jones Lang LaSalle (2014) “High-tech boosts office recovery, but at a high cost,” July 2014. Available at: http://www.us.jll.com/united-states/en-us/Research/US-high-tech-July-2014.pdf
26. Change The Equation (2014) “Vital Signs.” Available at: http://vitalsigns.changetheequation.org/
27. The Partnership for a New American Economy, Information Technology Industry Council, and the U.S. Chamber of Commerce (2012) “Help Wanted,” November 2012. Available at: http://www.renewoureconomy.org/wp-content/uploads/2013/07/stem-report.pdf
28. Compiled from Current Population Survey, a project of the Bureau of Labor Statistics and the Census Bureau. The data set is pooled monthly CPS samples for 12 months – December 2013 through November 2014. Observations do not include any of the social sciences and were weighted using the BLS composite monthly weight variable. Monthly weights were divided by 12, so totals are estimates of average monthly employment over the year. The 12 months of observations are the most recent 12 months available as of January 12, 2015.
29. Liana Christin Landivar (2013) “The Relationship Between Science and Engineering Education and Employment in STEM Occupations,” American Community Survey Reports, U.S. Census Bureau, September 2013. Available at: https://www.census.gov/prod/2013pubs/acs-23.pdf
30. Madeline Zavodny (2011) “Immigration and American Jobs,” American Enterprise Institute and the Partnership for a New American Economy, December 15, 2011. Available at: http://www.renewoureconomy.org/wp-content/uploads/2011/12/NAE_Im-AmerJobs.pdf
31. Kerr et al. (2014) “Skilled Immigration and the Employment Structures of U.S. Firms,” Journal of Labor Economics, September 2014. Available at: http://www.econ.psu.edu/classes-seminars/seminar-documents/william-lincoln-skilled-immigration-and-the-employment-structures-of-u-s-firms-1
32. National Foundation for American Policy (2008) “NFAP Policy Brief: H-1B Visas and Job Creation,” March 2008. Available at: http://www.nfap.com/pdf/080311h1b.pdf
33. The Partnership for a New American Economy (2012) “Patent Pending,” June 2012. Available at: http://www.renewoureconomy.org/wp-content/uploads/2013/07/patent-pending.pdf
34. William Kerr and William Lincoln (2010) “The Supply Side of Innovation: H-1B Visa Reforms and U.S. Ethnic Invention,” Journal of Labor Economics, July 2010. Available at: http://bit.ly/1F1w8ZS
35. The Partnership for a New American Economy, Information Technology Industry Council, and the U.S. Chamber of Commerce (2012) “Help Wanted,” November 2012. Available at: http://www.renewoureconomy.org/wp-content/uploads/2013/07/stem-report.pdf
36. Giovanni Peri, Kevin Y. Shih, and Chad Sparber (2014) “Foreign STEM Workers and Native Wages and Employment in U.S. Cities,” The National Bureau of Economic Research, Working Paper, Issued May 2014. Available at: http://www.nber.org/papers/w20093
37. Jonathan Rothwell and Neil G. Ruiz (2013) “H-1B Visas and the STEM Shortage,” Brookings Institution, May 10, 2013. Available at: http://www.brookings.edu/research/papers/2013/05/10-h1b-visas-stem-rothwell-ruiz
38. Giovanni Peri, Kevin Shih, and Chad Sparber (2014) “Foreign Scientists and Engineers and Economic Growth,” Cato Papers on Public Policy, Vol. 3, Cato Institute, 2014. Available at: http://object.cato.org/sites/cato.org/files/serials/files/cato-papers-public-policy/2014/6/cppp-3-3.pdf
39. Peri et al. (2014) “Closing Economic Windows,” The Partnership for a New American Economy, June 2014. Available at: http://www.renewoureconomy.org/wp-content/uploads/2014/06/pnae_h1b.pdf
END
NO
TES
26
40. Giovanni Peri (2010) “The Effect of Immigrants on U.S. Employment and Productivity,” Economic Letter 2010-26, Federal Reserve Bank of San Francisco, August 2010. Accessible at: http://www.frbsf.org/economic-research/publications/economic-letter/2010/august/effect-immigrants-us-employment-productivity/
41. Giovanni Peri (2010) “The Impact of Immigrants in Recession and Economic Expansion,” Migration Policy Institute, June 2010. Available at: http://www.migrationpolicy.org/research/impact-immigrants-recession-and-economic-expansion
42. Giovanni Peri (2010) “The Effect of Immigrants on U.S. Employment and Productivity,” Economic Letter 2010-26, Federal Reserve Bank of San Francisco, August 2010. Accessible at: http://www.frbsf.org/economic-research/publications/economic-letter/2010/august/effect-immigrants-us-employment-productivity/
43. The Partnership for a New American Economy, Information Technology Industry Council, and the U.S. Chamber of Commerce (2012) “Help Wanted,” November 2012. Available at: http://www.renewoureconomy.org/wp-content/uploads/2013/07/stem-report.pdf
44. Cost Estimate of H.R. 2131 SKILLS Visa Act (CBO, March 2014). Accessible at: http://www.cbo.gov/publication/45179
45. Madeline Zavodny (2011) “Immigration and American Jobs,” American Enterprise Institute and the Partnership for a New American Economy, December 15, 2011. Available at: http://www.renewoureconomy.org/wp-content/uploads/2011/12/NAE_Im-AmerJobs.pdf
46. Giovanni Peri, Kevin Y. Shih, and Chad Sparber (2014) “Foreign STEM Workers and Native Wages and Employment in U.S. Cities,” The National Bureau of Economic Research, Working Paper, Issued May 2014. Available at: http://www.nber.org/papers/w20093
47. Sam Batkins and Laura Collins (2015) “The Costs of a Broken Immigration System on American Business.” American Action Forum, April 9, 2015. Available here: http://americanactionforum.org/research/the-costs-of-a-broken-immigration-system-on-american-business
48. For a recent discussion of the bureaucratic costs of the H-1B process, see “The Costs of a Broken Immigration System on American Business” (Sam Batkins and Laura Collins, American Action Forum, April 2015). Accessible at: http://americanactionforum.org/research/the-costs-of-a-broken-immigration-system-on-american-business
49. Ibid.
50. See, for example, the story of Amit Aharoni as reported by ABC World News, available at http://abcnews.go.com/Business/MadeInAmerica/visa-problem-prevents-entrepreneur-creating-american-jobs/story?id=14857757 USCIS eventually reconsidered and granted Amit’s visa application.
51. See, e.g., U.S. Department of Commerce, Bureau of Economic Analysis (BEA) for GDP, U.S. Census Bureau for population, and World Bank for GDP per capita figures.
52. GDP today is $16.768 trillion and population is 316 million. In 1990, those numbers were $5.979 trillion and 250 million. GDP per capita is now $53,259 annually; in 1990 it was $23,934.
53. Legacy INS had ongoing issues in counting the number of H-1B numbers. For example, in FY 1996 it was initially announced that the cap had been hit on 8/21/96. However, on re-calculation, INS determined that the cap had not been hit, and resumed accepting H-1Bs on 9/6/96 through the end of the FY. Additionally, in FY 1999 a computer malfunction at INS resulted in the accidental issuance of 20,000 more H-1B visas than the law allows during the FY.
54. The law creating the advanced degree H1B Cap was signed in December 2004 and became effective on May 12, 2005. However, according to DHS officials, the agency first began tracking the master’s cap is FY 2006. Therefore, there is not a separate date for the master’s cap for FY 2005.
END
NO
TES
27

NO
TES
28 Notes