Understanding and Evaluating Kubernetespages.cs.wisc.edu/~anubhavnidhi/kubernetes.pdfSimple scripts...
86
Understanding and Evaluating Kubernetes Haseeb Tariq Anubhavnidhi “Archie” Abhashkumar
Transcript of Understanding and Evaluating Kubernetespages.cs.wisc.edu/~anubhavnidhi/kubernetes.pdfSimple scripts...

Understanding and Evaluating Kubernetes
Haseeb TariqAnubhavnidhi “Archie” Abhashkumar
▣ Overview of project
▣ Kubernetes background and overview
▣ Experiments
▣ Summary and Conclusion
Agenda
● Goals
● Our approach
● Observations
1.Overview of
Project
▣ Kubernetes□ Platform to manage containers in a cluster
▣ Understand its core functionality□ Mechanisms and policies
▣ Major questions□ Scheduling policy□ Admission control□ Autoscaling policy□ Effect of failures
Goals

▣ Monitor state changes□ Force system into initial state□ Introduce stimuli□ Observe the change towards the final state
▣ Requirements□ Small Kubernetes cluster with resource
monitoring□ Simple workloads to drive the changes
Our Approach

▣ Kubernetes tries to be simple and minimal
▣ Scheduling and admission control□ Based on resource requirements□ Spreading across nodes
▣ Response to failures□ Timeout and restart□ Can push to undesirable states
▣ Autoscaling as expected□ Control loop with damping
Observations

● Motivation
● Architecture
● Components
2.Kubernetes Background

▣ Workloads have shifted from using VMs to containers□ Better resource utilization□ Faster deployment□ Simplifies config and portability
▣ More than just scheduling□ Load balancing□ Replication for services□ Application health checking□ Ease of use for
■ Scaling■ Rolling updates
Need for Container Management

api-server
scheduler
kublet
pod pod
High Level Design
kublet
pod pod
User Master Nodes
Pods
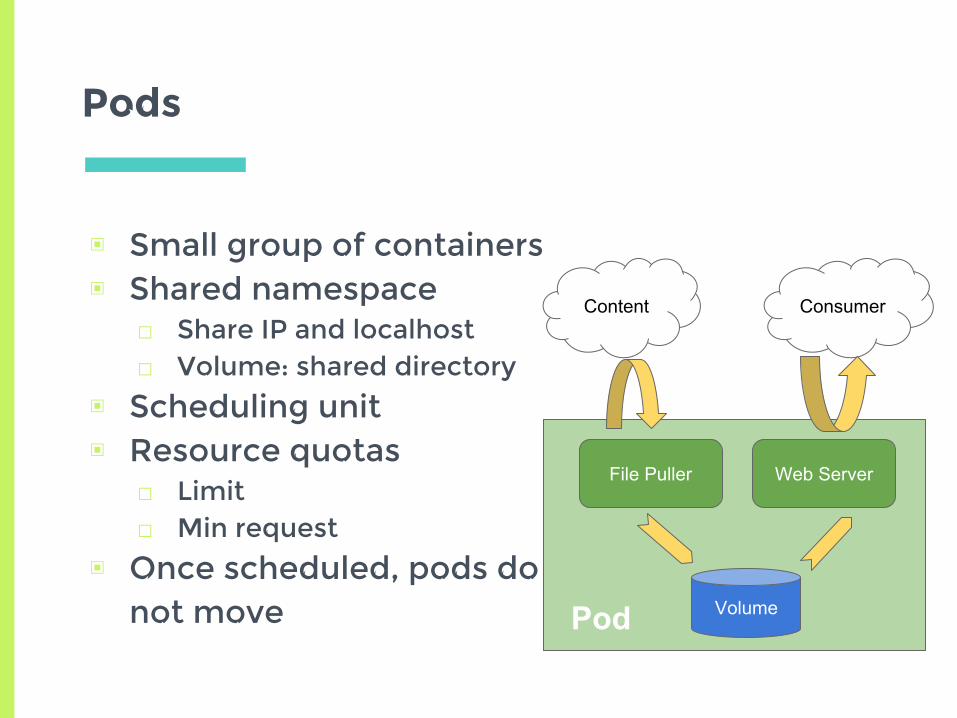
▣ Small group of containers▣ Shared namespace
□ Share IP and localhost□ Volume: shared directory
▣ Scheduling unit▣ Resource quotas
□ Limit□ Min request
▣ Once scheduled, pods do not move
File Puller Web Server
Volume
Content Consumer
Pod

General Concepts
Pod
▣ Replication Controller
□ Maintain count of pod replicas
▣ Service
□ A set of running pods accessible by virtual IP
▣ Network model
□ IP for every pod, service and node
□ Makes all to all communication easy

3.Experimental
Setup

Experimental Setup
Pod
▣ Google Compute Engine cluster□ 1 master, 6 nodes
▣ Limited by free trial□ Could not perform experiments on
scalability
Google Compute Engine
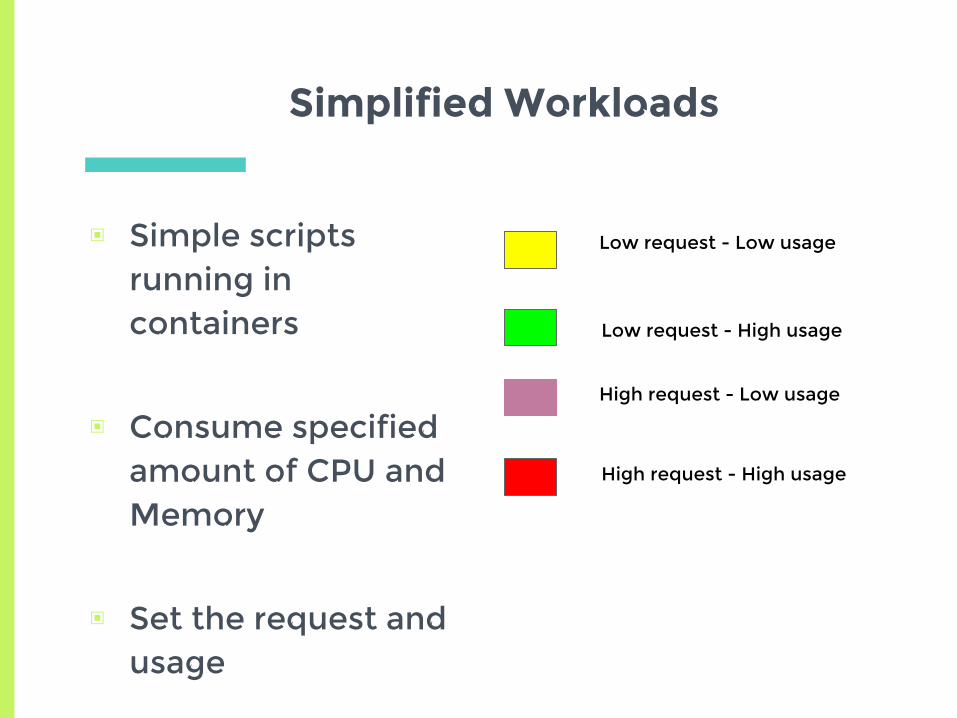
Simplified Workloads
Low request - Low usage
Low request - High usage
High request - Low usage
High request - High usage
▣ Simple scripts running in containers
▣ Consume specified amount of CPU and Memory
▣ Set the request and usage

5.Experiments
Scheduling Behavior
● Scheduling based on min-request or actual usage?

Scheduling based on min-request or actual usage?
Pod
▣ Initial experiments showed that scheduler
tries to spread the load,
□ Based on actual usage or min request?
▣ Set up two nodes with no background
containers
□ Node A has a high cpu usage but a low request
□ Node B has low cpu usage but higher request
▣ See where a new pod gets scheduled
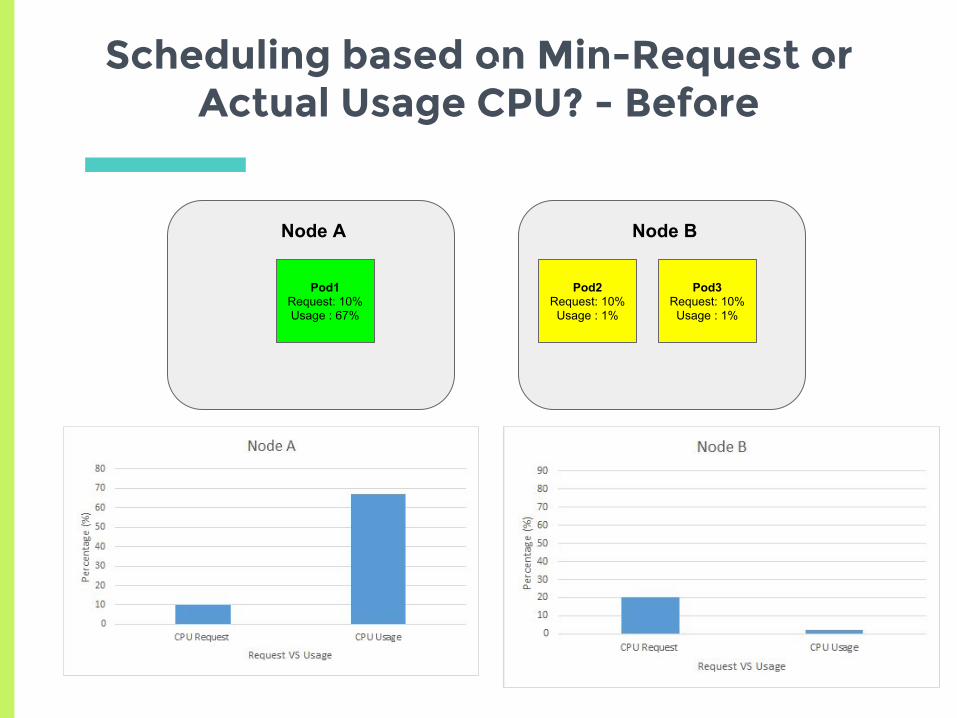
Scheduling based on Min-Request or Actual Usage CPU? - Before
Node A
Pod1Request: 10%Usage : 67%
Node B
Pod2Request: 10%
Usage : 1%
Pod3Request: 10%
Usage : 1%

Scheduling based on Min-Request or Actual Usage CPU? - Before
Node A
Pod1Request: 10%Usage : 42%
Node B
Pod2Request: 10%
Usage : 1%
Pod3Request: 10%
Usage : 1%
Pod4Request: 10%Usage : 43%

Scheduling based on Min-Request or Actual Usage Memory?
▣ We saw the same results when running pods
with changing memory usage and request
▣ Scheduling is based on min-request

5.Experiments
Scheduling Behavior● Are Memory
and CPU given equal weightage for making scheduling decisions?

Are Memory and CPU given Equal Weightage?
▣ First Experiment (15 trials):
□ Both nodes have 20% CPU request and 20%
Memory request
□ Average request 20%
▣ New pod equally likely to get scheduled on
both nodes.

New Pod with 20% CPU and 20% Memory Request
Node A Node B
Pod2CPU Request: 20%
Memory Request : 20%
Pod1CPU Request: 20%
Memory Request : 20%
Pod3CPU Request: 20%
Memory Request : 20%

New Pod with 20% CPU and 20% Memory Request
Node A Node B
Pod2CPU Request: 20%
Memory Request : 20%
Pod1CPU Request: 20%
Memory Request : 20%
Pod3CPU Request: 20%
Memory Request : 20%

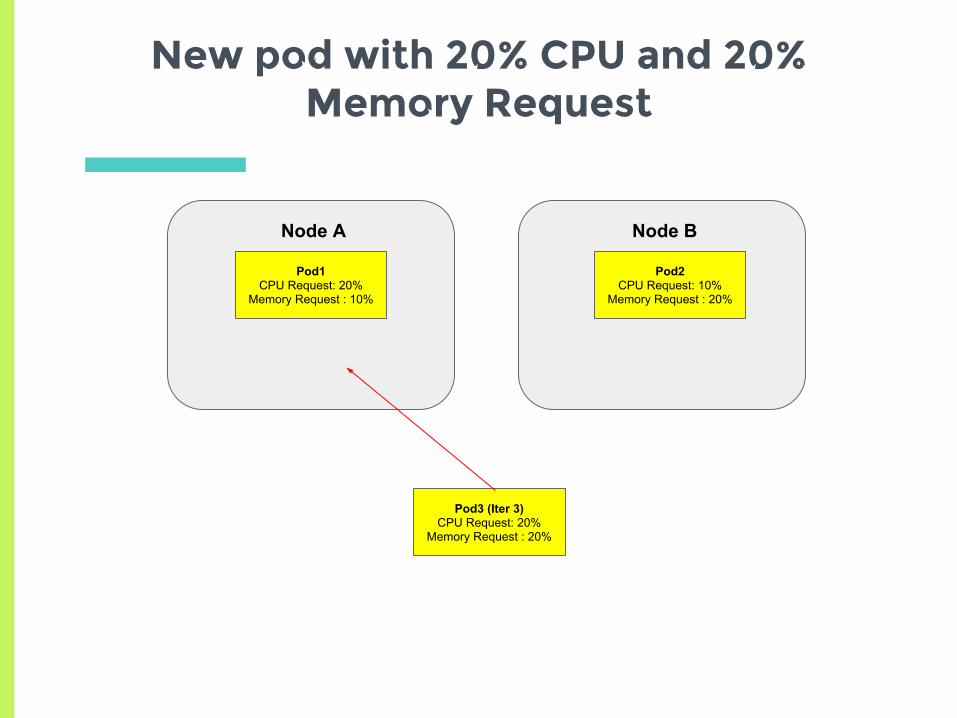
▣ Second Experiment (15 trials):
□ Node A has 20% CPU request and 10% Memory
request
■ Average request 15%
□ Node B has 20% CPU request and 20% Memory
request
■ Average request 20%
▣ New pod should always be scheduled on
Node A
Are Memory and CPU given Equal Weightage?

New Pod with 20% CPU and 20% Memory Request
Node A Node B
Pod2CPU Request: 20%
Memory Request : 20%
Pod1CPU Request: 20%
Memory Request : 10%
Pod3CPU Request: 20%
Memory Request : 20%

New Pod with 20% CPU and 20% Memory Request
Node A Node B
Pod2CPU Request: 20%
Memory Request : 20%
Pod1CPU Request: 20%
Memory Request : 10%
Pod3CPU Request: 20%
Memory Request : 20%

Are Memory and CPU given Equal Weightage?
▣ Third Experiment (15 trials):
□ Node A has 20% CPU request and 10% Memory
request.
■ Average 15%
□ Node B has 10% CPU request and 20% Memory
request
■ Average 15%
▣ Equally likely to get scheduled on both again

New pod with 20% CPU and 20% Memory Request
Node A Node B
Pod2CPU Request: 10%
Memory Request : 20%
Pod1CPU Request: 20%
Memory Request : 10%
Pod3CPU Request: 20%
Memory Request : 20%

New pod with 20% CPU and 20% Memory Request
Node A Node B
Pod2CPU Request: 10%
Memory Request : 20%
Pod1CPU Request: 20%
Memory Request : 10%
Pod3CPU Request: 20%
Memory Request : 20%

Are Memory and CPU given Equal Weightage?
▣ From the experiments we can see that
Memory and CPU requests are given equal
weightage in scheduling decisions

5.Experiments
Admission Control
● Is Admission control based on resource usage or resource request?
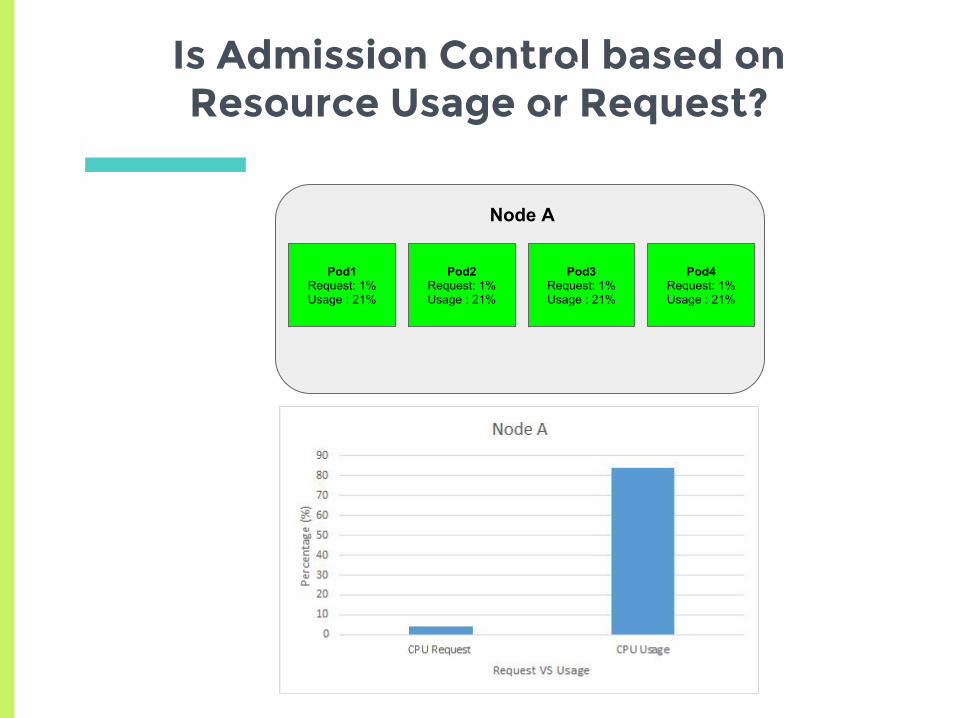
Is Admission Control based on Resource Usage or Request?
Node A
Pod1Request: 1%Usage : 21%
Pod2Request: 1%Usage : 21%
Pod3Request: 1%Usage : 21%
Pod4Request: 1%Usage : 21%

Is Admission Control based on Actual Usage? : 70% CPU request
Node A
Pod3Request: 1%Usage : 2%
Pod4Request: 1%Usage : 2%
Pod5Request: 70%Usage : 78%
Pod2Request: 1%Usage : 2%
Pod1Request: 1%Usage : 2%
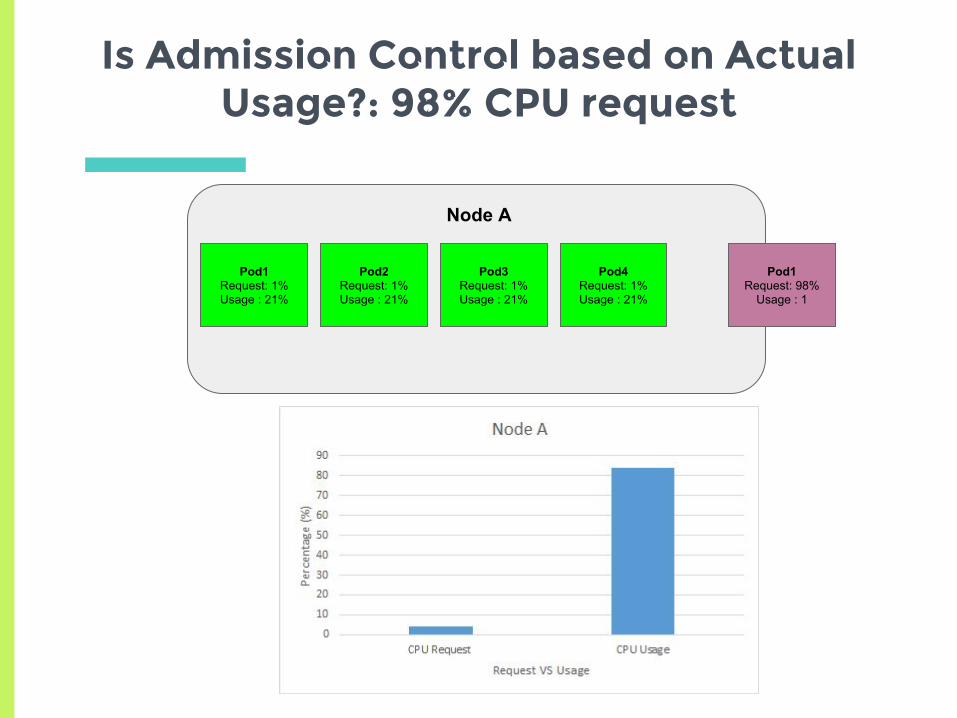
Is Admission Control based on Actual Usage?: 98% CPU request
Node A
Pod1Request: 1%Usage : 21%
Pod2Request: 1%Usage : 21%
Pod3Request: 1%Usage : 21%
Pod4Request: 1%Usage : 21%
Pod1Request: 98%
Usage : 1

Is Admission Control based on Actual Usage?: 98% CPU request
Node A
Pod1Request: 1%Usage : 21%
Pod2Request: 1%Usage : 21%
Pod3Request: 1%Usage : 21%
Pod4Request: 1%Usage : 21%
Pod1Request: 98%
Usage : 1

Is Admission Control based on Actual Usage?
▣ From the previous 2 slides we can show that
admission control is also based on min-
request and not actual usage

5.Experiments
Does kubernetes always guarantee minimum request?
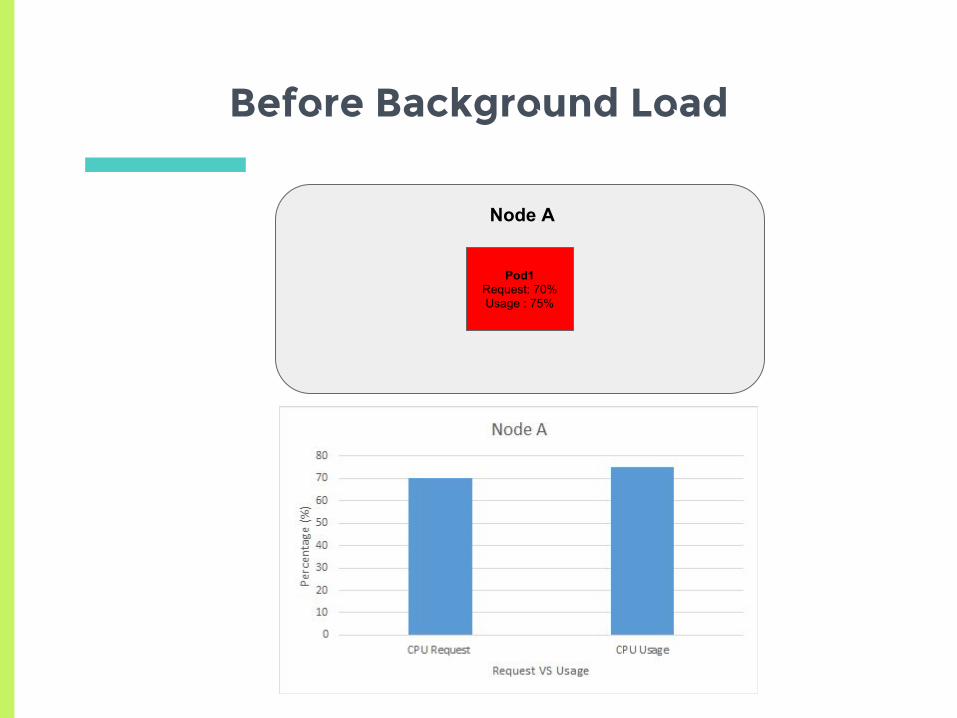
Before Background Load
Node A
Pod1Request: 70%Usage : 75%
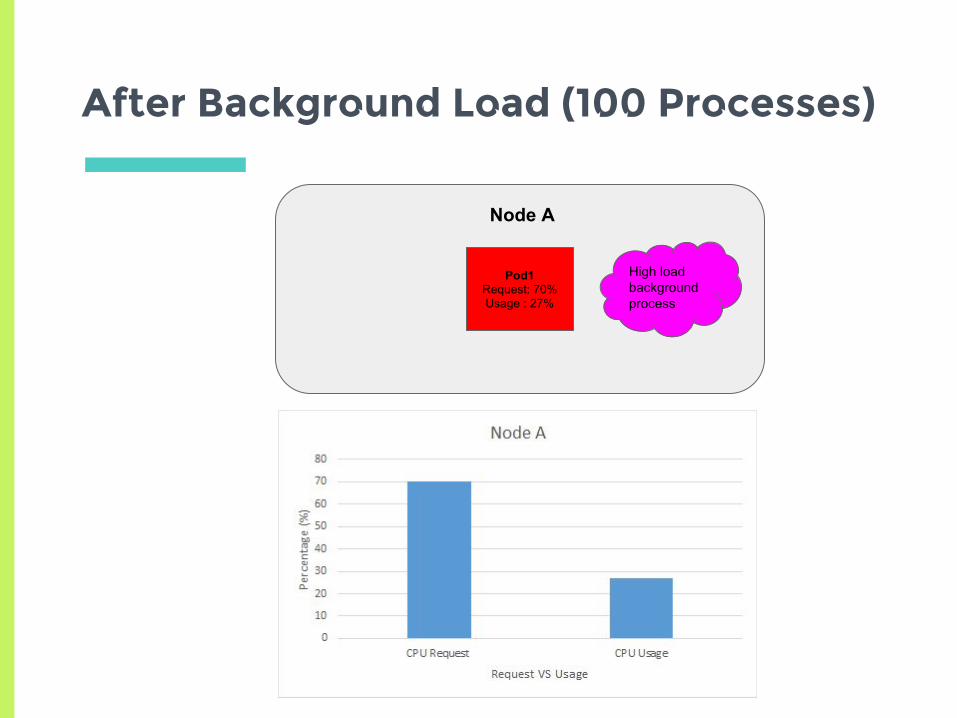
After Background Load (100 Processes)
Node A
Pod1Request: 70%Usage : 27%
High load background process
Does Kubernetes always guarantee Min Request?
▣ Background processes on the node are not
part of any pods, so kubernetes has no control
over them
▣ This can prevent pods from getting their min-
request

5.Experiments
Fault Tolerance and effect of failures
● Container and Node crash

Response to Failure
▣ Container crash
□ Detected via the docker daemon on the node
□ More sophisticated probes to detect slowdown
deadlock
▣ Node crash
□ Detected via node controller, 40 second heartbeat
□ Pods of failed node, rescheduled after 5 min

5.Experiments
Fault Tolerance and effect of failures
● Interesting consequence of crash, reboot

Pod Layout before Crash
Node A
Pod1Request: 10%Usage : 35%
Node B
Pod2Request: 10%Usage : 45%
Pod3Request: 10%Usage : 40%

Pod Layout after Crash
Node A
Pod1Request: 10%Usage : 35%
Node B
Pod2Request: 10%Usage : 45%
Pod3Request: 10%Usage : 40%

Pod Layout after Crash & before Recovery
Node A Node B
Pod2Request: 10%Usage : 27%
Pod3Request: 10%Usage : 26%
Pod1Request: 10%Usage : 29%

Pod Layout after Crash & after Recovery
Node A Node B
Pod2Request: 10%Usage : 27%
Pod3Request: 10%Usage : 26%
Pod1Request: 10%Usage : 29%

Interesting Consequence of Crash, Reboot
▣ Can shift the container placement into an
undesirable or less optimal state
▣ Multiple ways to mitigate this
□ Have kubernetes reschedule
■ Increases complexity
□ Users set their requirements carefully so as not to
get in that situation
□ Reset the entire system to get back to the desired
configuration

5.Experiments
Autoscaling
● How does kubernetes do autoscaling?

Autoscaling
▣ Control Loop□ Set target CPU utilization for a pod
□ Check CPU utilization of all pods
□ Adjust number of replicas to meet target utilization
□ Here utilization is % of Pod request
▣ How does normal autoscaling behavior look
like for a stable load?
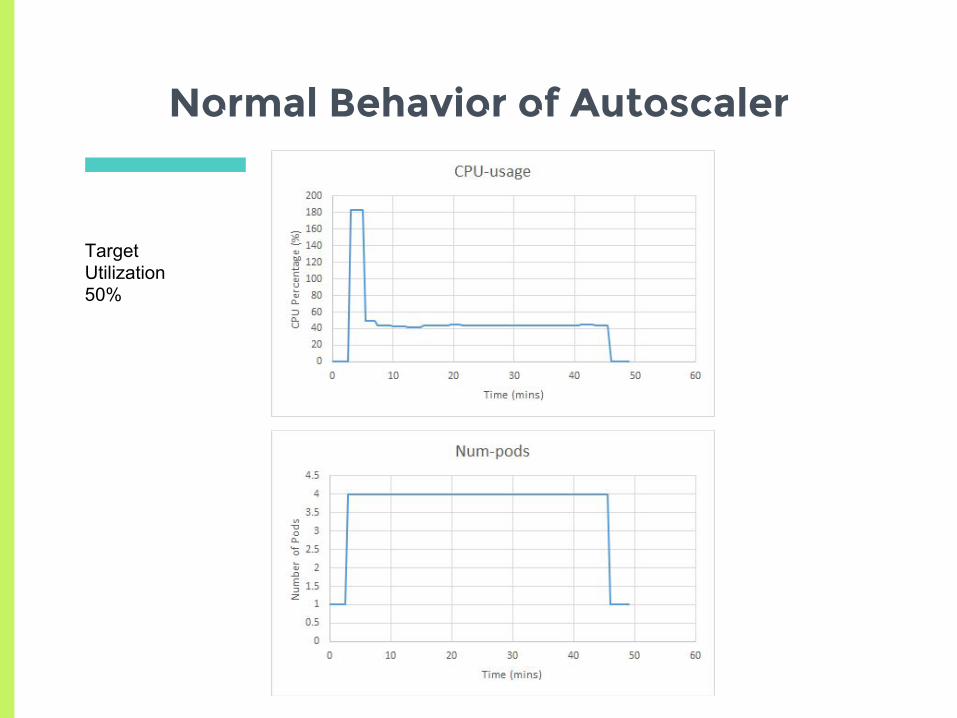
Normal Behavior of Autoscaler
Target Utilization 50%

Normal Behavior of Autoscaler
Target Utilization 50%
High load is added to the system. The cpu usage and number of pods increase

Normal Behavior of Autoscaler
Target Utilization 50%
The load is now spread across nodes and the measured cpu usage is now the average cpu usage of 4 nodes

Normal Behavior of Autoscaler
Target Utilization 50%
The load was removed and pods get removed
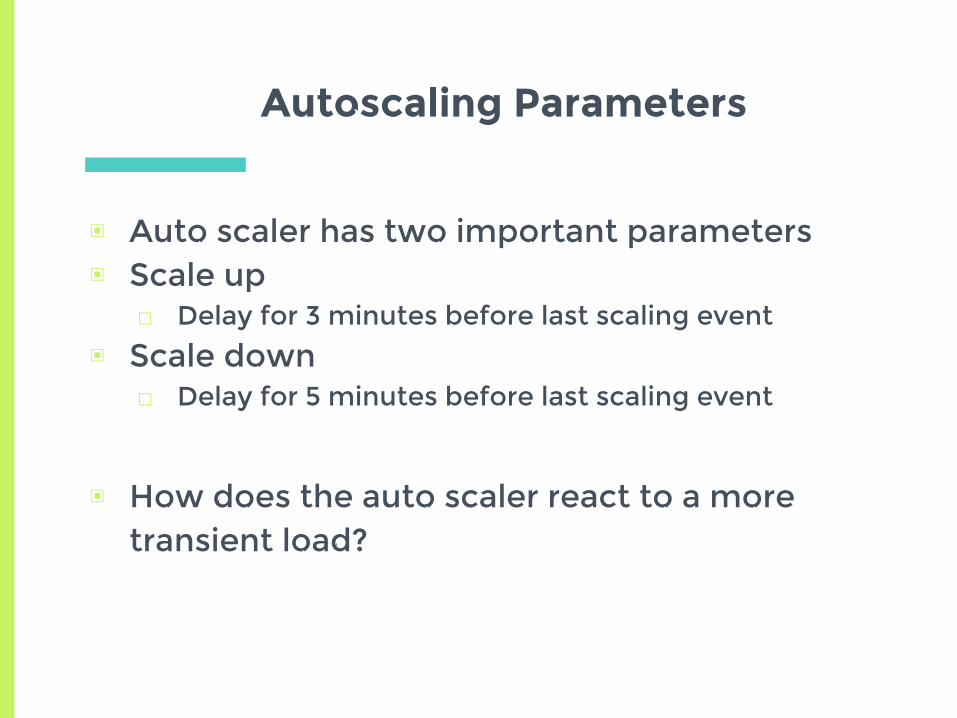
Autoscaling Parameters
▣ Auto scaler has two important parameters▣ Scale up
□ Delay for 3 minutes before last scaling event
▣ Scale down□ Delay for 5 minutes before last scaling event
▣ How does the auto scaler react to a more transient load?
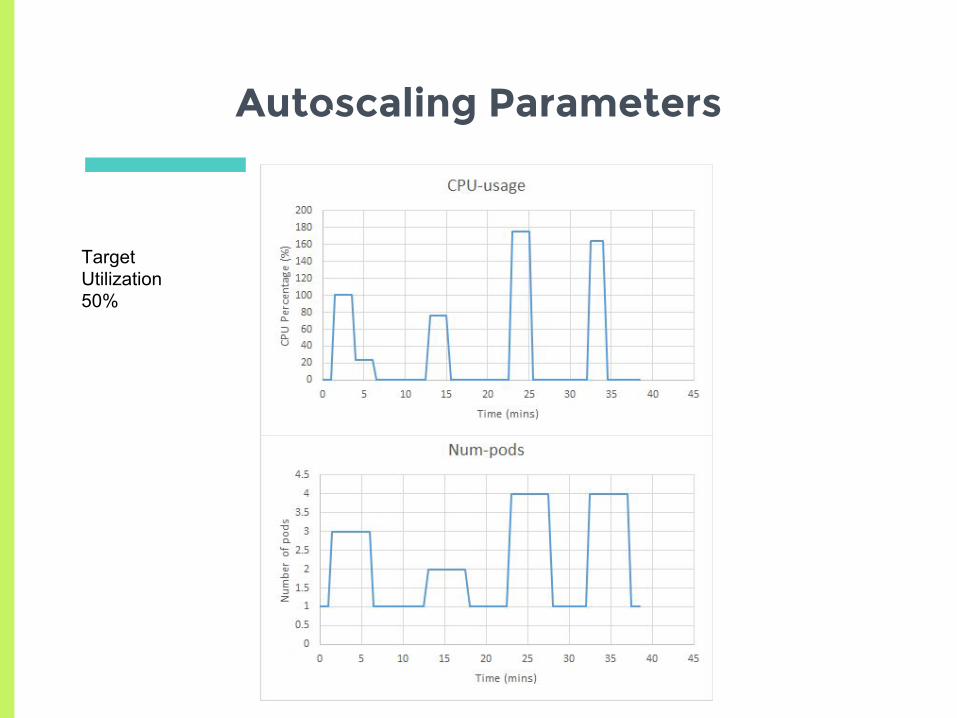
Autoscaling Parameters
Target Utilization 50%

Autoscaling Parameters
Target Utilization 50%
The load went down

Autoscaling Parameters
Target Utilization 50%
The number of pod don’t scale down as quick

Autoscaling Parameters
Target Utilization 50%
The number of pod don’t scale down as quick
The is repeated in other runs too

Autoscaling Parameters
▣ Needs to be tuned for the nature of the
workload
▣ Generally conservative
□ Scales up faster
□ Scales down slower
▣ Tries to avoid thrashing

5.Summary

▣ Scheduling and Admission control policy is
based on min-request of resource
□ CPU and Memory given equal weightage
▣ Crashes can drive system towards
undesirable states
▣ Autoscaler works as expected
□ Has to be tuned for workload
Summary

6.Conclusion

▣ Philosophy of control loops□ Observe, rectify, repeat□ Drive system towards desired state
▣ Kubernetes tries to do as little as possible□ Not a lot of policies□ Makes it easier to reason about□ But can be too simplistic in some cases
Conclusion

Thanks!Any questions?

References
▣ http://kubernetes.io/▣ http://blog.kubernetes.io/▣ Verma, Abhishek, et al. "Large-scale cluster management at
Google with Borg." Proceedings of the Tenth European Conference on Computer Systems. ACM, 2015.

Backup slides

4.Experiments
Scheduling Behavior
● Is the policy based on spreading load across resources?

Is the Policy based on Spreading Load across Resources?
Pod
▣ Launch a Spark cluster on kubernetes
▣ Increase the number of workers one at a time
▣ Expect to see them scheduled across the
nodes
▣ Shows the spreading policy of scheduler
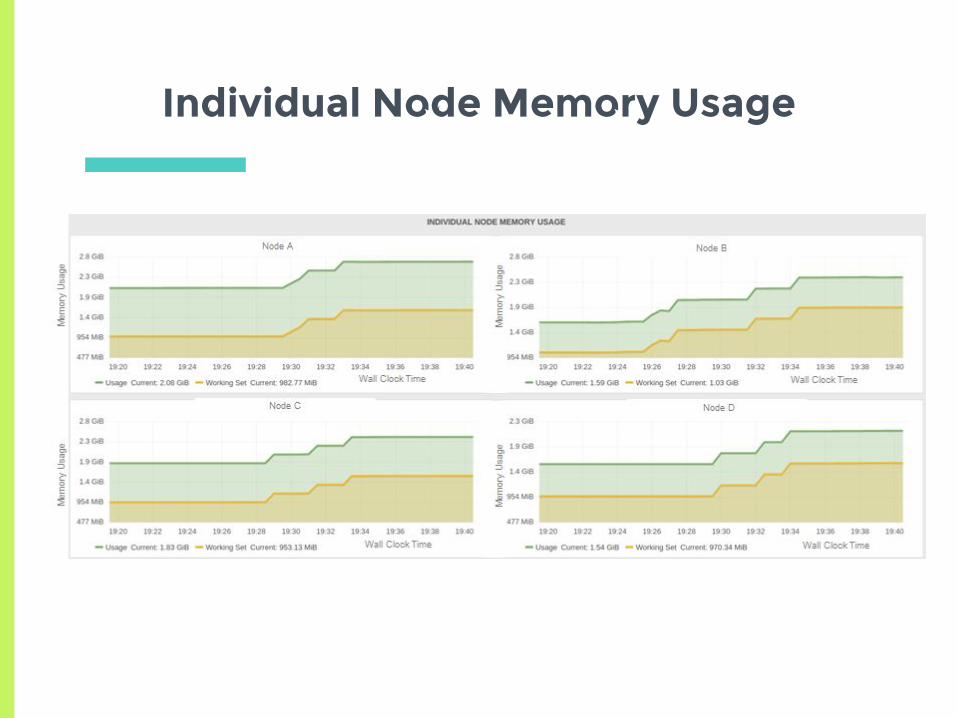
Individual Node Memory Usage

Increase in Memory Usage across Nodes
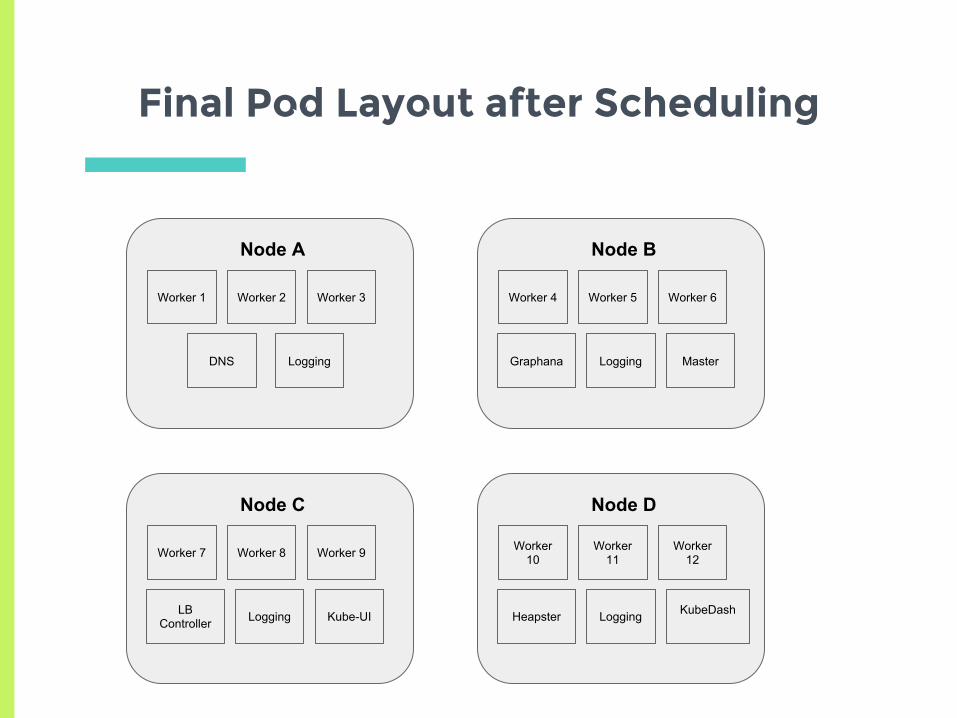
Final Pod Layout after Scheduling
Node A
Worker 1 Worker 2 Worker 3
DNS Logging
Node B
Worker 4 Worker 5 Worker 6
Graphana Logging Master
Node C
Worker 7 Worker 8 Worker 9
LB Controller Logging Kube-UI
Node D
Worker 10
Worker 11
Worker 12
Heapster Logging KubeDash

Is the Policy based on Spreading Load across Resources?
Pod
▣ Exhibits spreading behaviour
▣ Inconclusive
□ Based on resource usage or request?
□ Background pods add to noise
□ Spark workload hard to gauge

▣ CPU Utilization of pod□ Actual usage / Amount requested
Target Num Pods = Ceil( Sum( All Pods Util ) / Target Util )
Autoscaling Algorithm

Master▣ API Server
□ Client access to master
▣ etcd□ Distributed consistent
storage using raft
▣ Scheduler▣ Controller
□ Replication
Control Plane Components
Node▣ Kubelet
□ Manage pods, containers
▣ Kube-proxy□ Load balance among
replicas of pod for a service

Detailed Architecture

Autoscaling for Long Stable Loads (10 high, 10 low)

New Pod with 20% CPU and 20% Memory Request
Node A Node B
Pod2CPU Request: 20%
Memory Request : 20%
Pod1CPU Request: 20%
Memory Request : 20%
Pod3 (Iter 1)CPU Request: 20%
Memory Request : 20%

New Pod with 20% CPU and 20% Memory Request
Node A Node B
Pod2CPU Request: 20%
Memory Request : 20%
Pod1CPU Request: 20%
Memory Request : 20%
Pod3 (Iter 2)CPU Request: 20%
Memory Request : 20%

New Pod with 20% CPU and 20% Memory Request
Node A Node B
Pod2CPU Request: 20%
Memory Request : 20%
Pod1CPU Request: 20%
Memory Request : 20%
Pod3 (Iter 3)CPU Request: 20%
Memory Request : 20%

New Pod with 20% CPU and 20% Memory Request
Node A Node B
Pod2CPU Request: 20%
Memory Request : 20%
Pod1CPU Request: 20%
Memory Request : 10%
Pod3 (Iter 1)CPU Request: 20%
Memory Request : 20%

New Pod with 20% CPU and 20% Memory Request
Node A Node B
Pod2CPU Request: 20%
Memory Request : 20%
Pod1CPU Request: 20%
Memory Request : 10%
Pod3 (Iter 2)CPU Request: 20%
Memory Request : 20%

New Pod with 20% CPU and 20% Memory Request
Node A Node B
Pod2CPU Request: 20%
Memory Request : 20%
Pod1CPU Request: 20%
Memory Request : 10%
Pod3 (Iter 3)CPU Request: 20%
Memory Request : 20%

New pod with 20% CPU and 20% Memory Request
Node A Node B
Pod2CPU Request: 10%
Memory Request : 20%
Pod1CPU Request: 20%
Memory Request : 10%
Pod3 (Iter 1)CPU Request: 20%
Memory Request : 20%

New pod with 20% CPU and 20% Memory Request
Node A Node B
Pod2CPU Request: 10%
Memory Request : 20%
Pod1CPU Request: 20%
Memory Request : 10%
Pod3 (Iter 2)CPU Request: 20%
Memory Request : 20%
New pod with 20% CPU and 20% Memory Request
Node A Node B
Pod2CPU Request: 10%
Memory Request : 20%
Pod1CPU Request: 20%
Memory Request : 10%
Pod3 (Iter 3)CPU Request: 20%
Memory Request : 20%