Understanding & modelling rainfall to runoff, recharge and river
95
Understanding & modelling rainfall to runoff, recharge and river flow responses and potential diffuse pollution pathways Rob Soley: Amec Entec A mole’s eye view Wow! You can SEE the water!
Transcript of Understanding & modelling rainfall to runoff, recharge and river

Understanding & modelling rainfall
to runoff, recharge and river flow
responses and potential diffuse
pollution pathways
Rob Soley: Amec Entec
A mole’s
eye view
Wow! You can
SEE the water!

Presentation (& proposed report) outline
Understanding
The big picture context
Demo catchment detail (not much!)
Storm rainfall and flood responses
Modelling & data availability
With comments on possible diffuse pollution pathways

Topographic 50m DTM elevation 3D drape looking eastward
Big picture topo – geology – structure context
Test
Avon
Stour
Sem @ Cools Cott. Sem @ Priors Farm
Nadder
@ Donhead Hall
Ebble @
Ebbesbourne WakeWylye @
Hill Deverill
Wylye @
Brixton Deverill
Wylye @
Kingston Deverill
m AOD

1:250k Geology Outcrop 3D Drape
Wylye @
Hill Deverill
Wylye @
Brixton Deverill
Wylye @
Kingston Deverill
Sem @ Cools Cott. Sem @ Priors Farm
Nadder
@ Donhead Hall
Ebble @
Ebbesbourne Wake
ClayClay
GreensandGreensand
ChalkChalk
Big picture topo – geology – structure context

Base of the Chalk: BGS 50m grid surface with structure lines
Anticlines
Synclines
Faults
Big picture topo – geology – structure context

1:250k Geology Outcrop 3D Drape with structure lines
Anticlines
Synclines
Faults
Big picture topo – geology – structure context

Big picture topo – geology – structure context

groundwater
table geology
≠
outcrop geology
Cross SectionNorth South
UGs
ZZCk
WMCk
NpCk
HCk
LeCk
SCk
PCk
CCk
NCk
Flinty hardground or
marly flow horizons
Whitway Rock
~ 35 – 55 m a b SCk
Chalk Rock
~ 5 m a b LeCk
Melbourne Rock & Plenus
Marls ~ 0 m a b HCk
Groundwater
table
High GW table
Low GW table
Reading Beds
Chalk
Upper Greensand
Big picture topo – geology – structure context

…variation in
marly clay
content, porosity,
fracture
stratigraphy and
major spring lines
Plenus MarlMelbourn Rock
Chalk Rock
Whitway Rock
Chalk - not just ‘white stuff’
from Mortimore &
Pomerol, 1998
& Mortimore 2001,
2007.
Important flow
and marl
horizons from
Hants & Dorset
modelling

Springheads: Upper Greensand 'header
tanks', Plenus Marls, faults, hardgrounds
West Park Farm Member
Chalk
Upper Greensand
Plenus
Marls*
Faults
London Clay
Gault Clay
1:50k mapped rivers
Scarp slope springs at the edge
of the aquifer system
Dip slope springs from the Upper
Greensand/Chalk boundary, the
Plenus Marls, or faults
Dip slope springs at edge of
confined zone
Frome
Piddle
0 5km0 5km
*Plenus Marls drawn at approx.
intersection with min. GW level
No
rth W
inte
rbo
urn
eB
ere
Stre
am
South Winterbourne
Upwey
Empool
Hooke
Bride
Syd
ling
Win
Devil's
Bk.
(a)

Springheads: Upper Greensand 'header
tanks', Plenus Marls, faults, hardgrounds
(b)
New
Pit C
halk
Holyw
ell Chalk
Zig Zag Chalk
Upper G
reensand
Lewes N
odular
Chalk
Seaford C
halk
Devil's Brook
Perched & leaking reach
Strong
gain
Perched
Gaining
Observation boreholes with
monitored section and water level
water table
Plenus M
arls
Public Water
Supply
0 500 m0 500 m
80
60
40
m
AOD
100
North South
Chalk interfluve – valley groundwater flows
suggests 'high GW level + intense recharge overflow'
karstic response (but not limited to particular formations)
60
50
40
30
20
m AOD
~ 1 kmTarrant Crawford Drove
groundwater hydrograph
Tarrant Keyneston Manor
groundwater hydrograph
10
0
The Tarrant
(winterbourne)
Dominant GW flow
direction out of page
towards Stour (~ 2 km
south @ ~22 m AOD)
K
Interfluves
Valleys
~ east~ west
Variable
Hydraulic
Conductivity
with Depth
Hydraulic
Conductivity,
K
Max GW Level
Min GW Level
Mostly abandoned
(unsaturated) fissure
system (high GW
level 'overflow')
-10
High GWL
'overflow'
fissures
Present
day zone
of active
flow for
most of
the time
Key
'Hardground'
enhanced fissuring
characteristic "UCU"
hydrograph
Upsidedown
Cow's
Udder

Daily measured river flow contrasts
Nadder
Upper Wylye
Ebble
…lots of GW baseflow but
some big runoff spikes too

Local catchment geology and slope details
…from British Geological Survey 1:50 k map

Local catchment geology and slope details
…based on 50 m grid of elevations from Ordnance Survey

Local catchment geology and slope details
white = flat red = steep

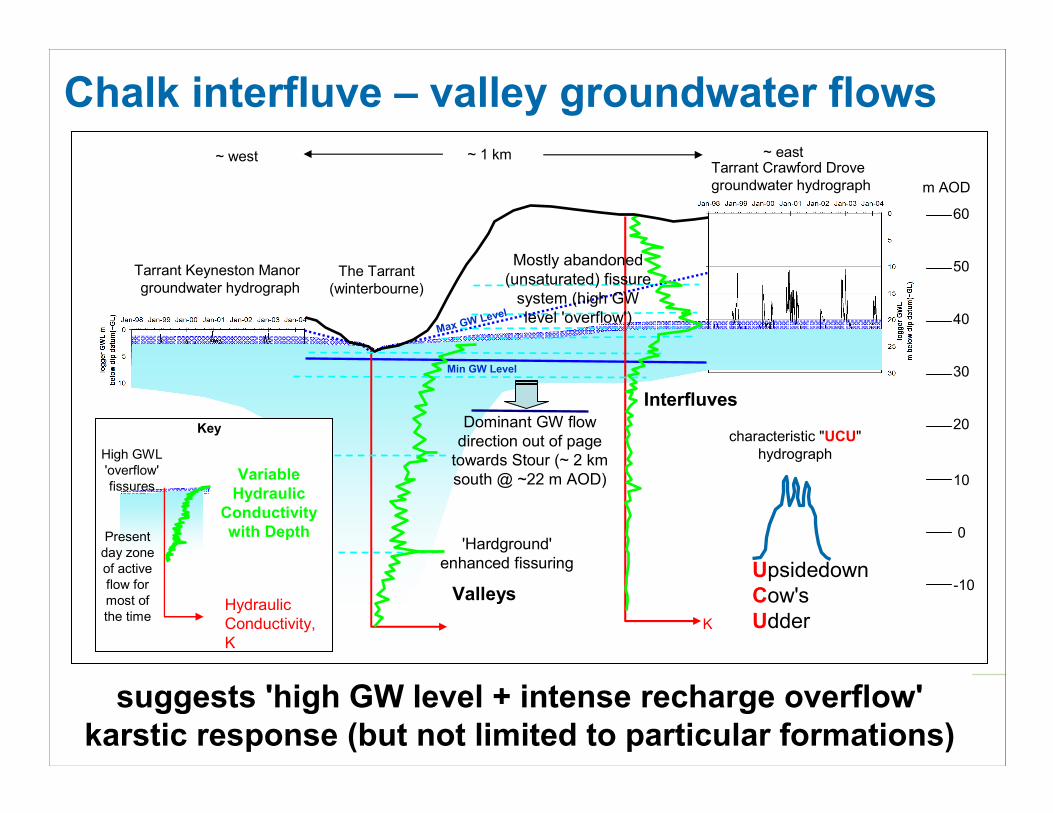
Looking east down the Wylye
Upper Greensand
Chalk
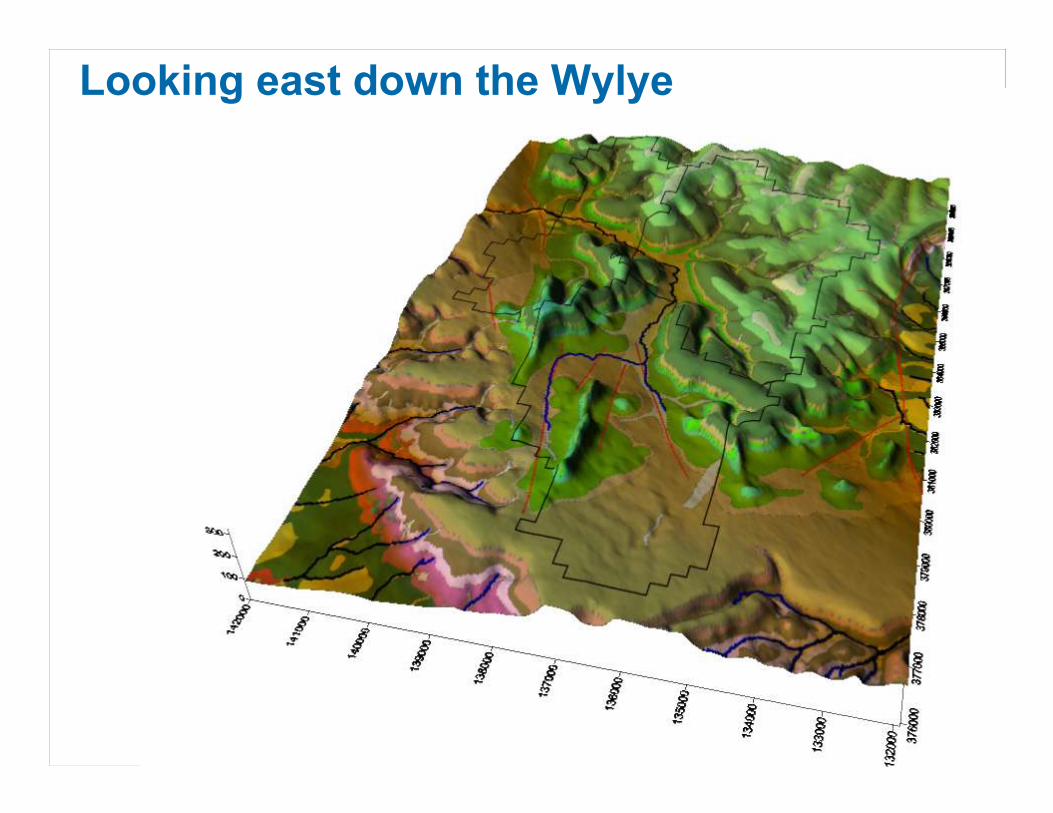
Looking east down the Wylye
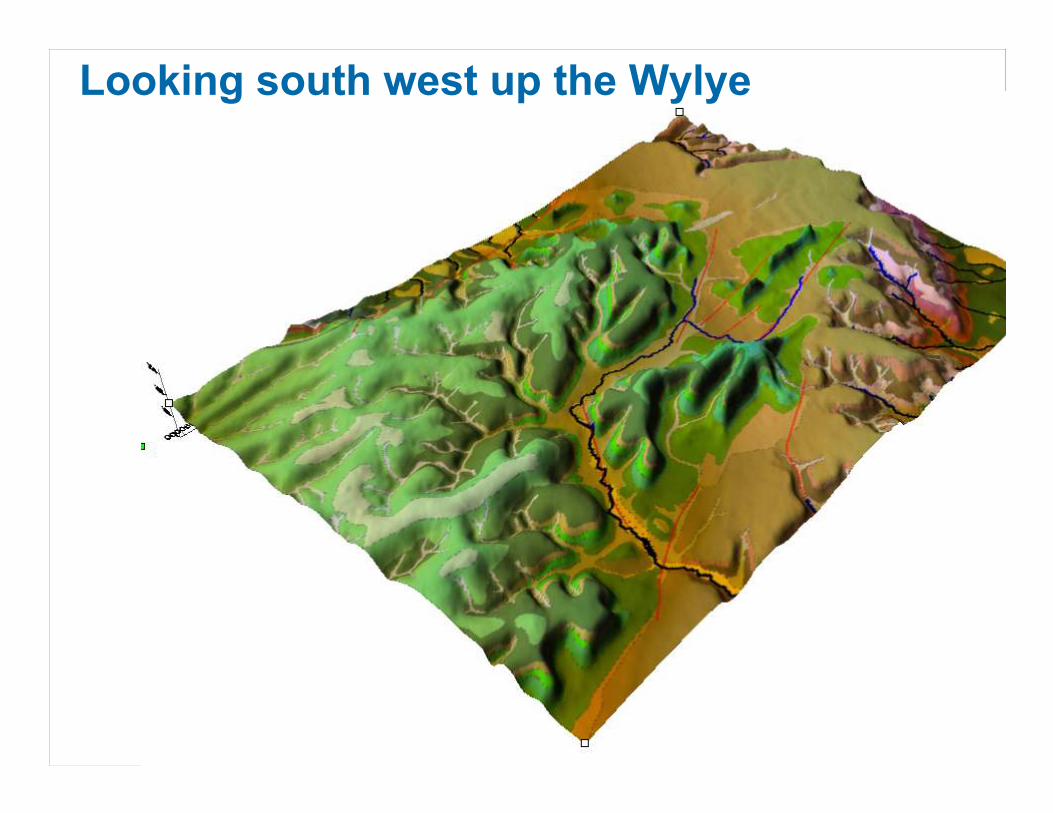
Looking south west up the Wylye

Looking south west up the Wylye

Looking east down the Nadder & Ebble
Upper Greensand
Chalk
Clay

Looking east down the Nadder & Ebble

Looking west up the Nadder & Ebble

Looking west up the Nadder & Ebble

Wessex Basin Modelling
focused on low flow impacts
Recent Actual Q95
minus
Natural Q95,
Ml/d

Wessex Basin Modelling
focused on low flow impacts
Recent Actual Q95
Compliance with
WFD flow
screening
thresholds
DRAFT!

But what happens
during storms?
Flow gauging
stations
Amesbury
Stockton Park
Laverstock

0
200
400
600
800
1000
1200
1400
1600
Jan 00 Jan 01 Jan 02 Jan 03 Jan 04 Jan 05 Jan 06 Jan 07
Flo
w (
Ml/d
)
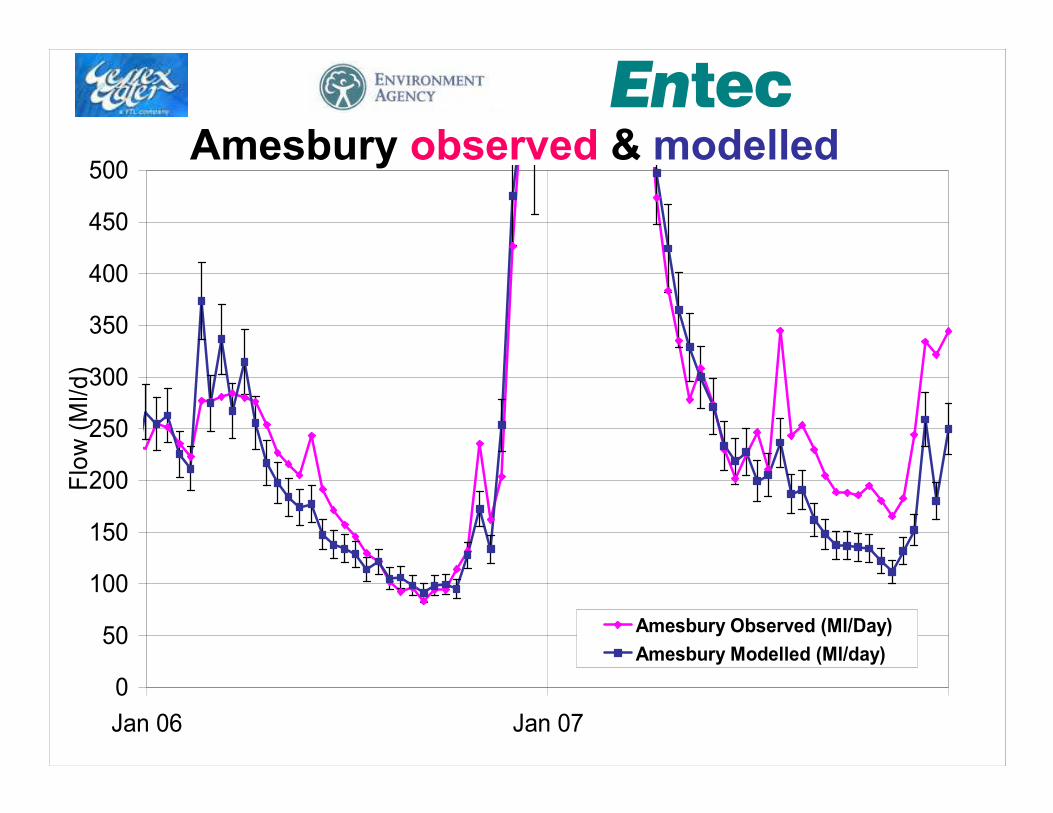
Amesbury Observed (Ml/Day)
Amesbury Modelled (Ml/day)
0
200
400
600
800
1000
1200
1400
1600
Jan 00 Jan 01 Jan 02 Jan 03 Jan 04 Jan 05 Jan 06 Jan 07
Flo
w (
Ml/d
)
Amesbury Observed (Ml/Day)
Amesbury Modelled (Ml/day)
Amesbury observed & modelled
0
50
100
150
200
250
300
350
400
450
500
Jan 06 Jan 07
Flo
w (
Ml/d
)
Amesbury Observed (Ml/Day)
Amesbury Modelled (Ml/day)
Amesbury observed & modelled

0
50
100
150
200
250
300
350
400
Jan 06 Jan 07
Flo
w (
Ml/
d)
Stockton Park Observed (Ml/Day)
Stockton Park Modelled (Ml/day)
Stockton Park observed & modelled

0
20
40
60
80
100
120
140
160
180
200
Jan 06 Jan 07
Flo
w (
Ml/
d)
Laverstock Observed (Ml/Day)
Laverstock Modelled (Ml/day)
Laverstock observed & modelled
What happened in July 2007?
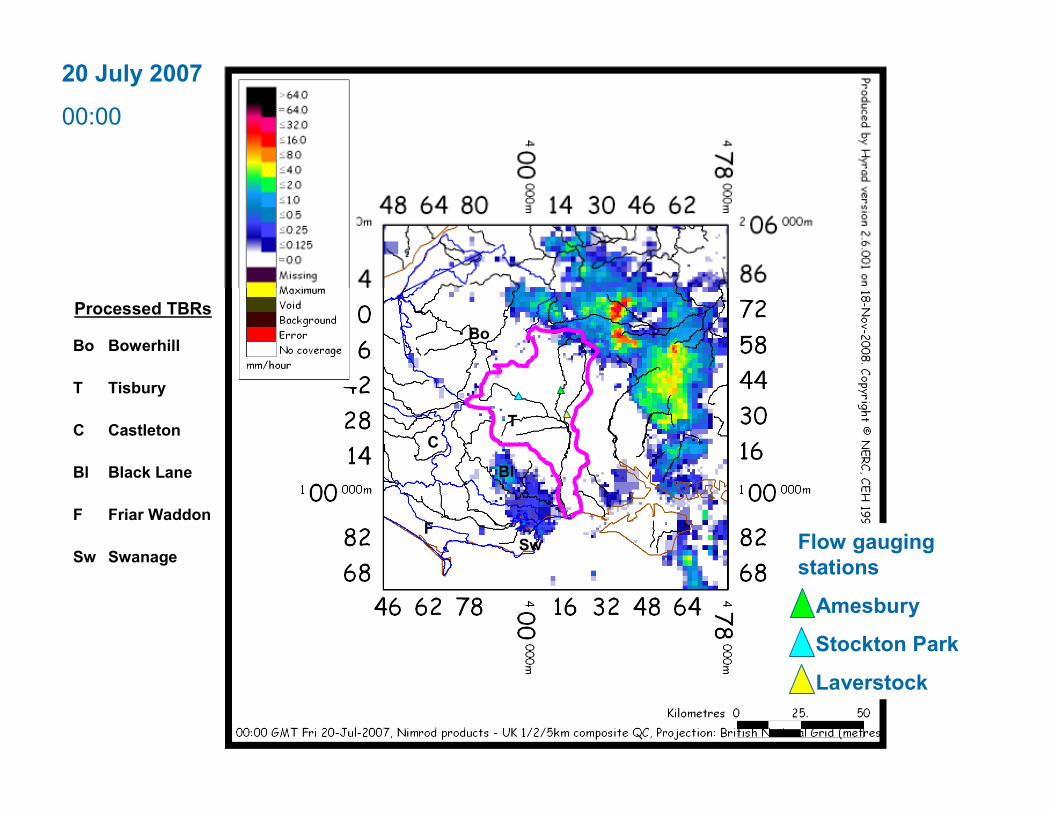
20 July 2007
00:00
Flow gauging
stations
Amesbury
Stockton Park
Laverstock
T
C
Bo
F
Bl
Sw
T
C
Bo
F
Bl
Sw
Processed TBRs
Tisbury
Castleton
Bowerhill
Friar Waddon
Black Lane
Swanage
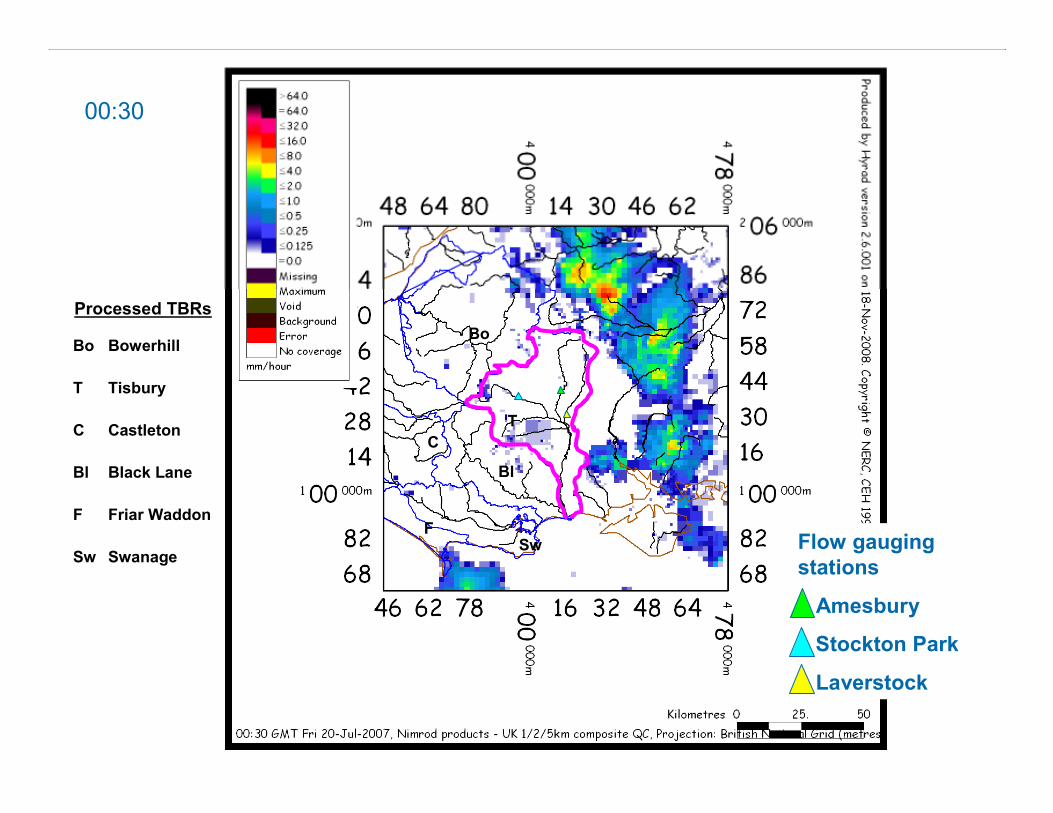
00:30
Flow gauging
stations
Amesbury
Stockton Park
Laverstock
T
C
Bo
F
Bl
Sw
T
C
Bo
F
Bl
Sw
Processed TBRs
Tisbury
Castleton
Bowerhill
Friar Waddon
Black Lane
Swanage

01:00
Flow gauging
stations
Amesbury
Stockton Park
Laverstock
T
C
Bo
F
Bl
Sw
T
C
Bo
F
Bl
Sw
Processed TBRs
Tisbury
Castleton
Bowerhill
Friar Waddon
Black Lane
Swanage

01:30
Flow gauging
stations
Amesbury
Stockton Park
Laverstock
T
C
Bo
F
Bl
Sw
T
C
Bo
F
Bl
Sw
Processed TBRs
Tisbury
Castleton
Bowerhill
Friar Waddon
Black Lane
Swanage

02:00
Flow gauging
stations
Amesbury
Stockton Park
Laverstock
T
C
Bo
F
Bl
Sw
T
C
Bo
F
Bl
Sw
Processed TBRs
Tisbury
Castleton
Bowerhill
Friar Waddon
Black Lane
Swanage

02:30
Flow gauging
stations
Amesbury
Stockton Park
Laverstock
T
C
Bo
F
Bl
Sw
T
C
Bo
F
Bl
Sw
Processed TBRs
Tisbury
Castleton
Bowerhill
Friar Waddon
Black Lane
Swanage

03:00
Flow gauging
stations
Amesbury
Stockton Park
Laverstock
T
C
Bo
F
Bl
Sw
T
C
Bo
F
Bl
Sw
Processed TBRs
Tisbury
Castleton
Bowerhill
Friar Waddon
Black Lane
Swanage
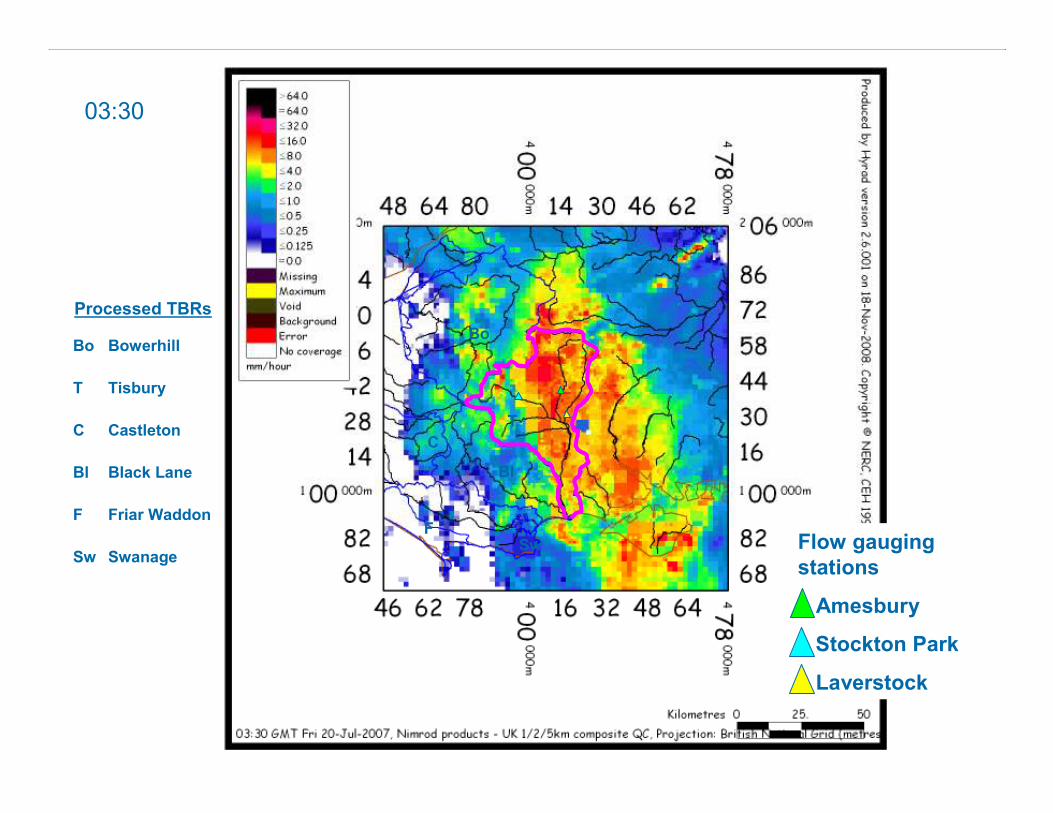
03:30
Flow gauging
stations
Amesbury
Stockton Park
Laverstock
T
C
Bo
F
Bl
Sw
T
C
Bo
F
Bl
Sw
Processed TBRs
Tisbury
Castleton
Bowerhill
Friar Waddon
Black Lane
Swanage

04:00
Flow gauging
stations
Amesbury
Stockton Park
Laverstock
T
C
Bo
F
Bl
Sw
T
C
Bo
F
Bl
Sw
Processed TBRs
Tisbury
Castleton
Bowerhill
Friar Waddon
Black Lane
Swanage

04:30
Flow gauging
stations
Amesbury
Stockton Park
Laverstock
T
C
Bo
F
Bl
Sw
T
C
Bo
F
Bl
Sw
Processed TBRs
Tisbury
Castleton
Bowerhill
Friar Waddon
Black Lane
Swanage

05:00
Flow gauging
stations
Amesbury
Stockton Park
Laverstock
T
C
Bo
F
Bl
Sw
T
C
Bo
F
Bl
Sw
Processed TBRs
Tisbury
Castleton
Bowerhill
Friar Waddon
Black Lane
Swanage

05:30
Flow gauging
stations
Amesbury
Stockton Park
Laverstock
T
C
Bo
F
Bl
Sw
T
C
Bo
F
Bl
Sw
Processed TBRs
Tisbury
Castleton
Bowerhill
Friar Waddon
Black Lane
Swanage

06:00
Flow gauging
stations
Amesbury
Stockton Park
Laverstock
T
C
Bo
F
Bl
Sw
T
C
Bo
F
Bl
Sw
Processed TBRs
Tisbury
Castleton
Bowerhill
Friar Waddon
Black Lane
Swanage
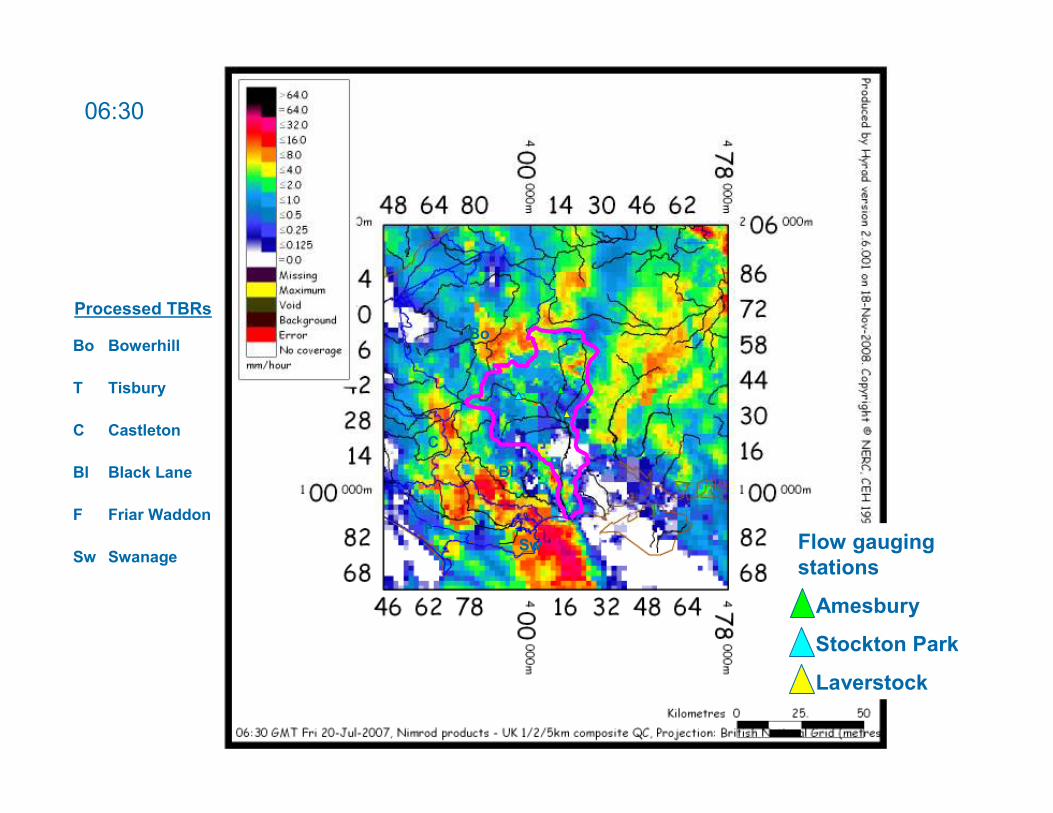
06:30
Flow gauging
stations
Amesbury
Stockton Park
Laverstock
T
C
Bo
F
Bl
Sw
T
C
Bo
F
Bl
Sw
Processed TBRs
Tisbury
Castleton
Bowerhill
Friar Waddon
Black Lane
Swanage
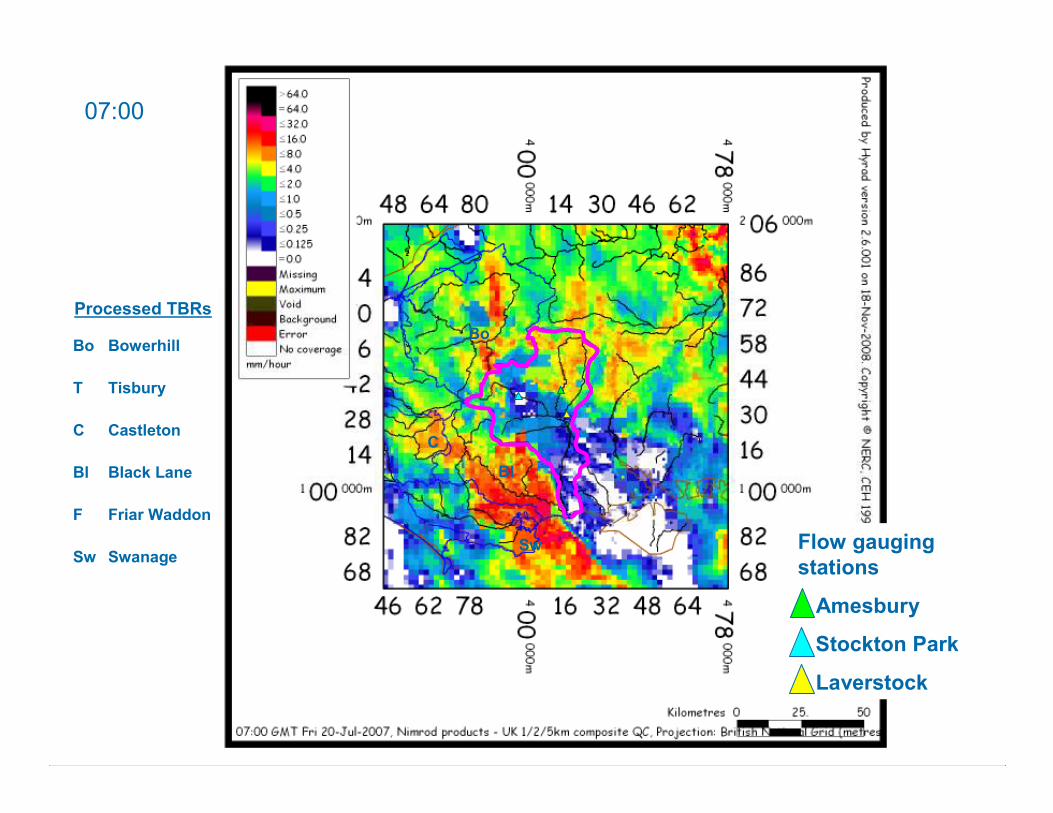
07:00
Flow gauging
stations
Amesbury
Stockton Park
Laverstock
T
C
Bo
F
Bl
Sw
T
C
Bo
F
Bl
Sw
Processed TBRs
Tisbury
Castleton
Bowerhill
Friar Waddon
Black Lane
Swanage

07:30
Flow gauging
stations
Amesbury
Stockton Park
Laverstock
T
C
Bo
F
Bl
Sw
T
C
Bo
F
Bl
Sw
Processed TBRs
Tisbury
Castleton
Bowerhill
Friar Waddon
Black Lane
Swanage

08:00
Flow gauging
stations
Amesbury
Stockton Park
Laverstock
T
C
Bo
F
Bl
Sw
T
C
Bo
F
Bl
Sw
Processed TBRs
Tisbury
Castleton
Bowerhill
Friar Waddon
Black Lane
Swanage

08:30
Flow gauging
stations
Amesbury
Stockton Park
Laverstock
T
C
Bo
F
Bl
Sw
T
C
Bo
F
Bl
Sw
Processed TBRs
Tisbury
Castleton
Bowerhill
Friar Waddon
Black Lane
Swanage

09:00
Flow gauging
stations
Amesbury
Stockton Park
Laverstock
T
C
Bo
F
Bl
Sw
T
C
Bo
F
Bl
Sw
Processed TBRs
Tisbury
Castleton
Bowerhill
Friar Waddon
Black Lane
Swanage

09:30
Flow gauging
stations
Amesbury
Stockton Park
Laverstock
T
C
Bo
F
Bl
Sw
T
C
Bo
F
Bl
Sw
Processed TBRs
Tisbury
Castleton
Bowerhill
Friar Waddon
Black Lane
Swanage

10:00
Flow gauging
stations
Amesbury
Stockton Park
Laverstock
T
C
Bo
F
Bl
Sw
T
C
Bo
F
Bl
Sw
Processed TBRs
Tisbury
Castleton
Bowerhill
Friar Waddon
Black Lane
Swanage

10:30
Flow gauging
stations
Amesbury
Stockton Park
Laverstock
T
C
Bo
F
Bl
Sw
T
C
Bo
F
Bl
Sw
Processed TBRs
Tisbury
Castleton
Bowerhill
Friar Waddon
Black Lane
Swanage

11:00
Flow gauging
stations
Amesbury
Stockton Park
Laverstock
T
C
Bo
F
Bl
Sw
T
C
Bo
F
Bl
Sw
Processed TBRs
Tisbury
Castleton
Bowerhill
Friar Waddon
Black Lane
Swanage

11:30
Flow gauging
stations
Amesbury
Stockton Park
Laverstock
T
C
Bo
F
Bl
Sw
T
C
Bo
F
Bl
Sw
Processed TBRs
Tisbury
Castleton
Bowerhill
Friar Waddon
Black Lane
Swanage

12:00
Flow gauging
stations
Amesbury
Stockton Park
Laverstock
T
C
Bo
F
Bl
Sw
T
C
Bo
F
Bl
Sw
Processed TBRs
Tisbury
Castleton
Bowerhill
Friar Waddon
Black Lane
Swanage

12:30
Flow gauging
stations
Amesbury
Stockton Park
Laverstock
T
C
Bo
F
Bl
Sw
T
C
Bo
F
Bl
Sw
Processed TBRs
Tisbury
Castleton
Bowerhill
Friar Waddon
Black Lane
Swanage

13:00
Flow gauging
stations
Amesbury
Stockton Park
Laverstock
T
C
Bo
F
Bl
Sw
T
C
Bo
F
Bl
Sw
Processed TBRs
Tisbury
Castleton
Bowerhill
Friar Waddon
Black Lane
Swanage

13:30
Flow gauging
stations
Amesbury
Stockton Park
Laverstock
T
C
Bo
F
Bl
Sw
T
C
Bo
F
Bl
Sw
Processed TBRs
Tisbury
Castleton
Bowerhill
Friar Waddon
Black Lane
Swanage

14:00
Flow gauging
stations
Amesbury
Stockton Park
Laverstock
T
C
Bo
F
Bl
Sw
T
C
Bo
F
Bl
Sw
Processed TBRs
Tisbury
Castleton
Bowerhill
Friar Waddon
Black Lane
Swanage
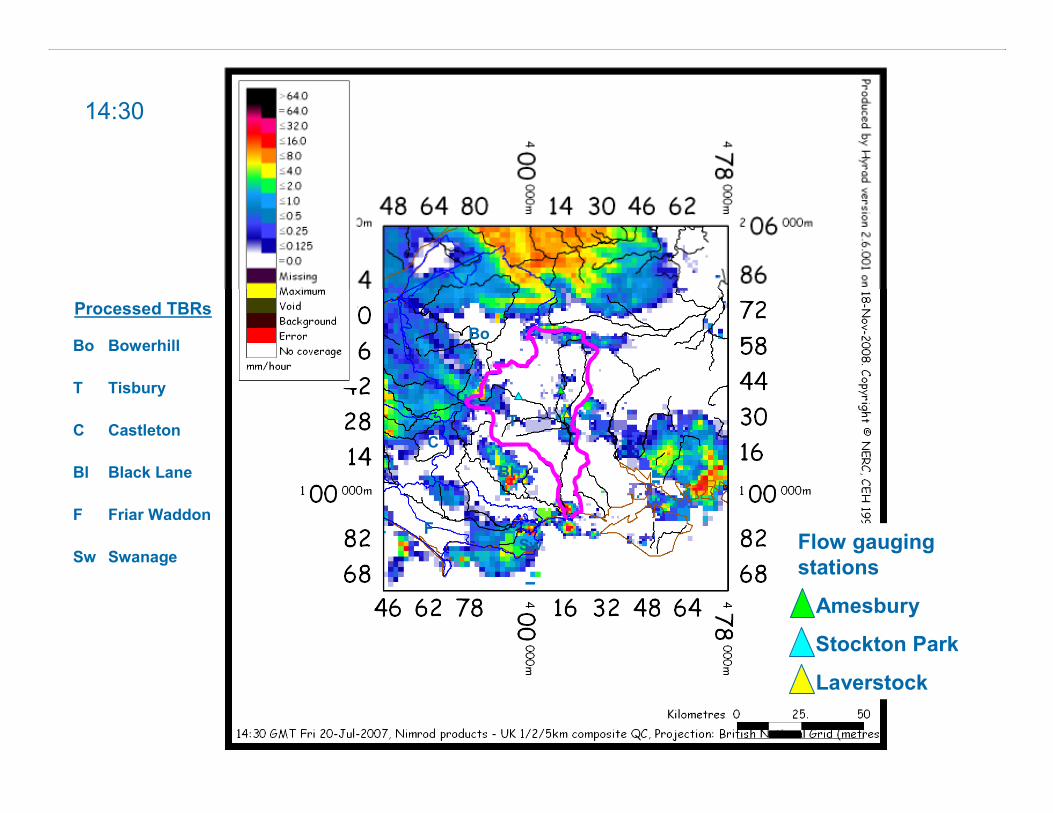
14:30
Flow gauging
stations
Amesbury
Stockton Park
Laverstock
T
C
Bo
F
Bl
Sw
T
C
Bo
F
Bl
Sw
Processed TBRs
Tisbury
Castleton
Bowerhill
Friar Waddon
Black Lane
Swanage

15:00
Flow gauging
stations
Amesbury
Stockton Park
Laverstock
T
C
Bo
F
Bl
Sw
T
C
Bo
F
Bl
Sw
Processed TBRs
Tisbury
Castleton
Bowerhill
Friar Waddon
Black Lane
Swanage

15:30
Flow gauging
stations
Amesbury
Stockton Park
Laverstock
T
C
Bo
F
Bl
Sw
T
C
Bo
F
Bl
Sw
Processed TBRs
Tisbury
Castleton
Bowerhill
Friar Waddon
Black Lane
Swanage

May – July
200% of LTA
2007 floods were extreme:
Rainfall 19-20 July
Top of catchment ~30mm
(compared to >125mm at
Teweskbury!)
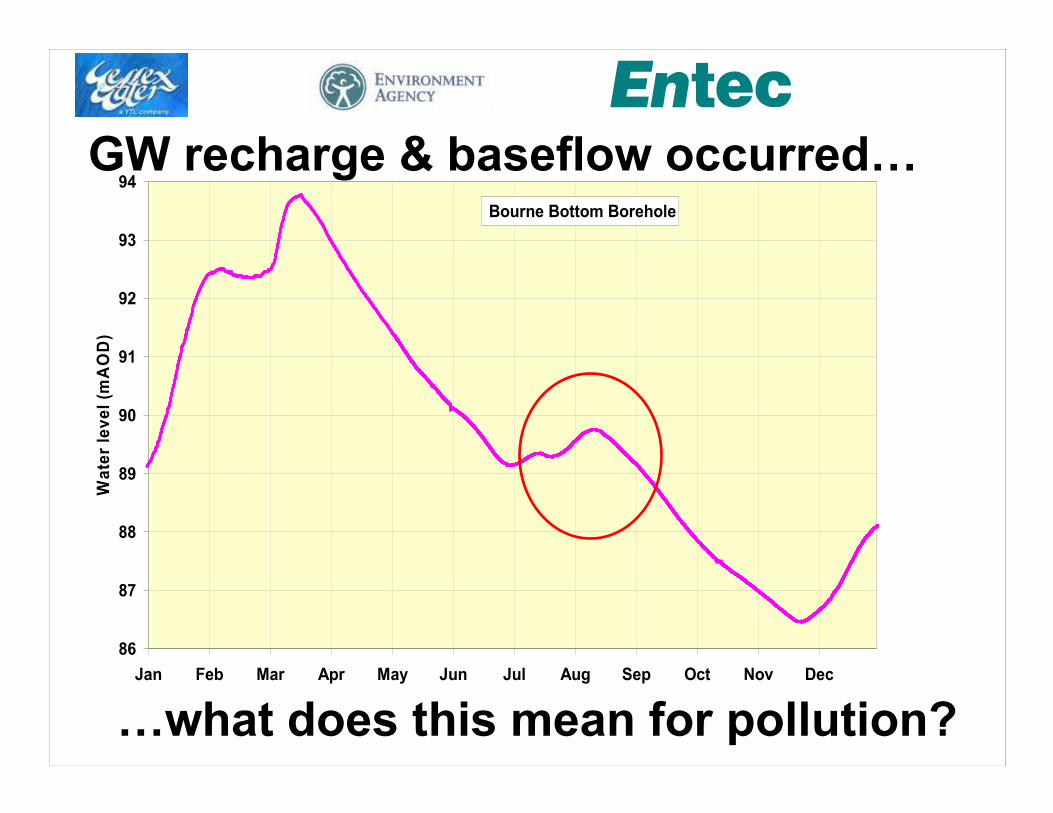
Bourne Bottom Borehole
86
87
88
89
90
91
92
93
94
Jan Feb Mar Apr May Jun Jul Aug Sep Oct Nov Dec
Wa
ter
lev
el
(mA
OD
)
GW recharge & baseflow occurred…
…what does this mean for pollution?

0
2
4
6
8
10
12
1990 1995 2000 2005 2010
Nit
rate
Co
nc
en
tra
tio
n (
mg
/l N
)
40
60
80
100
120
140
160
Wa
ter
Le
ve
l a
t W
oo
dy
ate
s O
BH
(m
AO
D)
Drinking Water Standard
Site Measured Nitrate
Woodyates OBH Water Level
NO3
at
PWS
Water
Level
at
OBH
Short term nitrate spikes at PWS sources are
evidence for smd bypass and rapid fracture
unsaturated flow recharge to groundwater.

Infiltration
recharge
drives slow
movement of
historically
leached NO3
Slow plug flow
through the
Chalk matrix
Rapid flow
through Chalk
fissures
Rapid fracture
recharge
sends through
spikes of this
month's (?)
leaching
Short term nitrate spikes at PWS sources are
evidence for smd bypass and rapid fracture
unsaturated flow recharge to groundwater.
What about Phosphate?

Even on the ‘baseflow
dominated’ chalk,
worked fields, tracks
etc generate turbid
runoff during intense
storms
…probably the way
most diffuse P and fine
sediment gets into the
rivers (i.e. NOT via
‘groundwater’)?

Topography
Modelling maps and data (250 m grid, 1970 – 2009 daily rainfall-runoff,
total river flow for 3 time steps/month)

4R Model: Routing
Modelling maps and data (250 m grid, 1970 – 2009 daily rainfall-runoff,
total river flow for 3 time steps/month)

Soils
Modelling maps and data (250 m grid, 1970 – 2009 daily rainfall-runoff,
total river flow for 3 time steps/month)

Soils (simplified)
Modelling maps and data (250 m grid, 1970 – 2009 daily rainfall-runoff,
total river flow for 3 time steps/month)

Landuse (500m)
Modelling maps and data (250 m grid, 1970 – 2009 daily rainfall-runoff,
total river flow for 3 time steps/month)
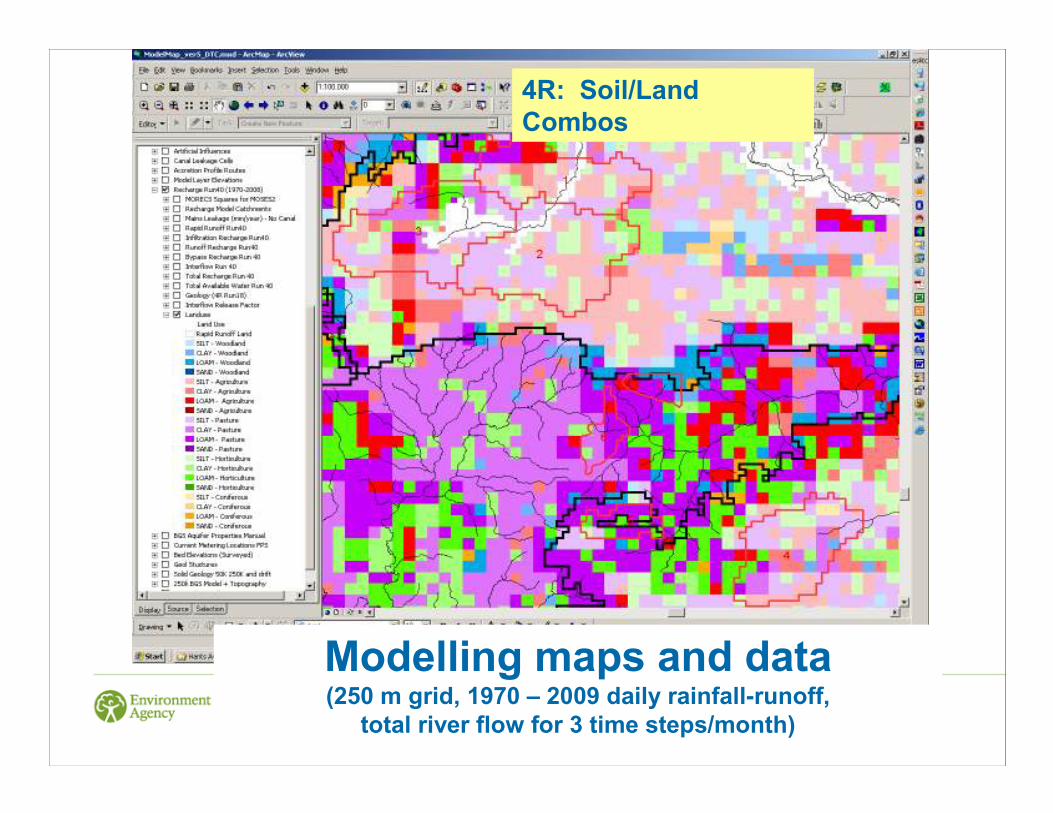
4R: Soil/Land
Combos
Modelling maps and data (250 m grid, 1970 – 2009 daily rainfall-runoff,
total river flow for 3 time steps/month)

Infiltration Recharge (LTA Annual
Average mm/a)
Modelling maps and data (250 m grid, 1970 – 2009 daily rainfall-runoff,
total river flow for 3 time steps/month)

Bypass Recharge (LTA Annual Average
mm/a)
Modelling maps and data (250 m grid, 1970 – 2009 daily rainfall-runoff,
total river flow for 3 time steps/month)
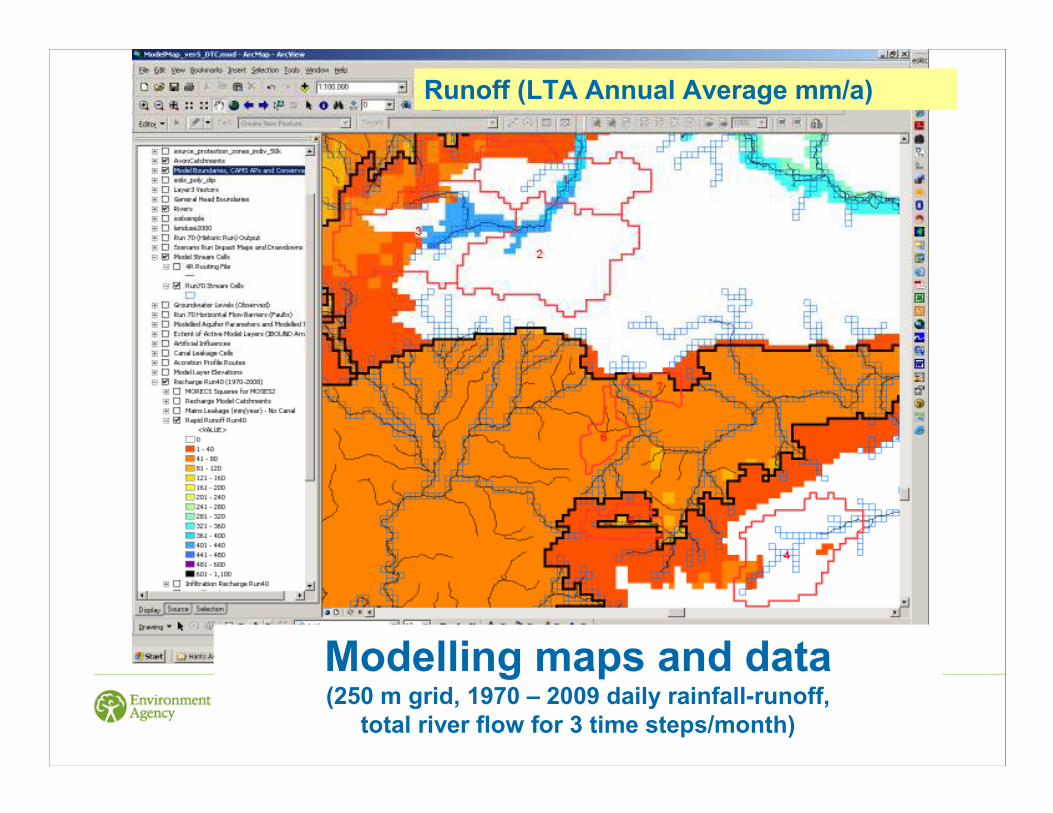
Runoff (LTA Annual Average mm/a)
Modelling maps and data (250 m grid, 1970 – 2009 daily rainfall-runoff,
total river flow for 3 time steps/month)

Interflow (LTA Annual Average mm/a)
Modelling maps and data (250 m grid, 1970 – 2009 daily rainfall-runoff,
total river flow for 3 time steps/month)

Runoff Recharge (LTA Annual Average
mm/a)
Modelling maps and data (250 m grid, 1970 – 2009 daily rainfall-runoff,
total river flow for 3 time steps/month)

Total Available Water (LTA Annual
Average mm/a)
Modelling maps and data (250 m grid, 1970 – 2009 daily rainfall-runoff,
total river flow for 3 time steps/month)

Modelling maps and data (250 m grid, 1970 – 2009 daily rainfall-runoff,
total river flow for 3 time steps/month)
GW Model Build Information

Modelling maps and data (250 m grid, 1970 – 2009 daily rainfall-runoff,
total river flow for 3 time steps/month)
GW Model transmissivity – how easy is
flow through the ground?

Modelled GW levels
Modelling maps and data (250 m grid, 1970 – 2009 daily rainfall-runoff,
total river flow for 3 time steps/month)
Wet winter
Modelling maps and data (250 m grid, 1970 – 2009 daily rainfall-runoff,
total river flow for 3 time steps/month)
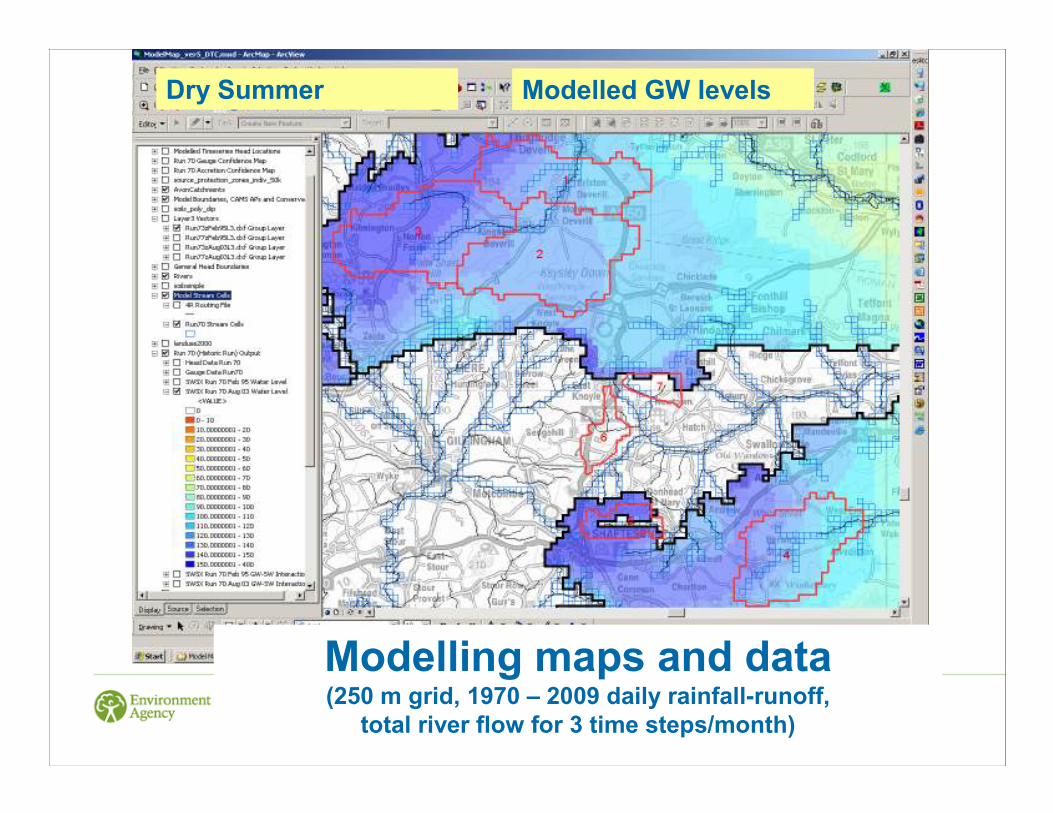
Modelled GW levelsDry Summer

Modelling maps and data (250 m grid, 1970 – 2009 daily rainfall-runoff,
total river flow for 3 time steps/month)
Modelled flows from
GW into the rivers
Wet winter

Modelling maps and data (250 m grid, 1970 – 2009 daily rainfall-runoff,
total river flow for 3 time steps/month)
Modelled flows from
GW into the rivers
Dry Summer

Abstractions & Source Protection Zones
Modelling maps and data (250 m grid, 1970 – 2009 daily rainfall-runoff,
total river flow for 3 time steps/month)

Unsaturated Zone Travel Times - Low GW Levels
(assuming slow plug flow)
Modelling maps and data (250 m grid, 1970 – 2009 daily rainfall-runoff,
total river flow for 3 time steps/month)

Modelling maps and data (250 m grid, 1970 – 2009 daily rainfall-runoff,
total river flow for 3 time steps/month)
Unsaturated Zone Travel Times - High GW Levels
(assuming slow plug flow)

Contributing GW catchment Areas – fraction
of the recharge which ends up in the river
Modelling maps and data (250 m grid, 1970 – 2009 daily rainfall-runoff,
total river flow for 3 time steps/month)
Modelling maps and data (250 m grid, 1970 – 2009 daily rainfall-runoff,
total river flow for 3 time steps/month)
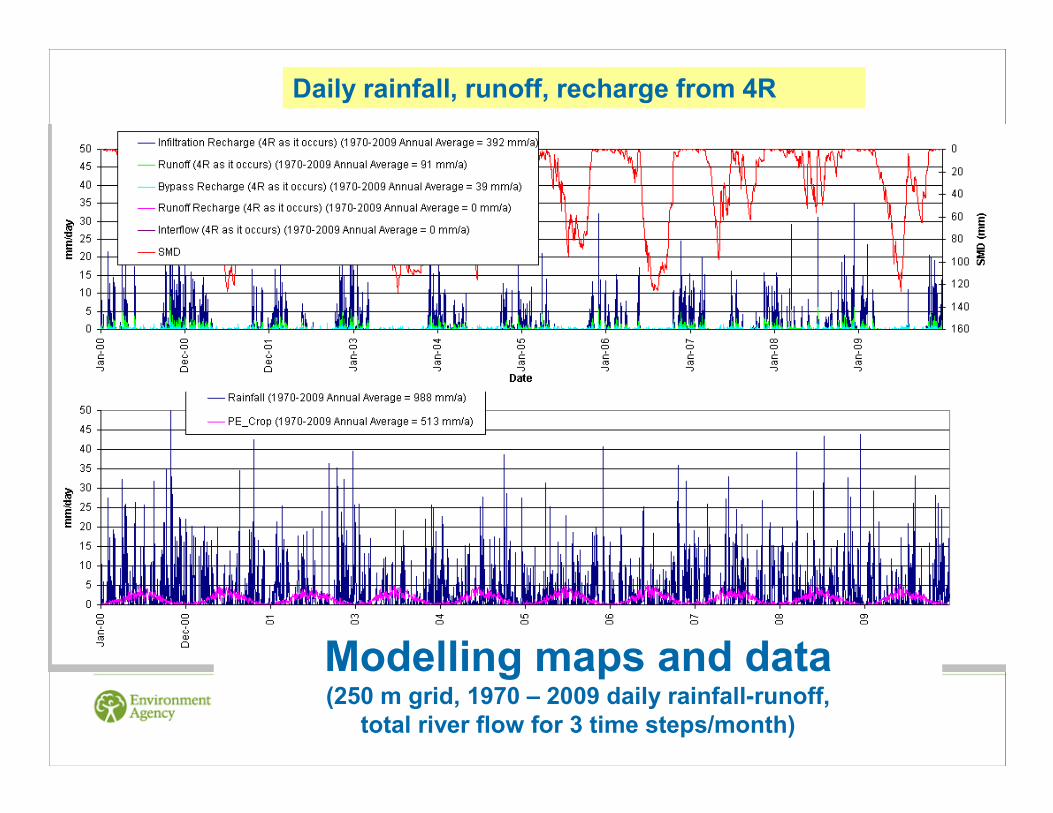
Daily rainfall, runoff, recharge from 4R
Modelling maps and data (250 m grid, 1970 – 2009 daily rainfall-runoff,
total river flow for 3 time steps/month)
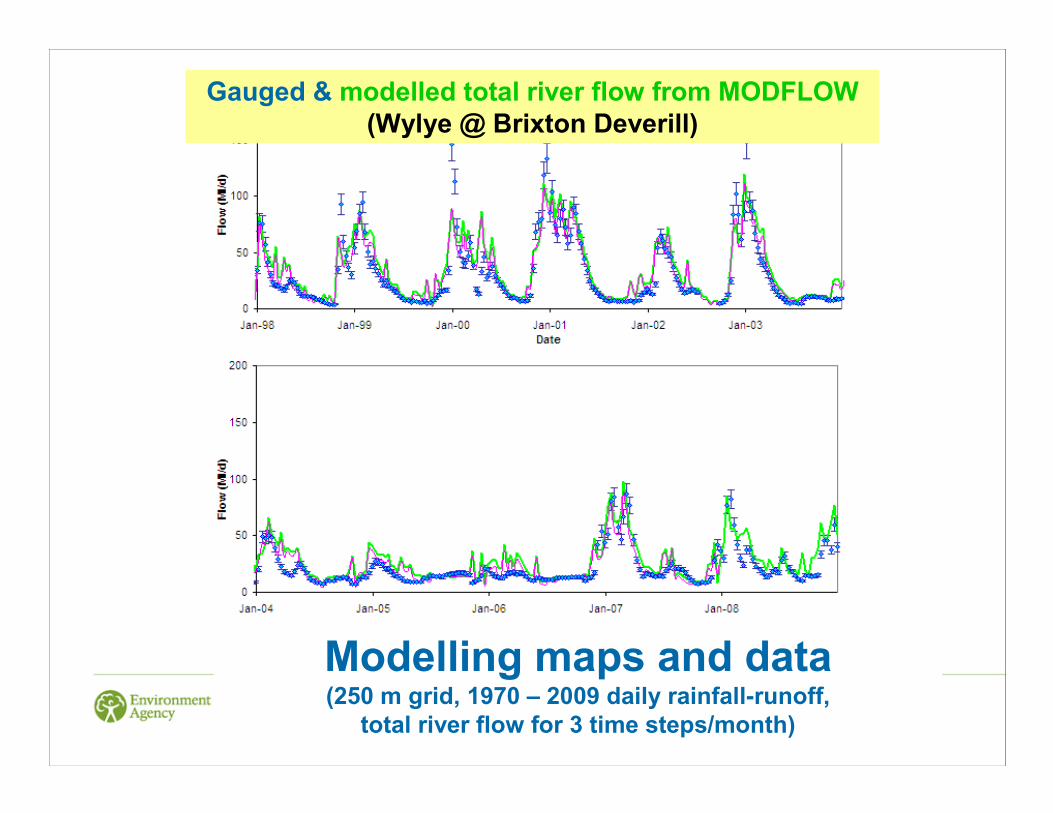
Gauged & modelled total river flow from MODFLOW
(Wylye @ Brixton Deverill)

Modelling maps and data (250 m grid, 1970 – 2009 daily rainfall-runoff,
total river flow for 3 time steps/month)
Gauged & modelled total river flow from MODFLOW
(Nadder @ Wilton)

Modelling maps and data (250 m grid, 1970 – 2009 daily rainfall-runoff,
total river flow for 3 time steps/month)
Gauged & modelled total river flow from MODFLOW
(Ebble @ Nunton Bridge)

Presentation & proposed report outline
Understanding
The big picture context
Demo catchment detail
Storm rainfall and flood responses
Modelling & data availability
With comments on possible diffuse pollution pathways
Report out by end of March!