Undergraduate Research Report William K. Bittner ... · Undergraduate Research Report Spring 2012...
20
Undergraduate Research Report • Spring 2012 • William K. Bittner Undergraduate Research Report for Spring 2012 William K. Bittner * Florida Institute of Technology, Melbourne, FL [email protected] Abstract This paper is in regards to the various research produced for Spring 2012 Undergraduate Research under Dr. Hohlmann, and in collaboration with Dr. Mitra, and the High Energy Physics Group A. The research this semester has covered a wide area. First focusing on getting results using POCLUST and CLUSTVIZ on real data that contained depleted Uranium and Lead. After that, the research principally focused on the future of Vx4D, POCLUST, CLUSTVIZ, and all the work done with Dr. Hohlmann and Dr. Mitra during my undergraduate career. * Dr. Hohlmann, Dr. Mitra 1
Transcript of Undergraduate Research Report William K. Bittner ... · Undergraduate Research Report Spring 2012...

Undergraduate Research Report • Spring 2012 • William K. Bittner
Undergraduate Research Report forSpring 2012
William K. Bittner∗Florida Institute of Technology, Melbourne, FL
Abstract
This paper is in regards to the various research produced for Spring 2012 Undergraduate Research underDr. Hohlmann, and in collaboration with Dr. Mitra, and the High Energy Physics Group A. The researchthis semester has covered a wide area. First focusing on getting results using POCLUST and CLUSTVIZon real data that contained depleted Uranium and Lead. After that, the research principally focused onthe future of Vx4D, POCLUST, CLUSTVIZ, and all the work done with Dr. Hohlmann and Dr. Mitraduring my undergraduate career.
∗Dr. Hohlmann, Dr. Mitra
1
Undergraduate Research Report • Spring 2012 • William K. Bittner
.Contents
1 Introduction 31.1 Before FAS 2012 Annual Conference . . . . . . . . . . . . . . . . . . . . . . . . . . . . 31.2 After the FAS 2012 Annual Conference . . . . . . . . . . . . . . . . . . . . . . . . . . 3
2 POCLUST 52.1 POCLUST Overview . . . . . . . . . . . . . . . . . . . . . . . . . . . . . . . . . . . . . 52.2 Key Parameters in POCLUST . . . . . . . . . . . . . . . . . . . . . . . . . . . . . . . . 52.3 Building POCLUST and using POCLUST . . . . . . . . . . . . . . . . . . . . . . . . . 5
3 CLUSTVIZ 63.1 CLUSTVIZ Overview . . . . . . . . . . . . . . . . . . . . . . . . . . . . . . . . . . . . . 63.2 Building CLUSTVIZ . . . . . . . . . . . . . . . . . . . . . . . . . . . . . . . . . . . . . 63.3 Using CLUSTVIZ . . . . . . . . . . . . . . . . . . . . . . . . . . . . . . . . . . . . . . . 7
4 FAS 2012 Results 84.1 The dataset setup . . . . . . . . . . . . . . . . . . . . . . . . . . . . . . . . . . . . . . . 84.2 The raw data . . . . . . . . . . . . . . . . . . . . . . . . . . . . . . . . . . . . . . . . . . 104.3 POCLUST Parameters settings . . . . . . . . . . . . . . . . . . . . . . . . . . . . . . . 104.4 CLUSTVIZ output . . . . . . . . . . . . . . . . . . . . . . . . . . . . . . . . . . . . . . 10
5 POCLUST Rewrite 125.1 The Goals . . . . . . . . . . . . . . . . . . . . . . . . . . . . . . . . . . . . . . . . . . . 125.2 The structure . . . . . . . . . . . . . . . . . . . . . . . . . . . . . . . . . . . . . . . . . 135.3 Abstracting Clustering Algorithms . . . . . . . . . . . . . . . . . . . . . . . . . . . . . 13
6 Parrallel and Distributed Clustering using Hadoop 14
7 The inclusion of Vx4D into ROOT 197.1 The use of TVxND . . . . . . . . . . . . . . . . . . . . . . . . . . . . . . . . . . . . . . 19
A Appendix A - Source Code Locations 20A.1 CLUSTVIZ,POCLUST,GenericClust,Vx4D . . . . . . . . . . . . . . . . . . . . . . . . . 20A.2 ROOT with TVx4D and future additions . . . . . . . . . . . . . . . . . . . . . . . . . 20
B Appendix B - Source Code Manuals 20
C GenericClust - the POCLUST rewrite 20
D POCLUST and CLUSTVIZ source documentation 20
2

Undergraduate Research Report • Spring 2012 • William K. Bittner
I. Introduction
The semester can essentially be split into two main parts:
1.1 Before FAS 2012 Annual Conference
This period of time was spent extending and concluding the research performed in the Fall of2011, primarily focused on producing results from the world on POCLUST and CLUSTVIZ inorder to present them at the FAS 2012 Annual conference. The target scenario was the "5 on a die"scenario, which featured 5 blocks of material including depleted Uranium in the middle. The goalwas the be able to isolate the Uranium from the surrounding materials, using POCLUST, and toshow that Muon Tomography and POCLUST is a viable solution for detecting Shielded NuclearWeapons in Cargo
POCLUST POCLUST is a density based clustering algorithm, that was created by Dr. Mitra,originally based on the clustering of GEANT4 simulation data of the Muon Tomographystation. It was created to be able to classify POCA points into "clusters" and with thoseclusters, calculate properties to be able to identify the material of the cluster. This is centralfor the detection of uranium inside lead shielding
CLUSTVIZ I created CLUSTVIZ in the Fall of 2011 to be able to visualize the output of POCLUSTin comparison to the original target positions, using OpenGL and Linux, and to be able tocalculate a metric for comparing results
1.2 After the FAS 2012 Annual Conference
After the FAS 2012 Annual Conference, efforts were mainly focused on bringing together all theresearch that I have done for Dr. Hohlmann over my Undergraduate Career and get it ready to bepassed on to the future of the High Energy Physcis Group A. Furthermore, I wanted to continuemy research while working at IBM, so directions were chosen that would align with both theGroup’s interest, and what would be possible, and most optimal while persuing my career at IBM.This period of research can be broken down into the following parts:
POCLUST rewrite The POCLUST code base originally obtained in the Fall of 2011 was longneeded of a rewrite. Furthermore, with the consideration of future students continuing theresearch, I wanted the essential parts of the Algorithm to be easily abstracted, so that futurestudents can do research on the Algorithm, without being concerned about the entirity ofthe working internals. This would allow students a low learning curve to get started withPOCLUST, and therefore increase the probability of it being continued.
Parallel and Distributed Clustering using Hadoop Hadoop is growing in huge popularity inthe sector of Big Data and Data Analytics, and runs seamlessly on a cloud infrastructure, allthree of which belong to IBM’s top 5 initiatives. Furthermore, if any complex methods of theoptimization of POCLUST parameters were going to be used, much more computationalpower would be needed. Therefore, by bringing POCLUST to a parallel and distributedarchitecture through Apache Hadoop, this would align both the Group’s interest, and thatof my professional career. Therefore, much research was done in this area
The inclusion of Vx4D into ROOT ROOT is an object oriented data analysis framework builtby CERN. All of the research students are familiar with ROOT, and it is used extensively
3

Undergraduate Research Report • Spring 2012 • William K. Bittner
within the High Energy Physics Lab A. Vx4D is a stand alone software package I build forthe High Energy Physics Group A initially. It is customized exactly to our needs, and had tobe created because of the lack of 4D Voxelized Data visualization software available. ROOTwas currently being used for doing 2D imaging on the data with "slices". In order to removethe necessity to maintain the framework of Vx4D, research was done to integrate Vx4D intoROOT. Therefore, future Undergraduate students can simply use ROOT’s scripting ability tocall Vx4D just like they would any other histogram.
4

Undergraduate Research Report • Spring 2012 • William K. Bittner
II. POCLUST
2.1 POCLUST Overview
• POCA Points are read in, unvoxelized
• Simple thresholds applied to remove major noise
• Clustering of the POCA points begin
• Deletion or removal of âAIJsporadicâAI clusters occurs on intervals
• Merging of Clusters that meet criteria
• When all the points have been processed, output is visualized in OpenGL and compared tooriginal targets in wireframes
2.2 Key Parameters in POCLUST
MAX_POINTS_IN_CLUSTER This is the number of points at which, greater than this, the clusterno longer uses a euclidean measure, and uses a measure based euclidean distance multipliedby a factor of Theta2/ClusterVariance a.k.a DM Measure
MAX_L2_NORM_DIST This is the maximum distance a point can be from a cluster when usingthe euclidean measure
MAX_DM_NORM_DIST This is the maximum distance a point can be from a cluster whenusing the DM measure
angleThresh If the Percent < 4 and the number of points is greater than 50, then the cluster is"thrown" away, where Percent =The percent of POCA points within that cluster that has anaverage deflection angle of < the parameter angleThresh
MinPercent two clusters are said to be similar if abs(Percent of Cluster1 − Percent of Cluster2) < MinPercent and also for MinVariance
MinVariance two clusters are said to be similar if abs(Percent of Cluster1 − Percent of Cluster2) < MinVariance and also for MinPercent
CENTROID_DISTANCE two clusters are said to be isClose() if the euclidean distance betweenthe two centroids is < CENTROID_DISTANCE
OVERLAP_PERCENTAGE two clusters are said to overlap() if (overlapVolume/(volumeCluster1+volumeCluster2)) > OVERLAP_PERCENTAGE
2.3 Building POCLUST and using POCLUST
To build POCLUST, it is quite easy. If you are in the /poclust/algo/ directory, make sure you:
1. unvoxelized poca file is copied to the file input.txt
2. edit input.txt, and make sure the first line the in dimensions of the volume i.e. "300 300 300"
3. type in ./build.sh
4. the cluster_vis_output.m is the file that CLUSTVIZ will take as a POCLUST output
5

Undergraduate Research Report • Spring 2012 • William K. Bittner
III. CLUSTVIZ
3.1 CLUSTVIZ Overview
CLUSTVIZ was built in order to visualize the POCLUST output, and be able to compare it to theoriginal target locations. It does this by take two files as parameters, one file being the originaltarget location, and one being the output from the POCLUST cluster_vis_output.m. The whitecubes inside of the volume represent the original targets, and the opaque objects represent theclustered objects. The color represents the mean scattering angle of that cluster / 15
Figure 1: CLUSTVIZ example output, white boxes are the original target locations, and the opaque objectsare the clusters from POCLUST
3.2 Building CLUSTVIZ
CLUSTVIZ, requires the same packages as Vx4D to be built. It also uses a make.sh file. Thefollowing packages are required:
• directfb (libdirectfb-dev)
6
Undergraduate Research Report • Spring 2012 • William K. Bittner
• stdc++ (libstdc++6-4.4-dev or apt-cache search libstdc++ for current version)
• libglu1-mesa-dev
• libglib2.0-dev
• libgl1-mesa-dev
• libx11-dev
• freeglut-dev (glutg3-dev) After those development libraries are installed, go to the/verb!/poclust/visual/! directory and type:./make.shAfter that, go to the bin directory, and you will see a file named:pvisThat is the executable
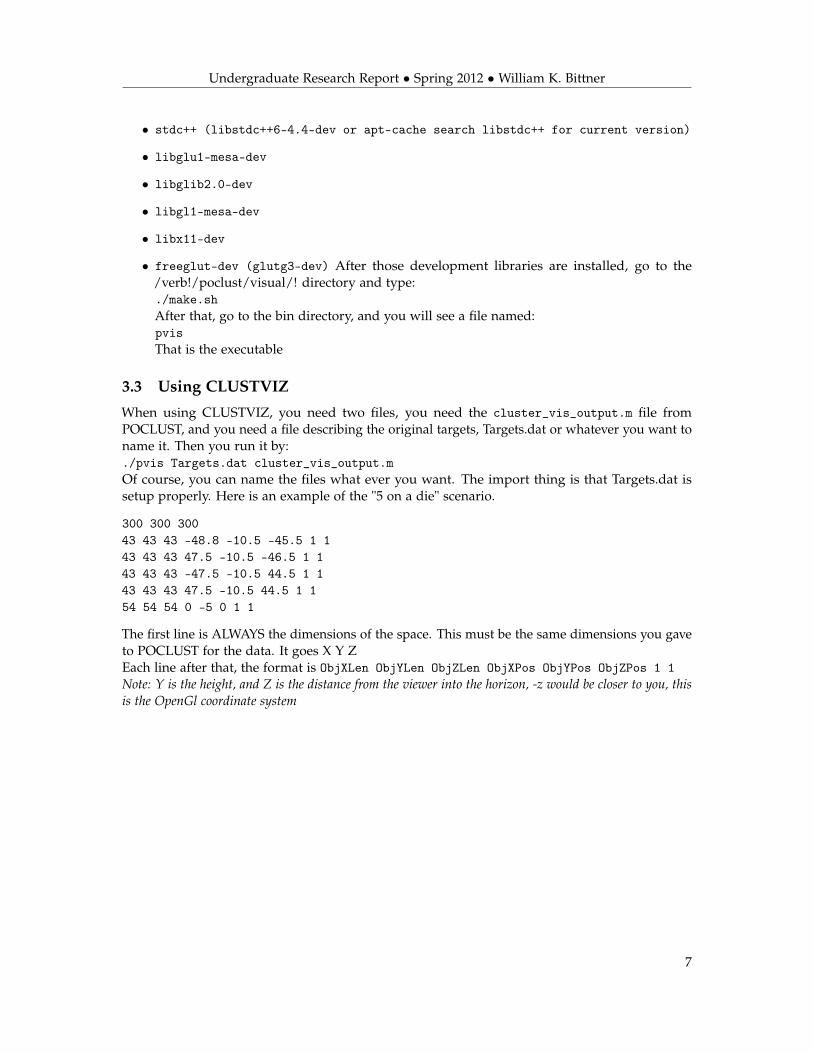
3.3 Using CLUSTVIZ
When using CLUSTVIZ, you need two files, you need the cluster_vis_output.m file fromPOCLUST, and you need a file describing the original targets, Targets.dat or whatever you want toname it. Then you run it by:./pvis Targets.dat cluster_vis_output.mOf course, you can name the files what ever you want. The import thing is that Targets.dat issetup properly. Here is an example of the "5 on a die" scenario.
300 300 30043 43 43 -48.8 -10.5 -45.5 1 143 43 43 47.5 -10.5 -46.5 1 143 43 43 -47.5 -10.5 44.5 1 143 43 43 47.5 -10.5 44.5 1 154 54 54 0 -5 0 1 1
The first line is ALWAYS the dimensions of the space. This must be the same dimensions you gaveto POCLUST for the data. It goes X Y ZEach line after that, the format is ObjXLen ObjYLen ObjZLen ObjXPos ObjYPos ObjZPos 1 1Note: Y is the height, and Z is the distance from the viewer into the horizon, -z would be closer to you, thisis the OpenGl coordinate system
7
Undergraduate Research Report • Spring 2012 • William K. Bittner
IV. FAS 2012 Results
This section covers the results presented at the FAS 2012 Annual meeting, in which the latestPOCLUST results were presented on the "5 on a die" real data, focusing on being able to distinguishbetween the Lead and the Depleted Uranium.
4.1 The dataset setup
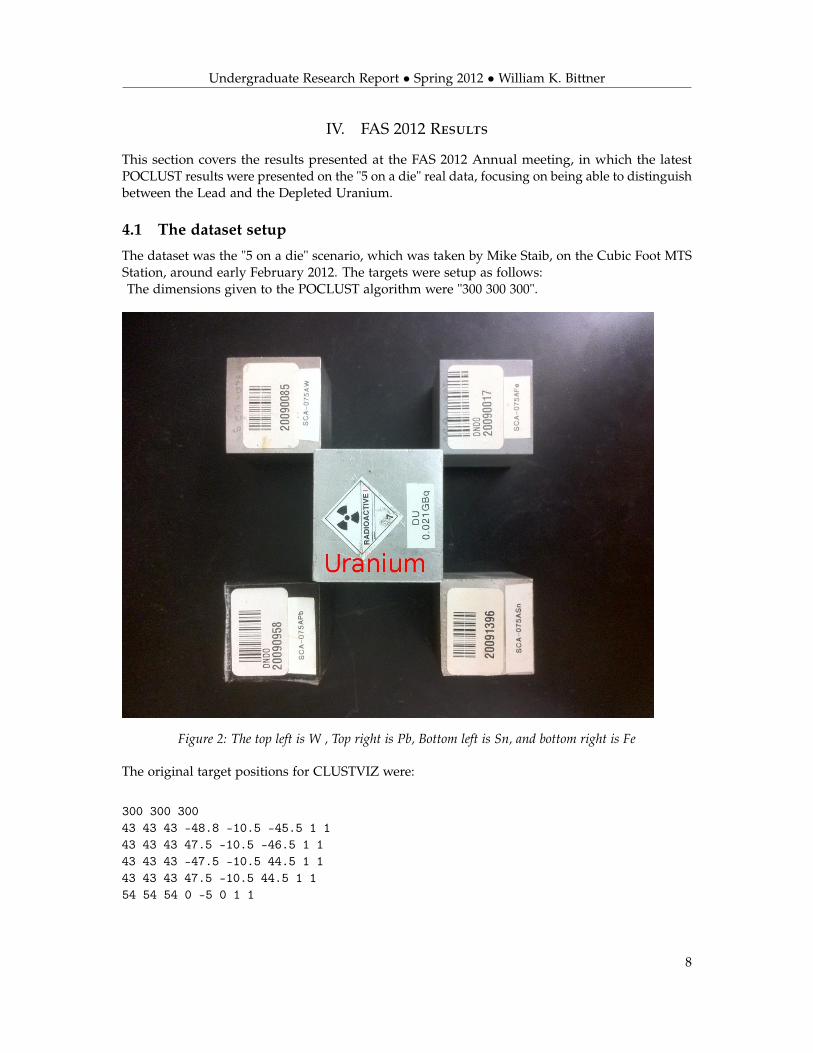
The dataset was the "5 on a die" scenario, which was taken by Mike Staib, on the Cubic Foot MTSStation, around early February 2012. The targets were setup as follows:The dimensions given to the POCLUST algorithm were "300 300 300".
Figure 2: The top left is W , Top right is Pb, Bottom left is Sn, and bottom right is Fe
The original target positions for CLUSTVIZ were:
300 300 30043 43 43 -48.8 -10.5 -45.5 1 143 43 43 47.5 -10.5 -46.5 1 143 43 43 -47.5 -10.5 44.5 1 143 43 43 47.5 -10.5 44.5 1 154 54 54 0 -5 0 1 1
8
Undergraduate Research Report • Spring 2012 • William K. Bittner
Figure 3: Vx4d output of "5 on a die" without any cuts applied
Figure 4: Vx4d output of "5 on a die" with manual cuts applied
9
Undergraduate Research Report • Spring 2012 • William K. Bittner
Table 1: common.h
#define DOCA_cut 1#define angThresh 4#define MAX_L2_NORM_DISTANCE 100#define MAX_DM_DISTANCE 1000#define MAX_CLUSTERS 20000 //max no of clusters inside a voxel..#define MinPointsInCluster 100 //this means that there should be 200 points inside a cluster, and after that only Baeysian infrence will be derived...#define MAX_OBJECTS 20000#define P0 3#define DENSITY_THRESH 1#define TIME_STAMP 10000#define OVERLAP_PERCENT 10#define CENTROID_DISTANCE 250#define MIN_VARIANCE 1#define MIN_PERCENT 3#define Ldeg 0.5#define Udeg 15#define MIN_ANG_CUT_ALL_TRACKS 1
Table 2: pocaStats.c parameters
#define Lcut 2#define Ucut 15#define DOCA_CUT 1
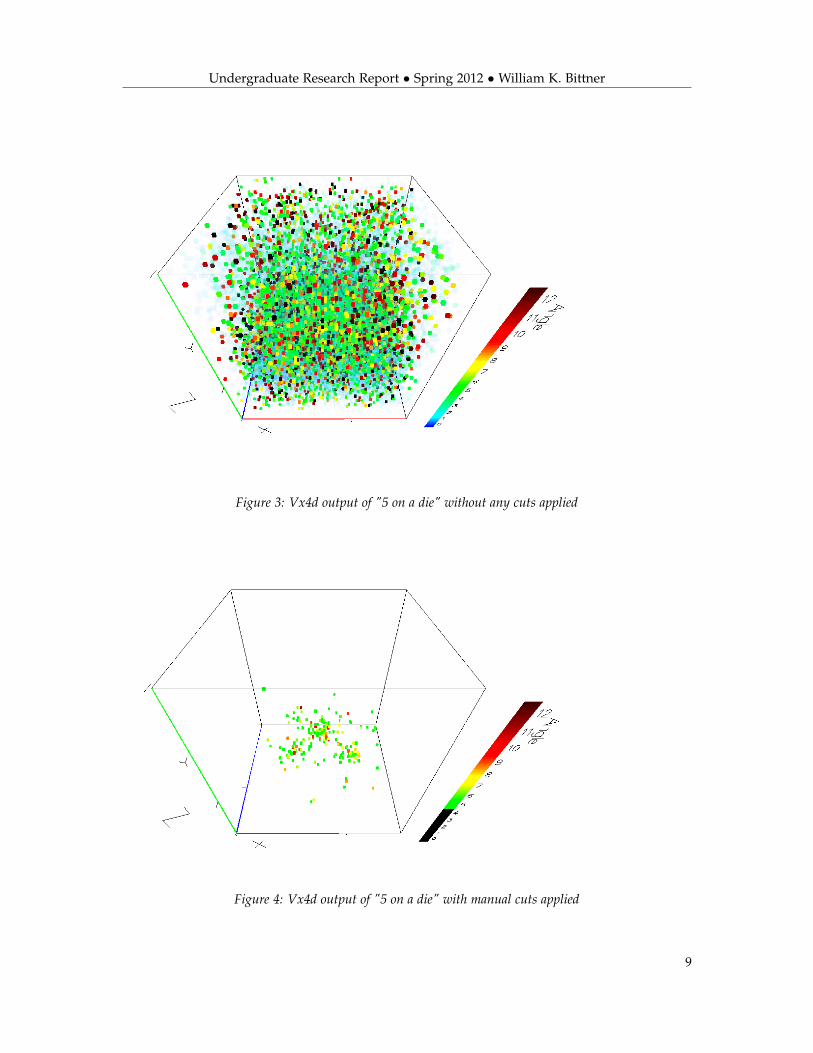
4.2 The raw data
Figure 3 is what the raw data from POCA output looks like, without any cuts applied:After manual cuts were applied, in Figure 4, you can somewhat see the resemblance of the objects,but nothing that would be adequate for distinguishing Uranium from the Lead Shielding.
4.3 POCLUST Parameters settings
There are many parameters in POCLUST, but here are the main ones, and their current values,at the time these results were produced: Also, the final merging from "GeantPackage.cpp" wasremoved, along with other things:
4.4 CLUSTVIZ output
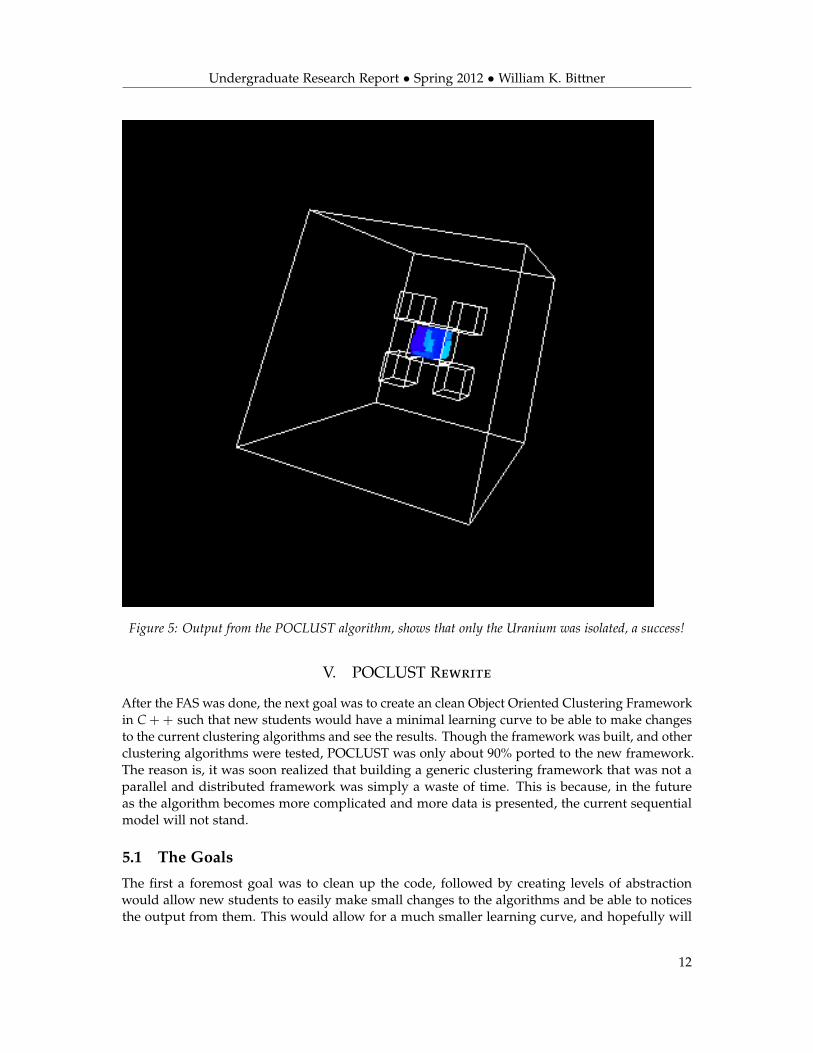
After tinkering around with the parameters and removing the final merging, which from theresults seemed to be buggy, I was able to achieve the following output:
10

Undergraduate Research Report • Spring 2012 • William K. Bittner
Table 3: GeantPackage.cpp diff
35 @@ -133,7 +133,7 @@ void Input_Geant_Data(char filename[]){36 //for testing purpose NOW which basically finds non-sporadic clusters..37 Find_objects_from_all_clusters(space.root,&Finclust,num);3839 -40 + //:NOTE: Removed the cluster merging and got a lot better result41 //Merge the clusters with eachother..42 //ClusterMerging(&Finclust);44 @@ -270,13 +270,18 @@ void Output_to_File(data *ptr){45 clusterDetail out;46 double percent,factor,pr,lambda;47 FILE *fout=fopen("output.txt","w");48 - FILE *matlab=fopen("5trgAir.m","w");49 -50 + FILE *matlab=fopen("cluster_vis_output.m","w");51 +52 + if (matlab == 0)53 + {54 + fprintf(stderr, "Could not open file for output");55 + exit(1);56 + }57 factor=(10*(M_PI)*(M_PI)*10000)/(18*18);5859 - fprintf(matlab,"function I=truck()\n");60 - fprintf(matlab,"rppd([400,300,300],[0,0,0],[0,0,0],[1,0,0],0);\n");61 -62 + //fprintf(matlab,"function I=truck()\n");63 + //fprintf(matlab,"rppd([400,300,300],[0,0,0],[0,0,0],[1,0,0],0);\n");64 + fprintf(matlab,"%d %d %d \n",lenght,width,height);65 for(int i=0;i< ptr->len;i++){6667 c=ptr->object[i];68 @@ -304,9 +309,14 @@ void Output_to_File(data *ptr){69 fprintf(fout,"\t\tEstimated density at last: %lf \n",lambda);7071 //Printing the matlab code.72 - if(out.dX!=0 && out.dY!=0 && out.dZ!=0 && out.varTheta<15)73 - fprintf(matlab,"rppd([%lf,%lf,%lf],[%lf,%lf,%lf],[%lf,0,%lf],[0,0,0],1);\n",(2*out.dX)/10,(2*out.dY)/10,(2*out.dZ)/10,(out.centroid.x)/10,(out.centroid.y)/10,(out.centroid.z)/10,out.varTheta/15,1-out.varTheta/15);74 -75 + if(out.dX!=0 && out.dY!=0 && out.dZ!=0)76 + //‘&& out.varTheta<50)77 + // fprintf(matlab,"rppd([%lf,%lf,%lf],[%lf,%lf,%lf],[%lf,0,%lf],[0,0,0],1);\n",(2*out.dX)/10,(2*out.dY)/10,(2*out.dZ)/10,(out.centroid.x)/10,(out.centroid.y)/10,(ou t.centroid.z)/10,out.varTheta/15,1-out.varTheta/15);78 + fprintf(matlab,"%lf %lf %lf %lf %lf %lf %lf 1\n",(2*out.dX)/10,(2*out.dY)/10,(2*out.dZ)/10,79 + (out.centroid.x)/10,(out.centroid.y)/10,(out.centroid.z)/10,80 +out.avgTheta/10);81 +//out.varTheta/50);82 +83 }
11
Undergraduate Research Report • Spring 2012 • William K. Bittner
Figure 5: Output from the POCLUST algorithm, shows that only the Uranium was isolated, a success!
V. POCLUST Rewrite
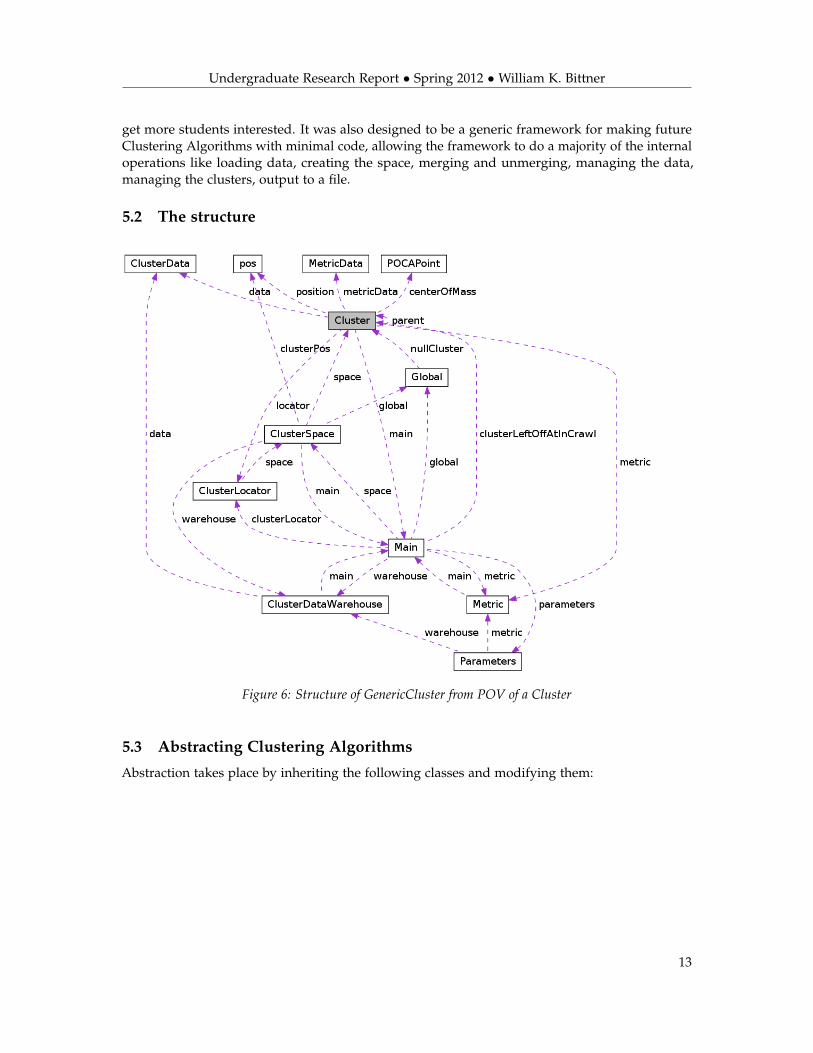
After the FAS was done, the next goal was to create an clean Object Oriented Clustering Frameworkin C ++ such that new students would have a minimal learning curve to be able to make changesto the current clustering algorithms and see the results. Though the framework was built, and otherclustering algorithms were tested, POCLUST was only about 90% ported to the new framework.The reason is, it was soon realized that building a generic clustering framework that was not aparallel and distributed framework was simply a waste of time. This is because, in the futureas the algorithm becomes more complicated and more data is presented, the current sequentialmodel will not stand.
5.1 The Goals
The first a foremost goal was to clean up the code, followed by creating levels of abstractionwould allow new students to easily make small changes to the algorithms and be able to noticesthe output from them. This would allow for a much smaller learning curve, and hopefully will
12
Undergraduate Research Report • Spring 2012 • William K. Bittner
get more students interested. It was also designed to be a generic framework for making futureClustering Algorithms with minimal code, allowing the framework to do a majority of the internaloperations like loading data, creating the space, merging and unmerging, managing the data,managing the clusters, output to a file.
5.2 The structure
Figure 6: Structure of GenericCluster from POV of a Cluster
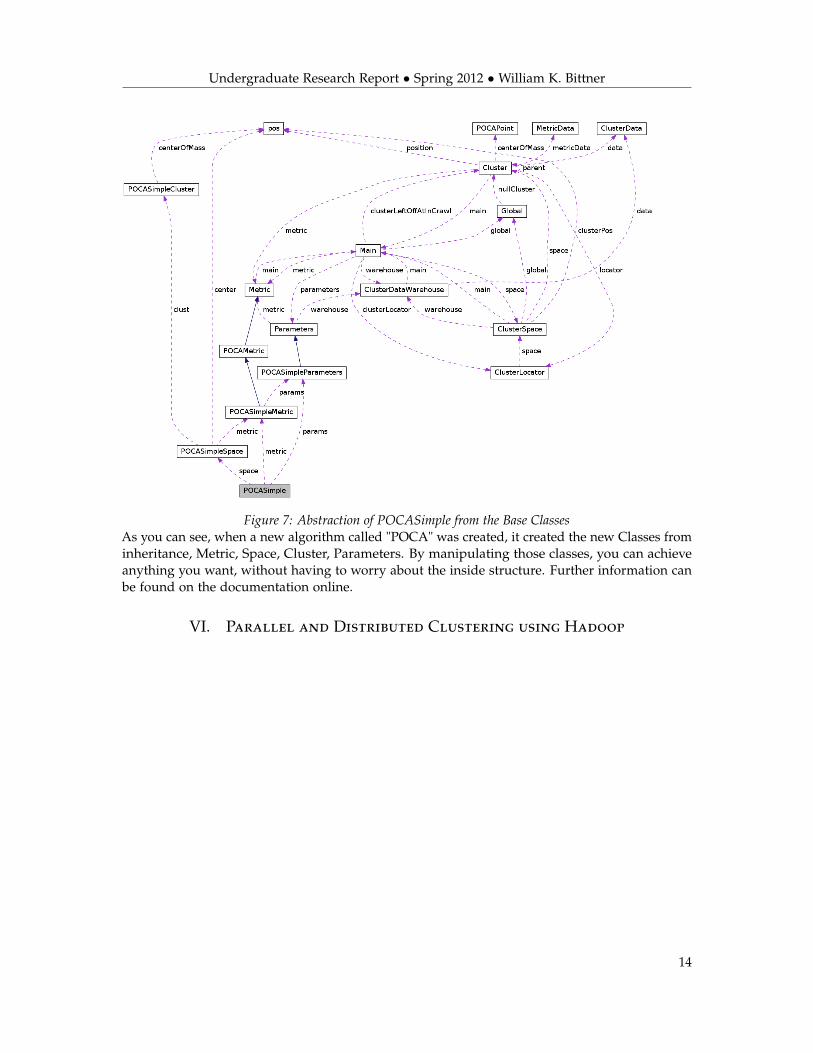
5.3 Abstracting Clustering Algorithms
Abstraction takes place by inheriting the following classes and modifying them:
13
Undergraduate Research Report • Spring 2012 • William K. Bittner
Figure 7: Abstraction of POCASimple from the Base ClassesAs you can see, when a new algorithm called "POCA" was created, it created the new Classes frominheritance, Metric, Space, Cluster, Parameters. By manipulating those classes, you can achieveanything you want, without having to worry about the inside structure. Further information canbe found on the documentation online.
VI. Parallel and Distributed Clustering using Hadoop
14
Abstract—Apache Hadoop is an open source frame work, thatis intended to do parallel and distributed computing over largecompute nodes or even in cloud environments such as AmazonEC2. Apache Mahout is the framework built on top of Hadoopthat is composed of Machine Learning Algorithms for analysinglarge data sets. Of the tool kits available through Mahout, thereexits a wide arrange of Clustering algorithms. Initial results ofthe ”out of the box” clustering algorithms on real POCA dataacquired from our cubic foot Muon Tomography station here atFlorida Tech is presented, and to establish a baseline. Mahout’sclustering algorithms allows the user to specify a ”Measure” foreach ”Job” that runs, hence the ease to modify the Metric usedfor calculating distance between points and clusters. Since muonColuomb scattering has an inherent Probability DistributionFunction (PDF) that can be modelled many ways. Therefore theincorporation of the PDF into the Measure in order to create aspace in which the Clustering Algorithms will run that is basedmore on the importance of the variables, will create a much betterresult. This has been seen is POCLUST, where the Euclideanmeasure was adjusted by the variance of the point with respect tothe cluster, if the cluster is sufficiently large. Taking the concept,and laying out the background information and method on how tocreate a new measure for a Hadoop clustering algorithm based ona user trainable Probability Distribution Function and abstractit to N dimensional space was the point of this paper.
I. INTRODUCTION
The following data set being used in the current analysis ofdevelopments on the DistanceMeasure in Hadoop Clusteringalgorithms, comes from our Muon Tomography Station in theHigh Energy Physics Lab A. It is a scenario containing 5blocks of metal. Four of them are arranged on the cornersof a square in the same plane, and the 5th is centred in themiddle. The middle is depleted Uranium, and the surroundingmetals range from Iron to Lead. The purpose of this scenariois to test our abilities to reconstruct the data and be able todistinguish the Lead from the other materials, without anyprevious knowledge of the placements.Current research on the clustering of the POCA points hasbeen done with POCLUST, which is a serialized on-lineimplementation of a density based clustering algorithm forPOCA points similar. The algorithm has a tough time runningas a single thread on a single machine as the dataset increases.If fast enough computation times, along with machine learningmethods for parameter optimization is going to be used, wemust move to a more power platform. We have access toa 30+ Node Tier 3 Computing Center that is run by theHigh Energy Physics Lab A, so implementing a parallel anddistributed algorithm that can take advantage of every nodewould be to our advantage, and that was the prime motivationfor the investigation into parallel clustering algorithms sucha PDBSCAN, and those recently published that are based onMap/Reduce.
[1]
Fig. 1. voidmap(Stringname, Stringdocument)
beginforeach word w e of document do
EmitIntermediate(w, ”1”)end
end
A. Hadoop Map Reduce Paradigm
Fig. 2. void reduce(String word, Iterator partialCounts)Data: word: a word and partialData: Counts: a list of aggregated partial countsintsum = 0foreach pc e of partialCounts do
sum+ = ParseInt(pc)
Emit(word,AsString(sum))
[2]
B. Map/Reduce Cluster Algorithms
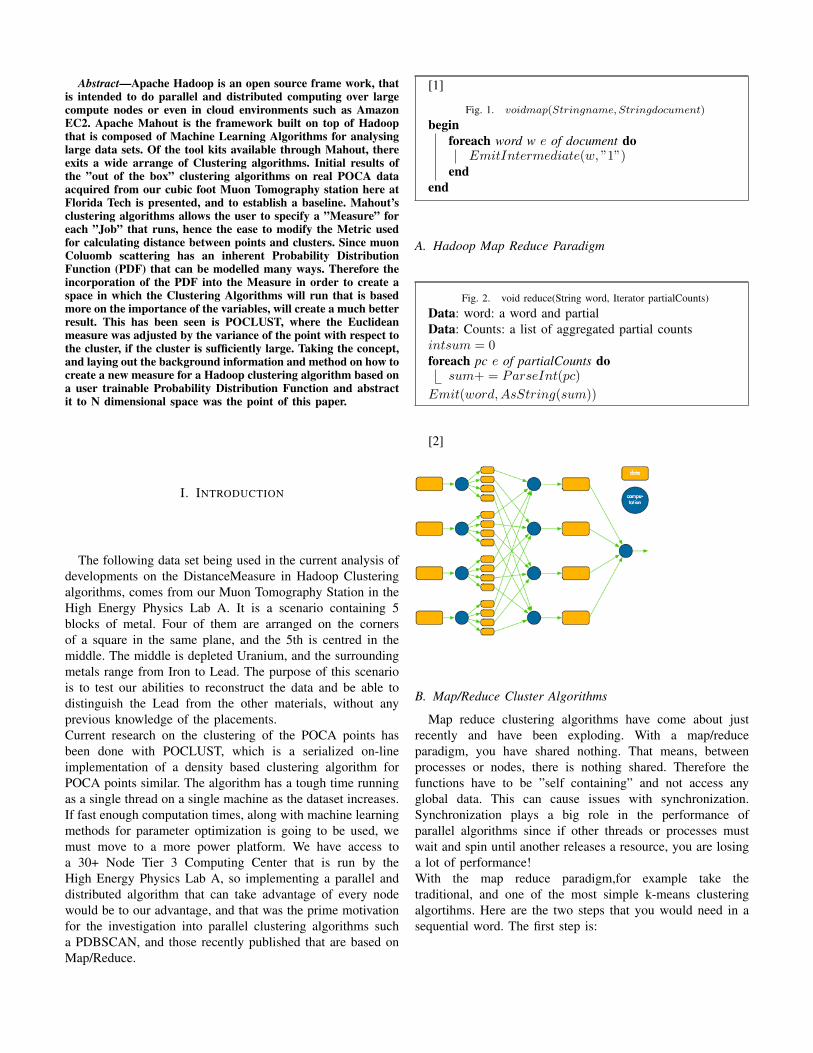
Map reduce clustering algorithms have come about justrecently and have been exploding. With a map/reduceparadigm, you have shared nothing. That means, betweenprocesses or nodes, there is nothing shared. Therefore thefunctions have to be ”self containing” and not access anyglobal data. This can cause issues with synchronization.Synchronization plays a big role in the performance ofparallel algorithms since if other threads or processes mustwait and spin until another releases a resource, you are losinga lot of performance!With the map reduce paradigm,for example take thetraditional, and one of the most simple k-means clusteringalgortihms. Here are the two steps that you would need in asequential word. The first step is:
Assignment Step
[h]S(t)i =
{xp :
∥∥xp −m(t)i
∥∥ ≤∥∥xp −m
(t)j
∥∥ ∀ 1 ≤ j ≤ k}
(1)Essentially, the assignment step, each set S, contains points
that joined S because out of all the other possible sets S, thisone was the closest. As you can see, it is one dimensional,and uses a traditional euclidean measure. This could be themap stage, where each element coming in, will get mapped
to an intermediate output.
Update Step
m(t+1)i =
1
|S(t)i |
∑
xj∈S(t)i
xj (2)
This step, essentially all you are doing is updating the meanvalue of the cluster with the addition of the new points. Thereason that you would want to have this as your reduce step,
is because Apache Hadoop, in the intermediate stepsbetween map and reduce, sort your outputs, so that reduce
gets all of the same outputs. In this situation, all of the sameS, or cluster.
Though the k-means clustering may seem easy, actuallyimplementing it is not. Coordinating the communication andsynchronization between the parallel processes, and handlingsituations when clusters have to split among nodes, overlap,
etc, it can become difficult. That is where Hadoop andmahout come in. Here is a diagram of a map/reduce k-mean
clustering algorithm.
C. Mahout’s Clustering Framework
Mahout is a algorithmic framework built on top of Hadoop.Essentially, Hadoop takes care of managing nodes, and file
systems, and connections between them. It manages who haswhat jobs and when, where to transfer data and when, andorchestrates an entire parallel computer for you. The ”hello
world” for map/reduce is counting the frequencies of a wordin a set of words such as a document. The mapper maps theportion of the document into 2 dimensional subset, the word,and the number of instances in that mapper, using the word
as the ”key”. The Intermediate step sorts all the outputs fromall the ”nodes” or computers, by the word, and separates thedata such that all the same words are given to a reducer. Thereducer then adds up the number of the same words it was
passed, and puts it into a ”counter” that each processingnode is allowed to have. The counters are all dumped to one
file by each Reducer node, in order, and all the counts aretherefore summed up for you.
So you created a parallel sorting algorithm for a sparsedataset, with about 4 lines of code added to the Hadoop
base. The nature of the Map/Reduce paradigm just makesthose sort of things really easy and fast, and some simple
things really hard. So it is important to pick the mostappropriate challenges by the Mahout team.
One of which, is classification, or the clustering of Ndimensional unstructured or structured data. For clustering in
Mahout, there are these major components:
D. The Abstract Vector Classifier
Mahout’s clustering classifier on the lowest level isabstracted from AbstractVectorClassifier. This is an abstract
class such that provides functions to take N-Dimensionalvectors of data, and return their probabilities to be associatedwith each of the K groups, with the probabilities summing to1. With the classifiers you either have to train them first, in
which they build their own Probability Distribution Function.How this is down depends on the specific classifier.
E. The OnlineLearner
An OnlineLearner is a abstract class that supports two mainfunctions, training and closing. For training, it accepts data,and updates its probability model based on the data it just
accepted. It requires both the instance values and the actualvalues, so it can ”learn” and compare to how well it is
doing. This way it can learn the best model. Once the modeland the parameters of the model have been satisfied by
sufficient training, the user ”Closes” the OnlineLearner, andcan now store the model, and use it for classification.
F. The Cluster Classifier
This class inherits mainly from the AbstractVectorClassifier ,and the OnlineLearner, and contains a ClusteringPolicy. TheCluster Classifier is given and ClusteringPolicy, which wasconstructed either by hand, or by training on previous data
sets with a learner. It then uses this ClusteringPolicy to feedthe VectorClassifier, to classify incoming data into the
Clusters defined by the Clustering policy. With the adaptationof the OnlineLearner, it can activate and create multiple
OnlineLearners, and not only classify data coming in, butcan also adjust it’s current clustering policy by closing atrained on-line learner, and feed it to the ClusterPolicy,
which then adapts to the OnlineLearner’s changes to theProbability Distribution Function and the model.
G. The Abstract Cluster
This is where the actual clustering goes on. A key thingabout Hadoop, is that all these objects must be writeable and
readable, similar to serializable, because they will betransmitted constantly over a transport that can’t just do
direct memory access. It stores and sends strings, or compactforms of the objects.
So the key parts of the abstract Cluster is first of all, here isthe data that is shared globally amount clusters:
• CLUSTERED POINTS DIR - Path of Points alreadyclustered
• CLUSTERS DIR - Path of All living clusters• FINAL ITERATION SUFFIX - File suffix of finish clus-
ters• INITIAL CLUSTERS DIR - Path of Initial Clusters
Since most clusters are based off a central point, and avolume definition around them, Mahout supports the
methods of:
• getCenter - gets the ”center” of the cluster• getRadius - gets the ”radius” of the cluster• isConverged - returns if the converged (optional)
H. Model
The model is a small class with two purposes, to observe anevent and retain it, and to construct a PDF (Probability
Distribution Function) from that data it observers.
• double pdf(x) - returns the probability that the observationx based on its model
• observe(event) - retains information of this event, andobserves it
• computeParameters() - computes a new set of posteriorparameters based on the observations, recreates the PDF
I. Our focus:iterator DistanceMeasureCluster
This class is the grand daddy of all the ClusteringAlgorithms in the Examples. All the Clustering algorithms
inherit this class. This class has three major traits:
1) A Model - to observe and generate the PDFs2) ParameteredGeneralizations - contains the prefix of file,
the Hadoop JobConf, cluster Parameters3) pdf function - pass a vector, get back the probability of
that vector based on its model4) identifier - method of identifying the cluster5) Data I/O readFields, write6) get/set DistanceMeasure - This is the function we will
be modifying
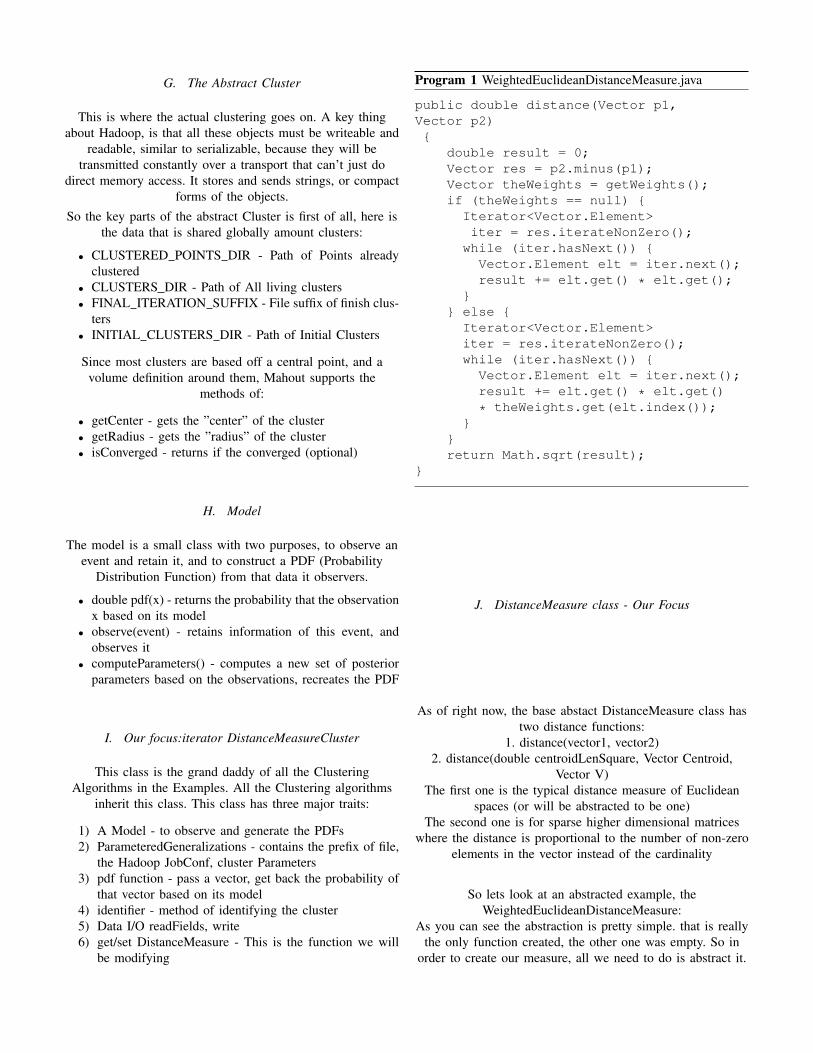
Program 1 WeightedEuclideanDistanceMeasure.java
public double distance(Vector p1,Vector p2){
double result = 0;Vector res = p2.minus(p1);Vector theWeights = getWeights();if (theWeights == null) {
Iterator<Vector.Element>iter = res.iterateNonZero();while (iter.hasNext()) {Vector.Element elt = iter.next();result += elt.get() * elt.get();
}} else {Iterator<Vector.Element>iter = res.iterateNonZero();while (iter.hasNext()) {Vector.Element elt = iter.next();result += elt.get() * elt.get()
* theWeights.get(elt.index());}
}return Math.sqrt(result);
}
J. DistanceMeasure class - Our Focus
As of right now, the base abstact DistanceMeasure class hastwo distance functions:
1. distance(vector1, vector2)2. distance(double centroidLenSquare, Vector Centroid,
Vector V)The first one is the typical distance measure of Euclidean
spaces (or will be abstracted to be one)The second one is for sparse higher dimensional matrices
where the distance is proportional to the number of non-zeroelements in the vector instead of the cardinality
So lets look at an abstracted example, theWeightedEuclideanDistanceMeasure:
As you can see the abstraction is pretty simple. that is reallythe only function created, the other one was empty. So in
order to create our measure, all we need to do is abstract it.
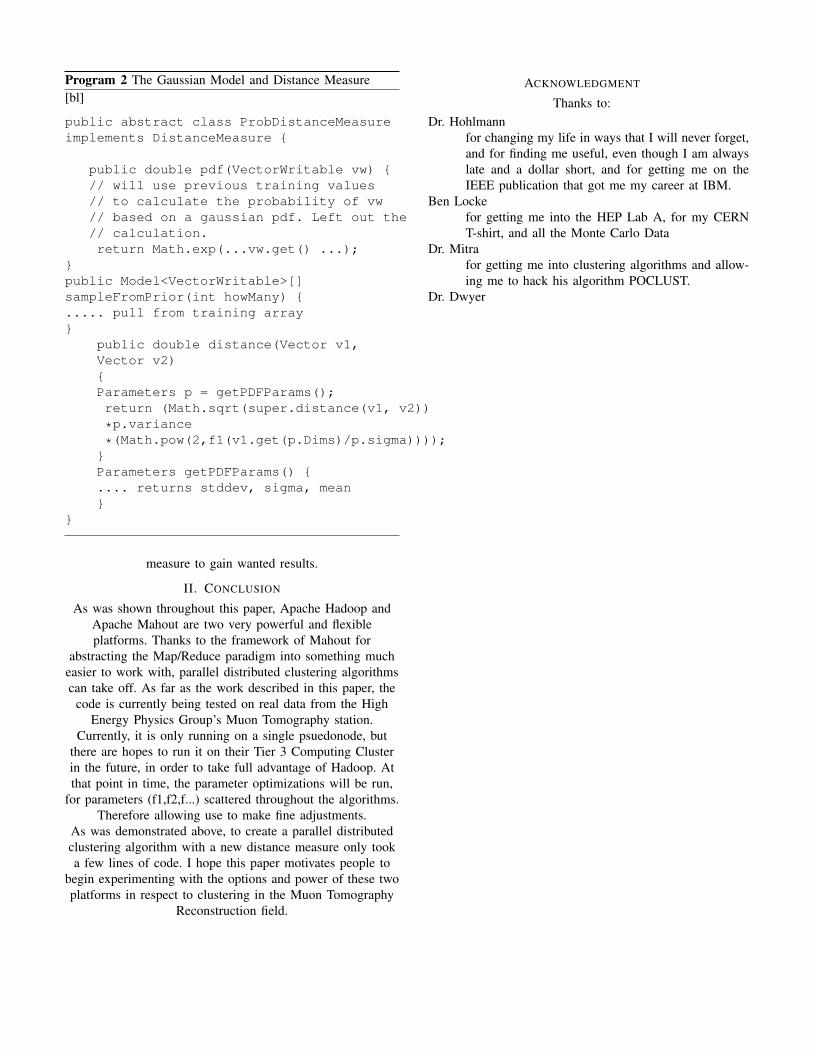
Program 2 The Gaussian Model and Distance Measure[bl]
public abstract class ProbDistanceMeasureimplements DistanceMeasure {
public double pdf(VectorWritable vw) {// will use previous training values// to calculate the probability of vw// based on a gaussian pdf. Left out the// calculation.return Math.exp(...vw.get() ...);
}public Model<VectorWritable>[]sampleFromPrior(int howMany) {..... pull from training array}
public double distance(Vector v1,Vector v2){Parameters p = getPDFParams();return (Math.sqrt(super.distance(v1, v2))
*p.variance
*(Math.pow(2,f1(v1.get(p.Dims)/p.sigma))));}Parameters getPDFParams() {.... returns stddev, sigma, mean}
}
measure to gain wanted results.
II. CONCLUSION
As was shown throughout this paper, Apache Hadoop andApache Mahout are two very powerful and flexibleplatforms. Thanks to the framework of Mahout for
abstracting the Map/Reduce paradigm into something mucheasier to work with, parallel distributed clustering algorithmscan take off. As far as the work described in this paper, the
code is currently being tested on real data from the HighEnergy Physics Group’s Muon Tomography station.
Currently, it is only running on a single psuedonode, butthere are hopes to run it on their Tier 3 Computing Clusterin the future, in order to take full advantage of Hadoop. Atthat point in time, the parameter optimizations will be run,
for parameters (f1,f2,f...) scattered throughout the algorithms.Therefore allowing use to make fine adjustments.
As was demonstrated above, to create a parallel distributedclustering algorithm with a new distance measure only tooka few lines of code. I hope this paper motivates people to
begin experimenting with the options and power of these twoplatforms in respect to clustering in the Muon Tomography
Reconstruction field.
ACKNOWLEDGMENT
Thanks to:Dr. Hohlmann
for changing my life in ways that I will never forget,and for finding me useful, even though I am alwayslate and a dollar short, and for getting me on theIEEE publication that got me my career at IBM.
Ben Lockefor getting me into the HEP Lab A, for my CERNT-shirt, and all the Monte Carlo Data
Dr. Mitrafor getting me into clustering algorithms and allow-ing me to hack his algorithm POCLUST.
Dr. Dwyer

Undergraduate Research Report • Spring 2012 • William K. Bittner
VII. The inclusion of Vx4D into ROOT
Due to the management complexity of keeping up with the dependencies, and multi-platformbuilds, it was decided that it would be much easier in the future to rewrite Vx4D in ROOT. Thisprocess is currently going on, and so is the inclusion of POCLUST eventually. Right now Vx4D issupported in ROOT, in beta, by using the:#include<TVxND.h>With a common constructor of: TVxND(TFile *) Using ROOT, a user interface will be created soon,allowing the user to manipulate, save, and load, all the previous options that Vx4D supported. Allof this is still under development, and progress is being made. Once it is available in a public betaform, it will be available at:TVxND Root Documentation, and Location of Code
7.1 The use of TVxND
TVxND will be an N-dimensional OpenGL Voxelized Visualization suite just like before, but nowyou can map an arbitrary amount of dimensions to the "Theta" variable.
19

Undergraduate Research Report • Spring 2012 • William K. Bittner
I. Appendix A - Source Code Locations
A.1 CLUSTVIZ,POCLUST,GenericClust,Vx4D
POCLUST and CLUSTVIZ Full Documentation
GenericClust Full Documentation
Vx4D Full Documentation
A.2 ROOT with TVx4D and future additions
TVxND Root Documentation, and Location of Code
II. Appendix B - Source Code Manuals
III. GenericClust - the POCLUST rewrite
IV. POCLUST and CLUSTVIZ source documentation
20