
Under-Resourced Schools Thought Force Report
10
NASFAA THOUGHT FORCE REPORT UNDER-RESOURCED SCHOOLS
Transcript of Under-Resourced Schools Thought Force Report

NASFAA THOUGHT FORCE REPORTUNDER-RESOURCED SCHOOLS
1Under-Resourced Schools Thought Force Report
Introduction and Background
Under-resourced schools are usually characterized as having insufficient resources and tend to serve large numbers of disadvantaged and/or low-income students. With a membership of 2,800 institutions, members of the National Association of Student Financial Aid Administrators (NASFAA) come from all sectors of higher education and range in both resources and the types of students they serve. One of the challenges of the association is balancing affordability with the financial resources needed to effectively run a national association.
In an effort to examine rebalancing NASFAA’s dues structures to be more affordable for smaller, less-resourced institutions, NASFAA has in the past run several financial models to explore whether it could lower its dues for schools that had fewer than 1,000 or 500 FTE students. The insurmountable challenge was the feasibility of attracting enough new members to offset the lost revenue that such a dues decrease would entail. NASFAA also explored purposefully and strategically decreasing dues for smaller schools all while accepting a revenue decrease. However, after closer examination, the NASFAA board determined that the resulting cuts in services and future opportunities from a revenue loss could not be justified.
Instead, NASFAA pursued other strategies to try and maintain NASFAA affordability, including limiting the frequency of annual dues increases. When dues were increased, those increases were purposefully nominal and well below industry benchmarks. In addition, NASFAA has attempted to provide its most important services (e.g., Today’s News, policy analysis, AskRegs) as part of its base membership.
Still, some schools continue to report that NASFAA membership, or particular services, remains unaffordable. These situations may be exacerbated by the current pandemic and the resulting economic distress. As such, the National Chair and President have convened a Thought Force to further explore this issue and provide a report containing these four outcomes:
1. Create a working definition of an under-resourced school.
2. Determine the scope of NASFAA members that meet that definition.
3. Explore and clearly identify the challenges faced by under-resourced schools, with a focus on challenges that pertain to NASFAA’s sphere of influence.
4. Broadly speaking, brainstorm about ways NASFAA could help meet the needs of under-resourced schools.
Thought Force Members
Chair: Andrew Hammontree, Francis Tuttle Technology Center
Commission Director: David Page, Dillard University
Mark Bandre, Bethany College
Marie Johnson, University of Vermont
Tevita Kale, Arizona State University
Lisanne Masterson, Blue Ridge Community College
Kelly Morrissey, Community College of Rhode Island
Robert Muhammed, Howard University
Greg Thornburg, Ball State University
NASFAA Staff Liaisons: Megan Coval, Beth Maglione, and Eunice Powell

2Under-Resourced Schools Thought Force Report
Resources
• “The Vital Role of Administrative Cost Allowances to Student Financial Aid Offices: Key Findings from NASFAA’s Administrative Cost Allowance Survey, July 2011” by NASFAA
• NASFAA’s Administrative Capability Task Force Report © 2020 NASFAA
• 2019 NAFSAA Benchmarking Report © 2019 NASFAA
• 2020 Administrative Burden Report © 2020 NASFAA
• 2019 NACUBO-TIAA Study of Endowments, © 2020 National Association of College and University Officers and TIAA
• State Higher Education FY 2019 Report, © 2020 State Higher Education Executive Officers Association
Executive Summary
To address the four objectives outlined in the introduction, the thought force held a series of virtual meetings between December 2020 and February 2021. The members discussed the underlying causes that create fiscal challenges for institutions of higher education and the stakeholders they serve.
The thought force explored these areas, which are described in more detail within this report:
• Title III and Title V criteria
• Administrative Cost Allowance (ACA)
• Endowments and institutional foundations
• Geographic location
• Funding levels and appropriations
• Administrative capability
• IPEDS financial data
To define under-resourced schools, the thought force looked at IPEDS financial data and explored an alternative method to identify schools with fiscal struggles. The members of the thought force also addressed specific challenges these schools face, and brainstormed on ways that NASFAA could assist these schools.

3Under-Resourced Schools Thought Force Report
Discussion
To determine the definition of an “under-resourced school,” the thought force concentrated on the financial status of the institution rather than focusing simply on schools that serve under-resourced students. The thought force recognized that under-resourced institutions often serve populations with insufficient resources, which can compound the fiscal challenges at the school; however, they did not want to assume that a school that serves under-resourced students is also under-resourced. Furthermore, they chose to view the fiscal health of the institution as a whole instead of looking at the financial aid office alone. In some cases, because of decisions made at a higher level, a financial aid office may be under-resourced at an institution that is otherwise solvent. With that in mind, the thought force gave special consideration to how the school’s financial challenges might impact the financial aid office and the students they serve.
One of the first areas the thought force explored was the eligibility for a Campus-Based institutional match waiver. Each year, the U.S. Department of Education (ED) provides this waiver to schools designated as Title III or Title V institutions. To determine who is eligible, ED produces an annual Eligibility Matrix (EM) to identify the schools that automatically receive this designation or are potentially eligible based on their most recent data from the Integrated Postsecondary Education Data System (IPEDS). The purpose of the institutional match waiver is, in part, to provide schools with greater fiscal stability. While not all of the institutions on the EM appear to be under-resourced, the thought force felt two metrics from the EM (i.e., core expenses and needy students) might help identify under-resourced schools.
Core Expenses.1 Under-resourced schools generally spend less money per full-time enrollment (FTE) than schools with more available resources. To determine which schools qualify for this metric, ED uses the IPEDS spring data collection survey to calculate each institution’s total core expenses per FTE. ED then calculates the average core expenses per FTE for the different institutional categories (based on type and control). If an institution’s average core expenses per FTE are less than the average core expenses per FTE for the same category of institution, then ED considers the school to have met this metric.
Needy Students. In general, this metric reviews whether 1) the institution disbursed a Pell Grant to more than the average percentage of Pell recipients at similar institutions, or 2) the institution awarded more than half their students a Federal Pell Grant, Federal College Work-Study, or Federal Supplemental Education Opportunity Grant (FSEOG). While the thought force did not think the needy student metric alone could qualify a school as being under-resourced, the members acknowledged that schools that serve needy students often use their own resources to fill the gap for student needs, which could exacerbate the shortfall at schools that already struggle with resources. This may be more common at schools that serve a high percentage of Pell recipients, first-generation students, or DACA students.
In FY20, ED’s Eligibility Matrix identified 1,277 institutions that met the core expenses and needy students metrics, qualifying them for the Campus-Based institutional match waiver. In addition, when an institution does not meet the core expenses or needy students metrics, ED provides schools with an opportunity to request an “exception,” if the institution can substantiate their request with appropriate documentation. After ED reviews the school’s application requesting an exception, they will provide the institution with documentation of their decision.
1 Core expenses are defined as the total expenses for the essential education activities of the institution. For public institutions reporting under the Governmental Accounting Standards Board (GASB) standards, this includes expenses for instruction, research, public service, academic support, student services, institutional support, operation and maintenance of physical plant, depreciation, scholarships and fellowships, interest and other operating and non-operating expenses. For institutions reporting under the Financial Accounting Standards Board (FASB) standards (primarily private, not-for-profit and for-profit), core expenses include the costs of instruction, research, public service, academic support, student services, institutional support, net grant aid to students, and other expenses. For both FASB and GASB institutions, core expenses exclude expenses for auxiliary enterprises (e.g., bookstores and dormitories), hospitals, and independent operations. (Source: IPEDS Data Collection Glossary)

4Under-Resourced Schools Thought Force Report
An institution can request an exception for the needy student metric if they can provide evidence that one of the following is true:
• The state provided more than 30% of the school’s budget, and the school did not charge more than $99 per student for tuition and fees for the year.
• At least 30% of the students in the base year were from low-income families.
• The institution substantially increased the higher education opportunities for low-income families or certain minority populations
• The institution increased the higher education opportunities for individuals residing in an area not included in a “Metropolitan Statistical Area.”
• The school is located within 50 miles of an American Indian reservation or a substantial population of American Indians.
Likewise, the institution can request an exception of the core expenses metrics if they can substantiate one of the following:
• The institution is located in an unusually high cost-of-living area.
• The school’s core expenses per FTE were distorted by high energy costs, low student enrollment for the fall term, an increase in in state funding that was part of a desegregation plan for higher education, or operations of high-cost professional schools (such as medical and dental schools).
Because ED only calculates the core expenses and needy students metrics for non-profit institutions that offer an associate’s or bachelor’s degree, the metrics would need to be calculated separately for other school categories, such as non-degree-granting, post-baccalaureate, or proprietary institutions. The data to calculate the metrics is readily available on the IPEDS website, so the task of calculating core expenses and needy students metric for each school category would not be overly burdensome. The metric exceptions listed above, however, present a larger challenge. ED only approves exceptions from two- and four-year non-profits. These schools should be able to provide documentation to show they qualified for the exception. Schools in other categories, however, do not have the same opportunity, and there is not an easy methodology to determine whether these schools qualify for these exceptions. To address this inequity, the thought force felt additional research would be needed to determine additional metrics that apply to all schools in conjunction with, or in place of, the core expenses and needy students metrics.
Next, the thought force pulled data from the IPEDS Finance collection survey to show all Title IV institutions’ core expenses and core revenues. The thought force reviewed three consecutive years of financial data to search for a consistent pattern. Ultimately, the thought force decided the financial data from IPEDS provided a good metric for determining under-resourced institutions.
Definition of Under-Resourced Schools
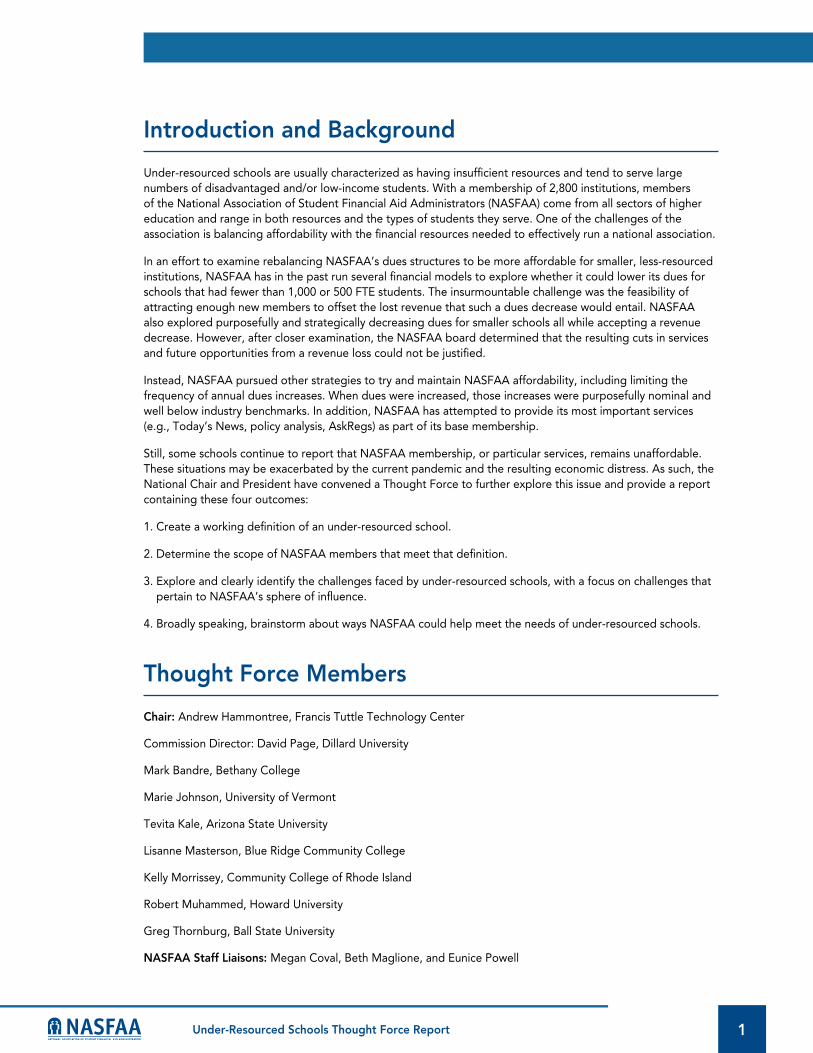
The thought force defined an under-resourced school as an institution whose core expenses per FTE exceeded their core revenues per FTE for three consecutive years. The data to calculate this information is available from IPEDS.
Of over 6,100 Title IV-eligible schools, 829 schools had expenses that exceeded their revenues for three consecutive years. The chart below shows a breakdown of under-resourced schools by school type and FTE. Of these schools, 337 (just under 41%) were current NASFAA members. Schools with an FTE of 250 or less comprise the largest group (approximately 43% of all schools), and nearly two-thirds of the schools had an FTE below 1,000. The private not-for-profit sector made up 40% of the schools, with proprietary and public schools at 31% and 28% respectively.
5Under-Resourced Schools Thought Force Report
Under-Resourced School by Control and FTE
0
1-250FTE
251-500FTE
501-1,000FTE
1,001-5,000FTE
5,001-10,000FTE
10,001+FTE
TotalFTE
800
700
600
500
400
300
200
100
900
Areas for Future Work
Because the above definition relies on IPEDS data that precedes the recent economic challenges resulting from COVID-19, the thought force felt some additional factors should be considered when determining whether a school is under-resourced. The economic consequences of the pandemic are still developing, and the higher education community will experience ripple effects for many years to come. At the time this report was written, Congress had approved two stimulus packages that provided tens of billions of dollars to colleges and universities and their students. But these funds only covered a portion of the expenses that schools (and students) have absorbed as a result of the pandemic. With this in mind, the thought force felt the conversation on under-resourced schools should remain on NASFAA’s radar. As the economic landscape continues to shift, additional metrics may need to be developed to identify under-resourced institutions.
The thought force felt the data from ED’s Title III and Title V Eligibility Matrix provides a good starting point for identifying additional under-resourced schools. For example, the thresholds for core expenses and needy students indicate that a school may be struggling financially in addition to serving a large percentage of under-resourced students. However, approximately one-third of all eligible schools fall into this category, and to narrow the scope, additional metrics would need to be developed. Some potential metrics include a review of the institution’s location (either in high-cost or remote areas), the administrative cost allowance per student, the size of their endowment or institutional foundation, staff size per applications received, and educational appropriations. These areas are explored in more detail in the “Under-Resourced School Challenges” section of this report.

6Under-Resourced Schools Thought Force Report
Below is a flowchart to show how the additional metrics could impact the definition of under-resourced schools.
Start
Do core expensesper FTE exceed
core revenues per FTE for 3 consecutive years?
(IPEDS)
Does the school meet both the Core Expenses
and Needy StudentsMetrics or havean exception (Title III/V)?
Does theinstitution meet
the additional metricsTBD (e.g., geographic,
ACA, endowment, etc.)?
School isunder-resourced.
School is notunder-resourced.
NO
NO NO
YES
YES
YES
The thought force also supported the idea of creating tiers of under-resourced schools. After the financial data from the pandemic is available, the statistics will likely show that some schools are struggling more than others. A tiered approach would identify the schools that are the most under-resourced.

7Under-Resourced Schools Thought Force Report
Under-Resourced School Challenges
Geographic Location. Institutions located in unusually expensive areas (e.g., San Francisco or Seattle) may have higher operational costs and may need to pay their employees higher wages to compensate for the high cost of living. Similarly, schools located in remote, rural areas may struggle to attract (and retain) qualified staff unless they are willing to offer higher salaries. Institutions located in certain remote areas may lack the community resources that their students and employees desire, leaving the burden on the institution to fill the gap.
Administrative Cost Allowance. Due to inequities in the Campus-Based funding allocation formula, many low-cost institutions serving high-need student populations are eligible for lower funding levels per FTE than higher-cost schools that have participated in the Campus-Based program for a longer period of time and serve wealthier student populations. While schools are allowed to draw down a portion of their Campus-Based expenditures as an Administrative Cost Allowance (ACA) to offset administrative expenses, many schools choose to spend their entire allocation on their students. Consequently, the schools that need the ACA the most are often the schools that benefit the least.
Many financial aid offices report they do not have control over how their institution’s ACA is spent. ED specifies that the ACA is intended to offset administrative costs such as salaries, furniture, travel, supplies, and equipment. It can also be used for service fees that banks charge for maintaining accounts, paying the cost of administering the Campus-Based and Federal Pell Grant programs, and covering expenses for carrying out the student consumer information service requirements. While the ACA may not be used for paying memberships in professional associations, it can be used for many worthwhile operations of the financial aid office that are especially worthwhile for under-resourced institutions.
Endowment/Institutional Foundation. Under-resourced institutions often have a small endowment or foundation, if they have one at all. While endowments and foundations are often perceived as a student resource (i.e., student grants and scholarships), they may also be used to fund the core functions of an institution. In addition, many endowments are restricted to specific uses, according to the donors’ terms. In these cases, the school may be limited to spending only the interest earned on the endowment and cannot touch the principal. Therefore, the thought force felt the focus should be on the amount of the endowment’s return rather than the full value of the endowment.
In general, schools that do not have an endowment or an institutional foundation are more likely to struggle with finding a way to fill the gap for institutional and student needs. On the other hand, schools with large, diversified investment income may have fewer fiscal struggles. The National Association of College and University Business Officers (NACUBO) offers an annual survey that evaluates the market value of institutional endowments. In their 2019 survey, out of 774 respondents, NACUBO reported that more than 78% of the total reported endowment value belonged to less than 14% of the schools, all of whom had an endowment of over $1 billion.2
Market fluctuations present another challenge to schools that rely heavily upon their investments. During an economic downturn, their endowment may provide fewer resources to the institution or its students, and institutions have to compensate for the shortfall through other revenue streams. This can have a snowball effect on institutions during periods of economic uncertainty.
State and Local Appropriations. During the Great Recession, state appropriations declined at a significant rate. Many institutions offset the shortfall through tuition hikes, which contributed to historic amounts of student loan debt. While 2019 marked the seventh consecutive year of education appropriation increases, these funds are still 8.7% below the pre-Great Recession levels. The recent pandemic will almost certainly impact state and local appropriations in the years to come, and it remains to be seen how institutions of higher learning will fare in the current economic crisis.
2 2019 NACUBO-TIAA Study of Endowments, ©2020 National Association of College and University Business Officers and
TIAA

8Under-Resourced Schools Thought Force Report
Administrative Capability. According to NASAA’s 2019 Benchmarking Report, the average Financial Aid Office has 2.4 full-time employees to serve every 1,000 aid applicants. Many schools with a small enrollment (e.g., less than 1,000 students) may find themselves with only one or two financial aid officers, who often split their responsibilities with other campus departments, such as the registrar or admissions. Without enough staff dedicated entirely to the administration of financial aid, under-resourced schools may struggle to keep up with the administrative burden associated with Title IV dollars.
Additionally, as colleges and universities rely more heavily on technology to meet the demands of their stakeholders, under-resourced schools may face challenges keeping up with technological advances. Schools that lack automation may have to fill the gap with manual processes, which can lead to more errors.
Finally, schools lacking sufficient resources cannot afford the training opportunities that other institutions utilize. Without proper training and staffing, these institutions may find themselves out of compliance with Title IV regulations, which could have deeper implications in the event of a program review. Schools may find themselves on heightened cash monitoring or paying hefty sanctions as a result.
Opportunities to Assist Under-Resourced Schools
The thought force brainstormed on ways NASFAA could meet the needs of under-resourced institutions. Below is a list of opportunities the thought force identified:
• Develop a mentoring program for under-resourced schools to provide them with an opportunity to build a network of their peers.
• Create a toolkit, including information on the availability of the Administrative Cost Allowance and its appropriate uses, a description of ways to qualify for the Campus-Based institutional match waiver, and other resources that might be helpful for these institutions.
• Provide a webinar specific to under-resourced schools regardless of their membership status.
• Invite under-resourced schools to participate in a Let’s Talk virtual discussion with Blue Icon.
• Create a document to explain the value of NASFAA membership, similar to the document used to justify attendance at the NASFAA Annual conference.
• Offer a discount on certain membership services, such as the P&P Builder or certain webinars.
• To encourage retention of NASFAA membership, offer an incentive to under-resourced schools. Examples include a free webinar or a discount on their dues if they choose to renew their membership.
Conclusion
Without appropriate resources, many schools struggle with administrative capability and sufficient training for their employees. If they cannot afford to provide quality services, their students also suffer. COVID-19 will almost certainly exacerbate the problems these schools face. With these challenges in mind, the thought force has provided a path to identify and assist these under-resourced institutions.

© 2021 National Association of Student Financial Aid Administrators
The National Association of Student Financial Aid Administrators (NASFAA)
provides professional development for financial aid administrators;
advocates for public policies that increase student access and success;
serves as a forum on student financial aid issues; and is committed to
diversity throughout all activities.
1801 PENNSYLVANIA AVENUE, NW, SUITE 850WASHINGTON, DC 20006-3606
202.785.0453 | fax 202.785.1487 | WWW.NASFAA.ORG


