Educational experiences of children under a continuing custody order

The Harriman State Campus, 1220 Washington Avenue, Albany, NY 12226-2050 I www.doccs.ny.gov
Under Custody Report:
Profile of Under Custody Population
As of January 1, 2016

The Harriman State Campus, 1220 Washington Avenue, Albany, NY 12226-2050 │ (518) 457-8126 │ www.doccs.ny.gov
i
Profile of Under Custody Population As of January 1, 2016
Table of Contents
_______________________________________________________________________
Page
Table of Contents ............................................................................................................. i
Executive Summary ......................................................................................................... ii
Introduction .................................................................................................................... 1
Inmate Categories…………………………………………………. ................. 2
Section 1: Demographic Characteristics
Gender Distribution ………………………………………………. .................. 3
Age Distribution ....................................................................................... 4
Race/Ethnic Distribution ........................................................................... 5
Region of Commitment ............................................................................ 6
World Region of Birth ................................................................................ 7
Marital Status ............................................................................................ 8
Number of Living Children ........................................................................ 9
Religious Affiliation .................................................................................. 10
Veteran Status ......................................................................................... 11
Section 2: Criminal History
Minimum Sentence ................................................................................. 12
Maximum Sentence ................................................................................ 14
Commitment Crime ................................................................................. 16
Felony Sentencing Status ....................................................................... 18
Prior Adult Criminal Record .................................................................... 20
Length of Time Served in Department Custody ...................................... 21
Time to Earliest Release ......................................................................... 22
Determinate Sentencing ......................................................................... 23
Education ................................................................................................ 24
Mental Health Indicator ........................................................................... 25

The Harriman State Campus, 1220 Washington Avenue, Albany, NY 12226-2050 │ (518) 457-8126 │ www.doccs.ny.gov
ii
Profile of Under Custody Population As of January 1, 2016
Executive Summary
* Not reported
Characteristics Category
Inmates
Under
Custody
Incarcerated
Parolees
Under
Custody
Total Under
Custody
Population January 1, 2016 51,744 600 52,344
Male 95.5% 85.2% 95.3%
Female 4.5% 14.8% 4.7%
Age Average Age 38.3 32.8 38.3
White 24.4% 48.2% 24.7%
Race/Ethnic Status African-American 48.6% 35.2% 48.5%
Hispanic 24.0% 13.0% 23.8%
New York City 43.7% 12.2% 43.4%
Region Suburban New York 10.6% 7.3% 10.6%
Upstate 45.6% 80.5% 46.1%
World Region of Birth Foreign Born 9.6% 2.7% 9.5%
Marital Status Never Married 66.1% 75.8% 66.3%
Living Children One or more living children 60.3% 60.2% 60.3%
Catholic 21.6% 26.2% 21.6%
Religious Affiliation Protestant 25.6% 18.3% 25.5%
Islam 11.3% 5.2% 11.3%
Military Service Veteran Status Veteran 4.6% 2.8% 4.6%
Median Minimum (in months) 72.0 24.0 67.0
Average Minimum (in months) 124.5 28.6 123.4
Median Maximum (in months) 84.0 42.0 84.0
Average Maximum (in months) 141.0 47.9 139.9
Violent Felony 65.0% 6.8% 64.3%
Drug Offenses 12.6% 43.3% 13.0%
Property/Other 12.8% 37.3% 13.1%
First Felony 55.8% 53.7% 55.8%
Second Felony 40.0% 46.3% 40.0%
Persistent Felony 4.2% 0.0% 4.2%
No Prior Arrest 15.9% 7.2% 15.8%
Prior Prison Term 34.5% 22.3% 34.3%
Median time served (in months) 25.4 1.5 *
Average time served (in months) 61.3 1.8 *
Median time (in months) 14.3 * *
Average time (in months) 50.9 * *
Drug Offenses - Determinate * * 96.8%
Violent Felony - Determinate * * 69.9%
Education Verified High School Credential 59.3% 56.3% 59.2%
OMH Service Level OMH Level 1 - 4 19.5% 24.0% 19.6%
Determinate Sentence
Minimum Sentence
Maximum Sentence
Crime
Gender
Felony Sentencing Status
Prior Adult Criminal Record
Time Served in Department
Custody
Time to Earliest Release Date

The Harriman State Campus, 1220 Washington Avenue, Albany, NY 12226-2050 │ (518) 457-8126 │ www.doccs.ny.gov
1
Profile of Under Custody Population As of January 1, 2016
INTRODUCTION
Purpose of the Report This report presents information on inmates and incarcerated parolees held under Department of Corrections and Community Supervision (DOCCS) custody as of January 1, 2016. It profiles their demographic and criminal history characteristics. Additional Offenders Reported Due to the Merger of Corrections and Parole On April 1, 2011, the former Division of Parole and the former Department of Correctional Services merged to form the Department of Corrections and Community Supervision (DOCCS). In past years the Department’s Under Custody reports only included inmates in correctional facilities. Starting with the 2012 report in this series, all inmates are reported including those participating in the Alt 90 or Alt 45 programs1. In addition, “incarcerated parolees” (offenders under community supervision who are participating in a parole program at a DOCCS facility) are included, but reported separately. Most “incarcerated parolees” are housed in parole program facilities, while some are housed in correctional facilities. Similarly, most inmates are housed in correctional facilities, while others are housed in parole program facilities. (See next page for a description). The table below shows the distribution of the various offender subgroups within the under custody population. Descriptions of these different offender subgroups are presented on the next page.
1. Alt-90 cases have been assigned to an alternative 90-day drug treatment program at Willard Drug Treatment Campus (DTC),
while Alt-45 cases have been assigned to an alternative 45-day drug treatment program at Edgecombe Residential Treatment Facility. See next page for a more complete description.
Type of Facility InmatesIncarcerated
ParoleesTotal
Correctional Facilities 51,363 172 51,535
Parole Program Facilities 381 428 809
Total 51,744 600 52,344

The Harriman State Campus, 1220 Washington Avenue, Albany, NY 12226-2050 │ (518) 457-8126 │ www.doccs.ny.gov
2
Inmate Categories Inmates in correctional facilities are inmates who have been sentenced to prison (or returned to prison as a result of a parole violation), are not under community supervision, and are incarcerated in a traditional “prison” facility (N=51,363). Incarcerated parolees in correctional facilities are parolees who are under community supervision and have been incarcerated in order to participate in a treatment program at a parole program facility (e.g. Willard Drug Treatment Campus, Edgecombe Residential Treatment Facility). Incarcerated parolees in correctional facilities (N=172) are in one of the following situations: 1) in a reception facility on the way to beginning a treatment program in a parole program facility, 2) in a correctional facility awaiting an outcome hearing by an Administrative Law Judge (ALJ) as a result of being removed from a treatment program at a parole program facility, or 3) are participating in an alternative treatment program due to medical or mental health needs that cannot be met at the designated parole program facility. Inmates in parole program facilities are returned parole violators who are participating in an alternative drug treatment program. These inmates were revoked and given a time assessment by an ALJ that represents a period of time that they must spend in prison. However, in lieu of serving the full amount of time in prison, these offenders were offered the opportunity to participate in a drug treatment program and they have volunteered to do so. If they successfully complete the program (either 90 days at Willard Drug Treatment Campus or 45 days at Edgecombe Residential Treatment Facility), these offenders will be released from incarceration at the completion of the program and restored to community supervision. If they do not successfully complete the drug treatment program, they must complete the remainder of their time assessment in a correctional facility (N=381). Incarcerated parolees in parole program facilities are parolees who are under community supervision and participating in an assigned treatment program at a parole program facility. Once these incarcerated parolees complete the treatment program, they will be returned to the community to complete their term of community supervision. If these incarcerated parolees do not successfully complete their assigned treatment program, they will be removed from the program and the parole violation process will proceed accordingly. Parolees who fail the Willard Drug Treatment program and parolees who were sent to Edgecombe via special condition are removed from the programs and a violation warrant is issued. Parolees who were sent to Edgecombe with the issuance of a warrant are removed from the program and a final hearing is scheduled (N=428). Sections of the Report
The first section of this report describes the demographic characteristics of inmates and incarcerated parolees, including gender, age, race/ethnicity, region of commitment, birthplace, marital status, number of living children, religious affiliation, and veteran status. The second section describes the criminal history of inmates and incarcerated parolees, including information on minimum sentence, commitment crime, second felony sentencing status, prior adult criminal record, length of time served at current facility, length of time in Department custody, time to earliest release, and determinant sentencing status.

The Harriman State Campus, 1220 Washington Avenue, Albany, NY 12226-2050 │ (518) 457-8126 │ www.doccs.ny.gov
3
Section One
DEMOGRAPHIC CHARACTERISTICS Gender Distribution Of the 52,344 offenders under custody on January 1, 2016, 49,901 (95%) were male and 2,443 (5%) were female. There was a drop of 759 (-1%) total offenders under custody since January 1, 2015. The number of male offenders decreased by 813 (-2%) while female offenders increased by 54 (2%). Females made up a larger proportion of incarcerated parolees (15%) than inmates (5%).
Figure 1. Proportion of Females Under Custody by Offender Status;
Under Custody Population on January 1, 2016
Table 1. Gender Distribution and Offender Status;
Under Custody Population on January 1, 2015 and January 1, 2016
4.5%
14.8%
0%
2%
4%
6%
8%
10%
12%
14%
16%
Inmates Incarcerated Parolees
Gender and Numeric Percent Percent of Percent of
Offender Status Change Change Total 2015 Total 2016
Inmates
Male 50,216 49,390 -826 -1.6% 95.6% 95.5%
Female 2,325 2,354 29 1.2% 4.4% 4.5%
Total Inmates 52,541 51,744 -797 -1.5% 100% 100%
Incarcerated Parolees
Male 498 511 13 2.6% 88.6% 85.2%
Female 64 89 25 39.1% 11.4% 14.8%
Total Parolees 562 600 38 6.8% 100% 100%
Grand Total
Male 50,714 49,901 -813 -1.6% 95.5% 95.3%
Female 2,389 2,443 54 2.3% 4.5% 4.7%
Total Under Custody 53,103 52,344 -759 -1.4% 100% 100%
2015 2016

The Harriman State Campus, 1220 Washington Avenue, Albany, NY 12226-2050 │ (518) 457-8126 │ www.doccs.ny.gov
4
Age Distribution
The average age of offenders under custody on January 1, 2016 was 38 years old. On average, inmates were older (38) than incarcerated parolees (33). About 47% of incarcerated parolees were under age 30, while only 31% of the inmates fell into this younger age group. Offenders under 21 years old numbered 1,679 (3%). Since last year’s report, the number of offenders in the under 21 age group decreased by 233 (-12%). Of the 1,679 offenders under age 21, 89 were 16 or 17 years old, 8 fewer than on January 1, 2015. Overall, the number of offenders age 50 and older increased by 207 (2%) between January 1, 2015 and January 1, 2016, while the total population declined by 759 (-1.4%).
Figure 2. Age by Offender Status; Under Custody Population on January 1, 2016
Table 2. Age by Gender or Offender Status;
Under Custody Population on January 1, 2016
<1%3%
27% 29%
21%
15%
5%
<1%
4%
43%
35%
12%
6%
1%<1%
3%
28% 29%
21%
15%
5%
0%
10%
20%
30%
40%
50%
16-17 18-20 21-29 30-39 40-49 50-59 60+
Inmates
Incarcerated Parolees
Total
Age by Gender 16-17 18-20 21-29 30-39 40-49 50-59 60+ Total Average
Male 87 1,526 13,709 14,291 10,551 7,420 2,317 49,901 38.3
Female 2 64 727 741 506 331 72 2,443 37.3
Total 89 1,590 14,436 15,032 11,057 7,751 2,389 52,344 38.3
Male 0.2% 3.1% 27.5% 28.6% 21.1% 14.9% 4.6% 100.0%
Female 0.1% 2.6% 29.8% 30.3% 20.7% 13.5% 2.9% 100.0%
Total 0.2% 3.0% 27.6% 28.7% 21.1% 14.8% 4.6% 100.0%
Age by Offender Status
Inmates 89 1,568 14,179 14,825 10,984 7,716 2,383 51,744 38.3
Incarcerated Parolees 0 22 257 207 73 35 6 600 32.8
Total Under Custody 89 1,590 14,436 15,032 11,057 7,751 2,389 52,344 38.3
Inmates 0.2% 3.0% 27.4% 28.7% 21.2% 14.9% 4.6% 100.0%
Incarcerated Parolees 0.0% 3.7% 42.8% 34.5% 12.2% 5.8% 1.0% 100.0%
Total Under Custody 0.2% 3.0% 27.6% 28.7% 21.1% 14.8% 4.6% 100.0%

The Harriman State Campus, 1220 Washington Avenue, Albany, NY 12226-2050 │ (518) 457-8126 │ www.doccs.ny.gov
5
Race/Ethnic Distribution Almost half (49%) of the total offenders under custody on January 1, 2016 were African-American, while just under a quarter were Hispanic and another quarter identified as White. A larger proportion of the female under custody population was White (47%) compared to the male under custody population (24%). A larger proportion of the incarcerated parolee population was White (48%) compared to the inmate population (24%).
Figure 3. Race/Ethnic Status by Gender; Under Custody Population on January 1, 2016
Table 3. Race/Ethnic Status by Gender or Offender Status;
Under Custody Population on January 1, 2016
24%
49%
24%
47%
35%
14%
25%
49%
24%
0%
10%
20%
30%
40%
50%
60%
White African American Hispanic
Male
Female
Total
Race/Ethnic Status by
GenderWhite
African
AmericanHispanic
Native
AmericanAsian Other Unknown Total
Male 11,744 24,504 12,124 395 239 605 290 49,901
Female 1,159 861 349 25 12 18 19 2,443
Total 12,903 25,365 12,473 420 251 623 309 52,344
Male 23.5% 49.1% 24.3% 0.8% 0.5% 1.2% 0.6% 100.0%
Female 47.4% 35.2% 14.3% 1.0% 0.5% 0.7% 0.8% 100.0%
Total 24.7% 48.5% 23.8% 0.8% 0.5% 1.2% 0.6% 100.0%
Offender Status
Inmates 12,614 25,154 12,395 415 250 618 298 51,744
Incarcerated Parolees 289 211 78 5 1 5 11 600
Total Under Custody 12,903 25,365 12,473 420 251 623 309 52,344
Inmates 24.4% 48.6% 24.0% 0.8% 0.5% 1.2% 0.6% 100.0%
Incarcerated Parolees 48.2% 35.2% 13.0% 0.8% 0.2% 0.8% 1.8% 100.0%
Total Under Custody 24.7% 48.5% 23.8% 0.8% 0.5% 1.2% 0.6% 100.0%

The Harriman State Campus, 1220 Washington Avenue, Albany, NY 12226-2050 │ (518) 457-8126 │ www.doccs.ny.gov
6
Region of Commitment Nearly half (43%) of the offenders under custody on January 1, 2016 were committed from New York City and 11% were committed from suburban New York (Nassau, Rockland, Suffolk, and Westchester counties). Offenders from Upstate counties with a population center of 50,000 inhabitants or more (Albany, Broome, Erie, Monroe, Oneida, Onondaga, Niagara, Rensselaer, and Schenectady counties) comprised 26% of the under custody population. The remaining 20% were sentenced from the other Upstate counties. Incarcerated parolees were less likely than inmates to have been committed from New York City (12% vs. 44%) and more likely to have been committed from Upstate Other counties (49% vs. 20%). When compared with males under custody, females under custody were less likely to come from New York City (28% vs. 44%) and were more likely to come from Upstate Other (37% vs. 20%).
Figure 4. Region of Commitment by Gender; Under Custody Population on January 1, 2016
Table 4. Region of Commitment by Gender or Offender Status;
Under Custody Population on January 1, 2016
* One inmate is from out of state, so the total for this table differs from the other tables in this report.
44%
11%
26%
20%
28%
8%
27%
37%
43%
11%
26%
20%
0%
20%
40%
60%
New York City Suburban New York Upstate Urban Upstate Other
Male
Female
Total
Region by GenderNew York
City
Suburban
New York
Upstate
Urban
Upstate
OtherTotal*
Male 22,018 5,336 12,734 9,813 49,901
Female 688 202 650 902 2,442
Total 22,706 5,538 13,384 10,715 52,343
Male 44.1% 10.7% 25.5% 19.7% 100.0%
Female 28.2% 8.3% 26.6% 36.9% 100.0%
Total 43.4% 10.6% 25.6% 20.5% 100.0%
Offender Status
Inmates 22,633 5,494 13,193 10,423 51,743
Incarcerated Parolees 73 44 191 292 600
Total Under Custody 22,706 5,538 13,384 10,715 52,343
Inmates 43.7% 10.6% 25.5% 20.1% 100.0%
Incarcerated Parolees 12.2% 7.3% 31.8% 48.7% 100.0%
Total Under Custody 43.4% 10.6% 25.6% 20.5% 100.0%

The Harriman State Campus, 1220 Washington Avenue, Albany, NY 12226-2050 │ (518) 457-8126 │ www.doccs.ny.gov
7
World Region of Birth Ninety percent (90%) of offenders under custody were born in the United States or a United States Territory. The other 10% or 4,968 reported birth in a foreign country. Of the offenders who reported birth in a foreign country, 48% or 2,379 were from one of the island nations in the Caribbean basin.2 Among inmates, 10% or 4,952 were foreign-born while only 3% or 16 of incarcerated parolees were foreign-born.
Figure 5. World Region of Birth; Under Custody Population on January 1, 2016
Table 5. World Region of Birth; Under Custody Population on January 1, 2016
* Includes offenders committed from United States Territories.
2. For additional information on foreign born inmates see "The Foreign Born Under Custody Population and the Institutional Removal Program" (2013), New York State Department of Corrections and Community Supervision, Albany, New York 12226. This report is on the DOCCS’ website at: http://www.doccs.ny.gov/Research/Reports/2014/ForeignBorn_IRP_Report_2013.pdf
486
2,379
630 621
344
141 80
261
445
0
500
1,000
1,500
2,000
2,500
North
America
Carribean Central
America
South
America
Europe Africa Near East Asia Other
World Region by
Gender
United
States*
North
AmericaCarribean
Central
America
South
AmericaEurope Africa
Near
EastAsia
South
PacificUnknown Total
Male 44,668 476 2,315 619 602 318 135 78 254 25 411 49,901
Female 2,289 10 64 11 19 26 6 2 7 1 8 2,443
Total 46,957 486 2,379 630 621 344 141 80 261 26 419 52,344
Male 89.5% 1.0% 4.6% 1.2% 1.2% 0.6% 0.3% 0.2% 0.5% 0.1% 0.8% 100.0%
Female 93.7% 0.4% 2.6% 0.5% 0.8% 1.1% 0.2% 0.1% 0.3% 0.0% 0.3% 100.0%
Total 89.7% 0.9% 4.5% 1.2% 1.2% 0.7% 0.3% 0.2% 0.5% 0.0% 0.8% 100.0%
Offender Status
Inmates 46,385 486 2,370 629 621 339 141 80 260 26 407 51,744
Incarcerated Parolees 572 0 9 1 0 5 0 0 1 0 12 600
Total Under Custody 46,957 486 2,379 630 621 344 141 80 261 26 419 52,344
Inmates 89.6% 0.9% 4.6% 1.2% 1.2% 0.7% 0.3% 0.2% 0.5% 0.1% 0.8% 100.0%
Incarcerated Parolees 95.3% 0.0% 1.5% 0.2% 0.0% 0.8% 0.0% 0.0% 0.2% 0.0% 2.0% 100.0%
Total Under Custody 89.7% 0.9% 4.5% 1.2% 1.2% 0.7% 0.3% 0.2% 0.5% 0.0% 0.8% 100.0%

The Harriman State Campus, 1220 Washington Avenue, Albany, NY 12226-2050 │ (518) 457-8126 │ www.doccs.ny.gov
8
Marital Status Two-thirds (66%) of the under custody population reported never being married. The proportion was higher (76%) for incarcerated parolees.
Figure 6. Marital Status by Gender; Under Custody Population on January 1, 2016
Table 6. Marital Status; Under Custody Population on January 1, 2016
66%
21%
2%
8%
1% 1%
64%
19%
1%
13%
3%<1
66%
21%
2%
9%
1% 1%
0%
20%
40%
60%
80%
Never Married Married Common Law Seperated/Divorced
Widowed Not Stated/Unknown
Male
Female
Total
Marital Status
by Gender
Never
MarriedMarried
Common
Law
Seperated/
DivorcedWidowed
Not Stated/
UnknownTotal
Male 33,116 10,540 1,022 4,206 476 541 49,901
Female 1,564 463 12 328 71 5 2,443
Total 34,680 11,003 1,034 4,534 547 546 52,344
Male 66.4% 21.1% 2.0% 8.4% 1.0% 1.1% 100.0%
Female 64.0% 19.0% 0.5% 13.4% 2.9% 0.2% 100.0%
Total 66.3% 21.0% 2.0% 8.7% 1.0% 1.0% 100.0%
Offender Status
Inmates 34,225 10,937 1,030 4,476 543 533 51,744
Incarcerated Parolees 455 66 4 58 4 13 600
Total Under Custody 34,680 11,003 1,034 4,534 547 546 52,344
Inmates 66.1% 21.1% 2.0% 8.7% 1.0% 1.0% 100.0%
Incarcerated Parolees 75.8% 11.0% 0.7% 9.7% 0.7% 2.2% 100.0%
Total Under Custody 66.3% 21.0% 2.0% 8.7% 1.0% 1.0% 100.0%

The Harriman State Campus, 1220 Washington Avenue, Albany, NY 12226-2050 │ (518) 457-8126 │ www.doccs.ny.gov
9
Number of Living Children Among inmates reporting parental status, the majority of offenders under custody (60%) reported that they had at least one living child at the time of admission to the Department. Women were more likely than men to report having a living child (71% vs. 60%).
Figure 7. Number of Children by Gender; Under Custody Population on January 1, 2016
Table 7. Number of Children; Under Custody Population on January 1, 2016
38%
23%
16%
10%11%
3%
29%
22%
19%
13%
17%
<1%
37%
23%
16%
10%
12%
3%
0%
15%
30%
45%
No Children 1 Child 2 Children 3 Children 4 or More Unknown
Male
Female
Total
Number of Children
by GenderNo Children 1 Child 2 Children 3 Children 4 or More Unknown Total
Male 18,773 11,392 8,007 4,737 5,695 1,297 49,901
Female 700 532 473 313 419 6 2,443
Total 19,473 11,924 8,480 5,050 6,114 1,303 52,344
Male 37.6% 22.8% 16.0% 9.5% 11.4% 2.6% 100.0%
Female 28.7% 21.8% 19.4% 12.8% 17.2% 0.2% 100.0%
Total 37.2% 22.8% 16.2% 9.6% 11.7% 2.5% 100.0%
Offender Status
Inmates 19,247 11,788 8,379 4,989 6,051 1,290 51,744
Incarcerated Parolees 226 136 101 61 63 13 600
Total Under Custody 19,473 11,924 8,480 5,050 6,114 1,303 52,344
Inmates 37.2% 22.8% 16.2% 9.6% 11.7% 2.5% 100.0%
Incarcerated Parolees 37.7% 22.7% 16.8% 10.2% 10.5% 2.2% 100.0%
Total Under Custody 37.2% 22.8% 16.2% 9.6% 11.7% 2.5% 100.0%

The Harriman State Campus, 1220 Washington Avenue, Albany, NY 12226-2050 │ (518) 457-8126 │ www.doccs.ny.gov
10
Religious Affiliation Eighty-five percent (85%) of offenders under custody reported affiliation with a recognized religion. Twenty-six percent (26%) were Protestant, 22% were Catholic, 11% were Islamic, 27% reported another faith, and 15% did not report affiliation with a religious faith.
Figure 8. Religious Affiliation by Gender; Under Custody Population on January 1, 2016
Table 8. Religious Affiliation; Under Custody Population on January 1, 2016
21%
25%
11%
30%
39%
9%
22%
26%
11%
0%
10%
20%
30%
40%
50%
Catholic Protestant Islam
Male
Female
Total
Religious Affiliation by
GenderCatholic
Protes-
tantIslam
Nation
of Islam
Rasta-
farianJewish
Asian
Religions
Native
American
Greek
OrthodoxOther
None
ListedTotal
Male 10,610 12,383 5,672 2,044 4,814 3,981 323 473 49 2,202 7,350 49,901
Female 722 955 217 10 17 36 14 15 4 28 425 2,443
Total 11,332 13,338 5,889 2,054 4,831 4,017 337 488 53 2,230 7,775 52,344
Male 21.3% 24.8% 11.4% 4.1% 9.6% 8.0% 0.6% 0.9% 0.1% 4.4% 14.7% 100.0%
Female 29.6% 39.1% 8.9% 0.4% 0.7% 1.5% 0.6% 0.6% 0.2% 1.1% 17.4% 100.0%
Total 21.6% 25.5% 11.3% 3.9% 9.2% 7.7% 0.6% 0.9% 0.1% 4.3% 14.9% 100.0%
Offender Status
Inmates 11,175 13,228 5,858 2,045 4,797 3,994 335 484 52 2,219 7,557 51,744
Incarcerated Parolees 157 110 31 9 34 23 2 4 1 11 218 600
Total Under Custody 11,332 13,338 5,889 2,054 4,831 4,017 337 488 53 2,230 7,775 52,344
Inmates 21.6% 25.6% 11.3% 4.0% 9.3% 7.7% 0.6% 0.9% 0.1% 4.3% 14.6% 100.0%
Incarcerated Parolees 26.2% 18.3% 5.2% 1.5% 5.7% 3.8% 0.3% 0.7% 0.2% 1.8% 36.3% 100.0%
Total Under Custody 21.6% 25.5% 11.3% 3.9% 9.2% 7.7% 0.6% 0.9% 0.1% 4.3% 14.9% 100.0%

The Harriman State Campus, 1220 Washington Avenue, Albany, NY 12226-2050 │ (518) 457-8126 │ www.doccs.ny.gov
11
Veteran Status Of the 52,344 offenders under custody on January 1, 2016, 5% (2,417) are reported as verified veterans. Of this total, 2,400 were inmates while only 17 were incarcerated parolees. Only 31 veterans were female. Veteran status is verified through a data match with the Veteran’s Administration (VA) or verified possession of a DD 214 form.
Figure 9. Veterans by Gender and Offender Status;
Under Custody Population on January 1, 2016
Table 9. Veterans by Gender and Offender Status;
Under Custody Population on January 1, 2016
2,370
16
2,386
30 1 31
2,400
17
2,417
0
500
1,000
1,500
2,000
2,500
Inmates Incarcerated Parolees Total Under Custody
Male
Female
Total
Veteran Status by
Offender Status
Non
VeteranVeteran Total
Non
VeteranVeteran Total
Non
VeteranVeteran Total
Inmates 47,020 2,370 49,390 2,324 30 2,354 49,344 2,400 51,744
Incarcerated Parolees 495 16 511 88 1 89 583 17 600
Total Under Custody 47,515 2,386 49,901 2,412 31 2,443 49,927 2,417 52,344
Inmates 95.2% 4.8% 100.0% 98.7% 1.3% 100.0% 95.4% 4.6% 100.0%
Incarcerated Parolees 96.9% 3.1% 100.0% 98.9% 1.1% 100.0% 97.2% 2.8% 100.0%
Total Under Custody 95.2% 4.8% 100.0% 98.7% 1.3% 100.0% 95.4% 4.6% 100.0%
Male Female Total

The Harriman State Campus, 1220 Washington Avenue, Albany, NY 12226-2050 │ (518) 457-8126 │ www.doccs.ny.gov
12
Section Two
CRIMINAL HISTORY Minimum Sentence
Overall, the median minimum sentence for offenders under custody was 6 years (67 months)3. However, the average minimum sentence length was ten years, reflecting the influence of lengthy minimum terms of many offenders. About one-third were serving minimum sentences of 10 years or more.
Current sentencing laws in New York require an inmate convicted of certain crimes to receive a determinate sentence. Determinate sentences require an offender to serve a minimum term of 6/7 of the determinate sentence imposed by the judge before being eligible for release. An inmate committed for a crime not designated as having a determinate sentence has a minimum sentence set by the court. As of January 1, 2016, there were 275 inmates under custody who were serving sentences of “Life Without Parole”. In calculating the average minimum sentence length, “Life Without Parole” cases were given a value of 45 years or 540 months.
Figure 10. Minimum Sentence Length of Offenders; Under Custody Population on January 1, 2016
Table 10A. Minimum Sentence; Under Custody Population on January 1, 2016
3 The median is the middle point between the number of instances of greater value and the number of instances of lesser value. The median is less subject to the influence of extreme values than is the average and is preferred by some users for this reason.
<1%
6%
8%
12%
11%
13%
15%
10%
8%
17%
1%
0%
5%
10%
15%
20%
< 12
Months
12-17
Months
18-23
Months
24-35
Months
36-47
Months
48-71
Months
72-119
Months
120-179
Months
180-239
Months
240 +
Months
Life, No
Parole
Minimum
Sentence
< 12
Months
12-17
Months
18-23
Months
24-35
Months
36-47
Months
48-71
Months
72-119
Months
120-179
Months
180-239
Months
240 +
Months
Life, No
ParoleTotal
Total Under- 131 3,338 4,081 6,402 5,684 6,643 7,945 5,050 4,137 8,658 275 52,344
Custody 0.3% 6.4% 7.8% 12.2% 10.9% 12.7% 15.2% 9.6% 7.9% 16.5% 0.5% 100.0%

The Harriman State Campus, 1220 Washington Avenue, Albany, NY 12226-2050 │ (518) 457-8126 │ www.doccs.ny.gov
13
Table 10B. Minimum Sentence; Under Custody Population on January 1, 2016
As can be seen in Table 10B above, the median minimum sentence for inmates was 72 months. There is a large difference between male inmates, whose median minimum sentence was 72 months, and female inmates, whose median minimum was 36 months.
For incarcerated parolees, the median minimum sentence was 24 months. Male parolees had a median minimum sentence of 24 months, while female parolees had a median minimum of 21 months. In general, incarcerated parolees have shorter minimum and maximum sentences than inmates committed to state prison. Overall, 16% of inmates had a minimum sentence of less than 2 years compared with 45% of incarcerated parolees.
Minimum Sentence
by Gender - InmatesMale Female Total Male Female Total
< 12 Months 103 19 122 0.2% 0.8% 0.2%
12-17 Months 2,865 343 3,208 5.8% 14.6% 6.2%
18-23 Months 3,642 310 3,952 7.4% 13.2% 7.6%
24-35 Months 5,811 407 6,218 11.8% 17.3% 12.0%
36-47 Months 5,315 282 5,597 10.8% 12.0% 10.8%
48-71 Months 6,284 322 6,606 12.7% 13.7% 12.8%
72-119 Months 7,674 249 7,923 15.5% 10.6% 15.3%
120-179 Months 4,928 120 5,048 10.0% 5.1% 9.8%
180-239 Months 4,020 117 4,137 8.1% 5.0% 8.0%
240 + Months 8,482 176 8,658 17.2% 7.5% 16.7%
Life, No Parole 266 9 275 0.5% 0.4% 0.5%
Total Inmates 49,390 2,354 51,744 100.0% 100.0% 100.0%
Minimum Sentence
by Gender - ParoleesMale Female Total Male Female Total
< 12 Months 6 3 9 1.2% 3.4% 1.5%
12-17 Months 105 25 130 20.5% 28.1% 21.7%
18-23 Months 106 23 129 20.7% 25.8% 21.5%
24-35 Months 155 29 184 30.3% 32.6% 30.7%
36-47 Months 82 5 87 16.0% 5.6% 14.5%
48-71 Months 33 4 37 6.5% 4.5% 6.2%
72-119 Months 22 0 22 4.3% 0.0% 3.7%
120-179 Months 2 0 2 0.4% 0.0% 0.3%
180-239 Months 0 0 0 0.0% 0.0% 0.0%
240 + Months 0 0 0 0.0% 0.0% 0.0%
Life, No Parole 0 0 0 0.0% 0.0% 0.0%
Total Incarcerated
Parolees511 89 600 100.0% 100.0% 100.0%
Total Under Custody 49,901 2,443 52,344 95.3% 4.7% 100.0%
Average and Median
Minimum Sentence
Male
Average
Female
Average
Total
Average
Male
Median
Female
Median
Total
Median
Total Inmates 127.0 72.6 124.5 72.0 36.0 72.0
Total Incarcerated
Parolees29.6 22.7 28.6 24.0 21.0 24.0
Total Under Custody 126.0 70.8 123.4 72.0 36.0 67.0

The Harriman State Campus, 1220 Washington Avenue, Albany, NY 12226-2050 │ (518) 457-8126 │ www.doccs.ny.gov
14
Maximum Sentence
As of January 1, 2016, the median maximum sentence of offenders under custody was seven years (84 months). However, the average maximum sentence length was nearly 12 years, reflecting the influence of lengthy maximum terms of many offenders. Almost one-third had maximum sentences of 15 years or more with 18% of the population having a maximum sentence of life. Average maximum sentences for women (96 months) were 47 months shorter than for men (143 months). Median maximum sentences for women (60 months) were 24 months shorter than for men (84 months). Average maximum sentences for inmates (141 months) were 93 months shorter than for incarcerated parolees (48 months). In calculating the average maximum sentence length, “Life Without Parole” cases were given a value of 45 years or 540 months, and Life maximum cases were given a value of 25 years or 300 months.
Figure 11. Maximum Sentence Length of Offenders;
Under Custody Population on January 1, 2016
Table 11A. Maximum Sentence; Under Custody Population on January 1, 2016
6%
11%
13%
10%
12%
4%
7%
5%
14%
18%
1%
0%
5%
10%
15%
20%
12-35
Months
36
Months
37-53
Months
54-71
Months
72-95
Months
96-107
Months
108-143
Months
144-179
Months
180 and
Over
Life
Maximum
Life, No
Parole
Maximum
Sentence
12 - 35
Months
36
Months
37-53
Months
54-71
Months
72-95
Months
96-107
Months
108-143
Months
144-179
Months
180 and
OverLife Max
Life, No
Parole
Total
Inmates
Total 3,240 5,526 6,994 5,122 6,475 1,909 3,806 2,519 7,215 9,263 275 52,344
Under Custody 6.2% 10.6% 13.4% 9.8% 12.4% 3.6% 7.3% 4.8% 13.8% 17.7% 0.5% 100.0%

The Harriman State Campus, 1220 Washington Avenue, Albany, NY 12226-2050 │ (518) 457-8126 │ www.doccs.ny.gov
15
Table 11B. Maximum Sentence; Under Custody Population on January 1, 2016
As can be seen in Table 11B above, the median maximum sentence for inmates was 84 months. There was a large difference between male inmates, whose median maximum sentence was 84 months, and female inmates, with a median maximum sentence of 60 months. For incarcerated parolees, the median maximum sentence was 42 months. The difference between males and females was much smaller, with a median maximum sentence of 48 months for males compared with 36 months for female incarcerated parolees.
Maximum Sentence
by Gender - InmatesMale Female Total Male Female Total
12 to 35 2,869 245 3,114 5.8% 10.4% 6.0%
36 Months 4,913 453 5,366 9.9% 19.2% 10.4%
37-53 Months 6,446 387 6,833 13.1% 16.4% 13.2%
54-71 Months 4,819 253 5,072 9.8% 10.7% 9.8%
72-95 Months 6,107 293 6,400 12.4% 12.4% 12.4%
96-107 Months 1,816 86 1,902 3.7% 3.7% 3.7%
108-143 Months 3,647 143 3,790 7.4% 6.1% 7.3%
144-179 Months 2,425 92 2,517 4.9% 3.9% 4.9%
180 and Over 7,032 181 7,213 14.2% 7.7% 13.9%
Life Max 9,050 212 9,262 18.3% 9.0% 17.9%
Life, No Parole 266 9 275 0.5% 0.4% 0.5%
Total Inmates 49,390 2,354 51,744 100.0% 100.0% 100.0%
Maximum Sentence
by Gender - ParoleesMale Female Total Male Female Total
12 to 35 102 24 126 20.0% 27.0% 21.0%
36 Months 130 30 160 25.4% 33.7% 26.7%
37-53 Months 145 16 161 28.4% 18.0% 26.8%
54-71 Months 45 5 50 8.8% 5.6% 8.3%
72-95 Months 63 12 75 12.3% 13.5% 12.5%
96-107 Months 7 0 7 1.4% 0.0% 1.2%
108-143 Months 15 1 16 2.9% 1.1% 2.7%
144-179 Months 1 1 2 0.2% 1.1% 0.3%
180 and Over 2 0 2 0.4% 0.0% 0.3%
Life Max 1 0 1 0.2% 0.0% 0.2%
Life, No Parole 0 0 0 0.0% 0.0% 0.0%
Total Incarcerated
Parolees511 89 600 100.0% 100.0% 100.0%
Total Under Custody 49,901 2,443 52,344 95.3% 4.7% 100.0%
Average and Median
Maximum Sentence
Male
Average
Female
Average
Total
Average
Male
Median
Female
Median
Total
Median
Total Inmates 143.1 96.4 141.0 84.0 60.0 84.0
Total Incarcerated
Parolees48.7 43.3 47.9 48.0 36.0 42.0
Total Under Custody 142.2 94.5 139.9 84.0 60.0 84.0

The Harriman State Campus, 1220 Washington Avenue, Albany, NY 12226-2050 │ (518) 457-8126 │ www.doccs.ny.gov
16
Commitment Crime Sixty-four percent (64%) of the offenders under custody on January 1, 2016 were convicted of a Violent Felony Offense (VFO). Another 13% of offenders were convicted of a Property or Other crime and another 13% of offenders were convicted of drug crimes. Forty-three percent (43%) of females were serving a sentence for a VFO compared to 65% of males. In contrast, 29% of females were sentenced for a Property or Other crime compared to 12% percent of males. Table 12B (below) lists the commitment crimes that are included in each of the general categories included in Figure 12. On January 1, 1997, there were 24,085 drug offenders out of a total custody population of 70,209 (34%). This compares with 6,780 drug offenders (13%) under custody on January 1, 2016. Between 1997 and 2016, there was a 72% reduction (-17,305) in the number of drug offenders held under custody.
Figure 12. Commitment Crime Category by Gender;
Under Custody Population on January 1, 2016
Table 12A. Crime Category; Under Custody Population on January 1, 2016
65%
8%
13% 12%
2%
43%
9%
18%
29%
2%
64%
8%
13% 13%
2%0%
15%
30%
45%
60%
75%
Violent Felony Other Coercive Drug Offense Property and
Other
Youthful/Juvenile
Offender
Male Female Total
Commitment Crime Type
by Gender
Violent
Felony
Other
Coercive
Drug
Offenses
Property
and OtherYO/JO Total
Male 32,611 3,896 6,340 6,169 885 49,901
Female 1,043 219 440 704 37 2,443
Total 33,654 4,115 6,780 6,873 922 52,344
Male 65.4% 7.8% 12.7% 12.4% 1.8% 100.0%
Female 42.7% 9.0% 18.0% 28.8% 1.5% 100.0%
Total 64.3% 7.9% 13.0% 13.1% 1.8% 100.0%
Offender Status
Inmates 33,613 4,067 6,520 6,649 895 51,744
Incarcerated Parolees 41 48 260 224 27 600
Total Under Custody 33,654 4,115 6,780 6,873 922 52,344
Inmates 65.0% 7.9% 12.6% 12.8% 1.7% 100.0%
Incarcerated Parolees 6.8% 8.0% 43.3% 37.3% 4.5% 100.0%
Total Under Custody 64.3% 7.9% 13.0% 13.1% 1.8% 100.0%

The Harriman State Campus, 1220 Washington Avenue, Albany, NY 12226-2050 │ (518) 457-8126 │ www.doccs.ny.gov
17
Table 12B. Crime Category by Offender Status by Gender; UC Population on January 1, 2016
Inmates Grand
Male Female Total Male Female Total Total
Violent Felony
Murder 6,429 193 6,622 0 0 0 6,622
Attempted Murder 1,323 31 1,354 3 0 3 1,357
Manslt 1st,Ag 2nd 1,942 153 2,095 0 0 0 2,095
Rape 1st 1,645 6 1,651 0 0 0 1,651
Robbery 1st 3,860 83 3,943 8 0 8 3,951
Robbery 2nd 2,569 82 2,651 8 0 8 2,659
Assault 1st 1,869 107 1,976 2 0 2 1,978
Assault 2nd 1,253 79 1,332 0 0 0 1,332
Burglary 1st 1,060 23 1,083 1 0 1 1,084
Burglary 2nd 3,717 144 3,861 8 0 8 3,869
Arson 1st,2nd 202 32 234 0 0 0 234
Sodomy 1st 958 5 963 0 0 0 963
Sex Ab 1st,Ag.2 1,197 11 1,208 0 0 0 1,208
Weapons Offenses 3,534 67 3,601 11 0 11 3,612
Kidnapping 1st,2nd 321 11 332 0 0 0 332
Other VFO Sex Off 545 15 560 0 0 0 560
Other Violent 146 1 147 0 0 0 147
Subtotal 32,570 1,043 33,613 41 0 41 33,654
96.9% 3.1% 100.0% 100.0% 0.0% 100.0%
Other Coercive
Manslaughter 2nd 224 20 244 0 0 0 244
Other Homicide 160 31 191 0 0 0 191
Robbery 3rd 1,012 45 1,057 27 2 29 1,086
Att Assault 2nd 346 39 385 6 0 6 391
Conspiracy 2,3,4 318 23 341 1 0 1 342
Other Weapons 655 11 666 4 0 4 670
Other Sex Offenses 781 15 796 0 1 1 797
Other Coercive 356 31 387 6 1 7 394
Subtotal 3,852 215 4,067 44 4 48 4,115
94.7% 5.3% 100.0% 91.7% 8.3% 100.0%
Drug Offenses
Drug Sale 3,156 232 3,388 106 19 125 3,513
Drug Possession 2,961 171 3,132 117 18 135 3,267
Subtotal 6,117 403 6,520 223 37 260 6,780
93.8% 6.2% 100.0% 85.8% 14.2% 100.0%
Property and Other
Burglary 3rd 2,002 99 2,101 69 14 83 2,184
Grand Larceny 1,140 231 1,371 47 15 62 1,433
Forgery 437 74 511 20 9 29 540
Stolen Property 326 31 357 14 3 17 374
Drive Intoxicated 645 84 729 16 3 19 748
Contempt 1st 367 11 378 3 0 3 381
All Other felonies 1,075 127 1,202 8 3 11 1,213
Subtotal 5,992 657 6,649 177 47 224 6,873
90.1% 9.9% 100.0% 79.0% 21.0% 100.0%
YO/JO
Youthful Offender 733 34 767 26 1 27 794
Juvenile Offender 126 2 128 0 0 0 128
Subtotal 859 36 895 26 1 27 922
96.0% 4.0% 100.0% 96.3% 3.7% 100.0%
Grand Total 49,390 2,354 51,744 511 89 600 52,344
95.5% 4.5% 100.0% 85.2% 14.8% 100.0%
Incarcerated ParoleesCommitment Crime Type

The Harriman State Campus, 1220 Washington Avenue, Albany, NY 12226-2050 │ (518) 457-8126 │ www.doccs.ny.gov
18
Felony Sentencing Status Fifty-six percent (56%) of the total offenders under custody on January 1, 2016, were sentenced as first felony offenders. Crimes are presented by felony sentencing status in Table 13B. In general VFO and YO/JO’s were more likely to be first felony offenders while Drug, Property, and Other Coercive offenders were more likely to be second felony offenders. Men were more likely than women (41% vs. 28%) to be sentenced as second felony offenders. New York State Penal Law establishes more severe sentences for second felony offenders and persistent felony offenders than for first felony offenders. In general, a persistent felony offender is a person convicted of at least two prior felony offenses on separate occasions. This status allows them to be sentenced to a life maximum. It should be noted that some offenders included among the individuals sentenced as first felony offenders were also convicted of prior felony crimes and some even had previous sentences to state prison. The majority of such offenders were convicted of class A-1 violent felony crimes, which do not permit sentencing as a second felony offender since the penalties for A-1 violent felony crimes are already the most severe. Figure 13. Felony Sentencing Status by Gender; Under Custody Population on January 1, 2016
Table 13A. Second Felony Sentencing Status; Under Custody Population on January 1, 2016
55%
41%
4%
71%
28%
1%
56%
40%
4%
0%
10%
20%
30%
40%
50%
60%
70%
80%
First Felony Offender Second Felony Offender Persistent Felony Offender
MaleFemaleTotal
Felony Offender by GenderFirst Felony
Offender
Second
Felony
Offender
Persistent
Felony
Offender
Total
Male 27,475 20,267 2,159 49,901
Female 1,733 695 15 2,443
Total 29,208 20,962 2,174 52,344
Male 55.1% 40.6% 4.3% 100.0%
Female 70.9% 28.4% 0.6% 100.0%
Total 55.8% 40.0% 4.2% 100.0%
Offender Status
Inmates 28,886 20,684 2,174 51,744
Incarcerated Parolees 322 278 0 600
Total Under Custody 29,208 20,962 2,174 52,344
Inmates 55.8% 40.0% 4.2% 100.0%
Incarcerated Parolees 53.7% 46.3% 0.0% 100.0%
Total Under Custody 55.8% 40.0% 4.2% 100.0%

The Harriman State Campus, 1220 Washington Avenue, Albany, NY 12226-2050 │ (518) 457-8126 │ www.doccs.ny.gov
19
Table 13B. Second Felony Sentencing Status; Under Custody Population on January 1, 2016
Inmates Incarcerated Parolees
Commitment Crime
Type
First
Felony
Offender
Second
Felony
Offender
Persistent
Felony
Offender
Total
First
Felony
Offender
Second
Felony
Offender
Persistent
Felony
Offender
TotalGrand
Total
Violent Felony
Murder 6,622 0 0 6,622 0 0 0 0 6,622
Attempted Murder 886 414 54 1,354 3 0 0 3 1,357
Manslt 1st,Ag 2nd 1,548 512 35 2,095 0 0 0 0 2,095
Rape 1st 996 534 121 1,651 0 0 0 0 1,651
Robbery 1st 1,770 1,699 474 3,943 6 2 0 8 3,951
Robbery 2nd 1,192 1,145 314 2,651 5 3 0 8 2,659
Assault 1st 1,190 692 94 1,976 1 1 0 2 1,978
Assault 2nd 608 630 94 1,332 0 0 0 0 1,332
Burglary 1st 515 476 92 1,083 1 0 0 1 1,084
Burglary 2nd 1,539 1,814 508 3,861 5 3 0 8 3,869
Arson 1st,2nd 169 65 0 234 0 0 0 0 234
Sodomy 1st 674 240 49 963 0 0 0 0 963
Sex Ab 1st,Ag.2 941 224 43 1,208 0 0 0 0 1,208
Weapons Offenses 1,898 1,582 121 3,601 7 4 0 11 3,612
Kidnapping 1st,2nd 234 82 16 332 0 0 0 0 332
Other VFO Sex Off 420 128 12 560 0 0 0 0 560
Other Violent 96 46 5 147 0 0 0 0 147
Subtotal 21,298 10,283 2,032 33,613 28 13 0 41 33,654
63.4% 30.6% 6.0% 100.0% 68.3% 31.7% 0.0% 100.0%
Other Coercive
Manslaughter 2nd 178 58 8 244 0 0 0 0 244
Other Homicide 164 24 3 191 0 0 0 0 191
Robbery 3rd 301 733 23 1,057 18 11 0 29 1,086
Att Assault 2nd 90 294 1 385 3 3 0 6 391
Conspiracy 2,3,4 209 128 4 341 1 0 0 1 342
Other Weapons 152 505 9 666 1 3 0 4 670
Other Sex Offenses 550 240 6 796 1 0 0 1 797
Other Coercive 200 180 7 387 5 2 0 7 394
Subtotal 1,844 2,162 61 4,067 29 19 0 48 4,115
45.3% 53.2% 1.5% 100.0% 60.4% 39.6% 0.0% 100.0%
Drug Offenses
Drug Sale 991 2,394 3 3,388 68 57 0 125 3,513
Drug Possession 995 2,132 5 3,132 62 73 0 135 3,267
Subtotal 1,986 4,526 8 6,520 130 130 0 260 6,780
30.5% 69.4% 0.1% 100.0% 50.0% 50.0% 0.0% 100.0%
Property and Other
Burglary 3rd 635 1,444 22 2,101 40 43 0 83 2,184
Grand Larceny 517 837 17 1,371 22 40 0 62 1,433
Forgery 151 356 4 511 13 16 0 29 540
Stolen Property 92 258 7 357 7 10 0 17 374
Drive Intoxicated 720 4 5 729 19 0 0 19 748
Contempt 1st 147 228 3 378 2 1 0 3 381
All Other Felonies 601 586 15 1,202 5 6 0 11 1,213
Subtotal 2,863 3,713 73 6,649 108 116 0 224 6,873
43.1% 55.8% 1.1% 100.0% 48.2% 51.8% 0.0% 100.0%
YO/JO
Youthful Offender 767 0 0 767 27 0 0 27 794
Juvenile Offender 128 0 0 128 0 0 0 0 128
Subtotal 895 0 0 895 27 0 0 27 922
100.0% 0.0% 0.0% 100.0% 100.0% 0.0% 0.0% 100.0%
Grand Total 28,886 20,684 2,174 51,744 322 278 0 600 52,344
55.8% 40.0% 4.2% 100.0% 53.7% 46.3% 0.0% 100.0%

The Harriman State Campus, 1220 Washington Avenue, Albany, NY 12226-2050 │ (518) 457-8126 │ www.doccs.ny.gov
20
Prior Adult Criminal Record For this report, offenders are placed in a prior adult criminal record category based on their most extensive contact with the criminal justice system prior to their current incarceration. Thirty-four percent (34%) of offenders under custody had served a prior prison term. For 25% of the custody population, prior jail was the most serious contact with the criminal justice system, while 16% had no prior arrest. Women had less serious prior adult records than men.
Figure 14. Prior Adult Criminal Record by Gender;
Under Custody Population on January 1, 2016
Table 14. Prior Adult Criminal Record; Under Custody Population on January 1, 2016
15%
8%
17%
25%
35%
26%
11%
20%
25%
18%16%
8%
17%
25%
34%
0%
10%
20%
30%
40%
No Prior Arrest No Prior Conviction Conviction, No Jail Prior Jail Term Prior Prison Term
MaleFemaleTotal
Prior Record by
Gender
No Prior
Arrest
No Prior
Conviction
Conviction,
No Jail
Prior Jail
Term
Prior Prison
TermTotal
Male 7,628 3,769 8,525 12,435 17,544 49,901
Female 636 268 495 610 434 2,443
Total 8,264 4,037 9,020 13,045 17,978 52,344
Male 15.3% 7.6% 17.1% 24.9% 35.2% 100.0%
Female 26.0% 11.0% 20.3% 25.0% 17.8% 100.0%
Total 15.8% 7.7% 17.2% 24.9% 34.3% 100.0%
Offender Status
Inmates 8,221 4,000 8,864 12,815 17,844 51,744
Incarcerated Parolees 43 37 156 230 134 600
Total Under Custody 8,264 4,037 9,020 13,045 17,978 52,344
Inmates 15.9% 7.7% 17.1% 24.8% 34.5% 100.0%
Incarcerated Parolees 7.2% 6.2% 26.0% 38.3% 22.3% 100.0%
Total Under Custody 15.8% 7.7% 17.2% 24.9% 34.3% 100.0%

The Harriman State Campus, 1220 Washington Avenue, Albany, NY 12226-2050 │ (518) 457-8126 │ www.doccs.ny.gov
21
Length of Time Served in Department Custody About one quarter (26%) of the inmates under custody on January 1, 2016 had spent six years or more under custody since their latest admission to DOCCS. While nearly one-third (32%) had spent less than one year under custody, 17% had spent 10 or more years incarcerated at DOCCS. Inmates under custody on January 1, 2016 had spent an average of 61 months at DOCCS since their latest admission date. The median length of time served was 25 months. Due to the short period of incarceration for incarcerated parolees, all had served less than a year (average of 2 months).
Figure 15. Length of Time Served in DOCCS Custody Since Last Admission Date (Inmates Only)
Table 15. DOCCS Time Served in Years; Under Custody Population on January 1, 2016
16,119
8,934
5,440
7,875
4,552
3,4432,356
3,025
0
5,000
10,000
15,000
20,000
LT 1 YR 1 YR 2 YR 3-5 YR 6-9 YR 10-14 YR 15-19 YR 20+ YR
Time in DOCCS LT 1 YR 1 YR 2 YR 3-5 YR 6-9 YR 10-14 YR 15-19 YR 20+ YR Total
Male 15,560 8,459 5,210 7,576 4,439 3,360 2,311 2,986 49,901
Female 1,159 475 230 299 113 83 45 39 2,443
Total 16,719 8,934 5,440 7,875 4,552 3,443 2,356 3,025 52,344
Male 31.2% 17.0% 10.4% 15.2% 8.9% 6.7% 4.6% 6.0% 100.0%
Female 47.4% 19.4% 9.4% 12.2% 4.6% 3.4% 1.8% 1.6% 100.0%
Total 31.9% 17.1% 10.4% 15.0% 8.7% 6.6% 4.5% 5.8% 100.0%
Offender Status
Inmates 16,119 8,934 5,440 7,875 4,552 3,443 2,356 3,025 51,744
Incarcerated Parolees 600 0 0 0 0 0 0 0 600
Total Under Custody 16,719 8,934 5,440 7,875 4,552 3,443 2,356 3,025 52,344
Inmates 31.2% 17.3% 10.5% 15.2% 8.8% 6.7% 4.6% 5.8% 100.0%
Incarcerated Parolees 100.0% 0.0% 0.0% 0.0% 0.0% 0.0% 0.0% 0.0% 100.0%
Total Under Custody 31.9% 17.1% 10.4% 15.0% 8.7% 6.6% 4.5% 5.8% 100.0%
Time Served Since Latest Admission Date in Months Inmate-Average 61.3 Parolee-Average 1.8
Time Served Since Latest Admission Date in Months Inmate-Median 25.4 Parolee-Median 1.5

The Harriman State Campus, 1220 Washington Avenue, Albany, NY 12226-2050 │ (518) 457-8126 │ www.doccs.ny.gov
22
Time to Earliest Release
Time to earliest release date is a measure of the length of time until the earliest possible date at which the inmate can legally be released. Incarcerated parolees are not included in this section. Sixty-two percent (62%) of the inmate population had less than two years to their earliest release dates. The average time to earliest release for the inmate population on January 1, 2016 was 51 months. The median time to earliest release was 14 months. Median and average time to earliest release was much lower for female inmates than for male inmates.
Figure 16. Length of Time to Earliest Release Date (Inmates Only); Inmate UC Population on January 1, 2016
Table 16. Time to Earliest Release Date in Months; Inmate UC Population on January 1, 2016
* Missing 206 cases.
7,868
6,953
4,880
3,833
5,120
3,444
2,1441,654
2,680
3,392
3,841
5,454
275
0
2,000
4,000
6,000
8,000
Time to Earliest
Release Date
0-2
Months
3-5
Months
6-8
Months
9-11
Months
12-17
Months
18-23
Months
24-29
Months
30-35
Months
36-47
Months
48-71
Months
72-119
Months
120 +
Months
Life W/O
ParoleTotal*
Male 7,376 6,553 4,609 3,621 4,876 3,303 2,045 1,586 2,581 3,300 3,728 5,341 266 49,185
Female 492 400 271 212 244 141 99 68 99 92 113 113 9 2,353
Total 7,868 6,953 4,880 3,833 5,120 3,444 2,144 1,654 2,680 3,392 3,841 5,454 275 51,538
Male 15.0% 13.3% 9.4% 7.4% 9.9% 6.7% 4.2% 3.2% 5.2% 6.7% 7.6% 10.9% 0.5% 100.0%
Female 20.9% 17.0% 11.5% 9.0% 10.4% 6.0% 4.2% 2.9% 4.2% 3.9% 4.8% 4.8% 0.4% 100.0%
Total 15.3% 13.5% 9.5% 7.4% 9.9% 6.7% 4.2% 3.2% 5.2% 6.6% 7.5% 10.6% 0.5% 100.0%
Average Time to Earliest Release Date in Months Male 52.1 Female 27.4 Total 50.9
Median Time to Earliest Release Date in Months Male 14.8 Female 9.2 Total 14.3 Inmates
The Harriman State Campus, 1220 Washington Avenue, Albany, NY 12226-2050 │ (518) 457-8126 │ www.doccs.ny.gov
23
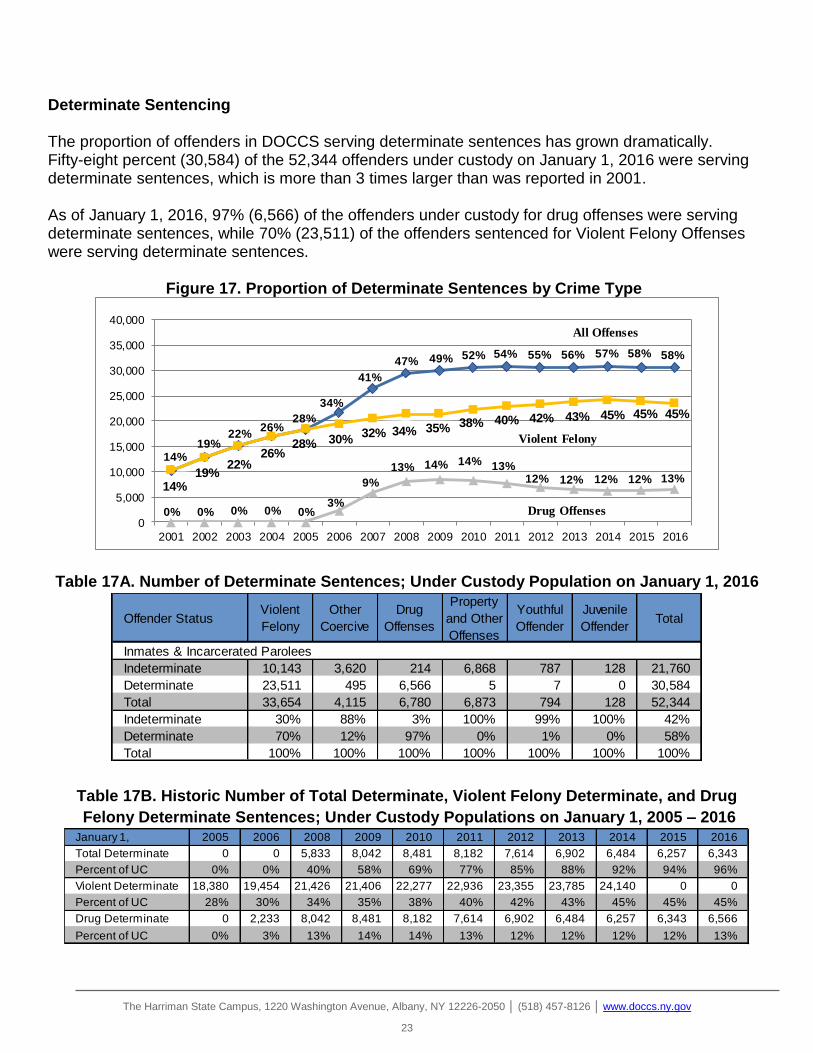
Determinate Sentencing The proportion of offenders in DOCCS serving determinate sentences has grown dramatically. Fifty-eight percent (30,584) of the 52,344 offenders under custody on January 1, 2016 were serving determinate sentences, which is more than 3 times larger than was reported in 2001. As of January 1, 2016, 97% (6,566) of the offenders under custody for drug offenses were serving determinate sentences, while 70% (23,511) of the offenders sentenced for Violent Felony Offenses were serving determinate sentences.
Figure 17. Proportion of Determinate Sentences by Crime Type
Table 17A. Number of Determinate Sentences; Under Custody Population on January 1, 2016
Table 17B. Historic Number of Total Determinate, Violent Felony Determinate, and Drug
Felony Determinate Sentences; Under Custody Populations on January 1, 2005 – 2016
All Offenses
Violent Felony
Drug Offenses
14%19%
22%26%
28%
34%
41%
47% 49% 52% 54% 55% 56% 57% 58% 58%
14%19%
22%26%
28% 30%32% 34% 35% 38% 40% 42% 43% 45% 45% 45%
0% 0% 0% 0% 0%3%
9%
13% 14% 14% 13%12% 12% 12% 12% 13%
0
5,000
10,000
15,000
20,000
25,000
30,000
35,000
40,000
2001 2002 2003 2004 2005 2006 2007 2008 2009 2010 2011 2012 2013 2014 2015 2016
Offender StatusViolent
Felony
Other
Coercive
Drug
Offenses
Property
and Other
Offenses
Youthful
Offender
Juvenile
OffenderTotal
Inmates & Incarcerated Parolees
Indeterminate 10,143 3,620 214 6,868 787 128 21,760
Determinate 23,511 495 6,566 5 7 0 30,584
Total 33,654 4,115 6,780 6,873 794 128 52,344
Indeterminate 30% 88% 3% 100% 99% 100% 42%
Determinate 70% 12% 97% 0% 1% 0% 58%
Total 100% 100% 100% 100% 100% 100% 100%
January 1, 2005 2006 2008 2009 2010 2011 2012 2013 2014 2015 2016
Total Determinate 0 0 5,833 8,042 8,481 8,182 7,614 6,902 6,484 6,257 6,343
Percent of UC 0% 0% 40% 58% 69% 77% 85% 88% 92% 94% 96%
Violent Determinate 18,380 19,454 21,426 21,406 22,277 22,936 23,355 23,785 24,140 0 0
Percent of UC 28% 30% 34% 35% 38% 40% 42% 43% 45% 45% 45%
Drug Determinate 0 2,233 8,042 8,481 8,182 7,614 6,902 6,484 6,257 6,343 6,566
Percent of UC 0% 3% 13% 14% 14% 13% 12% 12% 12% 12% 13%
The Harriman State Campus, 1220 Washington Avenue, Albany, NY 12226-2050 │ (518) 457-8126 │ www.doccs.ny.gov
24
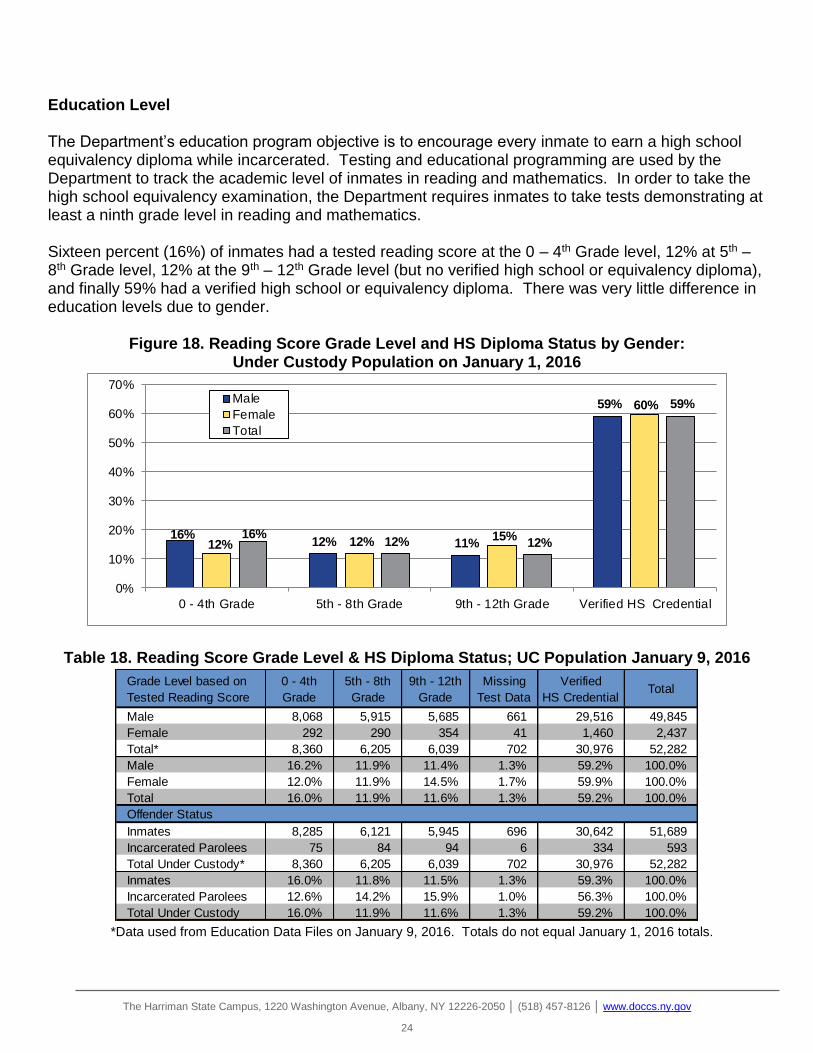
Education Level The Department’s education program objective is to encourage every inmate to earn a high school equivalency diploma while incarcerated. Testing and educational programming are used by the Department to track the academic level of inmates in reading and mathematics. In order to take the high school equivalency examination, the Department requires inmates to take tests demonstrating at least a ninth grade level in reading and mathematics. Sixteen percent (16%) of inmates had a tested reading score at the 0 – 4th Grade level, 12% at 5th – 8th Grade level, 12% at the 9th – 12th Grade level (but no verified high school or equivalency diploma), and finally 59% had a verified high school or equivalency diploma. There was very little difference in education levels due to gender.
Figure 18. Reading Score Grade Level and HS Diploma Status by Gender: Under Custody Population on January 1, 2016
Table 18. Reading Score Grade Level & HS Diploma Status; UC Population January 9, 2016
*Data used from Education Data Files on January 9, 2016. Totals do not equal January 1, 2016 totals.
16%12% 11%
59%
12% 12% 15%
60%
16%12% 12%
59%
0%
10%
20%
30%
40%
50%
60%
70%
0 - 4th Grade 5th - 8th Grade 9th - 12th Grade Verified HS Credential
Male
Female
Total
Grade Level based on
Tested Reading Score
0 - 4th
Grade
5th - 8th
Grade
9th - 12th
Grade
Missing
Test Data
Verified
HS CredentialTotal
Male 8,068 5,915 5,685 661 29,516 49,845
Female 292 290 354 41 1,460 2,437
Total* 8,360 6,205 6,039 702 30,976 52,282
Male 16.2% 11.9% 11.4% 1.3% 59.2% 100.0%
Female 12.0% 11.9% 14.5% 1.7% 59.9% 100.0%
Total 16.0% 11.9% 11.6% 1.3% 59.2% 100.0%
Offender Status
Inmates 8,285 6,121 5,945 696 30,642 51,689
Incarcerated Parolees 75 84 94 6 334 593
Total Under Custody* 8,360 6,205 6,039 702 30,976 52,282
Inmates 16.0% 11.8% 11.5% 1.3% 59.3% 100.0%
Incarcerated Parolees 12.6% 14.2% 15.9% 1.0% 56.3% 100.0%
Total Under Custody 16.0% 11.9% 11.6% 1.3% 59.2% 100.0%
The Harriman State Campus, 1220 Washington Avenue, Albany, NY 12226-2050 │ (518) 457-8126 │ www.doccs.ny.gov
25
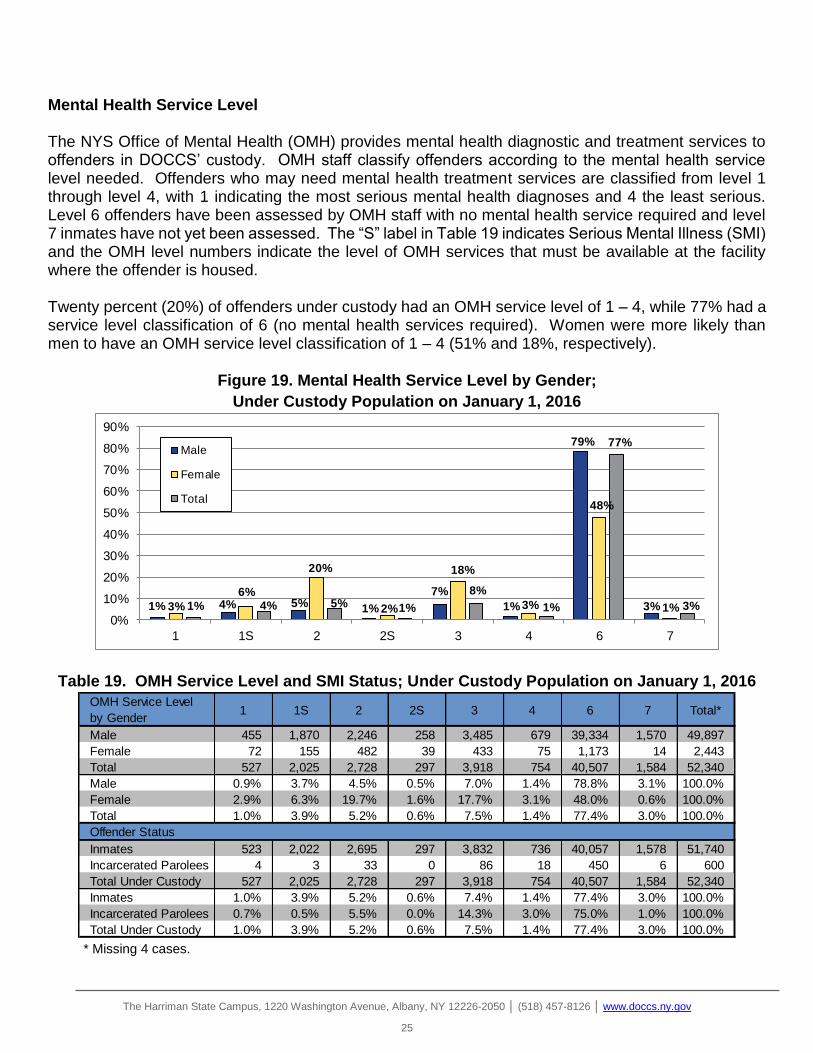
Mental Health Service Level The NYS Office of Mental Health (OMH) provides mental health diagnostic and treatment services to offenders in DOCCS’ custody. OMH staff classify offenders according to the mental health service level needed. Offenders who may need mental health treatment services are classified from level 1 through level 4, with 1 indicating the most serious mental health diagnoses and 4 the least serious. Level 6 offenders have been assessed by OMH staff with no mental health service required and level 7 inmates have not yet been assessed. The “S” label in Table 19 indicates Serious Mental Illness (SMI) and the OMH level numbers indicate the level of OMH services that must be available at the facility where the offender is housed. Twenty percent (20%) of offenders under custody had an OMH service level of 1 – 4, while 77% had a service level classification of 6 (no mental health services required). Women were more likely than men to have an OMH service level classification of 1 – 4 (51% and 18%, respectively).
Figure 19. Mental Health Service Level by Gender;
Under Custody Population on January 1, 2016
Table 19. OMH Service Level and SMI Status; Under Custody Population on January 1, 2016
* Missing 4 cases.
1% 4% 5% 1%
7%
1%
79%
3%3%
6%
20%
2%
18%
3%
48%
1%1% 4% 5% 1%
8%
1%
77%
3%
0%
10%
20%
30%
40%
50%
60%
70%
80%
90%
1 1S 2 2S 3 4 6 7
Male
Female
Total
OMH Service Level
by Gender1 1S 2 2S 3 4 6 7 Total*
Male 455 1,870 2,246 258 3,485 679 39,334 1,570 49,897
Female 72 155 482 39 433 75 1,173 14 2,443
Total 527 2,025 2,728 297 3,918 754 40,507 1,584 52,340
Male 0.9% 3.7% 4.5% 0.5% 7.0% 1.4% 78.8% 3.1% 100.0%
Female 2.9% 6.3% 19.7% 1.6% 17.7% 3.1% 48.0% 0.6% 100.0%
Total 1.0% 3.9% 5.2% 0.6% 7.5% 1.4% 77.4% 3.0% 100.0%
Offender Status
Inmates 523 2,022 2,695 297 3,832 736 40,057 1,578 51,740
Incarcerated Parolees 4 3 33 0 86 18 450 6 600
Total Under Custody 527 2,025 2,728 297 3,918 754 40,507 1,584 52,340
Inmates 1.0% 3.9% 5.2% 0.6% 7.4% 1.4% 77.4% 3.0% 100.0%
Incarcerated Parolees 0.7% 0.5% 5.5% 0.0% 14.3% 3.0% 75.0% 1.0% 100.0%
Total Under Custody 1.0% 3.9% 5.2% 0.6% 7.5% 1.4% 77.4% 3.0% 100.0%

Prepared by:
Kim Dworakowski Program Research Specialist II
Division of Program Planning, Research and Evaluation
April 2016