Under Armour: PEST and Industry Analysis Brian Teufel MGT 490-004 Assignment #2 Professor McDermott...
60
Under Armour: PEST and Industry Analysis Brian Teufel MGT 490-004 Assignment #2 Professor McDermott March 17, 2011
-
Upload
bathsheba-neal -
Category
Documents
-
view
222 -
download
0
Transcript of Under Armour: PEST and Industry Analysis Brian Teufel MGT 490-004 Assignment #2 Professor McDermott...

Under Armour:PEST and
Industry AnalysisBrian Teufel
MGT 490-004Assignment #2
Professor McDermottMarch 17, 2011

Kevin Plank, the CEO of Under Armour developed a blue ocean strategy
Created Performance Apparel market – enhances consumers performance while offering greater comfort
Total sales over $1.0 billion in 2010 First-mover advantage has allowed UA to gain
70% of the U.S. market and about 15% of the global market
Performance Apparel has evolved from niche to mainstream in terms of target market and competition (Nike and Adidas)
Under Armour Snapshot

Key Dependencies
Proof of Dependency Future Challenges
Innovation 1/4 of 3,900 employees in R&D
Ratio likely to decrease as UA branded stores continue to open
U.S. Market 95% of sales come from U.S.
International market development
Performance Apparel
85% of sales come from PA
Product development of non-PA products
International Subcontracting
Product suppliers mainly from Asia
Diversify supplier locations as costs and inflation increase in China
Retailers 2 retailers make up about 50% of sales
Brand development and franchising
Under Armour Snapshot (cont.)
Under Armour owns branded retail stores in 28 U.S. states (30+ stores) and 23 other countries (25+ stores). - First UA branded retail store opened on November 1, 2007.

Factor Trend Evaluation;O=OpportunityT=Threat
Impact (1=Low; 5=High)
Rank in terms of importance
Political - FDI policies T 2 -
Economic - Economic Recovery- Increase in cost of raw materials and resources; shipping costsi.e. cotton, all man made fibers, and the big one being OIL/GAS- Growth of performance apparel industry (Domestic and International)- Increase in interest rates - Inflation in China increasing- Chinese labor costs increasing
OT
O
TTT
35
5
233
-1
1
543
Social - Consumers focus on quality, not price- Aging population and increase in physically active seniors- Increase in physically active women- Consumers becoming more health conscious- Obesity rates in U.S.- Sport participation is a key aspect of U.S. culture- Increase in sports participation in emerging markets
OO
OO
TO
O
32
33
33
4
4-
--
25
2
Technological - Increase in e-commerce- Increase in m-commerce
OO
43
33
Pest Analysis• Opportunities and Threats are ranked in terms of importance separately; top five of each are ranked accordingly.(1 = extremely important, 5 = Not very important.

FDI Policies - Some foreign countries have policies in place that prohibit 100% ownership of retail stores which poses threat to internationalization
Chinese Labor Costs Increasing ◦ Costs of international labor is on the rise.◦ Hourly compensation costs of manufacturing employees in China from
2002-2008 is shown below.
Political Factor
Year National Currency Basis (Yuan)
U.S. Dollar Basis(U.S. $)
2002 4.74 .57
2003 5.17 .62
2004 5.50 .66
2005 5.95 .73
2006 6.44 .81
2007 8.06 1.06
2008 9.48 1.36
Economic Factors

Economic Factors (cont.)Factor Comment
U.S. and International Economic Recovery
Consumers have more disposable income
Growth of Performance Apparel industry
PA industry is on the rise and shows no signs of slowing down
Chinese Inflation Chinese inflation is on the rise and expected to continue to rise
Increase in Cost of Raw Materials/Resources
Cotton, Man-made fibers, are on the rise but GAS is the big factor
•The growth of the performance apparel industry is the greatest opportunity. •More Consumers = More Revenues

Obesity rates in U.S. show people not physically active
Consumers focus on quality more than price Increase in physically active women Increase in health conscious consumers = more
exercise/physical activity Sport participation is a key aspect of U.S. culture Aging population and increase in physically
active seniors Increase in sports participation in emerging
markets
Social Factors


Increase in e-commerce
Increase in m-commerce (trend is to always have digital connection)
Technological Factors

Opportunity Rank in terms of importance (1; least important, 5; most important)
Comments
Growth of the performance apparel industry (domestic and international)
1 Protect products and the industry
Increase in sports participation in emerging markets (foreign markets)
2 Marketing will be key
Increase in commerce (electronic and mobile)
3 Take advantage
Consumers focus on quality more than price
4 Innovation and Differentiation
Sport participation is a key aspect of U.S. culture
5 Sport participation will always be a key aspect of U.S. culture
PEST Summary

Threat Rank in terms of importance (1; most important, 5; least important)
Comments
Increase in cost of raw materials and resources, shipping costs
1 Buy in higher quantities; volume discounts
Obesity rates in U.S. 2 Marketing will be key
International labor costs increasing
3 Explore new options for production
Inflation in China increasing
4 Explore new options for production
Increase in interest rates 5 Keep debt as low as possible
PEST Summary

Under Armour is in the extremely competitive performance apparel industry which is defined as anything that is worn which enhances the performance of the user.
Performance apparel global sales = $6.4 billion in 2010 and is expected to grow to $7.6 billion by 2014.◦ In 4 years, the industry is expected to grow by 15%.
Industry Analysis Overview
Participants in the PA Industry
Buyers/Buyer Groups Physically active and want to enhance their performance, especially athletes. Groups include both domestic sports teams, international teams, and retailers
Suppliers/Supplier Groups Third Party Suppliers (100+)
Competitors Nike, Adidas, Columbia Sportswear
Substitutes Conventional apparel or no apparel
Potential Entrants Anyone is a possible entrant in this industry because of the high growth rates, especially organizations that produce apparel, sportswear, or equipment.

Porter’s 5 ForcesForce High/Moderate/Low Underlying Drivers
(Strong or Weak)
Threat of New Entrants
High Weak
Threat of Substitutes - Core Athletes = High
- Non-Core Athletes = Moderate
Strong
Bargaining Power of Buyers
- Athletes and Teams = High
- Non-Core Athletes = Moderate
Strong
Bargaining Power of Suppliers
Moderate Weak
Intensity of Rivalry High Strong

Threat of New Entrants - High
With the expected growth of the performance apparel industry, there will be new entrants in the industry from all over the world.
Most companies who enter the performance apparel industry are unable to compete due to existing brand loyalty and the high barriers to entry.◦ Examples include New Balance, Velocity, and
Sugoi

Substitutes are limited to conventional apparel or no apparel at all.
Core athletes have a large number of substitute options to choose from.
Threat of Substitutes – Moderate to High
Factor Under Armour
Lack of Direct Competition Exceptions include Nike and Adidas
PA not essential to participate in sports or physical activity
UA products enhance performance and allow comfort
Potential Substitute Products Low
Switching Costs Low

Buyer/Buyer Group
Bargaining Power
Comment
Core Athletes High Exposure to the public and builds relationshipsProfessional Teams
Non-Core Athletes Moderate - Limited competition and substitute products- UA’s products differentiated from competition- Consumers do not need performance apparel to compete or be physically active
Non-Professional Teams
Recreational Buyer
Bargaining Power of Buyers – Moderate to High
The bargaining power of buyers depends on the consumer’s skill level and the level of the team.

Factor Under Armour
Switching Supplier Costs Moderate
# of Different Suppliers Very High
Product Uniqueness Moderate
Third Party Suppliers Very High
Bargaining Power of Suppliers - Moderate
The use of third party suppliers allows performance apparel companies to chose their suppliers based on highest quality and lowest production cost.
Third party suppliers have high bargaining power by being able to choose the companies that they want to supply for.◦ The best third party suppliers can select the company or companies
that treat them the best and provide the best compensation.◦ There are thousands of third party suppliers all over the world.

Currently, the performance apparel industry is growing rapidly at 15%; this allows rivalry to grow rapidly as well.
There is a high # of competitors but UA, Nike, and Adidas make up the majority of the industry due to a quality advantage over other competitors.
Rivalry Intensity - HighFactor PA Industry
# of Competitors High
Brand Loyalty High
Industry Growth Rate Extremely High
Quality differences between competitors Moderate to High

Blue Ocean Strategy
InnovationDifferentiation
Enhance Performance
Niche R&D

The opportunities for the performance apparel industry outweigh the threats.◦ Labor and gas costs are increasing but opportunities such as the
global growth of the PA industry, global increase in sport participation, and increase in both e-commerce and m-commerce outweigh the threats.
Rivalry is extremely high in the performance apparel industry.◦ The competition between Nike, Adidas, and Under Armour is fierce
and it continues to heat up. Participants in the performance apparel industry must always
be aware of new entrants because the industry is on the rise.◦ Create high barriers to entry.
Blue Ocean Strategy was the basis for Under Armour and it allowed them to achieve success in the PA industry. ◦ Innovation, Differentiation, R&D, Creating Niche of performance
apparel that enhances performance while allowing comfort.
Conclusions

Under Armour:Competitor and Market Analysis
Brian TeufelMGT 490-004Assignment #2
Professor McDermottMarch 17, 2011

Key Competitors

Other Competitors

Company PA Sales (in millions)
Total Sales(in millions)
PA sales as % of total sales
% of sales spent on R&D
Under Armour $853 $1,060 81% 33%
Nike $1,300 $19,014 7% 12%
Adidas $1,150 $11,990 9% 5%
Columbia Sportswear Company
$400 $1,484 27% 1%
Sugoi $34 $85 40% 2%
PUMA $425 $2,862 15% 4%
Quiksilver $250 $1,834 14% 3%
North Face $300 $1,400 21% 3%
New Balance Private Company
Private Company
Private Company
Private Company
Performance Apparel Industry

• New Balance• Columbia Sportswear Company• Champion
• Nike• Adidas• Under Armour
• PUMA• The North Face• Quiksilver
Generic Strategy Competitive Advantage
Low Cost Differentiation
Competitive Scope
BroadTarget
Narrow Target

Price/QualityComparison
Price
Low High
Quality
Low
High
•Under Armour
•New Balance
•Columbia Sportswear Company
•Champion
•Nike•Adidas
•PUMA
•The North Face
•Quiksilver

Sales
U.S.Europe Asia/PacificRest of North America and South Amer-icaAfricaAustralia
64%
4%
9%
1%
Performance Apparel Industry Geographic Breakdown
20%
2%

Performance Apparel Geographic Growth Rates by Company
-UA = 23.5%-Nike = 8% -Adidas = 7%-Col. Sportswear = 22%-Quiksilver = (-9%)-PUMA = 22%
-UA = 0%-Nike = 20%-Adidas = 14%-Col. Sportswear = 10%-Quiksilver = (-9%)-PUMA = 22%
-UA = 0%-Nike = 20%-Adidas = 16%-Col. Sportswear = 13%-Quiksilver = N/A-PUMA = -3%
-UA =5%-Nike = 0%-Adidas = 2%-Col. Sportswear = 30%-Quiksilver = 4%-PUMA = (-2&)
-UA = 4%-Nike = (-6%) -Adidas = 7%-Col. Sportswear = 13%-Quiksilver = (-8%)-PUMA = (-3%)

Company Core Competence/Competencies
Core Competencies -Weak/Moderate/Strong
Under Armour Innovation, Quality, R&D Strong
Nike Inspiration, Innovation, Brand Image/Loyalty
Strong
Adidas Innovation, Technology, Sustainability
Strong
Columbia Sportswear Company
Distribution, Outerwear Moderate
Sugoi Quality, Bicycle-wear Moderate
PUMA Sustainability, Value, International Football
Moderate
Quiksilver Surfwear, Quality Moderate
North Face Innovation, OuterwearEnvironmental Awareness
Moderate
New Balance Footwear, Innovation, Customer Service
Weak
Champion Comfort, Quality Weak
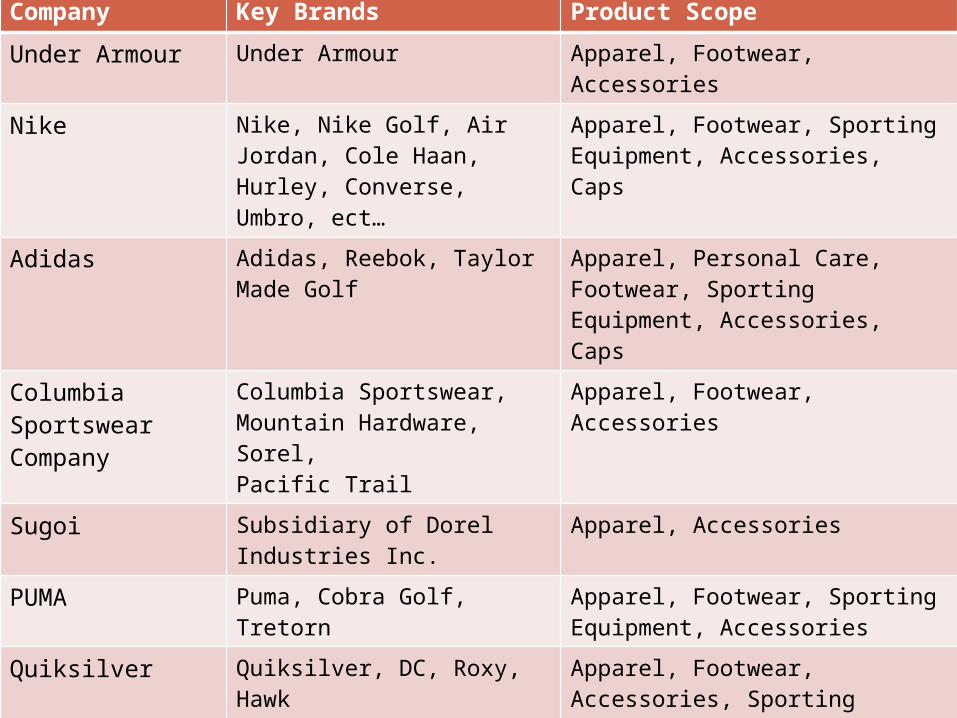
Company Key Brands Product Scope
Under Armour Under Armour Apparel, Footwear, Accessories
Nike Nike, Nike Golf, Air Jordan, Cole Haan, Hurley, Converse, Umbro, ect…
Apparel, Footwear, Sporting Equipment, Accessories, Caps
Adidas Adidas, Reebok, Taylor Made Golf
Apparel, Personal Care, Footwear, Sporting Equipment, Accessories, Caps
Columbia Sportswear Company
Columbia Sportswear, Mountain Hardware, Sorel,Pacific Trail
Apparel, Footwear, Accessories
Sugoi Subsidiary of Dorel Industries Inc.
Apparel, Accessories
PUMA Puma, Cobra Golf, Tretorn Apparel, Footwear, Sporting Equipment, Accessories
Quiksilver Quiksilver, DC, Roxy, Hawk Apparel, Footwear, Accessories, Sporting Equipment
North Face Subsidiary of VF Corporation
Apparel, Sporting Equipment, Camping Equipment, Accessories
New Balance New Balance, Dunham, Aravon, Warrior, Brine
Apparel, Footwear, Accessories
Champion Subsidiary of Hanes brands Apparel, Footwear, Accessories

Company Target Market Market Power(Low/Moderate/High)
Under Armour Male and female, anyone who wants to enhance performance and comfort
High
Nike Male and female, ages 18-35, physically active, athletes
High
Adidas Male and female, physically active, athletes
Moderate
Columbia Sportswear
Male and female, physically active, loves outdoor activities
Moderate
Sugoi Male and Female, physically active,loves biking and running
Low
PUMA Male and Female, physically active,loves soccer (international football)
Moderate
Quiksilver Male and female, young adult (ages 15-35), love warm weather activities (surfing/skating)
Low
North Face Male and female, young adult (ages 16-35), love cold weather activity
Low
New Balance Male and female, older adults (ages 35+), love walking/running
Low
Champion Male and female, hard working, physically active, all ages
Low

Performance Apparel is defined as anything that is worn which enhances the performance of the user.
New and existing companies are attempting to break into the PA industry every day due to the rapid growth.
The top three companies in the global PA industry include Nike, Adidas, and Under Armour
Gross sales come from company owned stores and third party retailers.
Sell products of quality which enhance performance while providing comfort to the user.
Performance Apparel Industry Defined

2002 2006 2010 20140
1
2
3
4
5
6
7
8
2.83.3
6.4
7.6
Global Performance Apparel Sales ($ bil-lions)
Global Performance Apparel Sales ($ bil-lions)Linear (Global Per-formance Apparel Sales ($ billions))
18% Inc.
Market Analysis
• The Performance Apparel industry has grownrapidly in the past four years and it is expected to continue to grow rapidly the next four years.
52% Inc. 15% Inc.

Performance Apparel Growth Rates
15% 22%9%
4%
2%
7%

Trend Opportunity/Threat
Comment
Sales increase (15%+) Opportunity Will continue to grow
Quality over price Opportunity Consumers want value for their money
Increase in technological innovation
Opportunity Compression apparel is currently the big thing in PA
People becoming more physically active
Opportunity Market to entire market, not particular segments
Increase in cost of raw materials/resources
Threat Find ways to negate such costs
Eco-friendly design Opportunity More consumers will buy product and feel they are helping the environment
Fashion friendly Opportunity Consumers feel better when wearing something fashionable (esp. women)
New competitors entering market
Threat Create high barriers to entry and superior product
Moving towards all ages (older generation)
Opportunity Market to entire market, not particular segments
Key Trends in PA

Company
Corporate Social Responsibility
Mission Statement
Marketing Vision/Strategy
Under Armour
Innovation, Inspiration, Reliability, and Integrity
Make all athletes better through passion, science, and the relentless pursuit of innovation
-Athlete Endorsements-Commercials/Slogans (“Click clack” and “We must protect this house”)-Event and team sponsorships
Be the world’s #1 performance athletic brand
Nike Sustainability, Innovation, Quality
Bring inspiration and innovation to every athlete in the world.
-Brand Image-Brand promotion-Athlete and team sponsorships
Experience the emotions of winning and crushing the competition.
Adidas Sustainability, Innovation, Environmental Awareness
Strive to be the global leader in the sporting goods industry with sports brands built on a passion for sports and a sporting lifestyle
-Brand Image-Focus on international marketing-Athlete and team sponsorships
Enhance social and env. performance in the company and the supply chain, thereby improving the lives of the people making our products.
Strategic Layout of Competition

Company Corporate Social Responsibility
Mission Statement
Marketing Vision/Strategy
Columbia Sportswear
Responsible business practices balancing economic goals with social and environmental considerations
Provide consumers the greatest quality outdoor gear while keeping them safe
-Increase on-line marketing -Stick to what we know and show consumers advantage of products
Continue to internationalize and provide high quality products to outdoor enthusiasts
Sugoi Innovation, Excellence, Value
Make excellent performance athletic wear for bikers and various other activities
_Increase global awareness of brand_Prove quality and uniqueness to consumers
Every garment that carries the Sugoi name is still designed, developed, and made in Vancouver, Canada
PUMA Sustainability, work towards a more eco-friendly world, global peace, Quality
Stay true to our values; inspire the passion and talent of our people working in sustainable, innovative ways, and do our best to be Fair, Honest, Positive, and Creative
-Sponsor international football and cricket players and teams-Increase presence in other markets
PUMAvision- create a safer, more peaceful, and more creative world than we know today
Strategic Layout of Competition

Company Corporate Social Responsibility
Mission Statement
Marketing Vision/Strategy
Quiksilver Touch people worldwide and improve quality of life, quality
Become the leading global youth apparel company
Focus is social media
Maintain our core focus and roots while bringing our lifestyle message of board riding, independence, creativity and innovation to this global community
North Face
Send famous athletes overseas and give back as much as they can; innovation; consumer-focused
Never stop exploring -Goal is to increase brand awareness-Social marketing
Our passion is beyond setting records and achieving fame, it's all about changing our lives and those people who inspire us to aim for extraordinary dreams
New Balance
New Balance Foundation; Make consumers value worth their money
Demonstrating responsible leadership, we build global brands that athletes are proud to wear, associates are proud to create and communities are proud to host
-Word of mouth-Athlete sponsorships
Continue to give back to all communities and provide excellent products to excellent consumers
Champion Ethical business practices, protect environment, quality
Anticipate what consumers want and innovate to meet those needs in comfort, fit, and value
-Social media-Athlete endorsements
world-class consumer goods company with a distinctive competence in operating a low-cost global supply chain
Strategic Layout of Competition

Social media has impacted the PA industry positively, increase in sales due to easier communication between consumers.
Consumers can give feedback (+ and -) in a relaxed environment.
Consumers can also socialize with other consumers to discuss PA products.
Marketing has been most effected by social media with sites such as Facebook, Twitter, Foursquare, and LinkedIn. ◦ PA companies can market to larger groups of
consumers at a much cheaper cost.
Social Media Importance

Nike and Adidas are Under Armour’s primary competition in the performance apparel industry.
Nike and Adidas have jumped UA in total PA sales even though PA accounts for only 7% of Nike’s and 9% of Adidas’s total turnover.
Under Armour would be the global leader in performance apparel sales if they were as successful internationally as they currently are in the U.S.
Asia and North America are fueling growth in the performance apparel industry with Europe also growing.
The performance apparel market is growing at a rate of higher than 15% and it is expected to continue to increase for the for seeable future.
Conclusions

Under Armour:Internal Analysis, SWOT Analysis,
Competitive Position, and Conclusions/Recommendations
Brian TeufelMGT 490-004Assignment #3
Professor McDermottMarch 17, 2011

Year PA Sales(in millions)
Total Sales (in millions)
Net Income from PA(in millions)
Total Net Income(in millions)
% of Net Income from PA
2006 $373 $431 $32.4 $39 83%
2007 $513 $607 $40.5 $52.6 77%
2008 $579 $725 $31.5 $38.2 82%
2009 $652 $856 $38.2 $46.8 82%
2010 $853 $1,064 $55.1 $68.5 80%
Under Armour’s Performance
• Under Armour’s PA sales and net income have increased every year since 2006.

2006 2007 2008 2009 2010$0.00
$200.00
$400.00
$600.00
$800.00
$1,000.00
$1,200.00
Licensed RevenueAccessoriesFootwearPerformance Apparel
Under Armour’s Performance
• On average, around 80% of Under Armour’s net income comes from PA.

Year PA % inc.% dec.
Footwear
% inc.% dec.
Access-ories
% inc.% dec.
Licensed Revenue
% inc.% dec.
Total Sales
% inc.% dec.
2006
$373.2 - $26.9 - $14.9 - $16 - $430.7 -
2007
$513.6 27% $40.9 34% $29.1 49% $24 33% $606.6 29%
2008
$578.9 11% $84.8 52% $31.5 8% $30 20% $725.2 16%
2009
$651.8 11% $136.2 38% $35.1 10% $33.3 10% $856.4 15%
2010
$853.5 24% $127.2 (7%) $43.9 20% $39.4 15% $1,063 19%
Change in Sales by Product• All $ amounts are in millions
• Footwear sales increased every year from 2006-2009 but decreased by 7% in 2010.• PA and accessories sales have increased every year; PA had a huge increase of 24% from 2009 to 2010.

Year N.A. Sales(in millions)
% inc.% dec.
% of Total Sales
Foreign Sales
% inc.% dec.
% of Total Sales
2006 $415 - 100% $0 - 0%
2007 $582.5 29% 100% $0 N/A 0%
2008 $692.4 16% 95% $32.9 100% 5%
2009 $808 14% 93% $48.4 32% 7%
2010 $997.8 19% 91% $66.1 27% 9%
Change in Distribution of Sales by Region
• International sales have increased every year since 2008 but UA is still heavily reliable on North America for about 90% of their total sales.

30%
15%32%
11%
12%
Asset DistributionCash and Cash Equiva-lents
Accounts Receivable
Inventories
Property and Equipment
Other
Under Armour’s Assets
Asset $ in Millions
Cash and Cash Equivalent $203.870
A/R $102.034
Inventories $215.355
Property and Equipment $76.127
Other $77.992
Total Assets $675.378

2200; 56%600; 15%
900; 23%
200; 5%
Factory House and Specialty StoresDistribution FacilitiesResearch and De-velopmentOther
Employee Distribution
# of Employees, % of Total Employees
• Under Armour has a total of 3,900 employees.• Factory House and Specialty Stores employees are increasing rapidly because UA is opening more branded stores.• Almost ¼ of UA’s employees are devoted to research and development.

Strength Impact (1=Low; 5=High)
Brand Loyalty 4Brand Equity 5Core competence in Innovation 5High Quality Apparel 4Increase in Sales Every Year 3Wide Range of Apparel 3Athlete and Team Sponsorships and Endorsements 3Very Intelligent and Efficient R&D Team 4
SWOT Analysis – Strengths and Weaknesses
Weakness Impact
Small Total Sales and Net Income compared to Nike and Adidas 4
Heavily Dependent on Domestic Market; Small International Presence 5
High Prices 3
Not a Synergistic Marketing Campaign 3
Heavily Dependent on PA for Sales (80%+) 4
Target Male Market more than Female Market 2
27% of Sales come from 2 Distributors; Dick’s and The Sporting Authority 4

Opportunity Impact (1=Low; 5=High)
Economic Recovery 3Growth of PA Industry (Domestic and International) 5Consumers focus on Quality, not Price 3Aging population and increase in physically active seniors 2Increase in physically active women 3Consumers becoming more health conscious 3Sport participation is a key aspect of U.S. culture 3Increase in sports participation in emerging markets 4Increase in e-commerce and m-commerce 4
SWOT Analysis – Opportunities and Threats
Threat Impact
FDI Policies 2
Increase in cost of raw materials and resources; shipping costsi.e. cotton, all man made fibers, and the big one being OIL/GAS
5
Inflation in China Increasing 3
Chinese Labor Costs Increasing 3
Obesity Rates in U.S. 3

Rank in respect to entire SWOT Analysis
Factor S/W/O/T
1 Core Competence in Innovation S
2 Increase in cost of Raw Materials, Resources, and Shipping Costs . . . OIL/GAS!!!!
T
3 Brand Equity S
4 Heavily Dependent on U.S. Market; Small International Presence
W
5 Growth of PA Industry O
6 27% of Sales come from 2 Distributors W
7 Heavily Dependent on U.S. Market for PA Sales
W
8 High Quality Products S
9 Increase in Sports Participation in Emerging Markets
O
10 Increase in Electronic and Mobile Commerce O
SWOT Analysis - Summary

Moving Here
Started Here
Generic Strategy Competitive Advantage
Low Cost Differentiation
Competitive Scope
BroadTarget
Narrow Target
• UA is moving from niche to mainstream in an attempt to compete with Nike and Adidas on other product lines (footwear and accessories) other than performance apparel.

Star Question Mark
Cash Cow Dog
Product BCG Matrix
Market Share
High Low
Market Growth
High
Low
•Performance Apparel
•Footwear
•Accessories

Value Chain• UA creates value for the consumers and gains its competitive advantage against the competition primarily through technology development.
• Innovation is what made UA what it is today, and Innovation is the key for future success.

Support Activities Weak/Moderate/Strong
Under Armour
Firm Infrastructure Strong UA is structured very well and has great company culture
Human Resources Management
Moderate UA is limited by only having 3,900 employees but they hire and train very well
Technology Development, Engineering
Very Strong Innovating and producing technologically advanced products is what UA does
Procurement Moderate Third Party
Value Chain AnalysisPrimary Activities Weak/Moderate/
StrongUnder Armour
Inbound Logistics Moderate Third Party
Operations/Manufacturing
Moderate Third Party
Outbound Logistics Moderate Third Party
Marketing and Sales Moderate Currently, UA has many sponsorships and endorsements but no synergy in marketing plan
After-Sale Service Strong UA has great reputation for customer service and after-sale service

Component Comment
Innovation UA is extremely reliant on producing innovative products that will continue to impress their consumers and hold on to high brand equity and brand loyalty
Market Development UA is really focused on selling their products to emerging markets; 90%+ of UA’s products are sold in the U.S.
Market Penetration UA would love to improve their market share in the U.S. for PA and improve their footwear and accessories sales as well
Product Development UA is devoted to continue to introduce new products to the U.S. and also other emerging markets around the world
Research and Development
UA plans on continuing to produce new and technologically advanced products which are superior to the competition
Grand Strategy

Strategy Products, Market
Under Armour
Market Penetration Existing Products, Existing Market
Very Strong Existing products are high quality and UA holds majority of existing market (U.S.)- Continue increasing U.S. market share
Market Development Existing Products, New Market
Strong Existing products are high quality but UA needs to increase market share in international and emerging markets
Product Development
New Products, Existing Market
Very Strong All new products are technologically advanced from previous products-U.S. market receives new products extremely well (Loves Innovation)
Diversification New Products, New Market
Weak Very difficult to introduce new products into new markets without having a decent market share of existing products
Ansoff’s Matrix

Existing Products New Products
Existing Market 2 3New Market 4 1
Ansoff’s Matrix (cont.)1 = Lowest Level of Effort4 = Highest Level of Effort
Market Penetration
Market Development
Product Development
Diversification
• UA is focused on all of these strategies but they must prioritize according to what will achieve them the greatest amount of success and what will put them in the best position to grow in the future.

Domestic Sponsorships/Endorsements
International Sponsorships/Endorsements
Sponsorships/Endorsements
Athlete/Team Association/Sport Type of Deal
All Teams NFL Official supplier of Footwear
Auburn, Boston College, Maryland
NCAA Official Outfitter
Brandon Jennings NBA Endorsement
Lindsey Vonn Skiing Endorsement
Tom Brady NFL Endorsement
Michael Phelps Swimming Endorsement
Hunter Mahan PGA Endorsement
Cam Newton NCAA/NFL Endorsement
Athlete/Team Association/Sport Type of Deal
Tottenham Champions League PA and Accessories Provider
Hockey Canada National Team Official Outfitter
Hanover 96 Bundesliga PA and Accessories Provider
All Teams Welsh Rugby Union PA and Accessories Provider

PA sales and overall sales have increased every year since Under Armour has been founded.
PA sales account for more than 80% of total sales. International sales account for less than 10% of sales
but they have been increasing slightly since 2008. Under Armour is attempting to make a push into
international and emerging markets. The two main strengths for Under Armour are its core
competence in innovation and its brand equity. UA is moving from niche to mainstream in an attempt to
compete with Nike and Adidas on other product lines (footwear and accessories) other than performance apparel.
Conclusions

Under Armour’s primary focus should be to increase their U.S. market share in other products such as footwear and accessories while maintaining market leadership in PA.
Under Armour should move into international and emerging markets with caution to assure they do not expand too quickly.
Under Armour needs to continue to provide value to consumers through innovation and research and development.
Under Armour needs to integrate their marketing plan and make sure than all sponsorships and endorsements contribute to the value of the brand.
Recommendations