Uncovering geospatial patterns of drought tolerance in Mimulus aurantiacus Nneka Nnatubeugo Bowdoin...
17
patterns of drought tolerance in Mimulus aurantiacus Nneka Nnatubeugo Bowdoin College University of Oregon – Summer Program for Undergraduate Research Mentor: Dr. James Sobel PI: Dr. Matthew Streisfeld Funded by the National Science Foundation
-
Upload
ellen-nicholson -
Category
Documents
-
view
220 -
download
0
Transcript of Uncovering geospatial patterns of drought tolerance in Mimulus aurantiacus Nneka Nnatubeugo Bowdoin...

Uncovering geospatial patterns of drought tolerance in Mimulus aurantiacus
Nneka NnatubeugoBowdoin College
University of Oregon – Summer Program for Undergraduate Research
Mentor: Dr. James Sobel
PI: Dr. Matthew StreisfeldFunded by the National Science Foundation
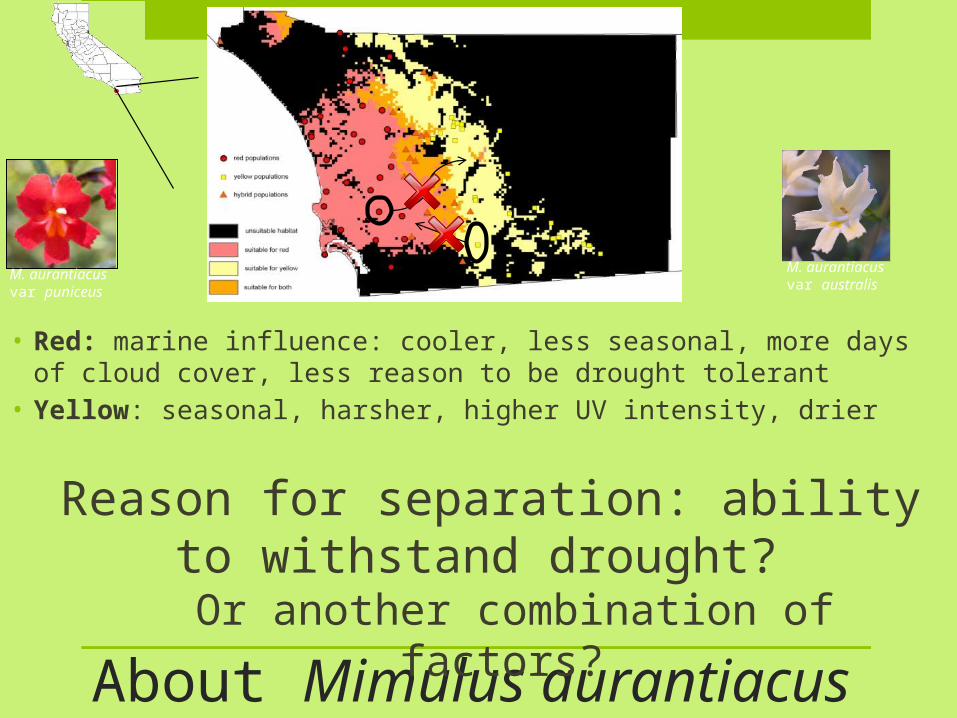
About Mimulus aurantiacus
• Red: marine influence: cooler, less seasonal, more days of cloud cover, less reason to be drought tolerant
• Yellow: seasonal, harsher, higher UV intensity, drier
M. aurantiacus var puniceus
M. aurantiacus var australis
Reason for separation: ability to withstand drought?
Or another combination of factors?
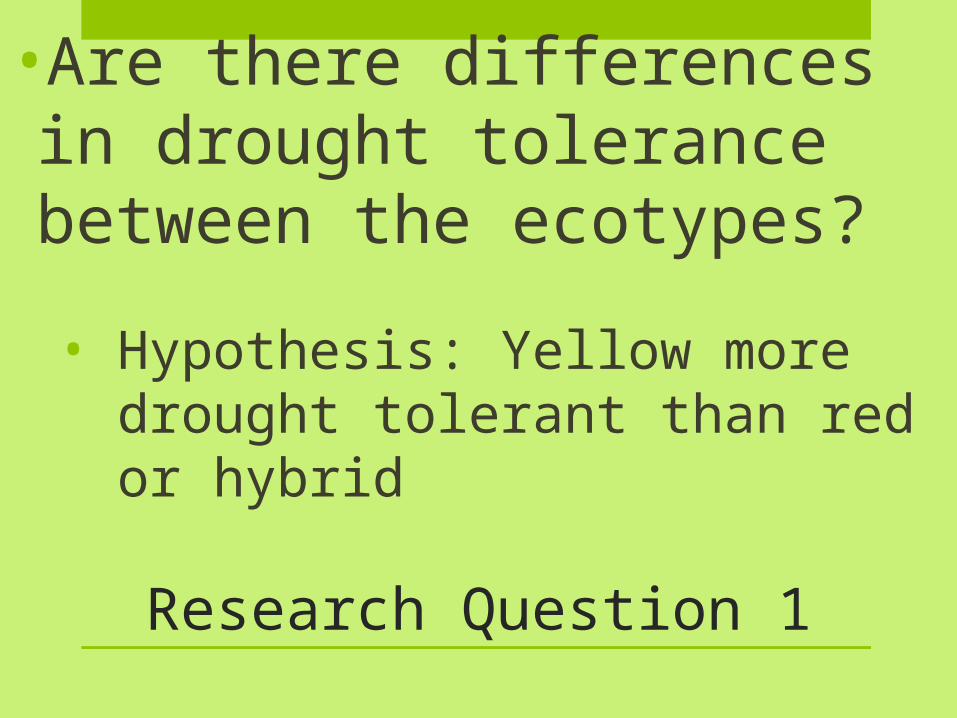
Research Question 1
•Are there differences in drought tolerance between the ecotypes?
• Hypothesis: Yellow more drought tolerant than red or hybrid

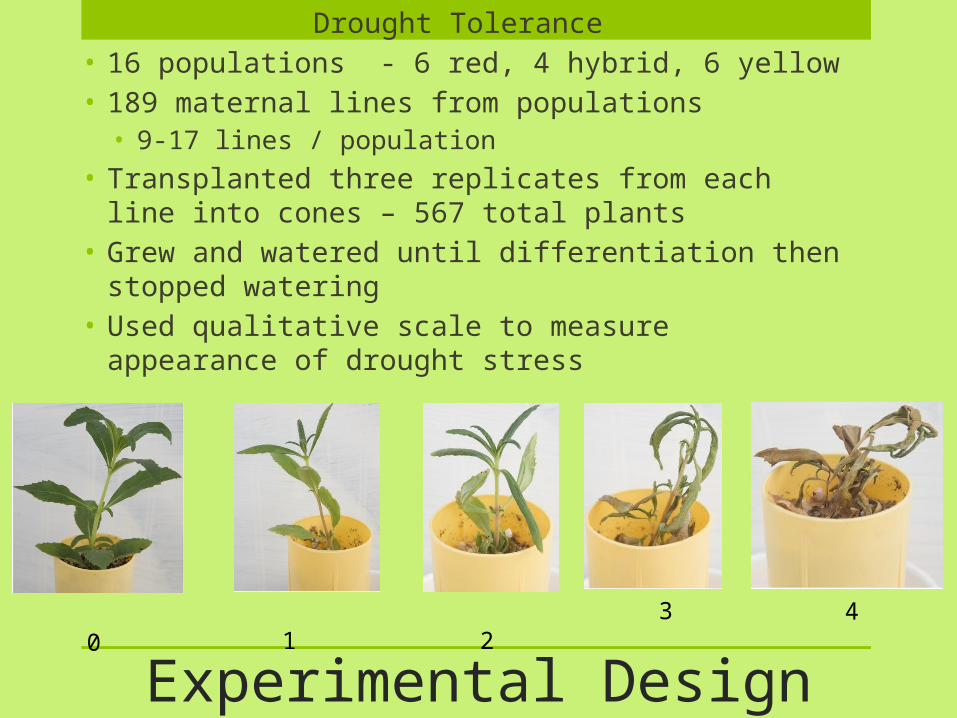
Experimental Design
Drought Tolerance • 16 populations - 6 red, 4 hybrid, 6 yellow • 189 maternal lines from populations• 9-17 lines / population
• Transplanted three replicates from each line into cones – 567 total plants
• Grew and watered until differentiation then stopped watering
• Used qualitative scale to measure appearance of drought stress
4 0 1 2 3
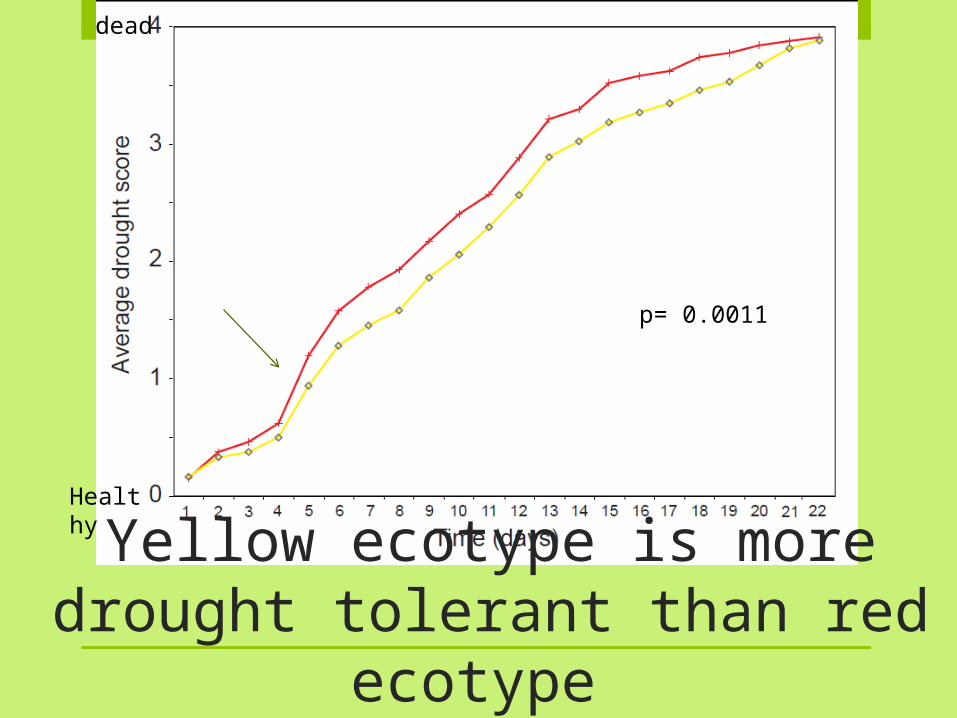
p= 0.0011
Yellow ecotype is more drought tolerant than red ecotype
dead
Healthy
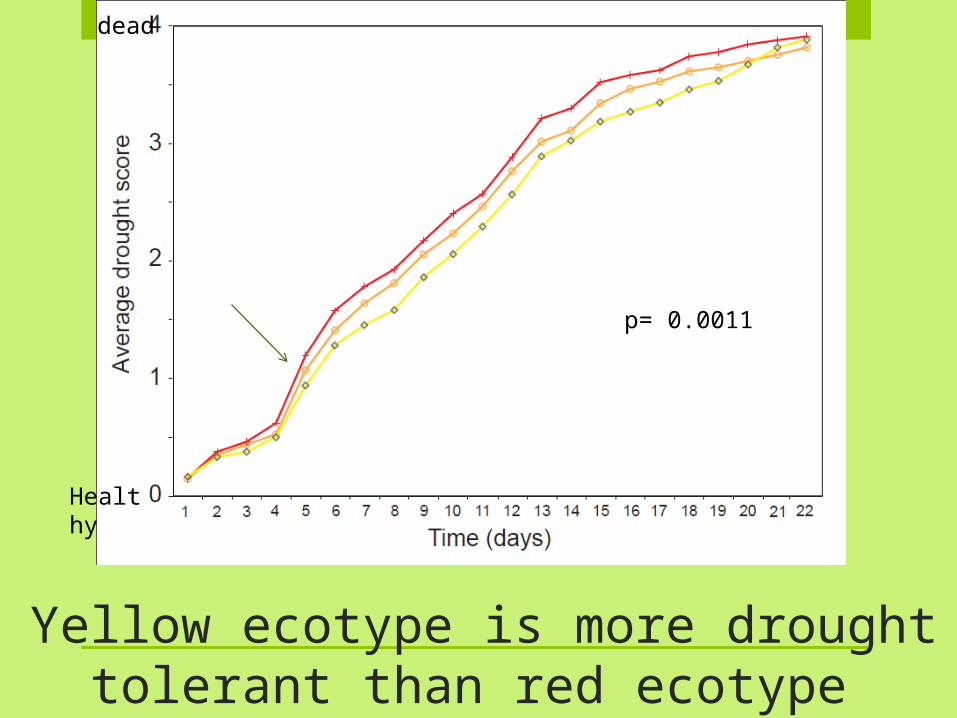
Yellow ecotype is more drought tolerant than red ecotype
p= 0.0011
dead
Healthy

Research Question 2
•Which traits contribute to differences in drought tolerance? •Leaf Area, Resin, Anthocyanin
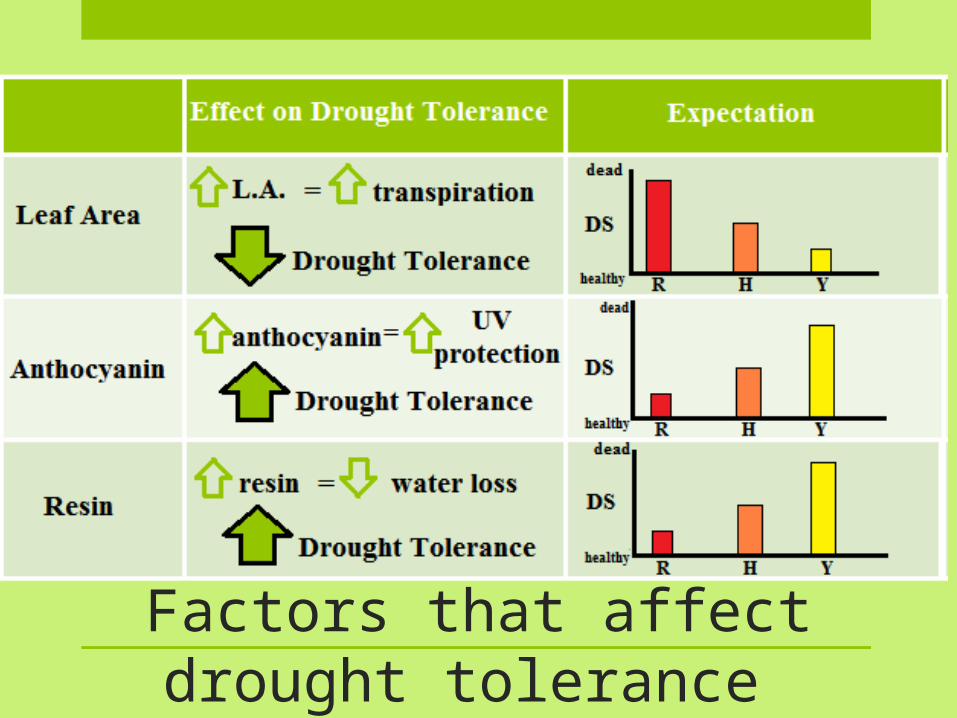
Factors that affect drought tolerance

Experimental Design
• Resin & Anthocyanin • Transplanted 2 plants per line into 2 ¾
inch pots • Grown for 1.5 months and then sampled:• Extracted resins and anthocyanin from
leaves • Analyzed concentrations of resin and
anthocyanin via UV spectrophotometry
• Leaf Area• Used program ImageJ to quantify
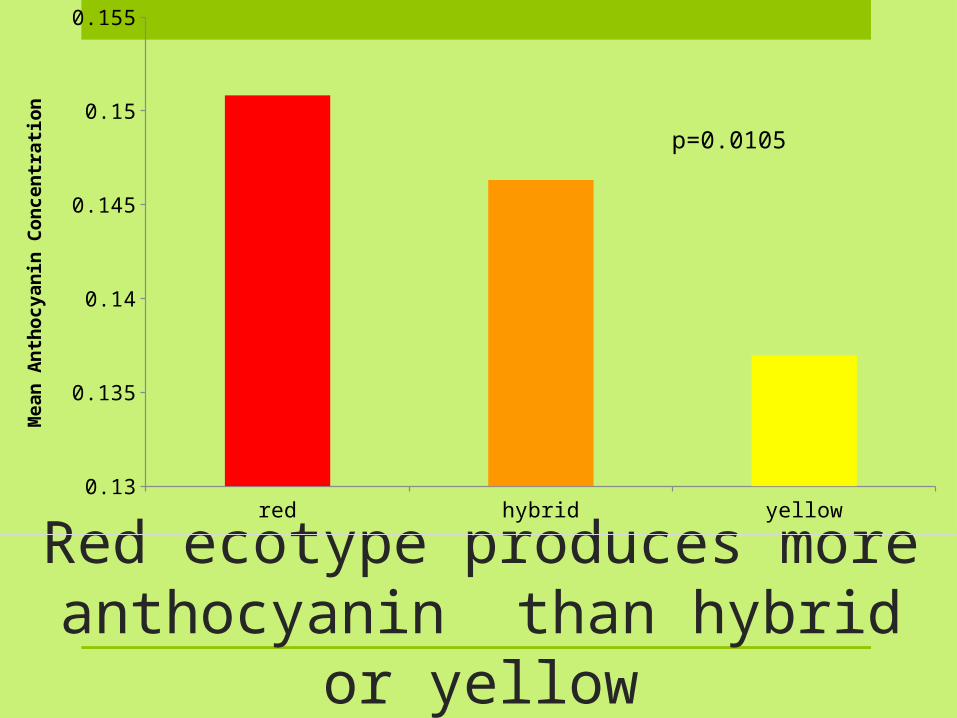
Red ecotype produces more anthocyanin than hybrid or
yellow
p=0.0105
red hybrid yellow0.13
0.135
0.14
0.145
0.15
0.155M
ean
An
thoc
yan
in C
once
ntr
atio
n
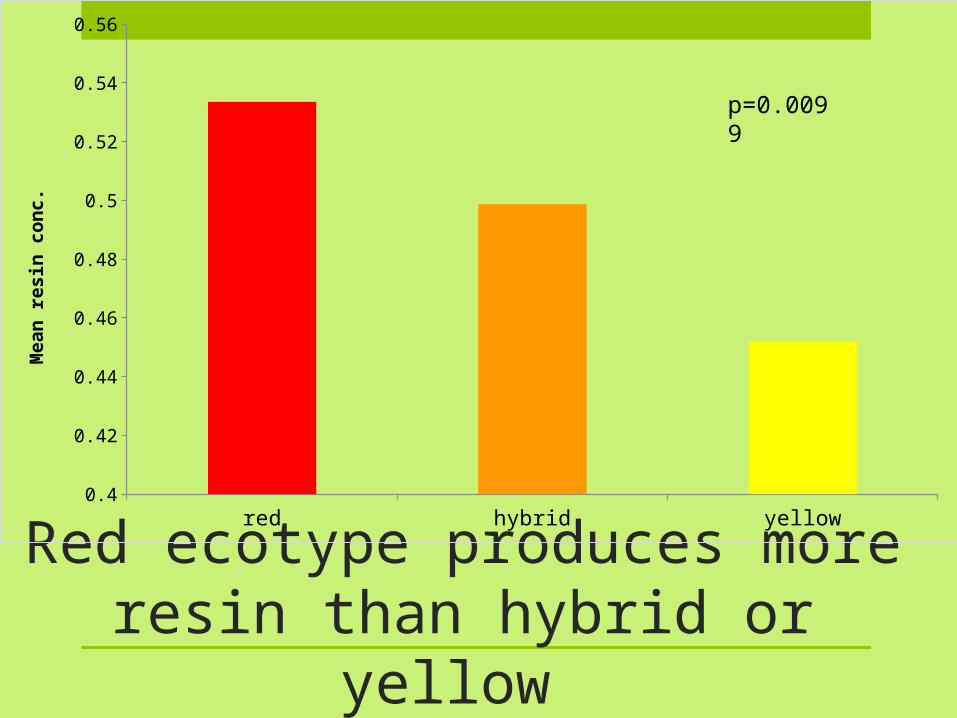
Red ecotype produces more resin than hybrid or yellow
p=0.0099
red hybrid yellow0.4
0.42
0.44
0.46
0.48
0.5
0.52
0.54
0.56M
ean
res
in c
onc.

Red ecotype has greater leaf area than hybrid or yellow
p= 0.0055
red hybrid yellow0
2
4
6
8
10
12
14M
ean
Lea
f ar
ea

Plants with greatest leaf area die fastest
DAY 4
DAY 5 DAY 6 p=0.2838; R2= 0.00614 p<0.0001; R2=0.11 p<0.0001; R2= 0.154848
dying
dying
dying
alive
alive
alive

• Yellow ecotype more drought tolerant than red ecotype
• The largest percent of variation in drought tolerance is explained by leaf area
Future Directions
• Measure vegetative anthocyanin and resin when the plants are stressed to see how the concentrations compare with the unstressed concentrations• Measure drought and correct for the effect
of leaf area in order to see how much of an impact ecotype has on the drought assessment

Acknowledgements
• Streisfeld Lab:• Matt Streisfeld• Jay Sobel• Josh Bahr
• SPUR:• Peter O’Day• Adam Unger• Fellow SPUR interns