Uncovering Anomalous Usage of Medical Records via Social Network Analysis You Chen, Ph.D. Biomedical...
44
Uncovering Anomalous Usage of Medical Records via Social Network Analysis You Chen, Ph.D. Biomedical Informatics Dept., School of Medicine EECS Dept., School of Engineering November 2, 2011 TRUST Autumn 2011 Conference (Joint work with Bradley Malin, Steve Nyemba, and Wen Zhang)
-
Upload
alfred-black -
Category
Documents
-
view
215 -
download
0
Transcript of Uncovering Anomalous Usage of Medical Records via Social Network Analysis You Chen, Ph.D. Biomedical...

Uncovering Anomalous Usage of Medical Records via Social Network Analysis
You Chen, Ph.D.Biomedical Informatics Dept., School of Medicine
EECS Dept., School of EngineeringNovember 2, 2011
TRUST Autumn 2011 Conference
(Joint work with Bradley Malin, Steve Nyemba, and Wen Zhang)
© You Chen, 2011 2Anomalous Usage

© You Chen, 2011 3Anomalous Usage

4
Two Typical Attacks
Anomalous users
Anomalous Access
(1) Anomalous users detection–user level
ab a
c(2) Anomalous accesses detection–access level
Intruders have little knowledge of thesystem and the anticipated behavior
Intruders have complete knowledgeof the system and its policies
© You Chen, 2011 5
Machine Learning
Case-Based
Reasoning
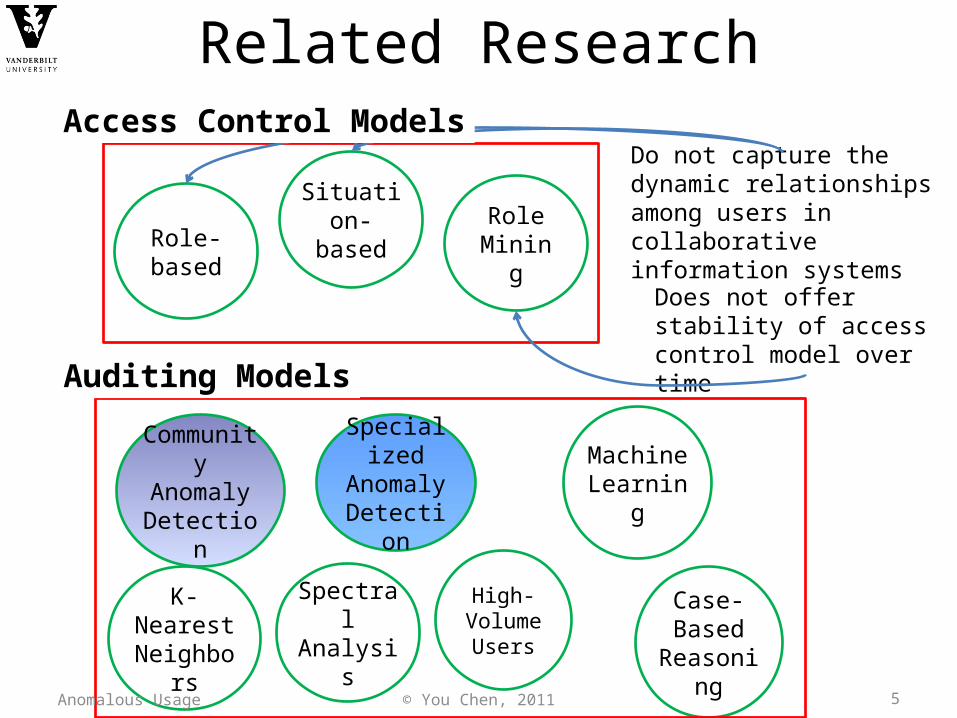
Role-based
Role Mining
Situation-based
Community Anomaly Detection
K-Nearest Neighbors
Spectral Analysis
Specialized Anomaly Detection
Do not capture the dynamic relationships among users in collaborative information systems
Does not offer stability of access control model over time
High-Volume Users
Anomalous Usage
Access Control Models
Auditing Models
Related Research
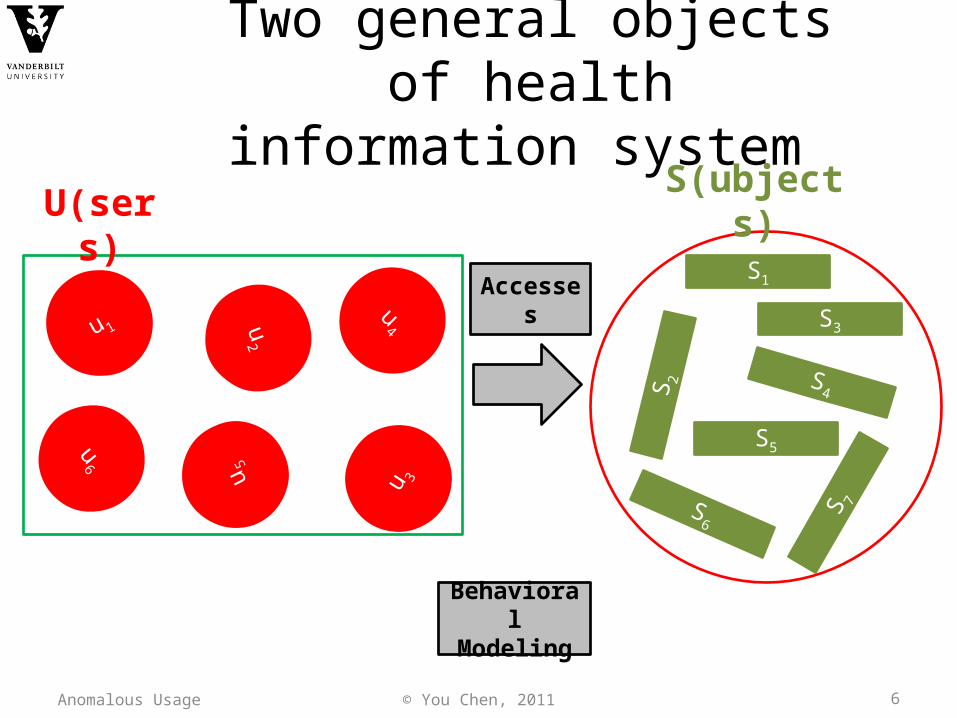
© You Chen, 2011 6
S3
S 2
S5
S4
S1
S6
S 7
u 1
u6 u5
u2
u4
u 3
Behavioral Modeling
S(ubjects)U(sers)
Accesses
Anomalous Usage
Two general objects of health information system
© You Chen, 2011 7
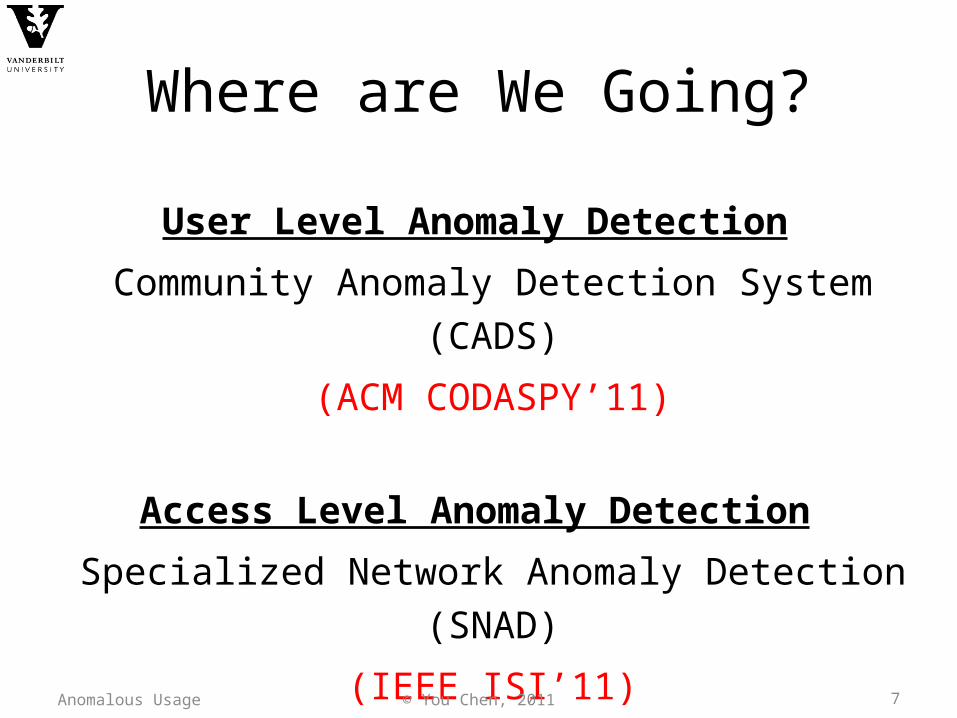
Where are We Going?
User Level Anomaly Detection
Community Anomaly Detection System (CADS)
(ACM CODASPY’11)
Access Level Anomaly Detection
Specialized Network Anomaly Detection (SNAD)
(IEEE ISI’11)
Anomalous Usage

© You Chen, 2011 8
Social Networks are a Novel Approach to Discovery of Electronic Medical Record Misuse
SNAD: A Local view of the network
CADS: Leverages a global view of the network
Anomalous Usage
© You Chen, 2011 9
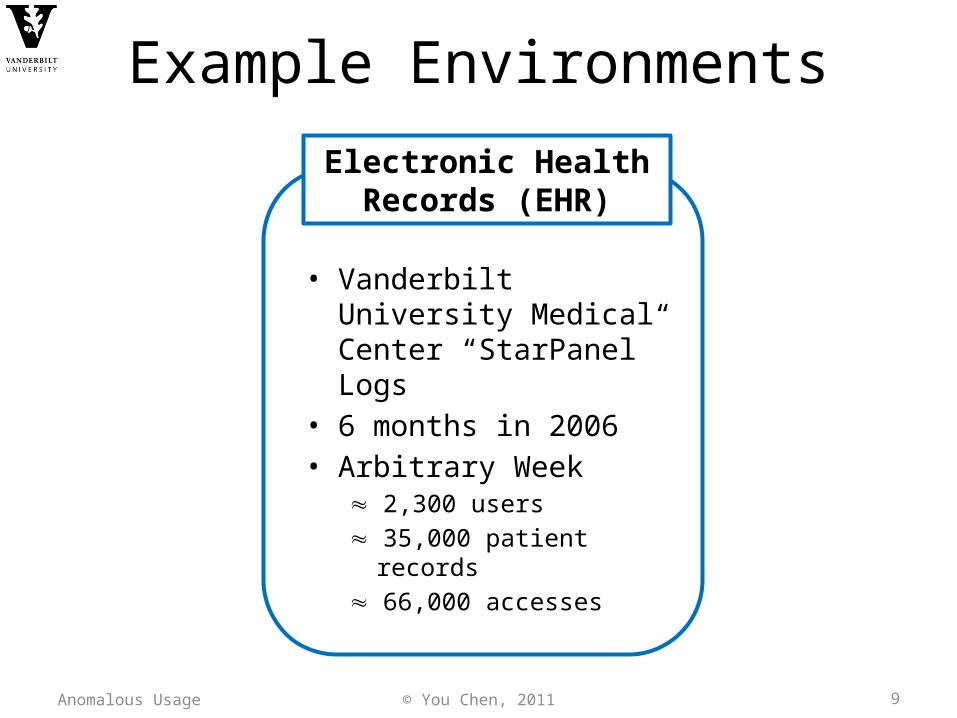
Example Environments
Electronic Health Records (EHR)
• Vanderbilt University Medical Center “StarPanel” Logs
• 6 months in 2006• Arbitrary Week
2,300 users 35,000 patient records 66,000 accesses
Anomalous Usage
© You Chen, 2011 10
Where are We Going?
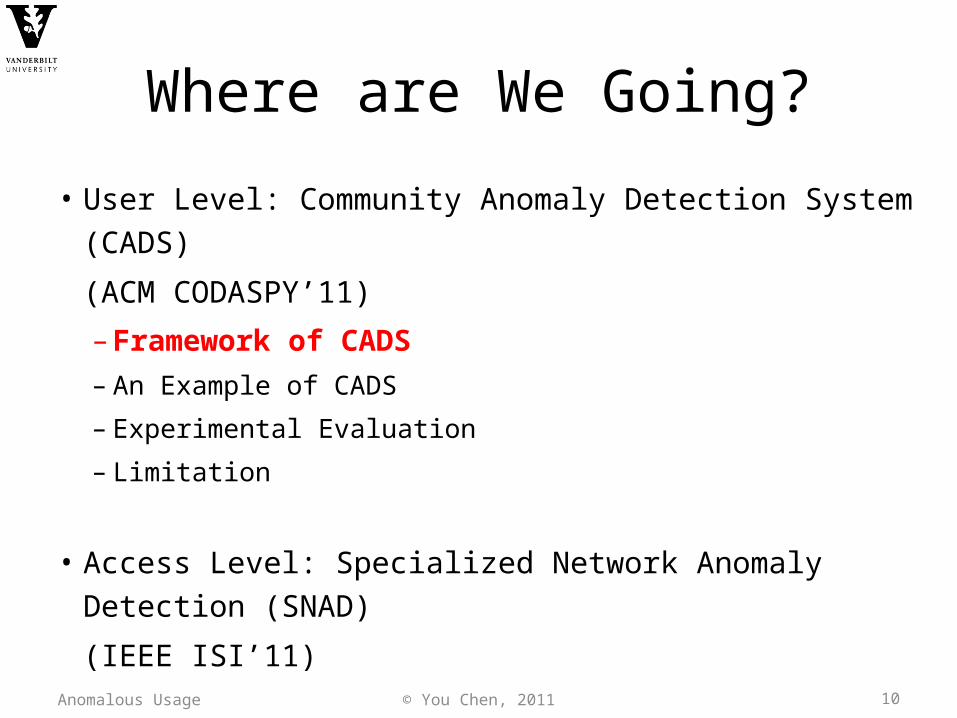
• User Level: Community Anomaly Detection System (CADS)
(ACM CODASPY’11)
– Framework of CADS– An Example of CADS
– Experimental Evaluation
– Limitation
• Access Level: Specialized Network Anomaly Detection (SNAD)
(IEEE ISI’11)Anomalous Usage

© You Chen, 2011 11
Community-Based Anomaly Detection (CADS)
<user, subject, time>
Communities of users
Nearest neighbor networks

© You Chen, 2011 12
Where are We Going?
• User Level: Community Anomaly Detection System (CADS)
(ACM CODASPY’11)
– Framework of CADS
– An Example of CADS– Experimental Evaluation
– Limitation
• Access Level: Specialized Network Anomaly Detection (SNAD)
(IEEE ISI’11)Anomalous Usage
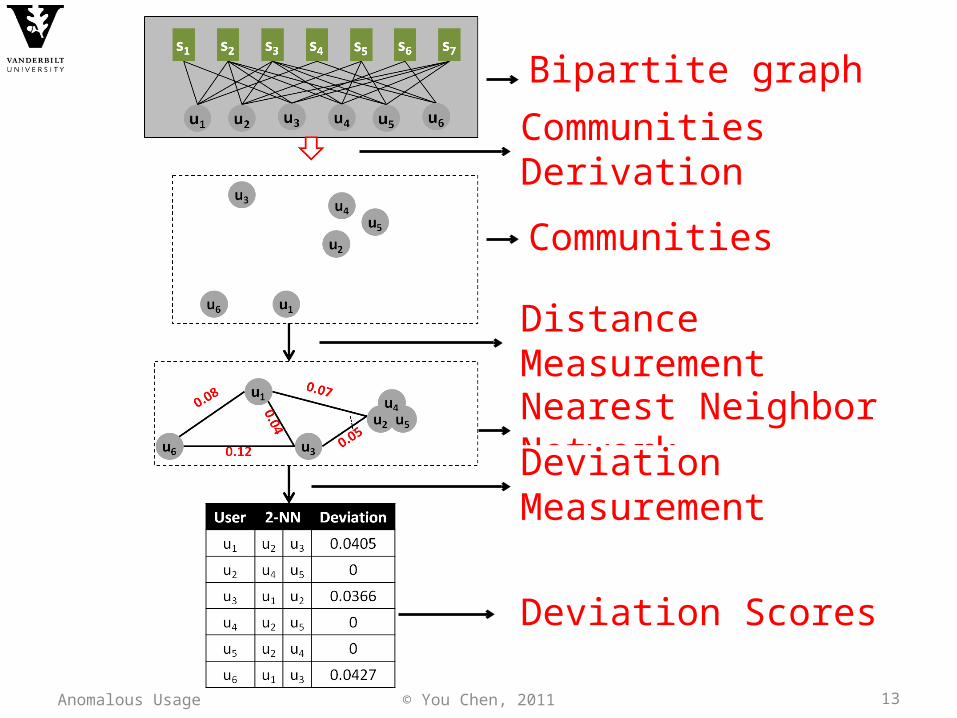
© You Chen, 2011 13Anomalous Usage
Communities Derivation
Distance Measurement
Nearest Neighbor Network
Bipartite graph
Communities
Deviation Measurement
Deviation Scores
© You Chen, 2011 14
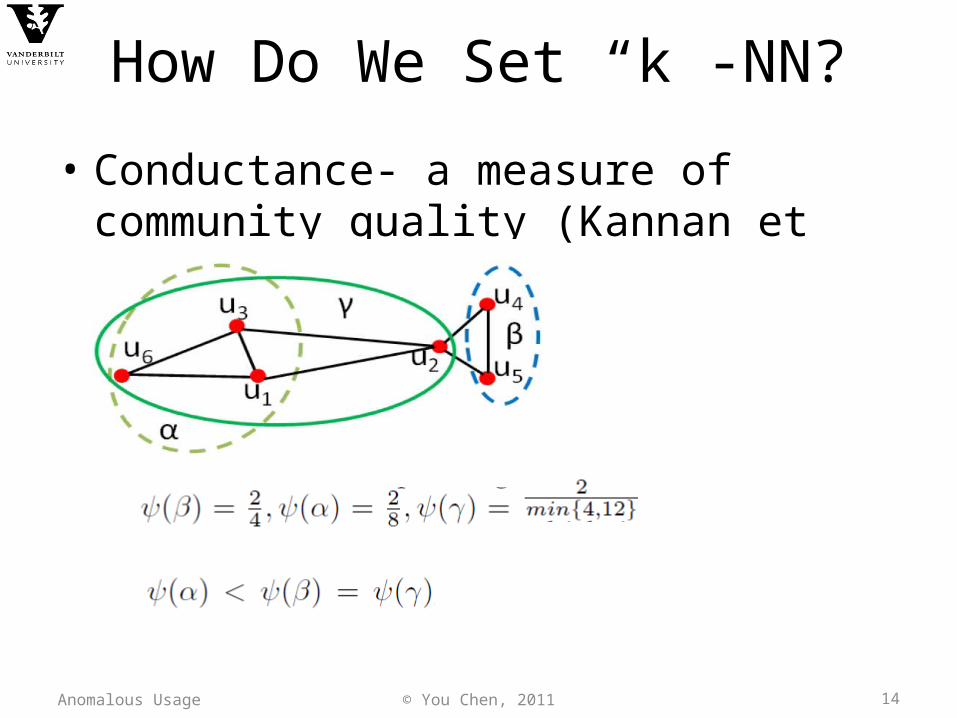
How Do We Set “k”-NN?
• Conductance- a measure of community quality (Kannan et al)
Anomalous Usage

© You Chen, 2011 15
Min
imum
con
duct
ance
for v
alue
k
kAnomalous Usage
Minimum conductance at k=6
© You Chen, 2011 16
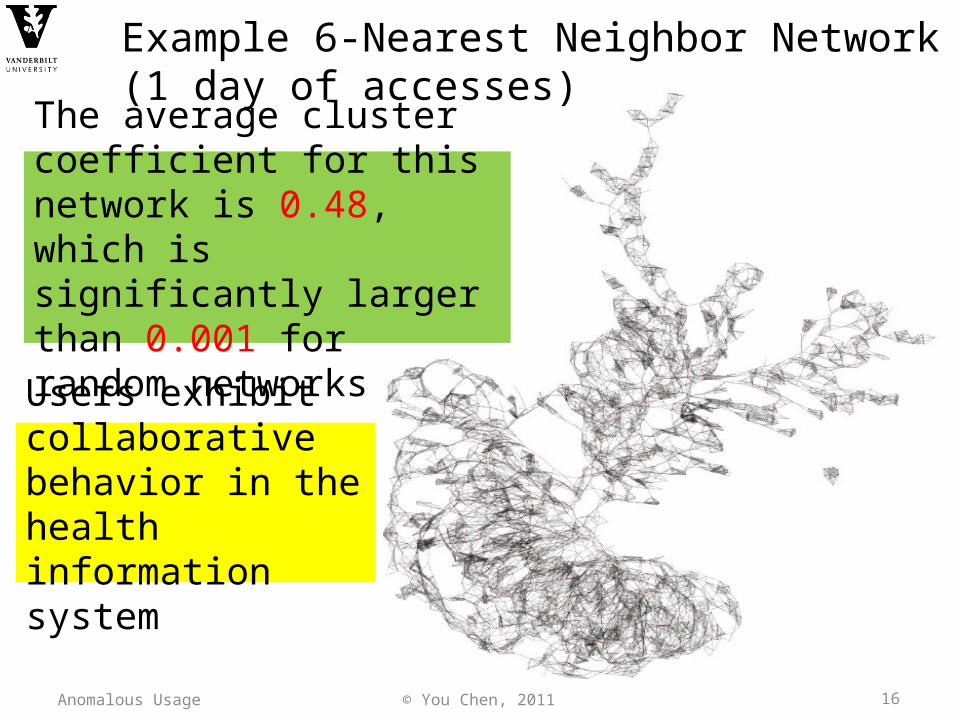
The average cluster coefficient for this network is 0.48, which is significantly larger than 0.001 for random networks
Users exhibit collaborative behavior in the health information system
Example 6-Nearest Neighbor Network(1 day of accesses)
Anomalous Usage

© You Chen, 2011 17
• Every user is assigned a radius d:– the distance to his kth nearest neighbor
• Smaller the radius higher density in user’s network
Measuring Deviation from k-NN
Anomalous Usage

© You Chen, 2011 18
Where are We Going?
• User Level: Community Anomaly Detection System (CADS)
(ACM CODASPY’11)
– Framework of CADS– An Example of CADS
– Experimental Evaluation– Limitation
• Access Level: Specialized Network Anomaly Detection (SNAD)
(IEEE ISI’11)Anomalous Usage

© You Chen, 2011 19
Experimental Design
• Datasets are not annotated for illicit behavior• We simulated users in several settings to test:– Sensitivity to number of records accessed
• Range from 1 to 1,000
– Sensitivity to number of anomalous users• simulated users correspond to 0.5% to 5% of total users• Number of records accessed fixed to 5
– Sensitivity to diversity• Random number of users and records accessed
Anomalous Usage

© You Chen, 2011 20
Deviation and Detection Rate Increases with Number of Subjects
Accessed
Dev
iatio
n
Patients Accessed
Fals
e Po
sitiv
e Ra
te
Patients Accessed
Anomalous Usage
© You Chen, 2011 21
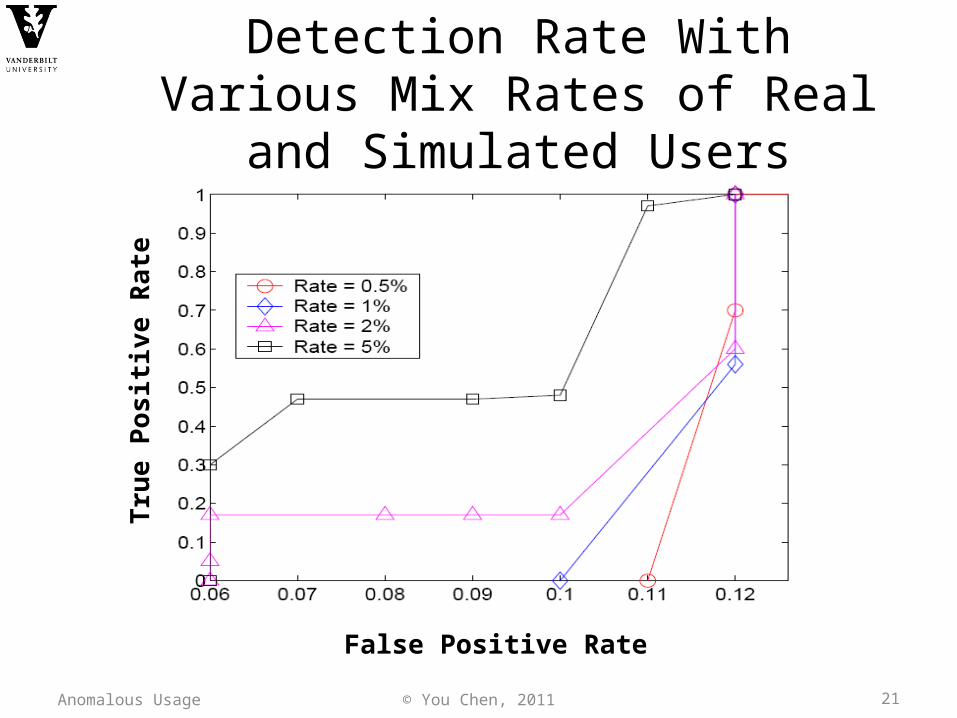
Detection Rate With Various Mix Rates of Real and Simulated Users
True
Pos
itive
Rat
e
False Positive Rate
Anomalous Usage

© You Chen, 2011 22
CADS Outperforms Competitors(mix rate = 0.5%)
True
Pos
itive
Rat
e
False Positive Rate
Anomalous Usage

© You Chen, 2011 23
Where are We Going?
• User Level: Community Anomaly Detection System (CADS)
(ACM CODASPY’11)
– Framework of CADS– An Example of CADS
– Experimental Evaluation
– Limitation
• Access Level: Specialized Network Anomaly Detection (SNAD)
(IEEE ISI’11)Anomalous Usage

© You Chen, 2011 24
• Simulated users are indicative of misuse of the system……but actual illicit behavior may be more directed.
• “False positives” are not necessarily false!(Adjudication by EHR privacy experts under way)
• Need to specialize tool to account for semantics of users and subjects– User: {Role, Department, Residence}– Patient: {Diagnosis, Procedure, Demographics, Residence}
• Anomalous users… not anomalous accesses– Need to account for insiders that deviate by only a couple of actions– Work underway (about to be submitted), but it’s detection is “local”, not
“global”
Some Limitations
Anomalous Usage

© You Chen, 2011 25
Where are We Going?
• User Level: Community Anomaly Detection System (CADS)
(ACM CODASPY’11)
• Access Level: Specialized Network Anomaly Detection (SNAD)
(IEEE ISI’11)
– Framework of SNAD– An Example of CADS
– Experimental Evaluation
– LimitationAnomalous Usage

© You Chen, 2011 26
SNAD Framework
Anomalous Usage

© You Chen, 2011 27
Where are We Going?
• User Level: Community Anomaly Detection System (CADS)
(ACM CODASPY’11)
• Access Level: Specialized Network Anomaly Detection (SNAD)
(IEEE ISI’11) – Framework of SNAD
– An Example of SNAD– Experimental Evaluation
– LimitationAnomalous Usage
© You Chen, 2011 28
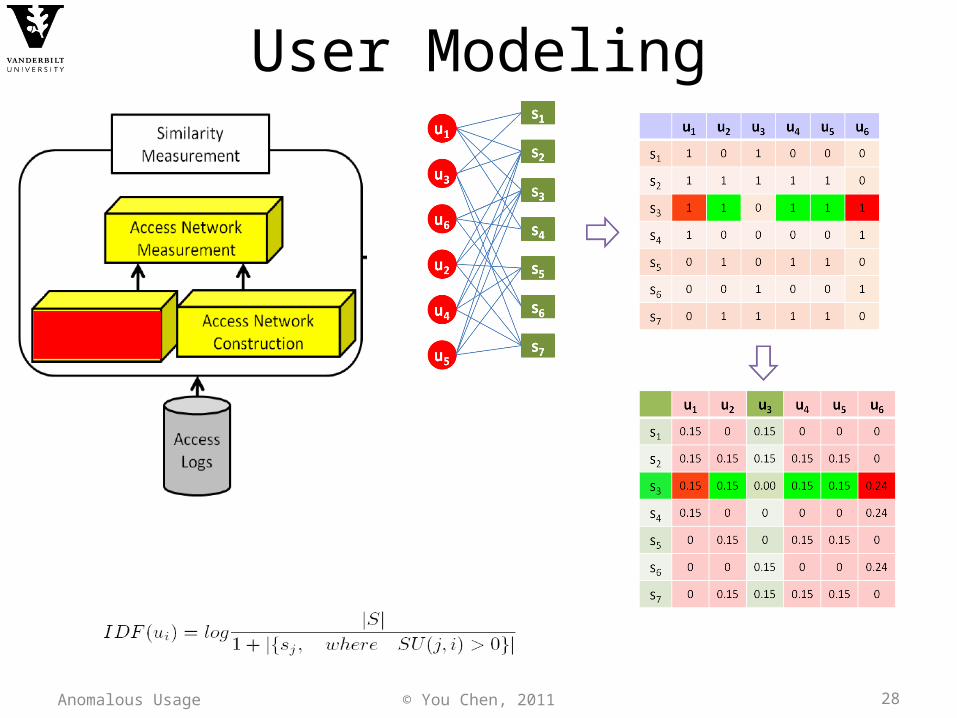
User Modeling
Anomalous Usage
© You Chen, 2011 29
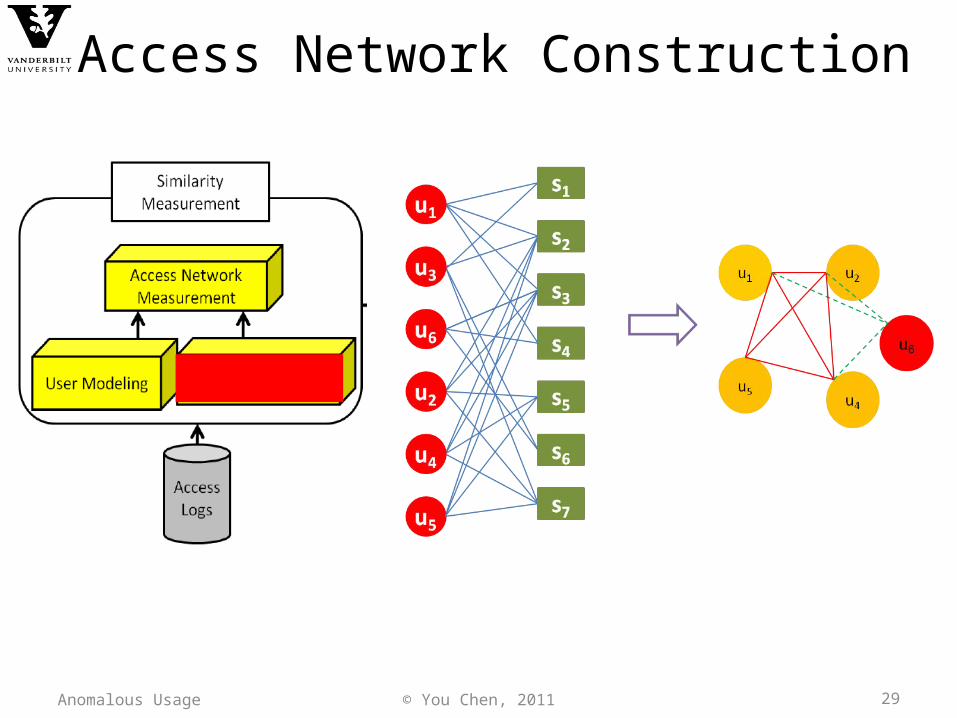
Access Network Construction
Anomalous Usage
© You Chen, 2011 30
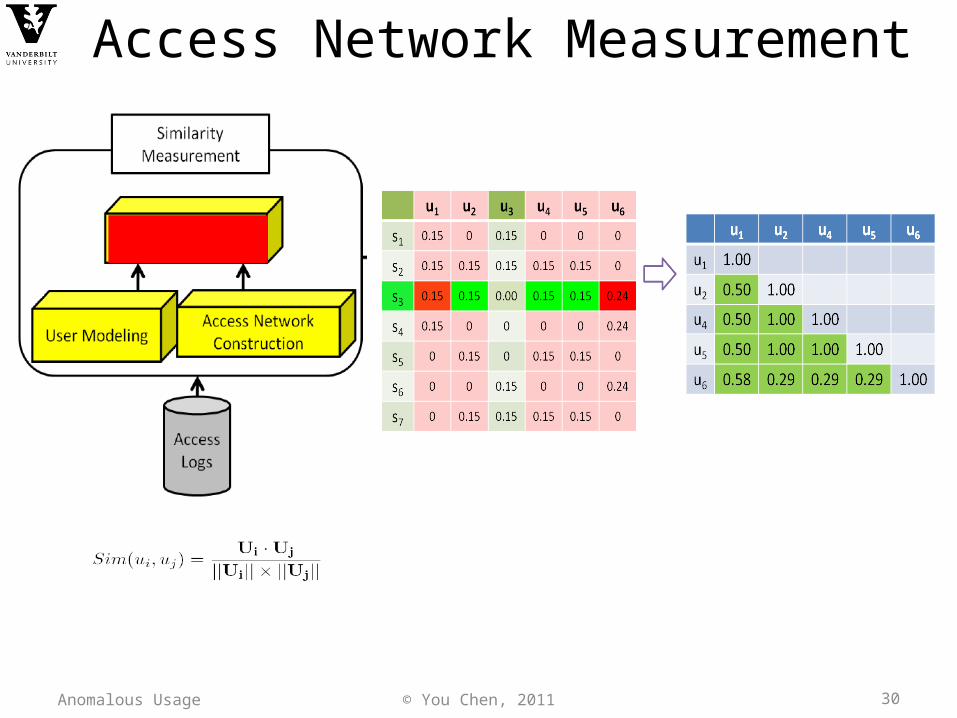
Access Network Measurement
Anomalous Usage

© You Chen, 2011 31
Measuring Accesses for Changes in Network Similarity
Anomalous Usage
Access: u1->s3
© You Chen, 2011 32
Where are We Going?
• User Level: Community Anomaly Detection System (CADS)
(ACM CODASPY’11)
• Access Level: Specialized Network Anomaly Detection (SNAD)
(IEEE ISI’11) – Framework of SNAD
– An Example of SNAD
– Experimental Evaluation– Limitation
Anomalous Usage

© You Chen, 2011 33
Experimental Design
• Datasets are not annotated for illicit behavior• We simulated users in several settings to test:– Sensitivity to number of subjects accessed
• Range from 1 to 1,00
– Sensitivity to number of anomalous users• Range from 2 to 20• Number of subjects accessed fixed to 5
– Sensitivity to diversity• Random number of users and subjects accessed
Anomalous Usage

© You Chen, 2011 34
SNAD: Deviation Rate Increase with Number of Subjects Accessed
Number of Subjects the Intruder Accesses
AUC
Anomalous Usage

© You Chen, 2011 35
SNAD: Deviation Rate Increases with Number of Intruders
Number of Intruders
AUC
Anomalous Usage

© You Chen, 2011 36
SNAD Outperforms Competitors When the Number of Intruders & Accessed Subjects is Random
False positive rate
True
pos
itive
rate
Anomalous Usage

© You Chen, 2011 37
Where are We Going?
• User Level: Community Anomaly Detection System (CADS)
(ACM CODASPY’11)
• Access Level: Specialized Network Anomaly Detection (SNAD)
(IEEE ISI’11) – Framework of SNAD
– An Example of SNAD
– Experimental Evaluation
– LimitationAnomalous Usage
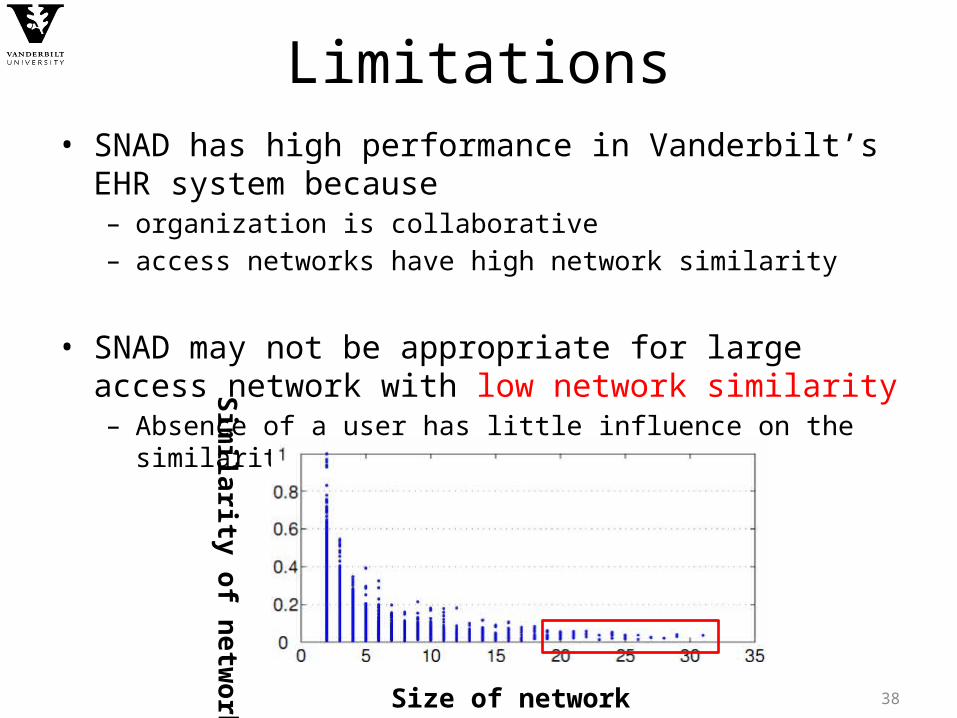
38
Limitations• SNAD has high performance in Vanderbilt’s EHR system because
– organization is collaborative– access networks have high network similarity
• SNAD may not be appropriate for large access network with low network similarity– Absence of a user has little influence on the similarity.
Size of networkSim
ilarity of network
39
Conclusions
• It is an effective way by using social network analysis to detect anomalous usages of electronic health records, such as CADS and SNAD
• Adding semantic information of users and subjects will make social network analysis be more understandable
© You Chen, 2011 40
References• Y. Chen and B. Malin. Detection of anomalous insiders in collaborative environments via relational analysis
of access logs. In Proceedings of the ACM Conference on Data and Application Security Security and Privacy, pages 63–74, 2011. (CADS)
• Y. Chen, S. Nyemba, W. Zhang, and B. Malin. Leveraging social networks to detect anomalous insider actions in collaborative environments. In Proceedings of the 9th IEEE Intelligence and Security Informatics, pages 119–124, 2011.(SNAD)
• Gallagher R, Sengupta S, Hripcsak G, Barrows R, Clayton P. An audit server for monitoring usage of clinical information systems. Proceedings of the AMIA Symposium. 1998: 1002.
• A. A. Boxwala, J. Kim, J. M. Grillo, and L. O. Machado. Using statistical and machine learning to help institutions detect suspicious access to electronic health records. Journal of the American Medical Informatics Association, 18:498–505, 2011.
• Y. Liao and V. R. Vemuri. Use of k-nearest neighbor classifier for intrusion detection. Computer Security. 2002; 21(5): 439-448.
• R. Kannan, S. Vempala, and A. Vetta. On clusterings: Good, bad and spectral. Journal of the ACM, 51(3):497–515, 2004.
• Fabbri D, LeFevre K: Explanation-based auditing. In Proceedings of 38th International Conference on Very• Large Data Bases 2012:to appear.• M. Shyu, S. Chen, K. Sarinnapakorn, and L. Chang. A novel anomaly detection scheme based on principal
component classifier. In IEEE Foundations and New Directions of Data Mining Workshop. 2003: 172-179.
Anomalous Usage

Acknowledgements
• National Science Foundation• CCF-0424422 (TRUST)• CNS-0964063
• National Institutes of Health• R01LM010207
• Carl Gunter, Ph.D.• Igor Svecs
FundingUIUC
• Erik Boczko, Ph.D., Ph.D.• Josh Denny, M.D.• Dario Giuse, Dr. Ing• Bradley Malin, Ph.D.
Vanderbilt• Steve Nyemba, M.S.• John Paulett, M.S.• Jian Tian• Wen Zhang, M.S.
• David Liebovitz, M.D. • Sanjay Mehotra, Ph.D.
Northwestern
© You Chen, 2011 41Anomalous Usage
© You Chen, 2011 42
Questions? Comments?
Health Information Privacy Lab:http://www.hiplab.org/
Anomalous Usage

© You Chen, 2011 43Anomalous Usage
SNAD assumes that access scores are approximately distributed around a well-centered mean.
Access score
Num
ber o
f acc
esse
s
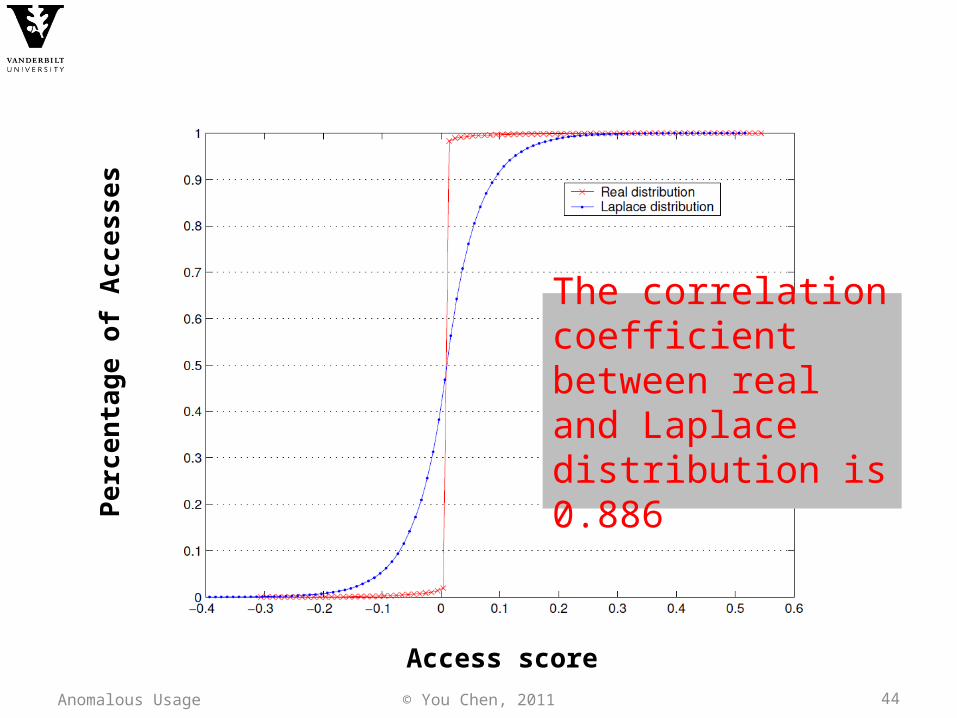
© You Chen, 2011 44
Access score
Perc
enta
ge o
f Acc
esse
s
The correlation coefficient between real and Laplace distribution is 0.886
Anomalous Usage