Uncovered Interest Parity, Purchasing Power Parity and the Fisher effect: Evidence ... · PDF...
47
85 Uncovered Interest Parity, Purchasing Power Parity and the Fisher effect: Evidence from South Africa Dennis Machobani * Gideon Boako †,‡ Paul Alagidede § Abstract This paper tests the validity of the Uncovered Interest Parity (UIP), the International Fisher Effect (IFE), and the Purchasing Power Parity (PPP) hypothesis in the context of South Africa using data of monthly periodicity from 1999 to 2014. We employ ordinary least squares regression, cointegration, causality, and impulse response functions for the empirical analyses. The results from the impulse response functions provide evidence for the rejection of the UIP, IFE and PPP for South Africa. Contrary to the UIP hypotheses, we show that in the event of shocks to the South African economy due to nominal interest rate increases, the rand will generally appreciate by approximately 2% against the euro. Moreover, an external shock due to increase in nominal interest rate in the euro-area leads initially to a transient 0.02% appreciation of the rand before it depreciates again by approximately 0.5% in the short run. Generally, we infer from the results that an increase in South Africa’s interest rates prompts more capital inflows from foreign investors, leading to currency appreciation. Another implication from the results is that movements in the rand are influenced primarily by * Wits Business School, University of the Witwatersrand, 2 St David’s Place, Parktown, Johannesburg 2193, South Africa † Wits Business School, University of the Witwatersrand, 2 St David’s Place, Parktown, Johannesburg 2193, South Africa Kwame Nkrumah University of Science & Technology, Kumasi-Ghana ‡ Corresponding author: Email:[email protected]; Tel: +233 242137523 § Wits Business School, University of the Witwatersrand, 2 St David’s Place, Parktown, Johannesburg 2193, South Africa
Transcript of Uncovered Interest Parity, Purchasing Power Parity and the Fisher effect: Evidence ... · PDF...

85
Uncovered Interest Parity, Purchasing Power Parity and the Fisher
effect: Evidence from South Africa
Dennis Machobani
*
Gideon Boako †,‡
Paul Alagidede§
Abstract
This paper tests the validity of the Uncovered Interest Parity (UIP),
the International Fisher Effect (IFE), and the Purchasing Power Parity (PPP)
hypothesis in the context of South Africa using data of monthly periodicity
from 1999 to 2014. We employ ordinary least squares regression,
cointegration, causality, and impulse response functions for the empirical
analyses. The results from the impulse response functions provide evidence
for the rejection of the UIP, IFE and PPP for South Africa. Contrary to the
UIP hypotheses, we show that in the event of shocks to the South African
economy due to nominal interest rate increases, the rand will generally
appreciate by approximately 2% against the euro. Moreover, an external
shock due to increase in nominal interest rate in the euro-area leads initially to
a transient 0.02% appreciation of the rand before it depreciates again by
approximately 0.5% in the short run. Generally, we infer from the results that
an increase in South Africa’s interest rates prompts more capital inflows from
foreign investors, leading to currency appreciation. Another implication from
the results is that movements in the rand are influenced primarily by
* Wits Business School, University of the Witwatersrand, 2 St David’s Place, Parktown,
Johannesburg 2193, South Africa † Wits Business School, University of the Witwatersrand, 2 St David’s Place, Parktown,
Johannesburg 2193, South Africa
Kwame Nkrumah University of Science & Technology, Kumasi-Ghana ‡ Corresponding author: Email:[email protected]; Tel: +233 242137523
§ Wits Business School, University of the Witwatersrand, 2 St David’s Place, Parktown,
Johannesburg 2193, South Africa
Uncovered Interest Parity, Purchasing Power Parity and the Fisher effect: Evidence from
South Africa - Dennis Machobani, Gideon Boako, Paul Alagidede –
Frontiers in Finance and Economics – Vol 14 N°2, 85 - 131
86
investor’s actions in pursuit of higher yields, withdrawing funds when interest
rate falls and conversely supplying more capital when interest rates increase.
These results imply that the exchange rate market may still be inefficient,
justifying more government intervention to eliminate inefficiencies. These
interventions could include implementing mild capital controls to avoid
excessive outflows during periods of economic slumps.
Keywords: South Africa, fisher effect, interest rate parity, exchange rate,
capital flows.
JEL Classification: C5, C32, F3

Uncovered Interest Parity, Purchasing Power Parity and the Fisher effect: Evidence from
South Africa - Dennis Machobani, Gideon Boako, Paul Alagidede –
Frontiers in Finance and Economics – Vol 14 N°2, 85 - 131
87
1 – Introduction
One of the most widely researched empirical topics in the area of
finance over the past few years has been the efficiency or, more accurately,
the seeming inefficiency of the foreign exchange forward market.
Specifically, a mammoth of surveys and studies have considered the
supposed failure of the forward exchange rate to hold as unbiased predictor
of future changes in spot rates, particularly in flexible exchange rate
regimes. One c r u c i a l factor determining the exchange rate is the
uncovered interest rate parity (UIP) condition. The UIP theory emphasizes
the efficiency of the forward market, indicating that a country’s currency
is expected to depreciate against a foreign currency when the domestic
interest rate rises higher than that of the foreign country. Uncovered interest
rate parity (UIP) suggests that the interest rate differential between
domestic and foreign country equals the expected change in the
exchange rate. The differential in interest rate between the two
countries will, on average, be similar to the ex post exchange rate
movement. If the uncovered interest rate parity condition holds, the interest
rate differential b e c o m e s a n unbiased predictor of the ex post
movement in the spot exchange rate. As an example, suppose the
differential between one-year rand and dollar interest rates is 6 percent with
the rand being higher, rational investors, who are deemed risk neutral, will
then expect the rand to depreciate by 6 percent over the one year duration.
This would cause the returns on the rand dollar to equalize. If instead the
rand fails to adjust as expected, arbitrage opportunities would be created.
Accordingly, the interest rate differential would be reflected by the forward
rate.
A number of studies over the previous decades have attempted to
investigate the validity of the uncovered interest rate parity in advanced world
financial markets. The majority of these studies have mainly focused on
economies with well-developed forward capital markets in foreign exchange
rates, considering that data in those countries is much more readily available.
It has been argued that the level of informational efficiency of these mature
capital markets is superior to those which are less established, thereby making
the interest parity hypothesis more plausible and occasions to make economic
profits from the Uncovered Interest Parity (UIP) arbitrage unlikely (Adrangi,

Uncovered Interest Parity, Purchasing Power Parity and the Fisher effect: Evidence from
South Africa - Dennis Machobani, Gideon Boako, Paul Alagidede –
Frontiers in Finance and Economics – Vol 14 N°2, 85 - 131
88
2011). Additionally, frictions in the financial market, including the political
and regulatory hurdles among developed markets has diminished over the
recent period. This has further reduced opportunities for arbitrage in those
foreign currency market establishments.
By testing the relevance and validity of the uncovered interest parity
hypothesis in emerging markets like South Africa, the study will help to
bridge the existing gap in the UIP literature concerning African economies.
Because South Africa is considered an emerging economy, the UIP study will
inform a determination of whether the movement in the actual exchange rate
between two economies could equate to that which was implied by the interest
rate differential in the past. The prevailing applied significance of this issue is
that many big hedge funds now operating in the financial markets of emerging
countries have sought to take advantage of mispricing market through
different currencies (Cao et al., 2015). This is despite the risky nature of
earning economic profits in that manner and the unfavorable peculiar position
in which the action of hedge fund managers has often left countries like South
Africa.
The fundamental conjecture forming the crux of the UIP theory
relates to the notion that capital markets are efficient and that prices reflect
thoroughly all available information to all participants in the market (Stigler,
1957; Malkiel and Fama, 1970; Malkiel, 2005; Narayan et al., 2015).
Therefore, no profitable opportunities will be possible in the market. This
suggests that exchange rates adjust s w i f t l y to new information
emerging in the market. In addition, market participants do not only have
rational expectations but are also assumed to be dominated by investors who
are risk neutral. Supposing that the assumptions are genuine and the UIP
condition holds, the expected return realized from holding domestic
currency as opposed to holding a foreign currency is offset by the
opportunity cost associated with holding funds in the domestic currency
against the foreign currency (Foy, 2005). Consequently no investor(s) can
gain attractive arbitrage opportunities arising from currency with high yield
because such a currency will be anticipated to depreciate against the other
currency in the market. The depreciation will be equivalent to the amount
approximately equal to the differential in interest rate between the domestic
and foreign country. Empirical tests of the UIP theory often fail to accord
with the facts.
A number of reasons have been advanced to explain the failure of
UIP. Amongst these are expectations, risk neutrality and the presence of a
time-varying risk premia (see Chinn & Meredith, 2005). In this study, an
Uncovered Interest Parity, Purchasing Power Parity and the Fisher effect: Evidence from
South Africa - Dennis Machobani, Gideon Boako, Paul Alagidede –
Frontiers in Finance and Economics – Vol 14 N°2, 85 - 131
89
attempt is made to analyze evidence of the UIP relation using data from
South Africa as the base country, United States, India, Eurozone, Japan, and
China. Compared to developed economies, South Africa, just like other
emerging markets (EMs), is often characterized by higher nominal interest
rate and higher inflation (Alper et.al, 2009). Differences with respect to
economic conditions may also have a direct impact on the relationship
between nominal interest rate differences and the exchange rate depreciation
(Chinn, 2006). Therefore, it is interesting to test the UIP in the context of an
emerging market such as South Africa. More importantly, the need for this
study is spurred by the fact that the UIP condition has implications for the
efficiency of the foreign exchange market, an area of academic and
professional research that is at its infancy. For example, the failure of the UIP
presents opportunity for international investors to make profit. In the event
that South Africa’s currency does not appreciate following a decline in
interest rates below those prevailing in the US, investors can earn a risk-free
return by moving funds from South Africa in favour of holding American
securities. This process may result in excessive capital outflows which may
result in unfavourable outcome for the country, thereby affecting economic
growth negatively.
According to data collected by the World Bank, the South Africa
capital account balance declined from $31 in 2010 to $25 in 2013, despite
efforts by the Federal Reserve Bank (FRB) to reduce interest rate during this
period. Mohamed & Finnoff (2004) found that capital flight as a percentage
of GDP was on average 6.6 percent between 1980 and 2000. Excessive
capital flight may lead to significant currency and financial crisis. The 2008
Global Financial Crisis which also affected South Africa implies the
vulnerability of the country to foreign financial contagion. For a country with
an integrated and relatively open capital market such as South Africa, failure
of the UIP, the related PPP and the International Fisher Effect hypothesis to
hold, could lead to high capital outflows. This may necessitate a need for
capital controls by the monetary authorities, though other dynamic
peculiarities may hinder such measures.
The Uncovered Interest Parity Test, PPP and International Fisher
Effect hypotheses are crucial because of their implications for the efficiency
of the foreign exchange market. Market inefficiency implies that arbitrage
opportunity is possible whereby investors can earn additional returns by
borrowing from low interest rate country and invest in high interest rate
country to earn proceeds. On the other hand, in order to affirm the Law of one
Price, it is important to ascertain whether past increases in domestic prices

Uncovered Interest Parity, Purchasing Power Parity and the Fisher effect: Evidence from
South Africa - Dennis Machobani, Gideon Boako, Paul Alagidede –
Frontiers in Finance and Economics – Vol 14 N°2, 85 - 131
90
have often been accompanied by commensurate depreciation of the domestic
currency. Deviation from the PPP has direct implication on the efficiency of
the markets. The International Fisher Effect posits that countries with higher
interest rate generally tend to have higher inflation. While this case is
generally accepted as valid, it is important to statistically test the significance
of the hypothesis. Inter alia, the study attempts to answer the following
questions: does uncovered interest parity, purchasing power parity and the
International Fisher Effect hold for South Africa? What are the implications
of the findings on the foreign exchange/capital markets? What is the
relationship between UIP, PPP and IFE and movements in South Africa’s
capital account, and finally, what can policy makers glean from these
relationships?
The remaining sections of the paper are organized as follows: Section
2 handles the literature review; Section 3 deals with data and methodology;
and Sections 4 and 5 present empirical analysis and conclusion, respectively.
2 - Literature review
Extant literature on UIP has found that countries with relatively high
interest rates tend to experience currency appreciation. These findings have
made the UIP hypothesis testing an empirical failure for many studies. Part of
the existing literature does not find adequate evidence in support of the UIP
hypothesis. Part of the challenge in testing the UIP hypothesis stems from the
difficulty associated with testing it directly, thereby relying heavily on
rational expectations theories and unbiased hypothesis argument. Studying the
UIP, PPP and Fisher Effect for emerging markets has often been approached
with more highlighted caution. Alper et al., (2009) notes that unlike
developed markets, emerging markets are characterized by poor
macroeconomic fundamentals, unstable economic conditions, weak financial
markets, and need for greater institutional reforms. Consequently, these
inherent differences between emerging and developed markets have
implications on the UIP empirical tests. The peculiarity of emerging capital
markets may violate some fundamental assumptions typically advanced when
studying UIP, PPP and the International Fisher Effect in developed markets.
These assumptions may include perfect substitutability of assets and
negligible transactional costs. Surprisingly, despite the peculiarities already
pointed and the expectation that UIP results from emerging markets was

Uncovered Interest Parity, Purchasing Power Parity and the Fisher effect: Evidence from
South Africa - Dennis Machobani, Gideon Boako, Paul Alagidede –
Frontiers in Finance and Economics – Vol 14 N°2, 85 - 131
91
supposed to be more unfavourable when using the same methodology as the
one typically applied for developed markets, the results are nonetheless less
unfavourable (Alper et al., 2009).
In the empirical literature, various attempts have been made to test
international parity hypotheses, such as the uncovered interest rate parity
(UIP) and Purchasing Power Parity (PPP), both of which play a fundamental
role in exchange rate and currency determination (MacDonald & Taylor,
1990). These parity hypotheses are usually considered as either arbitrage
relations, which in the case of UIP is assumed to hold constantly, or
sometimes just as long-run equilibrium relations, such as PPP. With regard to
PPP, for most of the existing literature, there have been two competing views
whereby on one side researchers argue that real exchange rates series are
non-stationary (Roll, 1979; Adler & Lehmann, 1983; MacDonald, 1985). On
the other side, as more investigations intensified, studies found that the real
exchange rate exhibited stationary patterns and therefore free from unit root
(Huizinga, 1987; Dornbusch, 1989; Whitt, 1992). Testing for the PPP using
co-integration methodology advanced by Engle & Granger (1987), Taylor
(1988) argues that the PPP fails to hold in the long run. However, contrary to
Taylor (1988), a plethora of studies relied on the Johansen (1991) co-
integration methodology to test the PPP and found that the parity condition
holds in the long run (Kugler & Lenz, 1993; MacDonald & Marsh, 1994;
Fisher & Park, 1991). Assuming that investors are risk neutral and market
participants have rational expectations, studies based on the uncovered
interest parity condition have typically favoured the rejection of the UIP
(Cumby & Obstfeld, 1981; Davidson, 1985; Taylor, 1987).This failure of the
PPP and UIP condition to hold suggest markets are inefficient and irrational
( MacDonald & Taylor, 1992).
Closely related with the UIP and PPP is the Fisher Effect which states
that worldwide real interest rates are made equal across boarders through
arbitrage. In this process, the level of real interest rate is determined by the
demand and supply of funds whereby investors chase investment
opportunities in countries where real interest rates are higher. Interest rate
differentials between two integrated capital markets can be attributed to
factors such as psychological barriers, political risk, (Solnik & Roulet, 2000),
legal constraints, transaction costs, and currency risks (Taylor, 1998).
However, in the absence of capital market imperfections and free capital
mobility, interest rate differentials between markets are eliminated.
Equilibrium in capital markets is therefore characterized by a state where the
differential in nominal interest rate is approximately equal to the differential
Uncovered Interest Parity, Purchasing Power Parity and the Fisher effect: Evidence from
South Africa - Dennis Machobani, Gideon Boako, Paul Alagidede –
Frontiers in Finance and Economics – Vol 14 N°2, 85 - 131
92
in expected inflation between the domestic and foreign country (Demirag &
Goddard, 1994). Essentially, the international Fisher Effect states that
differences in observed nominal interest rate between countries are owed to
differences in inflation.
Despite the theoretical appeal, the Fisher Effect has yielded
conflicting econometric evidence. Shapiro (1998) conducted a study for 22
countries by comparing their nominal interest rate and concluded that
generally, countries with higher inflation rates tend to have higher interest
rates. Aliber and Stickney (1975) observed for both developed and developing
countries that the International Fisher Effect holds in the long run but no
sufficient evidence was found to prove that it also holds in the short-run. More
support in favour of the International Fisher Effect was further provided by
Kane & Rosenthal (1982) for the period 1974-1979 who examined the
Eurocurrency market and concluded that the International Fisher Effect is
fulfilled in the long run.
Robinson & Wartburton (1980) were amongst the first group of
researchers to dispute the empirical validity of the International Fisher Effect
by arguing that the appreciation of the currency with lower nominal interest
rates in relation to the currency with the higher nominal interest rate would in
the medium run, erode any possibility of earning higher interest returns. Using
the residual-based co-integration test methodology by Engle & Granger
(1987), Mishkin (1992) argued that in the presence of a common stochastic
trend on interest rate and inflation, the International Fischer Effect may hold.
However, Gonzalo (1994) showed that the Engle-Granger test as applied by
Mishkin is not sufficiently robust in detecting stochastic trends and argued
that the most suitable approach would be the maximum likelihood method.
Yuhn (1996) found that while there was no significant evidence in support of
the Fisher Effect in the United Kingdom and Canada, the findings revealed
that results for Germany confirmed the validity of the International Fisher
Effect. Moreover, similar to Aliber & Stickey (1975), Yuhn (1996) found that
the Fisher Effect is more powerful in the long period horizon but weak during
periods of policy regime changes. Coppock & Poitras (2000) found that the
Fisher Effect does not hold because interest rates do not fully adjust to
inflation.
The overwhelming evidence against the UIP, PPP and the
International Fisher Effect may be attributed to errors as a result of
overlooking the linkages between an asset and goods markets (Johansen &
Juselius, 1992). Employing the Johansen & Juselius (1992) co-integration
framework that allows for interactions in the determination of interest rates,

Uncovered Interest Parity, Purchasing Power Parity and the Fisher effect: Evidence from
South Africa - Dennis Machobani, Gideon Boako, Paul Alagidede –
Frontiers in Finance and Economics – Vol 14 N°2, 85 - 131
93
prices and exchange rates and different horizon dynamics, Caporale et al.,
(2001) find evidence in support of the UIP and PPP.
While there has been extensive research done on the UIP in many
regions around the world, the focus on emerging African economies like
South Africa has been scarce and limited. The availability of credible data
sources has contributed to limitations associated with conducting quantitative
research on the African continent. As the African economies begin to
modernize their institutions, the challenge pertaining to data availability and
accessibility is gradually diminishing. Crucial investigation on the UIP for
South Africa was conducted by Lacerda et al., (2010), who in an attempt to
circumvent modelling which previously ignored shifts in policy regimes and
the concomitant distortions on the PPP and UIP relations, constructed a vector
error correction model (VECM) which is based on a Markov-switching
vector. This model incorporates shifts in exchange rate and monetary regimes
in which the UIP and PPP is tested as a joint long-run relationship in the
presence of shifts in both the political and economic regimes. Their standard
linear VECM results reveal weak evidence in favour of the UIP and PPP,
despite some residual indications that the functional form is inappropriate.
However, the constructed Markov-switching VECM gives compelling
evidence in support of the PPP and UIP, as well as, an improved distribution
of the residuals.1
3 – Methodology
3.1 The uncovered interest rate parity (UIP)
With free capital mobility and capital markets which are assumed to
be perfect, the relationship of the change in exchange rate and interest rate
differential between the domestic (SA) and foreign country (e.g. U.S.) is
defined below:
(1)
where rt is the domestic (SA) interest rate, is the foreign interest rate, is
the forward rate and is the domestic spot exchange rate. However, testing
the UIP comes with a number of challenges because according to Isard
(1996), expectations regarding the future exchange rates are not directly
observable. Therefore, the current forward rate is assumed to equal the

Uncovered Interest Parity, Purchasing Power Parity and the Fisher effect: Evidence from
South Africa - Dennis Machobani, Gideon Boako, Paul Alagidede –
Frontiers in Finance and Economics – Vol 14 N°2, 85 - 131
94
expected exchange rate as well as a forecast error term. The above
relation assumes that investors are risk neutral. Factoring in expectations
about future exchange rate, we have:
(2)
Assuming the UIP hypothesis holds, capital moves freely across borders and
investors are indifferent between investing in South African or U.S. assets
because returns between the two countries is the same. Capital market
imperfections under a flexible exchange rate regime lead to interest rate
differences between the two countries. The simplest version of the uncovered
interest parity condition is stated as:
(3)
where, and are the domestic and foreign nominal interest rates
respectively. is the n-horizon forward rate.
Under the Uncovered Interest Rate Parity (UIP) condition, there are no
arbitrage opportunities as the domestic interest rate (rt) and foreign interest
rate ( ) equals the spread in the exchange rate yield. When investors are risk
neutral, the UIP condition is simplified as:
) (4)
represents the expected percentage change in the spot exchange
rate, t, denotes the spot exchange rate period and k is the future exchange rate
period, (rt) and ( ) defines domestic (South African) and foreign (US)
interest rate respectively. Equation (4) assumes that there are no arbitrage
opportunities between South Africa and the US, implying the change in the
exchange rate and the interest rate differential are in equilibrium. This implies
that investors cannot earn extra return by moving funds between countries.
When investors are risk averse, equation (4) becomes:
(5)
Where represents the risk premium required by risk averse investors
who expect to be compensated for the risk of holding securities. The caveat of
equation (5) is that the expected exchange rate cannot be observed. Engel

Uncovered Interest Parity, Purchasing Power Parity and the Fisher effect: Evidence from
South Africa - Dennis Machobani, Gideon Boako, Paul Alagidede –
Frontiers in Finance and Economics – Vol 14 N°2, 85 - 131
95
(1996) attempted to circumvent this caveat by formulating that the market
movement at period t+k, with information efficiently utilized at time t, can be
determined as:
(6)
The term denotes the expected future exchange rate under the
assumption of rational expectation. defines the white-noise stochastic
process which is not correlated with the exchange rate spread at period t.
From equation (5) and (6), we get:
(7)
Assuming that the terms and are statistically independent of the
interest rate differential, equation (7) can be re-written in a testable form of
the Uncovered Interest Parity (UIP) hypothesis (see Chin and Meredith,
2005):
(8)
The term represents the white noise and assuming rational expectations
in exchange markets and risk-neutrality amongst investors, should equal
zero to reflect the absence of a constant risk premium and β should be equal to
one to capture a complete depreciating relation as posited according to the
UIP. The UIP requires that as the interest-rate differential widens, the
exchange rate should equally adjust through depreciation. For instance, if the
foreign currency (say dollar) is two percent higher than the rand, the dollar is
expected to depreciate by two percent after the two year period. Interest rate
parity reinforces the balance between exchange rates and preventing arbitrage
opportunities. The absence of the balance between the two currencies implies
that both the foreign and domestic investors would not prefer to hold lower
interest rate bonds. It must be noted that prior to estimating equation 8, unit
root test ought to be executed to avoid obtaining spurious results.
3.2 The purchasing power parity (PPP)
As outlined in Section 2, purchasing power parity (PPP) is one of the
most crucial theoretical notions in international finance. Purchasing power
Uncovered Interest Parity, Purchasing Power Parity and the Fisher effect: Evidence from
South Africa - Dennis Machobani, Gideon Boako, Paul Alagidede –
Frontiers in Finance and Economics – Vol 14 N°2, 85 - 131
96
parity describes the quantity of baskets of goods and services that can be
bought as defined by a representative bundle of goods. The absolute version
of the PPP compares the absolute price level between two countries against
the level of the exchange rate in the respective countries. The PPP relation is
defined below:
(9)
Where and represents domestic and foreign inflation rate respectively.
Equation (9) implies that the exchange rate should be such that the domestic
and foreign prices are equal. The relative PPP postulates that the differences
in inflation between countries (domestic and foreign), is captured by changes
in the exchange rate, implying for instance that if inflation in South Africa is
higher than in the United States by a particular percentage, the US dollar must
appreciate by the percentage by which South Africa’s inflation exceed that of
the US. The linear relation of the relative PPP is shown below:
(10)
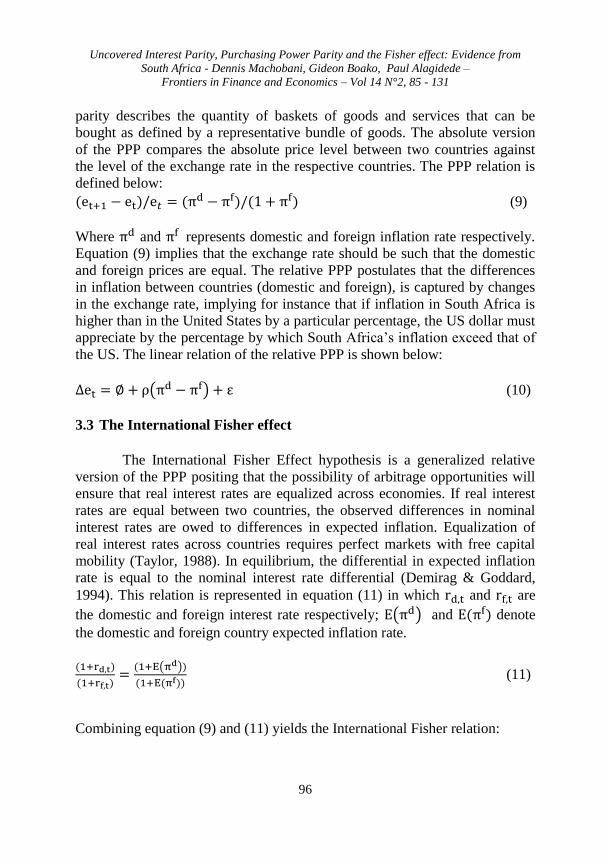
3.3 The International Fisher effect
The International Fisher Effect hypothesis is a generalized relative
version of the PPP positing that the possibility of arbitrage opportunities will
ensure that real interest rates are equalized across economies. If real interest
rates are equal between two countries, the observed differences in nominal
interest rates are owed to differences in expected inflation. Equalization of
real interest rates across countries requires perfect markets with free capital
mobility (Taylor, 1988). In equilibrium, the differential in expected inflation
rate is equal to the nominal interest rate differential (Demirag & Goddard,
1994). This relation is represented in equation (11) in which and are
the domestic and foreign interest rate respectively; and denote
the domestic and foreign country expected inflation rate.
(11)
Combining equation (9) and (11) yields the International Fisher relation:

Uncovered Interest Parity, Purchasing Power Parity and the Fisher effect: Evidence from
South Africa - Dennis Machobani, Gideon Boako, Paul Alagidede –
Frontiers in Finance and Economics – Vol 14 N°2, 85 - 131
97
(12)
The international Fisher Effect captured in equation (12) states that worldwide
real interest rates are made equal across boarders through arbitrage. In this
process, the level of real interest rate is determined by the demand and supply
of funds whereby investors chase investment opportunities in countries where
real interest rates are higher. Interest rate differences between two integrated
capital markets can be attributed to factors such as psychological barriers,
political risk, and inflation (Solnik & Roulet, 2000), legal constraints,
transaction costs, and currency risks (Taylor, 1988). However, in the absence
of capital market imperfections and free capital mobility, interest rate
differentials between markets are eliminated.
The International Fisher relation regression model discussed below is
similar to that of Sundqvist (2002). When a market is efficient, the exchange
rate makes an immediate adjustment to reflect the new information on which
all rational market participants make their decisions (Cheung et al., 2005).
Given a certain set of information, at time , the expected future spot
exchange rate can be represented as:
) (13)
Given all the available information at time , on average, the expected future
spot rate is approximately equal to the future spot rate (Hansen & Hodrick,
1980):
) (14)
In order to capture the difference between the actual future spot rate realized
and the expected future spot rate, an error term is added to equation (14).
The assumption that all market participants are rational implies that the error
term is not correlated with the available information at time t.
) + (15)
The International Fisher Effect regression model to be estimated takes the
form below:
(16)

Uncovered Interest Parity, Purchasing Power Parity and the Fisher effect: Evidence from
South Africa - Dennis Machobani, Gideon Boako, Paul Alagidede –
Frontiers in Finance and Economics – Vol 14 N°2, 85 - 131
98
The coefficient captures the value by which the exchange rate changes
when the nominal interest rate differential is equal to zero. The null
hypothesis for the International Fisher is that and . Just like the
UIP and PPP regression models discussed above, equation (16) coefficients
will be estimated using Ordinary Least Squares.
3.4 Data and descriptive statistics
The study uses the ZAR/USD, ZAR/YEN, ZAR/YUAN,
ZAR/RUPEE and ZAR/EURO spot exchange rates and discounted (nominal)
interest rates for both South Africa as the domestic country and the U.S,
Japan, China, India and the Euro area respectively. To incorporate the
Purchasing Power Parity (PPP) and the International Fischer effect, we also
use consumer price inflation (CPI) data from these countries, as well as the
real interest rate. The data frequency is monthly and covers the period 1999-
2014. The data used are obtained from the websites of the Federal Reserve
Bank of St. Louis and individual country national or central banks.
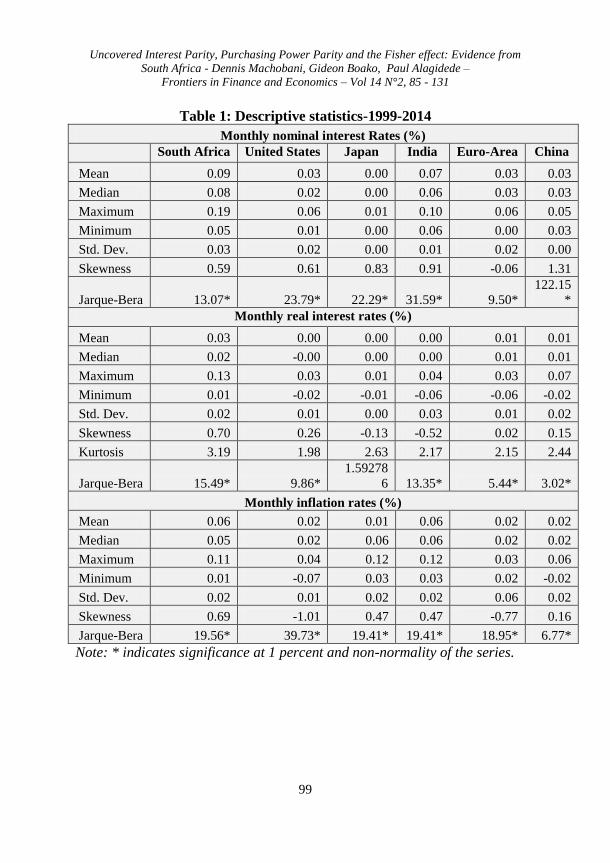
Table 1 depicts summary statistics for the nominal interest rates, real
interest rates and inflation for the sampled countries. Of these countries,
South Africa has the highest average nominal and real interest rates (9% and
3% respectively) while Japan has the lowest real and nominal interest rates.
Contrary to inflation trends in developed economies, the relatively high
inflation environment in South Africa necessitates commensurate high interest
rates by monetary authorities. In his work on the long run relationship
between inflation and interest rates, Mishkin (1992) finds that a 1% increase
in the rate of inflation leads to a 1.34% increase in the nominal interest rate.
The highest nominal interest rate period for South Africa was 1999 when the
interest rate reached 19%, coinciding with inflation rate of approximately 6%.
South Africa recorded its highest inflation rate for the period under review in
2008 as the globe slumped into a financial meltdown emanating from
developed countries. The Inflation trend across the selected countries for the
period under review is depicted in the Figure 1.
Uncovered Interest Parity, Purchasing Power Parity and the Fisher effect: Evidence from
South Africa - Dennis Machobani, Gideon Boako, Paul Alagidede –
Frontiers in Finance and Economics – Vol 14 N°2, 85 - 131
99
Table 1: Descriptive statistics-1999-2014
Monthly nominal interest Rates (%)
South Africa United States Japan India Euro-Area China
Mean 0.09 0.03 0.00 0.07 0.03 0.03
Median 0.08 0.02 0.00 0.06 0.03 0.03
Maximum 0.19 0.06 0.01 0.10 0.06 0.05
Minimum 0.05 0.01 0.00 0.06 0.00 0.03
Std. Dev. 0.03 0.02 0.00 0.01 0.02 0.00
Skewness 0.59 0.61 0.83 0.91 -0.06 1.31
Jarque-Bera 13.07* 23.79* 22.29* 31.59* 9.50*
122.15
*
Monthly real interest rates (%)
Mean 0.03 0.00 0.00 0.00 0.01 0.01
Median 0.02 -0.00 0.00 0.00 0.01 0.01
Maximum 0.13 0.03 0.01 0.04 0.03 0.07
Minimum 0.01 -0.02 -0.01 -0.06 -0.06 -0.02
Std. Dev. 0.02 0.01 0.00 0.03 0.01 0.02
Skewness 0.70 0.26 -0.13 -0.52 0.02 0.15
Kurtosis 3.19 1.98 2.63 2.17 2.15 2.44
Jarque-Bera 15.49* 9.86*
1.59278
6 13.35* 5.44* 3.02*
Monthly inflation rates (%)
Mean 0.06 0.02 0.01 0.06 0.02 0.02
Median 0.05 0.02 0.06 0.06 0.02 0.02
Maximum 0.11 0.04 0.12 0.12 0.03 0.06
Minimum 0.01 -0.07 0.03 0.03 0.02 -0.02
Std. Dev. 0.02 0.01 0.02 0.02 0.06 0.02
Skewness 0.69 -1.01 0.47 0.47 -0.77 0.16
Jarque-Bera 19.56* 39.73* 19.41* 19.41* 18.95* 6.77*
Note: * indicates significance at 1 percent and non-normality of the series.

Uncovered Interest Parity, Purchasing Power Parity and the Fisher effect: Evidence from
South Africa - Dennis Machobani, Gideon Boako, Paul Alagidede –
Frontiers in Finance and Economics – Vol 14 N°2, 85 - 131
100
Figure 1: Monthly inflation rate-1999-2015
It is observed from Fig.1 that the scale of the financial distress of the Japanese
economy beginning in the early 1990s was unprecedented amongst the
developed world in the post War era, characterized by a deflationary spiral in
which prices plummeted steadily (Cargill, 2001). As can be seen in Table 1,
Japan’s average inflation for the period is 1% while the average interest rate is
0%. The nominal interest rates in the U.S and Euro Area are also low, both
averaging 3% for the period. Following the 2008 Great Recession and the
European Sovereign debt crisis, the US Federal Reserve Bank and the
European Central Bank have both embarked on a series of monetary stimulus
efforts and interest rates cuts in an attempt to stimulate demand. Typical of
-2%
0%
2%
4%
6%
2000 2002 2004 2006 2008 2010 2012 2014
CHINA
-1%
0%
1%
2%
3%
4%
2000 2002 2004 2006 2008 2010 2012 2014
EUROAREA
2%
4%
6%
8%
10%
12%
14%
2000 2002 2004 2006 2008 2010 2012 2014
INDIA
-2%
-1%
0%
1%
2%
3%
2000 2002 2004 2006 2008 2010 2012 2014
JAPAN
0%
2%
4%
6%
8%
10%
12%
2000 2002 2004 2006 2008 2010 2012 2014
SA
-1%
0%
1%
2%
3%
4%
2000 2002 2004 2006 2008 2010 2012 2014
USA

Uncovered Interest Parity, Purchasing Power Parity and the Fisher effect: Evidence from
South Africa - Dennis Machobani, Gideon Boako, Paul Alagidede –
Frontiers in Finance and Economics – Vol 14 N°2, 85 - 131
101
most emerging countries, similar to South Africa (SA), India’s average
interest rates and inflation are also relatively high (7% and 6% respectively).
China had average nominal interest rates similar to the U.S and Euro area
average rates for the period (3%) while average inflation was moderate at 2%.
Historical nominal interest rates analyses (see Fig. 2) shows that
starting in the mid-1970s; US interest rate generally increased significantly
and reached a high of 14 percent in 1982. The relatively low interest rate
environment of the early 1970s led inflation to rise and prompted the Federal
Reserve Bank to hike interest rate sharply during the late 1970s and early
1980s (Cogley and Sargent, 2005). From 1983, US interest rates continued to
decline and were at 1 percent in 2003. After rising from 1 percent to
approximately 7 percent in 2007, the US interest rate began falling as a result
of the 2008 Financial Crisis. The Federal Reserve Bank has since then kept
interest rates at near zero. In the recent periods, US interest rates have
declined significantly.

Uncovered Interest Parity, Purchasing Power Parity and the Fisher effect: Evidence from
South Africa - Dennis Machobani, Gideon Boako, Paul Alagidede –
Frontiers in Finance and Economics – Vol 14 N°2, 85 - 131
102
Figure 2: Historical nominal interest rates
The dynamics are not much different from India, China, Japan, and the Euro-
area; which have reduced their interest rates in line with the global trend to
stimulate economic growth. Japan enjoyed rapid economic growth,
especially from mid-1960s through the 1970s. The rapid economic expansion
2.5%
3.0%
3.5%
4.0%
4.5%
5.0%
2000 2002 2004 2006 2008 2010 2012
CHINA
0%
1%
2%
3%
4%
5%
6%
2000 2002 2004 2006 2008 2010 2012
EUROZONE
.0%
.2%
.4%
.6%
.8%
2000 2002 2004 2006 2008 2010 2012
JAPAN
5%
6%
7%
8%
9%
10%
11%
2000 2002 2004 2006 2008 2010 2012
INDIA
4%
8%
12%
16%
20%
2000 2002 2004 2006 2008 2010 2012
SA
0%
1%
2%
3%
4%
5%
6%
7%
2000 2002 2004 2006 2008 2010 2012
USA
Uncovered Interest Parity, Purchasing Power Parity and the Fisher effect: Evidence from
South Africa - Dennis Machobani, Gideon Boako, Paul Alagidede –
Frontiers in Finance and Economics – Vol 14 N°2, 85 - 131
103
was as a result of a large-consumption society, as technological progress
stimulated the growth of manufacturing facilities, thereby increasing the sale
of consumer durables (Koo, 2011). The resilience of the Japanese economy
which was built in the 1960s shielded the country against effects of the two
oil crises of the 1970s. However, the housing market bubble that began in the
1990s had tremendous negative impact on the general economy and led to a
decade of weak growth and deflationary spiral (Ito & Mishkin, 2006). In an
effort to restore economic growth, the Japanese Central Bank began
aggressively reducing interest rates. From 1972 to 2014, interest rates in
Japan averaged 3.04 percent and reached record low in 1999 (Koo, 2011).
Unlike South Africa, the US, India, Japan and the Euro-area,
monetary policy in China has in recent years been conducted under difficult
limitations, including a relatively underdeveloped financial system, fixed
exchange rate regime and many institutional challenges (Goodfriend &
Prasad, 2006). Interest rates in China have averaged 3.2% for 1999-2014 and
were reduced significantly in 2002 and 2010. A desire to enhance trade led to
liberalization efforts as authorities began a move towards a flexible exchange
rate regime. These considerations have led the authorities to initiate a move
towards a more flexible exchange rate regime. However, despite the intention
to allow for greater flexibility, the Renminbi remain pegged to the dollar.
The weak economic growth in the Euro-area, compounded more by the
recent Greece severe debt crisis, has prompted the European Central Bank
(ECB) to reduce interest rates. The bank began a series of aggressive interest
rate cuts following the 2009-2010 Financial Crisis which saw most Euro
member countries affected severely and sliding into recession (Martin &
Phillippon, 2014). In India, interest rates have also tended to decline over the
span.

Uncovered Interest Parity, Purchasing Power Parity and the Fisher effect: Evidence from
South Africa - Dennis Machobani, Gideon Boako, Paul Alagidede –
Frontiers in Finance and Economics – Vol 14 N°2, 85 - 131
104
Table 2: Exchange rate descriptive statistics- 1999-2014
Monthly exchange rates
ZAR_EU
RO ZAR_RUP
EE ZAR_US
D ZAR_Y
EN ZAR_YU
AN
Mean 9.73 0.17 7.98 0.08 1.10
Median 9.63 0.16 7.57 0.07 1.05
Maximum 15.01 0.24 12.06 0.11 1.94
Minimum 6.20 0.13 5.73 0.05 0.69
Std. Dev. 2.29 0.02 1.60 0.02 0.32
Skewness 0.42 1.18 0.84 0.31 0.85
Kurtosis 2.39 4.60 2.65 1.70 2.86 Jarque-
Bera 8.84* 66.37* 24.05* 16.96* 24.01* Notes: Note: * indicates significance at 1 percent and non-normality of the
series.
South African Rand/Euro (ZAR_EURO), South African Rand/Rupee
(ZAR_RUPEE), South African Rand/USD (ZAR_USD), South African
Rand/Yen (ZAR_YEN), South African Rand/Yuan (ZAR_YUAN).
Figure 2: Exchange rate movement: South Africn Rand against selected
currencies (1999-2015)
6
8
10
12
14
16
2000 2002 2004 2006 2008 2010 2012 2014
ZAR_EURO
.12
.14
.16
.18
.20
.22
.24
.26
2000 2002 2004 2006 2008 2010 2012 2014
ZAR_RUPEE
4
6
8
10
12
14
2000 2002 2004 2006 2008 2010 2012 2014
ZAR_USD
.04
.05
.06
.07
.08
.09
.10
.11
2000 2002 2004 2006 2008 2010 2012 2014
ZAR_YEN
0.4
0.8
1.2
1.6
2.0
2000 2002 2004 2006 2008 2010 2012 2014
ZAR_YUAN

Uncovered Interest Parity, Purchasing Power Parity and the Fisher effect: Evidence from
South Africa - Dennis Machobani, Gideon Boako, Paul Alagidede –
Frontiers in Finance and Economics – Vol 14 N°2, 85 – 131
105
Table 2 provides summary statistics of the relationship between the rand and
the selected currencies. The rand has averaged R9.70 against the Euro, R0.17
against the Rupee, R7.9 against the USD, R0.08 against the Japanese Yen,
and R1.10 against the Renminbi. South Africa uses a free floating exchange
rate determined by market forces. The spot and forward rate for the rand-
dollar exchange rate is depicted in Fig. 3. The rand has depreciated steadily
against the U.S. Dollar over the time horizon under review. The forward
exchange rate movement closely mirrors the spot exchange rate trend. South
Africa’s rand has tended to depreciate against the selected countries’
currencies in the study.
In Fig. 3, it is noted that the South African rand has weakened against
the selected currencies to reflect a number of factors, among them the weak
economic fundamentals and low investor sentiments, (Zouaoui et.al, 2011),
lower yields compared to those in the US, compounded by several
downgrades of the country’s sovereign bond ratings by rating agencies (Block
& Vaaler, 2004). Generally, the rand is seen to have depreciated against the
selected currencies.
4 - Empirical analysis
4.1 Unit root test
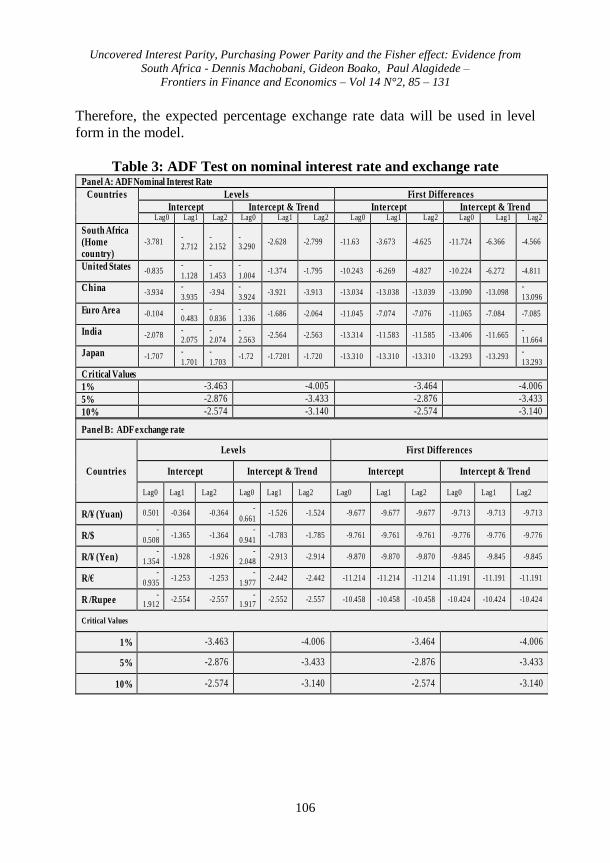
Table 3 shows the Augmented Dickey Fuller (ADF) unit root tests
results for the interest rate, interest rate differential between the domestic and
foreign country (Panel A), and exchange rate (Panel B) series. Results in
Panel A suggest that all the series of nominal domestic (South Africa) and
foreign interest rate are differenced-stationary, despite mixed orders of
integration at the levels.
Similar to Panel A, the evidence presented in Panel B shows that the
hypothesis of unit roots in the exchange rates can be rejected at the first
difference. The focus now turns to the analysis of the variables which enters
directly in the UIP models outlined in the methodology. The interest rate
differential is tested for presence of unit root using the ADF
procedure as the one followed above. The results which are presented in Table
4, shows that the interest rate differentials are first-differenced stationary. The
dependent variable, expected percentage exchange rate, ( is also tested
for stationarity in similar fashion as the interest rate differential and the results
which are presented in Table 5, shows a stationary process at the levels.
Uncovered Interest Parity, Purchasing Power Parity and the Fisher effect: Evidence from
South Africa - Dennis Machobani, Gideon Boako, Paul Alagidede –
Frontiers in Finance and Economics – Vol 14 N°2, 85 – 131
106
Therefore, the expected percentage exchange rate data will be used in level
form in the model.
Table 3: ADF Test on nominal interest rate and exchange rate
Panel A: ADF Nominal Interest Rate
Countries Levels First Differences
Intercept Intercept & Trend Intercept Intercept & Trend Lag0 Lag1 Lag2 Lag0 Lag1 Lag2 Lag0 Lag1 Lag2 Lag0 Lag1 Lag2
South Africa (Home country)
-3.781 -2.712
-2.152
-3.290
-2.628 -2.799 -11.63 -3.673 -4.625 -11.724 -6.366 -4.566
United States -0.835 -
1.128
-
1.453
-
1.004 -1.374 -1.795 -10.243 -6.269 -4.827 -10.224 -6.272 -4.811
China -3.934 -
3.935 -3.94
-
3.924 -3.921 -3.913 -13.034 -13.038 -13.039 -13.090 -13.098
-
13.096
Euro Area -0.104 -0.483
-0.836
-1.336
-1.686 -2.064 -11.045 -7.074 -7.076 -11.065 -7.084 -7.085
India -2.078 -2.075
-2.074
-2.563
-2.564 -2.563 -13.314 -11.583 -11.585 -13.406 -11.665 -11.664
Japan -1.707 -
1.701
-
1.703 -1.72 -1.7201 -1.720 -13.310 -13.310 -13.310 -13.293 -13.293
-
13.293
Critical Values
1% -3.463 -4.005 -3.464 -4.006
5% -2.876 -3.433 -2.876 -3.433
10% -2.574 -3.140 -2.574 -3.140
Panel B: ADF exchange rate
Countries
Levels First Differences
Intercept Intercept & Trend Intercept Intercept & Trend
Lag0 Lag1 Lag2 Lag0 Lag1 Lag2 Lag0 Lag1 Lag2 Lag0 Lag1 Lag2
R/¥ (Yuan) 0.501 -0.364 -0.364 -
0.661 -1.526 -1.524 -9.677 -9.677 -9.677 -9.713 -9.713 -9.713
R/$ -
0.508 -1.365 -1.364
-
0.941 -1.783 -1.785 -9.761 -9.761 -9.761 -9.776 -9.776 -9.776
R/¥ (Yen) -
1.354 -1.928 -1.926
-
2.048 -2.913 -2.914 -9.870 -9.870 -9.870 -9.845 -9.845 -9.845
R/€ -
0.935 -1.253 -1.253
-
1.977 -2.442 -2.442 -11.214 -11.214 -11.214 -11.191 -11.191 -11.191
R /Rupee -
1.912 -2.554 -2.557
-1.917
-2.552 -2.557 -10.458 -10.458 -10.458 -10.424 -10.424 -10.424
Critical Values
1% -3.463 -4.006 -3.464 -4.006
5% -2.876 -3.433 -2.876 -3.433
10% -2.574 -3.140 -2.574 -3.140

Uncovered Interest Parity, Purchasing Power Parity and the Fisher effect: Evidence from
South Africa - Dennis Machobani, Gideon Boako, Paul Alagidede –
Frontiers in Finance and Economics – Vol 14 N°2, 85 – 131
107
Table 4: ADF on interest rate differential
ADF Interest rate differential
Countries
Levels First Differences
Intercept Intercept & Trend Intercept Intercept & Trend
Lag0 Lag1 Lag2 Lag0 Lag1 Lag2 Lag0 Lag1 Lag2 Lag0 Lag1 Lag2
SA-CHN -2.942 -2.943 -1.873 -2.718 -2.719 -2.658 -
12.220 -6.970 -6.970
-
12.263 -6.952 -6.953
SA-USA -3.018 -2.339 -2.310 -2.407 -2.048 -2.310 -10.90 -6.21 -4.38 -10.96 -6.20 -4.32
SA-IND -2.077 -2.077 -2.077 -2.561 -2.561 -2.561 -
13.318 -
11.587 -
11.587 -
13.409 -
11.669 -
11.669
SA-JAP -3.730 -2.681 -2.143 -3.352 -2.682 -2.881 -
11.705 -6.461 -4.744
-
11.800 -6.463 -4.681
SA-EUR -4.780 -4.785 -2.933 -3.814 -3.814 -2.713 -
12.354 -7.243 -4.852
-12.600
-7.335 -4.934
Critical Values
1% -3.463 -4.005 -3.464 -4.006
5% -2.876 -3.433 -2.876 -3.433
10% -2.574 -3.140 -2.574 -3.140

Uncovered Interest Parity, Purchasing Power Parity and the Fisher effect: Evidence from
South Africa - Dennis Machobani, Gideon Boako, Paul Alagidede –
Frontiers in Finance and Economics – Vol 14 N°2, 85 – 131
108
Table 5: ADF test on expected percentage exchange rate
4.2 Co-integration test
Following from the unit root test, we apply the Johansen-Juselius
(1992) cointegration test to examine the possibility of a long-run equilibrium
relationship between and ( . The results are presented in
Table 6. We find at least one cointegrating equation in each pair, implying a
long run relationship between and ( . The assumption of
no cointegration in the series can therefore be rejected. Thus, despite the
possibility that the interest rate differential and the expected percentage
exchange rate can diverge substantially in the short-run, they will obey a long-
run equilibrium relationship.
ADF Percentage Exchange rate
Countries
Levels
Intercept Intercept & Trend
Lag0 Lag1 Lag2 Lag0 Lag1 Lag2
SA-CHN -9.762 -9.762 -9.762 -9.762 -9.762 -9.762
SA-USA -9.891 -9.891 -9.891 -9.881 -9.881 -9.881
SA-IND -10.624 -10.624 -10.624 -10.600 -10.600 -10.600
SA-JAP -10.163 -10.163 -10.163 -10.142 -10.142 -10.142
SA-EUR -11.011 -11.011 -11.011 -10.981 -10.981 -10.981
Critical Values
1% -3.464 -4.006
5% -2.876 -3.433
10% -2.574 -3.140

Uncovered Interest Parity, Purchasing Power Parity and the Fisher effect: Evidence from
South Africa - Dennis Machobani, Gideon Boako, Paul Alagidede –
Frontiers in Finance and Economics – Vol 14 N°2, 85 – 131
109
Table 6: Test for co-integration
4.3 Long run UIP
The co-integration results form a fundamental basis for examining the
two series (interest rate differential and the expected percentage exchange
rates) for each of the five UIP test cases using Ordinary Least Squares to yield
unbiased non-spurious regression results. Table 7 provides the long-horizon
OLS estimation results for the UIP model.
Included observations: 190 after adjustments.
Trend assumption: Linear deterministic trend
Lags interval (in first differences): 1 to 4
Hypothesized
Eigenvalue
Trace 0.05
Prob.** No. of Cointegrating
eqn(s) No. of CE(s) Statistic
Critical Value
SA-CHN None * 0.162 38.213 15.494 0.000
2 At most 1 * 0.036 6.140 3.848 0.010
SA-USA None * 0.168 39.757 15.491 0.000
2 At most 1 * 0.046 7.540 3.84 0.010
SA-IND None * 0.217 45.324 15.494 0.000
1 At most 1 * 0.012 1.485 3.841 0.220
SA-JAP None * 0.222 51.572 15.492 0.000
2 At most 1 * 0.034 5.565 3.844 0.020
SA-EUR None * 0.205 55.013 15.495 0.000
2 At most 1 * 0.063 12.635 3.846 0.000

Uncovered Interest Parity, Purchasing Power Parity and the Fisher effect: Evidence from
South Africa - Dennis Machobani, Gideon Boako, Paul Alagidede –
Frontiers in Finance and Economics – Vol 14 N°2, 85 – 131
110
Table 7: UIP long horizon (1999-2014)
In their UIP tests, Chinn & Meredith (2001) found that the UIP holds
only at long horizons. Therefore the analysis begins with testing for the UIP in
the long horizon. Examining the results from the UIP tests as depicted in
Table 7, for each of the five domestic-foreign cases, we get interesting results.
Starting with the β coefficient, the t-statistics and probability values suggest
that the hypothesized UIP relation is insignificant for four out of the five cases
(SA-CHN, SA-USA, SA-IND and SA-JAP). Similar to the findings of Lily et
al. (2011), the β coefficient for the SA-IND and SA-JAP has wrong signs,
opposed to the expectation of a positive slope coefficient. The UIP results for
the SA-EUR zone however, seems to suggest that the hypothesized UIP
relation between the euro-area and South Africa exists. In other words, the
results for the SA-EUR case support the UIP which emphasizes the efficiency
of the forward market, indicating that a country’s currency is expected to
depreciate against a foreign currency when the domestic interest rate rises
higher than that of the foreign country. This implies that South Africa’s rand
is expected to depreciate against the euro when South Africa’s interest rate
rises higher than those prevailing in the euro-area. However, the SA-EUR
exception does not hold for the other cases. The R2 values portrayed in the
table are very low, especially for the first four cases (SA-CHN, SA-USA, SA-
IND and SA-JAP), suggesting that the interest rate differential between South
Africa and the respective countries in the study are poor predictors of
et,t+k = + (rt,k rt,k ) + t,t+k
Variable Coefficient Std. Error t-Statistic Prob. 𝑹𝟐
(rSA rCHN )
𝜷 0.125 0.089 1.403 0.162 0.010
-0.011 0.005 -2.017** 0.045
(rSA rUSA )
𝜷 0.144 0.094 1.524 0.128
0.011 -0.011 0.006 -1.845* 0.066
(rSA rIND )
𝜷 -0.202 0.189 -1.067 0.287
0.005 0.012 0.013 0.972 0.331
(rSA rJAP )
𝜷 -0.011 0.100 -0.118 0.905
0.000 -0.001 0.008 -0.160 0.872
(rSA rEUR )
𝜷 0.282 0.118 2.372** 0.018
0.028 -0.018 0.007 -2.598** 0.010
Notes: ** and * indicates significance at 5% and 10% levels respectively.

Uncovered Interest Parity, Purchasing Power Parity and the Fisher effect: Evidence from
South Africa - Dennis Machobani, Gideon Boako, Paul Alagidede –
Frontiers in Finance and Economics – Vol 14 N°2, 85 – 131
111
movements in the exchange rate. The value of the R2
shows some minor
negligible improvement for the SA-EUR case (0.03), though still insufficient
to consider the interest rate differential as a good variable in explaining the
variation in expected percentage change in exchange rates. Having tested the
UIP at long horizon, we now turn to consider how the results differ when
testing the UIP in the short run.
4.4 Short run UIP
Table 8 shows the regression results from testing the UIP at short-
term horizon: 12 months, 16 months and 19 months. As it can be seen, the 12
months results reflect a definitive failure of the UIP, with very small t-
statistics, wrong signs and too large coefficients. The signs and magnitude of
the parameters seems to improve as we move from 12 month horizon to the 19
months horizon. In the 16 months and 19 month short-term horizon, two cases
are observed in support of the UIP, namely the SA-IND and SA-JAP.
However, the reduced degree of freedom associated with conducting UIP for
short term horizon presents a number of challenges and caution with which
the interpretation of the findings must be rendered, which could lead to
distorted regression results.
Table 8: UIP Short Horizon (2013-2014)
4.5 The Purchasing Power Parity (PPP) and the International Fisher
effect
The focus now turns to the related hypothesis of testing the validity of the
Purchasing Power Parity (PPP) and the international Fisher Effect. The
International Fisher Effect predicts that the domestic currency will depreciate
against that of a foreign trading partner as a result of an increase in the
et ,t+k = + (rt ,k rt ,k ) + t ,t+k
12 Months 16 Months 19 Months
Β t-Statistic t-Statistic Β t-Statistic
(rSA rCHN ) -5.075 -0.881 -0.392 -0.194 0.833 0.439
(rSA rUSA ) -2.853** -0.560 -0.572 1.768 0.600 0.345
(rSA rIND ) -0.300 -0.739 1.044 2.672** 3.322*** 4.381***
(rSA rJAP ) 8.621 1.298 0.79 0.338 2.890** 1.139
(rSA rEUR ) 0.700 0.396 1.118 1.246 1.803 1.777
Notes: *** , ** and * indicates significance at 1%, 5% and 10% levels respectively.

Uncovered Interest Parity, Purchasing Power Parity and the Fisher effect: Evidence from
South Africa - Dennis Machobani, Gideon Boako, Paul Alagidede –
Frontiers in Finance and Economics – Vol 14 N°2, 85 – 131
112
domestic real interest rates above those of the foreign counterpart. On the
other hand, the PPP relates the changes between currencies of two countries
over a period of time to changes in the price levels between the two countries
(Dornbusch, 1985). The PPP and the International Fisher Effect are therefore
in many aspects comparable with the UIP.
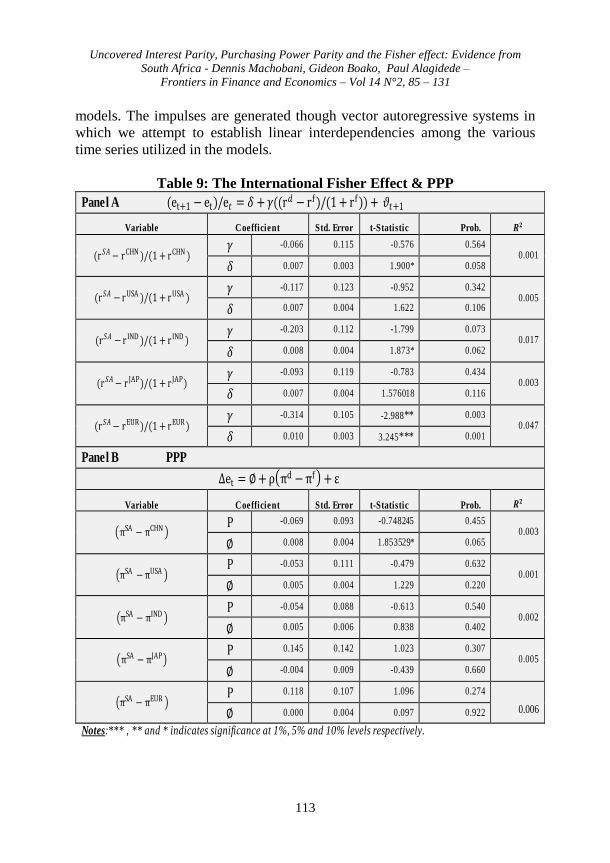
Table 9 shows the OLS results of both the International Fisher Effect
(Panel A) and the PPP (Panel B). Except for the SA-EUR case under the
International Fisher Effect which seems to reflect a significant relationship
between the real interest rate differential on the real foreign rate against the
expected percentage change in exchange rate, the rest of the cases do not seem
to display any evidence to suggest any statistically significant relationship
between the interest rate differential, inflation and the changes in the domestic
exchange rate. Nor does the value of the R2
across all the International Fisher
and PPP cases indicate any explanatory power of the interest rate differential
or inflationary differences to explain variations in the expected percentage
exchange rate. The findings from the UIP tests regarding the SA-EUR case
which suggested that the UIP could hold between South Africa and the Euro-
area is confirmed in the International Fisher Effect but not in the PPP results
displayed in Panel B of Table 9.
In Table 9, evidence in support of the International Fisher Effect is
found for the SA-EUR case, with significant values of both the slope and
intercept coefficients. This finding is similar to the results in Table 7 which
also suggest some evidence in support of the UIP for the case of SA-EUR.
However, neither the PPP nor the International Fisher Effect holds for the
other four cases, as the t-statistics yields insignificant results, as was found
when testing for the validity of the UIP. The implication for the failure of the
International Fisher Effect to hold is that a country with higher interest rates
need not necessarily be matched by higher inflation. This also implies that an
increase in inflation may not necessarily be accompanied by a depreciation of
the currency.
4.6 Impulse responses
The evidence in favour of the UIP and the International Fisher hypothesis
necessitates some more scrutiny on the response of the exchange rate to
shocks in the economy due to nominal interest rates and inflation. In this
section, we closely examine the dynamic reaction of the models to changes in
external factors. An impulse response is used to investigate these reactions as
function of time and other variables which are of interest in the dynamic
Uncovered Interest Parity, Purchasing Power Parity and the Fisher effect: Evidence from
South Africa - Dennis Machobani, Gideon Boako, Paul Alagidede –
Frontiers in Finance and Economics – Vol 14 N°2, 85 – 131
113
models. The impulses are generated though vector autoregressive systems in
which we attempt to establish linear interdependencies among the various
time series utilized in the models.
Table 9: The International Fisher Effect & PPP
Panel A (et+1 et)/e = 𝛿 + ((r𝑑 rf )/(1 + rf )) + +1
Variable Coefficient Std. Error t-Statistic Prob. 𝑹𝟐
(r𝑆𝐴 rCHN )/(1 + rCHN ) -0.066 0.115 -0.576 0.564
0.001
𝛿 0.007 0.003 1.900* 0.058
(r𝑆𝐴 rUSA )/(1 + rUSA ) -0.117 0.123 -0.952 0.342
0.005
𝛿 0.007 0.004 1.622 0.106
(r𝑆𝐴 r IND )/(1 + r IND ) -0.203 0.112 -1.799 0.073
0.017
𝛿 0.008 0.004 1.873* 0.062
(r𝑆𝐴 r JAP)/(1 + r JAP) -0.093 0.119 -0.783 0.434
0.003
𝛿 0.007 0.004 1.576018 0.116
(r𝑆𝐴 rEUR )/(1 + rEUR ) -0.314 0.105 -2.988** 0.003
0.047
𝛿 0.010 0.003 3.245*** 0.001
Panel B PPP
et = + d f +
Variable Coefficient Std. Error t-Statistic Prob. 𝑹𝟐
SA CHN Ρ -0.069 0.093 -0.748245 0.455
0.003
0.008 0.004 1.853529* 0.065
SA USA Ρ -0.053 0.111 -0.479 0.632
0.001
0.005 0.004 1.229 0.220
SA IND Ρ -0.054 0.088 -0.613 0.540
0.002
0.005 0.006 0.838 0.402
SA JAP Ρ 0.145 0.142 1.023 0.307
0.005
-0.004 0.009 -0.439 0.660
SA EUR Ρ 0.118 0.107 1.096 0.274
0.006 0.000 0.004 0.097 0.922
Notes:*** , ** and * indicates significance at 1%, 5% and 10% levels respectively.

Uncovered Interest Parity, Purchasing Power Parity and the Fisher effect: Evidence from
South Africa - Dennis Machobani, Gideon Boako, Paul Alagidede –
Frontiers in Finance and Economics – Vol 14 N°2, 85 – 131
114
The responses of inflation and nominal interest rate to shocks in the
exchange rate are shown in Fig. 4. We observe that, in the event of shock in
the economy due to nominal interest rate increase, the rand will appreciate by
approximately 2% against the euro in the first period. An external shock due
to increase in nominal interest rate in the euro-area leads initially to a transient
0.02% appreciation of the rand in the first period, before it depreciates against
the euro by approximately 0.5%. However, this rather erratic path of response
does not appear to be consistent with the UIP prediction, supporting the
generally accepted proposition in the literature that the UIP in most cases fail
to hold.
Following a domestic inflationary shock, the rand will adjust to the
shock by depreciating against the euro by 1.8%, in line with the PPP and
Fisher hypothesis (see Fig. 4). This behaviour could be attributed to a wide
variety of factors. An increase in domestic inflation generally reduces the
competitiveness of a country’s currency in relation to that of the foreign
trading partner. These findings are related with Mishkin’s (1992) evidence in
favour of the long-run Fisher Effect which showed how inflation has an effect
on the exchange rate through the effects on interest rates, as they both have a
common stochastic trend. The opposite happens when there are positive
inflationary shocks in the euro-area, leading to a 1.9% appreciation in the
rand, attributed to improving domestic competitiveness. A sudden exchange
rate shock has an effect of increasing domestic inflation to 0.5% in the first
period, before it eventually dampens to 0%.

Uncovered Interest Parity, Purchasing Power Parity and the Fisher effect: Evidence from
South Africa - Dennis Machobani, Gideon Boako, Paul Alagidede –
Frontiers in Finance and Economics – Vol 14 N°2, 85 – 131
115
Figure 3: Impulse Response Functions to shocks
-.002
.000
.002
.004
.006
1 2 3 4 5 6 7 8 9 10
Response of SA nominal rates to shock in R/€
-.4
-.2
.0
.2
.4
.6
1 2 3 4 5 6 7 8 9 10
Response of R/€
to shock in SA nominal rates
-.4
-.2
.0
.2
.4
.6
1 2 3 4 5 6 7 8 9 10
Response of R/€
to shock in SA Inflation
-.4
-.2
.0
.2
.4
.6
1 2 3 4 5 6 7 8 9 10
Response of R/€
to shock in Euro nominal rates
-.4
-.2
.0
.2
.4
.6
1 2 3 4 5 6 7 8 9 10
Response of R/€
to shock in Euroarea Inflation
-.002
.000
.002
.004
.006
1 2 3 4 5 6 7 8 9 10
Response of SA inflation to shock in R/€

Uncovered Interest Parity, Purchasing Power Parity and the Fisher effect: Evidence from
South Africa - Dennis Machobani, Gideon Boako, Paul Alagidede –
Frontiers in Finance and Economics – Vol 14 N°2, 85 – 131
116
4.7 Causality test: UIP, PPP and the International Fisher Effect
The next step involves looking at Granger Causality tests as initially
proposed by Granger (1969) to examine whether there is a lead-lag effect
between different series. For instance, the UIP hypothesis surmises that the
interest rate differential between domestic and foreign country can be used to
explain the expected percentage change in the exchange rate. The Granger
Causality test therefore is interested in testing the validity of such hypothesis.
Correlation is characterized by a tendency of variables to move together
whether in positive or negative direction. In the case of UIP for instance,
interest rate differential and expected percentage change in exchange rates
appear to exhibit a correlated pattern in which the increase in the domestic
interest rate occurs at the same time at which the exchange rate depreciates.
However, it cannot necessarily be the case that the depreciation was caused by
the increase in the domestic interest rate. The significance of the Granger test
lies in separating relationships which are merely due to statistical correlation
from those that are causal in nature. Thus, interest rate differential
can be considered to Granger-cause expected percentage in exchange
rate, if it can be proved, usually through F-tests and probability values
that the lagged values of yields information in respect of future
values of that is statistically significant. Table 10 provides such
information, where column 1 shows the null hypothesis to be tested for each
of the series. Column 2 and column 3 provide the F-tests and probability
values respectively. Starting with the UIP examination for any causality in the
series, the table displays the results for the PPP and the International Fisher
Effect.
The UIP tests for each of the five cases shows that the interest rate
differential series between South Africa and China does not Granger cause
movements in the expected percentage exchange rate. Instead, it is the
exchange rate movement which seems to have causal effect on the interest
rate differential. The results are the same for the SA-USA case which show
that the interest rate differential does not cause changes in the rand/dollar
exchange rate. The SA-IND and SA-JAP cases show that neither the interest
rate differential nor the exchange rate has any causal effect on each other. The
evidence in favour of the UIP for the SA-EUR case as displayed in Table 7 is
confirmed in the Granger Causality test, as the information in Table 7 shows
that the hypothesis positing that the series , can be used to predict

Uncovered Interest Parity, Purchasing Power Parity and the Fisher effect: Evidence from
South Africa - Dennis Machobani, Gideon Boako, Paul Alagidede –
Frontiers in Finance and Economics – Vol 14 N°2, 85 – 131
117
movements in the rand/euro exchange rate cannot be rejected, with the F-test
value of 2.97.
Most of the evidences from the PPP also show that with the exception
of the SA-EUR case, the inflation rate differential series cannot be
said to cause changes in the exchange rate. The null hypothesis of no causal
relationship between the series in the International Fisher Effect model is seen
across all tested cases.

Uncovered Interest Parity, Purchasing Power Parity and the Fisher effect: Evidence from
South Africa - Dennis Machobani, Gideon Boako, Paul Alagidede –
Frontiers in Finance and Economics – Vol 14 N°2, 85 – 131
118
Table 10: Granger Causality
Null Hypothesis:
F-
Statistic Prob.
UIP
(rSA rCHN )does not Granger Cause Percentage change R/¥ (Yuan)
1.161 0.313
Percentage Change R/¥ (Yuan) does not Granger Cause (rSA rCHN )
4.864 0.01
(rSA rUSA
) does not Granger Cause Percentage change R/$ 2.704 0.080
Percentage change R/$ does not Granger Cause (rSA rUSA )
4.752 0.012
(rSA rIND ) does not Granger Cause Percentage change R /₹
1.992 0.143
Percentage change R /₹ does not Granger Cause (rSA rIND )
0.114 0.905
(rSA rJAP ) does not Granger Cause Percentage change R/¥ (Yen)
0.284 0.768
Cause Percentage change R/¥ (Yen) does not Granger Cause (rSA rJAP )
1.154 0.323
(rSA rEUR ) does not Granger Cause Percentage change R/€
2.978 0.051
Percentage change R/€ does not Granger Cause (rSA rEUR )
3.340 0.047
PPP
SA CHN does not Granger Cause Percentage change R/¥ (Yuan) 2.336 0.106
Percentage change R/¥ (Yuan) does not Granger Cause SA CHN 6.525 0.000
SA USA does not Granger Cause Percentage change R/$ 3.070 0.056
Percentage change R/$ does not Granger Cause SA USA 9.70 0.00
SA IND does not Granger Cause Percentage change R /₹ 0.106 0.90
Percentage change R /₹ does not Granger Cause SA IND 0.73 0.485
SA JAP does not Granger Cause Percentage change R/¥ (Yen) 1.873 0.163
Percentage change R/¥ (Yen) does not Granger Cause SA JAP 4.543 0.015
SA EUR does not Granger Cause Percentage change R/€ 6.995 0.001
Percentage change R/€ does not Granger Cause SA EUR 3.805 0.023
International Fisher Effect
SA-CHN Real Interest differential factor does not Granger Cause Percentage change R/¥ (Yuan)
0.853 0.432
Percentage change R/¥ (Yuan) does not Granger Cause SA-CHN Real Interest differential factor
1.212 0.307
SA-US Real Interest differential factor does not Granger Cause Percentage change R/$
0.723 0.498
Uncovered Interest Parity, Purchasing Power Parity and the Fisher effect: Evidence from
South Africa - Dennis Machobani, Gideon Boako, Paul Alagidede –
Frontiers in Finance and Economics – Vol 14 N°2, 85 – 131
119
4.8 Why the UIP, PPP and International Fisher Effect?
The theoretical UIP hypothesis that an increase in domestic interest
rate should be accompanied by a depreciation of the rand against that of the
trading partner is violated for a number of reasons. The failure of these related
three hypothesis is that the capital markets are inefficient, attributed mainly to
adverse selection and moral hazard (Stiglitz & Weiss, 1981). Specifically,
other factors closely associated with inefficient capital markets include the
presence of transaction costs, taxes, differences in borrowing costs across
countries and the existence of asymmetric information (Modigliani & Miller,
1958). When the borrowing costs are not the same, investors will always
choose to borrow from low interest countries and this may prevent the UIP
and International Fisher effect from being fulfilled.
However, the other reason concerns short-term investors chasing
higher yields. Contrary to the UIP and the International Fisher Effect, an
increase in interest rate differential as a result of an increase in domestic
interest rates may cause the rand to appreciate. This phenomenon has been
observed in the South African economy in which interest rates hikes in the
United States has often led to capital flight out of the South African economy,
resulting in currency depreciation. A decrease in returns due to a decrease in
nominal interest rates following a monetary contraction action by the South
African Reserve Bank, will lead to foreign investors seeking higher return on
their holdings to sell the rand in exchange for a foreign currency whose return
is higher. This action leads to an increase in the supply of rand, thereby
causing a depreciation of the rand.
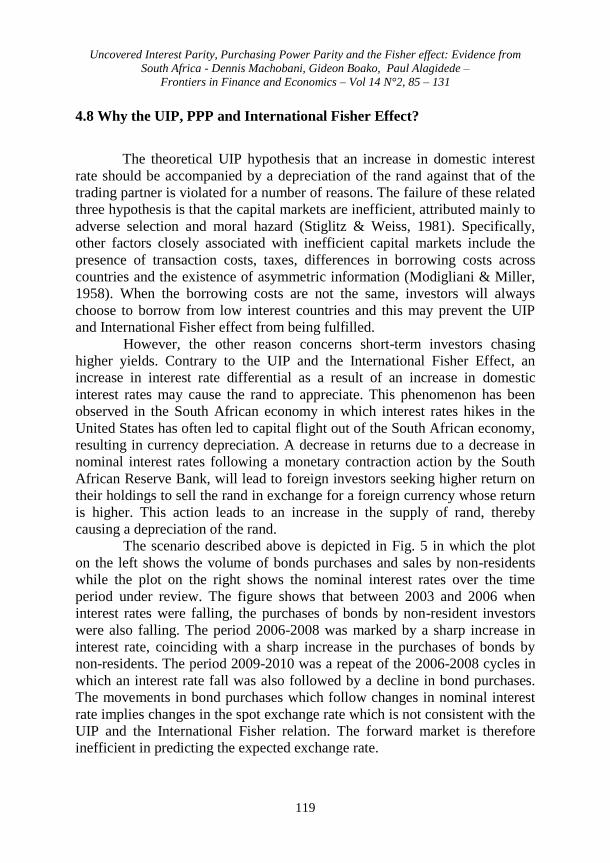
The scenario described above is depicted in Fig. 5 in which the plot
on the left shows the volume of bonds purchases and sales by non-residents
while the plot on the right shows the nominal interest rates over the time
period under review. The figure shows that between 2003 and 2006 when
interest rates were falling, the purchases of bonds by non-resident investors
were also falling. The period 2006-2008 was marked by a sharp increase in
interest rate, coinciding with a sharp increase in the purchases of bonds by
non-residents. The period 2009-2010 was a repeat of the 2006-2008 cycles in
which an interest rate fall was also followed by a decline in bond purchases.
The movements in bond purchases which follow changes in nominal interest
rate implies changes in the spot exchange rate which is not consistent with the
UIP and the International Fisher relation. The forward market is therefore
inefficient in predicting the expected exchange rate.
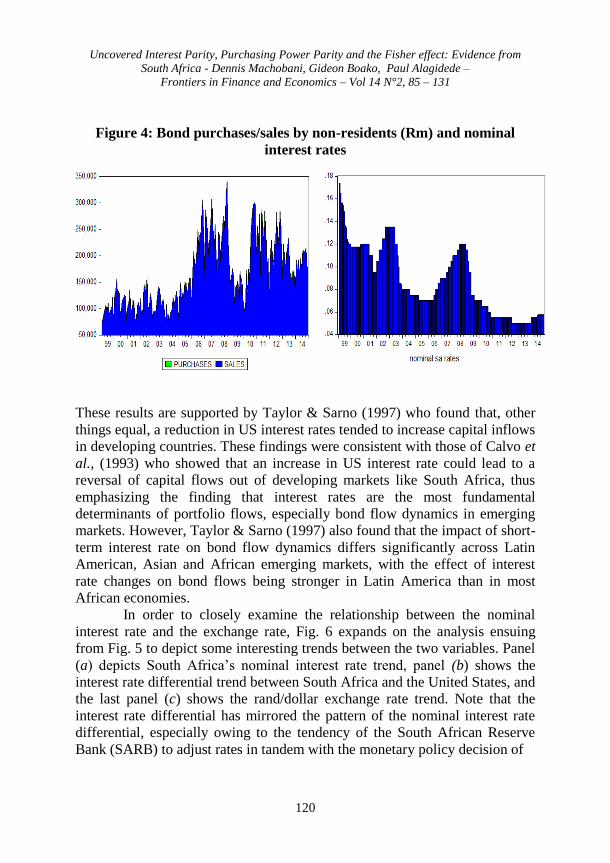
Uncovered Interest Parity, Purchasing Power Parity and the Fisher effect: Evidence from
South Africa - Dennis Machobani, Gideon Boako, Paul Alagidede –
Frontiers in Finance and Economics – Vol 14 N°2, 85 – 131
120
Figure 4: Bond purchases/sales by non-residents (Rm) and nominal
interest rates
These results are supported by Taylor & Sarno (1997) who found that, other
things equal, a reduction in US interest rates tended to increase capital inflows
in developing countries. These findings were consistent with those of Calvo et
al., (1993) who showed that an increase in US interest rate could lead to a
reversal of capital flows out of developing markets like South Africa, thus
emphasizing the finding that interest rates are the most fundamental
determinants of portfolio flows, especially bond flow dynamics in emerging
markets. However, Taylor & Sarno (1997) also found that the impact of short-
term interest rate on bond flow dynamics differs significantly across Latin
American, Asian and African emerging markets, with the effect of interest
rate changes on bond flows being stronger in Latin America than in most
African economies.
In order to closely examine the relationship between the nominal
interest rate and the exchange rate, Fig. 6 expands on the analysis ensuing
from Fig. 5 to depict some interesting trends between the two variables. Panel
(a) depicts South Africa’s nominal interest rate trend, panel (b) shows the
interest rate differential trend between South Africa and the United States, and
the last panel (c) shows the rand/dollar exchange rate trend. Note that the
interest rate differential has mirrored the pattern of the nominal interest rate
differential, especially owing to the tendency of the South African Reserve
Bank (SARB) to adjust rates in tandem with the monetary policy decision of

Uncovered Interest Parity, Purchasing Power Parity and the Fisher effect: Evidence from
South Africa - Dennis Machobani, Gideon Boako, Paul Alagidede –
Frontiers in Finance and Economics – Vol 14 N°2, 85 – 131
121
Figure 5: Nominal Interest rate, Interest rate differential and
Rand/dollar relationship
the Federal Reserve Bank. Coincidentally, in order to stimulate
domestic demand, both South Africa and the United States have cut rates
aggressively following the 2008 financial crisis.
.04
.08
.12
.16
.20
2000 2002 2004 2006 2008 2010 2012 2014
(a) SA Nominal Interest Rates
.00
.04
.08
.12
.16
2000 2002 2004 2006 2008 2010 2012 2014
(b) SA US Nominal Interest Rate Differential
4
6
8
10
12
14
2000 2002 2004 2006 2008 2010 2012 2014
(c) R/$
1 2 3 4 5

Uncovered Interest Parity, Purchasing Power Parity and the Fisher effect: Evidence from
South Africa - Dennis Machobani, Gideon Boako, Paul Alagidede –
Frontiers in Finance and Economics – Vol 14 N°2, 85 – 131
122
Figure 6 divides South Africa’s nominal interest rate trend from 1999-2015
into 5 phases. Period 1999-2000 marks the first phase characterized by
interest rate decline. The second phase begins in 2001 with a moderate rise in
interest rates until 2002. Interest rates began falling again from 2003 through
2005, denoted as the third phase. Period 2006-2007 represents the fourth
phase in which SARB aggressively hiked interest rate to curb inflation
(Rangasamy, 2009). The 2008 financial crisis prompted SARB to begin a
series of interest rate cuts beginning late in 2008. The unprecedented
reduction in interest rates was compounded by the Eurozone 2011-2013
sovereign debt crisis which resulted in a significant decline in global
aggregate demand, marking the fifth phase in our study (2008-2015).
Turning to the analysis of these five phases, when interest rates were
falling from 1999-2000, the South Africa rand depreciated from R6 per dollar
to R8 per dollar, peaking at R12 per dollar in late 2000. The second phase
(2001-2002) was associated with a general rise in interest rates, coinciding
with a period of appreciation of the rand against the America dollar. The third
phase (2003-2005) mimicked the first phase as interest rates began falling
again. However, contrary to the first phase in which the fall in interest rate
appeared to coincide with the rand depreciation, the rand does not
spontaneously react to the decrease in interest rate until 2004 after which the
transition towards depreciation begins. As the interest rate began rising
sharply in efforts to curtail inflation by the monetary authority, the rand/dollar
exchange rate became more volatile, though the rand generally depreciated.
As the interest rates began falling in the fifth phase amid fears of recession,
the rand was appreciating against the dollar until 2011, from which it reversed
into a major depreciating trajectory.
The patterns observed above reveal that the periods of decline in
South Africa’s interest rates are associated with periods of depreciation of the
rand. Conversely, a general increase in South Africa’s interest rates tends to
elicit an appreciation of the rand against the American dollar. This has been
found to be the case for all the phases except the fourth phase in which the
rand depreciated in spite of the increase in interest rates during 2006-2007.
These results support the evidence in favour of the rejection of the UIP and to
a broader extent, the rejection of the associated PPP and the International
Fisher Effect. The relationship between the interest rate and the rand/dollar
exchange rate seems plausible with the notion that investors tend to chase
higher yields, leading to currency depreciation when the domestic interest
rates fall.

Uncovered Interest Parity, Purchasing Power Parity and the Fisher effect: Evidence from
South Africa - Dennis Machobani, Gideon Boako, Paul Alagidede –
Frontiers in Finance and Economics – Vol 14 N°2, 85 – 131
123
The phenomenon outlined in the preceding paragraph explains the
major part concerning the failure of the UIP to hold. In their work for
emerging markets, Bosworth et al. (1999) acknowledge that in order to quell
capital outflows, emerging markets may be forced to raise interest rates. The
authors also indicate that portfolio flows are more sensitive to changes in
interest rate than Foreign Direct Investment (FDI). While this paper does not
delve into a detailed examination of the possible causes of the failure of the
PPP, the existence of transportation costs and trade barriers and the lack of
competition in the goods market are understood as reasons behind the failure
of the PPP to hold (Aizenman, 1984, 1985; Rogers & Jenkins, 1995). The
difference in taste between countries and non-tradable goods has also
frequently been cited as reasons behind the failure of the PPP (Warnock,
1998).
5 – Conclusion
In this paper, the Uncovered Interest Parity (UIP), the International
Fisher Effect (IFE) and the Purchasing Power Parity (PPP) hypothesis were
tested in the context of South Africa as an emerging economy. Similar to
Chinn & Meredith (2001), the Uncovered Interest Parity was tested at both
long and short-term horizon to establish whether the claim advanced by some
authors that the UIP holds only to the long run applies in emerging market
context. We employed the Johansen co-integration test to determine whether
any long term relationship existed between the dependent and independent
variables during the sampled period. The co-integration result support the
existence of long term relationship between the variables in question.
The study did not find any evidence in support of the UIP in the long-
term horizon for all the cases except for the SA-EUR. The OLS results did not
provide any strong support of the UIP in the short-term horizon, except for the
case of SA-IND. Like many other extant studies, the UIP is therefore
generally rejected. The results from the International Fisher Effect were also
predominantly insignificant, though consistent with the UIP test, there seems
to be some moderate evidence in support of the International Fisher Effect for
the case of the SA-EUR. The PPP is also rejected for all the cases as the t-
statistics all yield insignificant results. The R-squares for all the cases were
found to be low, suggesting the exchange rate is instead explained by many
other factors, not just the changes in nominal and real interest rates and the

Uncovered Interest Parity, Purchasing Power Parity and the Fisher effect: Evidence from
South Africa - Dennis Machobani, Gideon Boako, Paul Alagidede –
Frontiers in Finance and Economics – Vol 14 N°2, 85 – 131
124
rate of inflation. Impulse response functions were used to determine the effect
of shocks in interest rates and inflation on the exchange rate in a dynamic
system. The results from the impulse response functions provide more
evidence for the rejection of the UIP, IFE and PPP. Contrary to the UIP
hypothesis, the impulse response functions showed that in the event of shock
in the economy due to nominal interest rate increase, the rand will generally
appreciate by approximately 2% against the foreign country currency in the
first period. Moreover, an external shock due to increase in nominal interest
rate in the euro-area leads initially to a transient 0.02% appreciation of the
rand in the first period, before it depreciates against the euro by approximately
0.5%.
Granger causality tests results also showed that under the UIP tests
for each of the five cases the interest rate differential series does not Granger
cause movements in the expected percentage exchange rate. Instead, it is the
exchange rate movement which seems to have causal effect on the interest
rate differential. Most of the evidence from the PPP also showed that with the
exception of the SA-EUR case, the inflation rate differential series could not
cause changes in the exchange rate. The same results were found for the IFE
case.
Plausibly, the failure of the PPP, UIP, and IFE could be due to the
existence of transaction costs and taxes between countries. In addition,
investors also tend to chase higher returns for their assets, a phenomenon
recently seen across emerging markets including South Africa. Interest rates
hikes in the trading partner countries have often led to capital flight out of
South Africa, resulting in rand depreciation. A decrease in returns due to a
decrease in nominal interest rates following a monetary contractionary action
by the South African Reserve Bank, will lead to foreign investors seeking
higher return on their holdings to sell the rand in exchange for a foreign
currency whose return is higher. This action leads to an increase in the supply
of rand, thereby causing a depreciation of the rand. Movements in purchases
and sale/purchase of treasury bonds have also mirrored trends in interest rates
as set by the Monetary Policy Committee.
By dividing South Africa’s interest rate trends into five phases
between 1999 and 2015 and analyzing the movements in exchange rate
following changes to interest rate and the interest rate differential, it was
shown that the adjustment of the rand to changes in levels of interest rate is
not consistent with UIP. This more pragmatic analysis suggests that an
increase in South Africa’s interest rates prompts more capital inflows from
foreign investors, leading to currency appreciation. The implication of these

Uncovered Interest Parity, Purchasing Power Parity and the Fisher effect: Evidence from
South Africa - Dennis Machobani, Gideon Boako, Paul Alagidede –
Frontiers in Finance and Economics – Vol 14 N°2, 85 – 131
125
results is that the movements in the rand are influenced primarily by
investor’s actions in pursuit of higher yields -withdrawing funds when the
interest rate fall and conversely supplying more capital when interest rates
increases, leading the currency to appreciate. These results imply that capital
markets may still be inefficient, justifying more government intervention to
eliminate inefficiencies. These interventions could include implementing
capital controls to avoid excessive outflows during periods of economic
slumps. Future research in relation to the effectiveness of such capital controls
should explore each of the different mechanisms to understand the extent to
which each alternative would be most effective. A limitation of the models
used in this paper is that they do not fully capture the dynamic trends in
capital markets, especially as the markets become even more sophisticated.
The OLS method also does not most accurately capture the time-varying risk
premium required by investors, which could potentially affect the findings of
the study.
Footnotes
1. Since the 1970s, South Africa has had three interest rate regimes. The
liquid asset ratio-based system characterized by quantity controls on
credit and interest rate was typical and predominantly favoured
through the 1970s until the 1980s (Aron & Muellbauer, 2007). The
1985 Commission Report by de Kock recommended reforms which
led to a move towards cash-reserves based system enacted along with
the controls on interest rate. By 1986, the second regime was in
operation and focused more on monetary targets whose effectiveness
was undermined by the liberalization of financial markets which had
already commenced in the early 1980s (Fry, 1997). The interest rate
trend was more volatile and the systems of the two regimes were less
credible (Aron & Muellbauer, 2007). In an effort to enhance the
transparency, predictability and credibility of monetary policy, the
South African Reserve Bank transitioned into the third regime by
adopting inflation targeting in 2000. Under this regime, interest rate
is set and determined by the Monetary Policy Committee. Comparison
between the three interest rate regimes reveals that South Africa’s
interest rates were relatively higher during the 1970s. However, at
the end of 2000, interest rate began falling sharply from their
historical level, reaching 7 percent in 2006. In the same year, interest
rate trend reversed, rising moderately to 12 percent in 2008.

Uncovered Interest Parity, Purchasing Power Parity and the Fisher effect: Evidence from
South Africa - Dennis Machobani, Gideon Boako, Paul Alagidede –
Frontiers in Finance and Economics – Vol 14 N°2, 85 – 131
126
However, the 2008-2009 Global Financial Crisis led to interest rate
decline.
References
Adler, M. and Lehmann, B. 1983. Deviations from purchasing power parity in
the long run. Journal of Finance, 38 (22): 1471 – 1487.
Adrangi, B., Raffiee, K. and Shank, T. M. 2011. An ex-post investigation of
interest rate parity in Asian emerging markets. International Business
and Economics Research Journal (IBER), 6(2):18-31
Aizenman, J. 1984. Modeling deviations from PPP. International Economic
Review, 25 (4):175-190.
Aizenman, J. 1985. Adjustment to monetary policy and devaluation under
two-tier and fixed exchange rate regimes. Journal of Development
Economics, 18:153-169.
Aliber, R. Z. and Stickney, C. P. 1975. Accounting measures of foreign
exchange exposure: the long and short of it. Accounting Review,
50:44-57.
Alper, C. E., Ardic, O. P. and Fendoglu, S. 2009. The economics of the
uncovered interest parity condition for emerging markets. Journal of
Economic Surveys, 23(1):115-138.
Aron, J. and Muellbauer, J. 2007. Review of monetary policy in South Africa
since 1994. Journal of African Economies, 16 (5): 705-744.
Block, S. A. and Vaaler, P. M. 2004. The price of democracy: sovereign risk
ratings, bond spreads and political business cycles in developing
countries. Journal of International Money and Finance, 23(6):917-
946.
Bosworth, B. P., Collins, S. M. and Reinhart, C. M. 1999. Capital flows to
developing economies: implications for saving and
investment. Brookings Papers on Economic Activity 40(2):143-180.
Calvo, G.A., Leonardo L, and Carmen M.R. 1993. Capital inflows and the
real exchange rate appreciation in Latin America: The role of external
factors. IMF Staff Papers 40(l):108-51
Cao, Charles, Yong Chen, William N. Goetzmann, and Bing Liang. "The role
of hedge funds in the security price formation process." Available at
SSRN 2121495 2015.

Uncovered Interest Parity, Purchasing Power Parity and the Fisher effect: Evidence from
South Africa - Dennis Machobani, Gideon Boako, Paul Alagidede –
Frontiers in Finance and Economics – Vol 14 N°2, 85 – 131
127
Caporale, G. M., Kalyvitis, S. and Pittis, N. 2001. Testing for PPP and UIP
in an FIML framework: Some evidence for Germany and Japan.
Journal of Policy Modeling, 23(6): 637-650.
Cargill, T. F. 2001. Monetary policy, deflation, and economic history: lessons
for the Bank of Japan. Monetary and Economic Studies (Special
Edition), 22:10-22.
Cheung, Y.W., Chinn, M. and Pascual, D.A. 2005. Empirical exchange rate
models of the Nineties: Are any fit to survive? Journal of
International Money and Finance, 24 (7):1150-1175.
Chinn, M. and Meredith, G. 2001. Testing uncovered interest parity at
short and long horizons. Working Paper No.13560. Retrieved from
the National Bureau of Economic Research
website:http://www.nber.org/papers/w11077
Chinn, M. 2006. The (partial) rehabilitation of interest rate parity in
floating rate era: longer horizons, alternative expectations and
emerging markets. Journal of International Money and Finance,
25 (9):7-21.
Chinn, M. and Meredith, G. 2005. Monetary policy and long horizon
uncovered interest parity. IMF Staff Papers, 51 (3):409-430.
Cogley, T. and Sargent, T. J. 2005. The conquest of US inflation: learning
and robustness to model uncertainty. Review of Economic dynamics,
8(2):528-563.
Coppock, L. and Poitras, M. 2000 Evaluating the Fisher Effect in the long-
term cross-country averages. International Review of Economics and
Finance, 9:181-192.
Cumby, R. E. and Obstfeld, M. 1981. A note on the exchange-rate
expectations and nominal interest differentials: a test of the Fisher
hypothesis. Journal of Finance, 36 (2):697 – 703.
Davidson, J. E. H. 1985. Econometric modelling of the Sterling effective
exchange rate. Review of Economic Studies, 52:231 – 250.
Demirag, I. and Goddard, S. 1994. Financial management for international
business. Maidenhead,, UK: McGraw-Hill.
Dornbusch, R. 1985. Purchasing power parity. National Bureau of Economic
Research. Working Paper No. w1591.
Dornbusch, R. 1989. Real exchange rates and macroeconomics: a selected
survey. Scandinavian Journal of Economics, 91 (12), pp. 401 – 432.
Engel, C. 1996. The forward d i s c o u n t a n o m a l y a n d t he r isk
premium: A survey of the recent evidence. Journal of Empirical
Finance, 3 (2), pp.123-92.
Uncovered Interest Parity, Purchasing Power Parity and the Fisher effect: Evidence from
South Africa - Dennis Machobani, Gideon Boako, Paul Alagidede –
Frontiers in Finance and Economics – Vol 14 N°2, 85 – 131
128
Engle. R.F. and C.W.J. Granger, 1987. Co-integration and error correction:
Representation, estimation and testing, Econometrica 55, 251-276.
Fisher, E. and Park, J. Y. 1991. Testing purchasing power parity under the
null hypothesis of Co-integration. Economic Journal, 101 (2): 1476 –
1484.
Foy, T.M. 2005. An empirical analysis of uncovered interest rate parity and
the forward discount anomaly. Department of Economics,
Queen’s University, Ontario, Canada, (3)6, pp.1-8.
Fry, M. J. 1997. In favour of financial liberalisation. The economic
journal, 107(442):754-770.
Gonzalo, J. 1994. Five alternative methods of estimating long-run
equilibrium relationships. Journal of econometrics, 60(1):203-233.
Goodfriend, M. and Prasad, E. S. 2006. A framework for independent
monetary policy in China. International Monetary Fund Working
Paper, 6:1-52.
Granger, C.E.J. 1969. Investigating causal relations by econometric models
and cross-spectral methods. Econometrica, 37(3): 424-438.
Hansen, L. P. and Hodrick, R. J. 1980. Forward exchange rates as optimal
predictors of future spot rates: An econometric analysis. The
Journal of Political Economy, pp. 829-853.
Huizinga, J. 1987. An empirical investigation of the long-run behaviour of
real exchange rates. Carnegie Rochester Conference Series on Public
Policy, 27 (2):149 – 214.
Isard, P. 1996. Uncovered interest parity. The Economic Journal, 113
(23):34-52.
Ito, T. and Mishkin, F. S. 2006. Two decades of Japanese monetary policy
and the deflation problem. In monetary policy with very low
inflation in the Pacific Rim, NBER-EASE. University of Chicago
Press, 15 (2), pp. 131-202.
Johansen, S. 1991. Estimation and hypothesis testing of co-integration vectors
in Gaussian vector autoregressive models. Econometrics, 59 (6):1551
– 1580.
Johansen, S. and Juselius, K. 1992. Testing structural hypotheses in a
multivariate Co-integration analysis of the PPP and the UIP for UK.
Journal of Econometrics, 53 (3):211 – 244.
Kane, A. And Rosenthal, L. 1982. International Interest Rates and Inflationary
Expectations. Journal of International Money and Finance, 1:97-110. Koo, R. 2011. The world in balance sheet recession: causes, cure, and
politics. Real-world economics review, 58(12), pp. 19-37.

Uncovered Interest Parity, Purchasing Power Parity and the Fisher effect: Evidence from
South Africa - Dennis Machobani, Gideon Boako, Paul Alagidede –
Frontiers in Finance and Economics – Vol 14 N°2, 85 – 131
129
Kugler, P. and Lenz, C. 1993. Multivariate co-integration analysis and the
long-run validity of PPP. Review of Economics and Statistics, 75
(2):180 – 187.
Lacerda, M., Fedderke, J. W. and Haines, L. M. 2010. Testing for
purchasing power parity and uncovered interest parity in the
presence of monetary and exchange rate regime shifts. South
African Journal of Economics, 78(4): 363-382.
Lily, J., Kogid, M., Karim, M. R. A., Asid, R., and Mulok, D. 2011.
Empirical testing on uncovered interest rate parity in Malaysia.
Journal of Applied Finance & Banking, 1(2):95-114.
MacDonald, R. 1985. Do deviations of the real effective exchange rate follow
a random walk? Economic Notes, 14 (1): 63 – 69.
MacDonald, R., and Taylor, M. P. 1990. International parity conditions. In: A.
S. Courakis, and M. P. Taylor (Eds.), Policy issues for interdependent
economies (pp.53-77). Oxford: Oxford University Press.
MacDonald, R., and Taylor, M.P. 1992. Exchange rate economics. A
Survey In: IMF Staff Papers, 39(1), pp. 1-57.
MacDonald, R., and Marsh, I. W. 1994. On long- and short-run purchasing
power parity. In: J. Kaehler, and P. Kugler (Eds.), Econometric
analysis of financial markets (pp. 23 – 46). Heidelberg, Germany:
Physica-Verlag
Malkiel, B.G., 2005. Reflections on the efficient market hypothesis: 30 years
later. Financial Review, 40:1-9.
Malkiel, B.G., Fama, E.F., 1970. Efficient capital markets: a review of theory
and empirical work. The Journal of Finance, 25:383-417.
Martin, P. and Philippon, T. 2014. Inspecting the mechanism: Leverage and
the Great recession in the Eurozone. National Bureau of Economic
Research, 20(2):23-43.
Mishkin, F. S. 1992. Is the Fisher effect for real?: A reexamination of the
relationship between inflation and interest rates. Journal of Monetary
economics, 30(2):195-215.
Modigliani, F. and Miller, M. H. 1958. The cost of capital, corporation finance
and the theory of investment. American Economic Review 3(2):261-
297.
Mohamed, S. and Finnoff, K. 2004. In G. A. Epstein (Ed.), Capital Flight and
Capital Controls in Developing Countries (pp. 85–115). Cheltenham:
Edward Elgar.

Uncovered Interest Parity, Purchasing Power Parity and the Fisher effect: Evidence from
South Africa - Dennis Machobani, Gideon Boako, Paul Alagidede –
Frontiers in Finance and Economics – Vol 14 N°2, 85 – 131
130
Narayan, P.K., Narayan, S., Popp, S., Ahmed, H.A. 2015. Is the efficient
market hypothesis Day-of-the-week dependent? Evidence from the
banking sector, 44:2359-2378.
Rangasamy, L. 2009. Inflation persistence and core inflation: The case of
South Africa. South African Journal of Economics, 77(3):430-444.
Robinson, W. & Warburton, P. 1980 managing currency holdings: lessons
from the floating period. Economic Outlook, 4(5): 18-27.
Rogers, J.H. and Jenkins, M. 1995. Haircuts or hysteresis? Sources of
movements in real exchange rates. Journal of International
Economics, 7(5):55-76.
Roll, R. 1979. Violations of purchasing power parity and their implications
for efficient international commodity markets. In: M. Sarnat, & G.
Szego (Eds.), International finance and trade (pp. 260-282).
Cambridge, MA: Ballinger.
Shapiro, A. C. 1998. Foundations of Multinational Financial Management.
Prentice-Hall, Inc. London.
Solnik, B. and Roulet, J. 2000. Dispersion as cross-sectional correlation.
Financial Analysts Journal, 56(1):54-61.
Stigler, G. J. 1957. Perfect competition, historically contemplated. Journal of
Political Economy, 65(1):1-17.
Stiglitz, J. E. and Weiss, A. 1981. Credit rationing in markets with imperfect
information. American Economic Review 6 (5):393-410.
Sundqvist, E. 2002. An empirical investigation of the International Fisher
Effect. Social Science and Business Administration Programmes, pp.
42, 1-41.
Taylor, M. P. 1987. Risk premia and foreign exchange: a multiple time series
approach to testing uncovered interest parity. Weltwirtschaftliches
Archiv, 123 (4):579 – 591.
Taylor, M. P. 1988. An empirical examination of long-run purchasing power
parity using Co-integration techniques. Applied Economics, 20
(2):1369 – 1382.
Taylor, M.P. and Sarno, L. 1997. Capital flows to developing countries:
Long- and short-term determinants. The World Bank Economic
Review, 11(3): 451-470
Whitt, J. A. 1992. The long-run behaviour of the real exchange rate:
reconsideration. Journal of Money Credit and Banking, 24 (1):72 –
82.
Warnock, F.E., 1998. Idiosyncratic tastes in a two-country optimizing model:
implications of a standard presumption, International Finance

Uncovered Interest Parity, Purchasing Power Parity and the Fisher effect: Evidence from
South Africa - Dennis Machobani, Gideon Boako, Paul Alagidede –
Frontiers in Finance and Economics – Vol 14 N°2, 85 – 131
131
Discussion Paper No. 1998-631, Federal Reserve Board. Retrieved
from
Yuhn, K. H. 1996. Is the Fisher effect robust? Further evidence. Applied
Economics Letters, 3(1):41-44.
Zouaoui, M., Nouyrigat, G. and Beer, F. 2011. How does investor sentiment
affect stock market crises? Evidence from panel data. Financial
Review, 46(4):723-747.