Reliability Maintenance Engineering 1 - 4 Estimating Reliability

Software Maintenance Cost Estimating Relationships – One Size Does Not Fit All
28th International Forum on COCOMO and Systems/Software Cost Modeling
22-24 October 2013
UNCLASSIFIED Distribution Statement A: Approved for Public Release
UNCLASSIFIED

Oct 2013 2 UNCLASSIFIED Distribution Statement A: Approved for Public Release
UNCLASSIFIED
Purpose • This presentation presents an overview of an approach to estimating
Software Maintenance (SWM) and sustaining engineering cost at different milestones in a product’s acquisition lifecycle, i.e., from concept development through operations support. - Early life cycle
• No observed cost performance data on program • Need for a viable approach is important at this stage because it informs such
estimates as a product’s total ownership costs. - Late life cycle
• Actual cost data is available from previous releases • “Maintenance rhythm” shows that costs for operation support are more than
a linear projection of a product’s anticipated annual change.

Oct 2013 3 UNCLASSIFIED Distribution Statement A: Approved for Public Release
UNCLASSIFIED
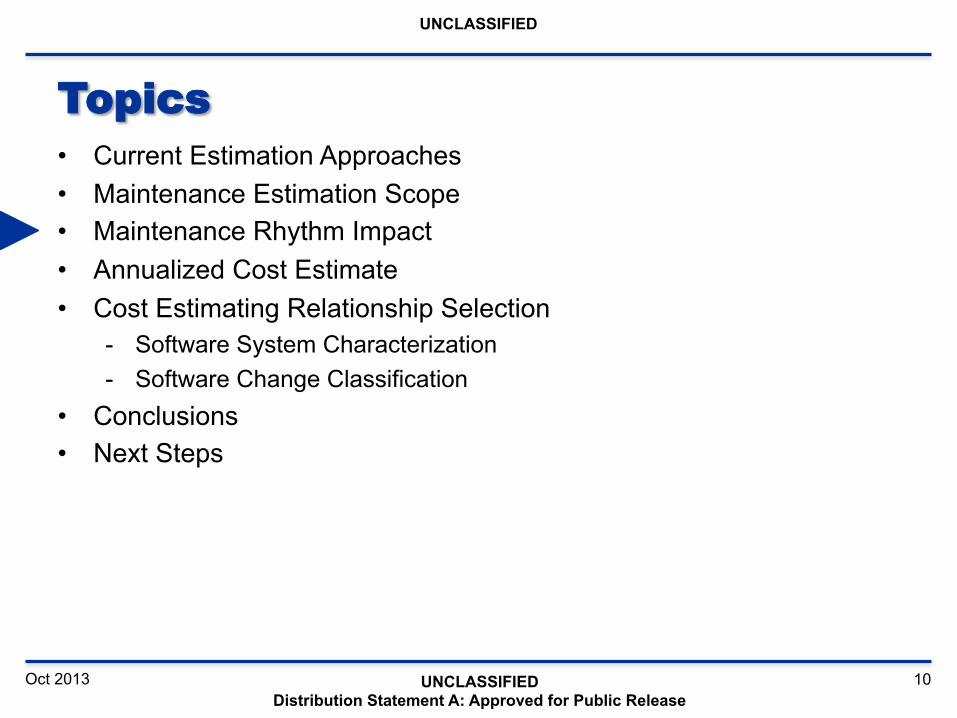
Topics • Current Estimation Approaches • Maintenance Estimation Scope • Maintenance Rhythm Impact • Annualized Cost Estimate • Cost Estimating Relationship Selection
- Software System Characterization - Software Change Classification
• Conclusions • Next Steps

Oct 2013 4 UNCLASSIFIED Distribution Statement A: Approved for Public Release
UNCLASSIFIED
Key Estimation Issues • Systemic availability of software maintenance data:
- Mapped to a consistent cost structure - Traceable to activity and product outputs - Both planning and execution data - Correlated software maintenance cost, technical and profile data
• Current software maintenance estimation methods: - Do not align with an individual program’s unique life cycle sustainment
profile - Do not take into account specific software maintenance products and
related activities for a given program (what’s in and what’s out) - Do not encompass multiple types of cost relationships - Do not address the differences across functional software domains

Oct 2013 5 UNCLASSIFIED Distribution Statement A: Approved for Public Release
UNCLASSIFIED
Topics • Current Estimation Approaches • Maintenance Estimation Scope • Maintenance Rhythm Impact • Annualized Cost Estimate • Cost Estimating Relationship Selection
- Software System Characterization - Software Change Classification
• Conclusions • Next Steps

Oct 2013 6 UNCLASSIFIED Distribution Statement A: Approved for Public Release
UNCLASSIFIED
Estimation Breadth • Breadth is the span of time covered by the estimate, e.g.,
- Estimate across the life of the program, from Milestone A forward - Estimate for the next 5 years, during Operation & Support
• Estimation considerations: - Availability and quality of program data - Different CERs at different estimation points - Accuracy of the estimate - Estimation consistency across the life cycle - Information related risk/uncertainty
• DoD’s Acquisition Lifecycle phases are shown in the figure
Concept Refinement
Technology Development
System Development & Demonstration
Production & Deployment
Operation & Support
PPSS A B C

Oct 2013 7 UNCLASSIFIED Distribution Statement A: Approved for Public Release
UNCLASSIFIED
Estimation Depth Depth is the amount of activities covered by the estimate SWM Work Breakdown Structure defines the depth of the estimate
1.0 Software Change Product - products and activities associated with defining, allocating, generating, integrating, and testing software changes for an operational software product or system
2.0 System Project Management - products and activities associated with system specific software maintenance project and technical management
3.0 Software Licenses - products and activities associated with the procurement and renewal of software licenses for operational software and facilities
4.0 Certifications and Accreditations - products and activities associated with verifying a software system against externally defined domain performance criteria
5.0 System Facilities - products and activities associated with establishing and operating software maintenance related development, integration, and test facilities, and support equipment and tools
6.0 Sustaining Engineering - products and activities associated with system specific test, delivery, and training support
7.0 Field Support - products and activities associated with the on-site support of a deployed software product or system in its operational environment
8.0 Support Infrastructure - products and activities associated with establishing and operating the organizational infrastructure required to implement common software maintenance business and technical processes across multiple software systems

Oct 2013 8 UNCLASSIFIED Distribution Statement A: Approved for Public Release
UNCLASSIFIED
Software Maintenance WBS • A WBS is foundational to understanding sources of cost
- Product based - system and organizational cost elements identified as those required to make changes to an operational software baseline(s)
- Common structure that includes all potential software maintenance products and activities
- Superset of program software maintenance cost elements • Identifies “what’s in” and “what’s out”
- Data collection - Cost estimate
• Applicable to: - Software maintenance estimation and planning - Tracking software maintenance execution and data collection
• Establishes common software maintenance definitions and terminology

Oct 2013 9 UNCLASSIFIED Distribution Statement A: Approved for Public Release
UNCLASSIFIED
Estimation Coverage
1.0 Software Change Product
2.0 System Project Management
3.0 Software Licenses
4.0 Certifications and Accreditations
5.0 System Facilities 6.0 Sustaining
Engineering 7.0 Field Support 8.0 Support
Infrastructure
Concept Refinement
Technology Development
System Development & Demonstration
Production &
Deployment
Operation & Support
Both Breadth and Depth are tailored to match the lifecycle and activities of the program under estimation, e.g., O&S with a subset of activities
X
X
X
X
X
X
Oct 2013 10 UNCLASSIFIED Distribution Statement A: Approved for Public Release
UNCLASSIFIED
Topics • Current Estimation Approaches • Maintenance Estimation Scope • Maintenance Rhythm Impact • Annualized Cost Estimate • Cost Estimating Relationship Selection
- Software System Characterization - Software Change Classification
• Conclusions • Next Steps

Oct 2013 11 UNCLASSIFIED Distribution Statement A: Approved for Public Release
UNCLASSIFIED
Maintenance Rhythm Impact • Maintenance costs are driven by repairs, emergency patches, updates,
technology refreshes and major upgrades • Annual release costs are not fixed – must be reflected in estimates
1 3 5 7 9 11 13 15 17 19 21 23
Maintenance Rhythm
Major Update
Update
Extra repairs
Annual Maintenance

Oct 2013 12 UNCLASSIFIED Distribution Statement A: Approved for Public Release
UNCLASSIFIED
Cost Estimate Timeframes • SWM WBS costs cover different timeframes • Release cycles: 6, 12, 18, 24 months
1.0 Software Change Product 2.0 System Project Management
• Annual cycle 3.0 Software Licenses - annual 4.0 Certifications and Accreditations - annual 5.0 System Facilities - annual 6.0 Sustaining Engineering - annual 7.0 Field Support - annual 8.0 Support Infrastructure
• The cost estimate has to be normalized to an common timeframe while taking maintenance rhythm into account

Oct 2013 13 UNCLASSIFIED Distribution Statement A: Approved for Public Release
UNCLASSIFIED
Annual Cost Estimates Example
• Estimated release costs for multiple major and minor releases are allocated across the release duration to obtain a “monthly burn rate” - Release costs often overlap
• Recurring annual costs are normalized to a monthly burn rate
• Monthly release & annual costs are overlaid
• Monthly costs are rolled-up to a 12-month or annual cost
Monthly Gantt Chart (L4)< Working >
18 36 54 72 90 108 126 144 162 180 198 216 234 252 270 288 306 324Jan'12
Jul'13
Jan'15
Jul'16
Jan'18
Jul'19
Jan'21
Jul'22
Jan'24
Jul'25
Jan'27
Jul'28
Jan'30
Jul'31
Jan'33
Jul'34
Jan'36
Jul'37
Jan'39
ECP RELEASES ECP 1 ECP 2 ECP 3 ECP 4 ECP 5 ECP 6 ECP 7 ECP 8 TECHNOLOGY REFRESH REL... Tech Refresh 1 Tech Refresh 2 Tech Refresh 3 WBS 2.0 LICENSES Software licenses WBS 3.0 INFORMATION ASSURA... IAVA Cost WBS 4.0 CERTIFICATION & AC... C&A WBS 5.0 SUSTAINING ENGINE... FSE WBS 6.0 FACILIT IES AND INFRA...

Oct 2013 14 UNCLASSIFIED Distribution Statement A: Approved for Public Release
UNCLASSIFIED
Topics • Current Estimation Approaches • Maintenance Estimation Scope • Maintenance Rhythm Impact • Annualized Cost Estimate • Cost Estimating Relationship Selection
- Software System Characterization - Software Change Classification
• Conclusions • Next Steps

Oct 2013 15 UNCLASSIFIED Distribution Statement A: Approved for Public Release
UNCLASSIFIED
SWM Cost Estimating Relationships • The selection of CERs is driven by the program’s life cycle phase
- Early life cycle • No observed cost performance data on program • Need for a viable approach is important at this stage because it informs such
estimates as a product’s total ownership costs. - Late life cycle
• Actual cost data is available from previous releases • “Maintenance rhythm” shows that costs for operation support are more than
a linear projection of a product’s anticipated annual change.
• Impact: One CER does not fit all phases • SWM CER modifiers:
• phase based data defined CERs • software system characterization model
• Multiple CER types: • parametric • ratios • Trend lines

Oct 2013 16 UNCLASSIFIED Distribution Statement A: Approved for Public Release
UNCLASSIFIED
WBS Element MS A MS B MS C Post MS C 1 & 2 - Software Change Produce & Project Management
Analogy for cost Analogy for size Proxy tables for sizes
Development (baseline) size and build info Formulas for schedule, effort, and cost
MS C information plus actual maintenance data from completed releases
3 - Software Licenses (Cost of)
Analogy based on type of system and anticipated maintenance depot
Information by system type – used in analogy
List of actual products with costs – license quoted costs
List of actual products with costs – license quoted costs (changes for obsolescence)
4 - Certifications & Accreditations
Analogy for cost by system domain
Analogy for cost by system domain
List of actual C&As with costs (by release or annual)
List of actual C&As with costs (by release or annual)
5 - Software Maintenance Facilities
Analogy for cost by maintenance depot
Analogy for cost by depot
Budget cost (percentage) by depot plus extras
Actual cost (percentage) by depot plus extras
6 - Sustaining Engineering
Analogy for cost by system domain
Analogy for cost by system domain
Analogy for cost by system domain
Actual cost (percentage) by actual maintenance data from completed releases
7 - Field Software Engineering
Analogy for cost by system domain
Analogy for cost by system domain
Analogy for cost by system domain
Actual cost (percentage) based on sites/users/platforms
8 – Support Infrastructure
Analogy for cost by maintenance depot
Analogy for cost by maintenance depot
Budget cost (percentage) by maintenance depot plus extras
Actual cost (percentage) by maintenance depot plus extras
SWM Phase Driven CERs
Oct 2013 17 UNCLASSIFIED Distribution Statement A: Approved for Public Release
UNCLASSIFIED
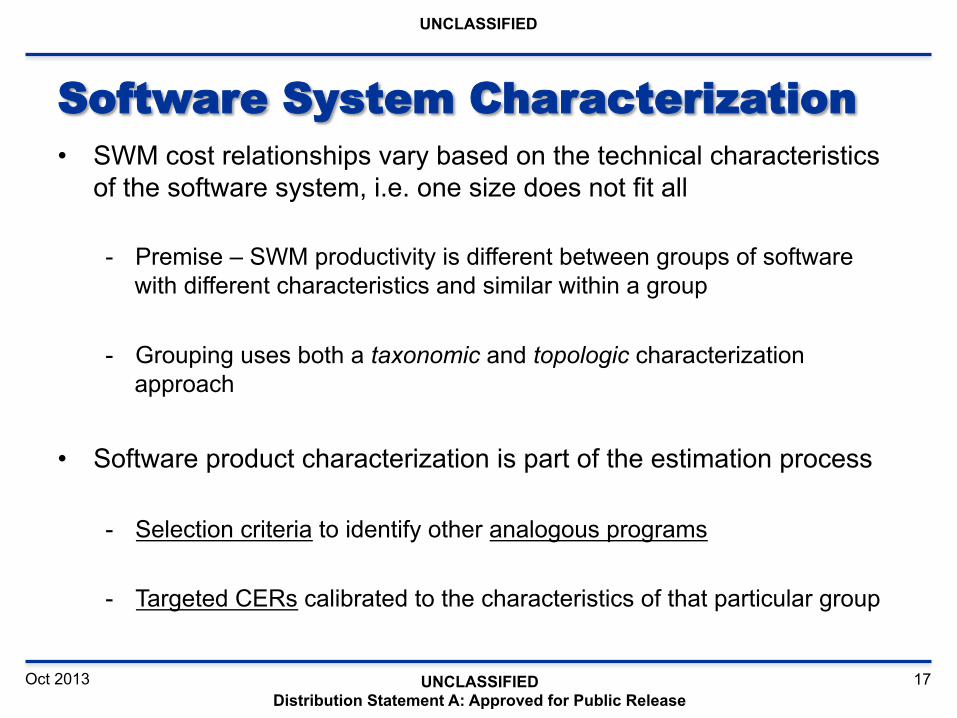
Software System Characterization • SWM cost relationships vary based on the technical characteristics
of the software system, i.e. one size does not fit all
- Premise – SWM productivity is different between groups of software with different characteristics and similar within a group
- Grouping uses both a taxonomic and topologic characterization approach
• Software product characterization is part of the estimation process
- Selection criteria to identify other analogous programs
- Targeted CERs calibrated to the characteristics of that particular group

Oct 2013 18 UNCLASSIFIED Distribution Statement A: Approved for Public Release
UNCLASSIFIED
System Characterization Using Super Domains Super Domain Software Application Domains
Real-Time (RT)
Sensor Control and Signal Processing
Vehicle Control
Vehicle Payload
Real Time Embedded-Other
Engineering (ENG)
Mission Processing
Executive
Automation and Process Control
Scientific Systems
Telecommunications
Mission Support (MS)
Planning Systems
Training
Software Tools
Test Software
Automated Information System (AIS)
Intelligence and Information Systems
Software Services
Software Applications

Oct 2013 19 UNCLASSIFIED Distribution Statement A: Approved for Public Release
UNCLASSIFIED
• Interoperability with other systems
• Change in the number of system interfaces
• Degree of external interfaces coupling, e.g., waiting problem
• Integrated functionality (versus stand-alone, maybe implied by # interfaces)
• Impact of eternal interface volatility
• Implications: • What is indirectly
affected by the number of interfaces
• Algorithmic complexity • Maturity • HMI • Display complexity • Failure impact • Data fusion • Info Assurance • Pre-programmed
reactions • Communication
complexity • Encryption • Anti-Jam • Frequency hopping
• Security complexity • Multi-level • Access partitioning
• Data bandwidth requirements
• Real-time data capture • Data reduction volume • Storage constraints
Critical Technology
• Event driven • Time driven (hard
real-time • Non-stop operation
• Number of COTS products
• Are new products being incorporated?
COTS Product Incorporation
Number of External Interfaces
Execution Timing Constraints
Software System Attributes
Characterization Using Software System Attributes
Oct 2013 20 UNCLASSIFIED Distribution Statement A: Approved for Public Release
UNCLASSIFIED
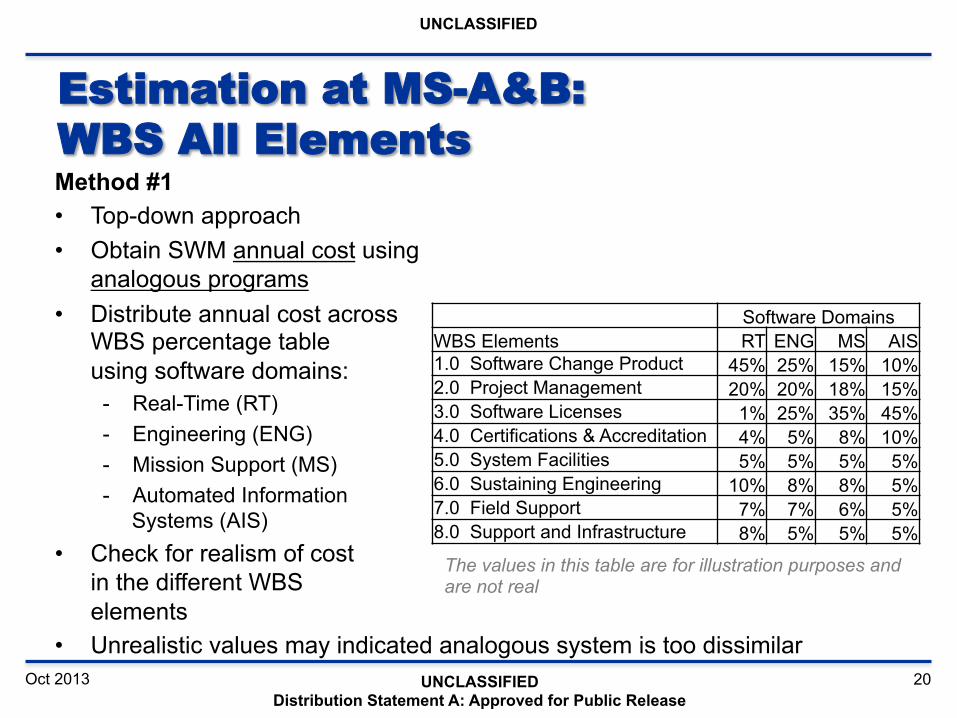
Estimation at MS-A&B: WBS All Elements Method #1 • Top-down approach • Obtain SWM annual cost using
analogous programs • Distribute annual cost across
WBS percentage table using software domains:
- Real-Time (RT) - Engineering (ENG) - Mission Support (MS) - Automated Information
Systems (AIS) • Check for realism of cost
in the different WBS elements
• Unrealistic values may indicated analogous system is too dissimilar
Software Domains WBS Elements RT ENG MS AIS 1.0 Software Change Product 45% 25% 15% 10% 2.0 Project Management 20% 20% 18% 15% 3.0 Software Licenses 1% 25% 35% 45% 4.0 Certifications & Accreditation 4% 5% 8% 10% 5.0 System Facilities 5% 5% 5% 5% 6.0 Sustaining Engineering 10% 8% 8% 5% 7.0 Field Support 7% 7% 6% 5% 8.0 Support and Infrastructure 8% 5% 5% 5%
The values in this table are for illustration purposes and are not real

Oct 2013 21 UNCLASSIFIED Distribution Statement A: Approved for Public Release
UNCLASSIFIED
Estimation at MS-A&B: WBS 1 & 2 Method #2 • Select the anticipated release cycle time and the
Maintenance Organization based on analogous programs
• Normalize the release cost to an annual cost, e.g., a release cost, $X, for 18 months would be normalized to an annual (12 month) cost with: $X * 12/18
Cost ($K) for WBS 1.0 and 2.0 Release Cycle
Maintenance Organization 6 months 12 months 18 months 24 months
OID: 221 $400 - $600 $800 - $1,000 $1,250 - $1,450 $1,700 - $1,800 OID: 222 $350 - $550 $750 - $950 $1,100 - $1,300 $1,400 - $1,600 OID: 223 $200 - $400 $450 - $650 $700 - $900 $1,000 - $1,200 OID: 224 $150 - $250 $300 - $500 $500 - $700 $700 - $900
The values in this table are for illustration purposes and are not real

Oct 2013 22 UNCLASSIFIED Distribution Statement A: Approved for Public Release
UNCLASSIFIED
Estimation at MS-A&B: WBS 3 • MS-A: Estimate the number of COTS products from analogous
programs - COTS Solution: these systems depend on one COTS software product
• Licenses tend to be Enterprise-Wide and a license is more expensive - COTS Intensive: these systems depend on a number of COTS software
products • Licenses vary in coverage (per computer versus enterprise) and cost
• MS-B: Estimate annual cost based on the types of COTS software products anticipated for this program
Annual Cost ($K) for WBS 3.0 (per COTS product) Number of COTS Licenses
COTS Product Type 1 2 - 10 10 - 25 25+ COTS Solution/
License $1,300 - $1,700 Intensive System/
License $800 - $900 $1,150 - $1,550 $1,600 - $2,00
The values in this table are for illustration purposes and are not real

Oct 2013 23 UNCLASSIFIED Distribution Statement A: Approved for Public Release
UNCLASSIFIED
Estimation at MS-A&B: WBS 4 - 8 • Analogous programs tend to be sustained at the same Maintenance
depot 4.0 C&As: estimate annual cost using average of analogous programs 5.0 System Facilities: estimate annual cost based on anticipated
maintenance depot 6.0 Sustaining Engineering: estimate annual cost based on analogous
programs 7.0 Field Software Support: estimate annual cost based on analogous • Number of FSEs may increase if sustainment is supporting a wartime-tempo of
operations 8.0 Support Infrastructure: estimate annual cost based on anticipated
maintenance depot

Oct 2013 24 UNCLASSIFIED Distribution Statement A: Approved for Public Release
UNCLASSIFIED
Estimation at MS-C: WBS 1 & 2 • Use historical data from multiple
software Development Builds to develop CERs or calibrate estimation models
• Examine build durations for long and short cycles indicating future major and minor release profiles
• Examine build overlaps • With the CERs, determine a monthly burn rate and normalized to an
annual cost for WBS 1 & 2
This data is based on the Real-Time software domain from DoD’s SRDR data

Oct 2013 25 UNCLASSIFIED Distribution Statement A: Approved for Public Release
UNCLASSIFIED
CER - Project Data
Build Equivalent
SLOC Hours Start Date End Date Months
Duration 1 173,447 15,648 01/01/08 07/10/09 18.3
1a 6,085 1,806 07/01/09 09/15/09 2.5 1b 6,609 1,441 09/10/09 11/03/09 1.8 2 108,081 25,153 06/01/09 12/15/10 18.5
2a 12,436 6,305 12/01/10 05/05/11 5.1 2b 4,106 1,994 04/01/11 10/15/11 6.5 3 220,788 40,104 08/20/11 01/09/13 16.7
3a 19,969 8,785 12/01/12 03/30/13 3.9 3b 80,575 19,105 02/01/13 09/05/13 7.1
CER Data Rhythm Data
Oct 2013 26 UNCLASSIFIED Distribution Statement A: Approved for Public Release
UNCLASSIFIED
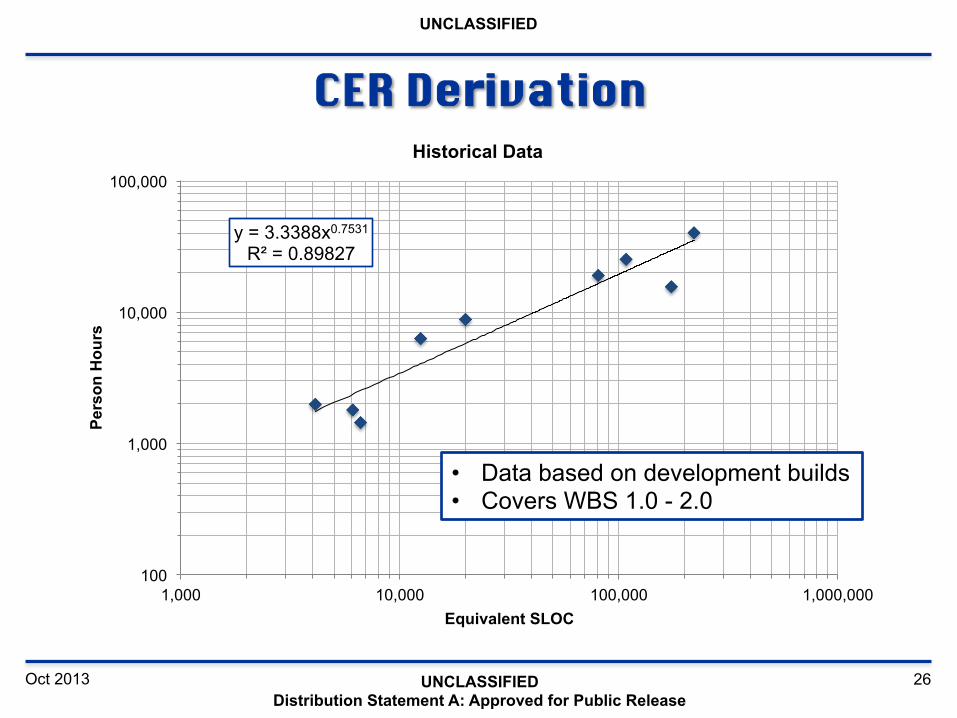
CER Derivation
y = 3.3388x0.7531 R² = 0.89827
100
1,000
10,000
100,000
1,000 10,000 100,000 1,000,000
Pers
on H
ours
Equivalent SLOC
Historical Data
• Data based on development builds • Covers WBS 1.0 - 2.0

Oct 2013 27 UNCLASSIFIED Distribution Statement A: Approved for Public Release
UNCLASSIFIED
Cost Projection - WBS 1.0 and 2.0
0
1,000
2,000
3,000
4,000
5,000
6,000
7,000
1 2 3 4 5 6 7 8 9 10 11 12 13 14 15 16 17 18 19 20
Dol
lars
($K
)
Year
Cost Estimate by Year
Estimate by Release
Release SLOC Effort (staff
hours)
Cost (@ $90/hour)
Duration (months)
Monthly Burn Rate
4 175,000 87,936 $7,914,281 16 $481,707
4.1 25,000 14,678 $1,321,056 6 $204,616
4.2 25,000 14,678 $1,321,056 6 $204,616
5 200,000 99,431 $8,948,784 18 $510,857
5.1 25,000 14,678 $1,321,056 6 $204,616
5.2 25,000 14,678 $1,321,056 6 $204,616
6 200,000 99,431 $8,948,784 18 $510,857
6.1 25,000 14,678 $1,321,056 6 $204,616
6.2 25,000 14,678 $1,321,056 6 $204,616
6.3 25,000 14,678 $1,321,056 6 $204,616
6.4 25,000 14,678 $1,321,056 6 $204,616
(cont.)
Oct 2013 28 UNCLASSIFIED Distribution Statement A: Approved for Public Release
UNCLASSIFIED
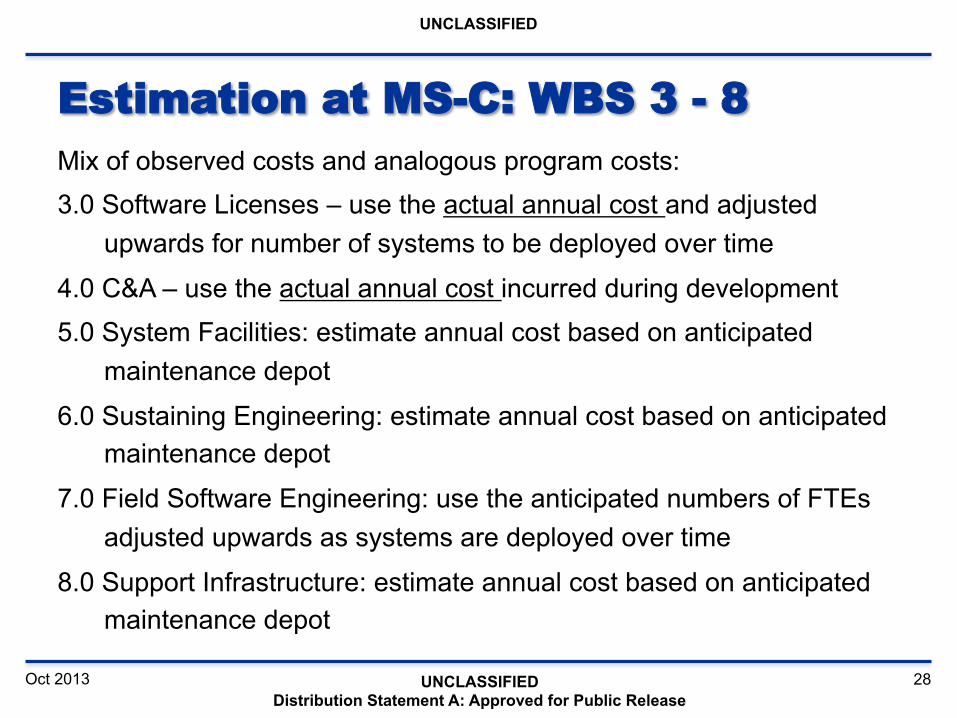
Estimation at MS-C: WBS 3 - 8 Mix of observed costs and analogous program costs: 3.0 Software Licenses – use the actual annual cost and adjusted
upwards for number of systems to be deployed over time
4.0 C&A – use the actual annual cost incurred during development 5.0 System Facilities: estimate annual cost based on anticipated
maintenance depot
6.0 Sustaining Engineering: estimate annual cost based on anticipated maintenance depot
7.0 Field Software Engineering: use the anticipated numbers of FTEs adjusted upwards as systems are deployed over time
8.0 Support Infrastructure: estimate annual cost based on anticipated maintenance depot

Oct 2013 29 UNCLASSIFIED Distribution Statement A: Approved for Public Release
UNCLASSIFIED
Conclusions • Different estimation approaches are required at different acquisition
lifecycle stages • Estimates require access to program data across the lifecycle, e.g.,
- Acquisition documents provide descriptive program data that can be used for selecting analogous programs
- Development data can be useful for developing initial CERs and determining a maintenance rhythm
- Post Production data provides actual change size, cost and duration • SWM estimates are driven by release cycle and annual costs
- “Monthly Burn” rate is a key component to normalizing costs to an annual cycle
• Maintenance Rhythm shows that total cost amortized over the life of a program is inadequate for annual cost planning

Oct 2013 30 UNCLASSIFIED Distribution Statement A: Approved for Public Release
UNCLASSIFIED
Next Steps • Systemic Army SWM data collection - focus on execution cost data -
expanded data store • WBS cost element CER refinement - quantitative relationships -
phase dependent models • CER calibration based on system software domains and technical
characteristics • Develop historical release profiles based on system domain and
technical characteristics
Oct 2013 31 UNCLASSIFIED Distribution Statement A: Approved for Public Release
UNCLASSIFIED
John McGarry U.S. Army RDECOM - ARDEC Quality Engineering & System Assurance RDAR-QES-A Building 62 Picatinny Arsenal, NJ 07806-5000 (973) 724-7007 [email protected] Cheryl Jones U.S. Army RDECOM - ARDEC Quality Engineering & System Assurance RDAR-QES-A Building 62 Picatinny Arsenal, NJ 07806-5000 (973) 724-2644 [email protected]
James Judy U.S. Army Office of the Deputy Assistant Secretary of the Army for Cost & Economics (ODASA-CE) 5701 21st Street Building 216 Fort Belvoir, VA 22060-5546 (703) 697-1612 [email protected] James P. Doswell U.S. Army Office of the Deputy Assistant Secretary of the Army for Cost & Economics (ODASA-CE) 5701 21st Street Building 216 Fort Belvoir, VA 22060-5546 (703) 697-1572 [email protected]
Contact Information