UNCLASSIFIED -Ehi~ mu//u///I/uI// -l/I/Ill/l/Ilmumn/IllnInln
133
AD-AOO 322 SRI INTERNATIONAL MENLO PARK CA F/6 13/2 CHARACTERIZATION OF NAVY SOLID WASTE AN COLLECTION AND DISPOSA-t&C(u) JAN 80 R E FREEMAN, A S CAPPS N00123-78-C-0866 UNCLASSIFIED CEL-CR-80.O03 NL a f:l//ffl/l/lfl //f -Ehi~ ~ . -EEEEl//l//lEE mu//u///I/uI// -l/I/Ill/l/Il mumn/IllnInln l/lllllllll
Transcript of UNCLASSIFIED -Ehi~ mu//u///I/uI// -l/I/Ill/l/Ilmumn/IllnInln
AD-AOO 322 SRI INTERNATIONAL MENLO PARK CA F/6 13/2CHARACTERIZATION OF NAVY SOLID WASTE AN COLLECTION AND DISPOSA-t&C(u)JAN 80 R E FREEMAN, A S CAPPS N00123-78-C-0866
UNCLASSIFIED CEL-CR-80.O03 NLa f:l//ffl/l/lfl //f-Ehi~ ~ .-EEEEl//l//lEEmu//u///I/uI//-l/I/Ill/l/Ilmumn/IllnInln
l/lllllllll
'I
A1
~t.
-- ~~ ~
- ,~
~~2~F'?~t~
A-
4. 12.1$t* "'~2 ,t,~ ~tQ~4 , -, - :4,,
~
4 'f~'~ -.~4,
I ~'
K ~
*4 ..- ~4 z~. ~
'0 1 -~
'%.is .'
.4~.4
*-e' -4
4 . ~ '2'2 ~ ~
;4
..~~. -- d
~4 '3 ..~4- I4'~
<'IA 4' '.4~.
~
Vt:: :~jl~4'l. ~.
33 ., . 4, 1<'
33*34~~
-'-'3 -3..',',
j-1 1 34
.~' ~1".",'.~.,,
3 . , .~ .. ~'44~ ~ ,.y F~433 *3~**~"..*' t . 3' , '3-.,
*' ~ '~4.'4'~> 4
- .3 ~ JF~~33 ~
SICUNlYV CI.ASSIFICAISW 00 THIS PlO0f9 f SM." Do eed ___________________
c~Characterization of Navy Solid 'West&e -nei f
6. CORTM ACT ON GRANT HUM690felRo N00123- -C
IS.~~~CY TASKMNTN Mt
6. E RWO NGO RGAiN IZAI NAM ** DA 921146 A.U. "F..W
'd
2"siI~& a@e,,SolId waternatea copn/s wast ;aaeetrsuc
efctivEgalterngativesaor metn1R97euieet. ome
ava Con7stuton atalion CenLter' casiIECNIT Huen CaliAIION .-/ Al 0 1191(fdf.et# -. 1J00144 s 14UOr LAt to o."
Navalj Fac li ie En i e r n o m n200 SovallStree
Inclanni f ipdSC¢UST CLASSISICP t 07 or THI PAGE 1 €" f.e Fneo..d.
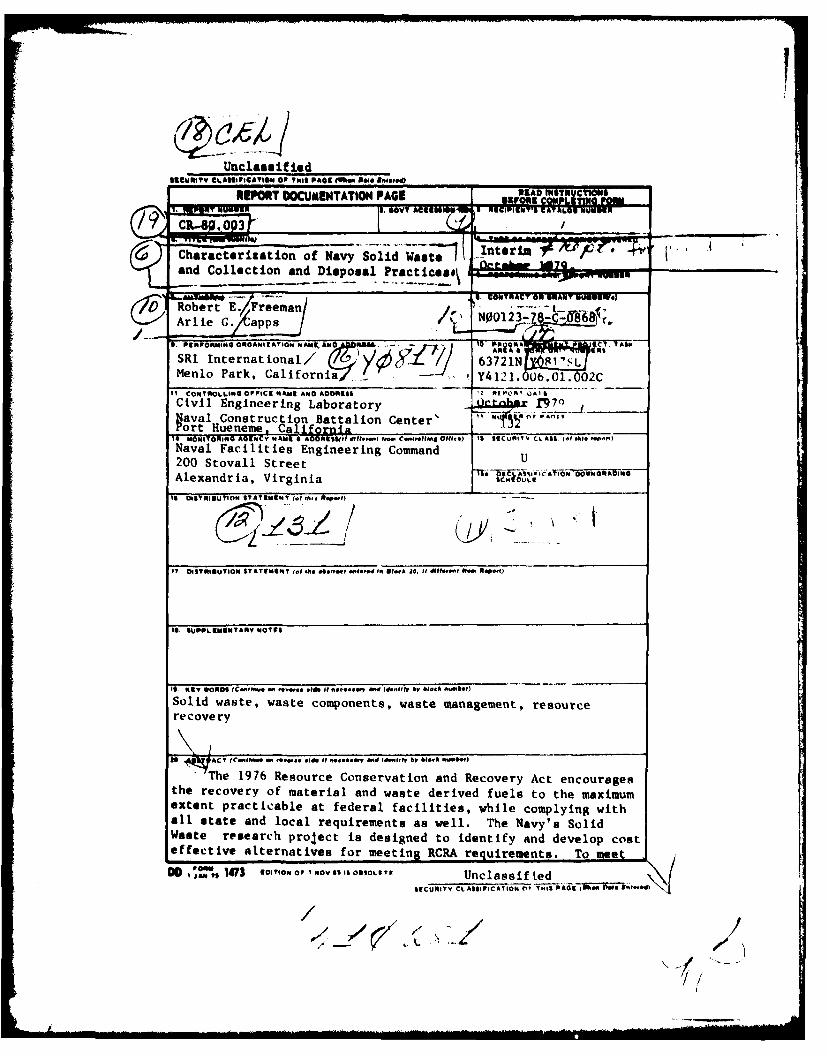
20. Abstract (cont'd)
this objective an immediate need of the project was to quantify 3ndcharacterize the recoverable material contained in the Navywaste stream and to compile information on how these materialare handled at typical Navy installations. The work was con-centrated in two areas: compiling and analyzIng available dataabout Navy solid waste composition and generation, and develop-ing a set of realistic descriptions of typic. Navy solid wastehandling practices. e t /
For waste composition and generatori e, data availablefrom the NACWIS data base, including R4 surveys conducted underthe direction of the Naval Environmental Support Office (NESO),were compiled and analyzed. Navy facilities were listed inclasses according to the amount of waste. A simplified technique was examined fkestimating quanti-ties of the various recoverable resources generated by a Navyinstallation. This technique was tested against data obtainedfrom the R4 surveys mentioned above. The test was aimed atevaluating this relatively low-cost technique for possible usein augmenting Navy solid waste data to enable adequate fieldplanning, selection, and preliminary sizing of Navy resourcerecovery systems. The technique requires a series of fieldobservations of the volumes of waste generated and the waste'sorigin to estimate weight and composition. Once the bulkdensities are thus derived, a few periodic volume observations
will establish trends and cycles.Existing information concerning current Nav practices for
handling its solid waste was also derived from R survey resultsobtained by the Navy. The information includes -3 I1d1cation oSthe type of personnel involved in the collection, the type ofdisposal methods used, useful life of landfill sites; andwhether the landfill is on Navy property. The format in whichthe data are compiled was intended to enable the establishmentof classes for collection and disposal methods and the indicatioof the number of Naval installations in each class.
This report also includes a brief analysis of how Navy andall other landfills will be affected by RCRA and the Safe Drink-ing Water Act (SDWA).
DO , 1473 GOI7,ON OF I OVG$IS OIOLCT& UnclassifiedSeCumiT CLASSIFICAION 009 TISI 04GI (Wh" DNSPt.
CONTENTS
LIST OF ILLUSTRATIONS .......................
LIST OF TABLES.............................V
I SU! I4RY...............................
II INTRODUCTION .............................. 5
A. The Problem .......................... 5
B. Previous Related Work and Data Sources .. .......... 7
C. Scope of This Volume and Its Relationship to theTotal Project. .. ...................... 7
III CHARACTERIZATION OF NAVY SHORE ACTIVITY ENERGY CONVERSION
SYSTEMS AND DEVELOPMENT OF A CLASSIFICATION METHOD.........9
A. General Characteristics. .. ................. 9
B. Site-Related Characteristics. .... ........... 20
C. Development of a Classification Method for Navy
Energy Conversion Systems .. ... .......... 21
IV NAVY ENERGY CONVERSION SYSTEMS IN CLASSES .. .. .. .. . .29
A. Classification of Existing Boilers. .... ........ 29
B. Classification Scheme and Energy Conversion Options. . 29
V POTENTIAL FOR CONVERTING SYSTEMS IN EACH CLASS TO USEALTERNATIVE FORMS OF WASTE DERIVED FUELS .. .. ......... 35
VI DIFFICULTIES AND COSTS OF IMPLEMENTING ALTERNATIVES . ... 39
A. Heat Recovery Incinerators. .... ............ 40
B. New or Replacement Boilers Capable of Burning WDF ... 41
C. Boilers Modified to Burn WDF. .... ....... . 43
D. Hybrid Conversions. ... .................. 44
E. Economic Comparisons. .. ................. 45
F. Suggestions for RDT&E .. .. .... .. .. .. .. .... 53
VII BIBLIOGRAPHY .. .. ........................ 57
Appendix A- -MASS BURNING OF REFUSE IN SHOP-FABRICATEDINCINERATORS. ..... .................. 71
ILLUSTRATIONS
1 Number of Boilers by Boiler Capacity ............... . . .ii
2 Number of Boilers by Fuel Type .... ............... .... 13
3 Number of Boilers by Fuel Types (1985) .............. .... 16
4 Seasonal Variation in Fuel Consumption ............. ... 18
5 Example of Seasonal Variation of Fuel Use atLarge Facility ........ ....................... .... 19
6 Structure of Systems Analysisfor Project ......... .. 22
7 Boiler Plant Capacity vs. Solid Waste .cneration Rate . . . 25
8 Distribution of Boilers by Capacity in Scenario SolidWaste Classes ............ ....................... 26
9 1978 Distribution of Boilers by Capacity and Fuel Type inScenario Solid Waste Classes ..... ............... .... 30
10 1985 Distribution of Boilers by Capacity and Fuel Type inScenario Solid Waste Classes .... ................ ... 31
11 Approximation of Relative Investment Requirements Basedon Actual and Estimated Costs for Large Refuse Processing
Facilities ........ ......................... .... 47
12 Approximation of Investment Requirements for Small RefuseIncineration Facilities with Heat Recovery ......... .... 48
13 Net Annual Operating Cost as a Function of Plant DesignCapacity with no Particulate Collection ............ ... 49
14 Net Annual Operating Cost as a Function of Plant DesignCapacity with Particulate Collection ............... ... 50
15 Net Annual Savings as a Function of Delivered Priceof RDF ......... ........................... .... 54
iv
TABLES
1 Navy Coal Burning Capabilities and Conversions:FY 1974-1985 ........ .......................... 15
2 Matrix of Energy Conversion Classes .. ............ ... 35
3 Judgmental Ratings of WDF Potential by Energy ConversionClasses ............. .......................... 17
4 Design Selection for Boiler Plant Fuels .... .......... .42
5 Economic Data from Studies Analved ..... ........... 4
6 Estimated Capital Costs of CoAverting an Existing250 x 106 Btu/hr Navy Oil Ftred Plant to Cofire Fluff ROF . 51
7 Estimated Annual Operating Costs for Modified Oil-FiredBoilers ........ .......................... .... 52
8 Breakeven Point for Case Study Boilers ............. .... 53
v
I SU HARY
Opportunities to recover resources from solid waste at Naval instal-
lations have been analyzed in a research project that SRI International
(SRI) conducted for the U.S. Navy Civil Engineering Laboratory. SRI's
research under this project is reported here; it addresses concepts of
recovering energy from solid waste by utilizing naval facility energy
conversion systems (i.e., its steam plants) as principal building blocks
of candidate solid waste/resource recovery systems at Navy installations.
The Navy's steam plants were first characterized in terms relevant
to firing or cofiring of waste derived fuels (WDF); they were then
assigned to categories suitable for subsequent treatment as optional
components in cost and effectiveness analyses of solid waste/resource
recovery systems.
For this study, the steam plants and their boilers were classified
in a simple, eight-class scheme. Size (designed heat input capacity,
106 Btu/hr) and type of primary fuel are the basic parameters of the
classes. Four size classes and two types of primary fuel burning capa-
bilities (coal, noncoal) were selected, and distributions of plants*
planned for 1985 were plotted for each of the eight classes.
To relate the steam plants' capabilities to burning WDF, four alterna-
tive means for utilizing WDF--adding incinerators, replacing boilers,
modifying existing boilers, and making hybrid conversions--were considered
for each class. Incineration and modification of existing boilers were
emphasized. These alternatives appeared to be the most feasible ones for
near-term implementation and were therefore central to the Navy's current
Fuel type capability classes other than "coal" and "noncoal" may be
more useful. Suggestions made after this report was completed include"coal," "noncoal," and "noncoal but readily convertible" or "solid fuel
capable" and "other" as classes. These classifications are being in-
vestigated in follow-on work.
IL
interests. Problems encountered, system modifications required, and
costs associated with the alternatives in the classes were defined as
clearly as the accuracy of the available data would allow.
The major conclusions of this portion of the project are:
• Although it is technically feasible to adapt Navy energy con-version systems to fire WDF in one or more of its forms, theoptimal form selected should be a site-specific total system.
* Near- to intermediate-term programs should probably continue
to give first consideration to waterwall incinerators and tothe cofiring of solid WDF in coal-capable plants because theseoptions are the ones most completely developed and documented.
" Package incinerators and conversion of oil burning plants tofire a fluff form of solid waste fuel may be the options withthe greatest potential for the intermediate term becausewaterwalls would be uneconomical in many small plants and be-cause the majority of medium-sized oil-burning plants willnot be converted to burn coal.
" Pyrolytic processes to produce gaseous and liquid fuels havenot been sufficiently developed as yet to be specified forcommercial operation. However, these forms of WDF have wide-spread potential applicability. If they (liquids in particu-lar) become available, they could become the most cost-effectivealternatives; using them would minimize the necessary modifica-tions of existing energy conversion systems. Probably 5 yearsor more of development and testing will be needed before thefuture of pyrolysis is clear.
This volume also offers suggestions for the RDT&E cited below to
develop data related to specific problems that were identified during
the research:
• A review of Navy solid waste components that could emit sig-nificant quantities of noncriteria air pollutants duringcombustion
" A preliminary technical/economic evaluation of a fluidized bed
combustor preceded only by a trommel and shredder for solidwaste combustion at Naval installations (perhaps a part of theDOD/DOE Great Lakes Training Station experiment)
" A study of the operating characteristics, performance, andinvestment and operating costs for particulate control de-vices for small solid waste combustion units (20 to 200ton/day)
" A study of the costs of controlling nuisance odor problems at
resource recovery plants by scrubbing building ventilationsystem exhaust
2
* A study of possible design improvements for shop-fabricatedincinerators to achieve more complete combustion of fixedcarbon in ash and to achieve better process control
* A continuing review and evaluation of developments in small-scale solid waste conversion units. (Auger bed incineratordevelopment is a possible subject to be included, as are up-dates on gasification and pyrolysis units. IdentifyingEuropean developments that employ mechanical grate units isanother possible topic.)
* A preliminary technical/economic evaluation of the O'Connorrotary combustor.
The Navy is likely to encounter these issues in implementing resource
recovery from solid waste.
3I
II INTRODUCTION
A. The Problem
Operating costs at Naval shore activities have increased dramatically
since 1973, largely because the cost of imported petroleum has quadrupled.
In FY 1973, Naval shore activity energy costs were approximately $173
million; estimated FY 1978 energy costs at the same activities were
approximately $500 million, despite a 20% reduction in energy use by the
activities during the same 5-year period. The need to halt and, if
possible, reverse the cost trend in the energy bill is obvious. Conse-
quently, the Navy is studying a number of options that may help reduce
energy costs at its shore activities. One option involves purchasing
and substituting low-cost (possibly less than $1.00/106 Btu) waste de-
rived fuels (WDF) for significantly higher cost primary fuels (i.e.,
oil, gas, coal).
Another energy-related option that may help reduce shore activity
operating costs is Navy recovery of fuels from its own solid wastes.
If the credits for the WDF produced and for reduction in the disposal
(landfill) costs outweigh the costs of producing the WDF and modifying
the existing systems to burn the WDF, this option can be quite attractive.f
However, the break-even costs in this second option for producing WDF may
be critically sensitive to landfill cost projections and to other site-
specific factors such as the costs of air and water pollution abatement
measures.
At present, deciding how and where the implementation of either or
both of these options might be cost-effective is both difficult and risky.
In only a few instances has implementing either of the options proved to
be cost-effective. Furthermore, neither the successes nor the failures
Navy Energy R&D Plan, Vol. 11 (1977).
c3DIW PA 3MANK5
have been sufficiently analyzed in technical and economic terms. This
is particularly true of operational and maintenance (O&M) factors for
small- to medium-scale systems, the sizes appropriate for most Navy shore
activities.*
A significant number of feasibility studies have been performed by
numerous engineering firms for U.S. municipalities and large utilities
to evaluate the potential for processing municipal solid wastes into WDF
and for utilizing the fuels under specified large-scale conditions.
These studies routinely use estimates of full-scale operational data
extrapolated from pilot system cost and performance data. Howev.. , the
accuracy of these estimates has been disappointing. To compound the
problem, adequate data have been available on the pilot systems of only
a few of the technically feasible alternatives, thereby limiting the
number of alternatives that have been given serious consideration.
The Navy has also had similar site-specific studies performed for
a number of its larger activities. Many of the studies for the Navy
(using essentially the municipal system data bases) have indicated that
processing an activity's solid waste into fuel and using this fuel in
the activity's boiler plants would be uneconomical because the plants
are small and the process is capital-intensive. On the other hand,
studies of some Navy activitiest have concluded that purchasing WDF and
cofiring them with primary fuels would be cost-effective. In either
case, typical conditions and system requirements at Navy installations
that could contribute to making a particular processing technique or WDF
utilization system cost-effective have not been set forth for the broad
spectrum of Navy activities. Apart from rough scale-of-operation data,
little or no cost or effectiveness sensitivity information is available
to guide system designers or decision makers.
,SRI project staff members have reviewed more than 30 such reports (seeChapter VII, Bibliography).
Charleston Naval Shipyard and Philadelphia Naval Shipyard, for example.
6 *
The objective of the work reported here, therefore, is to assemble
available energy conversion system/WDF utilization data, analyze them
for relevance to Navy applications, and portray the results in terms
suited to subsequent analyses of total solid waste/resource recovery
systems. Incineration technology and cofiring of WDF with primary fuels
in conventional boilers are covered in detail. The processing of solid
wastes into WDF is summarized to the extent necessary to describe tech-
nical feasibility and to estimate costs of processing Navy solid wastes
into WDF of various kinds.
B. Previous Related Work and Data Sources
SRI had previously examined ways of estimating the potential for
utilizing WDF in Navy boiler plants at a few selected sites in two brief
studies. Understanding gained during these studies, particularly of the
difficulties in obtaining realistic estimates of costs and performance
of small-scale systems, helped to focus the work reported here. With
this orientation, SRI's project team abstracted data from available solid
waste/resource recovery feasibility studies.
C. Scope of This Volume and Its Relationship to the Total Pro1ect
This volume reports work on:
* Characterizing Navy energy conversion systems
" Developing a classification method to indicate the potentialfor utilization of WDF of each class
* Estimating the number of systems in each class
* Assessing the potential for converting systems in each classto use alternative forms of WDF
" Identifying modifications required and technical and logisticproblems anticipated, and estimating costs of implementing WDFfuel alternatives for each class.
Typical Navy energy conversion systems (boiler plants) and their
operating characteristics are surveyed, and the technical potential G:
these plants for using WDF in several forms is assessed. Within the
limitations of data availability, the findings reported here are
7
representative of technically feasible energy conversion components (the
WDF utilization subsystem) of total solid waste/resource recovery systems
that the Navy could consider implementing in the next 5 years.
Two special studies were performed as part of the effort covered
herein. The first, "Mass Burning of Refuse in Shop Fabricated Incinera-
tors," was performed by SRI staff members, with contributions from project
consultants, and is included as an appendix to this report. The second,
"Waste Fuels Utilization in Existing U.S. Naval Base Boilers," was per-
formed by Gilbert/Commonwealth under subcontract to SRI and is reported
separately.
These special studies concern two of the most important near-term
options--installation of package incinerators and modification of ex-
isting boiler plants. Information from these special studies is discussed
in Chapters IV and V of this volume.
8I
III CHARACTERIZATION OF NAVY SHORE ACTIVITY ENERGY CONVERSIONSYSTEMS AND DEVELOPMENT OF A CIASSIFICATION METHOD
In prior research under other Navy solid waste contracts, SRI's
first characterizations of the boilers and boiler plants operating at the
Navy's facilities were only partially completed. General information
about the boilers (e.g., size, activity and building locations, fuel
types, average fuel throughput, boiler types, and manufacturers) was ob-
tained for approximately 2,000 Navy boilers. Site-specific features to
be considered in analyzing the technical and economic feasibility of co-
firing WDF were also identified. Information of this kind, avalable to
SRI's study team at the outset of this prolect, provided a good back-
ground for completing the task of characterizing Navy energy conversion
systems and for developing a classitication scheme suited to evaluating
"typical" Navv energy conversion plants as components of solid waste/
resource recovery systems. The approach used to characterize Navy boilers
in this study is described below, followed by an explanation of how a
classification method to facilitate analvsis was developed.
A. General Characteristics
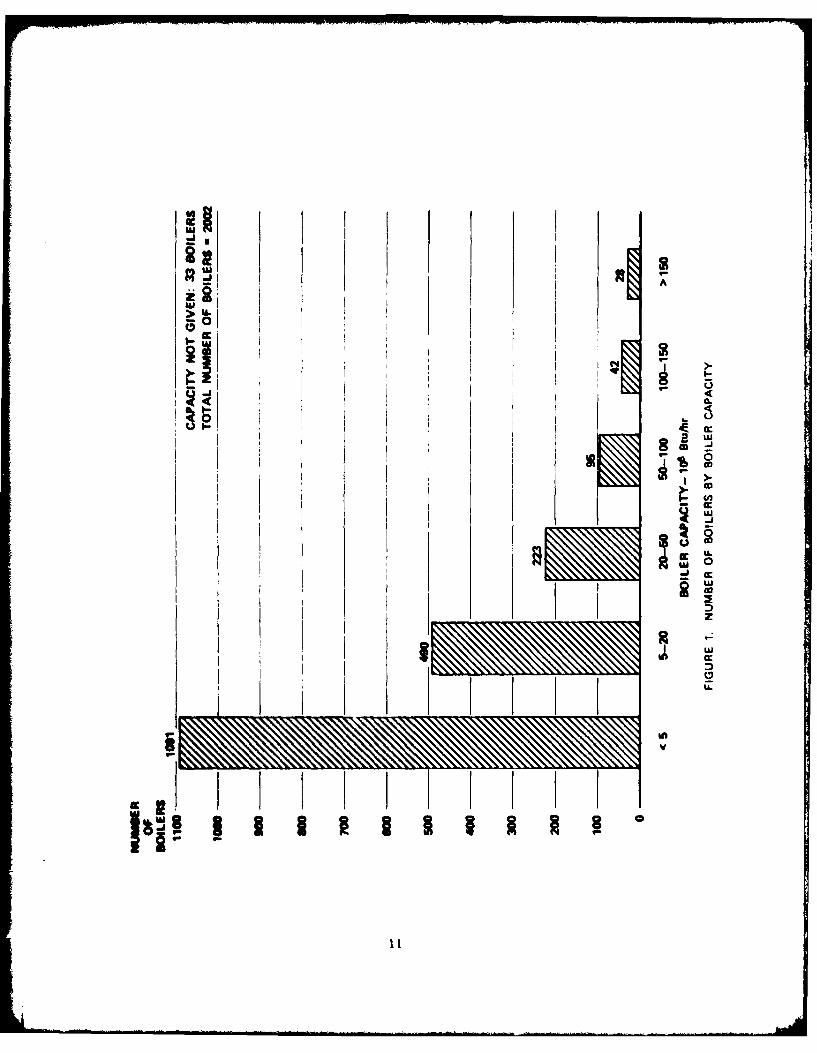
I. Size
A primary characteristic of Navy boilers and boiler plants that must
be accounted for in a classification scheme are their sizes in terms of
heat input capacities or steam output capabilities. MLny other features,
such as use, type, pollution control requirements, and possible modifica-
tions, correlate roughly with size. The obvious reason for assigning
SRI International, "A Pilot Study of the Potential for Navv Ptlizattonof Solid Waste-Derived Fuels," Contract N00014-7T-C-0151 (,Tune 1478)and "Potential of Waste-Derived Fuels to Offset Fossil Ftuel Consumptionat Selected Naval Ficlities," Contract Nt,2581/78-M-R.212, TechnicalMemorandum (April 1978).
t9
such importance to size is that boiler technology for large and small
boilers has advanced along different lines. Of course, no absolute
generalizations based on size can be made. In general, however, boilers
with heat input capacity of 100 X 10 Btu/hr or greater are usually
custom-designed, field-erected units. By contrast, those with capacities
of less than 20 X 10 Btu/hr are more than likely shop-fabricated and of
relatively unsophisticated design. Boilers with even smaller capacities
are probably simple fire tube designs ordered from catalogs and intended
for steam heating of spaces (saturated steam) rather than for generating
process quality steam (i.e., high-pressure, superheated steam).
The Navy's major boiler plants (i.e., the boilers and all of their
support equipment at large activities) are usually designed around mul-
tiple boilers of common or similar design and size to facilitate OM.
Total boiler capacity of these plants is usually high enough that the
peak expected steam load can be produced by about half the boilers oper-
ating at full design capacity. As a rule, significant amounts of excess
boiler capacity are found at plants where the process steam load is high
and steady, and where cogeneration is practiced.
Activities requiring large steam plants often have central steam
distribution systems, obviating multiple small or medium boilers dis-
tributed throughout the activity. Shipyards and air stations typically
have installations of this type. On the other hand, activities with
little or no demand for process heat (e.g., training stations) are likely
to have many smaller boilers, each serving a barracks, a classroom, a
galley, and so on.
The size (input in 106 Btu/hr) distribution of Navy boilers is shown
in Figure 1.
2. Fuel Type
Another characteristic certain to be important in a classification
scheme for boilers and boiler plants is the type or types of fuels they
can burn. Fuel type is important for many reasons. The designs of the
fire box, the heat exchanger, and all the auxiliaries of the boiler take
10
Em
I IL
-l I-
I, U
0
IV"
I I I
fuel charActeristics into considerat ion. The physical and chemical
nature of tlhe fuel will determine the handlIing L-eqtittements, its well as
the burning and clecan-tip requtirements. lit fact, the efficiency (thermo'-
dynamic and economic) of A boiler is verv muchi a fuinction of how well the
design of the boiler and its fuel are matched. (The Gilbert/Counonweatth
report provides A detailed Account of the importance of boiler and fuiel
compatibility.)
The types of fuels currently used by Navy shore facilities as pri-
mary fuels can be generally claissified bv their physnical state An solids,
liqviids, or ga4ses. Numero-us fuiels in each of these three states are
available to the Navy ite.g. * solid fuels ineluide coals, woods, and pent-
liquid fuels include petroleuim distil lates anid residuals; gases inclulde
natural gas,* LPG, * dd propanie). Fach has somewhat different physaical,
chemical , or burning chanracteristics. Theoretical lv. opitisim per-formance
is achieved when the characteristic@ of a single specific fuiel determinle
the design of a plant. In Practice, however, a platnt Mis~t be Able to
acconmodate variations tit the fuiel. This is particutlar-ly true of Navy
plants, which ust meet tlhe requtirements of the Naivv for operational
flexibility.
Older, large Navy boilers were uisually designed to htivii coal. flow-
ever, these coal-fired plants have almost universally been modified to
burn oil and/or gas and can no loniger bukrn coal . Some of them will be
converted, with various degrees of difficulty and at significant Cost.
back to coal . Plants or inal lv designed to butrn on lv oil or oIV gas
can, without major difficulty, usually be modified to burn either fuel
interchangeably, and All the larger Navy boilers have been so modified.
Unfortunately, plants originally designed to five oil or gas Are not so
readily modified to burn coal or other solid fuels.
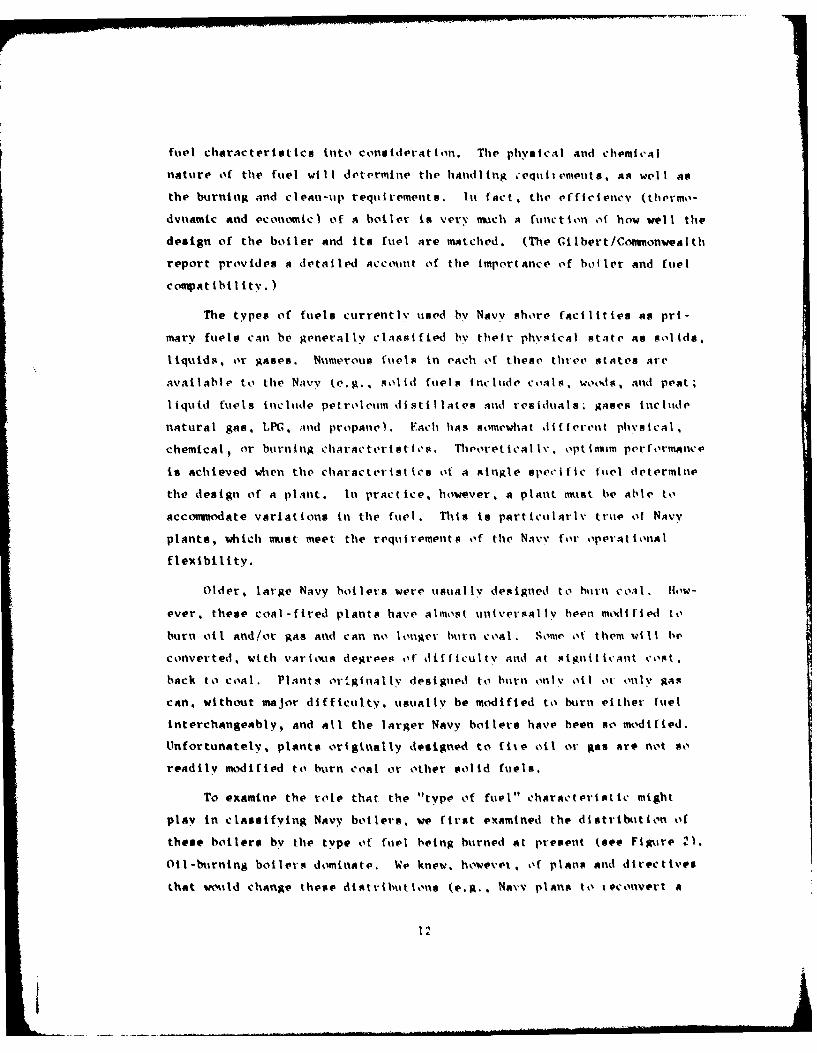
To examine the role that the "type of fuel" characteristic might
play in classifying Navy boilers, we first examined the distributi:n of
thee# boilers by the type of futel being burned at present i@e. Figure 2).
Oil-burning boilers dominate. We knew. howevex, of plans and directives
that would change these distrtbuitions (e.g., Navy plans to toconvert a
00
III 13
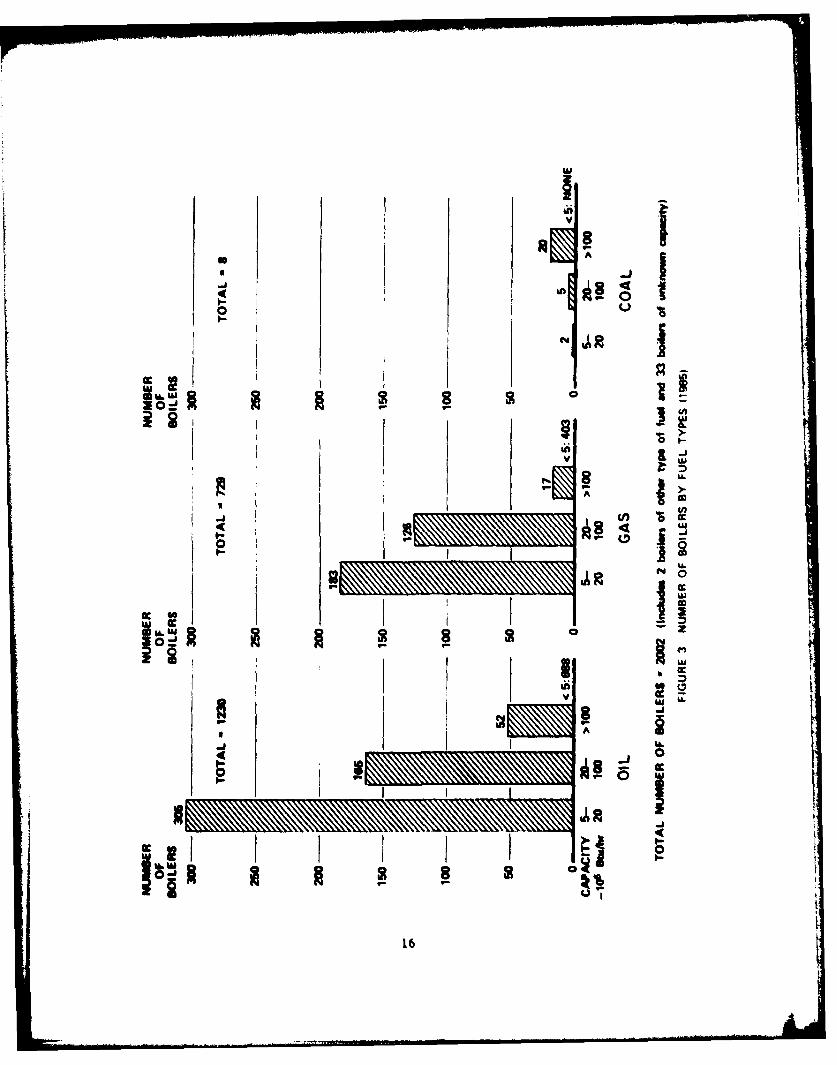
significant number of its previous coal boilers back to coal and OSD
directives that require all newly constructed boilers 100 x 106 Btu/hr
or larger to be coal-capable). The effects of converting the 20 plants
given in Table I on the distributions of Figure 2 are shown in Figure 3.
Although these boilers are few, their size and the relative versatility
of coal-capable plants for burning a variety of fuels without major
modifications make them important. In fact, coal-burning capability may
be of such importance that characterizing Navy plants as "coal" or "non-
coal" might suit our purpose. A two-category representation of fuel
type, combined with three or four size categories and perhaps categories
based on a few other boiler plant characteristics might be adequate.
3. Fuel Throughput
In our earlier work, it appeared that the quantity of fuel of a
given heat value fired in a given time (e.g., lb/hr) to meet the steam
demand and also the heat release rate (e.g., 106 Btu per lb/min) needed to
meet a varying demand could importantly influence the form, as well as
the amount, of WDF a plant could utilize. In other words, because the
heat content of the primary fuel, its volatility, and the way in which
it will be introduced into the furnace were all taken into account in
designing the boiler, these same features of the cofired fuels should be
important in determining WDF cofiring capability. Fuels with radically
different characteristics would have different limits in the rates (mini-
mum as well as maximum) at which they could be properly consumed in a
plant of a given design, and they would adapt differently to fluctuating
demands. (The relationship between primary and secondary fuel heating
values, rates of firing, and matching of boiler characteristics is dis-
cussed in some detail in the Gilbert/Commonwealth report.)
Whether the typical amounts of fuel throughput, as a characteristic,
would need to be included in the classification was unclear. We had
observed in our earlier studies that the total annual throughput and the
design capacity of a normally operated boiler could be related with a
simple function, at least as a first approximation. But if throughput
was to be indicated on a quarterly, monthly, daily, or hourly basis (as
14
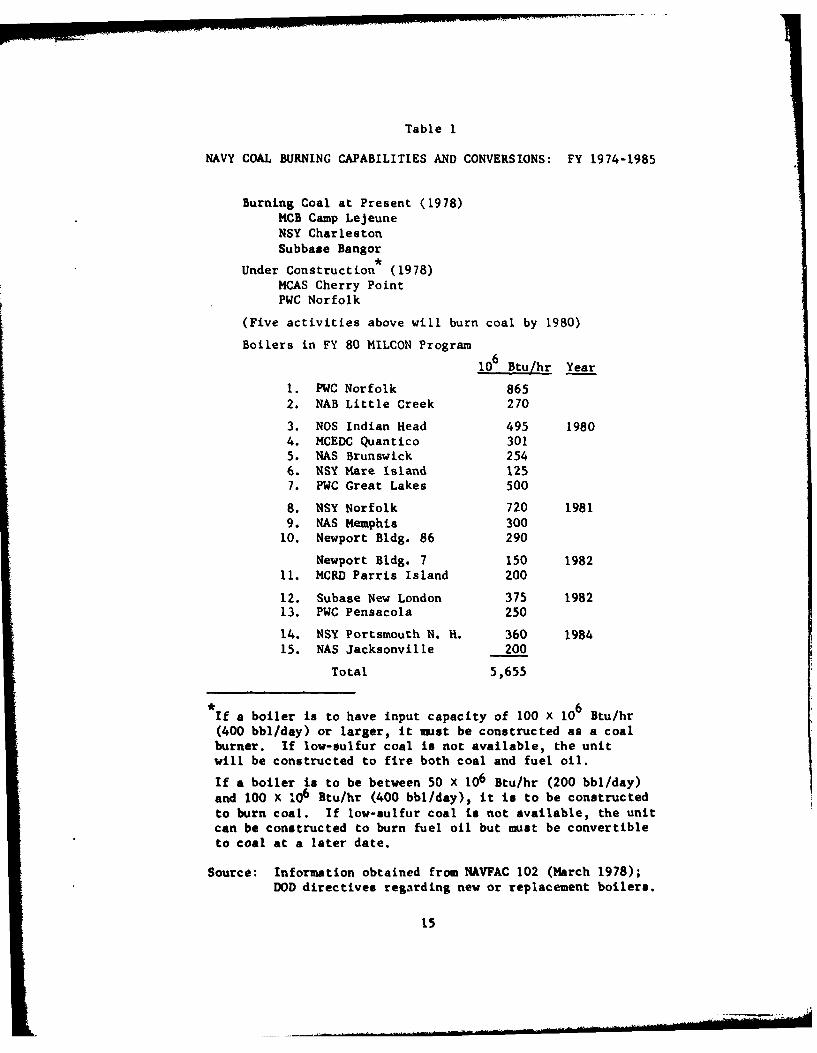
Table 1
NAVY COAL BURNING CAPABILITIES AND CONVERSIONS: FY 1974-1985
Burning Coal at Present (1978)MCB Camp LejeuneNSY CharlestonSubbase Bangor
Under Construction (1978)MCAS Cherry PointPWC Norfolk
(Five activities above will burn coal by 1980)
Boilers in FY 80 MILCON Program
106 Btu/hr Year
I. PWC Norfolk 865
2. NAB Little Creek 270
3. NOS Indian Head 495 19804. MCEDC Quantico 3015. NAS Brunswick 2546. NSY Mare Island 1257. PWC Great Lakes 500
8. NSY Norfolk 720 19819. NAS Memphis 300
10. Newport Bldg. 86 290
Newport Bldg. 7 150 1982
11. MCRD Parris Island 200
12. Subase New London 375 198213. PWC Pensacola 250
14. NSY Portsmouth N. H. 360 1984
15. NAS Jacksonville 200
Total 5,655
If a boiler is to have input capacity of 100 X 106 Btu/hr(400 bbl/day) or larger, it must be constructed as a coalburner. If low-sulfur coal is not available, the unitwill be constructed to fire both coal and fuel oil.
If a boiler is to be between 50 x 106 Btu/hr (200 bbl/day)
and 100 X 106 Btu/hr (400 bbl/day), it is to be constructedto burn coal. If low-sulfur coal is not available, the unitcan be constructed to burn fuel oil but must be convertible
to coal at a later date.
Source: Information obtained from NAVFAC 102 (March 1978);DOD directives regarding new or replacement boilers.
15
oI- UI-L
00
III I 116 Im 0
'316
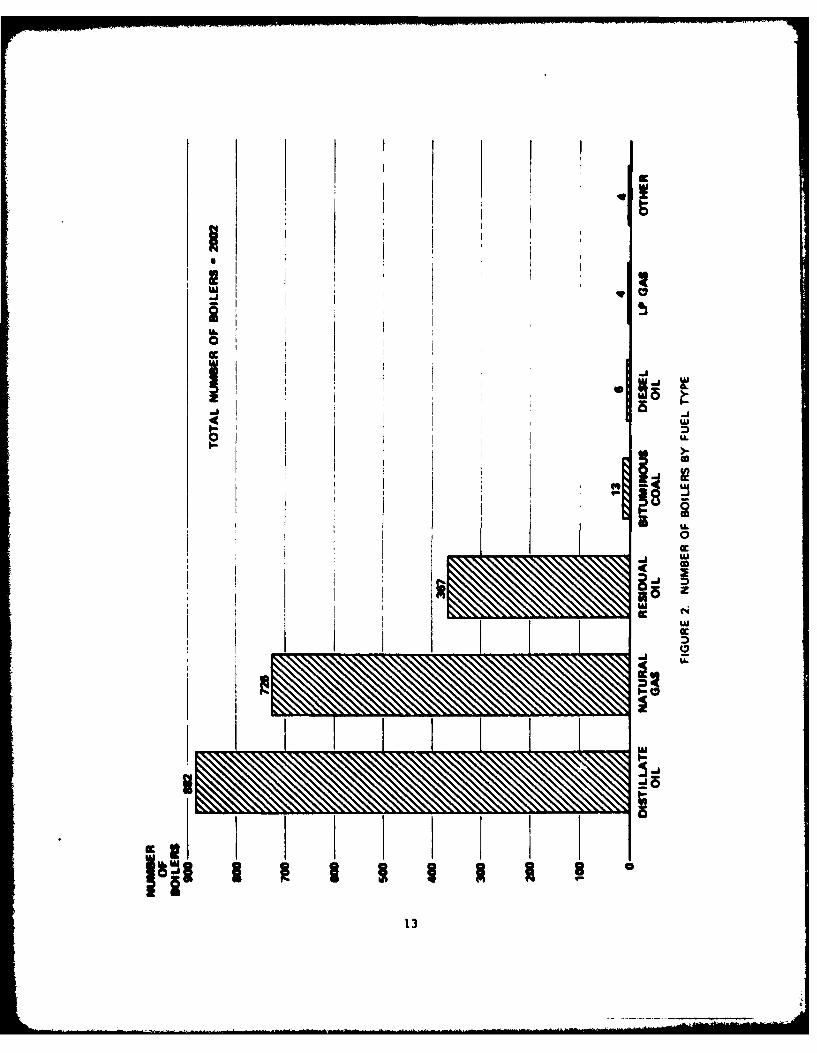
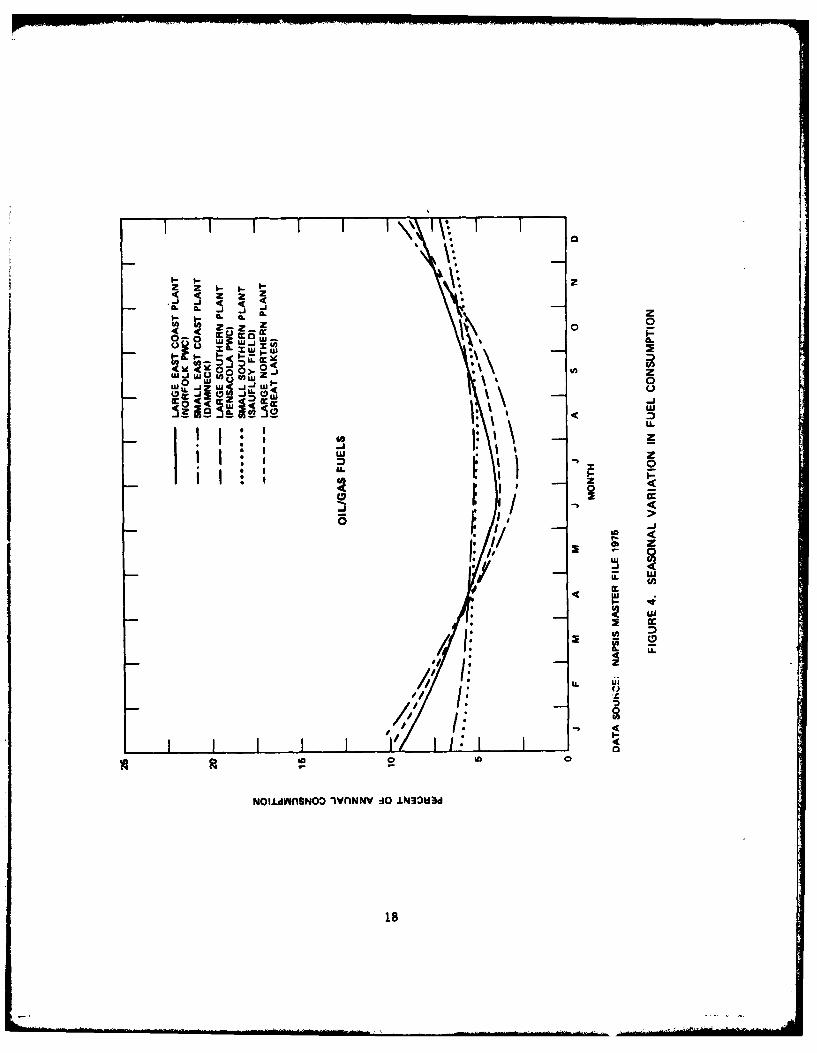
might be the case for determining WDF utilization potential), relating
throughput and boiler capacity became much more complicated. For ex-
ample, Figure 4 (prepared from NAPSIS quarterly estimates of percentage
of annual throughput) shows seasonal variations for several plants. But
Figure 5 (plotted from monthly consumption data for a single large plant
as reported in DEIS II records) indicates seasonal variations more
strongly.
Only a few activities were examined for monthly profiles of fuel
throughput similar to Figure 5 because of the excessive labor required
to extract the data manually from the fuel consumption records available
at SRI--hard copy computer printouts of DEIS II monthly reports by Major
Claimant. (Another SRI project for the Navy sought to facilitate the
analysis of DEIS II reports of Navy energy consumption. When this
computer-managed data file becomes available, a more comprehensive study
of consumption versus capacity should be performed.)
We decided that, although it was undoubtedly important in calculating
cofiring potential and economic data for a given plant, we would not use
fuel throughput as a primary variable in our boiler classification scheme.
Instead, it appeared that size (in 106 Btu/hr) was a reasonable substi-
tute; if throughput were needed for this study we assumed that the fol-
lowing relationships would suffice:t
" Average monthly throughput -30% of designed capacity (106
Btu/hr) X 720 hr.
* Peak monthly throughput -50% of designed capacity (106
Btu/hr) x 720 hr.
• Maximum monthly throughput -4007. minimum monthly throughput.
*Project NEUPAAS (Users' manual for the Navy Energy Usage Profile andAnalysis System) conducted by SRI for OPNAV 413.
tThe reader is cautioned that these relationships result from averagingdata from a sample of five arbitrarily selected plants. The relation-ships should be reexamined when NEUPAAS is available.
17
az
00
A0
-I 0
w.' w L
LU I.
0 -1~ I' -
-L I,
5u-j
ICL 5',*5I p.
I .-
Noi~~wnswa *vNN :1 N3~
18w
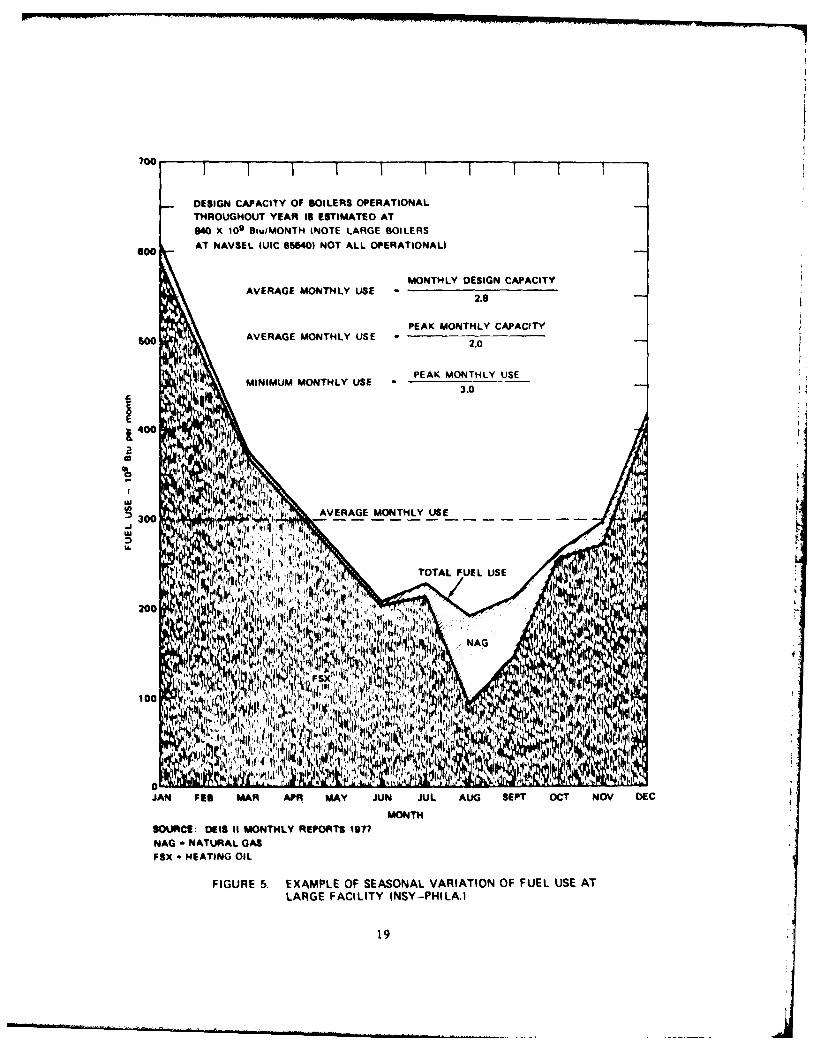
700
DESIGN CAPACITY OF BOILERS OPERATIONALTHROUGHOUT YEAR 18 ESTIMATED AT840 x 109 BiulMONTH (NOTE LARGE BOILERS
S00 AT NAVSEL (UIC 640) NOT ALL OPERATIONAL)
MONTHLY DESIGN CAPACITYAVERAGE MONTHLY USE *2.8
PEAK MONTHLY CAPACITYSoAVERAGE MONTHLY USE -2.0
'1 PEAK MONTHLY USEMINIMUM MONTHLY USE
3.0
400 2rI
- ..
~I K AVERAGE MONTHLY USE300 70
~~ 'Li TOTAL FUEL USE 4
NAG -NATURLNGA
1019
4. Other Characteristics
Descriptive information characterizing Navy boilers, such as boiler
age, manufacturer, type (water tube or fire tube), economizers, super-
heaters, and so forth was examined for possible use in the classification
scheme. However, none of these items appeared to provide direct informa-
tion useful in typifying Navy boilers for this study, and for the time
being, we omitted this level of detail from our classification scheme.
Nonetheless detailed information about Navy boilers can be obtained when
needed from engineering and utility files and routine reports.
B. Site-Related Characteristics
The type of information discussed above includes those kinds that
could be used to characterize the Navy boiler plants, without regard to
regional or local physical site requirements. Several analyses were per-
formed to ascertain whether Navy boilers had well-defined group charac-
teristics in common that were related to regional conditions such as
climate or indigenous fuels. Some evidence was found that small boiler
plants of recent vintage varied by region of the United States (e.g.,
oil was preferred in the North and Northeast, gas in the South and West).
Because only two coal-capable boiler plants were operational, no regional
preference for them could be determined. Proximity to ample supply of
a specific low-cost fuel probably influenced the choice of boiler type
in earlier years. However, with pipelines, railroads, trucks, and barges
conveying fuel to nearly every point in the United States, regional
groupings are probably no longer so important, at least not for plants
in the size range of those the Navy operates.
Local conditions can aictate a number of boiler plant design and
operating factors. Of particular importance are local conditions that
could prevent utilization of WDF, including space limitations, environ-
mental restrictions, lack of a rail trunk line, or lack of feasible truck
access to the boiler plant site. These problems, as well as numerous
20
institutional obstacles, are reported to have resulted in the cancella-
tion of several resource recovery/energy conservation projects. Although
factors such as these can constrain or eliminate options that might
otherwise be feasible, in this broad characterization of boilers and
boiler plants we found no adequate way of accounting for uniquely local
factors as they related to boiler plants as "types." We therefore
omitted local influences from our classification scheme. These factors
will, however, have to be taken into account in the final stages of the
analyses.
C. Development of a Classification Method for Navy EnergyConversion Systems
The characterization effort was the first step in sorting out infor-
mation from detailed day-by-day records on individual boilers to cate-
gorize attributes of the Navy's energy conversion system. It was then
necessary to select those characteristics that most effectively (and
efficiently, insofar as data management is concerned) represent the
technical and economic features of these energy conversion elements in
the analyses of solid waste/resource recovery systems. To make these
selections, we needed to know, at least roughly, which characteristics
had to be studied directly, which could be represented by other attributes
of the total system, and which could be omitted. The procedure used to
select the characteristics included in the classification scheme is dis-
cussed below.
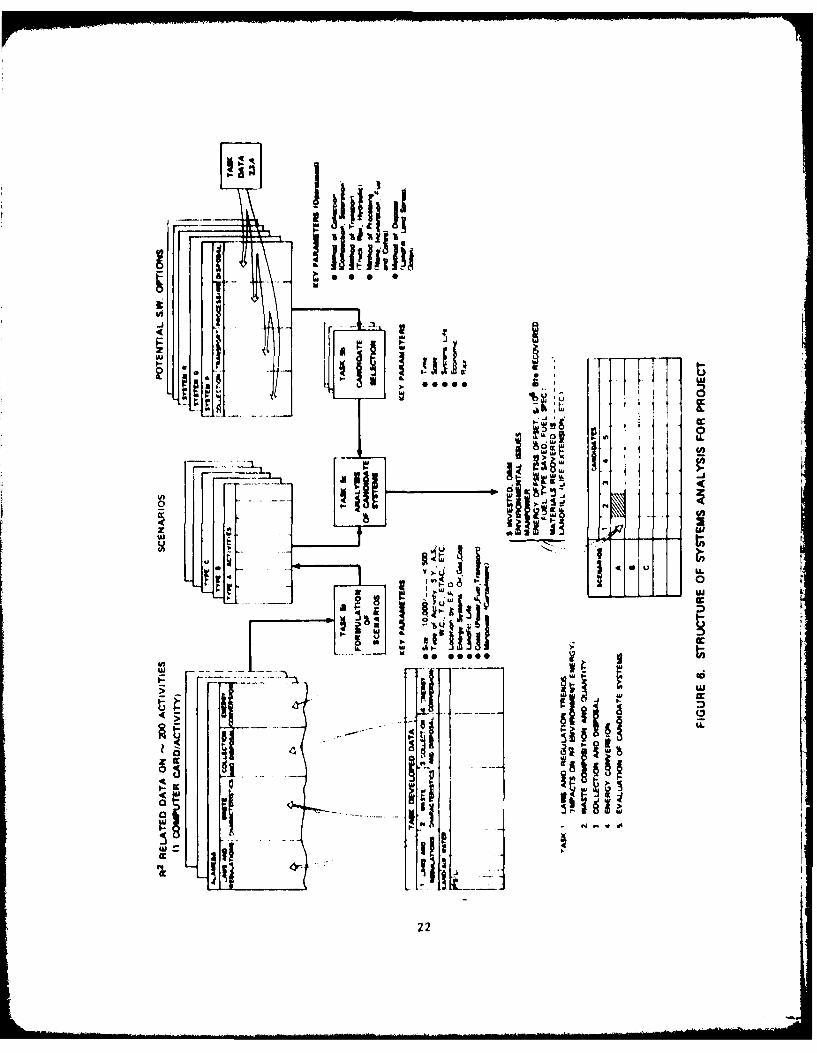
We first developed an overall systems analysis structure (see Figure
6) to indicate conceptually what information should result from our
analysis. From this structure, it became apparent that the analysis
should seek to compare different types of existing total solid waste sys-
teams with technically feasible alternative solid waste/resource recovery
systems--in particular alternatives that provide for energy recovery.
Gordian Associates, Inc., "Overcoming Institutional Barriers to SolidWaste Utilization as an Energy Source," Final Report prepared for U.S.
Department of Energy (November 1977).
21
- - - - . ...,
-I. i i-~ -- ..... .!
_ - : 4 I.
.1 1
22
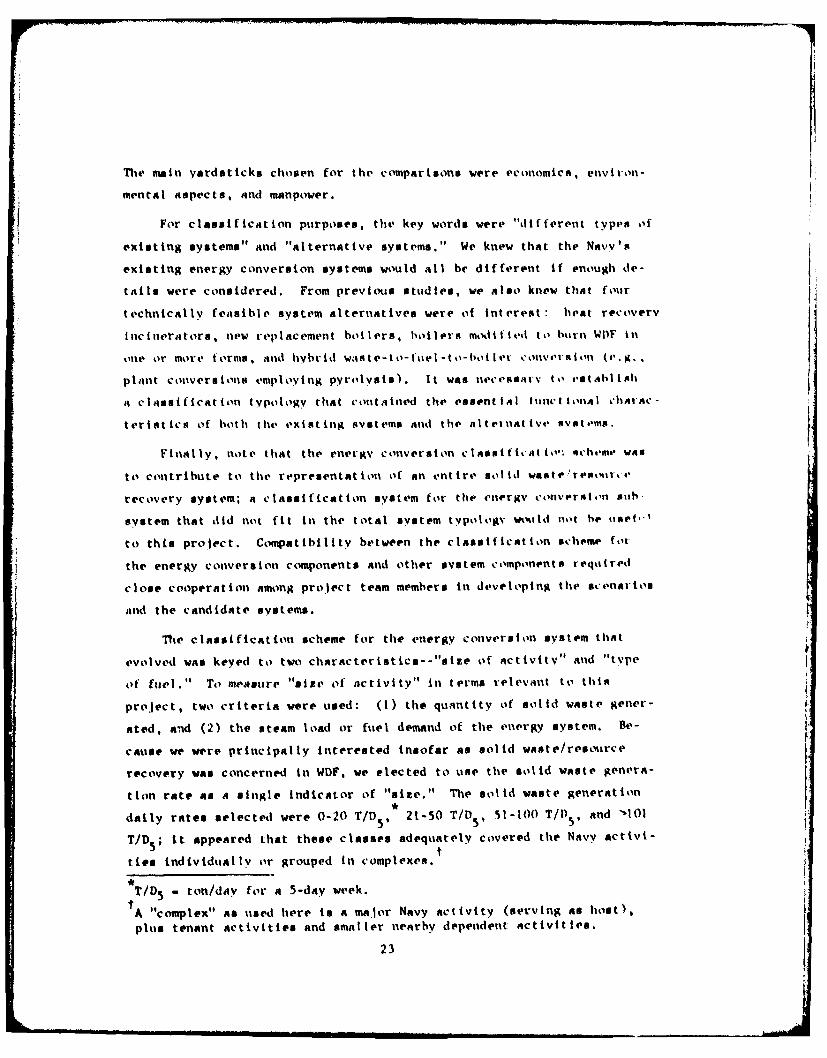
The main yardsticks chosen for the comparisons were economics, environ-
mental aspects, and manpower.
For classification purposes, the key words were "different types of
existing systems" and "alternative systems." We knew that the Navy's
existing energy conversion systems would all be different if enough de-
tails were considered. From previous studies, we also knew that four
technically feasible system alternatives were of interest: heat recovery
Incinerators, new replacement boilers, hollers mxitt ed to burn WDF in
tile or more terns, and hybrid ss-t.-fu watieconvers t'li (e.s.,
plant coversions employing pyrolysis). It was necessary to establish
n classification typology that contained the essential hinct tonal chArAc-
teristics of both the existing systems and the alternative vtems.
Finally, note that the energy conversion clAss ifticatI o, ach,,me was
to contribute to the representation of an entire solid wastreslxoutrce'
recovery system; a classification system for the energv convprsion sitb-
system that did not fit in the total system typologv wttuld not be ,tet,'
to this project. Compatibility between the classification scheme for
the energy conversion components and other system components required
close cooperation among project team members in developing the scenarios
and the candidate systems.
The classification scheme for the energy conversion system that
evolved was keyed to two characteristics--"size of activity" and "type
of fuel." To measure "size of activity" In terms relevant to this
project, two criteria were used: (1) the quantity of solid waste gener-
ated, mad (2) the steam load or fuel demand of the energy system. Be-
cause we were principally interested insofar as solid waste/restource
recovery was concerned in WDF, we elected to use the solid waste genera-
tion rate as a single indicator of "size." The solid waste generation
daily rates selected were 0-20 T/D5, 21-50 T/05 0 51-100 T/Ds, and -101
T/D ; it appeared that these classes adequately covered the Navy activi-5€
ties individually or grouped in complexes.t
T/D 5 - ton/day for a 5-day week.
A "complex" as ted here is a major Navy activity (serving as host),
plus tenant activities and smaller nearby dependent activities.
23

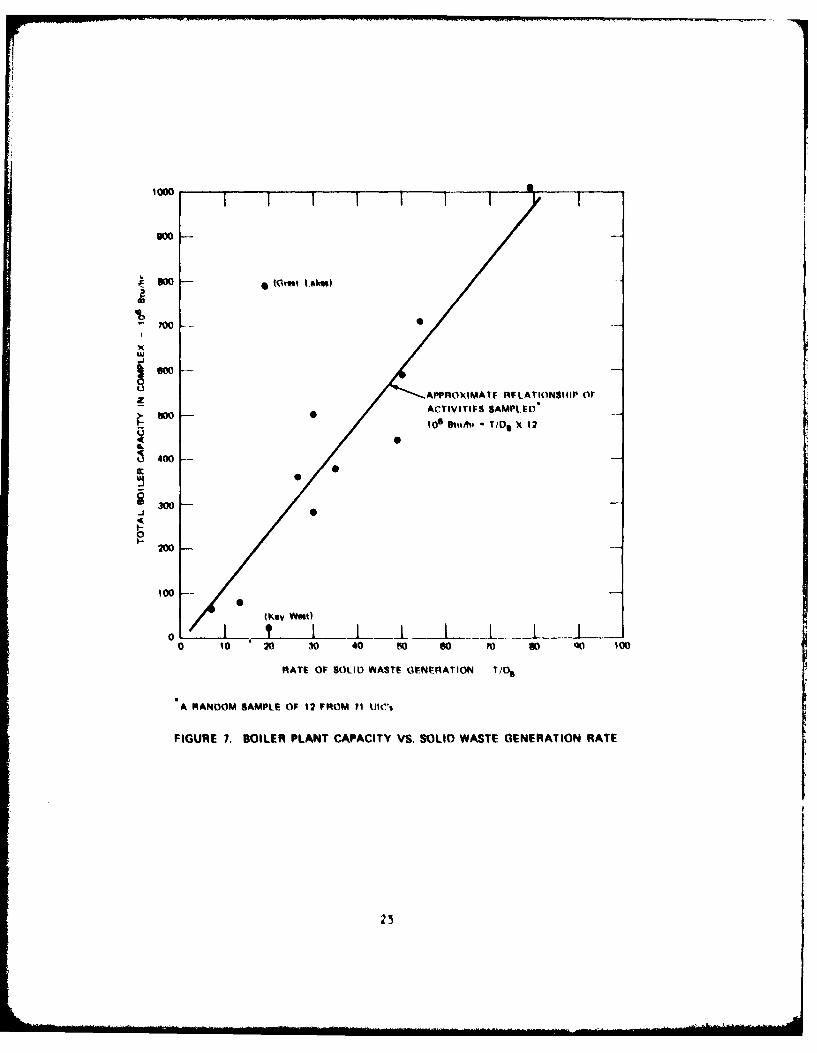
Cnvertinug usolid waste i nd icatotrs (T/1) 'into filel demnqttd pipye in-
klicAtors 00~ 140110r (OV %18e With etneVAV COM-OVeiOt plants and boi lersreqtved the time %it indirect tel at ionshirs. We had oserved that pl ant
Sol id waste gonerattoll rate And hot Iler plant shre were probably related,
A.' Ohow ill Ft glre 7.* And $l 180 that hotI let IllAnt s@te And AVPt-ae M~nthI v
INI Ant NoteI demand wove Poo i t t \'(, v couve Iat ed (see Figutre 5) On the
basis o'f these relationsips, we concluded that . as A firsit appro~xim-
thin for line in this atudy. this filel demand to' s"lItd wasto e lAtinhit
% omld tit expressed hr:
P'lant fulet dema~nd .jfL.tu/111) -Plant Poi d waste generat io~n I-Ate (T/PDSI
U t lig this vel atitislilp , lant filel demand Ci assem of '-80 1 0 fi I /fir
81 -;200 \~ 10 6 Awt/hv. *01 -400 \ 1o l it u/hr. ,And 401 ' 106 11tti/hr vere
estahl ahokd tO' c~irrOMP~id with thte stolid waste c lasses selected (--20 TIP9 .21-9 5t,1 1-100 T11) Ad 'l
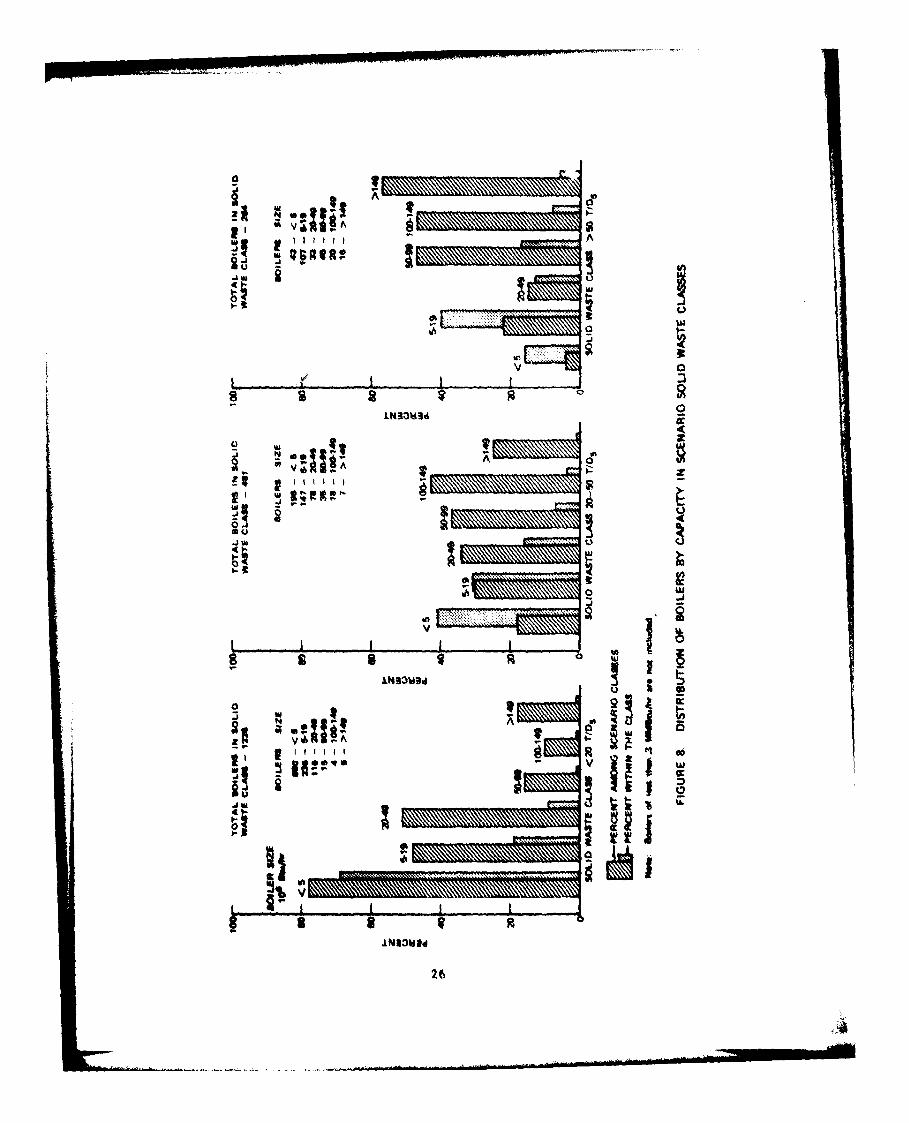
tin add it iov t ' the fuel denmad /Aloid w~ast e ret at Iionsip. the Pipe@
of boilers represented hv the solid waste classes in the classi ficat tim
scheme Were oif interest beCAusPe A 1b0ler's ste was related to~ the popets-
wore ckxded tIn class sites AS: -5 \ to Awt/hr. 5-19 x 10 Bt/ir,
20-49 0~ Rutu/hr. 5 0-QQ \ 106 Blu/hr , 100-149 \ 1 0' Rtu/hr. and
"149 It 1 it B/hr. The dl stribhuttion %if 0106e classes 'If hOtIlet- in
three of the four classi ficat ion site categories (i.e. , the Sol id waste
genorat ioni rate) Is shown tin Figmre 8i. hiecause the datA aIn thes -101 T,111
cat egorv were I nsuff iclent, thAt, cat gorv was combined wi th the 51-100
T/P9 class to make the -9ti T/\ tc1a0s.
T"he 'tlter characterttc selected for the energv c onversion Ciaspi -
ficat ton scheme, was "type of fueol" (I.e. * the prvimary filet (tirod).
Recogriaing the differinia pot ent tat of coal -cApahl e hot lets And other
boilers to lise WOF ti various fovms, we decidted that two %classes of "tvpe
of fuel'' shotild etted--oa' tittitict noea I
4 '4
100
900
400?00
AP'PROXIMATE RFLATIONSHIP or
0106 SSuhi- TIDS )c 12
~400-
~300
200
100
(Key Wert
0 r 10 ,0 40 m L0 o 0 SI 00 100
RATE OF SOLID WASTE (IFNERATION T/1
A RANOOM SAMPLE OF 12 FROM 1i UIR's
FIGURE 7. BOILER PLANT CAPACITY VS. SOLID WASTE GENERATION RATE
25
........ .....
1'inmoll__
2mel i)
IMMEME
oago
Combining the size criterion (four classes) and the type of fuel
criterion (two classes) gave an energy conversion system classification
scheme of eight classes (a 4 )( 2 scheme).
27
IV NAVY ENERGY CONVERSION SYSTEMS IN CLASSES
Classifying the energy conversion systems by size and by the type
of fuel consumed was a first step in solving the classification problem.
To ascertain whether this scheme was applicable, it was applied to the
Navy's existing energy boilers. The resulting classes were then examined
to determine whether they could be considered the typical building blocks
of future candidate options (i.e., systems typical of those that would be
modified to utilize WDF in one or more forms).
A. Classification of ExistinR Boilers
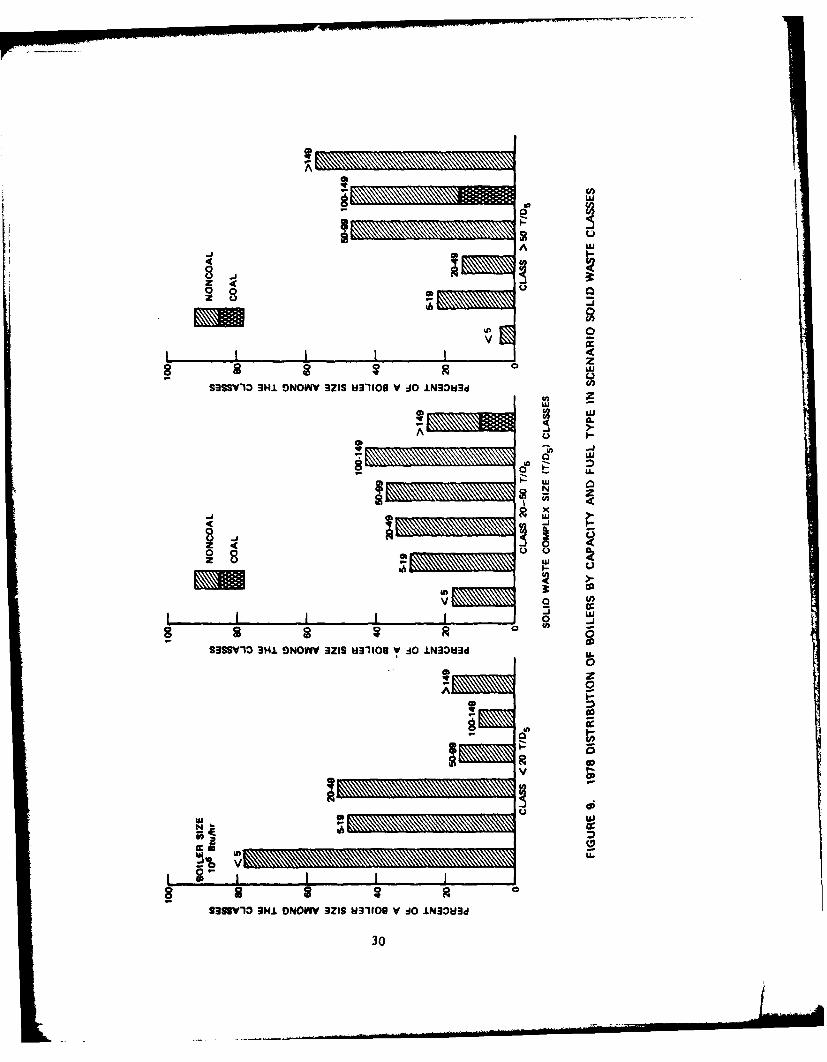
Figure 9 indicates the distribution of existing Navy boilers among
scenario classes under size and type-of-fuel consumed classifications.
The preponderance of relatively small, noncoal boilers is significant.
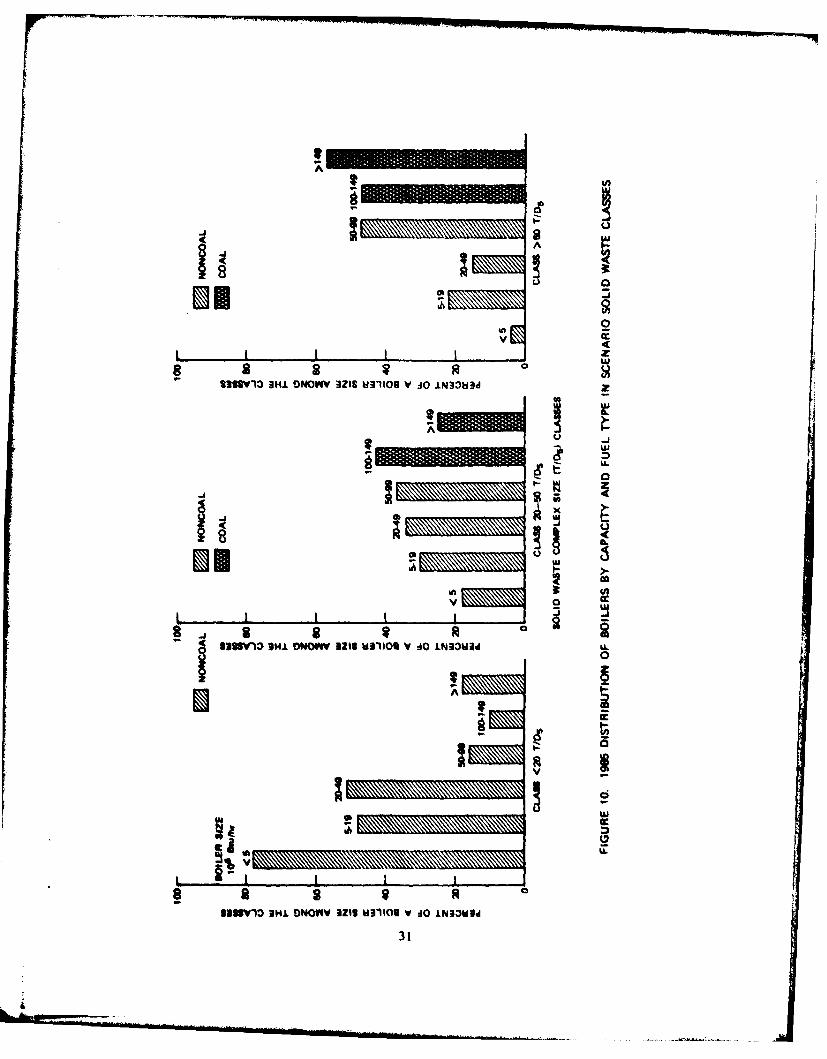
Next, the Navy's coal conversion plans were projected for the ex-
isting boiler inventory, and the resulting distribution was calculated.
Figure 10 shows the results. This figure illustrates how the coal con-
version program focuses on large boilers and large waste generators.
These large coal-firing boilers will certainly be system components for
WDF utilization in one or more candidate systems.
B. Classification Scheme and Energy Conversion Options
The boilers classified as shown in Figure 10 are assumed to repre-
sent candidates for modification, augmentation, or replacement, after
which they would represent energy conversion subsystem options in future
solid waste/resource recovery systems. To analyze the total system, we
needed to select the most technically feasible energy conversion subsystem
options and to include them in the candidate future systems for comparison
with current, unaltered operations.
29
A
0 0 CD
Z -A
00
o too
S CCD
z 4c00
CA
- 0 W
IL&
024
2 cc
2SIO ONO V4 IIS Ui31100 V :10 IN30b3d
300
AA
U
ax
% v
1333VI 3HI DNOWY aZIG U3110U v do 1N331w3d
31!
To judge whether the WDF energy conversion subsystem options were
technically feasible, it was first necessary to review the technology
of burning WDF in various forms as a function of boiler sizes and the
form of WDF, as well as transforming the WDF into the fuel suited to a
particular method of burning.
1. Incineration and WDF Preparation
Energy may be recovered from solid waste by mass burning (incinera-
tion) or by processing the waste into various fuels for subsequent burning
in existing boilers. In theory, mass burning can be successful, both
environmentally and insofar as solid waste disposal is concerned, with a
minimum amount of preparation of the raw waste if the incinerator is
properly designed to accept the particular waste. Heat recovery can im-
prove the economics of incineration. Techniques for incineration have
been improving for centuries and are continuing to advance, with in-
creasing emphasis on improving heat recovery and pollution control. Re-
cent studies of ways to improve heat recovery and to gain better control
over air and water pollution have pointed to the desirability of a cer-
tain amount of preprocessing of the raw waste to remove objectional items
and to make the waste more uniform in size and composition. More sophis-
ticated methods of controlling air and feeding, as well as methods of
stirring and ash handling, are also being developed to improve incinerator
operation. The optimal compromise between preparing solid waste for the
incinerator and tailoring the incinerator design to the waste form and
composition has not been found; incineration still appears to be more
art than science. Although relatively small package incinerators are
being tried with various kinds of waste, only one form of incinerator--
the waterwall incinerator--has been widely accepted in the United States
for disposal of mixed solid waste. This type is suitable for large-scale
installations (see Appendix A for a detailed analysis of the state of the
art in incineration).
32
2. Conversions of Existing Systems and WDF Preparation
If incinerators were thought capable of providing cost-effective
solutions to all energy recovery from solid waste needs, there would be
little or no interest in developing processes to prepare fuels from the
waste for use in existing (or modified) energy conversion systems. The
motivation behind WDF preparation is to make a fuel from the waste that
is compatible with the boiler and the primary fuels in order to make
maximum use of existing heat recovery equipment, thereby avoiding as
much as possible costly plant rearrangement or duplication of components.
It is technically possible to produce almost any form or kind of
fuel from solid waste, but at present the economics of producing these
fuels is very uncertain. Most of the processes are capital-intensive
and have strong economies of scale. Because one of the purposes of
processing the waste into WDF is to produce a product readily accepted
as either a substitute or an augmentation fuel, a substantial cost-saving
incentive is required to promote the use of the process. The ultimate
goal in developing waste refining processes is to produce solids, liquids,
and gases compatible with (or resembling) the primary fuels (i.e., coals,
oils, and gases) conventionally used, and to use the refined waste as
fuel thereby substantially iowering the total system costs. So far this
has proven quite difficult. More refined WDF forms generally perform
better and require less additional support equipment, but they cost sig-
nificantly more per unit of energy. The trade-offs between the degree
of processing and the amcunt of modification are quite complex because
of interactions among functions in the refining and burning processes,
and the economics of scale for modifications.
The methods developed to date to produce WDF usually involve to dif-
fering degrees the following first-stage processing steps: size reduc-
tion, removal of inert material, and classifications into combustible
and noncombustible fractions. Several forms of what are commonly called
"fluff RDY"* result. These fluffs can be processed further (second-stage
RDF is an acronym for refuse derived fuels. RDF as used here refers tosolid forms of WDF.
33
processing) by mechanical means into denser solid forms, chemically tito
dust solids, or thermally into liquids or gases. However, the physical
and chemical properties of each of these solid, liquid, or gaseous forms
of WDF can vary widely. One of the requirements in producing WDF is
process control to ensure that the end product (produced from a coaplex,
highly variable raw material) is usable or marketable. That is, it mist
be sufficiently uniform to be substituted for, or cofired with, a con-
ventional fuel.
Isolating unit processes without regard to their interactions for
the purpose of developing unit process technical or economic data has not
been very successful. The controlled testing necessary has not been done.
Capital costs for the unit processes can be obtained from equipment ven-
dors and architects and engineering firms, but estimating operating and
maintenance costs per unit processes with any precision is impossible
because no detailed records yet exist of system operations. Conmon prac-
tice at present is to set total system O&M costs at a percentage of the
total capital cost. This approach was used for developing the incinerator
costs shown in Appendix A and the costs of other alternatives discussed
in Section V.
Midwest Research Institute, "Study of Preprocessing Equiptent for Waste-
to-Energy Systems," prepared for EPA Workshop, New Orleans k8-10 February
1977).
34
t.
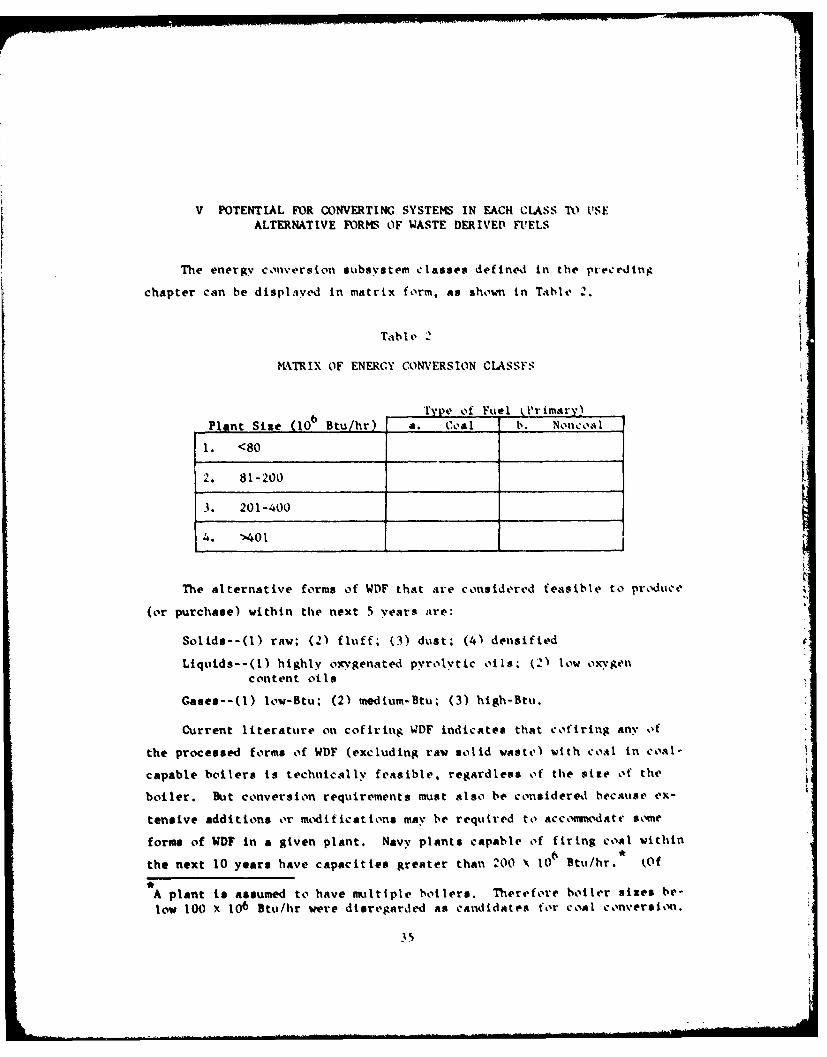
V POTENTIAL FOR CONVERTING SYSTEMS IN EACH CLASS TO USEALTERNATIVE FORML OF WASTE DERIVED FUELS
The energy conversion subsystem classes defined in the preceding
chapter can be displayed in matrix form, as shown in Table 2.
Table 2
MTRIX OF ENERGY CONVERSION CLASSFS
Type of Fuel 'rimary)Plant Size (16 Btu/hr) -a. Coal b. Noncoal
I. <80
2. 81-200
3. 201-400
4. ">401
The alternative forms of WDF that are considered feasible to prXuce
(or purchase) within the next 5 years are:
Solids--(l) raw; (2) fluff; (3) dust; (4) densified
Liquids--(l) highly oxygenated pyrolytic oils; (2) low oxygencontent oils
Gases--(l) low-Btu; (2) medium-Btu; (3) high-Btu.
Current literature on cofiring WDF indicates that cofiring any of
the processed forms of WDF (excluding raw solid waste) with coal in coal-
capable boilers is technically feasible, regardless of the size of the
boiler. But conversion requirements must also be considered because ex-
tensive additions or modifications may be required to accomm~odate some
forms of WDF in a given plant. Navy plants capable of firing coal within6*
the next 10 years have capacities greater than 200 \ 10' Btu/hr. (of
A plant is assumed to have multiple boilers. Therefore boiler sites be-low 100 X 106 Btu/hr were disregarded as candidates for coal conversion.
35
the 20 plants operating or planned, 8 will have capacities greater than
400 X 106 Btu/hr.) The potential for converting these larger plants to
use WDF is rated as moderate to high, depending on the form of WDF under
consideration. The two smaller coal classes will be deleted because no
plans exist for coal-capable Navy boilers in those classes.
For noncoal plants, few constraints, if any, are foreseen on firing
or cofiring liquid or gaseous WDF in these plants, regardless of their
size. Burning characteristics of low-Btu gases may, however, so decrease
the capacities of smaller plants firing these gases that they could not
meet the peak loads. (Smaller systems usually have less excess capacity
to meet peak loads.) One factor to consider in rating the potential for
converting noncoal boilers to fire liquid WDF is that the smaller plants
are most frequently designed to burn distillate only, whereas the larger
plants may be set up to fire either residual or distillate oils. For
this reason, the potential for firing low-oxygen WDF liquids appears
greater (the method is more universally acceptable and has fewer fuel
heating and pumping problems) than the potential for firing highly oxy-
genated WDF liquids. Nevertheless, the potentials for both are judged
to be high.
Burning solid forms of WDF in noncoal boilers is now undergoing £
considerable research. Technical feasibility has been demonstrated at
several large industrial plants that fire fluff and dust, but problems
related to arrangements for ash handling and particulate control can be
difficult and expensive to solve, especially at smaller plants. The
Gilbert/Commonwealth report contains a case study of a typical medium-
sized, oil-fired plant base loaded on fluff WDF. Simplified conceptual
firing arrangements are presented, and the capital cost estimates appear
to be attractive. The costs of this method are discussed in the next
section and covered in detail in that report.
Judgments concerning the technical feasibility of utilizing various
forms of WDF in the Navy's boiler plants can be entered into the matrix
of classes (Table 2) with the results presented in Table 3.
36
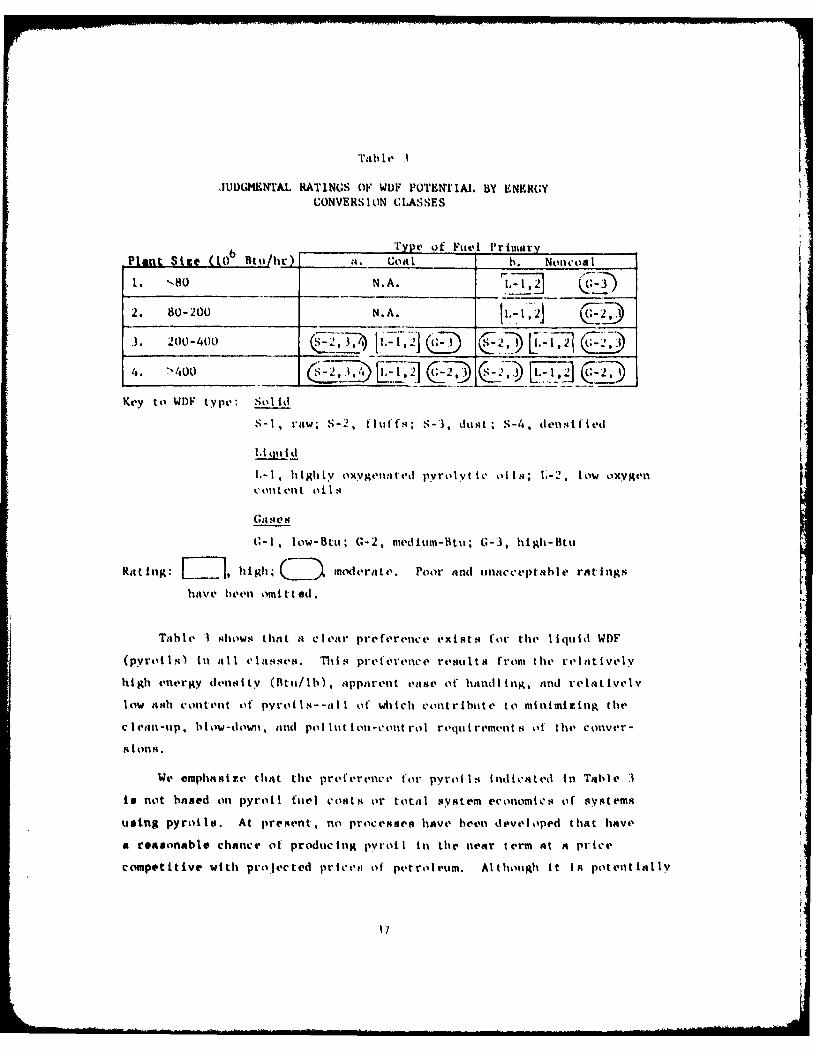
Tab le .1
JUDGMENTAL RATINGS OF WDF POTENTIAl, BY ENERGYCONVERSION CLASSES
6 Type of Fuel PrinmaryPlant Saze (10 Btu hr) a, Coal b. Noncoal
2. 80-200 N.A. El.-lD2
3. 200-400 -2,3,1 1 -1.2iQ G2DL-3Q
Key to WDF type: Sot Id
S-I, raw; S-2, I'luff1; S-3, dust; S-4, densified
I-I, highly oxygenlited pyrolytic oils; L-2. low oxygenSollt t t.l t
G-I, low-Btu; G-2, meditm-litt; G-3, high-Btu
Ratinug: high; CD7~ modierate. Potir and tinacceptable rAt i gs
have been omitted.
Table, I shows that t clear preference exists for the lIi(tl id WDF
(pyroi s) in all classes. Thits prefterence restits from tit relatively
high energy density O(Wlt/Ib), apparent ease of hand iig, :1ad re'lativelv
low ash content ift' pyroia l--all of wh i ch contribtte to minimizing the
c len -up,* blow-dowl, and pollut ion-c out re|ol requ irement s of the conver-
Hq i till 4.
We emphasize that the preference, for pyrolls indicated in Table 3
is not based on pyroil (ttel costs or total system economics of systems
using pyrotlo. At present, no processes have been developed that have
a reasonable chance of producing pyroil in tile near term at a price
competitive with projected prie',s of petroleum. Although it is potentially
attractive, widespread utilimatit, 1 of liquid WDF will depend on $lipifi-cantly reducing its costs. In the near to intermediate term, if specialsite conditions (eO.R., a large number of small oil-fired boilers in Aregion with stringent atr standards) require an unusual solution, pyroilmight be attractive in the total solid waste/roesurce recovery system.Pyrolls are discussed further in the next section, In Appendix A, and inthe Gilbert/Commonwalth report.
38
VI DIFFICULTIES AND COSTS OF IMPLEMENTING ALTERNATIVES
The classification scheme developed for this study tends to mask in-
dividual features of the Navy's boiler plants; each plant, in fact, is
unique in many ways. On the other hand, boilers within the classes we
have defined present common problems, similar modification requirements,
and typical costs as energy conversion alternatives. Knowledge of these
class-related traits should help narrow the field of investigation re-
quired for efficient analyses of candidates in subsequent detailed design
studies for a given class. Such knowledge also enables gross comparisons
among classes to be made for R&D planning purposes. The discussion that
follows, therefore, identifies what is known or can be estimated from
analyzing data from numerous sources and then generalizes the informa-
tion so that it may be applied to the energy systems in the classes we
have selected.
More than 200 articles, papers, and books (see Chapter VII, Bibli-
ography) were screened for relevant technical and economic information
about alternative actual or conceptual resource recovery systems. Data
were abstracted and compiled by the functional segments of a solid waste/
resource recovery system (i.e., by generation, collection, transport,
compaction, size reduction, classification, fuel recovery, energy con-
version, disposal, and marketing). SRI project staff members reviewed
the data in their areas of expertise and, when possible, extracted in-
formation from the compiled references that was appropriate to the "size/
type of fuel consumed" classes selected.
Together with this survey and the literature review, two special
studies were performed: (1) mass burning of solid waste with heat re-
covery in shop fabricated incinerators (package incinerators), and (2)
waste fuel utilization by conversion of existing Navy steam plants. These
See Appendix A and Gilbert/Commonwealth report.
39
two alternatives were of immediate interest to the Navy and thus deserved
particular attention.
Informativn acquired through these two studies was combined with the
information retrieved from the references to form a substa.,tial data base
on energy recovery systems and conversion alternatives. The alternatives
considered belonged to four general categories:
0 Heat recovery incinerators
• New or replacement boilers capable of burning WDF
* Boilers modified to burn WDF
* Hybrid conversions (pyrolysis and "hot smoke" generators,plus existing boilers).
The modifications, costs, and other problems associated with implementing
each of these alternatives are discussed in the following sections. A
later section compares cost data. Suggestions concerning RDT&E that
might help solve some of the problems identified are offered in the final
section of this chapter.
A. Heat Recovery Incinerators
Waterwall incinerators are appropriate for larger class systems
(>400 x 106 Btu/hr); they can generate large quantities of high quality
steam, but they are also capital-intensive and require a major commitment
of space and manpower. Other problems exist as well. First, when they
run on raw waste, the incinerators generate unpredictable air and water
pollutants, which may be difficult and expensive to control. Second,
process control is insufficient to meet rapidly fluctuating demand. Un-
less steam demand is substantial and relatively steady year round, it is
unlikely that a waterwall incinerator could be cost-effective.
A Navy complex that has coal-burning capability might find the water-
wall incinerator a competitor to modifying the plant to cofire WDF if
enough waste from the nearby federal activities or surrounding communities
were available. In addition, under the same conditions, a waterwall in-
cinerator could be a strong competitor with a noncoal complex.
40
Package incinerators are appropriate alternatives to be considered
for the smaller complexes or isolated activities. Still relatively un-
proven under relevant Navy operating conditions, they are nevertheless
important candidates for the future because their technology is advancing
rapidly. Investment costs of package incinerators are comparatively
modest, and for medium sizes estimated O&M costs are reasonable. Ad-
hering to air pollution regulations in most regions does not appear to
be a problem, but some questions have arisen concerning disposal of
residues in cases of incomplete burnout.
Package incinerators should be considered as alternatives for all
systems except, possibly, the largest, >100 T/D5.
B. New or Replacement Boilers Capable of Burning WDF
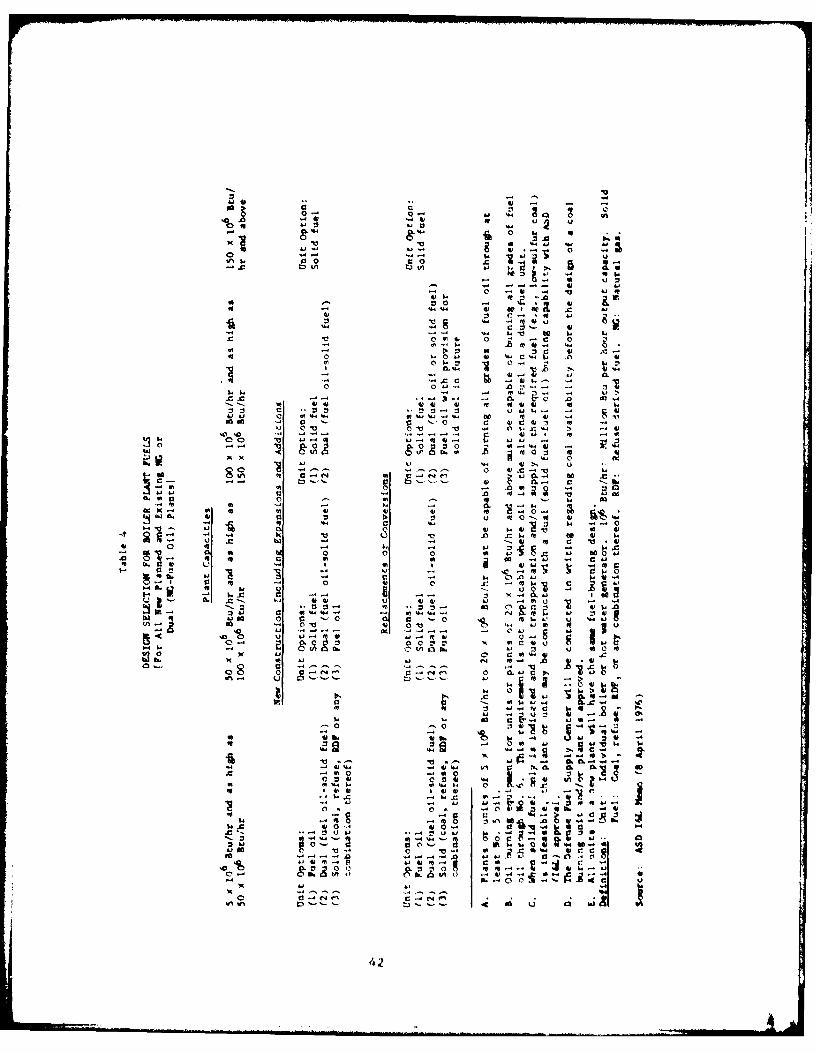
DOD design criteria for boiler and hot water heater fuel selection
are shown in Table 4. The basic intent of the ASD memorandum from which
this table was extracted was to reduce the use of natural gas in DOD
heating plants. A further objective was to reduce dependence or reliance
on any single form of fuel, and on natural gas in particular.
The criteria given in Table 4 are intended to encourage development
of dual fuel (oil/solid) capability in size categories from 5 X 10⁶ Btu/hr
to 150 x 106 Btu/hr, and solid fuel capability for boilers with capacities
150 X 106 Btu/hr or more. This directive mandates that liquid and solid
WDF must be considered candidate fuels in new or replacement boilers in
all the classes we have selected for study.
The Navy is implementing these instructions aggressively, giving
priority to coal utilization at its major plants. Because the basic de-
signs of these new boiler plants must accommodate ash handling, dust sup-
pression, and particulate control, it should be relatively easy to add
equipment to fire WDF in some form, although the added costs may be sig-
nificant. However, cofiring of WDF of characteristically low sulfur
ASD I&L Memo (8 April 1976).
41
.C C M
04 4J.- 41.44 . -
.0).~~~ 00U 0 '4''
'4 4
IL. 0 ). 4 ' 4) ' i ' iI 04
AI U, 4. w , 4)
0 "0
-A)4 -4 2 - c) hi:..4 -
4--) 4))44 4) 4) ))4 1
x 0 c .v 4.'. -
~ -1 Cl 0 '-0 0 tj4) 4) '
QO ' 4' v 06),-
(J.0 4) a-lE II 00ll"~ li ~4 ~4) ro be
4f. I 4) C:I L
4) 0 4) Li~.C i42
content may actually improve the cost effectiveness of new coal firing
systems in some instances by reducing the sulfur concentrations in the
stack gases, thereby enabling the plants to fire high-mulfur coals with
less costly stack gas cleanup equipment.
C. Boilers Modified to Burn WDF
The problems, modifications, and costs associated with converting
existing boilers to fire WDF are (1) site-specific and (2) a function of
original boiler type. However, some general comments on this alternative
may be useful, especially in suggesting the effects of the scale of the
plant, the size of the boilers, and the type of cofiring contemplated.
Converting plants already capable of burning coal to any form of WDF
should not be technically difficult. Conversion for liquid or gaseous
forms would probably be straightforward and would be less expensive than
conversion for solid forms. (Oil and gas firing systems are simpler than
counterpart systems for solids.) However, converting to solid forms
might be more cost-effective for larger systems because their fuel cost/
ton will probably be lower.
Reconverting plants previously capable of burning coal back to solid
fuels is a priority Navy program. Compared with boilers already capable
of burning coal, adapting these conversions for use with WDF may present
some added problems, depending on how the boilers and support equipment
were converted from coal burning to oil or gas. As discussed in a NAVFAC
working paper, in some plants much of the support equipment for coal
burning was left in place (in various states of repair); in others, how-
ever, the spur lines, unloading platforms, conveyors, and so on were re-
moved and the areas were used for other purposes. In some cases, the
furnace grates were removed but saved; in others, the furnace bottoms
were bricked up. Detailed studies of these plants are currently under
way. Table 1, page 14, lists plants now planned to be converted to coal.
A study by Hoffman/Munter Associates for NAVFAC Code 102.
43
It is, of course, possible to cofire liquid or gas WDF with coal in
reconverted plants. In general, if coal reconversion is only marginally
cost-effective, cofiring liquid or gaseous WDF might be attractive op-
tions, if it is assumed that Btu costs for WDF fuels are lower and if
cofiring reduces air pollution equipment costs.
Although much attention is being paid to increasing coal burning
capabilities throughout the Navy, most medium-stied plants will burn oil
or gas for many years to come. Converting these boilers to burn WDF
liquids or gases may not be particularly difficult or costly, but the
availability of these forms of WDF in sufficient quantity at competitive
prices is questionable.
The technology assessment in the Gilbert/Commonwealth report ad-
dresses the use of fluff WOF in a modified oil-fired boiler, and identi-
fies the problems that would be encountered, the modifications required,
and the typical capital costs for equipment. Site-related conditions
tending to favor the adoption of this alternative are also outlined.
D. Hybrid Conversions
A number of other combinations of solid-waste-to-fuel-to-ener&v-
conversion systems are possible. For example, a gasifying pyrolysis unit
producing fuel from an activity's waste could be used in a feedwater
preheater (economiser), and a package incinerator generating '"hot smoke"
could be used in the boiler or the superheater. Some of these alterna-
tives might be of interest if more technical and cost information were
available on the pyrolytic and incinerator "full generating" processes.
Appendix A presents information about costs of package incinerators with-
out heat recovery and an overview of the available information on pyrolysis
processes.
The CPU 400 system, a concept under development for solid weste to
electricity in one unified design, is not covered in this study. From
the beginning, technical problems have plagued this method of using the
hot gases from solid-waste-fueled fluidized bed combustion (FIC) to drive
a gas turbine generator. Advanced experiments with FBC are planned by
44
the Navy and DOE at the Great Lakes U.S. Naval Training Station. Further
development may make FBC a practicable alternative for firing solid
fuels, including solid wastes, to release heat or generate steam. When
more data on these systems are available, they should be included in the
data base of this project.
E. Economic Compari.ons
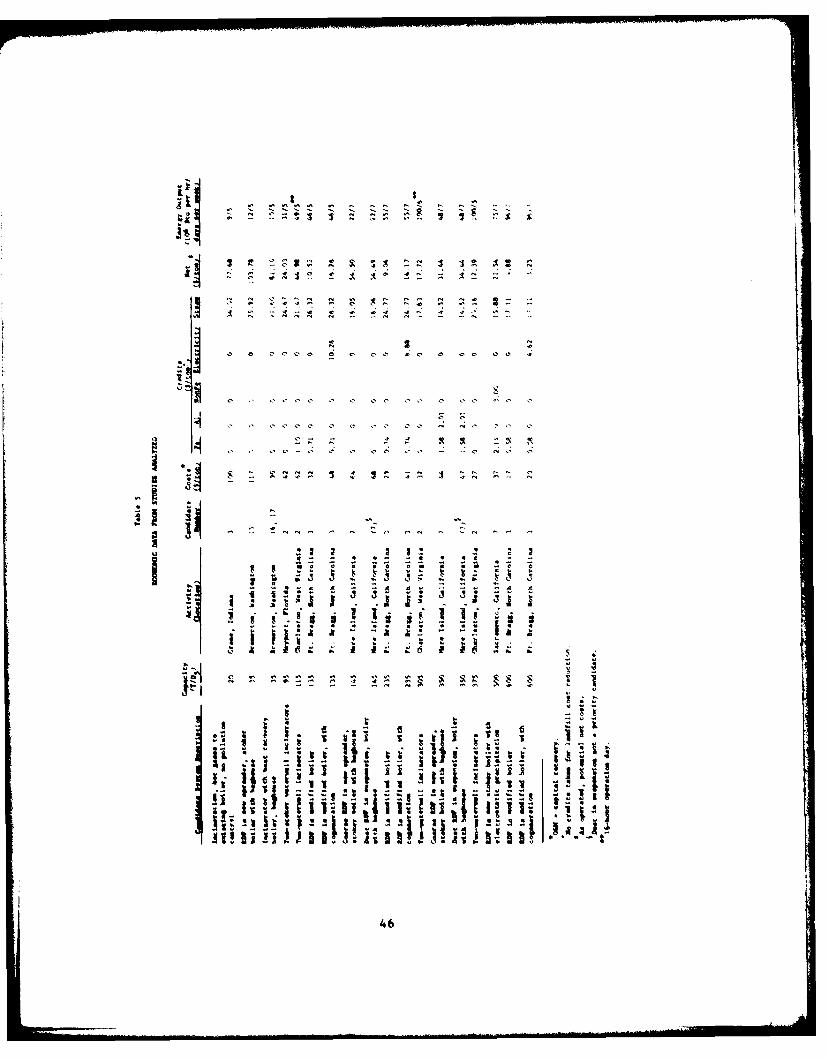
The economic data obtained from the various sources and from the
two special studies are of particular interest. Summary comparisons of
these cost data are provided below. Costs extracted from the literature
survey are given in Table 5.
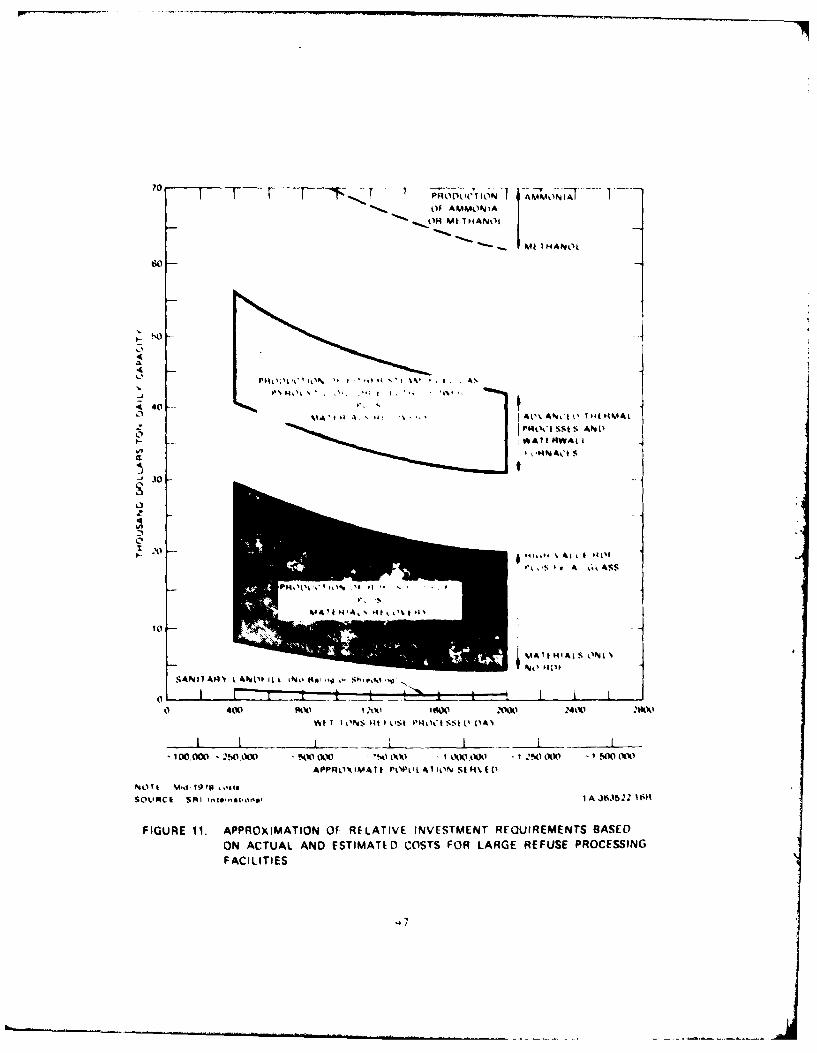
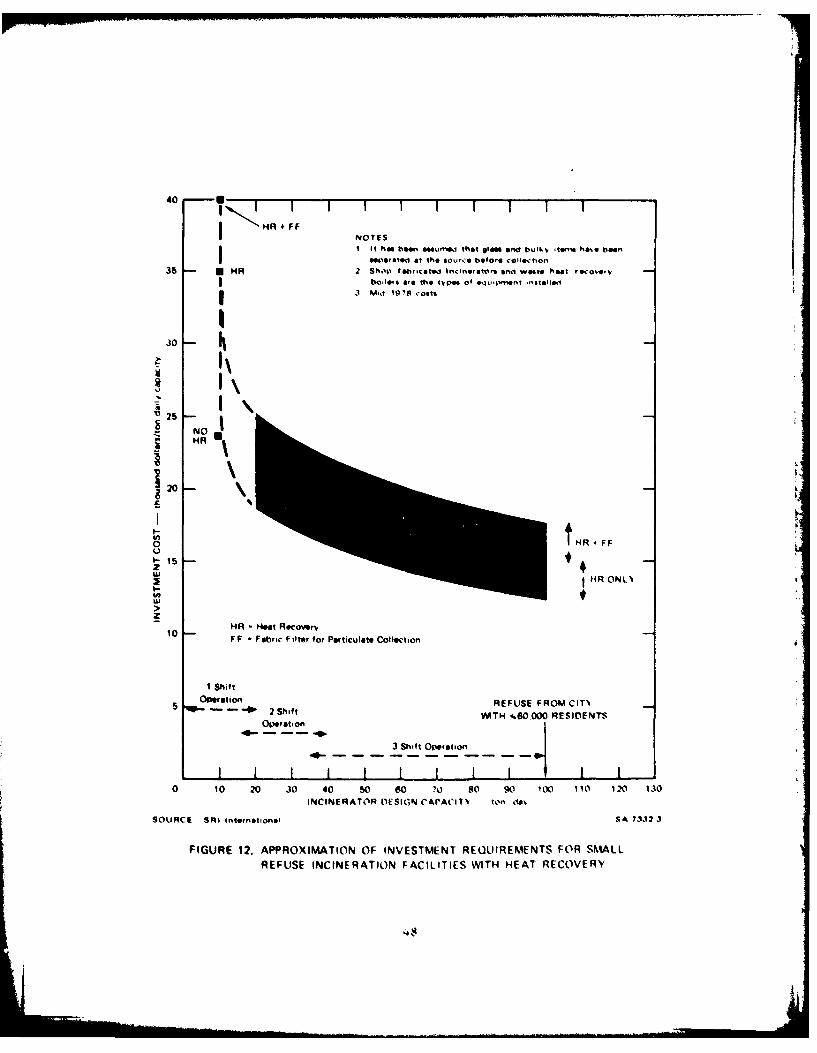
The investment cost per ton day capacity ($/TD 5 ) has frequently been
used to indicate the relative costs and the sensitivity to scale of
various alternatives. Figures 11 and 12 are examples of this indicator.
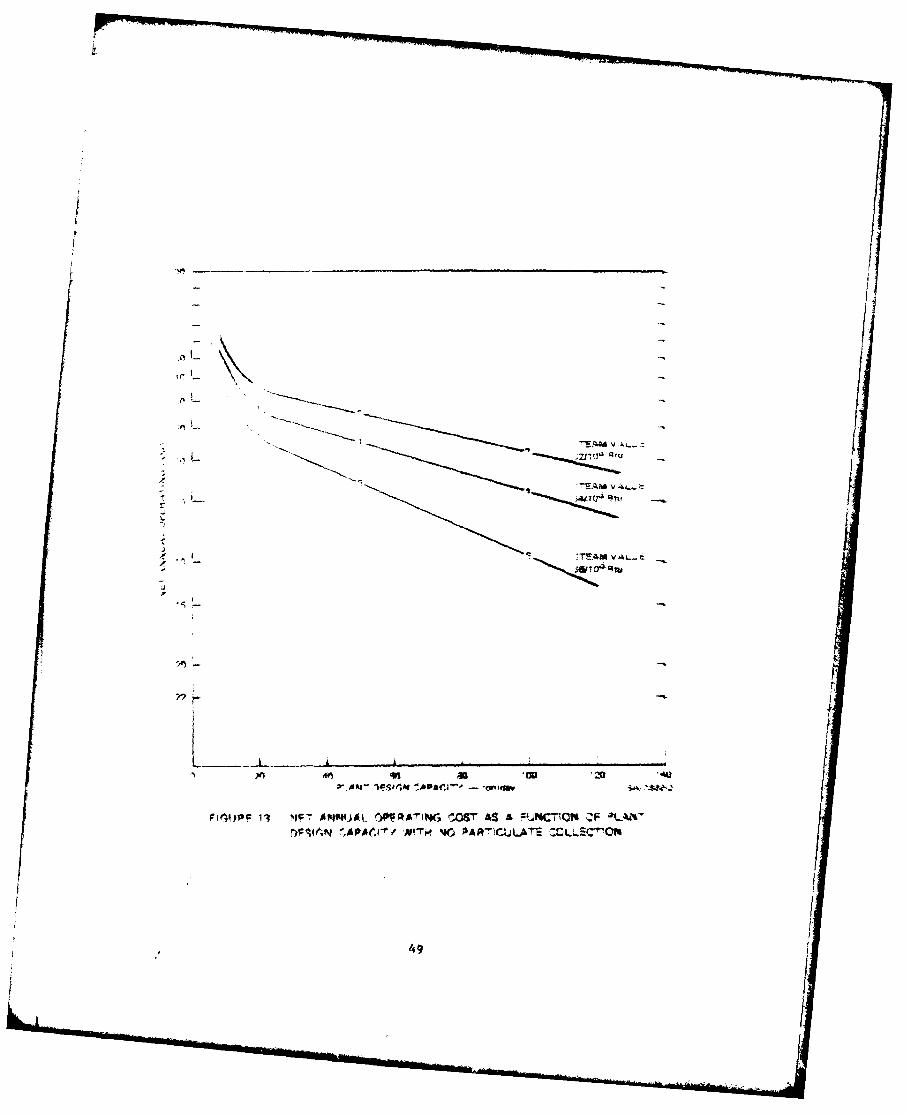
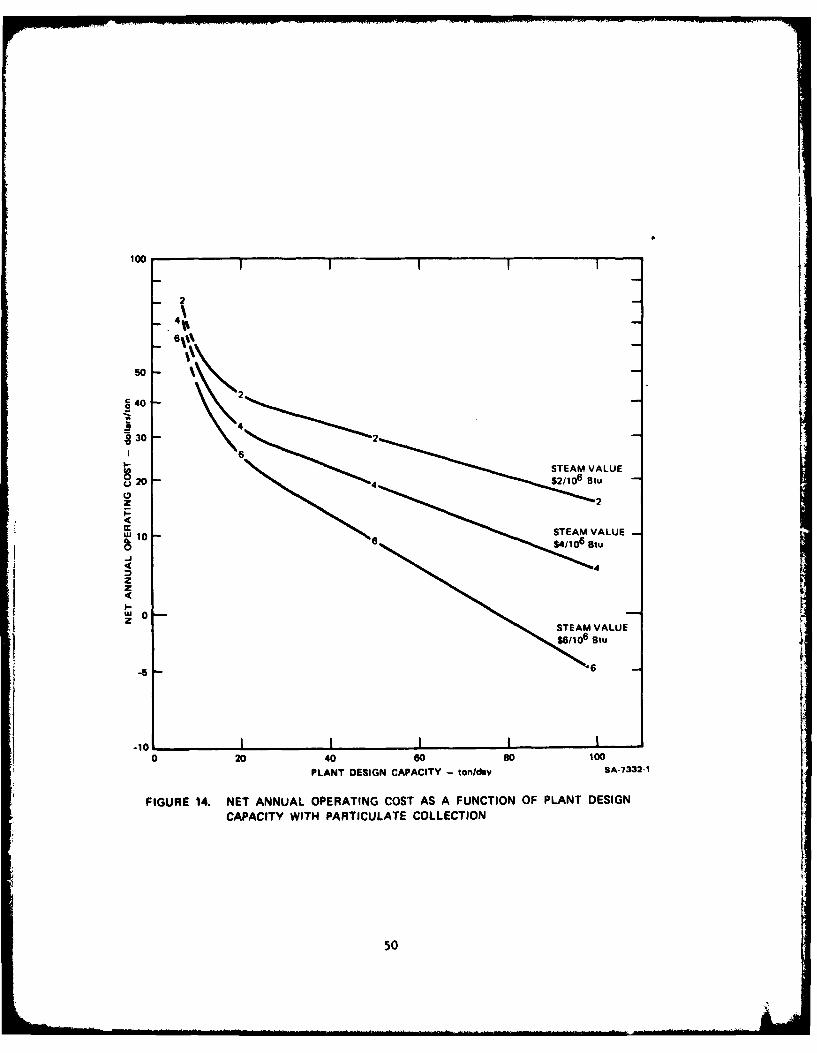
Figures 13 and 14 illustrate the total net annual costs of shop-
fabricated incinerators as a function of size and the cost impact of
particulate control. The costs depicted include capital recovery and
O&M costs. No credits are assumed for landfill cost reduction.
The capital cost data for the Case Study of the Gilbert/Cotmonwealth
report (con.ersion of a typical existing oil/gas plant to cofire fluff
RDF) are summarized in Table 6. These estimates of capital cow's were
prepared by Gilbert/Commonwealth for a plant firing RDF prepared from
approximately 120 tons of waste each day. This would indicate a capital
cost per ton-day capacity of $14,500, a very attractive cost compared
with the costs of other alternatives (see Figures I1 and 12).
On the basis of these capital costs, SRI calculated estimates of
other costs. These estimates are shown in Table 7. The break-eveni
point for this particular conceptual system was then calculated to do-
termine the price that could be paid (or the production costs that could
be incurred) for the RDF. Table 8 indicates this calculation.
See Appendix A for supporting details.
45
s r
I t
I t I
C'0 C ' ' C C46C' .
70 PRO-----v-vIL Iv C'(T I 4 ~OF AMMO NIA
MFt 74AN~1t
- I MHANOI
60
40 ---SA%&L t . . , ,R 0. A t
t 'PHtIS tS AND
I- - tl ?UtWA&L
a ~-HA0~ S
30
z4
% 4AI f 41ALS ONL N
SANITAHA t I ANIOI iiL tN,' hta-"gA. Sh-.d v
0 400 fkxl jk xxt 0000 40t I I ONS lt t St P'HO't SI L A ,
i I L . _
- 100.000 - .2bo'WoO - .Wt00 -'o~~ okI ,A)00 MI .'!,O(10 - tx!, (
APPROk14IMAI I POPLtL Al IN St H%f
FIGURE 11. APPROXIMATION OF RELATIVE INVESTMENT REQUIREMENTS BASEDON ACTUAL AND ESTIMATED COSTS FOR LARGE REFUSE PROCESSINGFACILITIES
-47
40 - 8 I I I
j HR+ FFNOTES
I It hair boon' aesun"W that 91as and b.Ikv *renA ha'.. baa.n11e1PrAated at the Sour'C beore. collection
35 M R 2 Sho'p fabri.cated. Incineow'ris and wate heat reco'..,'Ibode*,, a.e t.e ttpo of eit..p.'wr tale
.1 Mid 1978 coo",
S25
o HR. FF
15
HR ONLN t
z10HR -Heat Rocoverv10FF Fabric Filter for Particulate Collection
I Shiftoperation, REFUSE FROM CITN
5 - 2 Shift MTN %.60.000 RESIDENTSOperation
3 Shift Operation
0 10 20 30 4 oi0 7 o I tii 11i)200SOURCE SRI international SA 7332 3
FIGURE 12. APPROXIMATION OF INVESTMENT REQUIREMENTS FOR SMIALLREFUSE INCINERATION FACILITIES WITH HEAT RECOVERY
494
........ .
100
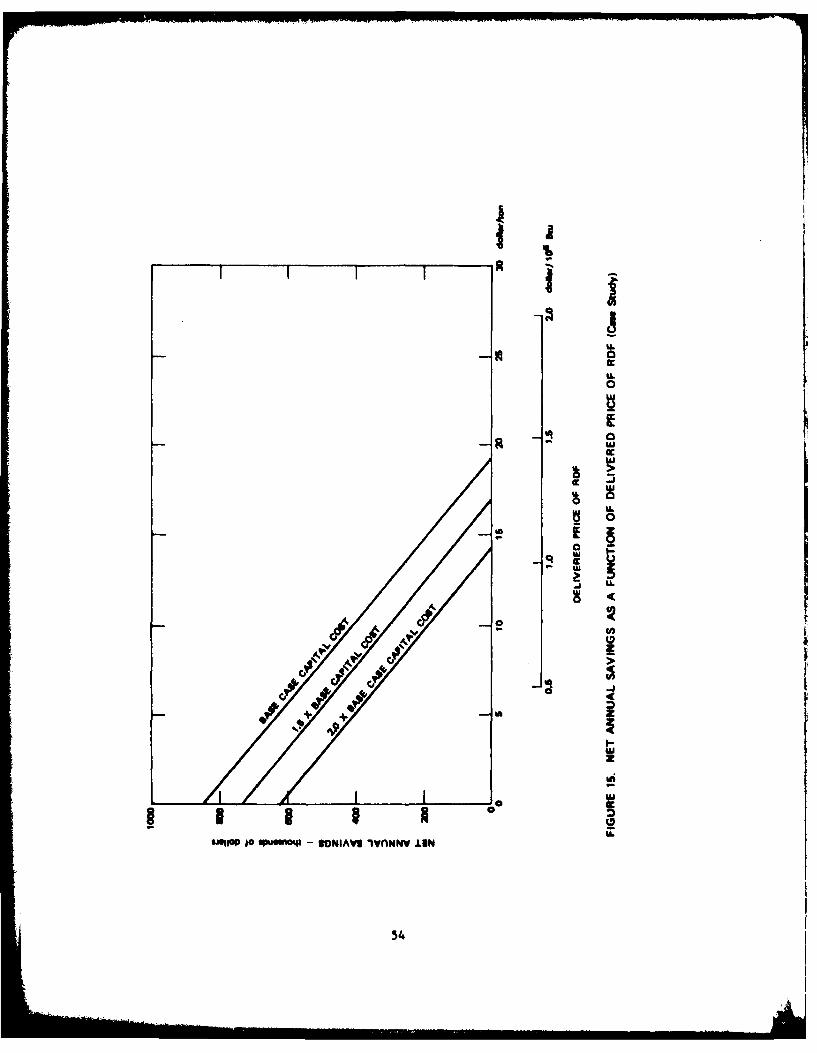
2
4'%
50
2840
* 4~302I 6
STEAM VALUE
z 20
W lo STEAM VALUE
44zzd-
zSTEAM VALUE
-5
-10 I0 2 0 40 60 so 100
PLANT DESIGN CAPACITY -tonldey SA-7332-1
FIGURE 14. NET ANNUAL OPERATING COST AS A FUNCTION OF PLANT DESIGNCAPACITY WITH PARTICULATE COLLECTION
50
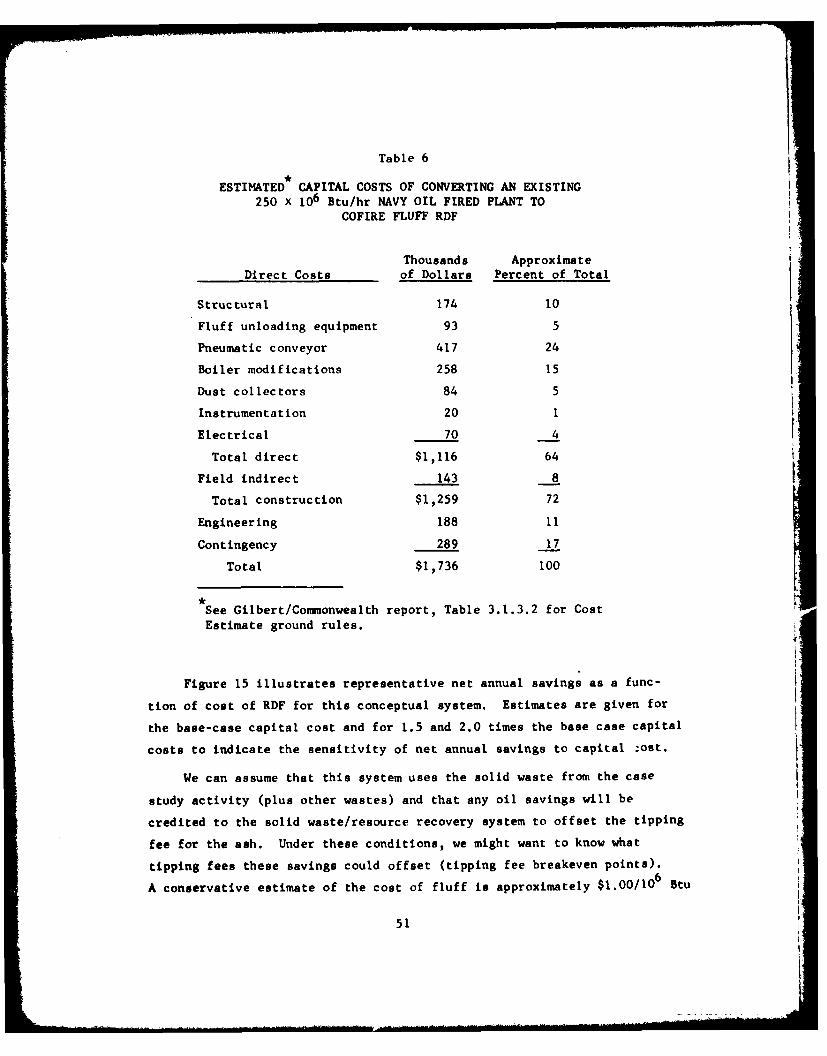
Table 6
ESTIMATED CAPITAL COSTS OF CONVERTING AN EXISTING250 X 106 Btu/hr NAVY OIL FIRED PLANT TO
COFIRE FLUFF RDF
Thousands Approximate
Direct Costs of Dollars Percent of Total
Structural 174 10
Fluff unloading equipment 93 5
Pneumatic conveyor 417 24
Boiler modifications 258 15
Dust collectors 84 5
Instrumentation 20 1
Electrical 70 4
Total direct $1,116 64
Field indirect 143 8
Total construction $1,259 72
Engineering 188 11
Contingency 289 17
Total $1,736 100
See Gilbert/Commonwealth report, Table 3.1.3.2 for CostEstimate ground rules.
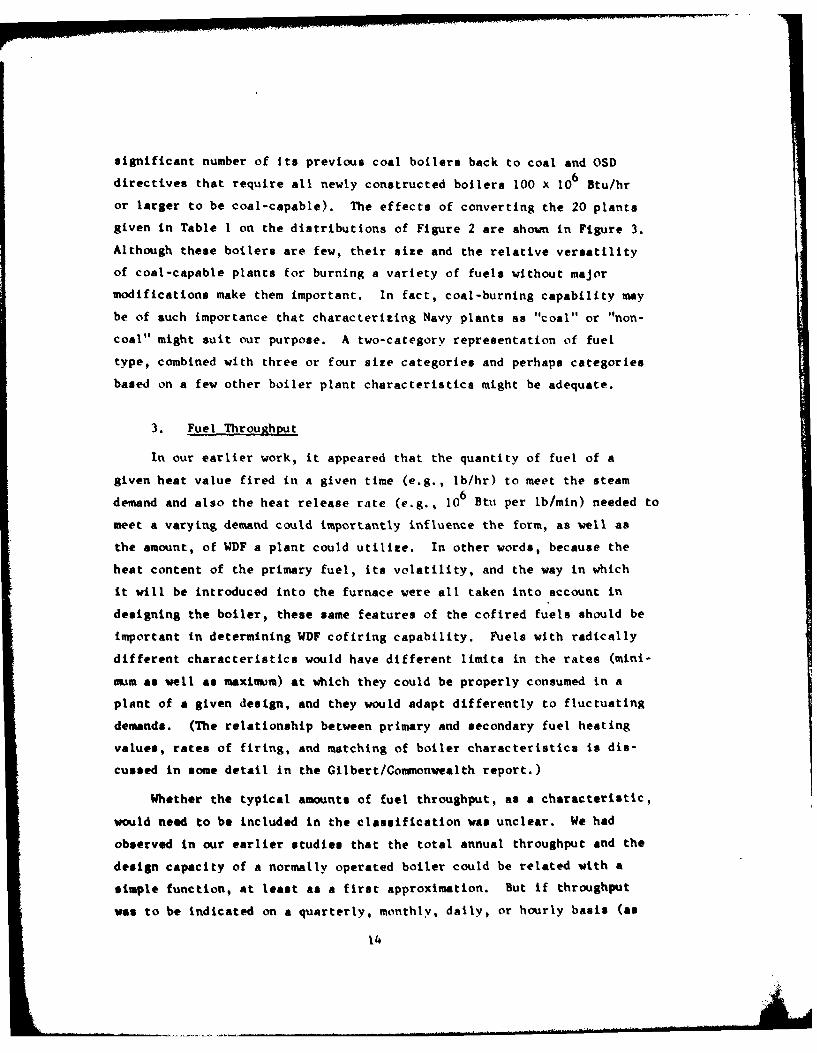
Figure 15 illustrates representative net annual savings as a func-
tion of cost of RDF for this conceptual system. Estimates are given for
the base-case capital cost and for 1.5 and 2.0 times the base case capital
costs to indicate the sensitivity of net annual savings to capital :ost.
We can assume that this system uses the solid waste from the case
study activity (plus other wastes) and that any oil savings will be
credited to the solid waste/resource recovery system to offset the tipping
fee for the ash. Under these conditions, we might want to know what
tipping fees these savings could offset (tipping fee breakeven points).
A conservative estimate of the cost of fluff is approximately $1.00/106 Btu
51
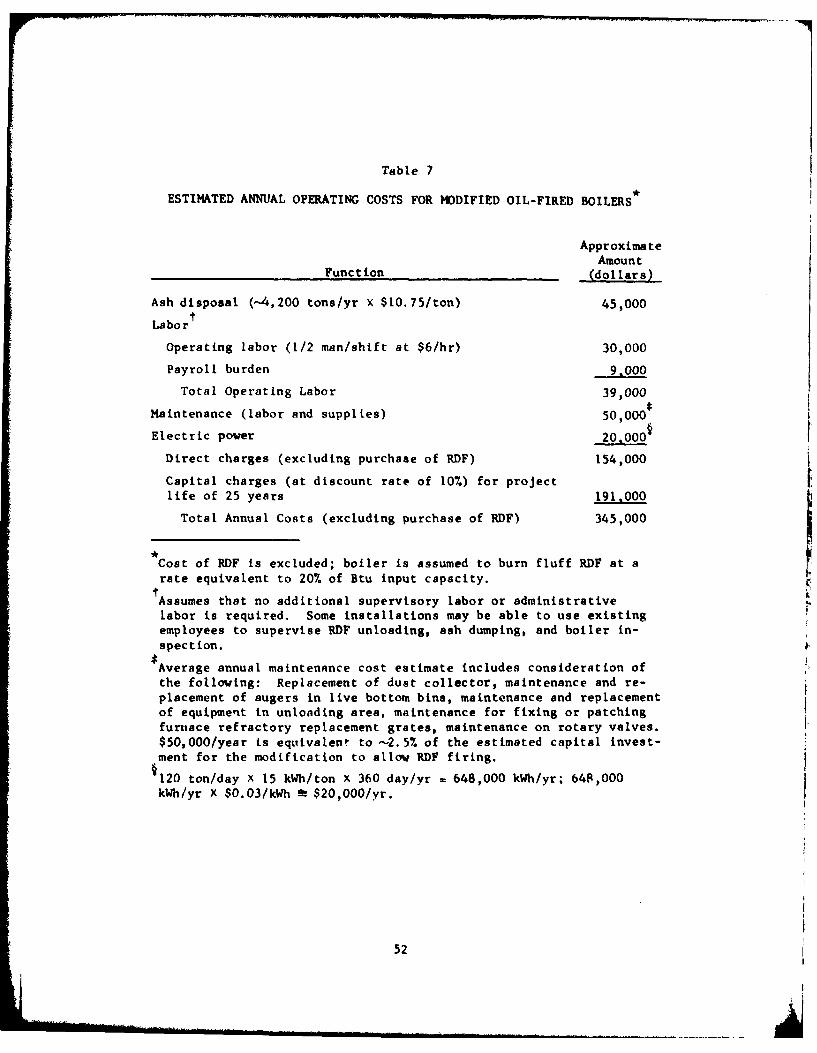
Table 7
ESTIMATED ANNUAL OPERATING COSTS FOR MODIFIED OIL-FIRED BOILERS
Approximate
AmountFunction (dollars)
Ash disposal (-4,200 tons/yr X $10.75/ton) 45,000
Labor
Operating labor (1/2 man/shift at $6/hr) 30,000
Payroll burden 9,000
Total Operating Labor 39,000
Maintenance (labor and supplies) 50,0005
Electric power 2000
Direct charges (excluding purchase of RDF) 154,000
Capital charges (at discount rate of 10%) for projectlife of 25 years 191.000
Total Annual Costs (excluding purchase of RDF) 345,000
Cost of RDF is excluded; boiler is assumed to burn fluff RDF at arate equivalent to 20% of Btu input capacity.
'Assumes that no additional supervisory labor or administrativelabor is required. Some installations may be able to use existingemployees to supervise RDF unloading, ash dumping, and boiler in-spection.Average annual maintenance cost estimate includes consideration of
the following: Replacement of dust collector, maintenance and re-placement of augers in live bottom bins, maintenance and replacementof equipment in unloading area, maintenance for fixing or patchingfuntace refractory replacement grates, maintenance on rotary valves.$50,000/year is eqtivalent to -2.5% of the estimated capital invest-
ment for the modification to allow RDF firing.
1l20 ton/day X 15 kWh/ton x 360 day/yr 2 648,000 kWh/yr; 648,000
kWh/yr X $0.03/kWh a $20,000/yr.
52
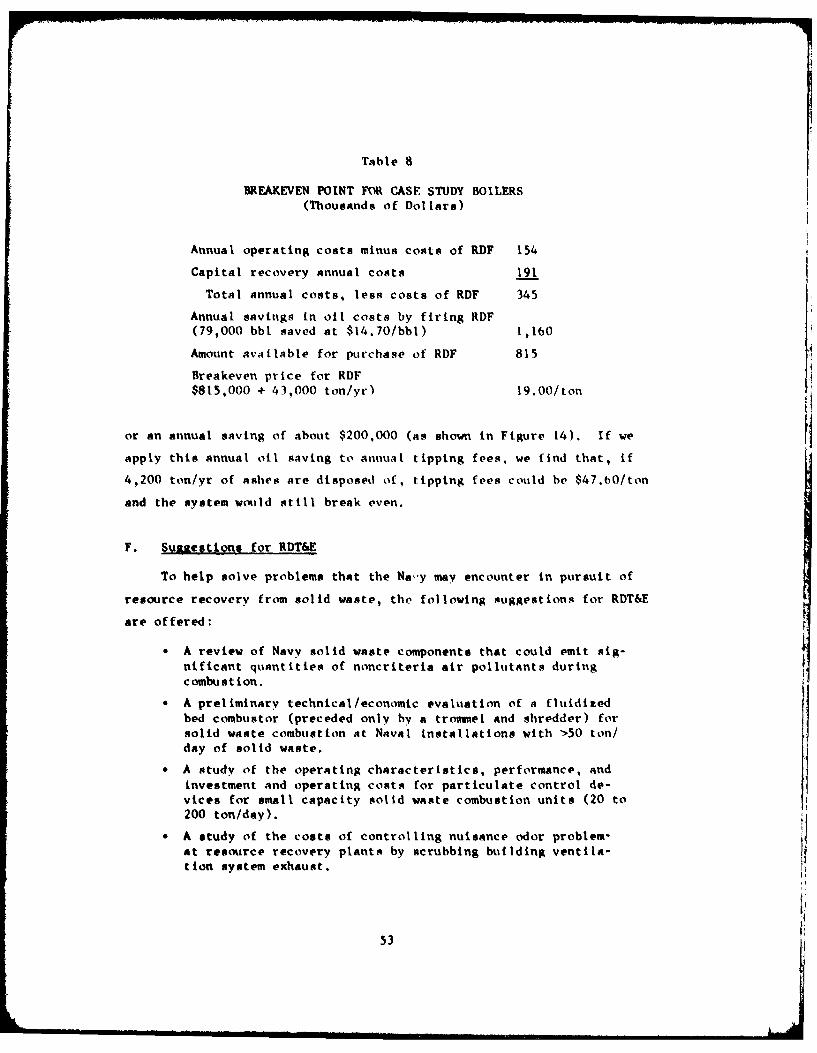
Table 8
BREAKEVEN POINT FOR CASE STUDY BOILERS(Thousands of Dollars)
Annual operating costs minus costs of RDF 154
Capital recovery annual costs 191
Total annual costs, less costs of RDF 345
Annual savings in oil costs by firing RDF(79,000 bbl saved at $14.70/bbl) 1,160
Amount available for purchase of RDF 815
Breakeven price for RDF$815,000 + 43,000 ton/yr) 19.00/ton
or an annual saving of about $200,000 (as shown in Figure 14). If we
apply this annual oil saving to annual tipping fees, we find that, if
4,200 ton/yr of ashes are disposed of, tipping fees could be $47.bO/ton
and the system wotld still break even.
F. Suggestions for RDT&E
To help solve problems that the Nsy may encounter in pursuit of
resource recovery from solid waste, the following suggestions for RDT&E
are offered:
0 A review of Navy solid waste components that could emit sig-nificant quantities of noncriteria air pollutants duringcombustion.
* A preliminary technical/economic evaluation of a fluidizedbed combustor (preceded only by a trommel and shredder) forsolid waste combustion at Naval installations with '>50 ton/day of solid waste.
* A study of the operating characteristics, performance, andinvestment and operating costs for particulate control de-vices for small capacity solid waste combustion units (20 to200 ton/day).
& A study of the costs of controlling nuisance odor problem-at resource recovery plants by scrubbing building ventila-tion system exhaust.
53
'a.0
W"IOP~~~eq w0W~" INAIinm o
54w
JA
" A study of possible design improvements for shop-fabricatedincinerators to achieve more complete combustion of fixedcarbon in ash and to achieve better process control.
• A continuing review and evaluation of developments in small-scale solid waste conversion units, including annual writtenreports on significant design improvement. (Auger bed in-cinerator development is a possible subject to be included,as are updates on gasification and pyrolysis units. Europeanwork on mechanical grate units is another possible topic.)
* A preliminary technical/economic evaluation of the O'Connorrotary combustor, including a site visit to the 50-ton/dayplant reported to be operating in Yokohama, Japan.
" The circumstances encountered in the Case Study can only berepresentative of a "class" of Navy Base facilities. Similarstudies should be conducted for other classes of installationsto provide the Navy with a broader basis for determining theirwaste utilization potential and the corresponding capital and06( requirements to accommodate waste fuel firing.
* A program for developing a special purpose, moderate-size steamgenerating unit designed specifically to accommodate Navy refusein the as-discarded form. This type of unit would have broadapplication, singly or in multiples, at many Navy Base facilities.
55
VII BIBLIOGRAPHY
Engineering Report: Industrial Waste Disposal Facility Puget Sound Naval
Shipyard, Bremerton, Washington. Western Division Naval Facilities Engineer-
ing Command. AkE Contract No. N62474-76-C-7216. The Rust Engineering Company,
Portland, Oregon (April, 1976).
Technical Evaluation Study: Solid Waste As A Fuel At Ft. Bragg, NC. S.A. Hath-
away, J.P. Woodyard. Construction Engineering Research Laboratory, Technical
Report E-95 (December, 1976).
Technical Evaluation Study: Energy-Recovery Solid Waste Use At Mare Island Naval
Shipyard, Vallejo, California. S.A. Hathaway, H.G. Rigo. Construction Engineer-
ing Research Laboratory, Technical Report (April, 1975).
Energy Recovery From Solid Waste In The Charleston, SC, SMSA. A.N. Collishaw,
S.A. Hathaway. Construction Engineering Research Laboratory, Technical Report
E-131. (June, 1978).
Refuse Incinerator Heat Reclamation Boiler Facility. Phase I: Feasibility Study
and Supporting Documentation. Naval Station, Mayport, Florida. Southern Divi-
sion Naval Facilities Engineering Command. A&E Contract No. N62467-73-C-0543,
Amendment No. 1. Greenleaf/Telesca (December, 1975).
Technical Evaluation Study: Energy-Recovery Solid Waste Incineration At Naval
Station Mayport, Florida. S.A. Hathaway, II.G. Rigo. Construction Engincering
Research Laboratory, Technical Report E-51 (March, 1975).
Technical Evaluation Study' Energy RecoverZ Solid Waste Incineration at Naval
Station Mayport, Florida. S.A. Hathaway, J.G. Rigo. Construction Engineering
Research Laboratory, Technical Report (February, 1975).
Technical Evaluation Study: Energy Recovery Incineration At Puget Sound Naval
Shipyard, Bremerton, Washington. S.A. Hathaway, H.G. Itigo. Construction
Engineering Research Laboratory, Technical Report (February 1975).
Technical Evaluation Study: Energy-Recovery Incineration of Solid Waste At
Naval Weapons Support Center, Crane, Indiana. S.A. Hathaway et al. Construction
Engineering Research Laboratory. Technical Report E-97 (December, 1976).
Philadelphia Naval Shipyard Economic Analysis For Refuse Derived Steam. Naval
Facilities Engineering Command-Department of the Navy. Henningson, Durham and
Richardson of Maryland, Inc. (May, 1976).
57
woo*
Technical Evaluation of the Feasibility of Burning Eco-Fuel At PhiladelphiaNaval Shipyard. H.G. Rigo. Construction Engineering Research Laboratory,
Letter Report 9-25 (January, 1974).
Utilization of Refuse Derived Fuel For State Heating and Cooling Plant, Prelimi-nary Cost Study. State of California, The Resources Agency, State Solid Waste
Management Board. Stanton Stockwell/Henuingson, Durham & Richardson (March 1977).
Resource Recovery Implementation Plan, Southeastern Virginia Planning DistrictCommissionHenningson, Durham and Richardson (March 1976).
West Virginia Region II, Boone, Clay, Kanawa, Putnam Counties, Solid WasteManagement Planning Porject, Executive Summary. The Environmental ServicesDepartment, Scientific Development, Bechtel Corporation and Stanford ResearchInstitute (No date).
New Orleans Resource Recovery Facility Implementation Study, Equipment,Economics, Environment, National Center for Resource Recovery, Inc., 1211Connecticut Ave., N. W., Washington, D. C. (September 1977).
Southern California Urban Resource Recovery Project, Volume I, Executive Summary.State of California, The Resources Agency, State Solid Waste Management Board,Stanton, Stockwel],tnningson, Durham and Richardson (February 1976).
Southern California Urban Resource Recovery Project, Phase 1, San Diego Energyand Materials Feasibility Report, Interim Report, State of California. TheResources Agency, State Solid Waste Management Board, Stanton, Stockwell/Henningson, Durham and Richardson (March 1977).
Regional Solid Waste Utilization Feasibility Study, Southeastern VirginiaPlanning District Commission, Henningson, Durham and Richardson, Norfolk,Virginia (No date).
Handbook of Solid Waste Management, D. V. Wilson (ed.) Massachusetts Instituteof Technonlgy (no date).
Engineering Feasibility Study: Materials Recovery System. National Centerfor Resource Recovery, Inc., 1211 Connecticut Ave., N.W., Washington, D.C.20036 (December 1972).
Detailed Discussion of Alternative Projects, Appendix E, State Solid WasteManagement Board, 141b Ninth Street, Room 1335, Sacramento, California 95814
(No date).
Solid Waste Management Planning Project for West Virginia Region III, Boone,Clay, Kanawa, Putnam, Final Report, Regional Intergovernmental Council (1970).
The Treatment of Industrial Wastes, E. B. Besselievre, McGraw-Hill BookCompany (no date).
58
4
Feasibility of Co-Firing Agricultural Residues in a Coal-Fired Electric PowerPlant in the Sacramento Valley, California Energy Resources Conservation andDevelopment Commission, Alternatives Implementation Division, J. A. Alich,K. A. Miller, R. K. Ernest, Stanford Research Institute (September 1977).
Field Evaluation of the Modular Angered-Bed Heat-Recovery Solid Waste Inciner-ator, Technical Report E-128. S. A. Hathaway, J. S. Lin, A. N. Collishaw,Construction Engineering Research Laboratory (May 1978).
Guidance for the Development of State Work Programs for FY-79 Under theResource Conservation and Recovery Act (RCRA), U. S. Environmental Protectiongency, Office of Solid Waste and Regional Office (May 1978).
Research Planning and Analytical Support to te Navy Solid Waste RDT & EProgram for FY 77, Navy Facilities Engineering Command, Department of theNavy, A. G. Capps, H. Duffey-Armstrong, R. E. Freeman, SRI International,333 Ravenswood Ave., Menlo Park, California 94025 (February 1978).
Third Report to Congress: Resource Recovery and Waste Reduction, U. S.Environmental Protection Agency, Office of Solid Waste Management Programs(1975).
Comparative Estimates of Post-Consumer Solid Waste, 11. S. EnvironmentalProtecLion Agency, Office of Solid Waste Management Program (May 1975).
Study of Pre-Processing Equipment for Waste-to-Energy Systems.L~uSmanrMaterial and Research Needs, EPA Workshop, New Orleans, February 8-10, 1977.Midwest Research Institute, Kansas City, Missouri.
Recycling Trends in the United States: A Review, United States Departmentof the Interior, Bureau of Mines (1976).
Fuel and Energy Production by Bioconversion of Waste Materials State-of-the-Art.Municipal Environmental Research Lab., Cincinnati, Ohio, EPON Research System.Silver Springs, Maryland (August 1976).
Fourth Report to Congress: Resource Recovery and Waste/Reduction, 1. S.Environmental Protection Agency, Office of Solid Waste Management Program.(1977).
Systems Analysis of Regional Solid Waste Handling, Bureau of Solid WasteManagement, U. S. Department of Health, Education, and Welfare.. N. Morseand E. W. Roth, Cornell Aeronautical Laboratory, Inc. (1970).
Decision Makers Guide in Solid Waste Management, U. S. Environmental Protec-tion Agency, Office of Solid Waste Management Programs (1976).
Preliminary San Deigo Regional Solid Waste Management Plan,l9 76-2000, Countvof San Diego, California (no date).
Human Factors Related to Source Segregation of Solid Waste, Civil EngineeringLaboratory, United States Naval Construction Battalion Center, Port Hueneme,California 93043, R. E. Weinstein, Community Relations Service, 1933 N.Glenbrook Ave., Camarillo, California 93010 (May 2S, 1976).
Energy from Refuse, Electric Power Research Journal, No. 9 (November 1977).
SQ
Use of Solid Waste as a Fuel by Investor-Owned Electric Utility Companies,Proceedings EPA/EDison Electric Institute Meeting, R. A. Lowe, Prepared from
minutes of the meeting held March 5-6 1975, Environmental Protection Agency(1975).
Recommended Standards for Sanitary Landfill Design, Construction, andEvaluation and Model Sanitary Landfill Operation Agreement, The NationalSolid Waste Management Association and the Federal Solid Waste ManagementProgram, U. S. Environmental Protection Agency (1971).
Developing a State Solid Waste Management Plan, R. 0. Toftner, U. S. Department
of Health, Education, and Welfare, Public Health Service, Environmental HealthService, Bureau of Solid Waste Management (1970).
Resource Recovery Program, Volume I, Summary, State of California Solid Waste
Management Board (June 1976).
Solid Waste Management Available Information Materials, Bibliography listing
all reports published by the Office of Solid Waste Management Programs from
January 1966 through June 1976. Compiled and Indexed by J. L. Larsen, U. S.
Environmental Protection Agency (September 1976).
Successful Sanitary Landfill Siting: County of San Fernardino, California.
N. G. Dunne. U. S. Environmental Protection Agency (1977).
Sanitary Landfill Design, Construction, and Evaluation, compiled by M. M. Wilcomb,and H. L. Hickman, Jr., U. S. Environmental Protection Agency (1971).
Sanitary Landfill Design and Operation, D. R. Brunner and D. J. Keller,U. S. Environmental Protection Agency (1972).
The Physician's Guide to Solid Waste, American Medical Association, 635 N.
Dearborn Street, Chicago, Illinois 60610 (no date).
mndbook of Air Pollution: Training Program, J. P. Sheehy, W. C. Achinger,
and R. A. Simon, U. S. Department of Health, Education, and Welfare, PublicWealth Service, Bureau of Disease Prevention and Environmental Control,National Center for Air Pollution Control, Durham, North Carolina 27701 (no date).
Residual Waste Best Management Practices: A Water Planner's Guide to LandDi poal, Dr. M. D. Neptune (Project Officer), U. S. Environmental Protection
Alency, Water Planning Division, Planning Assistance and Policy Branch,Washington, D. C. 20460 (June 1976).
ftykets and Technolosy for Recovering Energy from Solid Waste, Federal SolidVast* Management Program, S. L. Levy,, U. S. Environmental Protection Agency
(L974).
Hasuring External Effects of Solid Waste Management, Office of Research andDwmlopment, U. S. Environmental Protection Agen Dr. Richard Schmalensee,
at &I, Washington Environmental Research Center, 19 S. EnvironmentalProtection Agency, Washington, D. C. 20460 (March 1975).
A_ Intearsted Plan for the Conversion of Solid Waste to Energy in Santa ClaraCounty, Glenn Kramon and Hatt Sanders III, (Eds.) Prepared by Engineering 235
for the Institute for Energy Studies, Stanford University (November 1975).
60
Resource Recovery: Experimental Plant for Resource Recovery, Ministry ofthe Environment, Ontariro (no date).
A Model for Regional Solid Waste Measurement Planning: User's Guide, Officeof Solid Waste, E. B. Berman, et al., U.Ss. Environmental Protection Agency(1977).
Equipment Test and Evaluation Facility, A resource recovery pilot plant ofthe National Center for Resource Recovery, Inc. (no date).
Mineral Recovery from the Noncombustible Fraction of Municipal Solid Waste:A proposed project to demonstrate incinerator residue recovery, D. G. Arellaand Y. N. Garbe, U. S. Environmental Protection Agency (1975).
A New Look at Recycling, A report on a conference, May 11, 1976, sponsoredby the Citizens' Advisory Committee for Environmental Quality.
Comparative Estimates of Post-Consumer Solid Waste, U. S. EnvironmentalProtection Agency, Solid Waste Management (May 1975).
A Solid Waste Estimation Procedure: Hateiial Plows Approach, U. S. Environ-mental Protection Agency, Solid Waste Management (May 1975).
Solid Waste Management Plan for Santa Clara County, Santa Clara County Boardof Supervisors, Metcalf and Eddy Engineers (December 1975).
Environmental Management Plan for San Francisco Bay Region: Draft SolidWaste Management Plan, Association of Bay Area Governments (October 12, 1977).
Solid Waste Management Plan for Alameda County
Resource Recovery Program, Volume II, Unabridged report. State of CaliforniaSolid Waste Management Board (June 1976).
Environmental Assessment of Subsurface Disposal of Municipal Waste WaterTreatment Sludge, Interim Report, Dr. Ronald Lofy, et al., U. S. EnvironmentalProtection Agency, Office of Solid Waste (1977).
The Aluminum Magnet
Public Law 94-580-Oct. 21, 94-580 STAT. 2795. Title II - Solid Waste DisposalAct. 94th Congress.
Cost Estimating Handbook for Transfer Shredding and Sanitary Landfillina ofSolid Waste, U. S. Environmental Protection Agency. Booz-Allen & Hamilton,Inc. #August 1976).
Proceedings of the Fourth National Congress Waste Management Technology andResource and Energy Recovery, Cosponsored by the National Solid WastesManagement Association and the V. S. Environmental Protection Agency, Atlanta,November 12-14, 1975 (1976).
An Economic Evaluation of a Process to Separate Raw Urban Refuse into its Metal,Mineral, and Energy Components, T. A. Phillips, United States Department ofthe Interior, Bureau of Mines Information Circular 7832 (no date).
61
Solid Waste Laws in the U.S. Territories and States, U.S. EnvironmentalProtection Agency, Federal Solid Waste Management Program, Autocomp Inc.,Washington, D.C. (1972).
Refuse Collection Practice, Third Edition, Committee on Solid Wastes,American Public Works Association, Public Administration Service, 1313 E.Sixtieth Street, Chicago, Illinois 60637 (no date).
First Report to Congress: Resource Recovery and Source Reduction, ThirdEdition of the report (SW-118) U.S. Environmental Protection Agency, Officeof Solid Waste Management Programs (1974).
Recovery and Utilization of Municipal Solid Waste: A Summary of AvailableCost and Performance Characteristics of Unit Processes and Systems, U. S.Environinental Protection Agency, Solid Waste Management Office, N. L. Dropny,H. E. Hull, and R. F. Testin, Battelle Memorial Institute, Columbus Labor-atories (1971).
Solid Waste Collection Systems: Comparing One-Man with Multi-man Crews.A condensation, U. S. Environmental Protection Agency, Solid Waste Management(no date).
Energy Recovery from Solid Waste, Volume 2, Technical Report, Lyndon B. JohnsonSpace Center, C. J. Huang and Charles Dalton, University of Houston, Houston,Texas 77004 (April 1975).
Resource and Environmental Profile Analysis of Nine Beverage ContainerAlternatives, Final Report, U. S. Environmental Protection Agency (1974).
Characterizing Combustible Portions of Urban Refuse for Potential Use as Fuel,U. S. Department of Interior, Bureau of Mines, H. Schultz, P. M. Sullivan,and F. E. Walker (no date).
The Flash Pyrolysis of Solid Wastes, C. S. Finney and D. E. Garrett, GarrettResearch and Development Company, Inc., 1855 Carrion Road, LaVerne, Calfornia,91750 (November 11, 1973).
The State of Technology, Council of Environmental Quality, Midwest ResearchInstitute (February 1973).
Solid Waste Processing: A State-of-the-Art Report on Unit Operations andProcesses. U. S. Department of Health, Education, and Welfare, Bureau ofSolid Waste Management, R. B. Engdahl. et al., Battelle Memorial Institute,Columbus Laboratories (1969).
Heavy Media Separation of Alu, inum From Municipal Solid Waste, E. L. Nichels,et al, Transaction, Vol. 25& (March 1975).
Feasibility of a Total Energy System at Stanford University, D. M. Elovitz,26 Robinhood Road, Natick, Mass. 01760. (September 1975).
Metals in the Combustible Fraction of Municipal Solid Waste, B. W. Haynes,S. L. Law, and W. J. Campbell, 11. S. Department of the Interior, Bureau ofMines (no date).
62
Prospectus of Professional Qualifications, Technical Report, Resource
Technology Corporation (November 1976).
Composting Sewage Sludge by High-Rate Section Aeration Techniques: TheProcess as Conducted at Bandor, Maine, and Some Guides of General
Applicability, Interim Report (SW-614d), Dale Mosher and R. Kent Anderson,U. S. Environmental Protection Agency (1977).
Improving Productivity in Solid Waste Collection: A Brief for ElectedOfficials, The National Committee on Productivity (no date).
Demonstrating Multimaterial Source Separation in Somerville and Marblehead,Mass. Penelope Hansen and James Ramsey, Reprinted from Waste Age (Feb. 1976).
Senate Bill 1395, Chapter 1296, Synthetic Fuels: Solid Waste Conversion,Calfiornia Legislature (September 22, 1976).
Solid Waste Management: Available Information Materials, Catalogue SW-58.25,U. S. Environmental Protection Agency, Technical Information Staff, Officeof Solid Waste Management Programs (November 1975).
Solid Waste Management Today: Bringing About Municipal Changes, Diana Wahland R. L. Bancroft, Reprinted from Nation's Cities, 1620 Eye St., N. W.Washington, D. C. 20006 (no date).
Anaerobic Digestion of Solid Waste and Sewage Sludge to Methane., U. S.Environmental Protection Agency, SW-159 (July 1975).
Refuse as a Supplementary Fuel for Power Plants, November 1973 through March1974, Interim Progress Report, G. W. Sommerfield, U. S. EnvironmentalProtection Agency (July 1974).
Use of Solid Waste as a Fuel by Investor-Owned Electric Utility Companies-Proceedings: EPA/Edison Electric Institute Meeting, March5-6, 1975,Robert A. Lowe, U. S. Environmental Protection Agency, Washington, DC (1975).
Markets and Technology for Recovering Energy from Solid Waste, U. S.Environmental Agency, Federal Solid Waste Management Programs, Steven J. Levy(1974).
Fuel Conservation in Solid Waste Management, Kenneth A. Shuster, U. S.Environmental Protection Agency, Office of Solid Waste Management Programs(no date).
Recovering Resources from Solid Waste Using Wet-Processing, David B. Arella,U. S. Environmental Protection Agency, Federal Solid Waste ManagementPrograms (1974).
Solid Wastes Demonstration Projects, Proceedings of a Symposium, Cincinnati,May 4-6, 1971. Patrick L. Stump, U. S. Environmental Protection Agency (1972).
A Study of Solid Waste Collection Systems Comparing One-Man with Multi-ManCrews, Final Report, U. S. Department of Health, Education, and Welfare,Public Health Service, Bureau of Solid Waste Management, Ralph Stone andCompany. Inc., Engineers, Los Angeles, California (1969).
63
Solid Waste Management Available Information Materials, (SW-58.25) U. S.Environmental Protection Agency, Technical Information Staff, Office ofSolid Waste Management Program.
Economics of Recycling Metals and Minerals from Urban Refuse, P. N. Sullivanand M. H. Stanczyk, U. S. Department of Interior, Bureau of Mines SolidWaste Research Program, Technical Progress Report 33 (April 1971).
Baltimore Demonstrates Gas Pyrolysis: Resource Recovery from Solid Waste,
David D. Suasman, U. S. Environmental Protection Agency, Federal SolidWaste Management Program (1975).
An Accounting System for Solid Waste Collection, Eric Zausner, U. S.Department of Health, Education, and Welfare, Public Health Service (1970).
Logistic and Economic Factors Affecting the Reclamation and Recycling ofWaste Material and by-Products, Task 74-12, Project 3: Assignment ofResponsibilities in DoD Organizations. Frank N. Reynolds, Joseph R. Wilk,Robert D. Kaiser, Logistics Management instituite, 4701 Sangamore Road,Washington, D. C. 20016 (April 1975).
Recycled Materials Markets: February 1975, U. S. Environmental ProtectionAgency, Solid Waste Management Series (April 1975).
Residential Paper Recovery: A Municipal Implementation Guide, Penelope Hansen, L
U. S. Environmental Protection Agency (1975).
Analysis of Source Separate Collection of Recyclable Solid Waste-SeparateCollection Studies, 1U. S. Environmental Protection Agency, SCS Engineers,Incorporated (1974).
Solid Waste Planning and Disposal: Advance Notice of Proposed Rulemaking,Part IV, U. S. Environmental Protection Agency, 'ederal Register (Tuesday, &
July 5, 1977).
Environmental Research Outlook, FY 77 Through FY 1981: Report to Congress,U. S. Environmental Protection Agency, Office of Research and Development,Washington, D. C. 20460 (February 1977).
Resource Recovery from Municipal Solid Waste: A State-of-The-Art Study,National Center for Resource Recovery, Lexington Books, D. C. Heath andCompany, Lexington, Mass. (no date).
Energy from Solid Waste, Frederick R. Jackson, Noyes Data Corporation,Park Ridge, New Jersey (1974).
Developing a Local & Regional Solid Waste Management Plan, Richard 0. Toftner,U. S. Environmental Protection Agency (1973).
Hazardous Waste Guidelines and Regulations: Advanced Notice of ProposedRulemaking, Part V, U. S. Environmental Protection Agency, Office of SolidWaste, Federal Register (Monday, May 2,1977).
Implementation Plan for the Resource Conservation Committee, ResourceConservation Committee (Apri 1977).
Recovery of Resources From Waste: Volume XVII, No. 4, R. L. Schroeder,Raytheon Service Co. (Winter 1975).
64
Solid Waste Management Available Information Materials, Interim Catalogue,Bibliography (SW 58.27), Report listing from January 1966 through October1977, compiled, edited and indexed by Frances P. Lederer, U.S. Environmental
Protection Agency (December 1977).
Program Definition for Fuels from Biomass, J. A. Alich, Jr. et al.,
Stanford Research Institute, Menlo Park, California 94025 (October 1976).
Resource Recovery and Flash Pyrolysis of Municipal Refuse, G. T. Preston,
Occidental Research Corporation, 1855 Carron Road, La Verne, California91750 (December 24, 1975).
Energy Recovery from Municipal Solid Waste and Method of ComparingRefuse-Derived Fuels, Henry P. Sheng and Harvey Alter, Resource Recovery
and Conservation, El Sevier Scientific Publishing Company, Amsterdam,
Printed in The Netherlands (1(1975)).
Annual Report, 1977, National Center for Resource Recovery.
Summary of Presentation to State Solid Waste Management Board, Los Angeles,California, Stanton, Stockwell/Henninison, Durham & Richardson, Resource
Technology Corporation, Koebig, Inc. (March 11, 1976).
Materials Relating to the Resource Conservation and Recovery Act of 1976,
U.S. House of Representatives, Committee on Inter State and Foreign
Commerce, Subcommittee on Transportation and Commerce, 94th Congress, 2nd
Session, U.S. Government Printing Office, Print No. 20 (April 1976).
Second Report to Congress: Resource Recovery and Source Reduction, U.S.
Environmental Protection Agency, Office of Solid Waste Management Programs
(1974).
Refuse as a Resource, Business Intelligence Program Datalog File (#76-105),
SRI International, Menlo Park, California 94025.
Solid Waste Management Available Information Materials, Bibliography(SW-58.26), Reports listed from January 1966 through June 1976, compiledand indexed by Julie L. Larsen, U.S. Environmental Protection Agency
(September 1976).
Status of Solid Waste Management in the United States, Address (SW-526)by Sheldon Meyers, Deputy Assistant Administrator for Solid Waste Manage-
ment Programs, U.S. Environmental Protection Agency (1976).
Solid Waste Management ... Horizons Unlimited, U.S. Environmental Pro-tection Ageacy, Washington, D.C. 20460 (June 1976).
Assessment of the Capability of Firing Clean Low Btu Gases in ExistingCoal, Oil, and Gas-Fired Steam Generators, Final Report, Electric Power
Research Institute, Palo Alto, California 94304, Combustion Engineering,
Inc., 1000 Prospect Hill Road, Windsor, Connecticut 06015 (December 1975).
65
Technology Review, ated tit tilt Iss husetts nstitute of Technology,Volume 79, No. 4 (February 1977).
Conyposting of Municipal Solid Wastes in tile United States, Andrew W.Preidenbach et at., U.S. Environment l Protect ion Agency (1971).
Preliminary Environmental Assessment of Energy Conversion Processes forAgricultural and Forest Product Residues, Volume 1, Benjamin J. Gikiset al ., Stanford Research Institute, Menlo Park, Californi a 94025 (nodate).
Pyrolysis of Municipal and Tndustrial Refuse in a Pyrolenergy System,Interim Report No. IR, F. Michael Lewis, Stanford Research Institute,Menlo Park, California W4025 (october 28, 1975). VFundamentals for Conve rsion oi Solid Wastes to Fuels, Jerry L. Jones,SRI Internation,il, Mento lPlrk, (allfornla 94029 (Junet 1977).
Elergy Cotisewrvat ton Through A luntantm Recovery, AL Mag Systems, Combustion
Power Co., Inc., Menlo Park, Callifornia 4025 (no dmte).
Sol Ld Waste Management Study Cor Cochran County, 'rexas, R. it. Ramsey andL. V. Urban, South Plliins Assoc iat Ion of Governments, Lubbock, Texas79401 (1976).
Transcript: Regional Public Meetings on tle Resource Conservation andRecovery Act of 197b, March 10-1l, 1977, San Francisco, Callfornia, U.S.Env Irounment.al Prote ct ion Agency, Off'ice of Solid Wa st v (1977).
Guidelines for Local Government s on Solid Waste Management, U.S. Environ-
mental Prot ect Ion Agencv, Federal Sol id Waste Management Program, Nat ionalAssochation of Count ites Research Foundat ion (1971).
The Resource Conservat ion & Recovery Act of 1976 (Public Law 94-580), U.S.Environmental Protect Ion Agencv (Febrtary 1977).'
Municipal Refuse Disposal, U.S. Department of Henlth, Education andWelfare, Bureau of Solid Waste Managenient, Institute for Solid Wastesof Amer ican Public Works Assocl at Ion (no date).
Defense Energy Informition System: A Preliminary Analysis. Volume I--Conceptual Design, Compiled by Richard A. Schmidt and Arlie G. CappS,Stanford Research lustItute, Menlo Park, Call fornla 9402S (January 1974).
Defense Energy Inftor-matton Sy-stem--A Preliminary Ana lysis. Volume ii--Special Report for the Defense Energy Task Group, Richard A. Schmidt,Arlie G. Capps, David N. Berg, Stanford Research Inst itute, Menlo Park,CallLfornla 94025 (January 1074).
Logistic and Economic Factors Affect ing the Reclamation anti Recyclingof Waste Material and By-Products, Task 74-12, Project 8: Measurementand Descript ion of the DOI) Sol id Waste Program, Interim Report, 11. .1.Boisseau, Jr., Logist ics Management Inst ituite, 4701 SangAmore Road,Washington, D.C. 20016 (March 14716).
Resource Recovery; Catalogue of processes, Council tin EnvironmentalQuality, Midwest Research Instittute (February 1971).
Solid Wastes: Engineering Principals and Management Issuies, George' TchoBanioglouis, Hilary Tlsen, and Rol f Fl lassen, Mc~rAw Hill1 Book C'o. (nodlate).
Energy and Resource Recovery from industriAl and Municipal Solid Wastes,G. F. Kroneberger (edt.), Vol. 71, No. l16, American Ins;ftitt of ChemicallEngineers, 345) East 47 Street, Now York, New York 10017 (1977).
Solid Waste Management and Resource Recovery, Hearings Before the Subh-committee on Science anti Technology, U.S. Houise of Representatives,Ninety-Fourth Congress, Second Sess ion, April 7, 8, 12, Il, 1976, U. S.Government Printinug office, WashIingtoni, D.C. (1476).
The Resource Recovery Industry-, A Survey of the Industry and Its Capacity,U.S. Environmental Protection Agency, Office of Solid Wasto MainagementPrograms (1476).
Resource Recovery Plant Implementation, Markets, Gu ides for MunicipalOfficials, Compiled by Yvonne M. Carhe and Stephen J1. Levy, 1.S. Env~ron-mental Protection Agency (1976).
Resource Recovery Plant Imp Ienit aIt ion; Procuirement, Gidtes forMunicipal Officials, U.S. FEnvironmental Protectiton Agency (no date).
Resource Recovery Pl ant Imp lement at ion,- Further Assist ance, Gku ies forMunicipal Officials, 1U.S. Environmental Protect ion Agenicy (nio date).
Resource Recovery Plant Implement at ion, T'echno logi es. G utides fol Muk~inc ipa IOfficials, Compiled by Steven J1. Levy and H. Gregor Rigo', U.S. Ftnviron-mental Protection Agency (1976).
Resource Recover'X Plant Implemetitat Iln, Financ ing Gu ides for Muniicipal.Officials, U. S. Environmental Protect ion Agency (not date).
Resoutrce Recvery Pl'ant Implenentation, Ac:ouint Ing Format,, Gutides fox-Municipal Officital s, UI.S. Environmentail Protect ion Agency (no date).
Resource Recovery Plant Impl ement at ion, Planning andl Overvi ew, C"u idesfor Municipal Offic ials, Compiled by Al an Shilepskv andl Rober't A. L1owe,U.S. Environment., Proteoct ion Agenvv~ (1476).
The States' Roles in Solid Waste Management, A Task Force Report, ThomasAnderson, Chairman et al., U.S. Environmental Protection Agency, Officeof Solid Waste Management Programs, The Council of State Governments,Iron Works Pike, Lexington, Kentucky 40505 (no date).
Problem Solving in Solid Waste Management Through Federal-Local Coopera-tion: 8 Case Studies, Compiled by Bruce Weddell and Martha Madison, U.S.Environmental Protection Agency (1974).
Intergovernmental Approaches to Solid Waste Management, Richard 0.Toftner and Robert 14. Clark, U.S. Environmental Protection Agency, SolidWaste Management Office (1971).
Status of Technology in Recovery of Resources from Solid Wastes, John D.Parkhurst, Chief Engineer and General Manager, County Sanitation Dis-tricts of Los Angeles County, California (n,, date).
An Analysis of the Materials and Nat:-- ' Resource Requirements andResiduals Generation of Personal Consumption Expenditure Items, Tayler H.Bingham et al., U.S. Environmental Protection Agency, Office of SolidWaste Management Programs, Resource Recovery Division (February 1976).
Overcoming Institutional Barriers to Solid Waste Utilization as an EnergySource, Executive Summary, U.S. Department of Energy, Division of SyntheticFuels, Washington, D.C. 20461, Gordian Associates, Inc., 711 Third Avenue,New York, New York 10017 (November 1977).
Overcoming Institutional Barriers to Solid Waste Utilization as an EnergySource, Final Report, U.S. Department of Energy, Division of SyntheticFuels, Washington, D.C. 20461, Gordian Associates, Inc., 711 Third Avenue,New York, New York 10017 (November 1977).
The Third Environment, State Solid Waste Management Board (no date).
Evaluation of Small Modular Incinerators in Municipal Plants, Prepublica-tion Issue, U.S. Environmental Protection Agency (August 1976).
Report to the Congress; Using Solid Waste to Conserve Resources and toCreate Energy, The Comptroller General of the United States (February 27,1975).
The Federal Task Force for Hazardous Materials Management, Final Report,Compiled by Charles T. Bourne, Task Force Chairman, Hazardous MaterialsBranch, Air and Hazardous Materials Division, U.S. Environimental Protec-tion Agency, Region IX, 215 Fremont Street, San Francisco, California94105 (March 1, 1978).
Conversion of Cellulosic Wastes to Oil, U.S. Department of the Interior,Bureau of Mines, H. R. Appell et al., Pittsburgh Energy Research Center(no date).
68
.... .... . . .. .
A Preliminary Analysis of Agriculture Residues in Ten California Counties,R. Kent Ernest and Jean S. Smith, Stanford Research Institute, Menlo Pnrk.California 94025 (August 1977).
Resource and Environmental Profile Analysis of Plastics and CompetitiveMaterials, Final Report, The Society of the Plastic Industries, Inc.,
250 Park Avenue, New York, New York 10017, Midwest Research Institute,425 Volker Boulevard, Kansas City, Missouri 64110 (November 1974).
69
Appendix A
MASS BURNING OF REFUSE IN SHOP-FABRICATED INCINERATORS
Prepared by:
Jerry L. JonesDavid C. BombergerSRI International
Prof. A. G. BuekensJ. G. SchoetersDepartment of Chemical EngineeringUniversity of BrusselsBrussels, Belgium
David A. Hoecke, PresidentEnercon Systems, Inc.Cleveland, Ohio
F. Michael Lewis, ConsultantMountain View, California
57
CONTENTS
LIST OF ILLUSTRATIONS ...................... iv
LIST OF TABLES ........................ V
I. INTRODUCTION ........................ A-I
A. Scope of Work ........ ..................... ... A-IB. Background ......... ...................... .A-2
II. SURVEY OF TECHNOLOGY IN UNITED STATESAND WESTERN EUROPE ......... ..................... .. A-5
A. U.S. Technology ........ .................... . A-5B. Other U.S. Technology Identified
But Not Evaluated ........ ................... ..A-10C. Western European Technology ..... .............. ..A-I1
III. TECHNICAL EVALUATION OF OPERATING UNITSIN THE UNITED STATES ......... .................... .A-15
A. Incinerators with Capacities ofMore Than 20 ton/day ......... .................. A-15
B. Small Incinerators (20 ton/day Capacity) .......... .A-20C. Air Pollution Control ....... ................. .A-20
IV. ECONOMIC EVALUATION ......... .................... .A-25
A. Limitations on Use of Output ...... ............. A-25B. Mass and Energy Balances ........ .............. A-25C. Specification of Plant Design Capacity .... ........ A-29D. Economic Bases ........ ..................... A-29E. Investment and Operating Cost Estimates ........... .A-31F. Comparison of Investment and Operating Costs
for Small and Large Facilities ..... ............ ..A-45G. Summary of Findings ......... .................. A-52
V. FUTURE RESEARCH NEEDS ........ ................... .. A-55
tI" A S
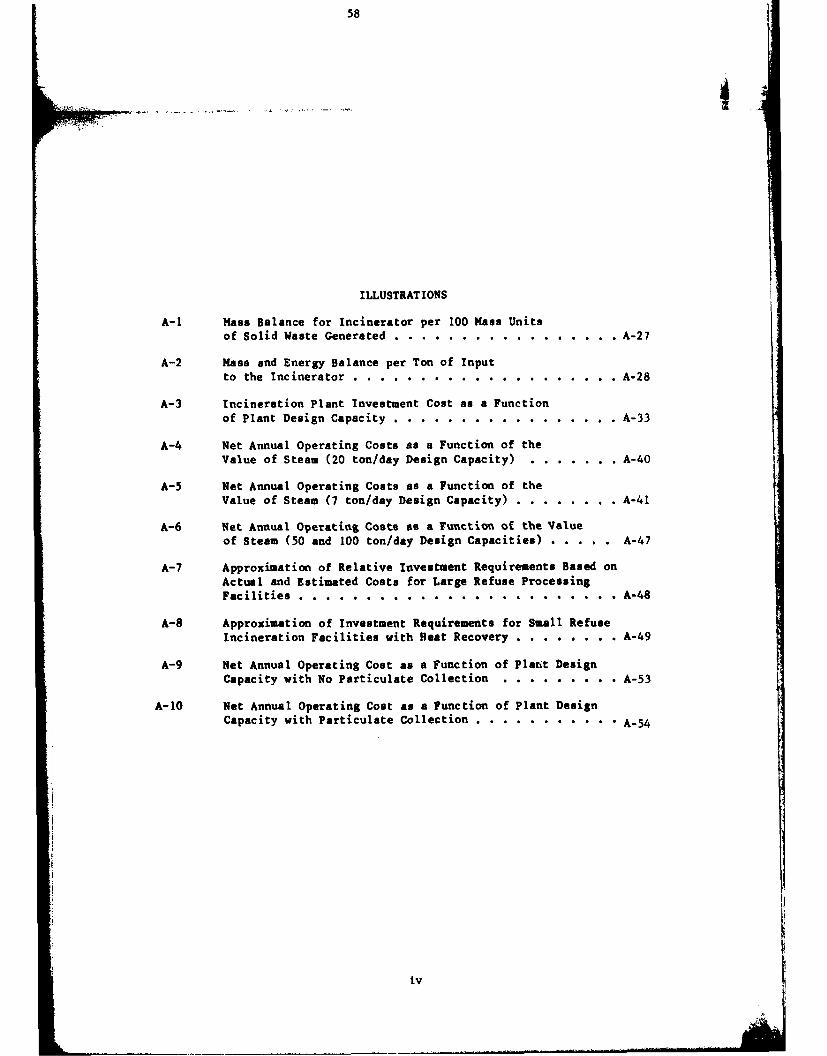
58
ILLUSTRATIONS
A-I Mass Balance for Incinerator per 100 Mass Unitsof Solid Waste Generated ..... ................. .A-27
A-2 Mass and Energy Balance per Ton of Inputto the Incinerator ....... .................... ..A-28
A-3 Incineration Plant Investment Cost as a Functionof Plant Design Capacity ..... ................. .A-33
A-4 Net Annual Operating Costs as a Function of theValue of Steam (20 ton/day Design Capacity) ......... .A-40
A-5 Net Annual Operating Costs as a Function of theValue of Steam (7 ton/day Design Capacity) .......... .A-41
A-6 Net Annual Operating Costs as a Function of the Valueof Steam (50 and 100 ton/day Design Capacities) ....... A-47
A-7 Approximation of Relative Investment Requirements Based onActual and Estimated Costs for Large Refuse ProcessingFacilities ......... ........................ .A-48
A-8 Approximation of Investment Requirements for Small RefuseIncineration Facilities with Beat Recovery ... ........ A-49
A-9 Net Annual Operating Cost as a Function of Plant DesignCapacity with No Particulate Collection .. ......... .. A-53
A-10 Net Annual Operating Cost as a Function of Plant DesignCapacity with Particulate Collection ... ........... .A-54
iv
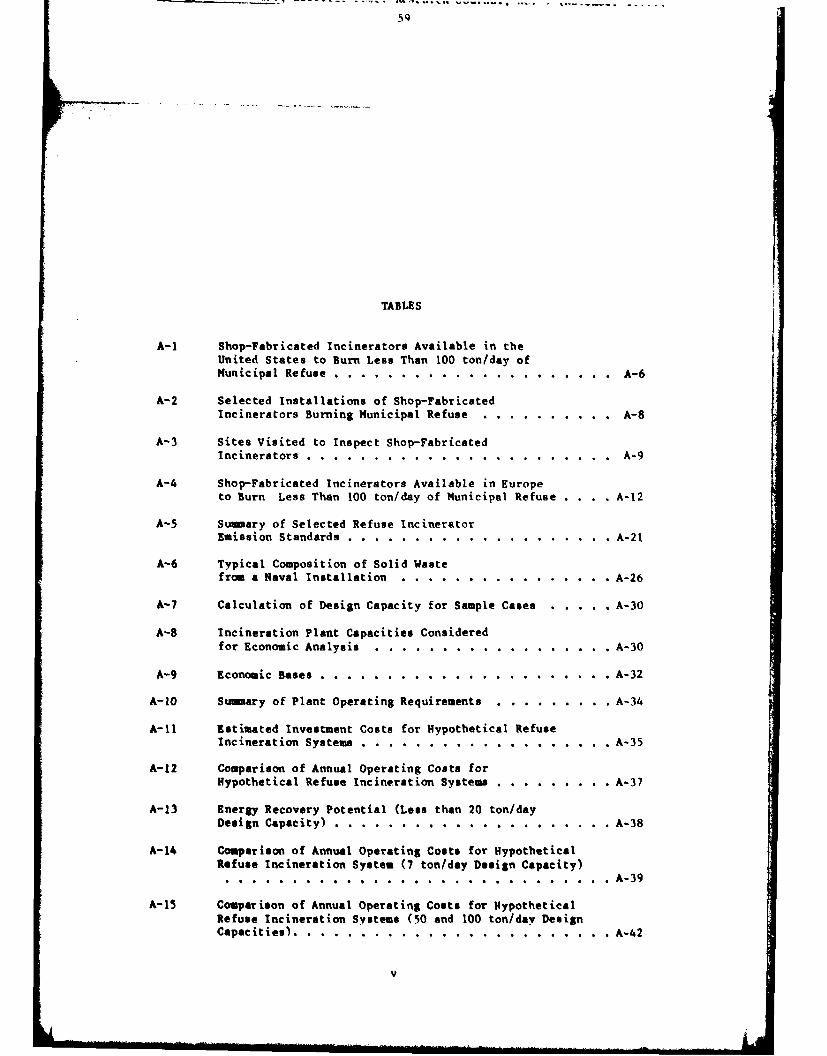
TABLES
A-1 Shop-Fabricated incinerators Available in theUnited States to Burn Less Then 100 ton/day ofMunicipal Refuse .. .................... A-6
A-2 Selected Installations of Shop-FabricatedIncinerators Burning Municipal Refuse. .......... A-8
A-3 Sites Visited to Inspect Shop-FabricatedIncinerators .. ...................... A-9
A-4 Shop-Fabricated Incinerators Available in Europeto Burn Less Than 100 ton/day of Municipal Refuse . . . . A-12
A-5 Summary of Selected Refuse IncineratorEmission Standards. .................... A-21
A-6 Typical Composition of Solid Wastefrom a Naval Installation. ............... A-26
A-7 Calculation of Design Capacity for Sample Cases.......A-30
A-8 Incineration Plant Capacities Considered
for Economic Analysis... ................ A-30
A-9 Economic Bases .. ..... ............... A-32
A-10 Summary of Plant Operating Requirements. ........ A-34
A-11 Estimated Investment Costs for Hypothetical RefuseIncineration Systems .. ................. A-35
A-12 Comparison of Annual Operating Cosa forHypothetical Refuse Incineration System. ......... A-37
A-13 Energy Recovery Potential (Less than 20 ton/dayDesign Capacity) .. ................... A-38
A-l14 Comparison of Annual Operating Costs for HypotheticalRefuse Incineration System (7 ton/day Design Capacity).... . .. .. .. ..... ......... ..... A-39
A-15 Comparison of Annual Operating Costs for HypotheticalRefuse Incineration Systems (50 and 100 ton/day DesignCapacities). .. ..... .......... ....... A-42
v
for C1* Institute for Energy Studies, Stanford University (November 1975).60
TABLES (Conc:uded)
A-16 Particulate Control System Design Capacitiesand Investment Costs ........ ................... A-43
A-17 Annual Operating Costs for ParticulateControl Systems ........ ..................... .A-44
A-18 Energy Recovery Potential (50 and 100 ton/day DesignCapacities) ..................... A-46
A-19 Estimated Investment and Net Operating Costsfor Large Pyrolysis Systems ..... ............... .A-S1
vi
Minera' .A Energy Luv&-M -- - Ciclr73the Interior, Bureau of Mines Information ircular 783i no U5L I*
61
I INTRODUCTION
One available option for disposal of solid wastes from military
bases is mass burning of unprocessed refuse in shop-fabricated incinera-
tors. A number of military bases, including several Navy bases, have
installed or plan to install shop-fabricated incineration units. The
following review of available technology and generalized cost correla-
tions has been prepared for inclusion in the SRI-developed data base to
be used by Navy planners responsible for solid waste management and
energy conservation.
A. Scope of Work
The precise scope of this task effort is summarized below:
o Prepare a comprehensive list of suppliers of shop-fabricatedrefuse incinerators that may be installed at plants withdesign capacities of less than 100 ton/day of refuse. Sup-pliers in North America as well as in Western Europe are to beincluded.
o Classify the suppliers as to (a) current production of units
for mass burning of municipal refuse with heat recoveryboilers (and possibly air pollution control devices), (b)active development of a unit for mass burning of refuse, and(c) production of units for other types of wastes or residues.
" Select several installations of units from suppliers in cate-gory (a) above for on-site inspections to gather data concern-ing operating costs, operation and maintenance practices,environmental control practices, and energy recovery programs.
o Prepare investment and operating coat estimates based on datagathered from site visits and contacts with unit suppliers.
Costs are to be presented for several levels of pollutioncontrol and for a capacity range of from less than 10 ton/dayto about 100 ton/day. All significant design assumptions andcost estimating bases will be noted.
A-I
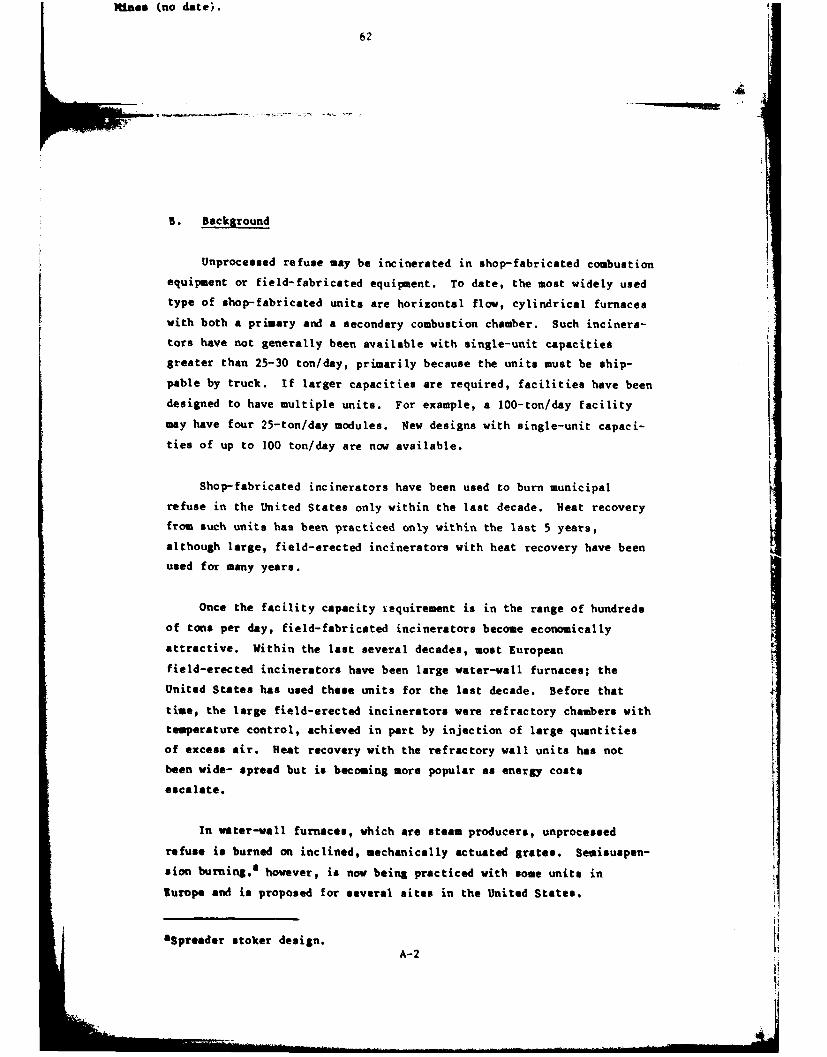
Nines (no date).
62
B. Background
Unprocessed refuse may be incinerated in shop-fabricated combustion
equipment or field-fabricated equipment. To date, the most widely used
type of shop-fabricated units are horizontal flow, cylindrical furnaces
with both a primary and a secondary combustion chamber. Such incinera-
tors have not generally been available with single-unit capacities
greater than 25-30 ton/day, primarily because the units must be ship-
pable by truck. If larger capacities are required, facilities have been
designed to have multiple units. For example, a 100-ton/day facility
may have four 25-ton/day modules. New designs with single-unit capaci-
ties of up to 100 ton/day are now available.
Shop-fabricated incinerators have been used to burn municipal
refuse in the United States only within the last decade. Heat recovery
from such units has been practiced only within the last 5 years,
although large, field-erected incinerators with heat recovery have been
used for many years.
Once the facility capacity iequirement is in the range of hundreds
of tons per day, field-fabricated incinerators become economically
attractive. Within the last several decades, most European
field-erected incinerators have been large water-wall furnaces; the
United States has used these units for the last decade. Before that
time, the large field-erected incinerators were refractory chambers with
temperature control, achieved in part by injection of large quantities
of excess air. Beat recovery with the refractory wall units has not
been wide- spread but is becoming more popular as energy costs
escalate.
In water-wall furnaces, which are steam producers, unprocessed
refuse is burned on inclined, mechanically actuated grates. Semisuspen-
sion burning,a however, is now being practiced with some units in
Europe and is proposed for several sites in the United States.
aSpreader stoker design.
A-2
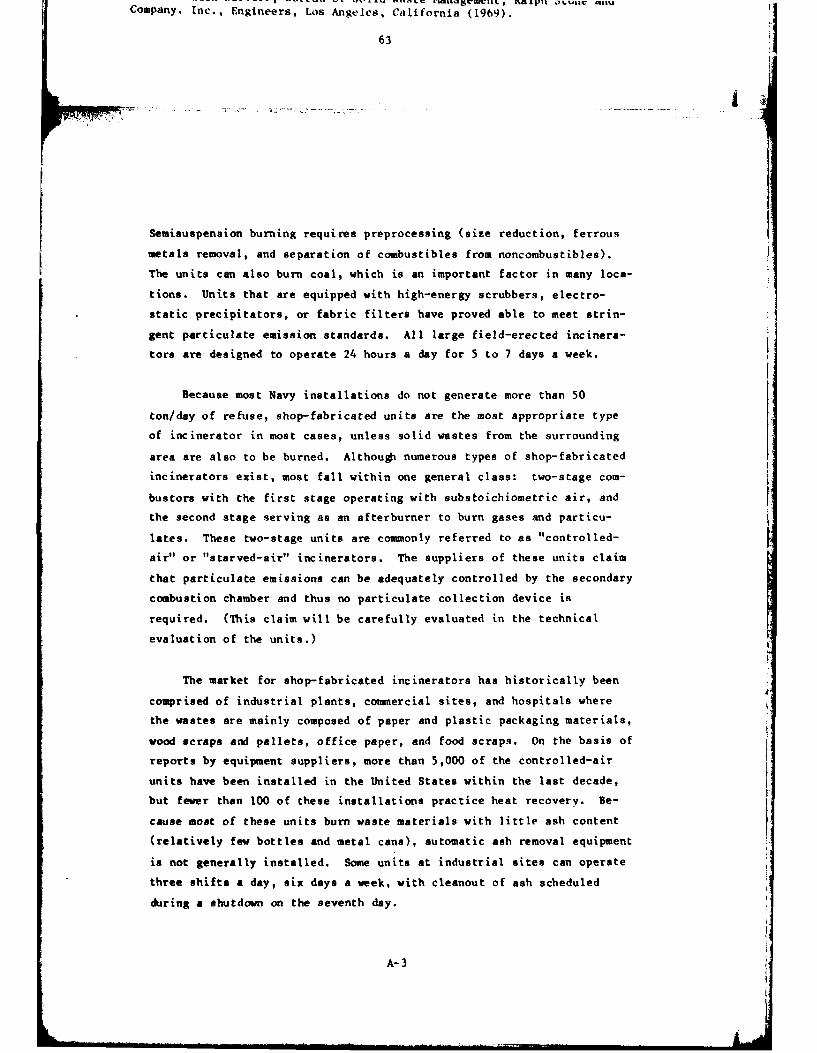
Company. Inc., Engineers, Los Angeles. California (1969).
63
Semisuspension burning requires preprocessing (size reduction, ferrous
metals removal, and separation of combustibles from noncombustibles).
The units can also burn coal, which is an important factor in many loca-
tions. Units that are equipped with high-energy scrubbers, electro-
static precipitators, or fabric filters have proved able to meet strin-
gent particulate emission standards. All large field-erected incinera-
tors are designed to operate 24 hours a day for 5 to 7 days a week.
Because most Navy installations do not generate more than 50
ton/day of refuse, shop-fabricated units are the most appropriate type
of incinerator in most cases, unless solid wastes from the surrounding
area are also to be burned. Although numerous types of shop-fabricated
incinerators exist, most fall within one general class: two-stage corn-
bustors with the first stage operating with substoichiometric air, and
the second stage serving as an afterburner to burn gases and particu-
lates. These two-stage units are commonly referred to as "controlled-
air" or "starved-air" incinerators. The suppliers of these units claim
that particulate emissions can be adequately controlled by the secondary
combustion chamber and thus no particulate collection device is
required. (This claim will be carefully evaluated in the technical
evaluation of the units.)
The market for shop-fabricated incinerators has historically been
comprised of industrial plants, commercial sites, and hospitals where
the wastes are mainly composed of paper and plastic packaging materials,
wood scraps and pallets, office paper, and food scraps. On the basis of
reports by equipment suppliers, more than 5,000 of the controlled-air
units have been installed in the United States within the last decade,
but fewer than 100 of these installations practice heat recovery. Be-
cause most of these units burn waste materials with little ash content
(relatively few bottles and metal cans), automatic ash removal equipment
is not generally installed. Some units at industrial sites can operate
three shifts a day, six days a week, with cleanout of ash scheduled
during a shutdown on the seventh day.
A-3
Recovery of Resources From Waste: Volume XVI1, No. 4, R. L. Schroeder,Raytheon Service Co. (Winter 1975).
64
CDC 6400 Extended FORTRAN
The CDC 6400 version of standard FORTRAN was used to sort data
files held in the SIR system and to carry out arithmetic computations
using the data. This FORTRAN language is a version of the coimnon
FORTRAN programeing language that has been tailored for use on the CDC
6400. The sorting activities included the retrieval of data files and
resequencing of the information on the basis of certain attributes
identified in each data base. Specifically, data stored in a random
sequence were ordered into two new files in sequence according to waste
generator type in one file and acording to waste type in the other.
FORTRAN programs were used to perform summations using the new sorted
files, to calculate bulk load densities, and to prepare new files for
input to SPSS.
SPSS
SPSS is a package containing subprograms to carry out a multitude
of arithmetic, graphical, and statistical procedures. It is used to
analyze data, test hypotheses, plot, and to do many other activities.
In this report, SPSS was used to perform regression analyses for
coefficient estimation and to test confidence levels of the coefficients
generated.
Regression analysis is a technique used to generate the
coefficients for an equation that can describe the relationship between
a measured variable (like volumes of each waste type) and an unknown
variable (the weight of a load consisting of a certain mix of waste
types). In the regression analysis, the observations of the
"independent" variables (e.g., volumes of waste types) and the
"dependent" variable (i.e., weight of a load) are compared to determine
coefficients that represent the relationship between the variables
(here, the densities of each waste type).
i I m m A-4
65
II SURVEY OF TECHNOLOGY IN THE UNITED STATES
AND WESTERN EUROPE
A. U.S. Technology
From listings of equipment suppliers in trade journals, discussions
with suppliers at trade shows and conferences, and personal communica-
tion with consulting engineers concerned with combustion equipment, SRI
has compiled information on shop-fabricated combustion equipment for
solid wastes as veil as for agricultural and forestry residues. Those
suppliers that have installed shop-fabricated units to burn municipal
refuse or that are attempting to sell units for that purpose are listed
in Table A-1. The suppliers are classified into three major categories:
" Those with systems (including heat recovery) now burning muni-cipal refuse.
" Those with units not now burning municipal solid waste (NSW)but with the potential to do so or with units burning MSW butwithout heat recovery.
o Those with units requiring extensive development to allowburning of municipal refuse or units not designed for heatrecovery.
Table A-i also notes any need for processing of the refuse before
combustion. The table also indicates the type of furnace and hearth,
the method of ash removal (manual or automatic; ash pusher or bomb-bay
doors), the type of boiler usually supplied, the type (if any) of parti-
culate collection equipment usually supplied, and the range of capaci-
ties available for individual modules.
Table A-2 identifies the sites (by supplier) where MSW is now or
soon will be burned in shop-fabricated incinerators. Table A-3
A-5
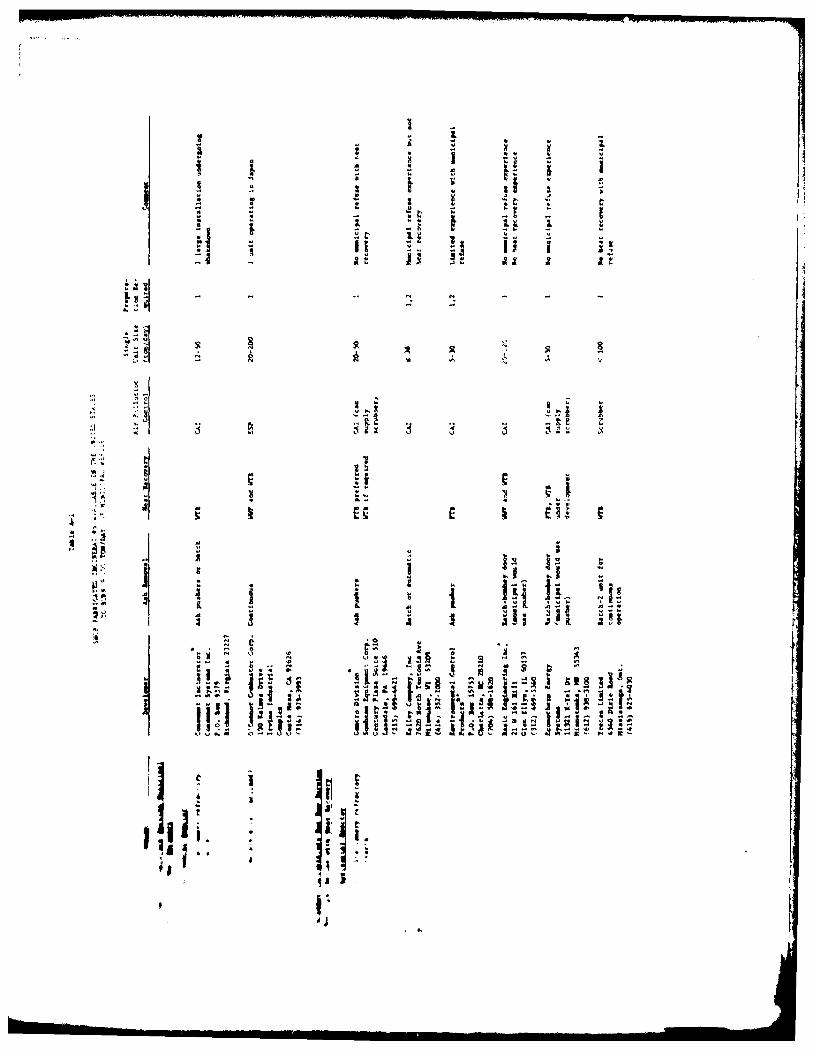
i2a II - a
I II a '~; -~
- i2. - F
ii i- I~ h I~Z 2
s.j
j
- N N V
= [A
- -~'A
EV~
I-.4 i pI ~ 'I
5 I -~ NI~ - AS .fl4*a U.1
e4 AS ~.-
N 5.5 ~4 S.5. 4 .54 *SNS N ~ ~ A ~
II J. im~+ I ~
- ~ at~ N(SU'
Ih! ~ S
I11*Iii;V
'a
i5'
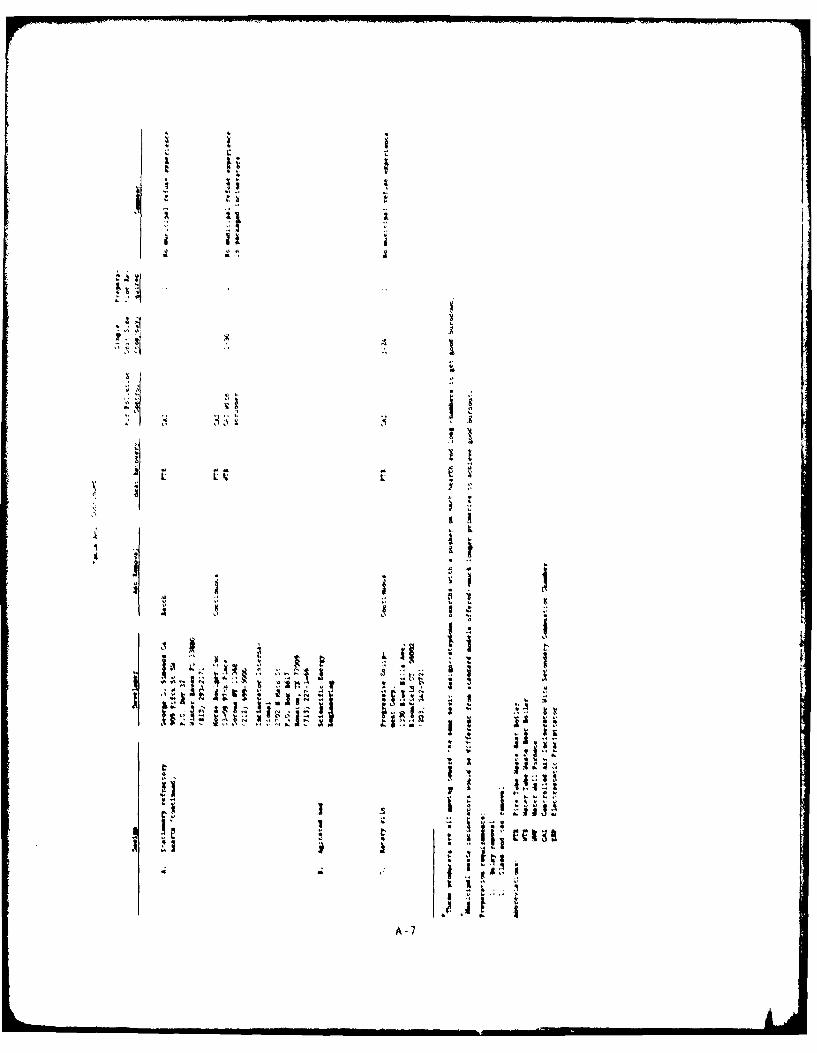
ii
, i I *I
R-7
* Is
- I II I II I . .... II I I
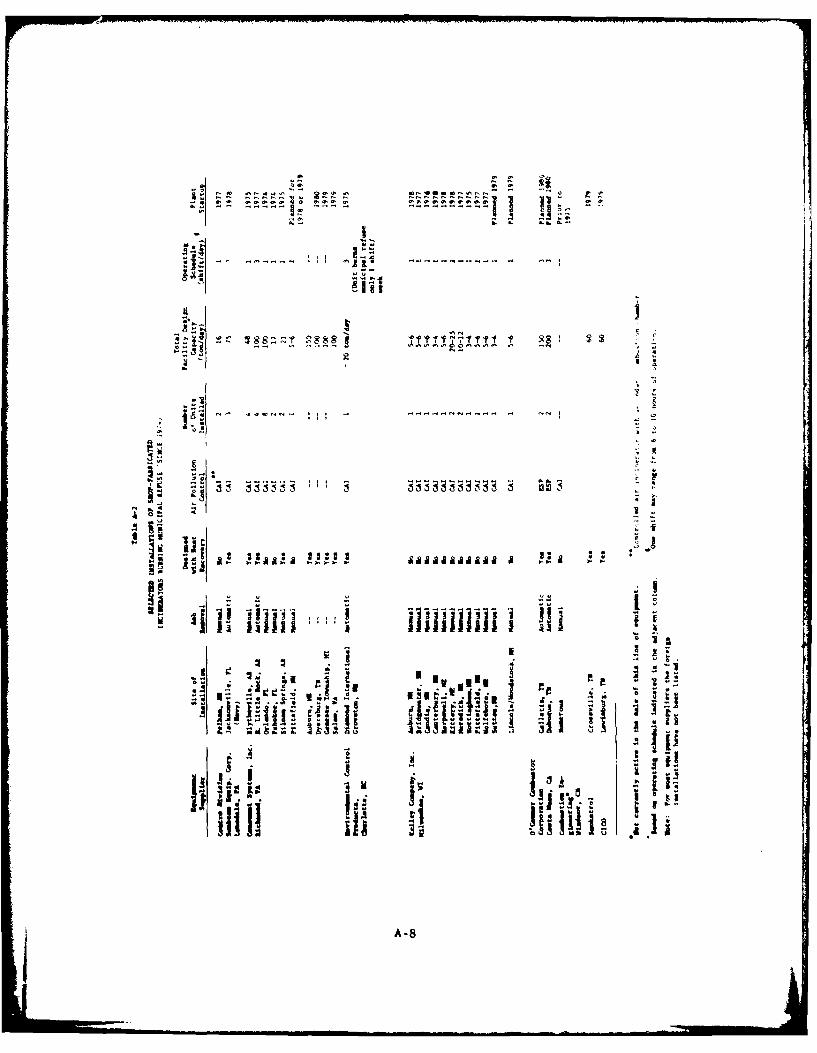
- - . . ..... . ....
,.+"
I
-- A
IU aa aA an a n 1+
,2" I
+• i I + "-
++ ++++++ ++IJIIIIIIII + I i
w j i :: a I I
0 * I " "
jA-8
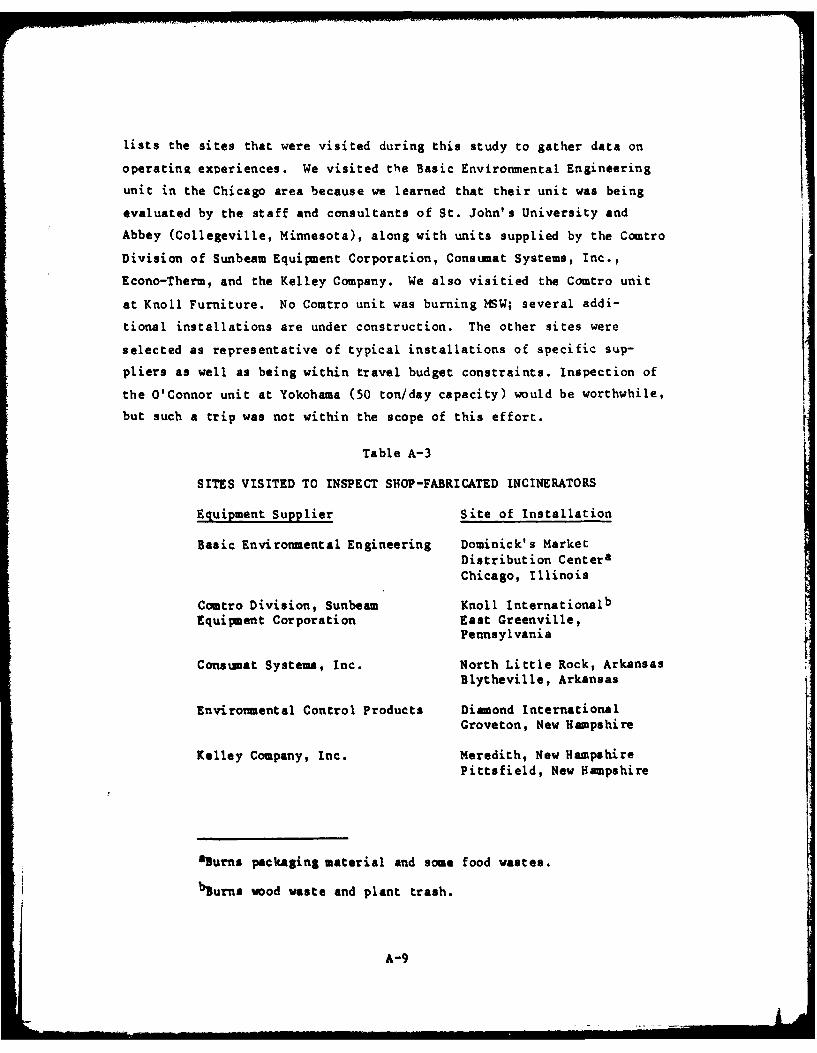
lists the sites that were visited during this study to gather data on
operatinR experiences. We visited the Basic Environmental Engineering
unit in the Chicago area because we learned that their unit was being
evaluated by the staff and consultants of St. John's University and
Abbey (Collegeville, Minnesota), along with units supplied by the Comtro
Division of Sunbeam Equipment Corporation, Consumat Systems, Inc.,
Econo-Therm, and the Kelley Company. We also visitied the Comtro unit
at Knoll Furniture. No Comtro unit was burning MSW; several addi-
tional installations are under construction. The other sites were
selected as representative of typical installations of specific sup-
pliers as well as being within travel budget constraints. Inspection of
the O'Connor unit at Yokohama (50 ton/day capacity) would be worthwhile,
but such a trip was not within the scope of this effort.
Table A-3
SITES VISITED TO INSPECT SHOP-FABRICATED INCINERATORS
Equipment Supplier Site of Installation
Basic Environmental Engineering Dominick's MarketDistribution Centera
Chicago, Illinois
Comtro Division, Sunbeam Knoll Internationalb
Equipment Corporation East Greenville,Pennsylvania
Consumat Systems, Inc. North Little Rock, ArkansasBlytheville, Arkansas
Environmental Control Products Diamond InternationalGroveton, New Hampshire
Kelley Company, Inc. Meredith, New HampshirePittsfield, New Hampshire
alurns packaging material and some food wastes.
bBurns wood waste and plant trash.
A-9
Although some companies have installed units with gas-to-gas heat
exchangers to recover heat for building heating systems, only steam gen-
eration was considered in this study because of the more widespread need
for steam on a year-around basis at Navy installations.
The findings from the site visits and discussions with the equip-
ment vendors and operators are sumarized in a later section of the
report.
B. Other U.S. Technology Identified But Not Evaluated
Fluidized bed combustion of processed MSW has been the subject of
research for the last decade. Much of the research work has been con-
ducted by the Combustion Power Company of Menlo Park, California, under
EPA sponsorship. A fluidized bed has also been tested for combustion of
the short fiber stream at the Black-Clawson Resource Recovery plant at
Franklin, Ohio. Sewage sludge was burned along with the short fiber
stream. A codisposal facility for sewage sludge and processed MSW that
will use a fluidized bed combustor is being installed at Duluth,
Minnesota. A fluidized bed combustor with a heat transfer surface in
the combustor is currently being evaluated by Stanford University and
Combustion Power Company under EPA sponsorship for MSW combustion.
In fluidized bed combustors, however, the MSW must be shredded and
the heavy fraction (metals, glass, other inorganic solids) removed
before combustion. For a small facility, extensive preprocessing is nota.
economically feasible. One leading company in this field is now
evaluating the possibility of using a trommel screen alone for
eEnergy Products of Idaho has been supplying fluidized bed combustorsto the forest products industry since 1972. During the 4-year period
from 1973-1977, the company installed 22 commercial units in sizes upto 80 x 106 Btu/hr.
A-10
processing MSW injected into the combustor. Energy Products of Idaho
believes that its combustor may offer an attractive option for communi-
ties needing to burn less than 200 ton/day of refuse. Testing of the
concept is under way now at the company's pilot plant in Idaho.
Another current development effort that Navy personnel are aware of
is the auger-bed incinerator. Hoskinson and Associates, the developers,
conducted a field demonstration of this unit during May 1977. The re-
sults of the field evaluation have been reported by the Army Construc-
tion Engineering Research Laboratory.a The field study "demonstrated
short-term successful operation" with the auger-bed incinerator "pro-
cessing up to 3.5 tons/hour of solid waste--more than three times the
throughput capability of currently marketed modular solid-waste inciner-
ators." Because of certain design problems, the unit is not considered
commercial at this time. The concept, however, does appear to have
technical merit.
C. Western European Technology
Professor A. G. Buekens and J. G. Schoeters surveyed Western
European incineration technology. Table A-4 summarizes the characteris-
tics of shop-fabricated units that they identified as being suitable for
incineration of 20 to 100 ton/day of MSW. European companies do not
appear to have much experience with shop-fabricated municipal incinera-
tors that burn MSW, but numerous companies with units that burn plant
trash have offered to build such units. Buekens and Schoeters did not
identify any existing modular unit that is burning MSW. Many suppliers
of large incinerators have offered to build small capacity field-erected
units for 1SW that are adapted or scaled down from their larger
aS.A. Hathaway, J. S. Lin, and A. N. Collishaw, "Field Evaluation of
the Modular Auger-Bed Heat Recovery Solid Waste Incinerator," U.S. Army
Corps of Engineers, Technical Report E-128 (May 1978).
A-11
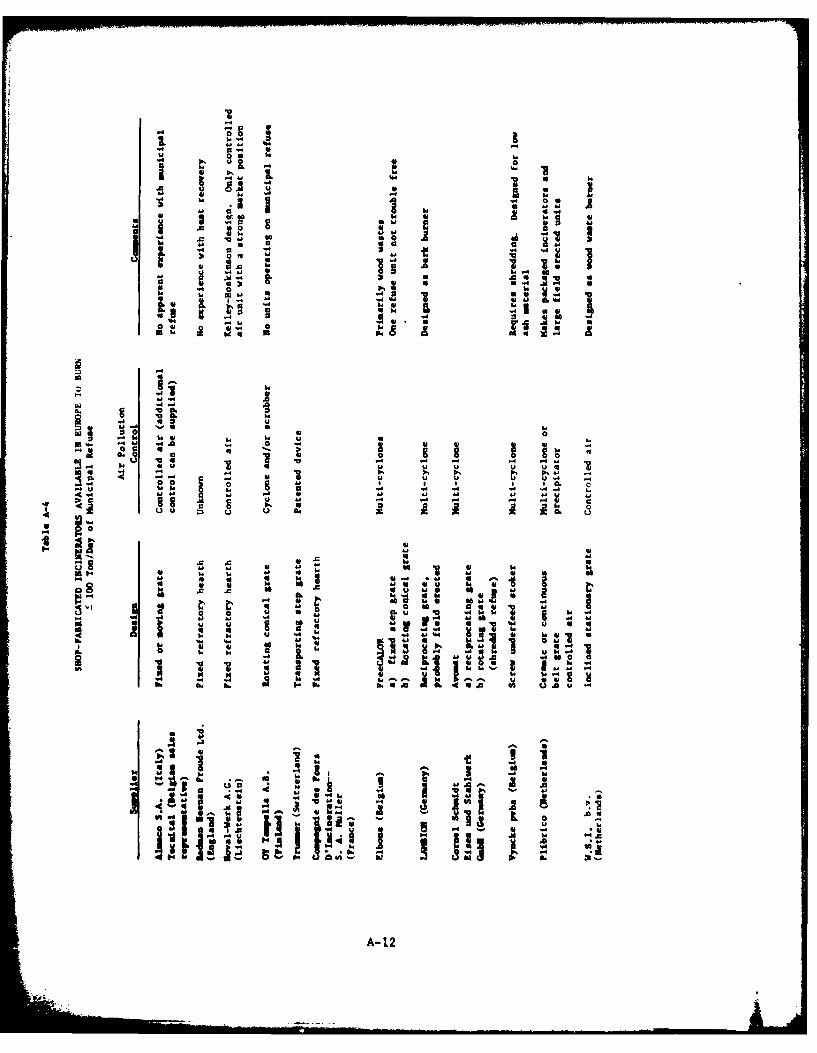
71*1
V aa Iu
a- 0
A WOId0 4
to.u
96
.6 ~ ~ ~ P 04 -* .13 a x3.v~
bi 06 -A~~ 4.14
a ~4A*4
tj4. 4 1 4 4
44 -4
.440 04 o 4
U~ ~~ ~ .4. ~
-u'k on4 5 *k-C 0) .0 WM 4 In >44
44'a a -. -' u b.4 4 44
-A44
~~PO
hIC A 412
designs. Therefore, most incinerators with a capacity of 20 to 100
ton/day do not use the stationary horizontal refractory hearth that is
used almost exclusively in the United States. Instead, most incin-
erators use some version of a mechanical grate--either rocking,
transporting, or rotating. Host suppliers include an air pollution
control device such as a scrubber or multicyclone.
At this time, European technology in building shop-fabricated
incinerators does not appear to be superior to U.S. technology. Because
small capacity units in Europe use mechanical grates, the units are rel-
atively expensive. In the future, more information should be obtained
from European companies on small field-fabricated units burning MSW to
determine the costs and whether they are less prone to slag problems or
provide more complete burndown than U.S. units.
A1
A- 13
III TECHNICAL EVALUATION OF OPERATING UNITS
IN THE UNITED STATES
A. Incinerators with Capacities of More Than 20 ton/day
Four installations of shop-fabricated incinerators were visited:
o A Constumat installation at Blytheville, Arkansas
o A Consumat installation at North Little Rock, Arkansas
o A Basic installation at a Dominick's Market warehouse in
Chicago, Illinois
o A Comptro installation at Knoll Furniture, East Greenville,
Pennsylvania.
On the basis of these site visits, some general commnts on the state of
the art of municipal refuse incinerators are possible.
1. Construction Quality and Unit Lifetime
Current construction standards are probably inadequate for
long-term use by municipal personnel. Some units, for example, have
loading facilities that do not appear to be designed to be sturdy or to
have sufficient safety interlocks. As a result, the door that closes
the top of the loading hopper dring the feeding cycle warps. The lack
of insulation of some units made working near them uncomfortably hot;
high temperatures were particularly noticeable near heat recovery
units. Some access doors to the incinerators and heat
sent did not have heavy-duty hinges, a particularly bad
these units require frequent (several times daily) visua
A-15
III TECHNICAL EVALUATION OF OPERATING UNITS
IN THE UNITED STATES
A. Incinerators with Capacities of More Than 20 ton/day
Four installations of shop-fabricated incinerators were visited:
o A Consumat installation at Blytheville, Arkansas
o A Consumat installation at North Little Rock, Arkansas
o A Basic installation at a Dominick's Market warehouse in
Chicago, Illinois
o A Comptro installation at Knoll Furniture, East Greenville,
Pennsylvania.
On the basis of these site visits, some general comments on the state of
the art of municipal refuse incinerators are possible.
1. Construction Quality and Unit Lifetime
Current construction standards are probably inadequate for
long-term use by municipal personnel. Some units, for example, have
loading facilities that do not appear to be designed to be sturdy or to
have sufficient safety interlocks. As a result, the door that closes
the top of the loading hopper duri, the feeding cycle warps. The lack
of insulation of some units made working near them uncomfortably hot;
high temperatures were particularly noticeable near heat recovery
units. Some access doors to the incinerators and heat recovery equip-
ment did not have heavy-duty hinges, a particularly bad defect because
these units require frequent (several times daily) visual inspection.
A- 15
-SLA
From the limited data available, unit lifetime is difficult to
estimate. Conaumat promises 25 years, which is probably unrealistic,
given the condition of some in-service units. The Blytheville unit,
Aich has been operating for only 3 years, shows significant deteriora-
tion. The inside walls of the primary combustion chamber are almost
worn to bare metal in a few small places, and the metal and paint on the
outer surfaces are discolored--a sign of severe overheating. Oxidation
has made holes in the metal shell in some places, which have been
patched with welded-on metal pieces. Two of the four units at
Blytheville will probably be replaced within the next year. Some damage
is probably due to operation above design capacity and inadequate main-
tenance--the Blytheville plant has had several plant managers and budget
cuts since it was built--but the units should have been constructed to
deal with this.
Because some of the design errors leading to the rapid deteriora-
tion of the Blytheville unit have been corrected, North Little Rock,
which was the next major Consumat installation, will last longer. How-
ever, the jump to a 25-year lifetime probably cannot be made in one
cycle of design changes, especially when the new units look so much like
the old ones. External signs of overheating are already visible.
The Comptro and Basic units look as though they hold up better, but
they are not in municipal service and have only been operating for a few
years. More time will be required to determine their service life.
2. Temperature Control
Temperatures can be controlled in shop-fabricated incinerators in a
number of ways. The primary chamber operates with substoichiometric air
so that in response to short-term temperature changes its temperature
can be raised by increasing air rates or, in the case of a fixed air
supply, by adding refuse at a lower rate. Alternatively, the primary
temperature can be lowered by decreasing the air rate or by adding more
A-16
refuse without changing the air rate. As an emergency measure, the pri-
mary temperature can be lowered by adding water from a spray system.
The secondary combustion chamber operates with excess air so that
in response to temperature changes it can be cooled by adding more air,
or heated by burning auxiliary fuel. (Heating by using less air is
probably not wise because this might interfere with providing complete
combustion). An additional temperature control option is to cool the
secondary combustion chamber by adding less air to the primary chamber;
this would reduce the amount of gaseous fuel volatilized from the refuse
and therefore decrease the amount of fuel fed to the secondary chamber.
A strong interaction exists between the temperature in the secon-
dary chamber and any measures used to control temperature in the primary
chamber. For example, if the primary chamber is cooled by adding more
refuse, the secondary chamber temperature will tend to rise because of
the rapid devolatilization of the refuse and the subsequent increase in
the fuel-to-air ratio in the secondary chamber. The temperature rise
can be dampened by increasing the secondary air flow, but this strategy
will decrease residence times in the secondary chamber and may cause air
pollution.
Most of the shop-fabricated incinerators visited had simple temper-
ature control systems and required a high level of operator skill.
Temperatures could not be completely controlled by simply adjusting air
flows. Some systems had locking devices to prevent overfeeding, but
none could indicate when faster feeding rates were necessary. At all
installations, the temperatures in the incinerators and the condition of
the burning refuse were not visible to the operator responsible for
loading. An inspection of small temperature gauges and the incinerator
(the primary chamber requiring a visit outside the loading area and man-
ual opening of an access door) had to be made by supervisory personnel.
The supervisor's experience then served as the basis for his verbal con-
munication to the operator regarding the loading strategy until the
A-17
next inspection. For example, at the Consumat installation in North
Little Rock, the primary chamber in one unit overheated during the lunch
hour because the operator did not feed it for a half hour. The over-
heating was detected by the supervisor, who turned on the water spray
and instructed the operator to feed tho unit rapidly to bring the pri-
mary temperature down. These two control measures caused the unit to
smoke badly.
Of all the sites visited, the Basic incinerator, which burns mostly
cardboard, had the most sophisticated control system. Basic uses modu-
lated air as the primary temperature control and a lockout to prevent
overfeeding. Once the unit was operating within the desired temperature
range, only a minimum of auxiliary fuel was required to maintain the
proper temperature in the secondary chamber.
3. Heat Recovery Boilers
Comptro has no heat recovery boilers in MSW service that could be
inspected. Basic has not yet installed a heat recovery boiler. Both
Basic and Comptro indicate that fire tube boilers would work well in
this service and that soot blowing can be made automatic. Consumat sup-
plies water tube boilers, but the original design, represented by
Blytheville, appears to have been inadequate. The boilers are no longer
operational because they are too compact, cannot be kept soot-free, and
corroded badly. Almost all tube fins are gone. However, the new units
at North Little Rock seem to be better designed. Individual tube banks
can be replaced and enough space inside the unit exists to provide ade-
quate soot blowing. At present, the first bank of tubes cannot be
cleaned automatically, but modifications to solve this problem are under
way. Whether all problems have been solved is not yet known. The
units, which have been operating for less than a year, are still under-
going shakedown and have not been able to meet their steam coitments
on a sustained basis, As a result boiler efficiency cannot be assessed.
A- 18
4. Burndown
During the site visits, only the two Consumat units were burning
MSW. The unit at Blytheville, which did not have automatic ash removal,
was discharging an almost completely inorganic ash. The units at North
Little Rock (operating three shifts a day with continuous ash removal)
were not providing complete burndown during our visit. Magazine pages
were readable in the ash stream, and grass clumps were still green
inside. This occurred even though the units were being fed at only 90%
of their design capacity. Apparently, additional development (possibly
added residence time or changes in the underfire air system or both) is
required for the continuously operated units. Any fixed hearth unit
supplied by vendors other than Consumat will most likely have the same
problems because they all have similar designs.
The two municipal units visited produce some slag, but the slag
does not apparently attack the refractory or otherwise significantly
affect operation. The Consumat design for North Little Rock did have
trouble with slag clogging the underfire air ports, but this has been
fixed by a field modification.
5. Air Pollution
None of the sites visited included auxiliary controls for air pol-
lution control. The two incinerators burning plant trash showed no
plume during normal operation, primarily because they both burn a lowash
material and therefore do not use ash-moving rams during the burning
period. Moving the ash stirs up particulates.
The two Consumat units showed visible plumes during operation and
occasionally visible pieces of ash. The North Little Rock units had
automatic soot blowing, which released a 10- to 20-second plume of brown
smoke every time it operated. Units with continuous ash removal will
A-19
I AD-ABO 322 SRI INTERNATIONAL MENLO PARK CA F/6 13/2CHARACTERIZATION OF NAVY SOLID WASTE AND COLLECTION AND OISP0SA-ETCtUlI JAN 80 R E FREEMAN, A 6 CAPPS N00123-TS-C-0.68UNCLASSIFIED CEL-CR-80.O03,22E EE EEE
I
probably require an auxiliary device to operate in compliance with air
pollution regulations, especially if complete burndown of fixed carbon
is required.
B. Small Refuse Incinerator Sites (Less Than 20 ton/day)
Several small incinerators were visited, including:
o Kelley Incinerator, Mereditht New Hampshire
o Environmental Control Products Incinerator, Grovetono New
Hampshire
o Kelley Incinerator, Pittsfield, New Hampshire.
In general, the temperature control systems were simple and re-
quired skilled manual intervention. The stack condition and incinerator
burning condition were not observable by the loading operators. Nor was
temperature information readily available to the operator. A signifi-
cant problem seems to be slag attack on the refractory; the slag was
pulling pieces of refractory off the walls of the primary chamber. A
jack hammer was used to remove slag from the Groveton unit. Source sep-
aration to remove glass is required at both Meredith and Groveton.
C. Air Pollution Control
I. Emission Standards
A number of air pollution control agencies were contacted during
the study to determine what kinds of standards will apply to refuse
burning in plants with a total capacity of less than 100 ton/day. The
findings of our telephone survey for areas where there are large Navy
installations are summarized in Table A-5. Currently, only particulate
emissions (visible and mass emissions) are being regulated. In general,
A-20
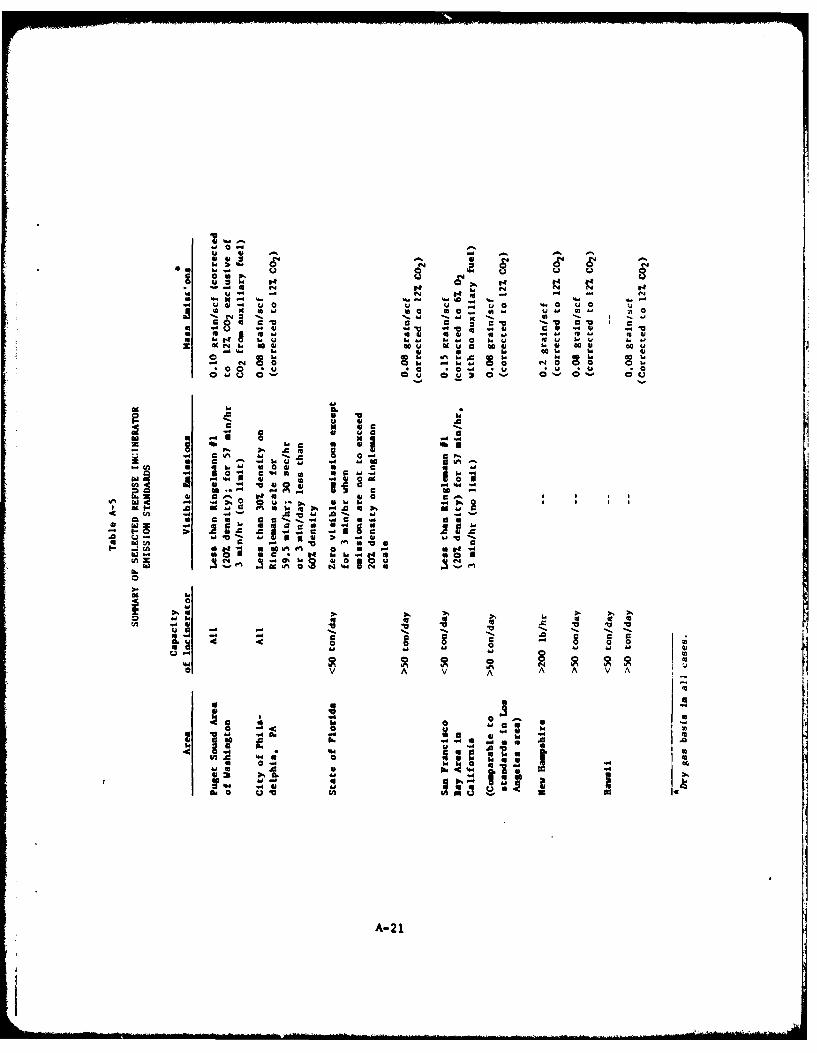
-0.4
-. 4 0
C; U; 0 C; . 0 uO44.4440 40... 4.4 J 44 .;
M 96-4
1.4- a4 44 4- 84- 4-4
-0 *U C 0 * U U .
re 4
cc LA 44 r4
d a I4 a
sk-4. .4 .48a
U2 ~ ~ ~ C U Ah.44 U 06 .
04 . *0 u 044 W4.. W
.4441 44 * A-218
all regions have mass emission standards for particulate matter compar-
able to the EPA New Source Performance Standards (NSPS) of 0.08 grains
per dry standard cubic foot (dscf), corrected to 12% CO, for units
*dith a capacity to burn more than 50 ton/day of refuse.
:lass omission requirements for smaller units range from the same as
NSPS for larger units, to 0.2 grains/dscf (corrected to 12% C02 ). No
regulations directly address the issue of soot blowing the heat recovery
boilers. Several individuals contacted felt that incinerators with heat
recovery boilers may be required to comply with standards for solid
waste or residue-fired boilers. These standards are not necessarily
-more stringent than those for incinerators. In Floridi, for example,
aitcs with less than 30 x 106 Btu/hr of input must have visible emis-
sions of less than 20% density on the Ringelmann scale, except for 2
minutes per hour, where a density of 40% is allowed. This is more leni-
ent than the standard in Florida for an incinerator with a capacity of
less than 50 ton/day, (30 x 106 Btu/hr would be equivalent to around
3.3 tons of refuse per hour, or close to 80 ton/day).
No standards now exist for control of chlorides and none have been
proposed or are anticipated in the rogi,,ns identified in Table A-5.
In noncomplianca or nonattainment areas, criteria pollutants that
exceed ambient air quality standards will be strictly regulated. If
emission of a problem criteria pollutant from a new source exceeds 25
lb/hr or 250 lb/day, a new source review is required. "Offsets" may be
necessary to allow installation of a new unit. On-site reductions in
emissions from other sources will be accepted on a 1/1 basis in terms of
mass. Off-site reductions will be considered on a case-by-case basis,
but will not be on a I/I basis.
A-22
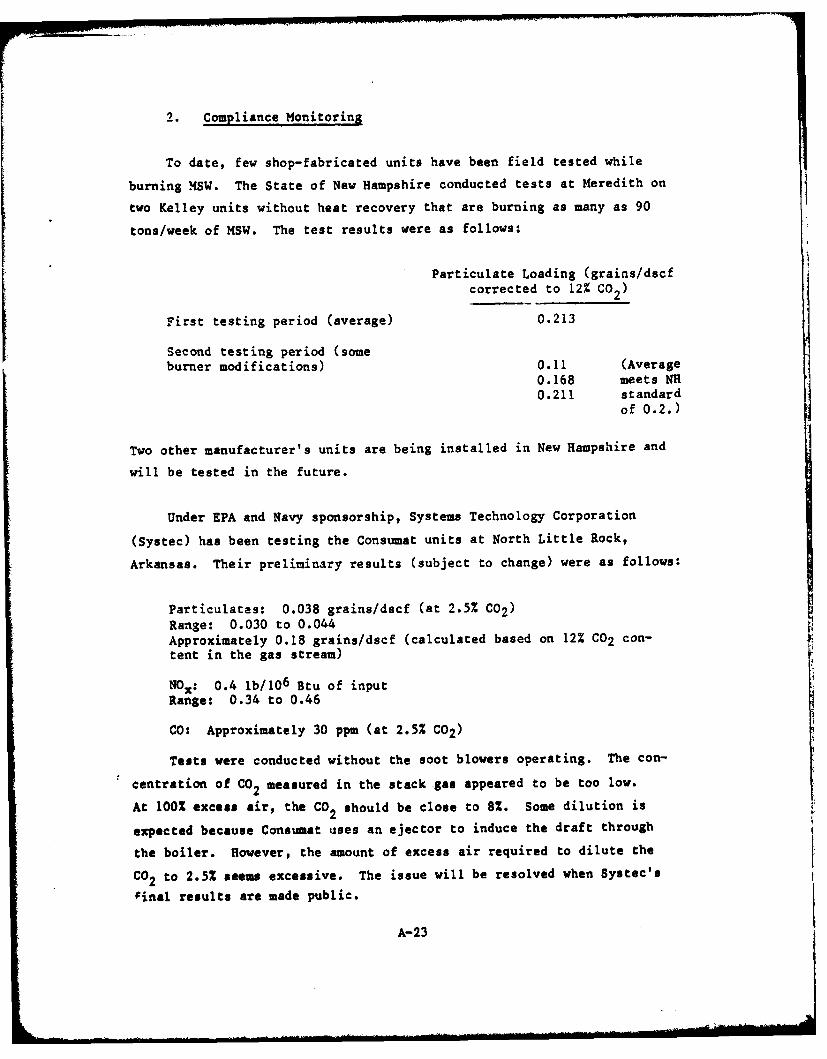
2. Compliance Monitoring
To date, few shop-fabricated units have been field tested while
burning MSW. The State of New Hampshire conducted tests at Meredith on
two Kelley units without heat recovery that are burning as many as 90
tons/week of MSW. The test results were as follows:
Particulate Loading (grains/dscfcorrected to 12% CO2)
First testing period (average) 0.213
Second testing period (some
burner modifications) 0.11 (Average
0.168 meets NH0.211 standard
of 0.2.)
Two other manufacturer's units are being installed in New Hampshire and
will be tested in the future.
Under EPA and Navy sponsorship, Systems Technology Corporation
(Systec) has been testing the Consumat units at North Little Rock,
Arkansas. Their preliminary results (subject to change) were as follows:
Particulates: 0.038 grains/dscf (at 2.5% C02 )Range: 0.030 to 0.044Approximately 0.18 grains/dscf (calculated based on 12% CO2 con-tent in the gas stream)
NOx: 0.4 lb/10 6 Btu of inputRange: 0.34 to 0.46
CO: Approximately 30 ppm (at 2.5% C02)
Tests were conducted without the soot blowers operating. The con-
centration of CO2 measured in the stack gas appeared to be too low.
At 100% excess air, the CO2 should be close to 8%. Some dilution is
expected because Consumat uses an ejector to induce the draft through
the boiler. However, the amount of excess air required to dilute the
CO2 to 2.5% seems excessive. The issue will be resolved when Systec's
Final results are made public.
A-23
IV ECONOMIC EVALUATION
A. Limitatiins on Use of Output
The investment cost estimates presented in this appendix are based
on specific design assumptions, which are not likely to be applicable in
all cases because of possible site-specific differences in solid waste
composition, site conditions (need for pilings, possible use of existing
structures or equipment, space limitations), and local construction
labor rates and productivity. Price differences will also exist among
vendors of specific types of equipment. In estimating operating costs,
we could not select unit costs or rates for utilities and labor require-
ments that are appropriate for every site. Maintenavce materials and
labor are also difficult to predict. Therefore, the cost correlations
should be used only for very preliminary evaluation to screen alterna-
tives. The cost data should not be used as the sole basis for final
selection of any one solid waste management option.
B. Mass and Energy Balances
Table A-6 shows an estimated Navy refuse composition. A more com-
plete analysis might show a different composition, but the changes would
not substantially affect the technical and economic analysis of inciner-
ation.
On the basis of the refuse composition shown in Table A-6, mass and
energy balances have been prepared (see Figures A-1 and A-2). We assume
that glass and bulky wastes are removed before collection. Glass is
separated to prevent clinker formation in the incinerator. In Figure
A-2, 100 mass units of total refuse are used as a basis for the mass
balance. The heating value of I ton of incinerator feed was calculated
to be 10.1 x I06 Btu/ton.
A-25
Me ELA
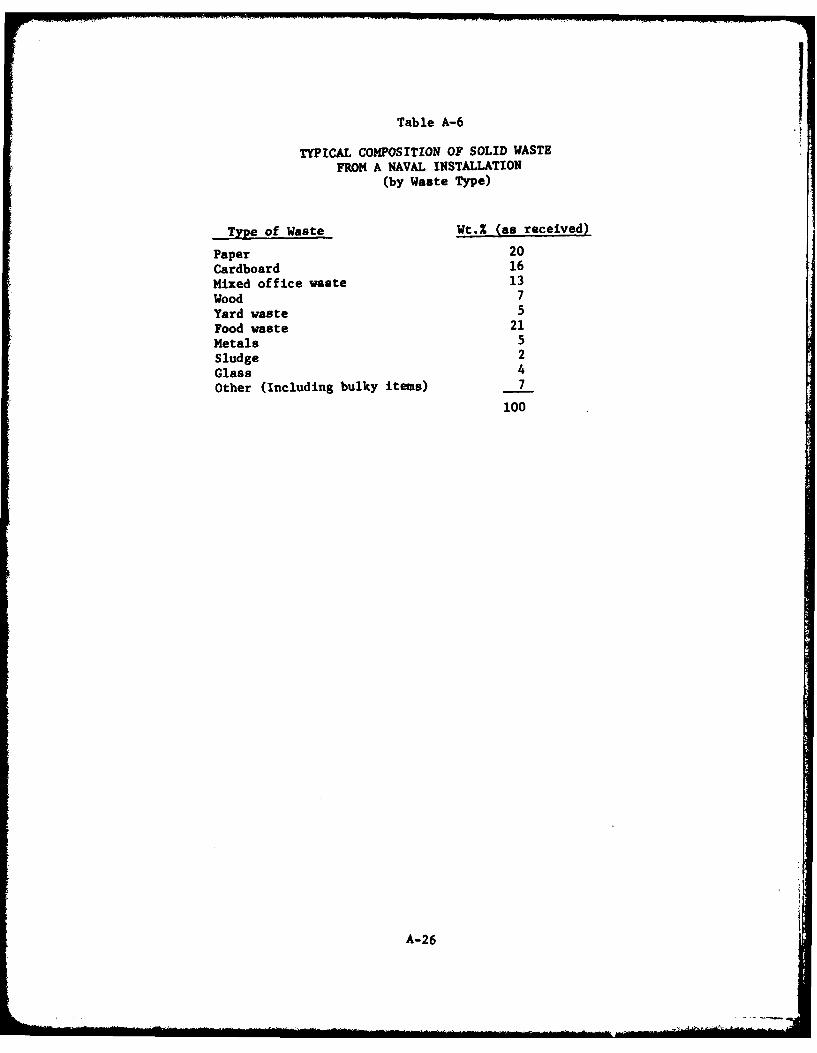
Table A-6
TYPICAL COMPOSITION OF SOLID WASTEFR~OM A NAVAL INSTALLATION
(by Waste Type)
Type of Waste Wt.Z (as received)
Paper 20
Cardboard 16
Mixed office waste 13
Wood 7
Yard waste 5
Food waste 21
Metals 5
Sludge 2
Glass 4
Other (Including bulky items) 7
100
A-26
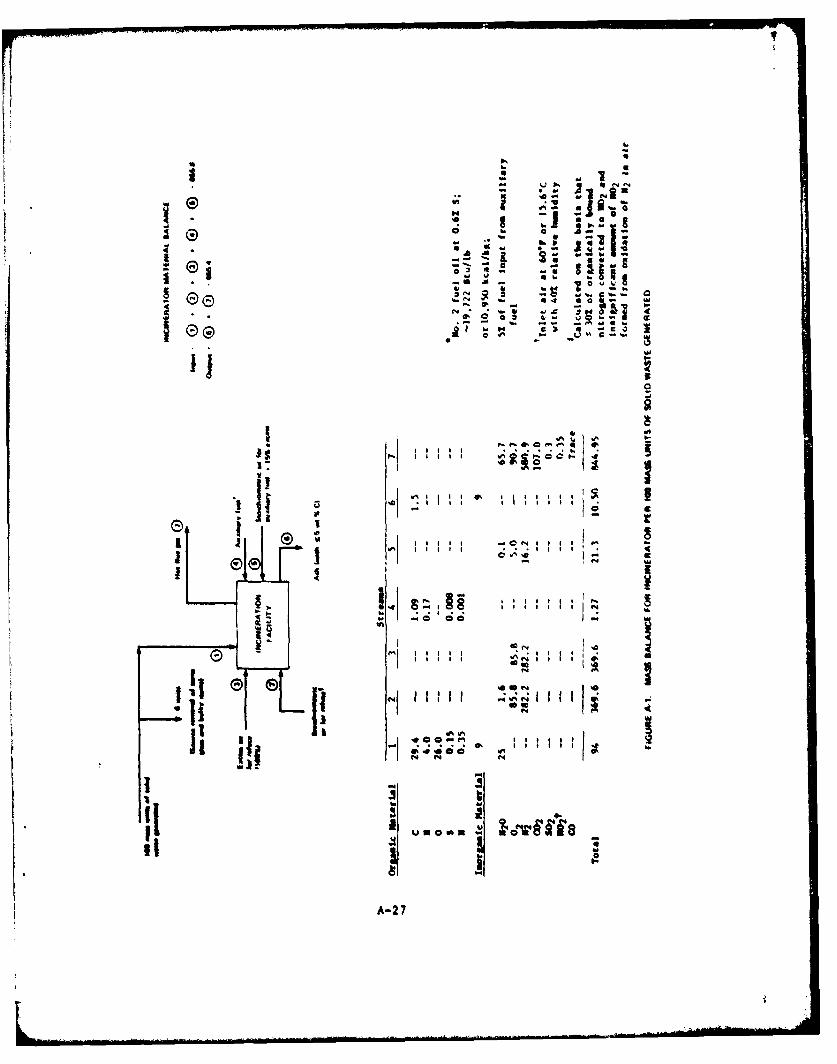
r~i 1 St . IN
l a
jft I~ ;
IA VN1* h i l 0.1 1
A-2 7
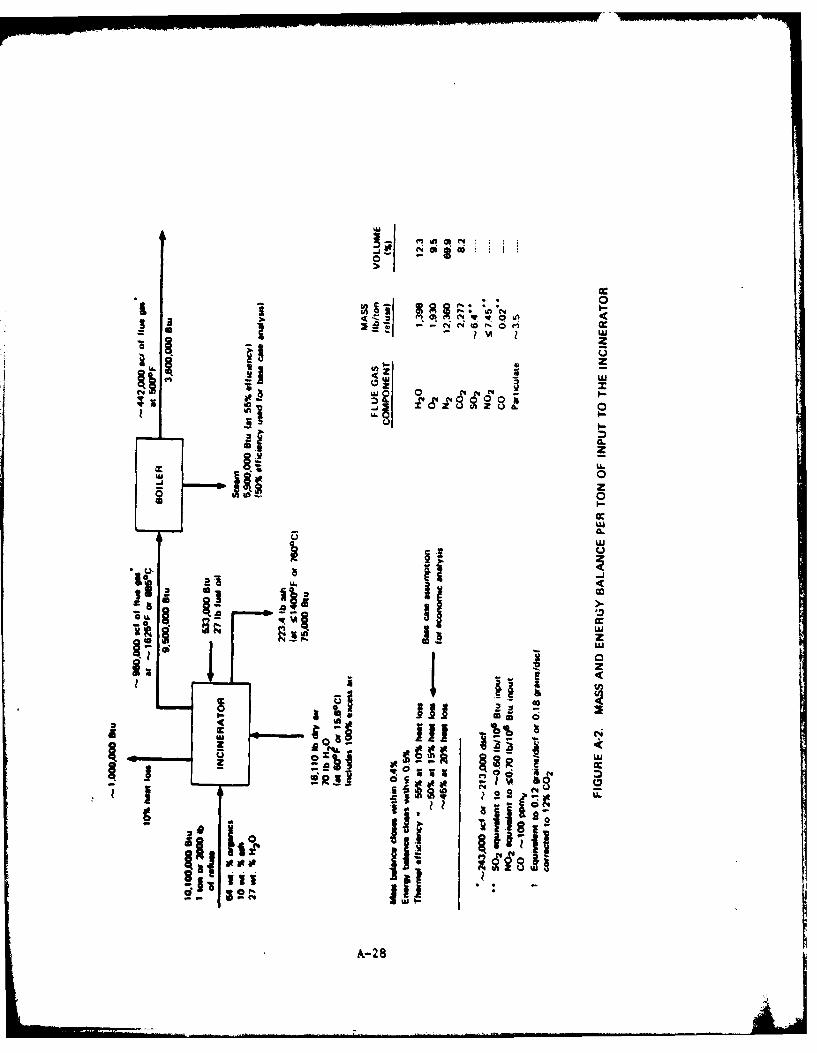
0a~~~ g~. .
202
j 0
LLQL
0z
0
333
ii!i(%o
III rwU
g - z
Iii ?9S
A-2 8
The overall thermal efficiency is 502, with 100Z excess air inputand a system equipment heat loss of 152. The particulate emissions andCO emissions have been estimated on the basis of data for a Consumatunit burning MSW at North Little Rock, Arkansas; the data were suppliedto SRI by Systec of Xenia, Ohio (another Navy contractor). The S02emissions have been calculated on the basis of an asaumed sulfur contenttypical of NSV. The NO2 emissions are calculated on the assumptionthat less than 302 of the organic nitrogen content of the 1MSW is conver-ted to NO2 and that insignificant amounts of NO2 are formed from
oxidation of N2 because of the low operating temperatures.
C. Specification of Plant Design Capacity
In the design of a facility capable of processing the MSW deliveredfrom a 5-day/week collection operation, the assumed source separation ofglass and bulky items, downtime for maintenance and holidays, and theprobability that the unit cannot perform at all times at the ratedmass-burning capacity must be considered. Taking these factors intoaccount, the incineration operation must burn a tonnage of material 18%greater than the total tonnage of material generated on a 5-day/weekbasis (see Table A-7).
To include examples that are relevant to Navy operations, plantdesign capacities ranging from 7 to 100 ton/day have been specified forthe economic analysis. Few Navy bases generate 50 or more ton/day ofrefuse, and most generate around 20 ton/day.
D. Economic Bases
Table A-8 sumnarises information concerning the quantity of refuseburned per year for the four facilities considered and the number of
shifts per day the facilities would operate. (The reason for selectingfewer hours of operation for the smaller facilities is discussed laterin the analysis.)
A-29
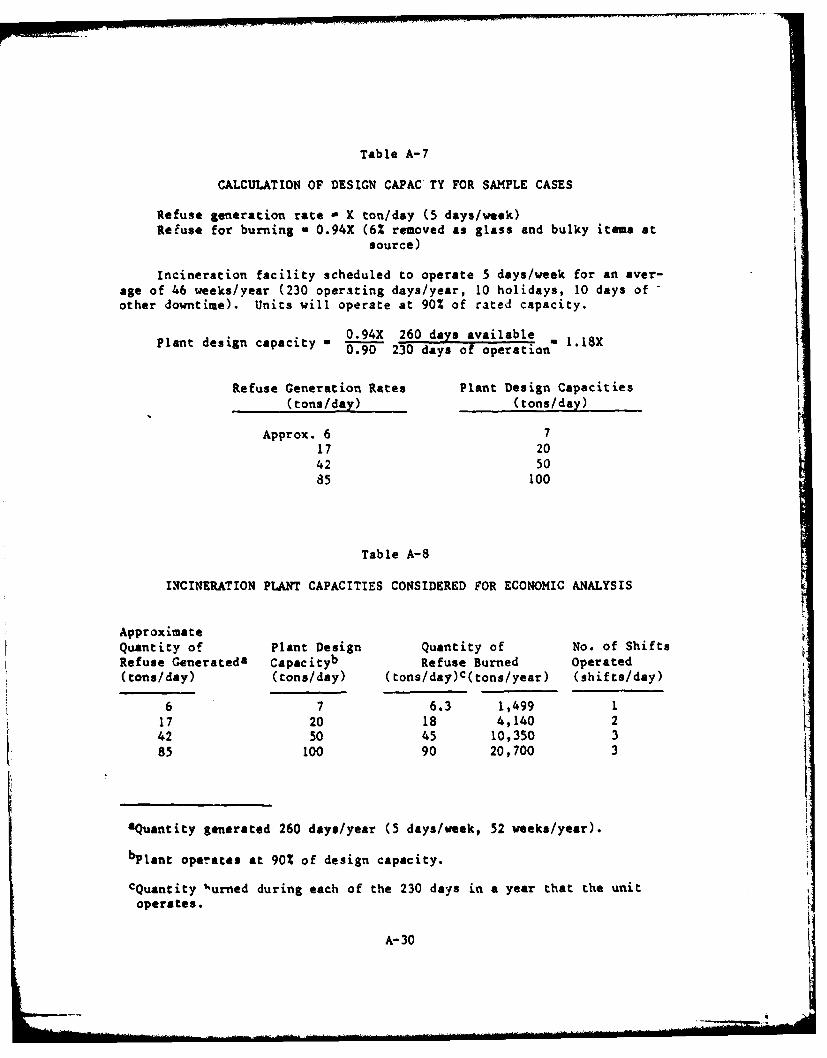
Table A-7
CALCULATION OF DESIGN CAPAC TY FOR SAMPLE CASES
Refuse generation rate a X ton/day (5 days/week)Refuse for burning - 0.94X (6% removed as glass and bulky items at
source)
Incineration facility scheduled to operate 5 days/week for an aver-age of 46 weeks/year (230 oper.iting days/year, 10 holidays, 10 days ofother downtime). Units will operate at 90% of rated capacity.
Plant design capacit 0.94X 260 days available . 1.18Xn d 0.90 230 days of operation
Refuse Generation Rates Plant Design Capacities(tons/day) (tons/day)
Approx. 6 717 2042 5085 100
Table A-8
INCINERATION PLANT CAPACITIES CONSIDERED FOR ECONOMIC ANALYSIS
ApproximateQuantity of Plant Design Quantity of No. of ShiftsRefuse Generateda Capacityb Refuse Burned Operated(tons/day) (tons/day) (tons/day)c(tons/year) (shifts/day)
6 7 6.3 1,499 117 20 18 4,140 242 50 45 10,350 385 100 90 20,700 3
&Quantity generated 260 days/year (5 days/week, 52 weeks/year).
b lant operates at 90% of design capacity.
cQuantity 1,urned during each of the 230 days in a year that the unit
operates.
A-30
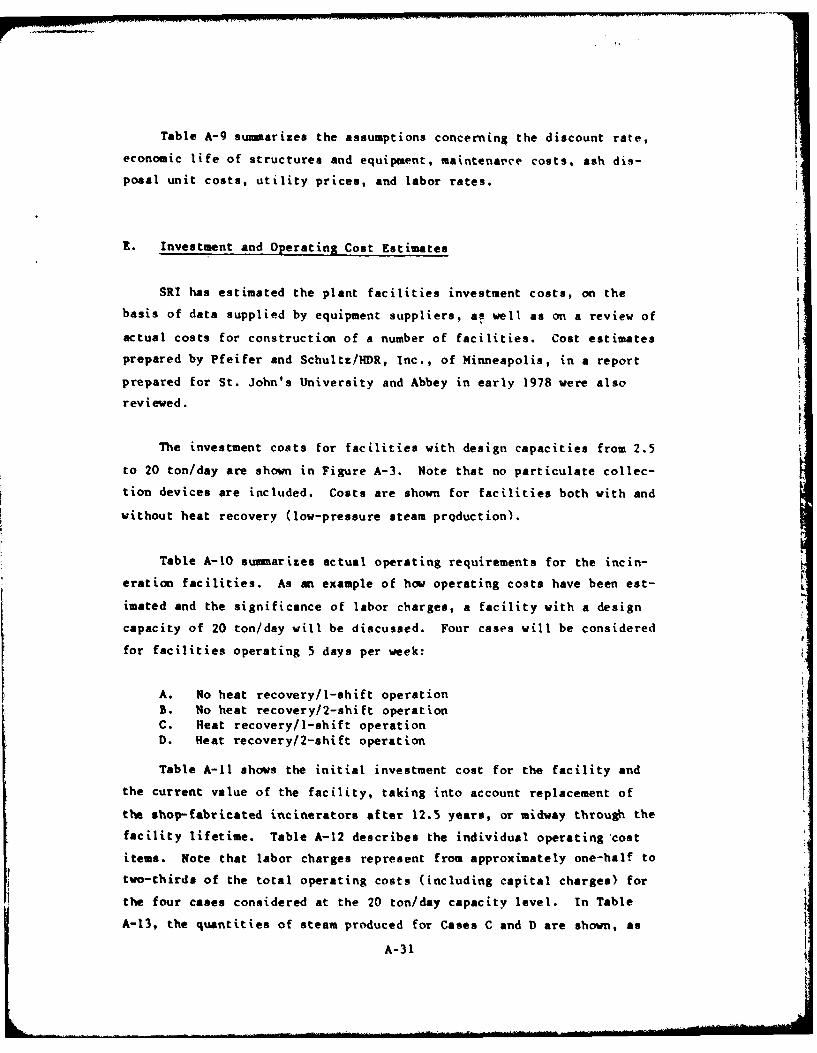
Table A-9 summarizes the assumptions concerning the discount rate,
economic life of structures and equipment, maintena'ce costs, ash dis-
posal unit costs, utility prices, and labor rates.
E. Investment and Operating Cost Estimates
SRI has estimated the plant facilities investment costs, on the
basis of data supplied by equipment suppliers, as well as on a review of
actual costs for construction of a number of facilities. Cost estimates
prepared by Pfeifer and Schultz/HDR, Inc., of Minneapolis, in a report
prepared for St. John's University and Abbey in early 1978 were also
reviewed.
The investment costs for facilities with design capacities from 2.5
to 20 ton/day are shown in Figure A-3. Note that no particulate collec-
tion devices are included. Costs are shown for facilities both with and
without heat recovery (low-pressure steam prQduction).
Table A-10 suimarizes actual operating requirements for the incin-
eration facilities. As an example of how operating costs have been est-
imated and the significance of labor charges, a facility with a design
capacity of 20 ton/day will be discussed. Four cases will be considered
for facilities operating 5 days per week:
A. No heat recovery/i-shift operationB. No heat recovery/2-shift operationC. Heat recovery/i-shift operationD. Heat recovery/2-shift operation
Table A-Il shows the initial investment cost for the facility and
the current value of the facility, taking into account replacement of
the shop-fabricated incinerators after 12.5 years, or midway through the
facility lifetime. Table A-12 describes the individual operating cost
items. Note that labor charges represent from approximately one-half to
two-thirds of the total operating costs (including capital charges) for
the four cases considered at the 20 ton/day capacity level. In Table
A-13, the quantities of steam produced for Cases C and D are shown, as
A-31
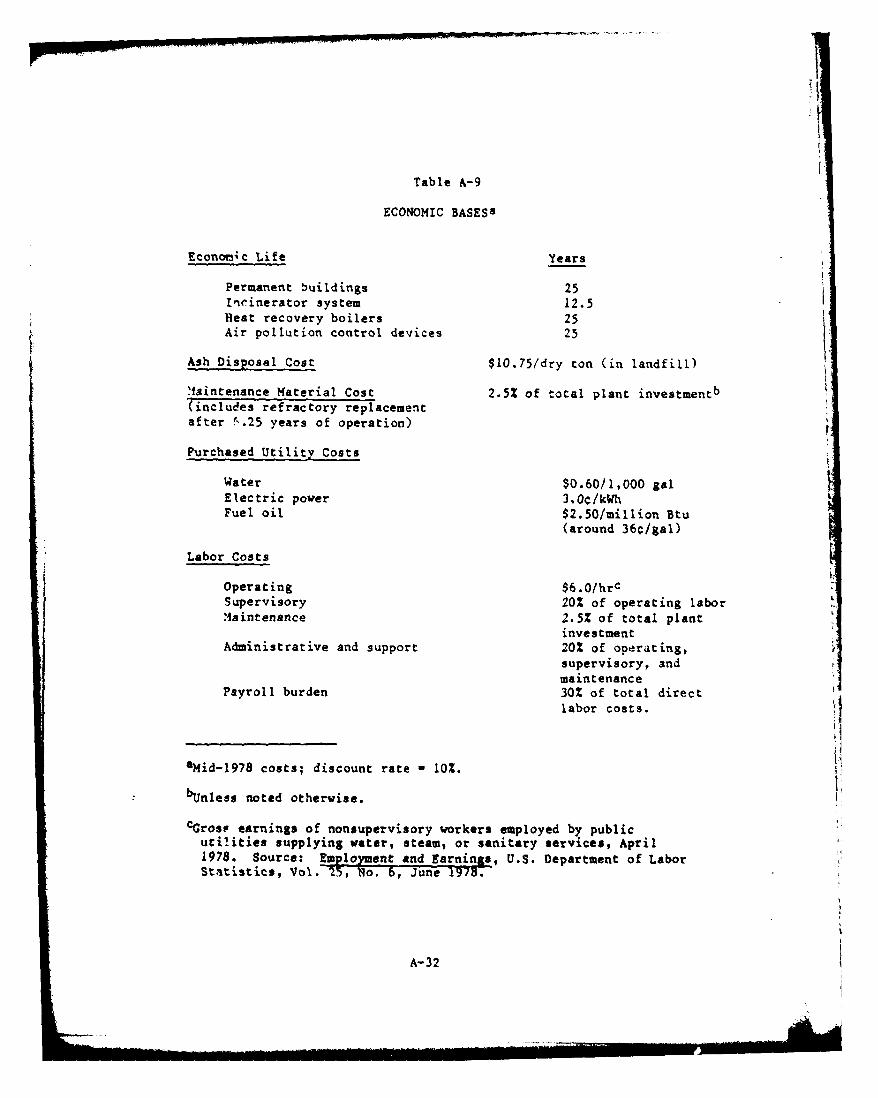
Table A-9
ECONOMIC BASES&
Econonmc Life Years
Permanent buildings 25Incinerator system 12.5Beat recovery boilers 25Air pollution control devices 25
Ash Disposal Cost $10.75/dry ton (in landfill)
'faintenance Material Cost 2.5% of total plant investmentb(includes refractory replacementafter v. 2 5 years of operation)
Purchased Utility Costs
Water $0.60/1,000 galElectric power 3.0c/kWhFuel oil $2.50/million Btu
(around 36c/gal)
Labor Costs
Operating $6.0/hrcSupervisory 20% of operating laborMaintenance 2.5% of total plant
investmentAdministrative and support 20% of operating,
supervisory, andmaintenance
Payroll burden 30% of total directlabor costs.
aMid-1978 costs; discount rate 1 10%.
bUnless noted otherwise.
CGrosp earnings of nonsupervisory workers employed by publicutilities supplying water, steam, or sanitary services, April1978. Source: Emloyment and Earnings, U.S. Department of LaborStatistics, Vol. 25, No. 6, June 1978.
A-32
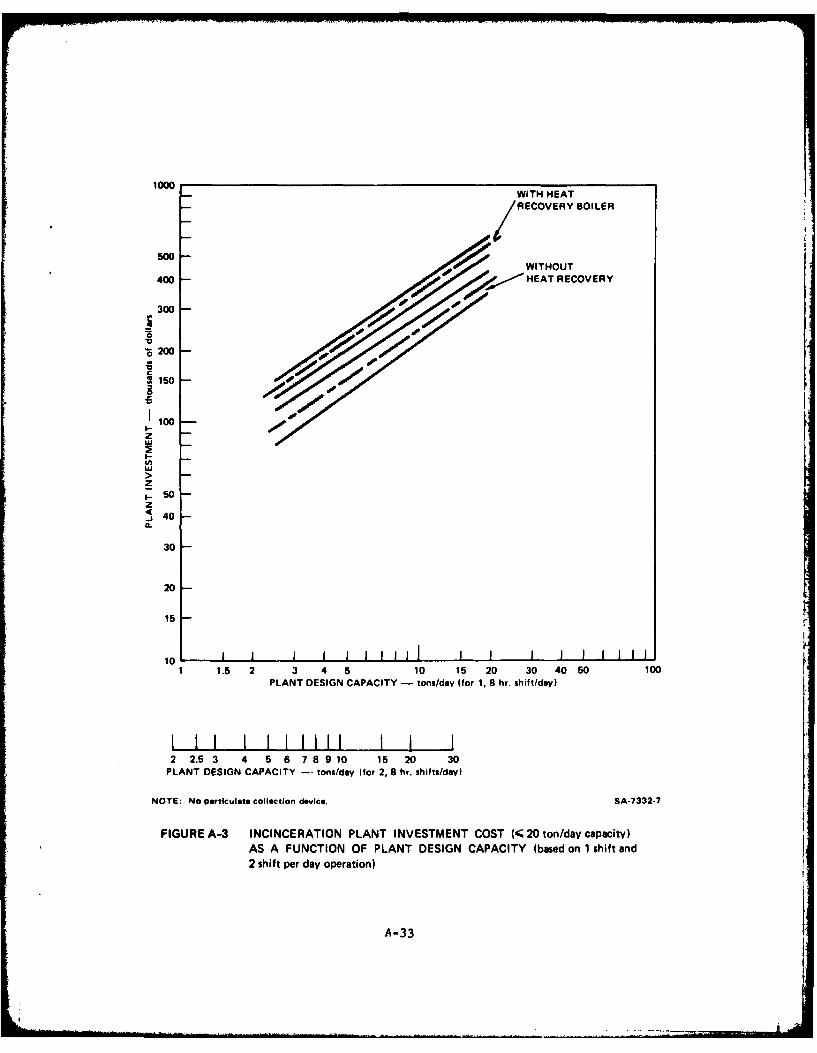
1000WITH HEATRECOVERY BOILER
500
400 -HEAT RECOVERY
300
*0 200
3 150
100100z
wuz1.- 50z
40
30
20
15
10 1.5 2 3 4 5 10 15 20 30 40 50 100
PLANT DESIGN CAPACITY - tons/day (for 1, 8 hr. shiftiday)
2 2.6 3 4 5 67 8 910 15 20 30PLANT DESIGN CAPACITY -- tons/day (for 2, 8 hr. shifts/day)
NOTE: No particulate collection device. SA-7332-7
FIGURE A-3 INCINCERATION PLANT INVESTMENT COST (< 20 ton/day capacity)AS A FUNCTION OF PLANT DESIGN CAPACITY (based on I shift and2 shift per day operation)
A-33
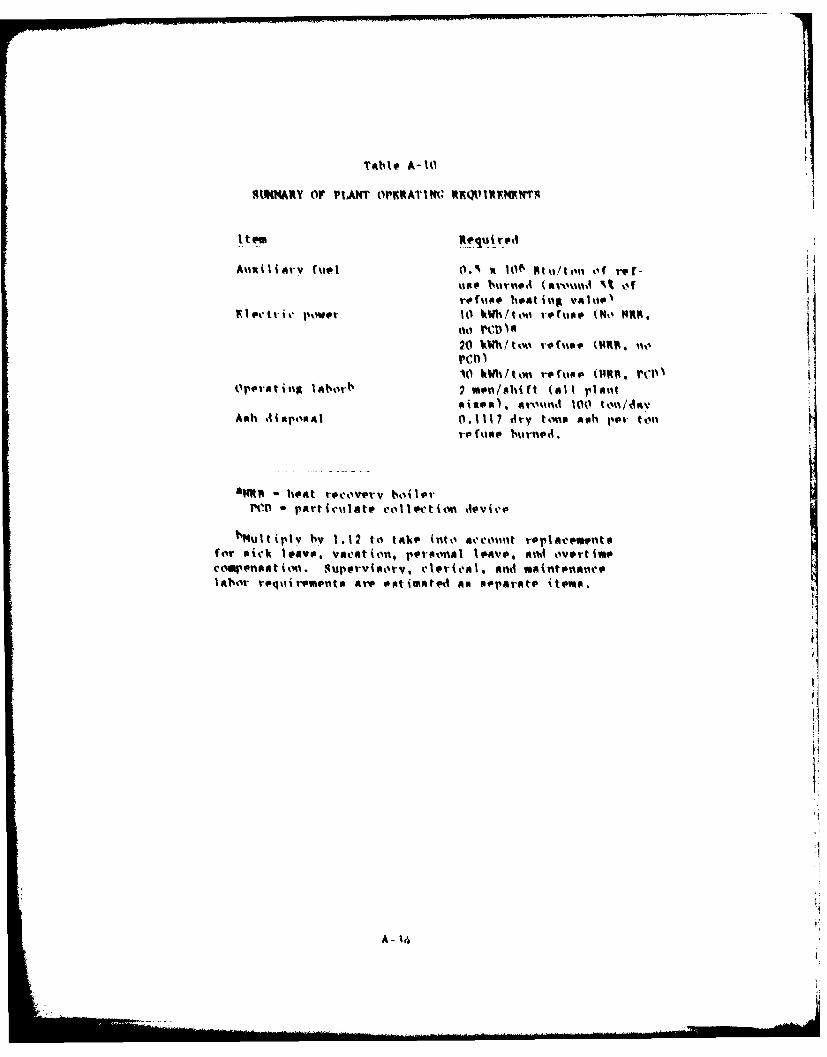
gt*MARY OF PIANT OPIKKATlti ING ~ N'
ror%100 heat in valklo)
Elp% tvi p"Wor20 kWh/t%%i vetON.e UUw. 14noPC Is
OpelrAtin~ labiirb 2 men/shi ft WaIlrlantmitoo), Aro'und j00tnda
A~h ~sr~sal0.1117 dry toins Aph 1,e1 to"n
Im"RA~ heat t-ecowery boilorPCI) particuilato coloct ion device
Ib14utiplv hy 1.12 to take into accouint vrlacementsfor sick leave, vacation, prtsonal loave, and overtimecoispoeat in. 1,4upevimorv, clerical, andi maintenanelab'or req~iiromonto are estimated as separAte it#%*,
A - 14
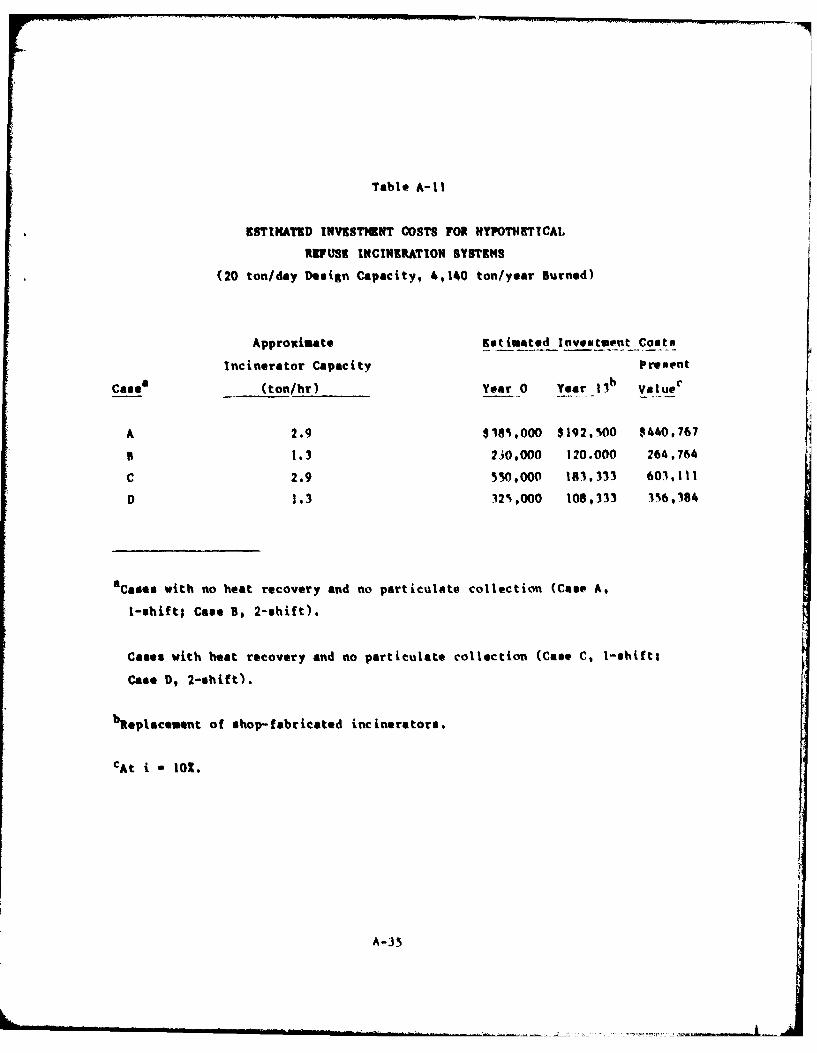
Table A-1I
ESTINATED INVESTIMNT COSTS FOR RYPOTHETTCAL
REFUSE INCINERATION SYSTEMS
(20 ton/day Design Capacity, 4,140 ton/year Burned)
Approximate Est imated Investment Cost@
Incinerator Capacity Prement
Case s (ton/hr) Year 0 Year 13b Valuec
A 2.9 $185,000 $192,500 $440,767
B 1.3 230,000 120.000 264,764
C 2.9 550,000 18,333 603,111
D 1.3 32S,000 108,333 356,.64
aCases with no heat recovery and no particulate collection (Case A,
I-shift; Case B, 2-shift).
Cases with heat recovery and no particulate collection (Case C, i-shift,
Case D, 2-shift).
bReplacesent of shop-fabricated incinerators.
cAt i lo.
A-35
well as the quantity from a 7-ton/day plant. Table A-14 itemizes the
*stimat'c operating costs for the 7-ton/day facilities, one with and one
without heat recovery.
Without heat recovery included in a 20-ton/day plant, it appears
from the deta presented in Table A-12 that a one-shift per day operation
would be preferable to a two-shift per day operation. Figure A-4 shows
that for a plant with heat recovery, the decision between choosing a one
or two-shift operation is influenced by the value of the steam pro-
duced. Tf the steam has a value of more than $2/10 6 Btu,a the
2-shift operation is more attractive. Almost 25Z more steam can be pro-
duced from a two-shift operation than from a one-shift operation (see
Table A-13.)
For a 7-ton/day plant, Figure A-5 sliaws that steam must have a
value of $3/106 Btu for the heat recovery system to be economically
attractive relative to the unit without heat recovery.
At the 50- and 100-ton/day capacity levels, the incinerator modules
(25-ton/day each) will be designed with automatic ash removal and will
operate 3 shifts per day for 5 days per week. in Table A-15, the esti-
nated operating cost items are listed for plants both with and without
Ca:ric filters for particulate collection. Tables A-16 and A-17 present
the details on the costs for pArticulate collection for facilities with
from 7 to 100 ton/day capacity. All facilities with particulate control
are assumed to have a heat recovery system. The heat recovery system
reduces the flue gas temperature to around 5000F, which is a
fthe ayerage steam value at Navy installations is slightly more than
$4/100 Btu. This figure includes all costs associated with steamoroduction. The value of the steam from an inci neration operation mayonly be equivalent to the fuel component of the $4/106 Btu figure,which is probably $2-$3/106 Btu. The current labor and capital
charge components may be fixed costs that would not change unless the
total steam demand is met by the new incinerator installation.
A-36
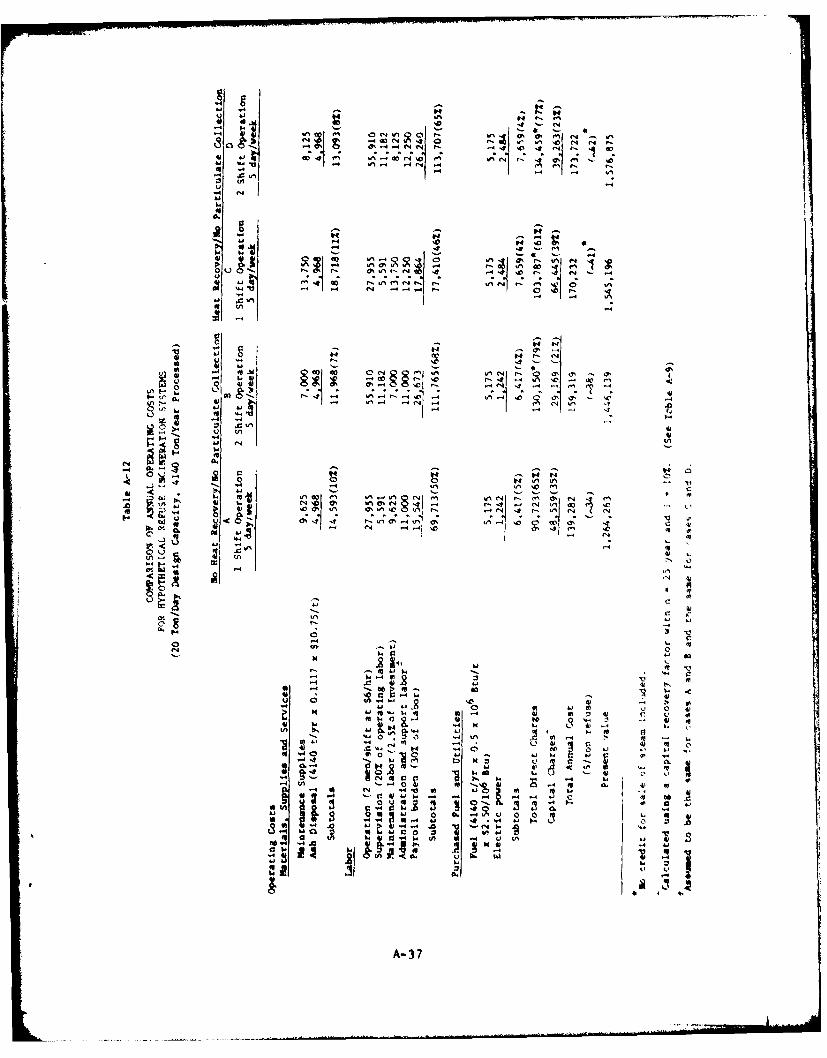
I H4
.4 N
I.I
4,4
o Hj-4 4 ~ b 41-- 44 -
~~Xr4 0 t.4 0.8. A
.41 .- 4 N .441
I .41 '0 r- 4 ~0
IV
A-H
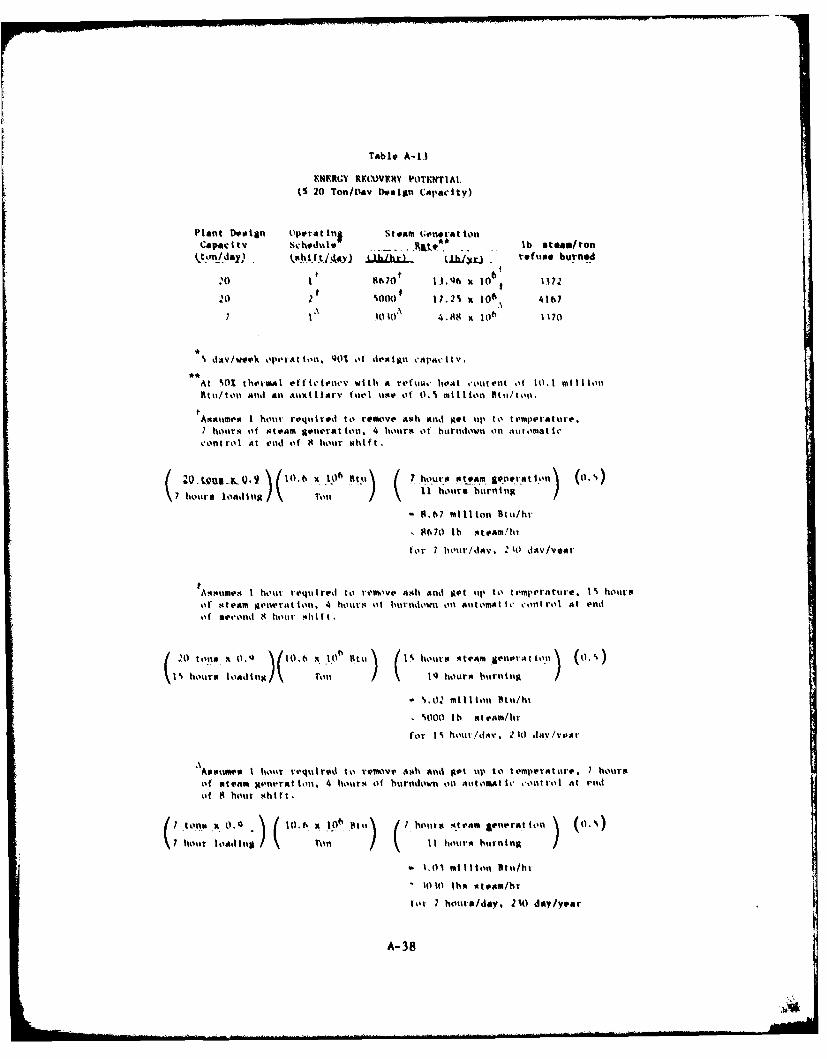
Table A-13
KNtERGY RVA)VVUY I'OThNTIAI.(' 20 Ton/Pav D~msgn Capacity)
P~lant Dopan (eperat in5 steam tGenerat tonCapacity schtedule - -. I l tam/ton
itun/day)oil I~hf1a) .hhL refulso burned
.1 $7 13.96 x 10⁶ 1172
%00( 17.2% x 106 4167
I A 1040 A 4.118 x 10⁶ 17
Sdav/woek ope'ratioti 90 Qolt doi'sIgn c'tlapait v
At S% thermal et ftetiev wttit rvhi(u, lie.-t %cutot ot 10. 1 wtiltlltlitti/ton And all nui ItArv Net time ot 0. % milliion 11tki/too.
Asittmom I hour roqu I ted ill remove alth and get up to te.mperat ure,7 hotirs ot set cam gonorat ion. 4 hotr tit bUrtidown ton nttimat Iccont rol at endt tof A houir 0M.t
wo- 0A Q .LQ9)(10.16 x10⁶ Rtut .7 iiout ustoan l. ineyratfion (t. N)
7 hours loatding Tol ( 1 iitira burning /- 8.67 million i /h
1 8670 Il stcAm!h1
for I hoir /dAv * 21t day /vear
Asittmos I hout requ ired t o remto Ati alud got uip ito teimpoerttre 1% hoursOf Steam MetierAt'lou, 4 houritS tit t)urnt0Wn On atotti t coott rtl lit enidtit Nocond 8 houir .1hill
( 0 tons x 0.0 Q 10.6 x t Bt u (1 hurciengneai \( )
I S hours load Ing /\ Ton /19 furl'urnlng
S .O02 mtitll, A1tli/lit
SO00 lb st enM/hut(or IS hot/dAy, * 2 0 day vest~
~Asklimli I houtr vequ itrod tit rvlvv Asti *%nd got u~p to 1 emprsi re. * 7ournlif at Am soneratt iin 4 hours oit hurndowu n t satit ~it eont to at 1,1,1tit 11 bot shift.
( t na 0 10.6 it l(-19 , iBill hotirs Ateam &eno at on (o )7ho uir loadingl /o n It0 11 4. horq b urining / .S
1,0t1 mill ion Atki/hrt
1010 lbst steam/hr
itot 7houirs/daly, 210 day/year
A- 38
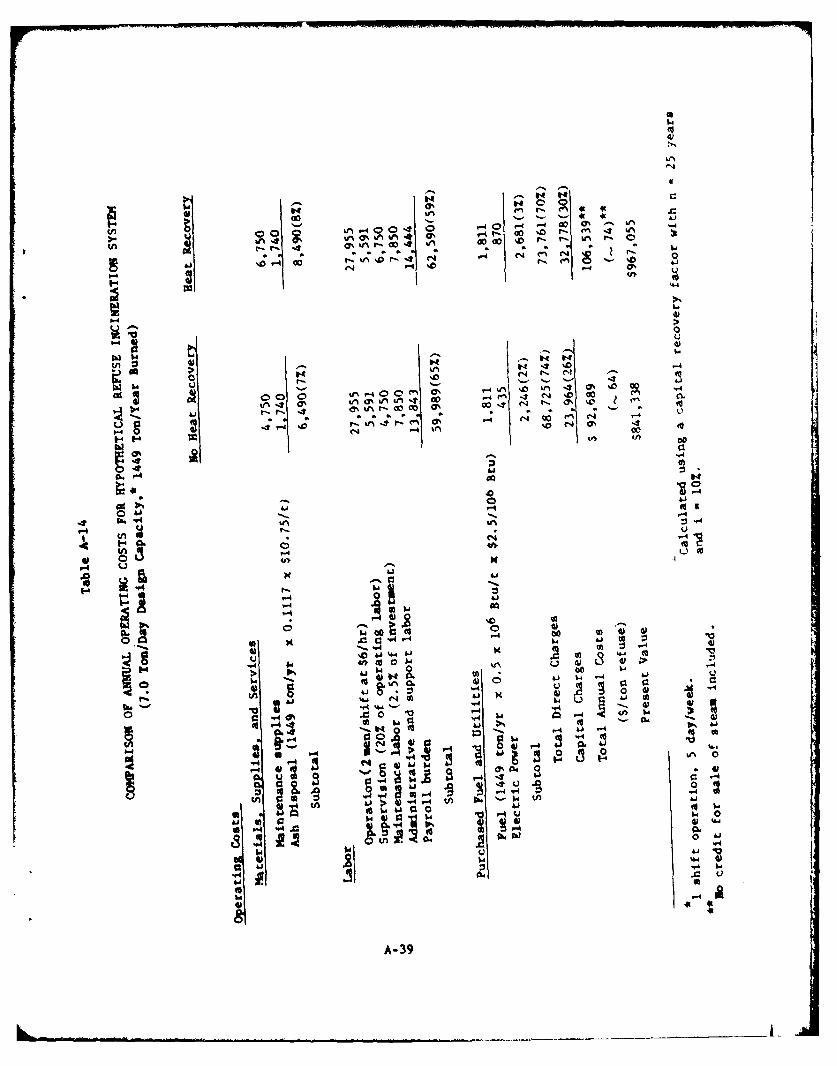
C44
uv
- '0% 0%~~00 P0 N- -~
C4 04~ 00-o - 0~ a ~' -0000 u~ t~.
I 44
C4 00000
.00
-' 0
-~~. 0I-OU . -
-,~f AJ' U'
41 61'S 0 1
tnC 4) -a,
'4 Ali 1 4
-i *
'a4"414j 441 3'44,-~4 (~
0 0 .A-39
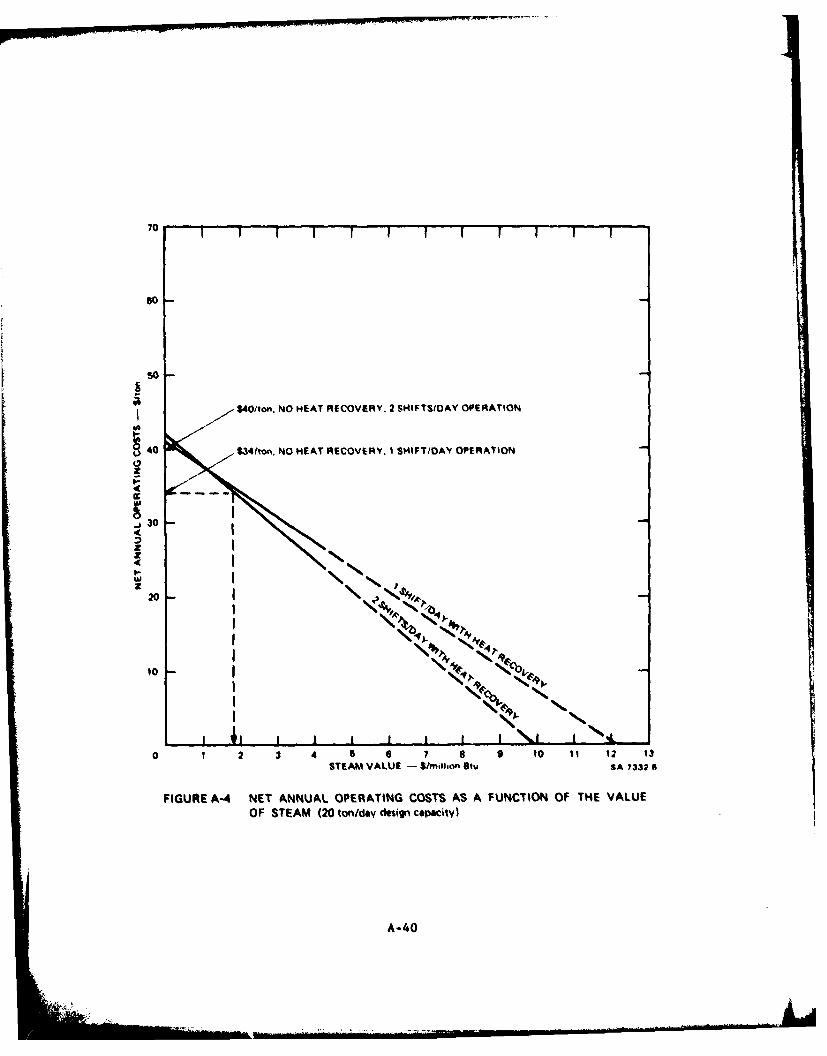
70
so
so
$40/to.'. NO HEAT RECOVERYV. 2 SHIFTSIOAY OPER~ATION
S40 S34fto.'. NO HEAT RECOVERY.,I smir-T/DA' OPERATION
j 30
44
4CIO
I~~ , I
0 1 2 3 4 5 6 7 8 9 to 11 12 13
STEAM VALUE - S/milh on Btu SA 1332 6
FIGURE A-4 NET ANNUAL OPERATING COSTS AS A FUNCTION OF THE VALUEOF STEAM (20 ton/day design capacity)
A -40
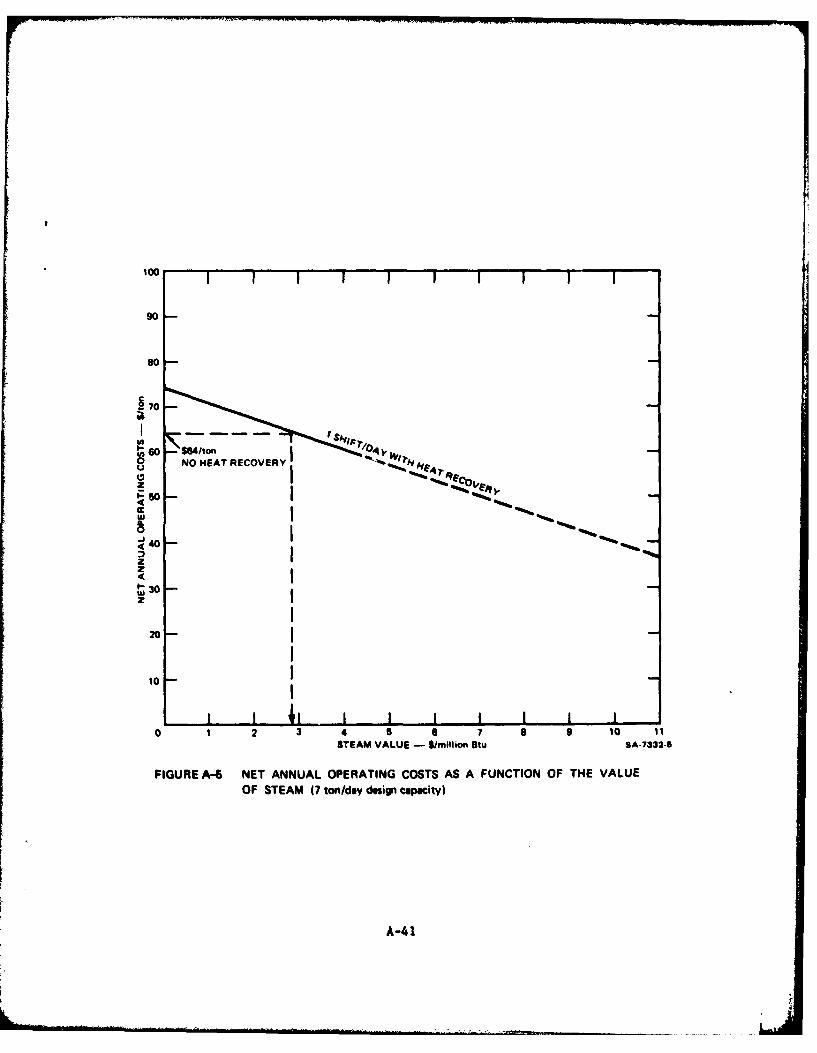
100
90
so
70
~60 $64/iw' V
30
10
.j 40I
A-0
0 1 3 4 5 6 7 9 0 1
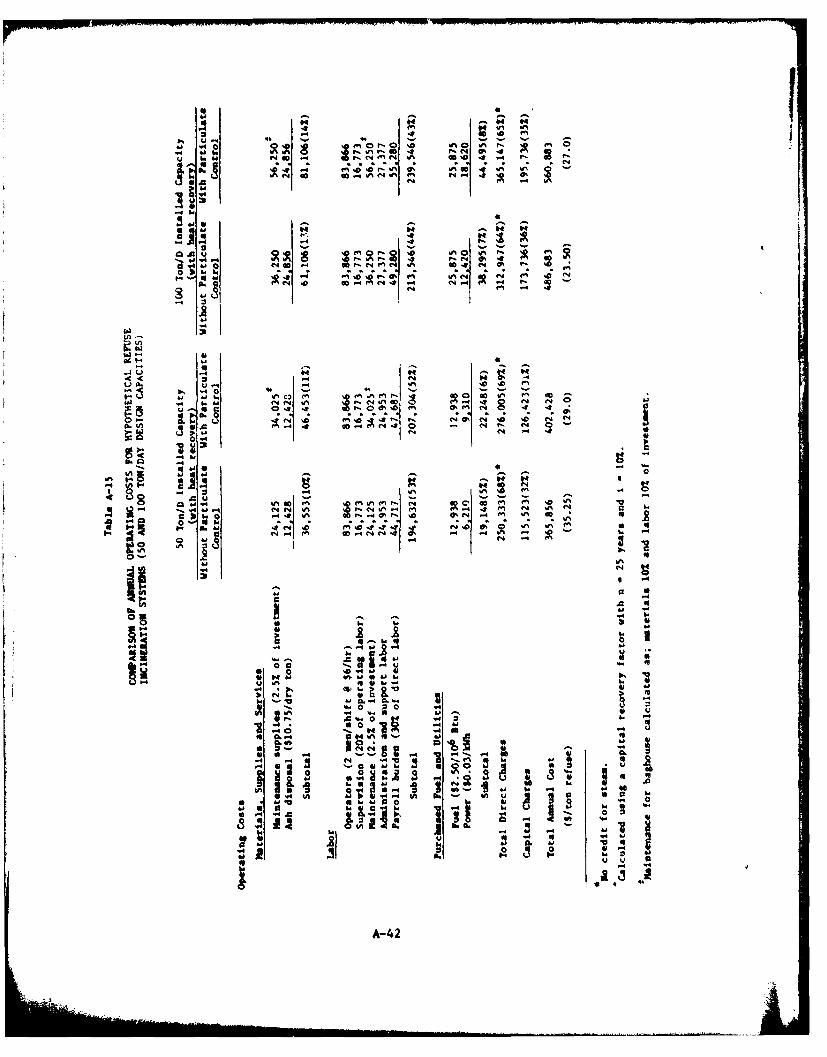
40 I 4v
4 14 -4 14
In U -1 ]041 .4 ~ 04 PU rN % r 4 .
44 .- i r, t.4* fn 40. 4 a,1Z iN I-4 e
- 4C4
I4 (4 A <4 -A 00 A
-0 .J 4ONa
f , @ 4 4V N,
f4 WN M
N..4
41 b 1'4z 0
-4 s 0 NO'06 "
U4 4 0
b. 8.44~ 4
C~ 0.N@4 .0 0 ND
4 a A-4'
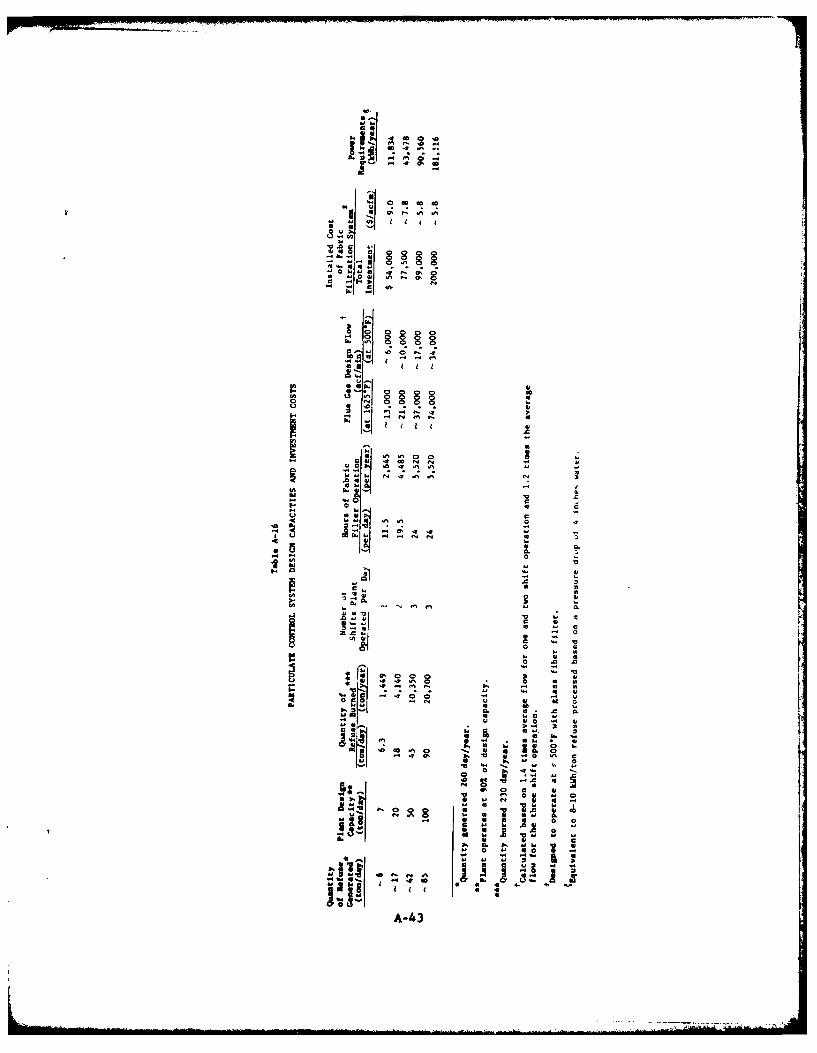
-. (
10 Its, Q
I3IN,
41.1
~oGo10,
v to
4 0
0, w SOD1
UA-4
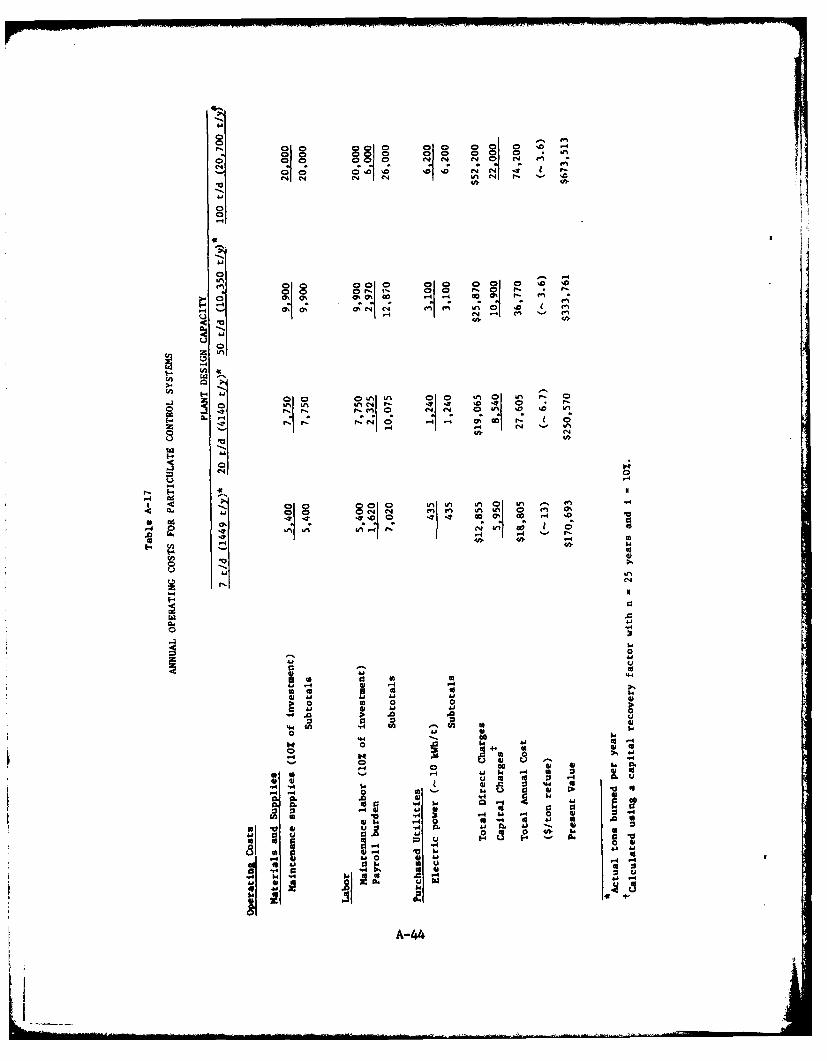
00
Q. V.
4
(n
4.8
Ole 4&
00~ ZU4
I-0
0 to.
4)'4
4- 14 41
4~_ .4JI w~. n4I 0 r4 0
CL C6 4401 t
.0 0 j I ."U~4 w.t I4 I Aj~ 4
u- (Ulo 4
wn 41
A0. 4
A-448
tolerable temperature for the fabric filter.& Filter material will
have to be chosen to resist burning carbon particles that may be emitted
from the secondary combustion chamber.
Table A-18 shows the estimated quantities of steam to be generated
by the 50- and 100-ton/day facilities. Figure A-6 illustrates boy the
net annual operating costs are affected by the value of the steam.
F. Comparison of Investment and Operating Costs for Small and Larpe
Facilities
In discussions of resource recovery facilities, the investment
costs are coonly examined in terms of dollars per ton of daily capa-
city as a function of the plant capacity. One such comparison for large
capacity systems (greater than 400 ton/day) is shown in Figure A-7.
Depending on the size and types of process employed, an energy produc-
tion operation may require an investment of from $30,000 to veil in ex-
cess of $50,000 per ton of daily capacity. These facilities are all
especially designed field-erected units.
Figure A-8 has been prepared on the basis of data presented in this
study. The investment costs per ton of daily capacity are far below the
figures previously mentioned, primarily because of shop fabrication of
equipment, no preprocessing, and low-pressure steam production. If one
were to consider addition of a shredding operation at the 100-ton/day
plant operating one shift per day,b the incremental investment
a400 -4 50O 7 may be a safer temperature range to ensure acceptable
fabric life.
bShredders for SW are limited to a certain minimum size
because of feed opening requirements. Units are not generallysupplied with capacities below I to 20 tons/hr.
A-45
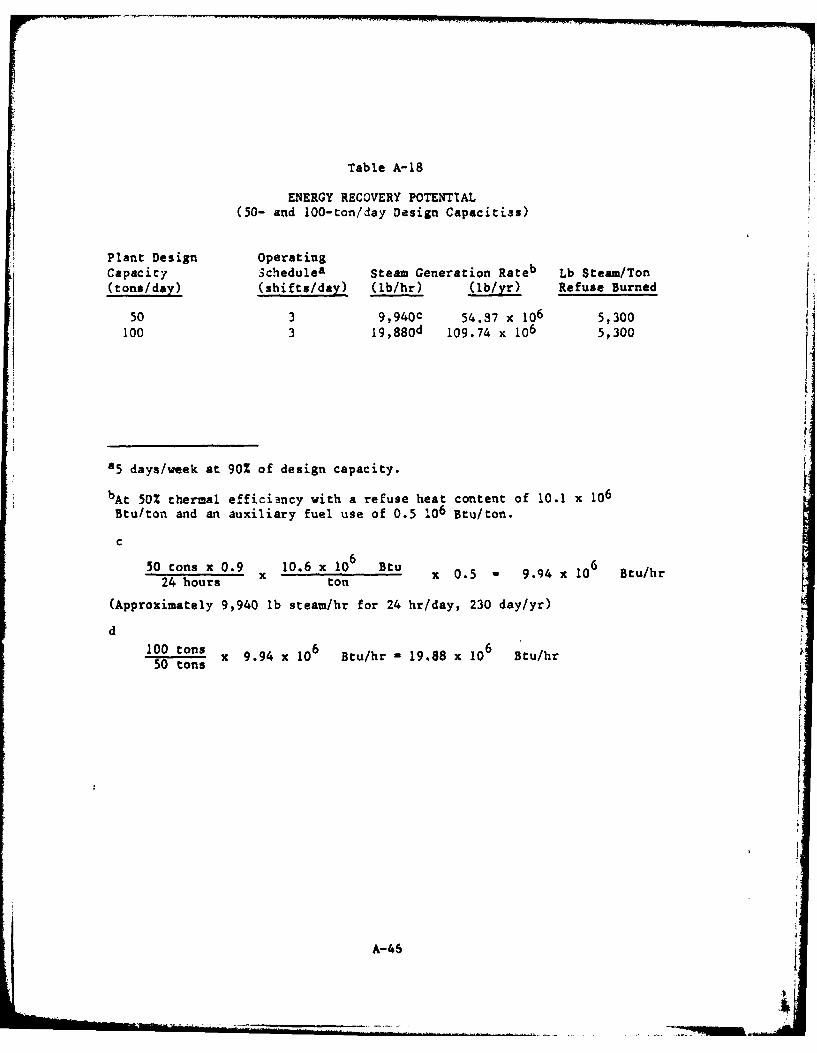
Table A-18
ENERGY RECOVERY POTENTIAL(50- and 100-ton/day Design Capacitias)
Plant Design OperatingCapacity 3chedulea Steam Generation Rateb Lb Steam/Ton(tons/day) (shifts/day) (lb/hr) (lb/yr) Refuse Burned
50 3 9,940c 54.37 x 10⁶ 5,300
100 3 19,8 80 d 109.74 x 10⁶ 5,300
a5 days/week at 90% of design capacity.
bAt 50% thermal efficiancy with a refuse heat content of 10.1 x 10⁶
Btu/ton and an auxiliary fuel use of 0.5 I06 Btu/ton.
C
50 tons x 0.9 10.6 x 10⁶ Btu 624 hours x ton x 0.5 = 9.94 x 10 Btu/hr
(Approximately 9,940 lb steam/hr for 24 hr/day, 230 day/yr)
d100 tons -18
50 tons x 9.94 x 10⁶ Btu/hr 19.88 x 10⁶ Btu/hr
A-46
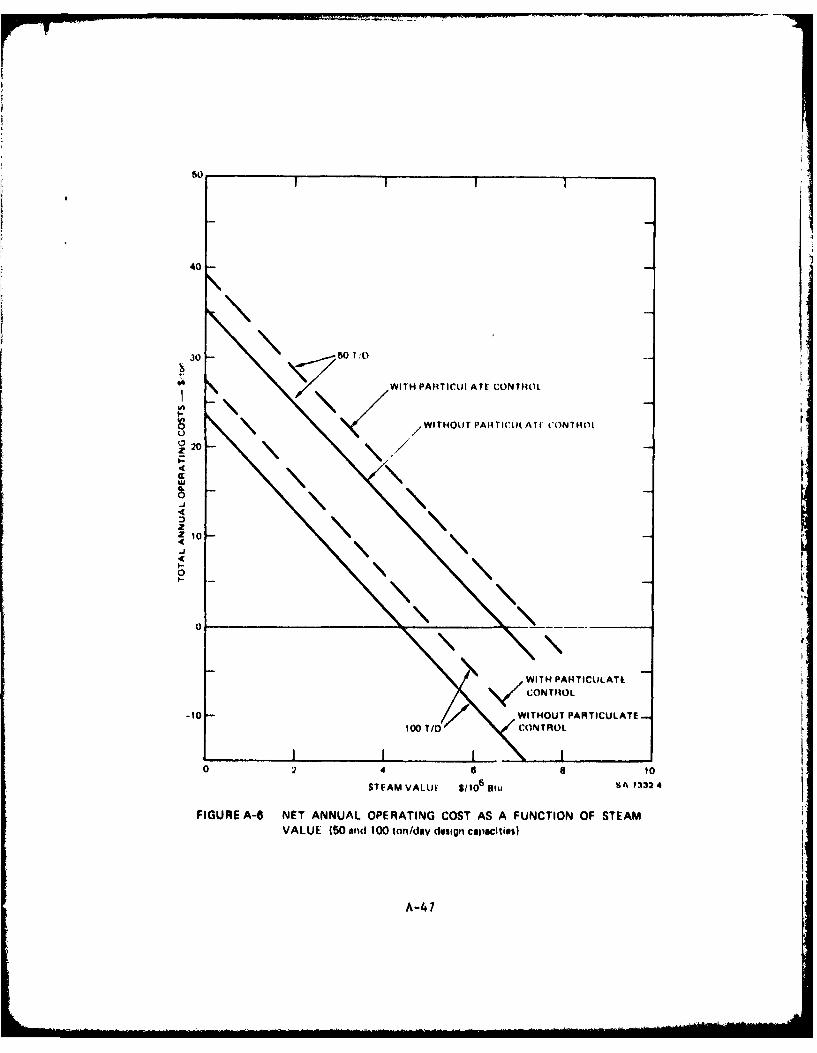
50
40
30 5 ;0 1.,
e liD WITH PARTICUI ATE CONTHIL V
In . WITHOUT PARATIClAI CoN11oI
20
4
z 1
\ \O
WITH PARTICILATECONTRtOL
-10- SJWITHOUT PARTICULATE100 TI CONTROL
2 4 68 0
STFAM VALUI S/10 Blu SA 1332 4
FIGURE A-6 NET ANNUAL OPERATING COST AS A FUNCTION OF STEAMVALUE (50 and 100 ton/da design capacities)
A-47
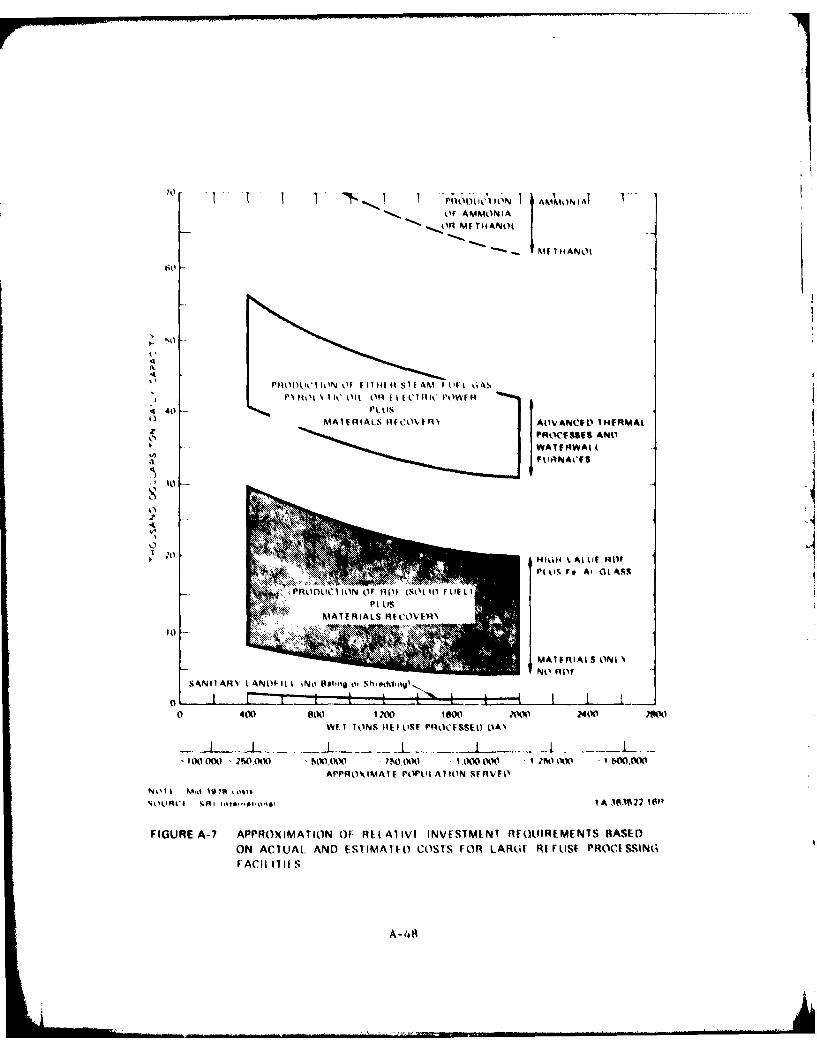
I~ ~~ KA10 I Al I PCLU1O 1NIF IHANi)1tit
So
1 140)It'll ION OF F 11041 It Sl I AM 0 Of~ I OAS
4 0-MATERIALS 14FOV" At(ANCFL'w THFRMAL
z PROCESSES ANLO
WATREPWAI'FUR~1NACE S
0
A
11t 7. F A' GI, Ass
MAI F IAL S ONL N
NO AL~VSANI I ARN' L AN01- ItLL i~ fRaino oShod-
0 400 80K) 1200 1600 ^141 24041 2m)WE I I oNS 1f4LF uSQ PR CESSEO OAN
- I oi 000 2W~.000I hiNI00 n~0.001 FA0000 I M I0 WSW0
APPROXIMATE P(WI'L Al ION SIFFVIEL~
N.011 i l
%01,1141I R it e.,a IA 3611,22 If~ll
FIGURE A-7 APPROXIMATION OF2 Rl Al IVt INVESTMENT RIOUIREMENTS BASEDON ACTUAL AND EStIMATI:) COSTS F2OR LARGIF RE rUISt PROC(SSIN6FACII 1711 S
A -4
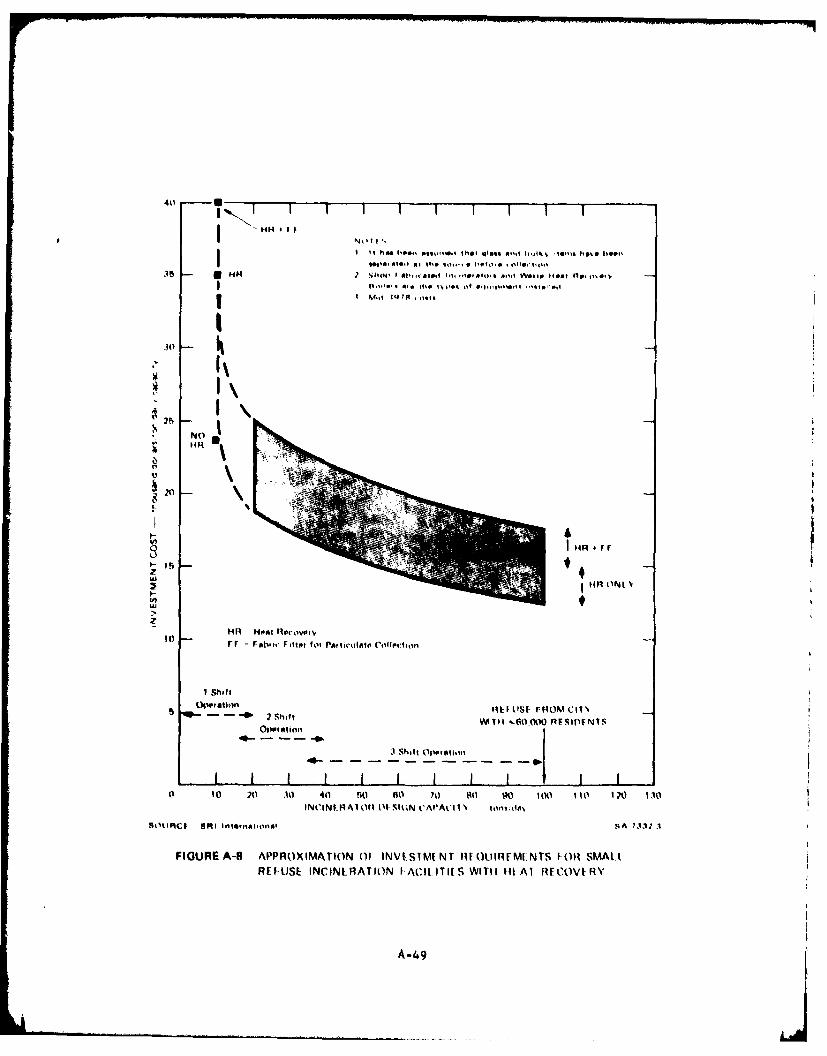
40 -
NH'O II
I I his 110, e g... lid,.i~ that ati,, aslid 1-lki 10... s .e,150,
II30
No
H4R r
10
I ShiftL'
Opsiom RE1FUSU FE4OMICI1"- - ~ ~Mti4 '.60 00 RESIDENTS
3 Siftt Oiwoion
0 10 20 30 40 !50 60 70 AO go0 100 If( 170 1,10INCINE RAI of% M) SIkiN C'AI'ACI I N ovo
stitict ISRI lttrhdltsA 7.31~ 1
FIGURE A-8 APPROXIMATION OP1 INVI-STMI NT MU OLIRMMUNTS FO08 SMALLRE-USE INCINLRATION fACII ITII S WITH tit Al HFCOVt HY
A-49
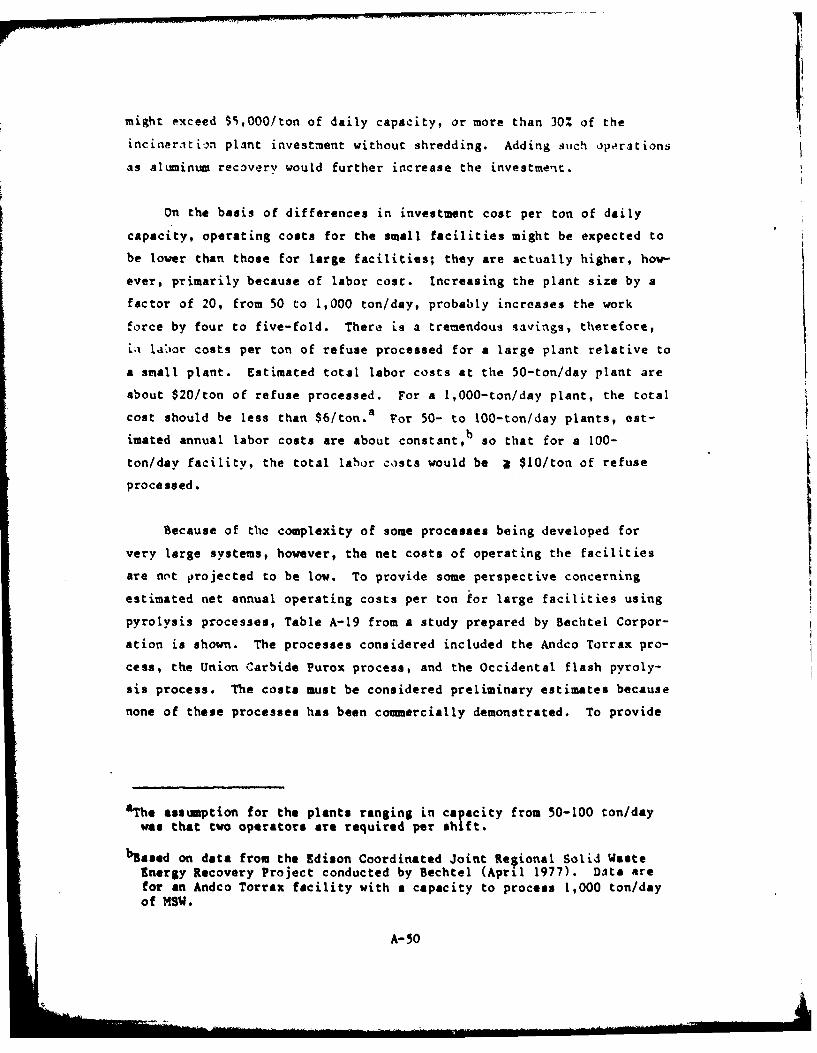
might exceed S,0O0/ton of daily capacity, or more than 30% of the
inciner.itc-n plant investment without shredding. Adding such operations
as aluminum recovery would further increase the investment.
On the basis of differences in investment cost per ton of daily
capacity, operating costs for the small facilities might be expected to
be lower than those for large facilities; they are actually higher, how-
ever, primarily because of labor cost. Increasing the plant size by a
factor of 20, from 50 to 1,000 ton/day, probably increases the work
force by four to five-fold. There is a tremendous saviigs, therefore,
i i lai'or costs per ton of refuse processed for a large plant relative to
a small plant. Estimated total labor costs at the 50-ton/day plant are
about $20/ton of refuse processed. For a 1,000-ton/day plant, the total
cost should be less than $6/ton.a For 50- to 100-ton/day plants, est-
bimated annual labor costs are about constant, so that for a 100-
ton/day facility, the total labor costs would be i $10/ton of refuse
processed.
Because of the complexity of some processes being developed for
very large systems, however, the net costs of operating the facilities
are not projected to be low. To provide some perspective concerning
estimated net annual operating costs per ton for large facilities using
pyrolysis processes, Table A-19 from a study prepared by Bechtel Corpor-
ation is shown. The processes considered included the Andco Torrax pro-
cess, the Union Carbide Purox process, and the Occidental flash pyroly-
sis process. The costs must be considered preliminary estimates because
none of these processes has been commercially demonstrated. To provide
5The assumption for the plants ranging in capacity from 50-100 ton/daywas that two operators are required per shift.
baseed on data from the Edison Coordinated Joint Regional Solid Waste
Energy Recovery Project conducted by Bechtel (April 1977). Data Arefor an Andco Torrax facility with a capacity to process 1,000 ton/dayof MSW.
A-50
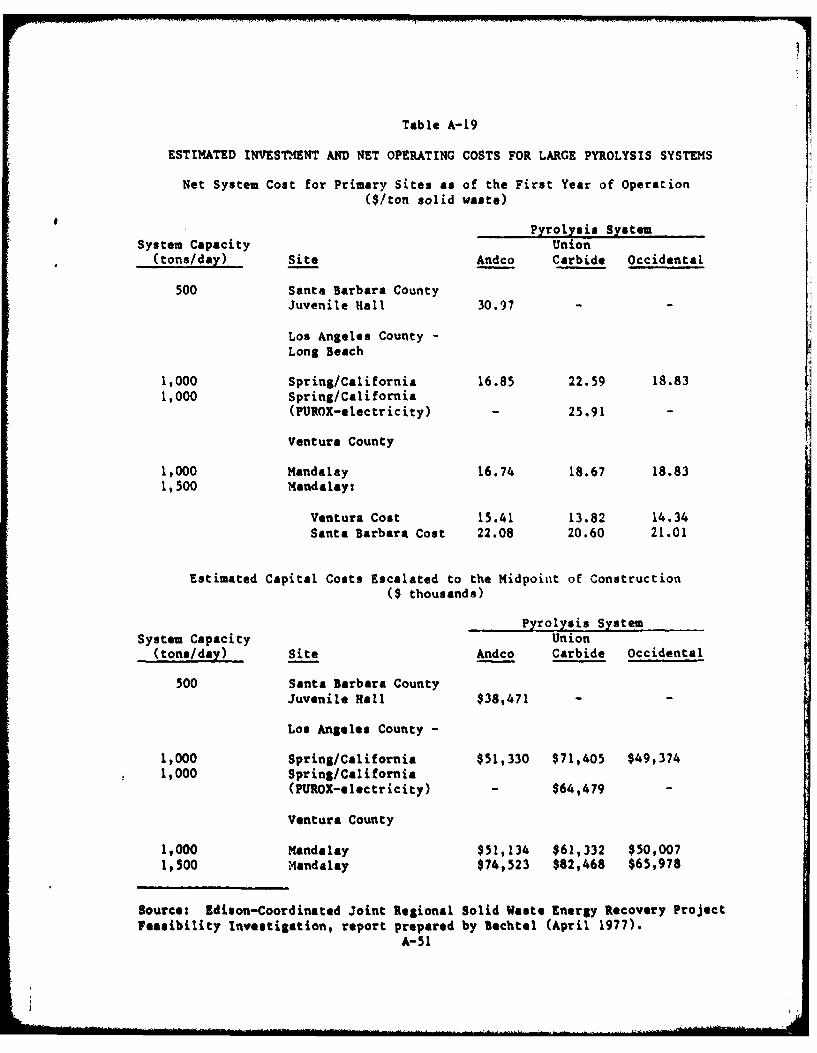
Table A-19
ESTIMATED INVESTMENT AND NET OPERATING COSTS FOR LARGE PYROLYSIS SYSTEMS
Net System Cost for Primary Sites as of the First Year of Operation($/ton solid waste)
Pyrolysis SystemSystem Capacity Union
(tons/day) Site Andco Carbide Occidental
500 Santa Barbara CountyJuvenile Hall 30.97
Los Angeles County -
Long Beach
1,000 Spring/California 16.85 22.59 18.831,000 Spring/California
(PUROX-electricity) - 25.91 -
Ventura County
1,000 Mandalay 16.74 18.67 18.831,500 Mandalay:
Ventura Cost 15.41 13.82 14.34Santa Barbara Cost 22.08 20.60 21.01
Estimated Capital Costs Escalated to the Midpoint of Construction($ thousands)
Pyrolysis System
System Capacity Union(tons/day) Site Andco Carbide Occidental
500 Santa Barbara CountyJuvenile Hall $38,471 -
Los Angeles County -
1,000 Spring/California $51,330 $71,405 $49,3741,000 Spring/California
(PUROX-electricity) - $64,479 -
Ventura County
1,000 Mandalay $51,134 $61,332 $50,0071,500 Mandalay $74,523 $82,468 $65,978
Source: Edison-Coordinated Joint Regional Solid Waste Energy Recovery Projectfeasibility Investigation, report prepared by Bechtel (April 1977).
A-51
demonstrated. To provide some perspective on the costs for a proven
process such as a Von Roll water-vall incineration facility (producing
steam), the Saugas, Massachusetts, facility requires a tipping fee of
approximately $15/ton of refuse. It appears unlikely that the Navy will
be able to send refuse to large resource recovery facilities located
near Navy operations for much less than a tipping fee of $10/ton. In
many cases, the fee will be considerably higher than this, and a signi-
ficant hauling fee may also be required to transport the refuse to the
facility.
G. Summary of Findings
Figures A-9 and A-10 summarize the results of the economic analy-
sis. The net annual operating costs are plotted as a function of plant
design capacity and steam value. Figure A-9 presents costs for facili-
ties without fabric filters for particulate control and Figure A-10
illustrates costs for facilities vith fabric filters.
A-52
.........
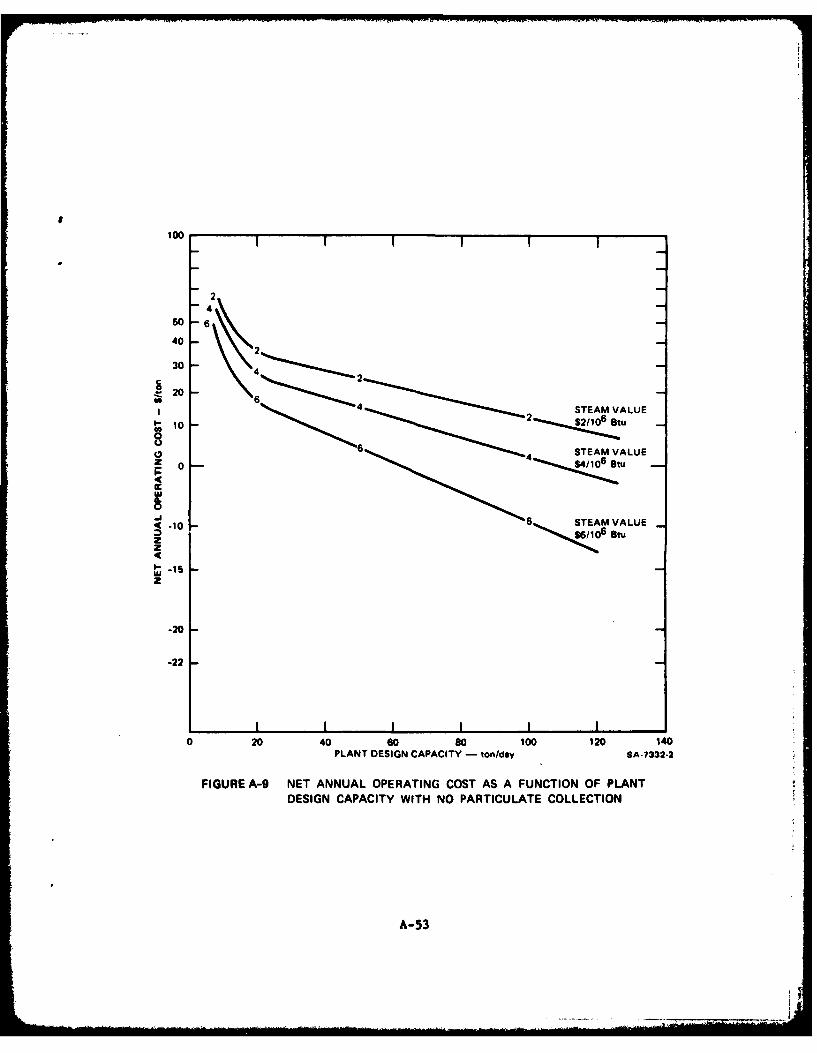
100
40
30
204 STEAM VALUE
22
44
-10 6 STEAM VALUE
I--15z
-20
-22
0 20 40 60 s0 100 120 140PLANT DESIGN CAPACITY - ton/day SA-7332-2
FIGURE A-9 NET ANNUAL OPERATING COST AS A FUNCTION OF PLANTDESIGN CAPACITY WITH NO PARTICULATE COLLECTION
A-53
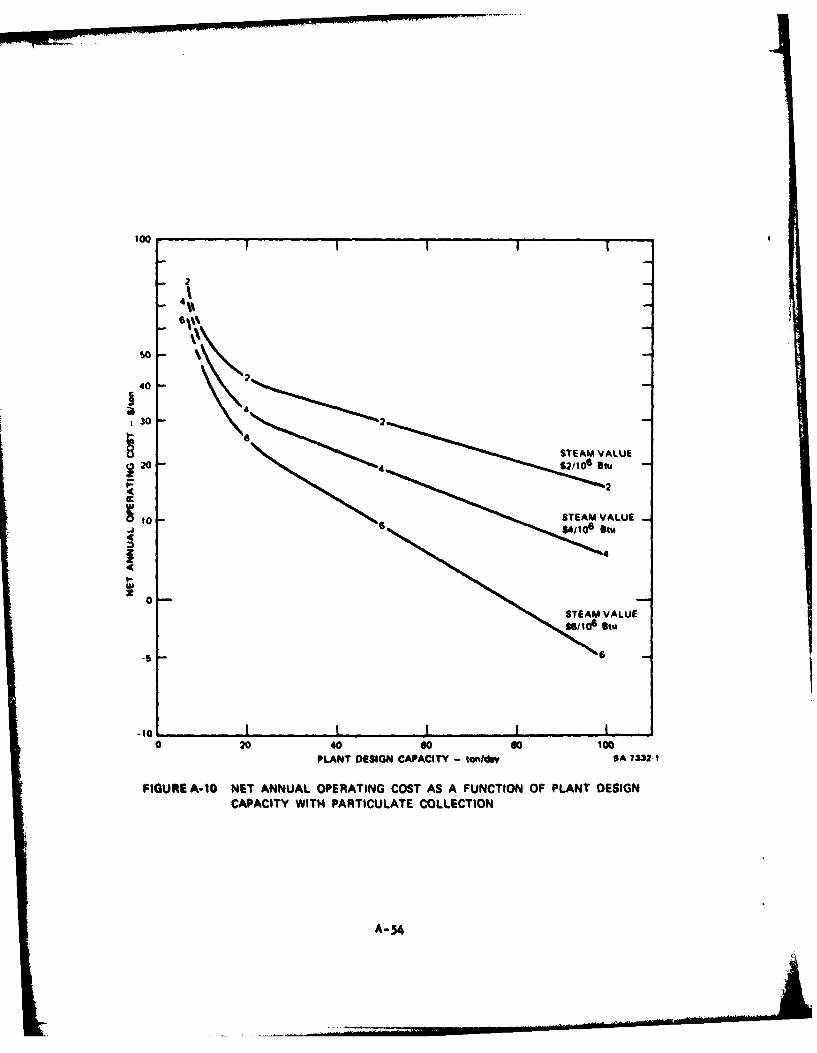
too
2
4'
61%~
40
~30 - 2
~22
10-6SEA AU
0
-6
0 20 40 so so 100PLANT DESIGN CAPACITY - So/d A 7332W
FIGURE A-10 NET ANNUAL OPERATING COST AS A FUNCTION OF PLANT DESIGNCAPACITY WITH PARTICULATE COLLECTION
A-54
V FUTURE RESEARCH NEEDS
On the basis of the findings of this study of shop-fabricated
incinerators, ye have identified the following topics as possible sub-
jects for further research and evaluation by the Navy (possibly in coop-
eration with DOE and EPA):
(1) A preliminary technoeconomic evaluation of the O'Connor com-bustor, including a site visit to the 50-ton/day plant inYokohama, Japan.
(2) A preliminary technoeconomic evaluation of a fluidized bedcombustor (preceded only by a tromel) for solid waste combus-tion at Navy installations with more than 50 ton/day of solidwaste.
(3) A study of the operating characteristics, performance, invest-ment, and operating costs for particulate control devices forsmall capacity solid waste combustion units (20 to 200ton/day).
(4) A study of the costs for controlling nuisance odor problems atresource recovery plants by means of scrubbing building venti-lation system exhaust.
(5) A study of possible design improvements for shop-fabricatedincinerators to achieve more complete combustion of fixed car-bon in ash and to achieve better process control.
(6) A continuing review and evaluation of developments in small-scale solid waste conversion unitsp with written reports pre-pared annually on significant design improvement. (Auger bedincinerator development is a possible subject to be included,as well as updates on gasification and pyrolysis units.Identification of developments in Europe with mechanical grateunits is another possible topic.)
(7) A review of Navy solid waste components that if combustedcould result in the emission of significant quantities of non-criteria air pollutants.
A-55


![SummaryMap ward2 [Converted] · 2019-10-01 · MU-2 MU-6 MU-16 MU-14 MU-6 MU-2 MU-20 MU-9 MU-4 MU-13 MU-15 MU-13 MU-16 MU-18 MU-22 MU-19 MU-16 MU-27 MU-4 MU-3A MU-17 MU-13 MU-4 ...](https://static.fdocuments.in/doc/165x107/5f5e4f591750d150e9633369/summarymap-ward2-converted-2019-10-01-mu-2-mu-6-mu-16-mu-14-mu-6-mu-2-mu-20.jpg)