UNCLASSIFIED AD NUMBER AD NUMBER ... Experimental Nozzle Coefficients K1 versus Reynolds Number. ....
138
UNCLASSIFIED AD NUMBER AD075184 NEW LIMITATION CHANGE TO Approved for public release, distribution unlimited FROM Distribution authorized to U.S. Gov't. agencies and their contractors; Administrative/Operational Use; Jul 1954. Other requests shall be referred to the Director, Wright Air Development Center, Wright-Patterson AFB, OH 45433. AUTHORITY AFWAL ltr, 5 Jul 1984 THIS PAGE IS UNCLASSIFIED
-
Upload
dinhnguyet -
Category
Documents
-
view
220 -
download
0
Transcript of UNCLASSIFIED AD NUMBER AD NUMBER ... Experimental Nozzle Coefficients K1 versus Reynolds Number. ....
UNCLASSIFIED
AD NUMBER
AD075184
NEW LIMITATION CHANGE
TOApproved for public release, distributionunlimited
FROMDistribution authorized to U.S. Gov't.agencies and their contractors;Administrative/Operational Use; Jul 1954.Other requests shall be referred to theDirector, Wright Air Development Center,Wright-Patterson AFB, OH 45433.
AUTHORITY
AFWAL ltr, 5 Jul 1984
THIS PAGE IS UNCLASSIFIED
'2..'
''D
"-44
itr~l~ ~~>c chnica Inf ormation genc,ti L4t i.'" V
AA.'0T T BI~ULDING, DAYTON, 2, OHIO...-t Available CopyBetAalbeCp
This document is the property of the United StatesGo'ýernment. It is furnished for the duration of the contract and
shall be returned when no longer required, or uponrecall by ASTIA to the following address:
:1.,Armedi Services Technical Information Agency, Document Service Center,Knott Building, Dayton 2, Ohio.
z ~~:WHVP'N GOVERNMENT OR OTHER DRAWINGS, SPECIFICATIONS OR OTHER DATAIb'' tRr~FOR~ ANY PURPO5X" OTHER THAN IN CONNECTION WITH A DEFINITELY RELA
ul!QX-REN PROCUREMENT OPERATION, THE U. S. GOVERNMENT THEREBY INCURS% - ~>JTY, NOR ANY OBLIGATION WHATSOEVER; AND T~r FACT THAT THE!E~t"4' 1AAY HAVE FORWvULATED, FURNISHED, OR IN ANY Wit" SUPPLIED THE~<*iAAVIX~-SPECIFICATIOJ(18, OR OTHER DATA IS NOT TO BE RE*2.,RDED BY
J 0 YIOR(C OTHERWISE AS IN ANY MANNER LICENSING THE HOLD:-R OR ANY0H,SC~ ~RCOXrPORATION, OR CONVEYING ANY RIGHTS OR -PERMISSION TO MANUFACT
i ~ ~ I itli nY PATENTED 15VENTION THAT M4AY IN ANY WAY BE~ RELATED THERE
F4--
'-' ~-~Clow
WADIC 'rECH7N, CAL REPORT 55-143
THE JET PUM '* AS A LUBRICATION OIL SCAVENGE PUMPFOR AIRCRAFT ENGINES
RICHARD G. CUNNINGHAM
DEPARTMENT GA ,I',GINEERING RESEARCH
THE PENNSYLVANIA STATE UNIVERSITY
JULY 1954
WRIGHT AIR DEVELOPMENT CENTER
FOREWORD
This report was prepared by the Department of Engineering Re-search of the Pennsylvania State University under Contract No. AF33.(616)-436. The work covered in this program was under the super-vision of Mr. 0. 9. Miller, Mr. O. B. *orter, and Lt. 3. 3. Dieclmannof the Power Plant Laboratory, Directorate of Laboratories, WrightAir Development Center, Lt, Dieckananu was the last supervisor.
The jet pump study as contained in this report is one phase ofthe overall aircraft lubrication system work done by ftnosylvaniaState Universitya The work was conducted under RDO No. 534-115A,SClosed Circuit High Altitude Turbojet Angine Oil System,' later
redesignated Project No, 3060, 'Engine Lubrication Subsystem.'
WADG TB 55-3-43
/1
ABSTRACT
A study v~s iide of the oil jet pump, in particular the possibilityof application as a, scavenge pump for aircraf't engines. 'Three rajorproblems treated in the theoretical and experimental investigations ares(a) effect of high viscosity3 (h) cavitation and altitude ceiling character-istics; and (o) behavior with an air-oil mixture inducted at the auctionports
Au analytical expression is developed which describes pump perfor-rance in dimensionless tormes a flow ratio, a pressure-difference ratio#the nozzle to throat area ratiol and two friction loss coefficients.,
Oil jet pump efficiency is of the order of 25 per cent at high. jetReynolds numbers (RK A 10,,000 to 30,000) and "decreases only slightlyas RN approaches 3#000o Below this point performtance drops rapidly.at 1,,000,, efficiency is about 10 per cents
Ra~mp capacity is limited by cavitation tuider ceriain conditions*Based on a correlation of test results an equation is developed expressirgaltitude ceiling as a function of oaviiiation-limited flow ratio, nozzlepressure drop, And design area ratio. Operation at altitudes of 60,000feet and over is possible,, but at reduced pump of f ioienqye
The jet punp can be oversized to provid~e the excess capacity neededin the dnr-sump system. Eqoations are developed for 'use in predicting theair consumption rate of a jet soavenge pumpl as a tun~ction' the primary andsecondary oil flow rates and the pressures on the pump. Agreement withtest results is good.
Variables in the laborator-y program include nozzle to throat arearatio (eight pumps), b- Oe0. to0.o6, nozzle diameter OdO00to 0.177 inchlnozzle pressure drop 20 to'200 p i;,dis~charee pressure up to 60 puig;primary flow rate 10 to 60 lbs/mini flov ratio 0 to 4,6j pressure-differeniceratio 0 to 2.6., Altitude pressures were simulatid to over 70#000 feest. 0ilsused were MltL-Z6091U, Grades 10051 MIL-L-60924., Grad, 1100g and lUZL-L-.7809 synthetic oils Oil temperatures were go to l9OIP, for a viscosityrange 2 to 100 oentistokmes 'Nozzle and throat-diffuser friction GoesfficiO#13sare correlated versus Reynolds num~ber from L~OO to 30#000.
PUBLICATION REVIEW
This report has been reviewed and is approved*
FOR THE C0IV2ANDERs
7/RAN Go APPOLDColonel# 'USAFChief, Power Plant I~boratory
WADC TH 9C5-3 143 Directorate of Laboratories
iiiM
LIST OF ILLUSTRATIONS
PageFig. 1 Sketch of the Jet Piump Showing the Mixing Process. * . . • . 70
2. Characteristic Curve Showing Effects of Mixing, Jet, andFriction Losses.. .* * • * • * * * • * * * , . . . * * * 8
3. Pressure-Difference Ratio and Efficiency versus Flow RatioFor Pumps withbu 0.1to 0.6. , o s * a * * .,• . a * 8
4. Optimum Area Ratios versus Flow Ratio and Friction Factors.From Theoretical Equations* • . a . . . . . • . * • a •. a . . • 88
5. Maximum Flow Ratio as a Function of Area Ratio and FrictionFactor.@ . a s . . * * * .. 9
6. Efficiency and Pressure Ratios versus. 0 and b for OptimumConditions. . . 6 a . a a a * * ;' 0 0 a e G * 0 . e a'. * 90
7. Flow Diagrams , Jet Pump Test Stand. 91•a• *.• • •
f8tb Experimental Jet Pump, Assembly, and Details.. . a o * .• e
9. Conventional Jet Pump....... . . •. • . . .0. .. ., .0
10. Experimental N Values versus 0, The y ShoWn ao Solid 9.5to Line; b a 0.6, 0. 544, 0. 4, 0. 2, 0. 1. + * a1, . 1*. • • • • .•hru14. 9915. Effect of Oil Viscosity on N Characteristic Cr van; Oils
Grade 1005 and BleeidA, 80 Ftol60 F.. * , , • • 0 e • . . 100
16. Experimental Nozzle Coefficients K1 versus Reynolds Number. .
17. Experimental Throat-Diffuser Coefficient K34 versus ReynoldsNumber. • e e * .ee.• • . . .• .e..e , . 1P 0 a . • 10
18. Effect of AltitudePressure. . . . . . .a a e a a a * . e e . '
19. Limiting Flow Caused by A. Jet Velocity and, B. ReducedPressure P.. • * * 0 * 0 . 2 ! . . . . . . e . . " " * " " a *
20. Transparent JetPump.. a o * * • a * . . a a * a • a a .o e * * 05
21,22. Cavitation in Oil JetPump.. *e.a•• •• •• . 106307
W= TRt 55-143
23. High Speed Flash Pictures of Oil Jet Pump Showing FourStages of Cavitation..•.. a.... * . ' . . . 108
24. Limiting-Flow Function Y for Three Jet Pumps. s • . . 1 . . •0,
25. Limiting-Flow Results Obtained by Throttling the SuctionPort to Control po. * * * * * • 0 . * * , * a . a a a 0 . a a " 110
26. Limiting-Flow Results for Hydrocarbon and Synthetic LubricatingOils. 1336•
27. Increase in Limiting Flow After Removal of Dissolved Air.. 112
28. Showing Four Conditions df Flow. Note Relation of PoakEfficiencyto Limiting-Flow. 0 .. 0 .. 0 a. 133
29. Y versus p0 From Test With Low Jet Velocity. PerformanceUnaffected by Limiting-Flow for Po Exceedingl0 psia. f . . . . 114
30. Altitude Ceiling versus Nozzle Pressure Drop. Bottom CurvesShowGain;FromReducing Flow Ratio. @ . * * • , • 135
l. Flow Ratio and Maximum Pump Pressures versu's b For Operationat60,000Feet.... . . .. • . . . . . . . o * .* a * * 116
32. Optimum Nozzle-Throat Spacing versus Area Ratio. High Jet-Reynolds Number, 0 -2/3 Oreep. * • a a . * a * • • * 117
33. Effect of Nozzle-Throat Spacing on Limiting-Flow Function,. . 116 4
34. Jet Pump Test Stand Modifiedfor Air Tests. •...... 119
35. P srformance Characteristic Curves. 3 . a * * a * * * a e a 120
36. Air Flow versus Pressure Ratio NA, b a 0.1. . 2. . . .. a* .1
37. Air Flow versus Pressure Ratio,NA, b = 0.1, with High Jet-Velocity. off*. a * a . * *esss a a , a a a a a . * 9 e 9 122
38. Air Flow versus Pressure Ratio NA, b=w 0. 2. • • a • • * a .123
39, Air Flow versus Pressure Ratio NA, b a 0.544. o a . a . . . 124
40. Effect of Aeration on Nozzle Pressure Drop-.. . . 1 2 5 . . o * 1o5
WAD TR 55m143 v1
LIST OF TABLES
Table Page
le N and ý Versus Pf for Optimum b Value o . • . e * . • • • • • • • . 92. Envelope Curve Study o . . . . . a. . * . . . . . . . . 103 B asic Performance Data, Experimental Jet Pumps .. • . • . a * a a 16
Measured Friction Coefficients vr. Reynolds Numbers a . . . . . . 205. Calculated Efficiencies vs. Reynolds Number . . . * . . * . . . 22"6. Size Effect on Jet Pump Performance .... o. . . . . . 237. Optim~iumNozzle-Throat Spacings *. o a o.... o. o 3So9go Effect of Spacing at Low Jet Reynolds Numbers * o o o o o a : a9. Comparison of Two and Four Diameter Throat Lengths . o • * & a o . 1i10. Effect of Throat Entry Shape . . . . . . . . . . a • . . . • . . 2
ip
I i5
I
WADC TR 55-143 vi ii
I
INTRODUCTION
The jet pump or eductor, ejector, injector, is a device by means ofwhich one fluid stream is pumped by the action of a high velocity, jet ofthe same or other fluid. The pumping process is a result of transfer of mo-mentum from the jet fluid of the pumped stream:. The most familiar appli-cations are the steam-jet air ejector (compressible flow) and the water jetpump. The latter is widely used as a booster for water-well centrifugalpumps.
Oil supplied to aircraft engines is usually removed from the suMpsunder the lubrication zones by one or more scavenge pumps, and returnedto the oil tank. This is usually termed a "dry-sump" system: The volu-metric capacity of the scavenge pumps is 1. 5 to 6 times the oil rate intothe engine, thus maintaining a "dry" engine. Some air is normally pumped 3ýfrom the sump with the oil as a result of the excess pump capacity. Turbo-jet aircraft engines contain from two to as many as a dozen scavenge pumps.Each pump normally requires an individual mechanical drive, arrangement,usually involving one or more gears to take power from the main shaft.
The Objective. - This investigation'was undertakan to determine the feasi-bility of replacing the usual gear-type scavenge pump with the jet pump.Three major problems must be answered: (a) the effect of viscosity, or lowReynolds number on performance; (b) the upper limit of operating pressuresand Velocities (cavitation); and (c) behavior with a two-phase mixture of airand oil inducted at the 'suction port, as in the dry-sump system.
WAIJC TR 55-14i31
CHAPTER I
JET PUMP THEORY
A jet pump is a device by means of which a fluid may be pumped by the
action of a high velocity jet of the same, or other fluid. The pumping action
is a result of a transfer of momentum from the jet fluid to the fluid being
pumped.
Because of the complex nature of the problem, development of the theoryof jet pumps has been slow, particularly for compressible flow. There are a
large number of references on the subject, but the dontributions of Fluegel (i)and Keenan and Newmann (2) (3) are probably the most significant.
In the case of incompressible flow, the analyses by Gibson (4), Goslineand O'Brien (5), Fluegel (1), and Hussmann (6) are of interest in the presentproblem, that of pumping lubricating oil.
The objectives of the theoretical study, presented in detail in Appendix I,were:
a. To include the effects of friction in the form of dimension-less coefficients that could be established as some functionof viscosity, probably by means of the Reynolds criteria.
b. To simplify otherwise cumnbersorrerelations through use of"total head" pressures, as opposed to use of static pressureterms.
c. To clearly differentiate between unavoidable mixing lossesand friction losses.
Mechanism of Pumping Action. - As a jet of fluid penetrates a stagnant or slowlymoving fluid, a dragging action occurs on The boundary of the jet between thehigh- and low-velocity particles. Mixing occurs between the jet fluid and thelow velocity fluid; and transfer of momenta accelerates the latter in the directionof the flow. As the two flows progress, che mixture stream spreads. The un-disturbed high velocity core progressively decreases in diameter until it disap-pears. (See Fig. 1). Confined by parallel throat walls, the secondary fluid entersa region of decreasing area, that area being the annulus between the mixturestream and the throat wall. At the throat entrance the annular area is the differ-ence between jet and throat area. At the throat exit the mixture stream hasspread until it touches the wall of the throat. Then all of the side fluid has beenmixed with the primary jet.
WADO TR 55-1432
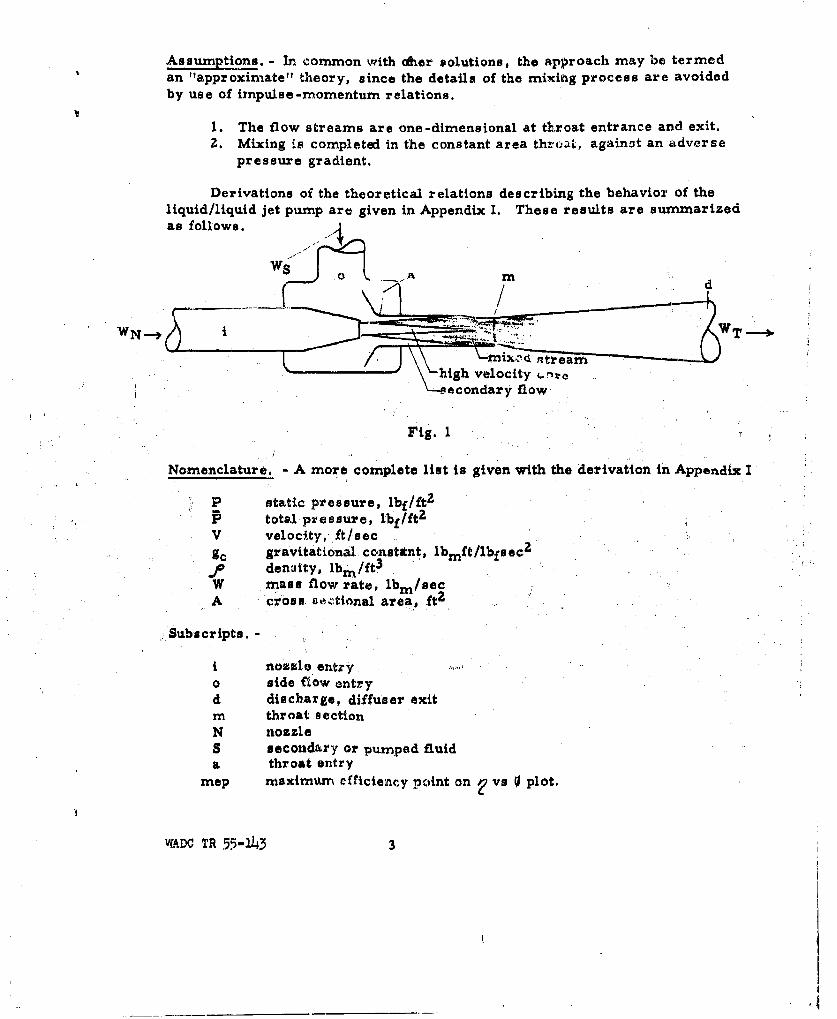
Assumptions. - In common with dher solutions, the approach may be termedan "approximate" theory, since the details of the mixing process are avoidedby use of irnpulse-momentum relations.
1. The flow streams are one-dimensional at th•roat entrance and exit.2. Mixing is completed in the constant area throat, against an adverse
pressure gradient.
Derivations of the theoretical relations describing the behavior of theliquid/liquid jet pump are given in Appendix I. These results are sumrmnarizedas follows.
W /
m /, d \\ -rni --------. • . '" \•high velocity ,.i•-ne
\\--secondary flow
Fig. 1
Nomenclature. - A more complete list is given with the derivation in Appendix I
P static pressure, lbf/ftz
P totalpressure, lbf/ft2
V velocity, it/secgravitational constitnt, lbrft/lbfsec2
denritty, lbm/ft 3
W mass flow rate, lbm/secA cross. ae:tional area, ft 2
Subscripts. -
I nozzle. enity.o side flow entryd discharge, diffuser exitm throat sectionN nozzleS secondary or pumped fluida throat entry
mep maximum efficiency point on vs 0 plot.
WADC TR 55-2143 3
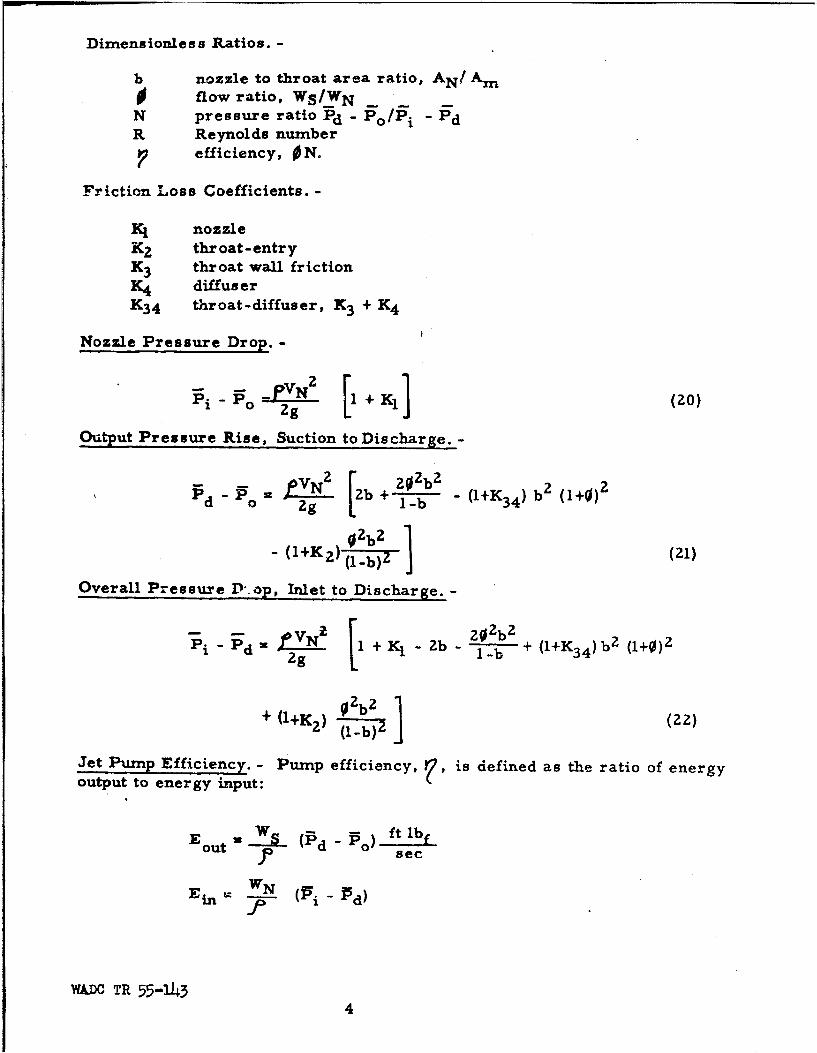
Dimensionless Ratios. -
b nozzle to throat area ratio, AN! Amflow ratio, WS/WN _
N pressure ratio Pd - Po/Pi -Pd
R Reynolds number
7 efficiency, ON.
Friction Loss Coefficients. -
K1 nozzleK2 throat-entryK 3 throat wall frictionK4 diffuser
K 3 4 throat-diffuser, K 3 + K 4
Nozzle Pressure Drop. -
- f;- PVN'
Pi - o Zg 11 [ + K1 1 (20)
Output Pressure Rise, Suction to Discharge. -
TP d "-' p 0 N 2 b + b - (1+K 3 4 ) b2 (1+0)2
Zg 1 l-b
- (l+K 2) (0 b)Z (21)
Overall Pressure P-.op, Inlet to Discharge. -
"Pi - d = PVN2 l + K1 - Z- -b + (l+K 3 4) b 2 (1+0)2
+ (I+K2 ) (-b) 2 - (22)
Jet P'ump Efficiency. - Pump efficiency, 1, is defined as the ratio of energyoutput to energy input:
o WS (-d -po) ft lbfu p sec
Ein = WN (15i - 5d)
WA.DC TR 55-1434
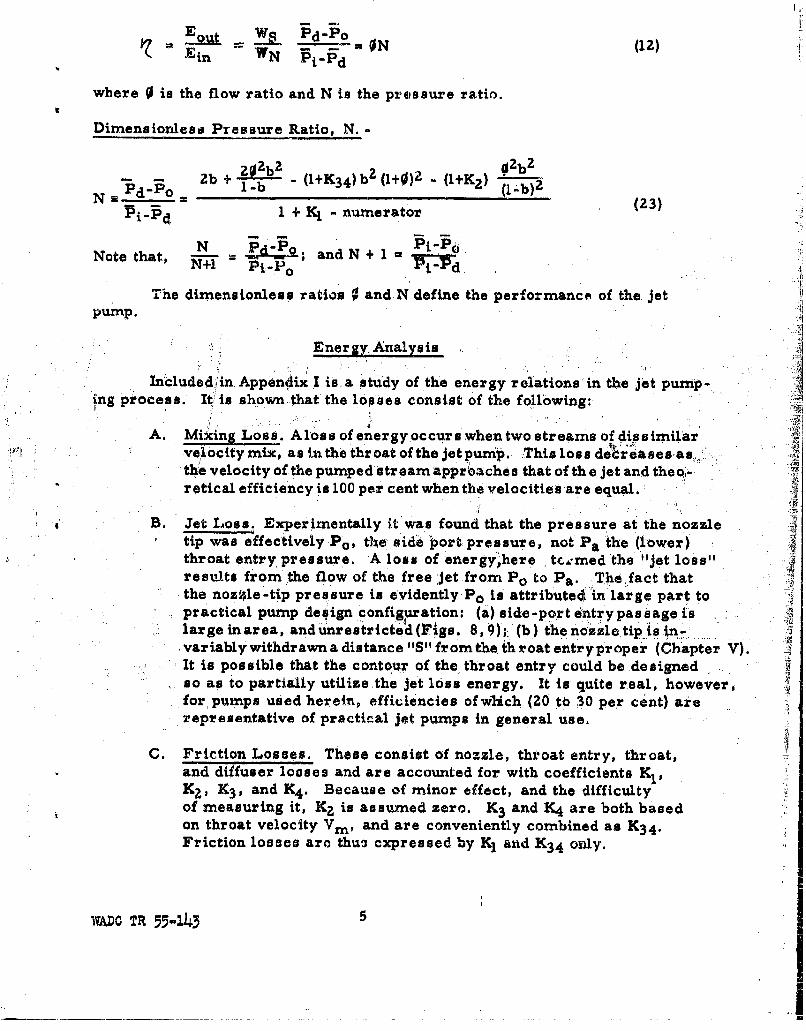
Ei WN vi-d ON (12)
where 0is the flow ratio and N is the prossure ratio.
Dimensionless Pressure Ratio, N. -
- - 2b + 20 2 b2 _ (l+K3 4 )b 2 (l+0)2 -, (1+IK2) 02b2
N Pd-P% 1-b (1-ýb) 2
1 +- K1 numerator (3
Note that, -j PP 0 and N + 1 y~
The dimensionless ratios 0and N define the performance of the. Jet
pump. y, Analysis
In'cludedj,i Appendix .1 is, a study of the energy relations in the Jet pump -i~~ng process. It; is shown-that the losses Ioss o holoig
A,. Miking Loss., Alos. of energy occurs when two streams of dissimilarve,46city mik, as izthe throatofth jetpun'ip. This loss dedrd.ases as0,,;.the velocity of the pumped str eamnapprbache a that of the jet and theo0-retical efficiency is 100 per cent when the velocities are equal.:
B. Jet Loss, Experimentally it was found that the pressure at the nozzletip was effectively P 0 , thle side port pressure, not Pa the (lower)throat entry pressure. -A lose of energy"ýhere tcem~red the "Jet lossres Ults from the flow of the free Jet from iP 0 to Pa. The fact thatthe nozi~e -tip presslure is evidently P0 is attributeo in large part topractical pump design configuration: (a) side-port entry pas sage i'slarge in area, and unrestricted1 (rigs. 8, 9);: (b) the nozxle tip is in-variably withdrawn a distance 'IS" from the, thr~oat entry proper (Chapter V). 4It is possible that the contour of the throat entry could be designedso as to partially ut~iZe the je t loss energy. It io quite real, however,for, pumps used herein, efficiencies of wlch (20 tb 30.per cent) arerepresentative of practical jet pumps in general use.d
C. Friction Los ses. These consist of nozzle, thikoat entry, throat,and diffuser louses and are accounted for with coefficients K1 ,K2 , K3 , and K4 . Because of minor effect, and the difficultyof measuring it, K2 is assumed zero. K3 and K4 are both basedon throat velocity VMP and are conveniently combined as K3 4 .Friction losses are thu3 expressed by K1 and K3,4 Only.
WCD TR 55-1.43
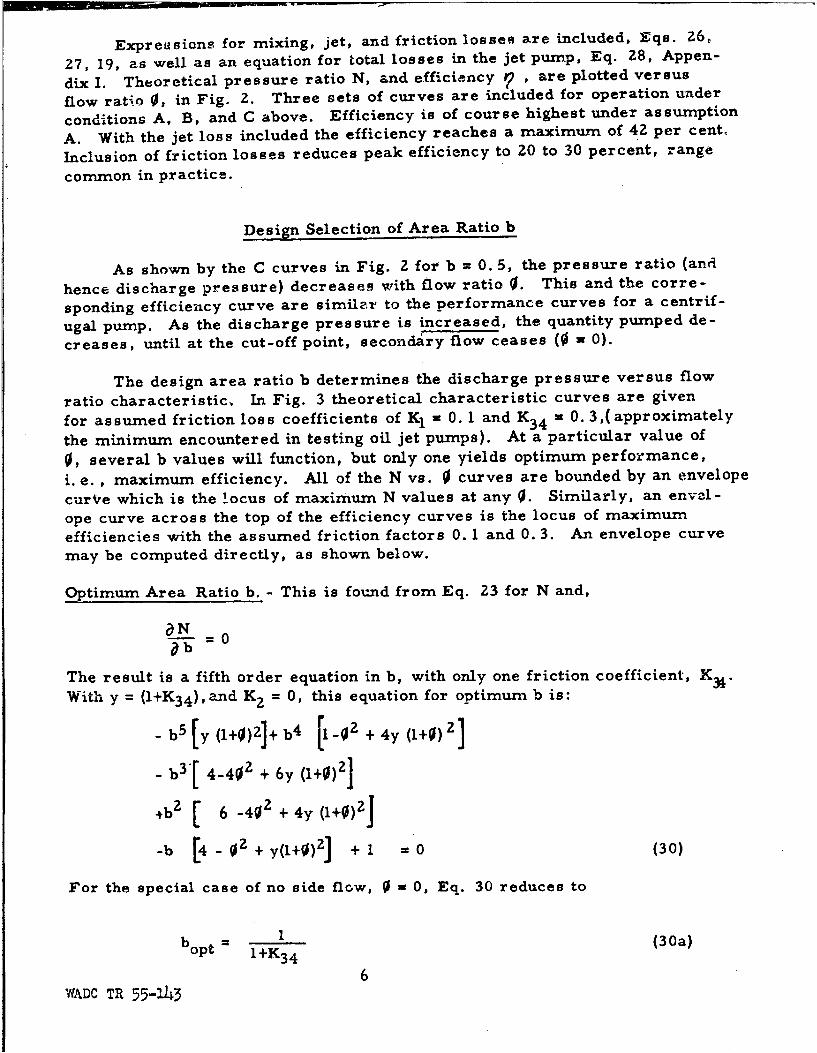
ExpreLsions for mixing, jet, and friction losse" are included, Eqs. 26,
27, 19, as well as an equation for total losses in the jet pump, Eq. Z8, Appen-
dix I. Theoretical pressure ratio N, and efficiency ? . are plotted versus
flow ratio 0, in Fig. 2. Three sets of curves are included for operation under
conditions A, B, and C above. Efficiency is of course highest under assumption
A. With the jet loss included the efficiency reaches a maximum of 42 per cent,
Inclusion of friction losses reduces peak efficiency to 20 to 30 percent, range
common in practice.
Design Selection of Area Ratio b
As shown by the C curves in Fig. 2 for b = 0. 5, the pressure ratio (and
hence discharge pressure) decreases with flow ratio 0. This and the corre-
sponding efficiency curve are similar to the performance curves for a centrif-
ugal pump. As the discharge pressure is increased, the quantity pumped de-
creases, until at the cut-off point, secondary flow ceases (0 z 0).
The design area ratio b determines the discharge pressure versus flow
ratio characteristic, In Fig. 3 theoretical characteristic curves are given
for assumed friction loss coefficients of K1 a 0. 1 and K 3 4 = 0. 3,(approximately
the minimum encountered in testing oil jet pumps). At a particular value of
0, several b values will function, but only one yields optimum performance,
i. e., maximum efficiency. All of the N vs. 0 curves are bounded by an envelope
curVe which is the locus of maximum N values at any 0. Similarly, an envel-
ope curve across the top of the efficiency curves is the locus of maximum
efficiencies with the assumed friction factors 0. 1 and 0. 3. An envelope curve
may be computed directly, as shown below.
Optimum Area Ratio b. - This is found from Eq. 23 for N and,
aN
The result is a fifth order equation in b, with only one friction coefficient, K 3.
With y = (1+K 3 4 ), and K 2 = 0, this equation for optimum b is:
- b 5 [y (1+0)2]+ b 4 [11-02 + 4y (1+0)2]
- b3[ 4-40Z + 6 y (1+0)2]
+b2 [ 6 402 + 4y (1+0)2
-b [4 - 07 + y(l+0)2] + 1 0 (30)
For the special case of no side flow, 0 - 0, Eq. 30 reduces to
bopt I+K31 (30a)
6WADC TR 55-143
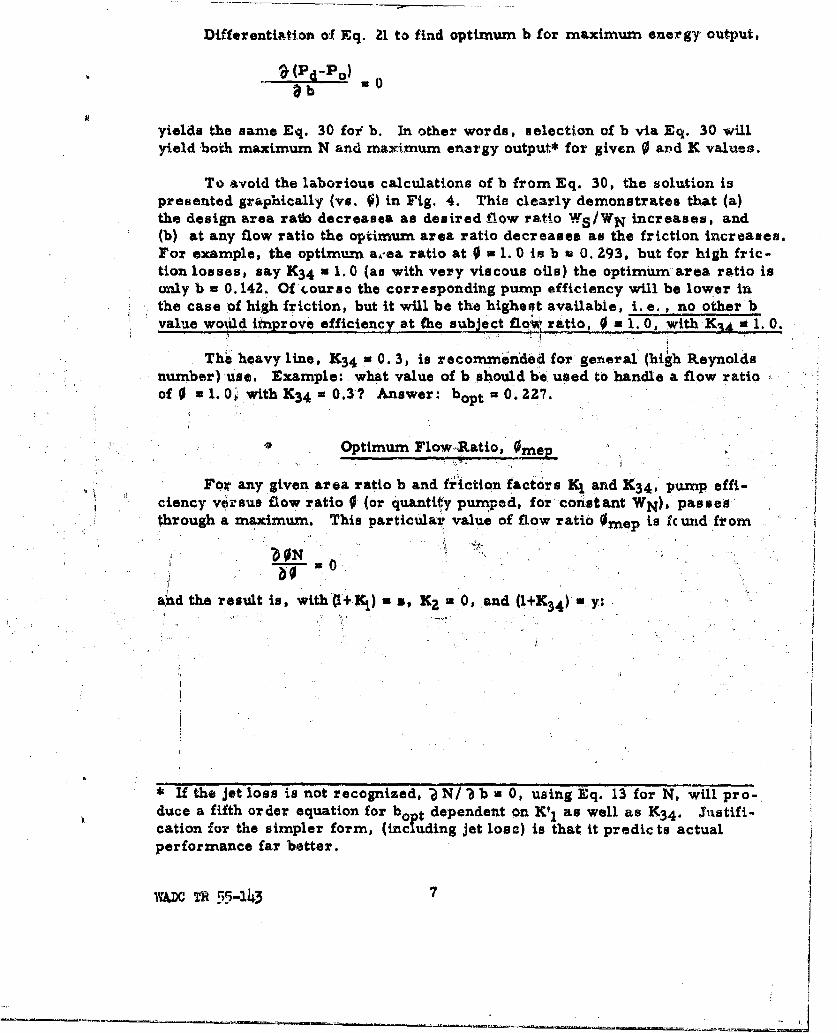
Differentiation of Eq. 21 to find optimum b for maximum energy output,
•' (Pd-Po)•b 0
yields the same Eq. 30 for b. In other words, selection of b via Eq. 30 willyield both maximum N and maximum energy output* for given 0 and K values.
To avoid the laborious calculations of b from Eq. 30, the solution ispresented graphically (vs. 0) in Fig. 4. This clearly demonstrates that (a)the design area ratl decreases as desired flow ratio WS/WN increases, and(b) at any flow ratio the optimum area ratio decreases as the friction increases.For example, the optimum a,.ea ratio at 0 = 1. 0 is b v 0. 293, but for high fric-tion losses, say K3 4 N 1. 0 (an with very viscous oils) the optimum area ratio isonly b * 0.142. Of course the corresponding pump efficiency will be lower inthe case of high friction, but it will be the highest available, i. e., no other bvalue woxild improve efficiency at the subject flow ratio, 0 - 1.0, with KAA u 1. 0.
The heavy line, K3 4 w 0. 3, is recommiended for gerteral (high Reynoldsnumber) use. Example: what value of b should be used to handle a flow ratioof 0 ul. 0 withK 3 4 0.3? Answer: bopt 0.227.
SOptimum Flow.-Ratio, Omep
For any given area ratio b and friction factors K1 and K 3 4 , pump effi-ciency ve'rsus flow ratio 0 (or quantity pumped, for constant WN), passesthrough a maximum. This particular value of flow ratio Omep is Icund from
b0and the result is, with (I+K1 ) =s, K2 -0, and (l+K 3 4 ) my:
*'If the jet loss is not recognized, N N/I b * 0, using Eq. 13 for N, will pro-duce a fifth order equation for boft dependent on K'1 as well as K3 4 . 3ustifi-cation for the simpler form, (including jet lose) is that it predicts actualperformance far better.
5 7
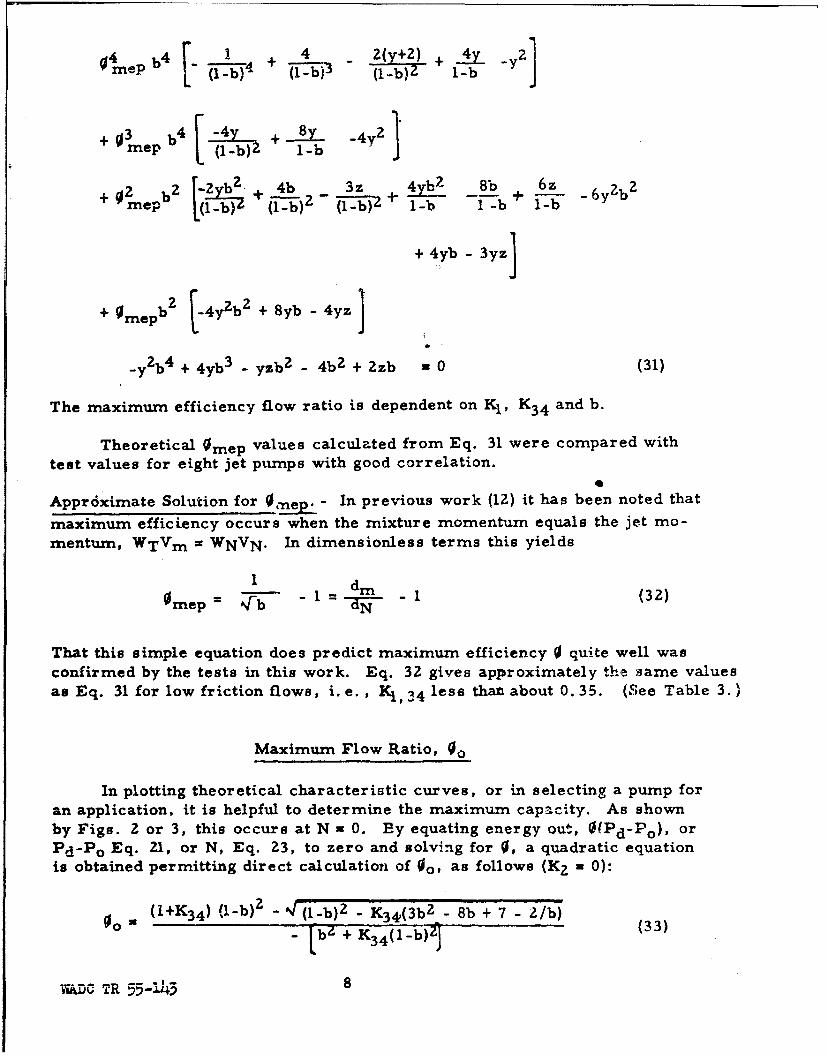
04 b4 1 + 4 Z(y+Z) + y _YZ
mep ( )2b)+ 1-b+¢3be A4Yd• + L .___ 4y2"
+2 f byb2 4b 3z 4yb_ 8b 6z
+02 b _ ) - -+ - + 1-b
+ 4yb - 3yz3
+Omepb 2 [-4y2b2 +8yb -4Yz)
-y20 + 4yb3 - yzb 2 - 4b 2 + Zzb • 0 (31)
The maximum efficiency flow ratio is dependent on K1 , K 3 4 and b.
Theoretical Omep values calculated from Eq. 31 were compared withtest values for eight jet pumps with good correlation.
Apprdximate Solution for ,nep.- In previous work (12) it has been noted that
maximum efficiency occurs when the mixture momentum equals the jet mo-mentumn, WTVm = WNVN. In dimensionless terms this yields
1 adr 1 (32)0 mep = ý---1- -I(-32
That this simple equation does predict maximum efficiency 0 quite well wasconfirmed by the tests in this work. Eq. 32 gives approximately the same valuesas Eq. 31 for low friction flows, i.e. , K1 , 34 less than about 0.35. (See Table 3.)
Maximum Flow Ratio, 0o
In plotting theoretical characteristic curves, or in selecting a pump foran application, it is helpful to determine the maximum capa•cty. As shownby Figs. 2 or 3, this occurs at N = 0. -y equating energy out, O(Pd-Po), or
Pd-Po Eq. 21, or N, Eq. 23, to zero and solving for 0, a quadratic equationis obtained permitting direct calculation of 00, as follows (K2 = 0):
o U G(1+K 3 4 ) (1-b) 2 - ! (1-b) 2 - K3 4 (3b 2 " 8b + 7 - 2/b)
- + K 34(1-b)
WOC TR 55-2123 8
A graphical solution to Eq. 33 is presented (vs. b) in Fig. 5 for K 34
values from 0 to 1. 0. Incidentally for frictionless flow Eq. 33 reduce$ to00 w 1-b/b, which will be recognized as the condition for zero mixing loss.
En-ope Curves
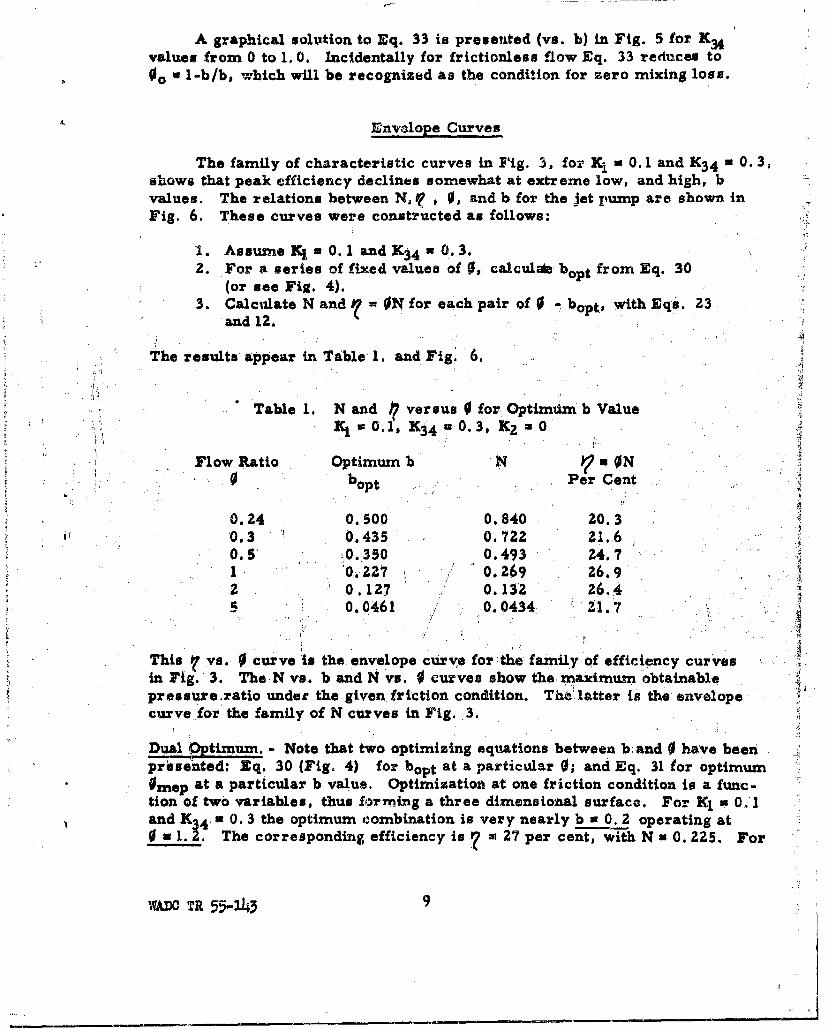
The family of characteristic curves in Fig. 5, for K1 = 0. 1 and K3 4 a 0. 3,shows that peak efficiency declines somewhat at extreme low, and high, bvalues. The relations between N. I , 0, and b for the jet pump are shown inFig. 6. These curves were constructed as follows:
1. Assurme K 1- 0.1 and K34 0.3.2. For a series of fixed values of 0, calcul; bopt from Eq. 30
(or see Fig. 4).3. Calculate N and O= N for each pair of 0 - bopt, with Eqs. 23
and 12.
The results appear in Table 1. and Fig, 6.
Table 1 N and versus 0 for Optimum b Value
1C1 .01, K3 4 o0.3, X2 0
Flow Ratio Optimum b N n ON0 bopt Per Cent
0.24 0.500 0.840 20.30.3 0.435 0.722 21.60.55 ,0. 350 0.493 24.7"1 0.227 0.269 26.92 0.127 0.132 26.45 0.0461 0.0434, 21.7
This 7 vs. 0 curve is the envelope curve for the family of efficiency curves.in Fig. 3. The N vs. b and N vs. 0 curves show the maximum obtainablepressure ratio under the given friction condition. The latter is the envelopecurve for the family of N curves in Fig. 3.
Dual 'Otimum. - Note that two optimizing equations between b. and 0 have beenpresented: Eq. 30 (Fig. 4) for bopt at a particular 0; and Eq. 31 for optimumOmep at a particular b value. Optimization at one friction condition is a func-tion of two variables, thus forming a three dimensiontal surface. For K1 " 0. 1and X *4 a 0. 3 the optimum combination is very nearly b-a 0. operating at
1. 1. The corresponding efficiency is '7.27 per cent, with N u 0. 225. For
,ADM TR 55-343 9
this case alone, bopt - 0 and $mep - b are identical. Note that the 7curve forb = 0. 2 is tangent to the envelope curve at its maximumn point, whereas larger bvalue curves are tangent at O<Omep, and smaller values at 0> omep"
Similar analyses were made at other friction conditions with the resultstabulated below. The pump with area ratio b = 0. 2 operating at 0 = 1. 2 re-mained the best "dual optimum" condition.
Table 2 Envelope Curve Study
Assumed Max.Friction
K 0.05K3 4*= 0.10
K 1 0.10K 34 " 0.20
K = 0.10 27,0SK3 4 a 0.30
K1 *0.20 Sý22, 0K34 0.40
Appr oxim~a •E Theory
It has been suggested previously (5, 11) that the N vs. 0 characteristiccurve be approximated with a straigfht line. Inspection of Figs. 3, 10 to 14,shows that the N - 0 line is slightly concave down, at b = 0.1,linear at'b * 0 2,and concave up for larger b values. Thus, particularlyrfor b <0. 3, this line-arity approach is quite useful. A straight line on N vs. coordinates is drawnbetween 00 (Eq. 33 or Fig. 5) on the abscissa and No on the ordi'ate. NO iscalculated from Eq. 23, which reduces to the following at 0 = 0.
2b - (1+134) b2
No I +K - numerator
The efficiency curve, ?= ON will be a parabola; the following relations alsoapply) if N vs. 0 is linear:
N: No - e0 (34)
where 0 N , the elope
00ep O (35)2
W&DC TRt rS.-1L4 10
O= N°- e 2 (36)
?'max (37)
In Appendix 3 this approximation is compared with and ad values versusb from Reference 11.
WADOC TR 55-13 I 4
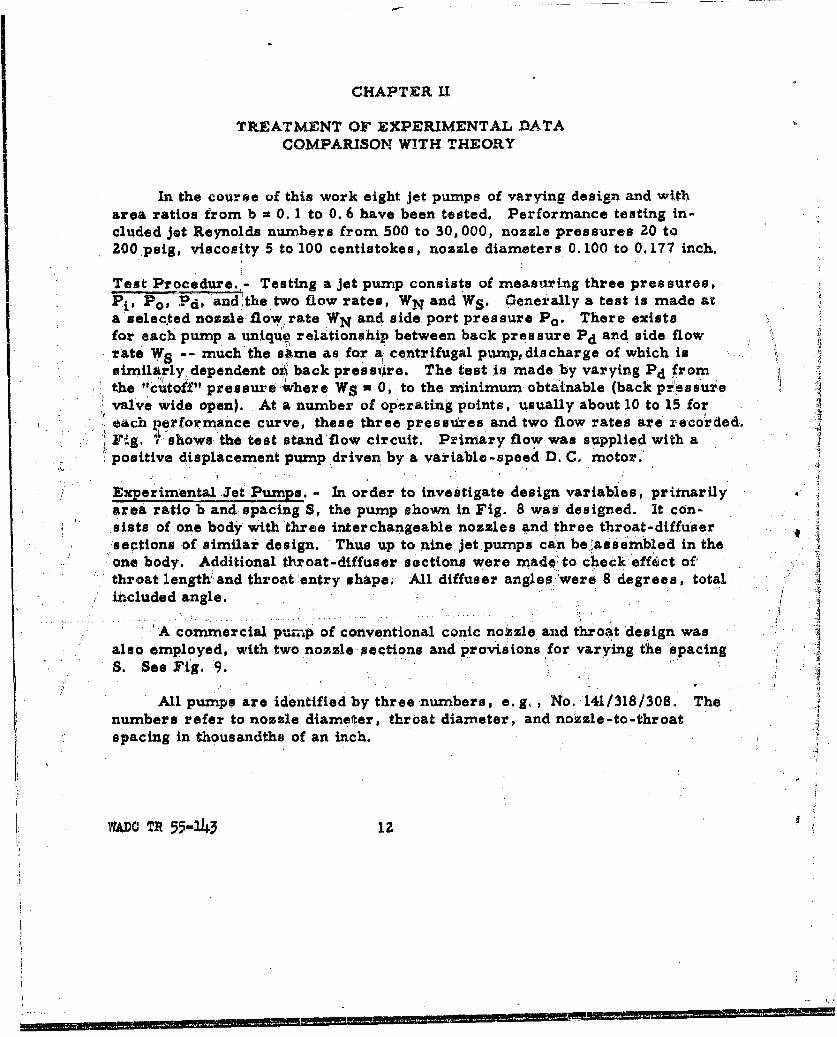
ICHAPTER II
TREATMENT OF EXPERIMENTAL DATACOMPARISON WITH THEORY
In the course of this work eight jet pumps of varying design and witharea ratios from b = 0. 1 to 0. 6 have been tested. Performance testing in-cluded jet Reynolds numbers from 500 to 30,000, nozzle pressures 20 to200 psug, viscosity 5 to 100 centistokes, nozzle diameters 0. 100 to 0.177 inch.
Test Procedure..'- Testing a jet pump consists of measuring three pressures,Pi, Po, Pd, 'andlthe two flow rates, WN and WS. Generally a test is made ata selected nozzle flow rate WN and side port pressure Po. There existsfor each pump a unique relationship between back pressure Pd and side flowrate WS -- much the sime as for a centrifugal pump, discharge of which is Asimilarly dependent oL back pressure. The test is made by varying Pd fromthe "cutoff" pressure ývhere WS - 0, to the minimum obtainable (back piessurevalve wide open). At a number of operating points, usually about 10 to 15 forSeach performance curve, these three pressures and two flow rates are recoirded.'Fg. i shows the test stand flow circuit. Primary flow was supplied with apositive displacement pump driven by a variable-speed D.C. motor.
Experimental 3et Pumps. - In order to investigate design variables, primarilyarea ratio b and spacing S, the pump shown in Fig. 8 was designed. It con-slats of one body with three interchangeable nozzles and three throat-diffuser.,sections of similar design. Thus up to nine jet pumps can be assembled in theone body. Additional throat-diffuser sections were made: to check effect of"throat length" and throat entry shape. All diffuser angles were 8 degrees, totalincluded angle.
'A commercial pu,-,p of conventional conic noizle and throat design was '
also employed, with two nozzle sections and provisions for varying the spacingS. See Fig. 9.
All pumps are identified by three numbers, e. g, , No. 141/318/308. Thenumbers refer to nozzle diameter, throat diameter, and nozzle-to-throatspacing in thousandths of an inch.
WADC TR 55-343 12
• ,, . .. . _ . . ... - -
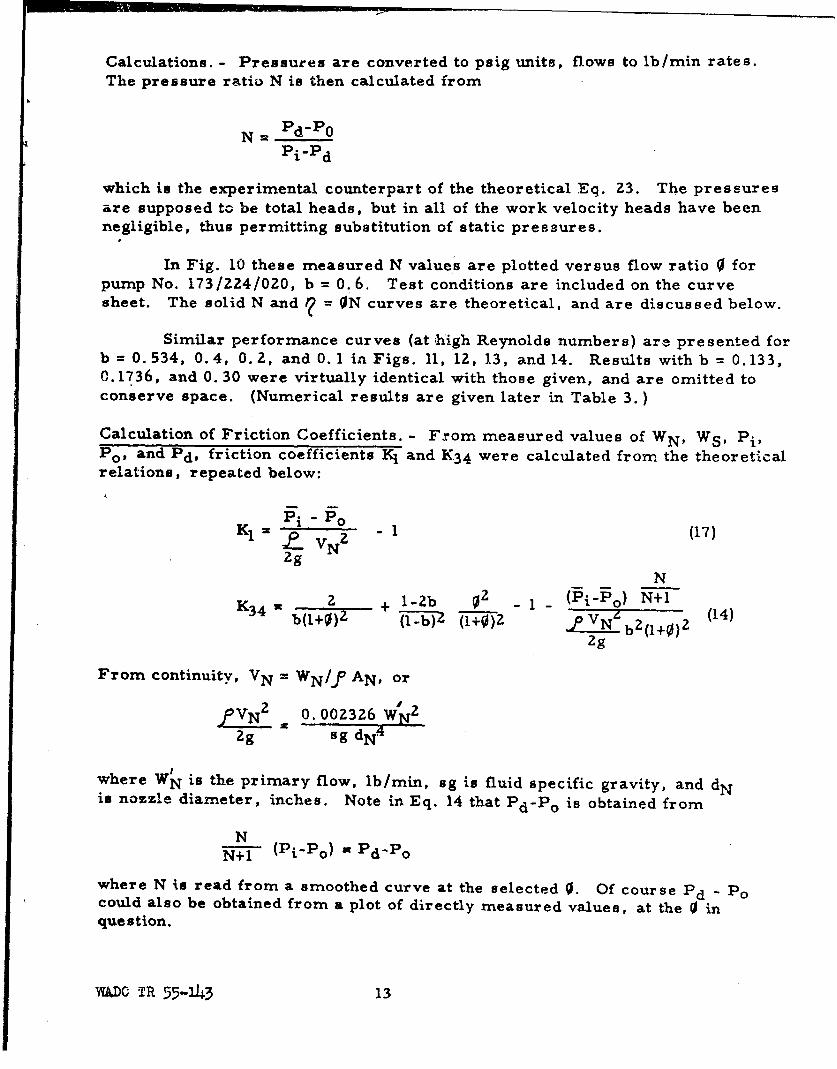
Calculations. - Pressures are converted to psig units, flows to lb/min rates.The pressure ratio N is then calculated from
N-= Pd-P0
Pi-Pd
which is the experimental counterpart of the theoretical Eq. 23. The pressuresare supposed to be total heads, but in all of the work velocity heads have beennegligible, thus permitting substitution of static pressures.
In Fig. 10 these measured N values are plotted versus flow ratio 0 forpump No. 173/224/020, b = 0.6. Test conditions are included on the curvesheet. The solid N and = ON curves are theoretical, and are discussed below.
Similar performance curves (at high Reynolds numbers) are presented forb = 0.534, 0.4, 0.2, and 0. 1 in Figs. 11, 12, 13, and 14. Results with b = 0.133,"0. 1736, and 0.30 were virtually identical with those given, and are omitted toconserve space. (Numerical results are given later in Table 3.)
Calculation of Friction Coefficients. - From measured values of WN, WS, P i ,Po, and Pd, friction coefficients KN and K 3 4 were calculated from the theoreticalrelations, repeated below:
K1 2 - 1 (17)
Zg VN
K34 2 + l-Zb 02 -1- (P-P) N+l (14)b(1+0) (1-b)Z (1+0)2 VN- b2(+10 )2
2g
From continuity, VN = WN/fP AN, or
,PVNz o .002326 W'N2PVNN
2g sg dN4
where W' is the primary flow, lb/min, sg is fluid specific gravity, and dNis nozzle diameter, inches. Note in Eq. 14 that Pd-Po is obtained from
NN+l (Pt-P o) Pdo
where N is read from a smoothed curve at the selected 0. Of course Pd - POcould also be obtained from a plot of directly measured values, at the 0 inque s tion.
WDOc TR 55-143 13
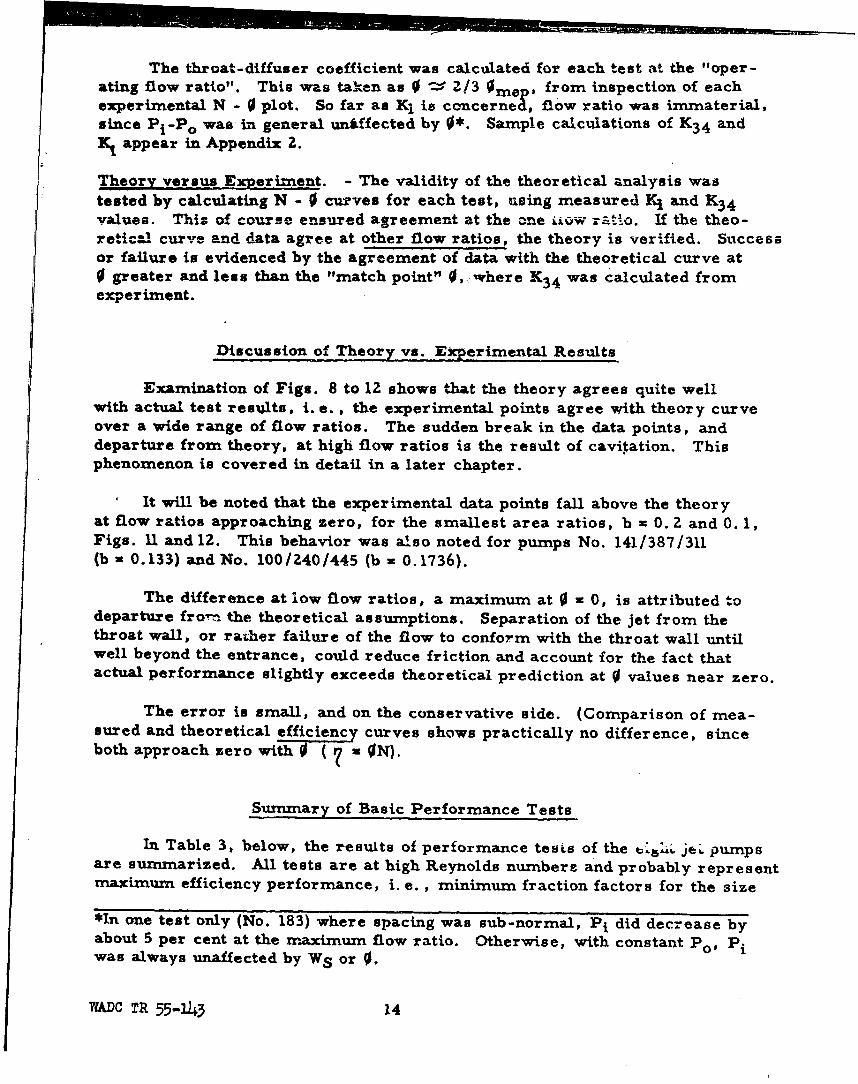
The throat-diffuser coefficient was calculated for each test at the "oper-ating flow ratio". This was taken as 0 _ 2/3 nmep, from inspection of eachexperimental N - 0 plot. So far as KI is concerned, flow ratio was inmmaterial,since Pi-Po was in general uniffected by 0*. Sample calculations of K 3 4 andK1 appear in Appendix 2.
Theory versus Experiment. - The validity of the theoretical analysis wastested by calculating N - 0 curves for each test, using measured K1 and K 3 4values. This of course ensured agreement at the one ii•w 'atio. If the theo-retical curve and data agree at other flow ratios, the theory is verified. Successor failure is evidenced by the agreement of data with the theoretical curve at0 greater and less than the "match point" 0, where K 3 4 was calculated fromexperiment.
Discussion of Theory vs. Experimental Results
Examination of Figs. 8 to 12 shows that the theory agrees quite wellwith actual test results, i. e. , the experimental points agree with theory curveover a wide range of flow ratios. The sudden break in the data points, anddeparture from theory, at high flow ratios is the result of caviation. Thisphenomenon is covered in detail in a later chapter.
It will be noted that the experimental data points fall above the theoryat flow ratios approaching zero, for the smallest area ratios, b X 0. 2 and 0. 1,Figs. U and 12. This behavior was also noted for pumps No. 141/387/311(b = 0.133) and No. 100/240/445 (b , 0.1736).
The difference at low flow ratios, a maximum at 0 = 0, is attributed todeparture fro---, the theoretical assumptions. Separation of the jet from thethroat wall, or rather failure of the flow to conform with the throat wall untilwell beyond the entrance, could reduce friction and account for the fact thatactual performance slightly exceeds theoretical prediction at 0 values near zero.
The error is small, and on the conservative side. (Comparison of mea-sured and theoretical efficiency curves shows practically no difference, sinceboth approach zero with O( ON).
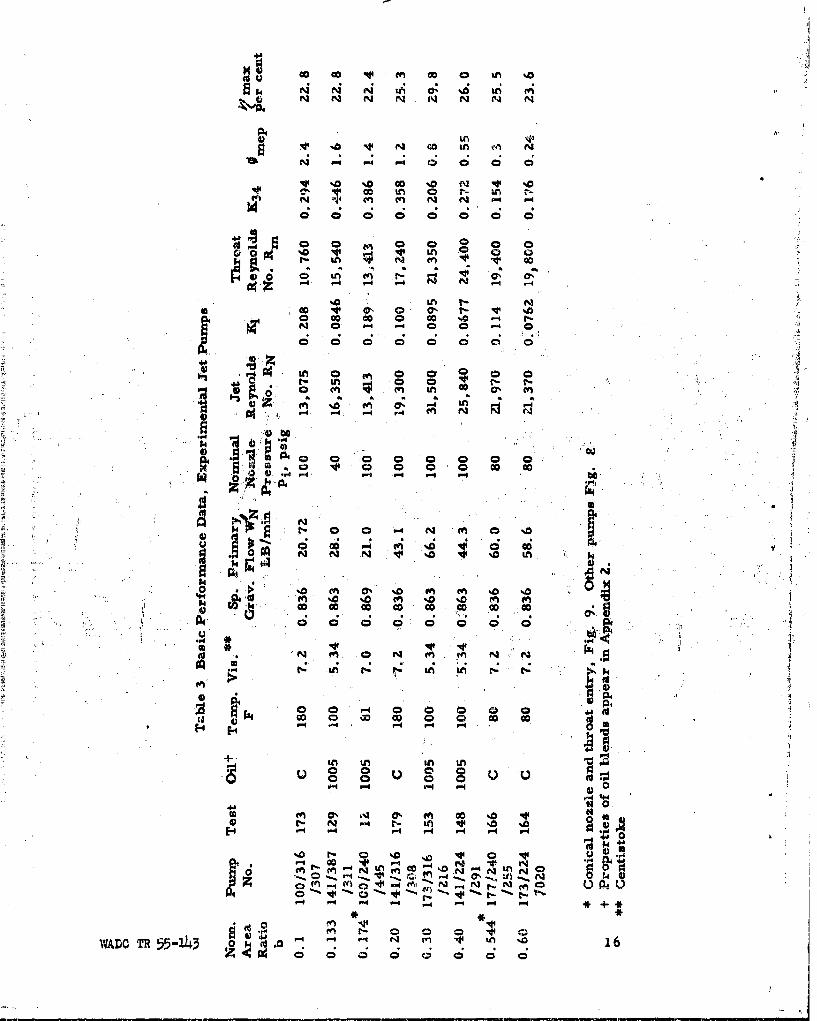
-Summary of Basic Performance Tests
In Table 3, below, the results of performance tesas of the )S" Je1. pumpsare summarized. All tests are at high Reynolds numbers and probably representmaximum efficiency performance, i. e., minimum fraction factors for the size
*In one test only (No. 183) where spacing was sub-normal, Pi did decrease byabout 5 per cent at the maximum flow ratio. Otherwise, with constant PO, Piwas always unaffected by WS or 0.
WADC TR 55-143 14
of pump in question. As is the case with turbulent flow in pipes, friction
factors decline toward minimum values at high Reynolds numbers. (See next
Chapter.)
Effect of Area Ratios. - Whereas the theoretical analysis (Chapter I) showed
b a 0. 2 to be optimum for maximum efficiency with fixed K1 and- K3 4 values,
Table 3 indicates that b = 0.3 is superior. Furthermore, efficiency does not
decline at high b values as the analysis wit; constant K values shows. Exam-
ination of the K 3 4 column reveals that measured K 3 4 values decrease as b in-
creases , for these tests at high Reynolds numbers.
WU= TR 55-143 is
N Vco 0 1 n 0 C0 %n f0m MN N M P-4
N 9A N (n NON
v 0 0 Lo M f-N Cr Y
N4 "4 - - 0
14 Go do Q0 G0 N4 t-
0 0 0 04 0 0 W0 0
A t- a -
0 0 0 0 go G0 14t r-4 -4 0'I 1 - 14 t
cc co 00 -oc G 00 c
M- .~ a N~ m
144
0 0 0 0 0 0 u
r-~~ ~ ~ "44r- L % 0c
00 0- '- o N I.0 .
0 in
4A4 0 0 0 tn %0
WAD TR5-4 16u " N ~ V*U4 0ý6C ýC
i•.
CHAPTER III
CORRELATION OF MEASURED FRICTION COEFFICIENTS
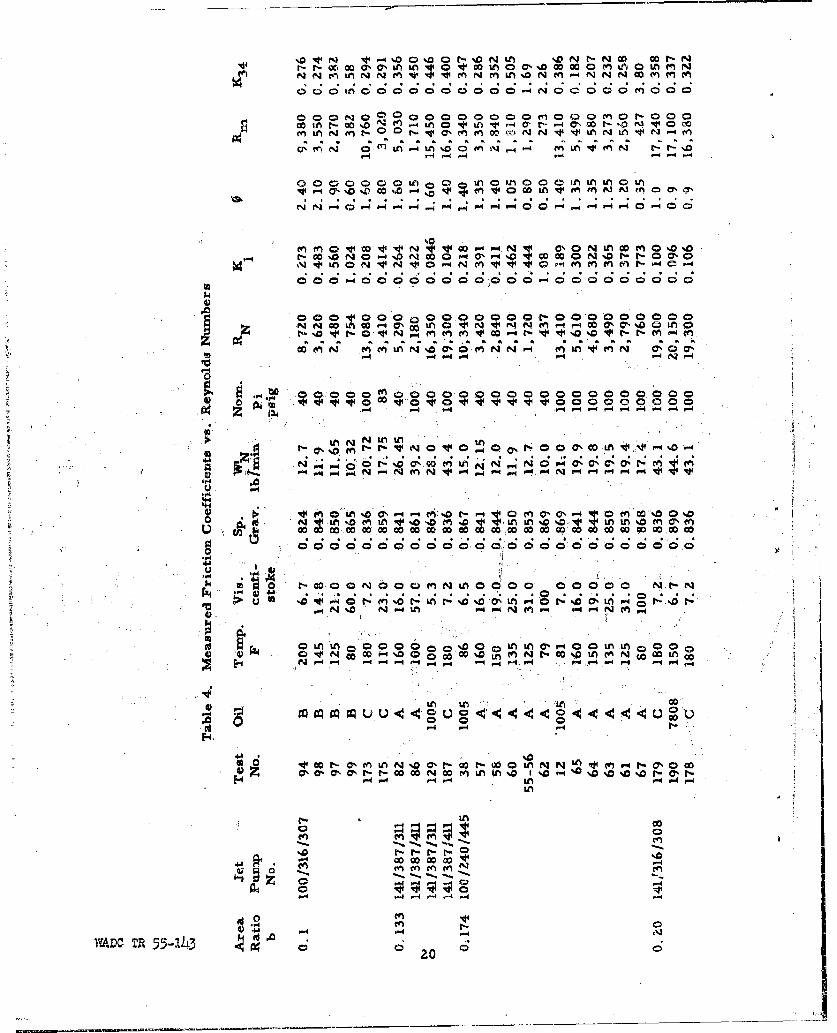
)ne of the primary questions to be answered in judging the feasibilityof using a jet pump in a lubrication system is that of the effect of viscosity.As developed below, tests show that pump efficiency in affected relatively littleby viscosity dbwn to a jet Reynolds number of about 3,000. Below this, per-formance decreases so rapidly that operation in the laminar region should beavoided.
The Effect of Viscosity. - To simulate low temperature operation, blends ofGrades 1005 and U100oil (identified as A, B, C) were used at controlled tem-peratures from 80. to 200 F. Viscosity and apecific gravity data are given inFigS. 43 and 44 . In Fig. 15, N characteristic curves are givenfor two jetpumps at several viscosities. The uppermost N - 0 line for each punip is the"Inormalt" pressure ratio characteristic. The depression of the 31 centistokecurve is quite different between the 1,00/240/445 and 141/316 /408 pumps. Thereason of cciurse is the difference in Reynolds numbers, which are: noted atthe right of the"curves. As shown below, performance declines rapidly with
Reynolds number when RN < 3,000. (Loss in efficiency due to lowering of•N values is quite evident,.since ON).W
Additional tests with different velocities soon confirmed that Rotynolds ýnuiber, not viscosity, governed performance when viscous effects are large.
-r -b
Reynolds Numbers
The jet pumping process, a momentum interchange, depends uponturbulent mixing onie primary and secondary streams. Turbulence can per-sist only when the viscous stresses in the flow are insufficient to damp outlocal fluctuations in velocity.
Reynolds Similitude. - ByL means of dimensional analysis it can be shown that*in the nozzle, and in the throat and diffuser, the dynamic pattern of flow willdepend upon the value of the Reynolds number. The Reynolds number expressesthe relative importance of viscous action, being a ratio of inertial.to viscous Jforces. In any two flows inwhich viscosity plays an important role, dynamic
WADC TR 55-.43 17
similitude exists when the boundaries are geometrically similar, and theReynolds numbers are the same.
Apart from the simpler flows in the nozzle and diffuser, the complexjet mixing process itself depends upon a "stability parameter" (7), whichresembles a Reynolds number. Whether or not turbulent mixing occurs betweena free jet and the surrouiding fluid depends on the value of the atability parame.ter. As in the case of the transition from turbulent to laminar pipe flow at aReynolds number of about 2100, a critical value ex~its for the free jet.
The case of the jet pump is complicated by the fact that the mixingoccurs in an adverse presmure gradient, and is confined by the parallel wallsof the throat. The latter will be a stabilizing influence, tending to delay theonset of turbulent flow (8).
Since boththe mixing process and the nozzle, side entry, and diffuserflows may be expected to depend upon Reynolds number, measured values ofloss coefficients have been correlated versus either the jet Reynolds num.berRN or the throat Reynolds number, Rm.
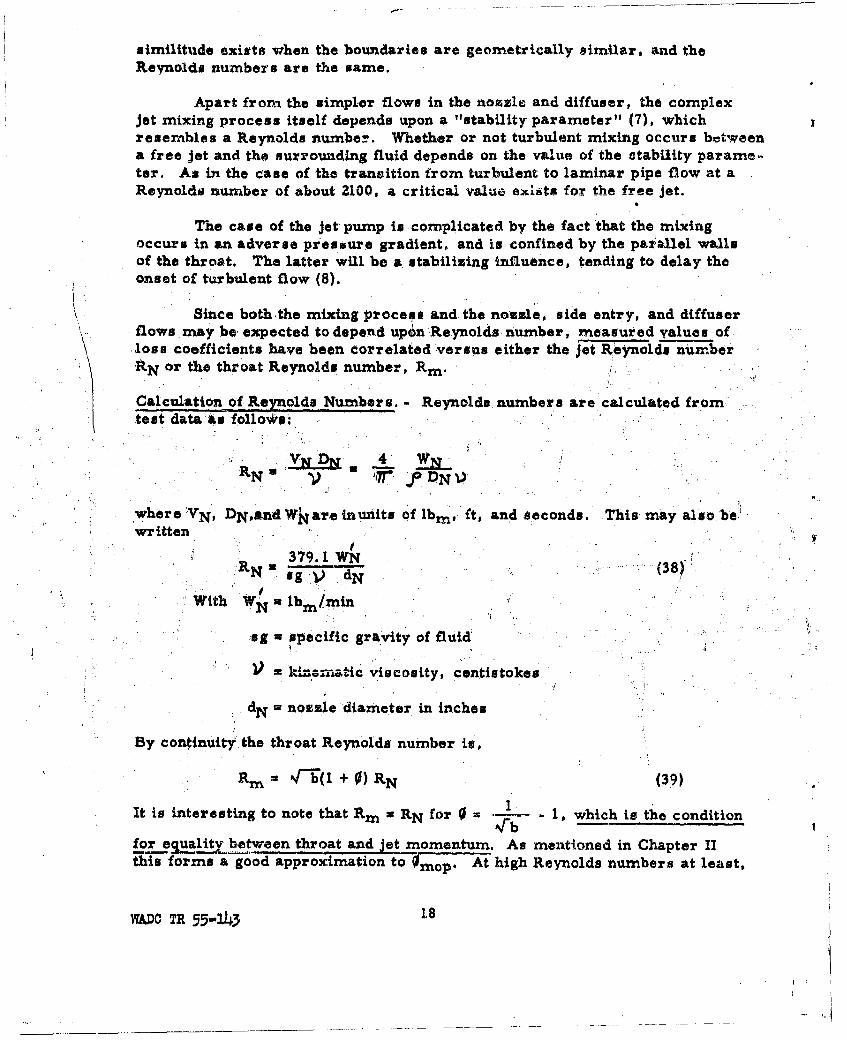
Calculation of Reynolds Numbers. - Reynolds numbers are calculated from:test data'as follows: :
where VN, DNandWilare inunits of lbm, ft, and seconds. This may also be1'written
379.1 WN S(38)' !:,RN= sg ,) dN (38)
With WN "lb /min
ag * specific gravity of fluid
d= kiarniatic viscosity, centistokes
dN nozzle diameter in inches
By continuity the throat Reynolds number it,
R1 1, w(i +0)RN (3t9)
It is interesting to note that Rm x RN for 0 1, which is the condition
for equality between throat and jet momentum. As mentioned in Chapter IIthis forms a good approximation to Omop. At high Reynolds numbers at least,
WAPO TR 55-1343 1
the throat Reynolds number R.t1 at the experimental Or ep wa, always foundto be quite close in value to the jet Reynolds number RN.
Experimnental Results
Values of nozzle coefficient K1 calculated from test resUlts are plottedvs. nozzle Reynolds number RN in Fig. 16. These data consist of K1 valuesfrom 42 performance test on, eight jet pumps plus a few nozzle tests. Includedare coefficients for (a) three nozzles with elliptical profile (Fig. 8): dN = 0.100,0.141, 0.173 in. ; and (b) for two nozzles with conical approach profile: dN 0.100,0.177 in. (Fig. 9).
In general K1 varies inversely as RN to ;tbout the one-half power, from500 to 20,000. Although these' data are insufficient to show it, it would beexpected that this relation would fail at very high Reynolds numbers; where K1probably approaches a constant value (independent of RN). K1 = 0.1 is probablya good general assumption for this case.
Size Effect. - As would be expected, the smallest nozzle exhibits the highestloss coefficient, i. e. , has the lowest efficiency, at any one value of RN. .
If coefficients are available in the literature for a particular nozzleselectedfor a jet pump design, these may,be applied directly.
F1 Values may be taken from Fig. 16'for design use, These curves willbe somewhat conservative for applicatiotito larger nozzles (dN> 0.1'77 in.).
Throat-,iffuser Coefficient. - K3 4 values are plotted versus throat ReynoldsnurnberRm in Fig. 17. These values are based on some 42. tests n eight jetpunps, using three mineral ol' blends and a synthetic oil.
Referring to Zi7g. 17 the following points of interest are noted'
1. Friction increases rapidly for Rm< 3,000, where K3 4 r900/Rm'
2. A horizontal line, K3 4 0. 3, best represents results for Rrn• 3,000.
3. There is an indication that K3 4 vs. Rm dips to a minimum (0. 2)at about 5,000 and then rises again to 0.34 or 0.4 at Rm'= 15,0O0.Data are insufficient to warrant a conclusion, however.
4. At high Reynolds numbers (15,000-20,000) pumps with larg aý,earatios, b = 0.3, 0.4, 0.534, 0.6 showed K3 4 0.3. Forpumpsof small area ratios, 0.2, 0.174, 0.133, 0.10, K 34 > 0.3.
WADC T 55-31+3 19
%0 V N VF 0- 0%0 0 %D 0 N 0Q 00 - %Q N 0 OD c0 N 00N
00 ON 0o o aOaO00n03 0 v i 0%D0 w0 m~ 0 1' 000
oin F o' N m .4i 0 -h v . -4 ., -- ,e 0" CO r- e-40 CQ 0
1-1 ONOý-r -0O ".4
C0000000cooa00t)0In0 0 0 L n0 00
t '0 1 -0 .14 N w~ 0 fl" ON " %a N4 14 %0 0 14 r- 0U~ NC~ .fU NC'M N MW1~ M M f
N OU 0- 7 oU *4 e -4 ý 0a 7 D0L
Al .E4* .O0 ~ O 0 0 0 .0000000000 .
1-4.~ . 14 P-4O'i 1. -4Od.
An........................................f- N r- 000 00 0 0' co 000
en .. 0 In N 0 -4U PI"NV4. cm Dr - P4 mC'% %
m Lr )% %e
co o 0 0 0 0 doc 0 00
%D f -4 -n4 P-4 fQ M P P4ý3 -
F4.G
inc~14M
41 ~ ~ ~ - 1,G 0 o o1
- -4 &Wý -4
-,DC TR 55-143 34 0 0 00 C
0 4 1- I '0 N N t- M OM N W 0f M0 -
S00• 000000 0 O0 00000C
, ," ••• ¢ N 0"0t'- 0", 1414 c4 Nl 0", MO
N M N N m *4
C c;, C; C; 'i ... . .... ..6 ý 6 6
-4, N P-4 v r-. r- t~- t- 1 in~ (l m N N N
co N ,oN coc) 0Lt' %oinc r- un N v N -p-"• N N N o N' 0 N N 0 N en CZ N
.P 4
~Ntf~0'U~f-4O"~
N ~N N N N14I nvt 40!
Go o c 00000 00NcocoGoco0M0 c c ,coW
F4 n Q om 0 N Q C0~o10.-%OO4,
z
... N . .. , , . -.. .,, .
a N %o m t- t- coco o c t-d = o J,0 0 in o Ln o0 00 sO %a 0 Q0o N; o 0 Go N =i 0 ; a o 0,: 0
,: .. N~~~ a.. -. •,, e.0....................... q • 0....
~{N -4* 4-4 P-1 -4 -4- .4- -4, 4 P-
.• .4. .•<, luu u U 0 Ul•u u u v
0) ,- (n m%,. 0ON0 00
( 0 C%, N r- t-' 6-• t"i u) L vm10 % 1 ,0 % ,,C %a
4) Z 4 -4 v" . ,.1 "4) P- P- i - "
M= fq '•eI
-d N "•w"I
0 0-
14~~t 0 0m n -
•_} .• ... i~ N 14 fw43 MN N N
WADC TR 55-1)43 4 ) 21 °- a j
Efficiency ver 9 s R oynod Nmber. - Rapid estimates of maximium pumpefficiency may be made uxinj the approxixvlate solution in Chapter 1, lEqs. 23a(No), 33 (00) and Eq. 37, m xi NOO/4. (This approximation is based onthe assumption that N vs. 0is a straight line. It is quite accurate for arearatios in the vicinity of b =0. 2).
With K1 and K34 va~lueN taken from the heavy line curves in Figs. 16and 17, efficiencies were izalculated via Eq. 37 at R. values from 500 to 20, 000.
(at t RmI% RN.) Results appear in Table 5 and are. plotted vs. Rm inFig. 17.
Table 5, Calculated Efficiencies vs. Reynolds Number
K-, 34 No 17N 000/RN~m Pe rCent
20, 000 0.10 0.30 2.49 0.463 28.87,000 0.20 0.30 2.49 0.409 25.43,0100 0.33 0.30 .2.49 0.354 22:02,000 0.43 .0. 45 2.14, 0.314 16. 81,000 C.o 66 9 1. 54;1 0.242 9.32
700 0.82 1.3 1. 20j' 0.218 6.55-. 500 .1.0, 1.8 0.9!6 018 4.04
300. 1.4 3.0 0 .6(A 0.111 1.,66.
** 1, K34 valueils from heavy line curves,. Figs.' 06 andl17.
*The efficiency curve in Fig. 17 is representative of the-actual -test'results. As the Reyniolds number is increased above 3, 000, only a slight gaininý performance results; this is due to the decline in nozzle coefficient K.below 3, 000, both ic1 and 34' are increasing, and efficiency drops off rapidly.Operation here should be avoided if possible.
Effect of Oil Used. - A~s shown by Table 4, t ,hese me asurements of K vallues in-volved th. use of MIL-L-6801A Grade 1005 oilb three blends of Grade 1005 plusMIL-L-6802Ak, Grade 1100 oil, -and MIL-L-7808, a synthetic oil. At sin'Rilarviscosities (through temperature control) all oils gave, essentially the same per -formiance. (As shown in Chapter IV, oil composition did affect cavitation slightly.)
The importance of the synthetic oil to future lubrication systems warrantsa special comparison. Experimental N values vs. 0 were the same for blend Cand MIL-L-7808 synthetic oil, within experimental accuracy. Test data, andcalculated K values for blend C and for synthetic oil (under similar conditions,RN 2: 20, 000) appear as Tests 179 and 190 in Table 4, K1 values were 0. 100 and0. 096, K34 values were 0. 358 and 0. 337, for the mineral blend and the syntheticOil, respectively.
W.ADC TR 55-143 22
Effect of Altitude. - The theoretical developments in Chapter I and Appendix Ishow that pump performance is dependent on pressure differences, and not onabsolute or gage pressures. All ,of the data cited so far in this report was takknowith side port or suction pressure Po within one psi of tank pressure. The tankwas normally vented to the atmosphere (except when cavitation testing was un-derway). Local ambient pressure corresponds to about .,200 to 1,400 feet al-titude in the NACA table (Ref. 13.).
Fig. 18 compares performance of pump No. 141/316/308, at1, •100 andat 12, 000 feet altitude (tank pressure 10 inches Hg. below atmospheric). Thetwo N curves are ident' -al except for the cavitation - limited flow ratio, 0 Lwhich is lower for the altitude test. This test, as well as many' performancetests at altitudes to 70,000 feet made in the cavitation study, confirm thetheoretical independence of the jet pump from altitude, providing the pumep isnot cavitating.
Effect of Pump Size. - Pipe friction factors are dependent on the relative rough-ness of the wall, as well as on Reynolds number (14). Size also affects nozzlecoefficients (8, 9). This effect has already been demonstrated by Fig. 16 fornozzle diameters from 0. 100 to 0. 177 inch. To investigate the effe~t of size onthe overall pump performance -the interchangeable Tee jet pump Was assembledand tested with b =,0. 20, with three different sizes of nozzle and throat-diffusers.Results are sunmnarized tn Table 6. Note from the pump code numbers thatnozzle diameters are0.100, 0.141, and 0.173 inch, with proportional throat diam-eters. Conclusion: In range tested, size exerts essentially no effect.
Table 6. Size Efec.t on Jet Pump PergqormanceAreaRatio, b x 0. 20Oi MIL. 80, 's 1vA•
Soil ML-L-78, $ Synthetic, 190,150,135F.Nominal, RN 20,'000• ' ,
Jet Test WN Noma. N Nat aiN 0r map N axPump No. lb/min P at 0=0. 0. 9 per centNo. ~i
-100/224/190 208 29,'78 92 .0.50 0.28 1.1 26.2.141/316/308 190 44.6 100 0.48 0.28!, 1.1 25.6173/387/219 206 66.8, 100 0.50 0.29 1.1 26.8
Effect of Nozzle-to-Throat Spacing. - This design variable 'IS" is not includedin the theory; it must be determined experimentally. Although this subject iscovered in some detail in Chapter V the effect of S on the meas-trement of K 3 4should be mentioned here in connection with the K34-Rm correlation study.Particularly for larger area ratios (b> 0. 3), the agreement between test andtheory with change in 0 is affected to some extent by the spacing S.
WA.DC TIR 55-14~3 23
The K3 4 data in tables 3 and 4, plotted in Fig. 17, are only from testsfor which there was good agreement at high Reynolds number between theo-retical and experimental N - 0 curves, i. e. , S was at or near optimum forevery test. (Adjui~sting S for maximumn efficiency, also yielded the best matchbetween theory and e.-parimental results. This agreement is important, mincethe correlation sought is K34 vs. Rm: 0should not affect K3 4 ,)
V"
WA.DC TR 55-Wi~.
CHAPTER. IV
A CAVITATION IN THE OIL JET PUMP
A second major question to be answered in evaluating the jet pui-mip asan aircraft engine scavenge pump is' that of the upp4.r limit of practical oper -ating pressures and velo~citites.
From thfA standpoint of size a~nd weight of the pump and associ ,atedplumbing, it would be, desirable to operate at very high flow ratios, i. .e.,
~apwr - !--.:go amount (WS) from the--engine with a small primary flow (WN). Asshown in Fig. .3, large ratios may btýhad by using sm-all design area. ratios ofthe order of b 0.1 ok 0. 2.
The price paid for a high 0 caracteristic (high relative capacity) is lossof output pressure capacity: X valuesa for smv-ll b pumps are low. Since
d ~Nl
progressively higher iWet pressures Pj niust be. used to ,obtain a given'" outpin~~ pPsur d, as b is reduceid. Tha use of high nazzle rsurso cus
means high jet velocities.
*As shown below, high jet velocities and/or low auction.-port absolute'*pressure results in cavitation. This disturbance places definite limits on
pump capacity.,, An experimentally determined cavitation functioni is established,,.jpermitti~ng the design of jet pumps foi- high-altitude operattinn.
A., ,Evidence, and Consequences of Cavitation
Assume, for ease of discussion,' a pump operating with fixed, WN..andP0 . The amount of fluid pumped, W8 ,.is then controlled entirely by thxe dio -charse or back peur d- (In this way the performance tests reported er- jin were conducted.) As Pd is reduced, WS and hence 0. normally increasesto the limit,. 00, determined by the design area ratio b, Conversely, raising F-d Iwill reduce WS and 0 toward zero flow. An increasce in Pd above'tbut-of~f'Willresult in rejection of primary fluid from the side port.
WADO TR 55-343 7.5
The relation between the three pressures Pi, Po, a" Pd, and the twoflows WN and WS is uniquely determined by the N -0characteristic curve,whether primary flow or side port pressure are constant or varying. Noteagain that N, which fixes 0 on the applicable characteristic curve, is a ratioof pressure differences, N x (Pd-Po)/(PI,-Pd): it is independent of absolutepressures.
The Cavitatin& jet Pup - Under cftain conditions of high jet velocity Lhenormal experim.enýtal, and theoretical response of WSto change in Pd1 fails.Below a critical value of back pressure, WS attains a fixed value independent.Of Pd termed "limiting flow". WSL- The corresponding '.limiting flow ratio"
isJ
Fig. 19 shows several performance tests with llrnitifg flow. In Fig. 19. Ait was caused by raising the nozzle pressure drop from 39.A to 99 psi. POwas atmospheric in both cases. -In Fig. 19 B limiting flow was..caused by thrott-ling tesdpotpesrbewatmospheric. These oil. jet pump curves bearmarked, resemblance to cavitatirig water jet pump curves (5).-
J, Futherexampe~sof limiting flow wek-: presented earlier in Fg.; 10truh14 co~ig. eý,u willh b .0 o0. 6. All o heihRyod
number tests were ma#,e with P~~80 to 100 pot, all exhibited limiting,_flow.As show~n by the verti'al dashed line, effieCiency x N, drops tow~iardAzegro.
B. Ob s vations yqth-!1,Transpareant. 3et PUMPIn order to determine where cvtionoccur -in the jtpum n o
it results in limiting. f1~ a "tWo-ýdimensiooialk1 jet pumnp w&sL onstructed
from: sheets of clear plastic as shown in. Figil 2*0.
The n 'ozzle and throat areas were selecteA to_ a~pproxcimate jet PUMP.No. 100 /1.40/445.. The throat of the lucite pump, is square, I/4 by 1/4 inch,
wi a diffuaet` divergence angle of 10 degre~es. .The nozzle approach consistsof a metal cylindrical, 'Ino" wiproctbewnth on _inch outer lucite
* slabs. The hole in the tipis a slit 0. 05O inch wldý,,by 0. 230 inCh;L which forms* aribb n-shaped jet perpendicullar to the plteof the, pump-.
WADC TR 55-143 26
Perforrnance. - At pi w 150 psig, the transparent pump behaved quite likethe conventional cylindrical pump, including limiting flow. Maximum efficiencywas of the order of only 10 to 15 per cent. This it attributed to the unusualnozzle shape, and the large internal surface area in contact with the flow stream.
Visual Evidence of Cavitation. - Limiting flow w•a accompanied by the presenceof a "front" in the throat of the pump. From the point of mixing to the frontthe fluid appeared am a gray foam. Acroos the well defined front a suddenchange to a lighter color occurred.
Figs. 21 and 22 consist oi photographs of the pump in. four stages ofCavitation, caused by progressively lowering the back pressuire (labeled Pbin these pictures). The second picture shows the cavitation front near thethroat entry, Pb a 22. 5 psia. As pb is reduced to 21 and 17 psia in the last*two pictures, the front moves deeper into the throat; but WSL w 40 lb/minfor all cases with the front in the throat. Onset of limiting flow coincidedwith the appearance of the cavitation front at the throat entry.
High-Speed Flash Lighting., - The use of a high-speed electronic flash tubeY (General1 Radio Corp. Strobolux) operated at about 30 flashes per second con-
siderably aided interpretation of cavitation phenomena. Although the light wasnot, of course, "synchronized", to the lhuman eye, it frose the action momen--tartly. Color change across the cavitation.4ront was reversed: from light
2 --foam to dark liquid oil.I
Incipient Cavitation. - Under stroboscopic iighting the nozile or primary flowrate was gradually increased. Up to a/nozzle pressure of about 30 psig,. pri-mrary and secondary streams were clear. ,-At 33 psig (jet velocity about 501 ft/tsec) Ithe first signs 'of cavitation appeared at the jet boundary: small bubbles whichgrew and coflapsed. At the same time (a) a distinct cavitation wadi1 was~d6-.tected, and (b) bubbles were first found in the diffuser.. The latter is evidentlya ,result of air "evolved in cavitation and not yet re-dissoIved in passage throughthe diffuser of the-jet pump.
Choking ,Flow. - Further incrolase in -jet velocity increased the width and length 4of, the cavitation disturbance; smore and more air bubbles could be seen in thediffuser. Not until the cavitation "void' filled the throat entrance, did "choking"nlow occur.
:High-Speed Flash Picturese of Cavitation. - "our stages of cavitation areisaown in Fig. 23. These pictures were made with a miniature camera at f4. 5lens opening on Super XX film. "Ooean-flaish" technique was' used. The high- 3speed flash (40 microseconds) was obtained with a General aadio Corp. "Strabo- Ilux" unit, wired for push-button single-flash use.
In the top picture the jet velocity is slightly above that corresponding toincipient cavitation. The air cavities, although slightly blurred, are quite evident.
W~kDCTE ~27_ _ O _ ___-343~1
The gray cast in the diffuser is the result of the air released in cavitation and
not yet completely redilsolved.
The second picture was taken at the point of choking or liniti!Ulow_The cavitation disturbance has grown sufficiently to fill the throat entrance.No change in the cavitation whistle was noted at this point.
Further increase in cavitation intensity moves the cavitation frontdownstream an shown in the two bottom pictulres. The increasing amount offine air bubbles released from solution as cavitation intensity increases, isindicated by the gradual change in gray shading of the diffuser fluid, from thetop to the bottonm picture. Both primary and secondary streams enter thepump free of entrained air. A sight glass in the discharge line several feetfrom the diffuser showed clear oil again. The air had redi-svsolved in the oil.
Pressure Jump at Cavitation Front. - The transparent jet pump was providedwith three static-pressure taps in the throat section. See Figs. 20 to 23. Bycontrolling the back pressure the cavitation front could be positioned betweentwo of the taps. With a total flow of the order of 50 lb/min., the pressurewas observed to suddenly increase by as much as .1 or 12 psi across the front.
This jump is apparently the result of a sudden deceleration of the liquidoil particles at the fralt. It is suggested that primary and secondary oil partic-les travel from throat entrince to the cavitation front in "free flight", surroundedby air, vapor, and foam. At the cavitation front the "void" collapses and the'liquid decelerates, filling the throat section.. Calculations oa pressure recoverybased on this hypothesis agree well with the observed pressure Jups. Thepressure relations are also affected to some extent by the evolution and solutionof diisolveA air. Cavitation' is kntown to be effective in releasing air froma olution. Also, air dissolves relatively more alowly than it evolves (15).
Other york with the transparent jet pump included Control of primary
flow air content, operation without side flow, operation on water, and use ofthe pump body as a cavitating venturi., Results are summarized below.
Summary and Conclusions
1. Covitation first occurs at the jet boundary near the nozzle exit. Uponvis~ual appearance of cavitation,
a. A whistle it detected, andb. Air bubbles appear in the diffuser.
2. An incr.ease in jet velocity, or a decrease in mixing zone pressure causesthe region of disturbance to spread and extend downstream toward thethroat. Oil in diffuoser beco.-mnee increasingly cloudy from air bubbles.
W& M CT 55-143 28
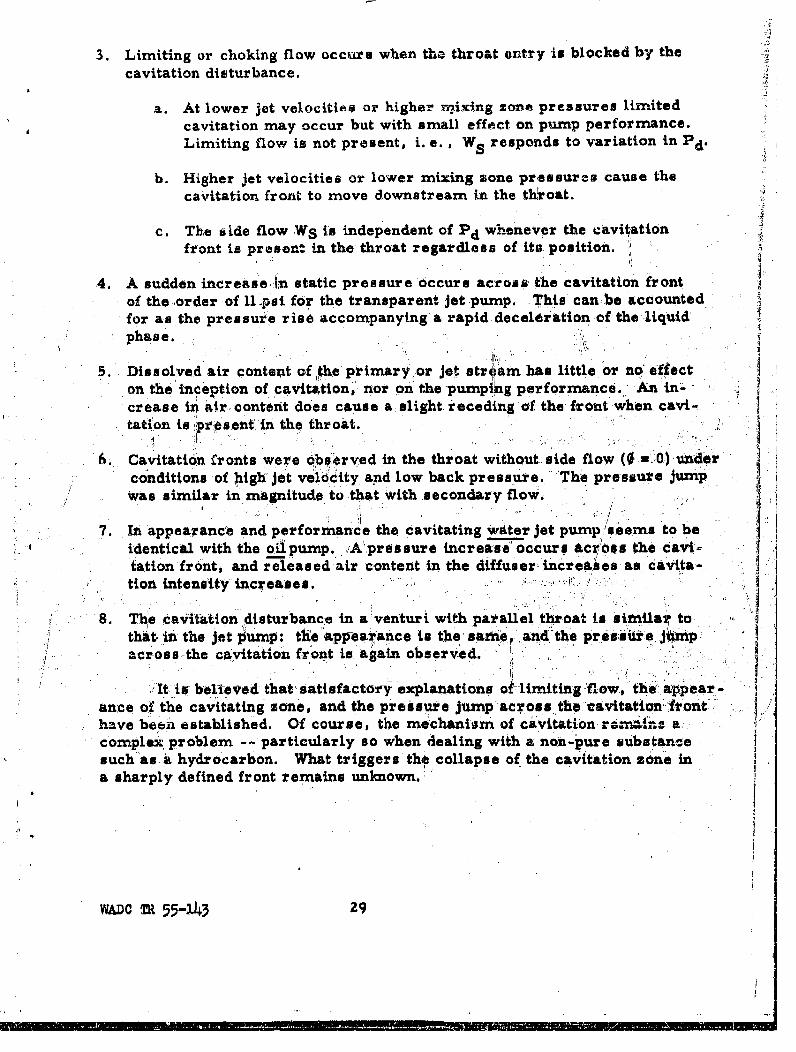
3. Limiting or choking flow occurs when tho throat ontry is blocked by thecavitation disturbance.
a. At lower jet velocitie~s or higher nv~ixing zorne pressures limitedcavitation may occur but with smnall effect on pump performance.Limiting flow is not present, i. e. , W5 responds to variation in d
b. Higher jet velocities or lower mixing z~one pressures cause thecavitation front to move downstream in the throat.
c. The side flow .WS Is independent of Pd whenever the cavitationfront is present- in the, throat regardless of Ito' position. '
4, A sudden increase iAn static pressure Occurs across, the cavitation fr ontof the order of ll~psi for the transparent jet pump. This canbe accountedfor as the pressur~e rise accompanying 8 rapid deceleration of the liquid'phase. 1
5. Dissolved air contenit of the primary,,or jet strýýam has little or no eftecton the incepto ofvitAtion, nor on the pump4ing performance. An in-ýcrease in air. content does. cause a, slight receding of, the front when. cavi-.tation is prea .sent in the throat.j
.6. Cavitation fronts were observed in the throat without side flow (0 0)underconditions of high j t vetocitty and low back pesr.'h rsuejmwas similar in magnitude to that with secondary flow.
7. In appearance and performance the cavitating waiter jet puinp seems to beidentical with the oilpump. 'A pres sure increase" occurs acr.oss the cavi-tation fro'nt, and released air content in the diffuser- iincrea~es -as.cviation intensity increases. i
8. The cavitation disturbance in a venturi with pai'allel throat is similar to-that in the jet pm:the 8appeaigance is the, Sam'l and the pr a sifreJ*impacr-oss-the cavitatioin -front- is-again observed. '
It, in- bellevied that' satisfactory explanations of limiting flowf the. appearance, of the cavitating zone, and the pressure jump'lacross ,the eavitation friont.have beeii established. Of course, the mechantirm of -cavitation. rem."fn: a.-complex, problem -- particularly so when. dealing with a, non-pure substancesuch as, &I hydrocarbon. What triggers the collapse of the cavitation zone ina sharply defined front remains unknow.'m
WADC TRl 55-143 29
C. Limnitingt-Flow Theory and Tests
From th'a continuity relation and the side flow energy equation (4)in Appendix I.
fSA5 8 VSa
V~a (40)
Eq. 40 refers -to: the throat-entry where the secondary flow stream area isassumed* to be AS& = Am - AN, 'the pressure is, Pa, and the ve1~city o'f WSis V5a, Thus,ý WS to deter mine d by Fo P Limiting flow WqL; would occurif the throat entry pressure reached, a ixe minimum, Pa,- P.' 'If this con-jecture is correct, Eq. 40 shows tha~t
VSjL and/or WSL 2 values plotted versus P -PC should be linear.
This linearity was shown to be true Ifor the, cavitptlUU water jet pump(5), Where PC Warn takVO&to be ,the vapor pressure o;f water, ."Pv.:
Oil Cavitation. -Compared with water, oilcavitation is: complicated by twodifferences:.
1. Lubricating oil -contains up -to 15 per Cent bq, Volume of dis -
solved air which eyolves in proportion to .a decrease in abso-lute pressure. Water 'contains about. onk tenth the ~mouiht.
2A hydrocarbon lubricating oil. is a mixture, of tnany ,fractions ofdifferent-vapor pressu1re. In general,joil vapor, pressures arequite'low (15).
Limiting Flow versus po, absolute Pressure. -In the absence of alkownTcritical pressure, limiting flow data for cavitig oil jet pumps were .`plotted.against absolute -scin otprsu& WBL s. Pa. Such cui~ves, for several
upsformed essentially straight lines, usually paussn hog h rgnoCoordinates. The magnitude of WSL at-any one pressoure, of Course, dependson the size of the pump, and the area, ratio b.
*The primary stream, or jet, is assumed to enter the throat with area equalto noz.zle area AN. Jet spreading or irtxing before throat entry is ignored.
+ Lo wear came p refers to psi units, capital P is lbf /ftZ
30WA.D TR 55~-14~3
Limiting-Flow Function, Y. - Converting limiting flow data to a velocity basisby dividing by flow stream area, ASa, eliminates pump size and reduces alldata to a c~ommnon basis as shown below. By definition the limiting or "choking"velocity of the secondary fluid entering the throat is,
VT-WSL = WSL b (41)~S AN "D
The Lirniting-Flow Function, Y, is:
jPVSL_ WSL 2 b2
lY Zg 144 f Zg ANA (I -b)Z- psi (42)
The theoretical value of Y is,
y*Po,-PC d
I + K2
Test Procedure.- Limiting flowý is indicated by the sharp break. in the N -or 0. experimented. curve. Once'limiting flow is, reached, further reduc tionin back pressure Pd, heieN, hasm no effect On, WSL, or OL - This S~imPlifietes at, p r9ceadilre : pumps,a: ,re operatead at. fixed primary flows, WN, with, back,pressure Valve opened Wide; to ýprovide minimum Pdi- tngflw WSL, arethen r'ead from the sideflow rotameter ver'sus..the independent. variable Po.,
WSLvaueswee cnvrted to Y Woritnj in, pqii) with Zq. 42.and ,plotted.
aga~.ast suction port'"presoure.. Fig. 24\shows the ries~tlts for 'tests 'oft threepup fare 8i:s .01. 20, 0. 30 and 0.'534. (pum~p,,detailsFigs., 8 and 9.i)-Teoil warn MlIL-L-6081A* Grade-.1005.ý 0 aie o na 3-0 are l1et
=0. 20r In the rniddl, anod points for b 0). 534 are, highest. This i's attribuited'primarily to effect of noiizle-to-throat spading S. ,As shown in the, next cha~ptran extri larg sacing suppresses, the onset.,, of limiting flow, at low p0 values.The *elation Y u0. 6 8 P0 aperio represen~t the, general experimentakl correlation..
In-this test po valuaes Were' obtained by evaciuating the entire (closed). oilcircuit, including the overhead oil tank. Tank pressuree and auction port ~pres-sure are sessen 'tially equal (the gravity head compensates flow losses). Theresults in Fig. 24 simxulate high-altitude oil syuta.n operation. Dissolved airis readucead as the tan~k pressure tiv reduced.
UMD TR 55-343 31j
Cotolb Trttig Side Flow. - Suction port pressure can, of course, bedepressed simply by closing a valve between the tank and the pump. Fig. 25shown Y values for tests made this way. The oil tank was vrated to atmos-.pheric pressure at all times. Consequently the oil may be regarded as satwilatedwith air at one atmiosphere. Comparison of the line, Y m 0. 68 "po, with thecurve in Fig. 25 sh~ows how higher dissolved air content aggravates cavitation.At p0 = 4 poia, Y Ua about 25 per cent below that for the "altitude" tests, Fig.24, where ai~r 'was rcnwrad by rnaiUntaining the tank under. vacuum. This dif-ference shows why high-altitude operation should be simulated with the entiresystern under altitude pressure, ncei by throttling the pump, This applies. toconventional rotary pumps, and to lube arad fuel system, tests in general aswell as to the problem at hand.
Effect of 011 Proporties. - As shown above the maximum or critical inflowvelocity depends on po - pr, where pC is some minimum value., (the vaporpressure in the case of water). Y. as divorced from pump site, would beexpected to be, a function of fluid properties such an vapor pressure, air-solubility constant, viscosity and perhaps surface tension., As shown by Figs. 24and 25,ternperatureo of 100 and 150 F gave the same results,
The currmntly approved synthetic (diester). oil'kMIL-L-7808 has an ex.-tremel y low vapor pressUre tha 0hudsprs cavtio (raise Y)I
"vapor"CaVtation 'causes limiting ilow
Vapor pressure apparently ýaxeito littleo offect~onicavitation: In F1ig1'26,'Y vs po data for Grade 1005 oil ar, compardwt similiar data aenwtMIL-L-7808 oil. ;These t~ests, as well as, other, here omnitted, show esslentiallIyno differeant~e: betweeon the. two .oils. Release of dissolved air or "air cavi-tationl" is apparently the,:,meckarnismn of limitnGj flow',, not, =apor cavitati6n.I
Temprar Caitaion.Egreusion by Air Removal.~ - yoerating the entireoil sytmUnder high vacuumr for .a prolonged period, most of the air canbestrippe,,d out bf solution. Y valuesý\ are nearly .doubled by'-this- prodedure oas-shown ýy Fig 270 tB Thes C toDprino the bat consisted of taki -a'series cif WgjL readings aso tank and pb pressure was-incr~ea'sed fii- a rapid_"dive! to% sea, level1 conditions- The top of the loop shows that-a it-value 6fover 15 pai was reached;. After a few minutes operation~, air andubility equilibrium.was !again 'established aid Y dropped-to 10-ps-i, closi3ng-the loop.r Synthetic oil,was used ii, this test., This hysteresis loop effect-was also noted for Orakde 1:0 05
*Vapor pressure of the synthetic oil at 300 F is onily 0. 1 com;par;ed to '80 rmmHg. for Grade 1010 oil (16). Vapor presaure of Grade 1005 oil isnnot available,but is well above 80 mm Hg.
WOD TE 55-1143 32
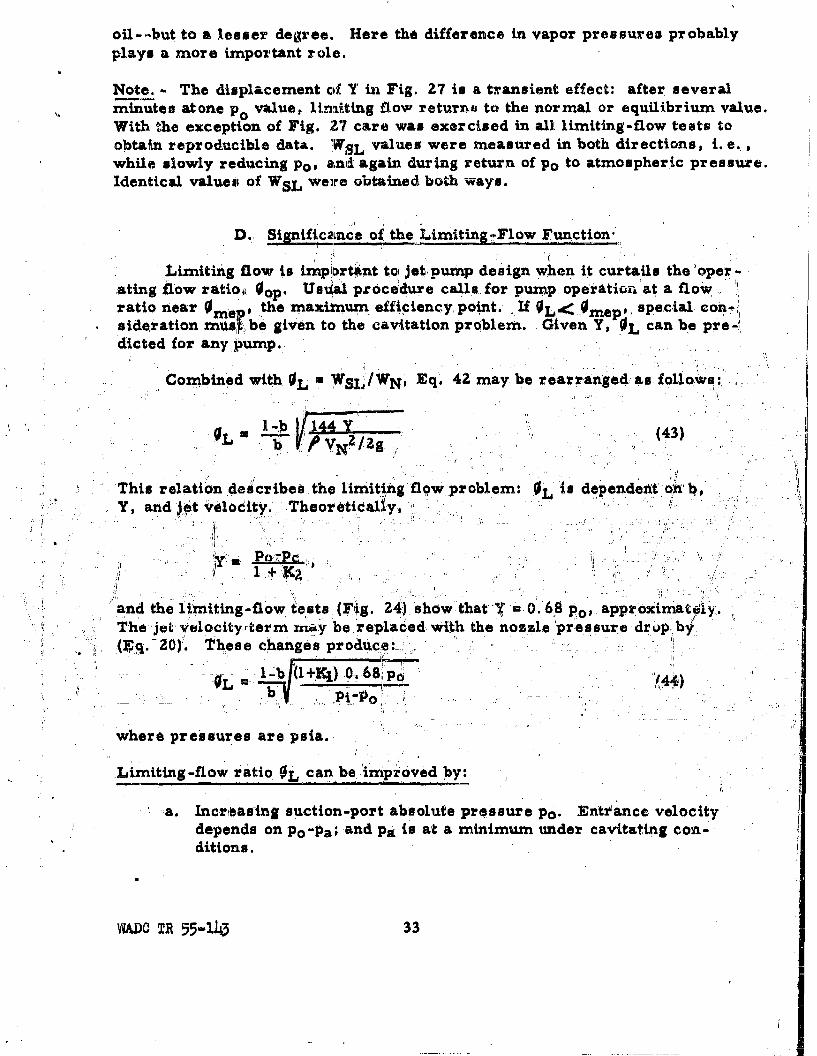
oil- -but to a Xesser degree. Here the difference in vapor pressures probablyplays a more important role.
Note. - The displacement of Y in Fig. 27 in a transient effect: after severalminutes atone p0 value, limi~ting flow returns to the normal or equilibrium value.With the exception of Fig. 2.7 care was exercised in all limiting-flow tests. toobtain reproducible data. W, L values were measured in both directions ie.,while slowly reducing poe and again du.ring return of Po to atmospheric pressure.Identical values; of WSL we~re obtained both ways.
D., _____iaac of the Limiting -Flow Function-
Limiting flow is impOrtant to jet, pumnp design When it curtails the 'ope r -oting flow ratioii Oop. Usijal procedure calls for pump. operaltiontat a flowratio near 0 e the maximum, efficiency poi~nt. If OL< 0 e'scilo-
sidratonrtis~be given to the cavitation problem.Gve 0 Lcnbpr-
dicted for any poump.
Combined with. OL *WSIJ/WN#,Eq. 42 may be rearranged, as follow.
* 1-b ~Z/2g(43)
This relation de~cribes the limitn flw problem: 0Lis dependefht ot 'b,Y, and, ''t velocity. Theoretictaliy
and the limiting-flow. tests (Fig141hwtht''=0 6,8 pop' approxirnatý4yThe jet velocity/term Ynay be replaced with the nozzle pres~sure drop .bf
(s.20);. These changes produce
0L 1-b L+1 ) 0. 6 8 !; 144OL b
where pressures are psia.
Limiting-flow ratio OL cn.be improved by:
A. Incriiasing suction-port absolute pressure Po. Entrance velocitydepends on Po-pa; and pa% is a~t a minimum under cavi1tating con-ditions.
WA.DO TR 55-143 33
b. Increasing the relative area of the secondary flow stream,ASa/AN xfl -bYb, by enlarging the throat (reduce b).
c. Redlucing the jet velocity (reduce pi-p0 ).
Effect of Jet Velocit.X. - if the jet pump is operating under limiting flowconditions, the throat-entrance velocity of the secondary tflud is at a maxi-mnum. Increasing-jet -velocity, as by increasing WN, will not affect WSL.Limiting flow ratio will decrease inversely to WN.
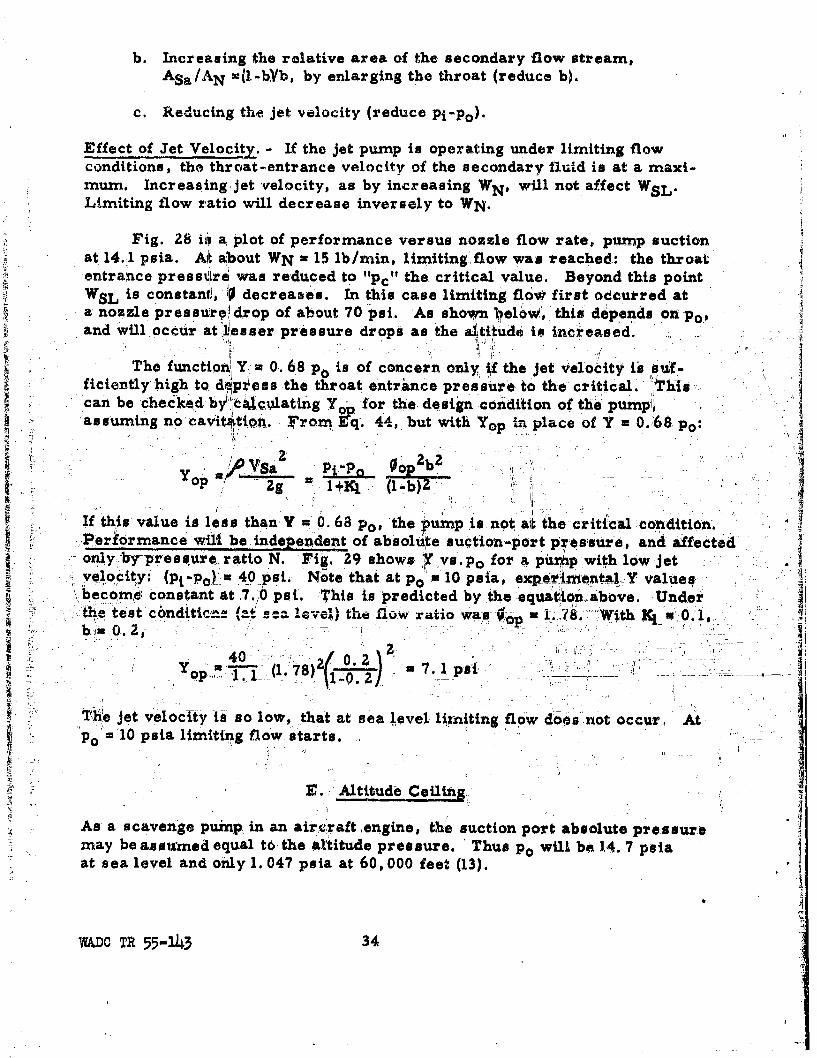
Fig. 28 Vii a. plot of performance versus nozzle flow rate, pump suctionat 14.1 psia. At about WN = 15 lb/mmn, limiting flow wa-s reached.: the throatentrance pressý4re was reduced to "1pc" the. critical value. Beyond this pointWSL is constant, ~0decreases. In this case limiting flowfitocreda
anozzle pressu~re;'drop of about, 70 psi.. 0A hw eo, hsdpn.oand will occur at l10esser pressure drops as the alltitudei is increased.
The function' Y =0.. 68 p0 is of concern only ifthe jet Velocity is suf-ficiently high to d~pesthe throati enric~rsuet h"ciia.`!hiscanl be checlked by' 1̀t~atng for the design condition of the pump'8
asuin ocv:Fi~..rom z.q. 4,btwth YOP in .place o f It, 0.68, po:
y j0 Si P- 0 0 2 b2I
OP2g I+KQi
If this value io less than Y a0. 68 po, 'the pump is. not at the critical ýconditi~n..-P~ertorrnance will be indgenezdent of absoli~e suction-port pr-esisute, and affected.only bypr'es sure.. ratio N. Fig. 29 shows. Y vs. po for a puýtx with low jet4velocity: (pi- 0 40psi. Nbte that at p0 * 10 psia, experlezalYvue
becomnO constant at 7.0 ,psi. This is predicted by the 'equition. above. Unde
hetest conditicnae (. e ee)t.io ai a 7.Wt 1 e01baZ - -h lw ai
40- 0.
The j et veoit 01solw that at sea level limiting flow does 'not occur, Atýp0 `10 psia limiting flow, starts.
720
E.. Altitude Cetling
As a scavenge pump, in an aircraft ,engine, thie suction port absolute pressure ~may be asowumed equal to the attitude pressure. 'Thus p0 will be J14. 7 psiaat sea level and only 1. 047 psia at 60, 000 feet (13).
WAbDO TR 55-1)43 34
Equation 44 may be arranged to express minimum suction port, henc aaltitude, pressure:
Po OL b2 (pi-p.) (44a)(1-b)2 0. 68 (l+K1 )
At the. "altitude ceiling" the operating flow ratio Oop equals8 the limiting flow
rato:.o = OL' by definition. Assuining that normal design procedure pro-vides for O0,,:Z/3 0 ep the OL a/3 Ormep. In Chapter I a useful (approUxi-mate) relation between Ompand b was presented.:.
1 4b0 xnep -(3 2)O4e
tinder these co'nditions,
0L2 = ~(l~b) 2 and Eq. 44a becomes
4 (1-b) bP (pj-p) (~
M i i m m 0 9 ( 1 - ) 0 6 ( l + K ) .
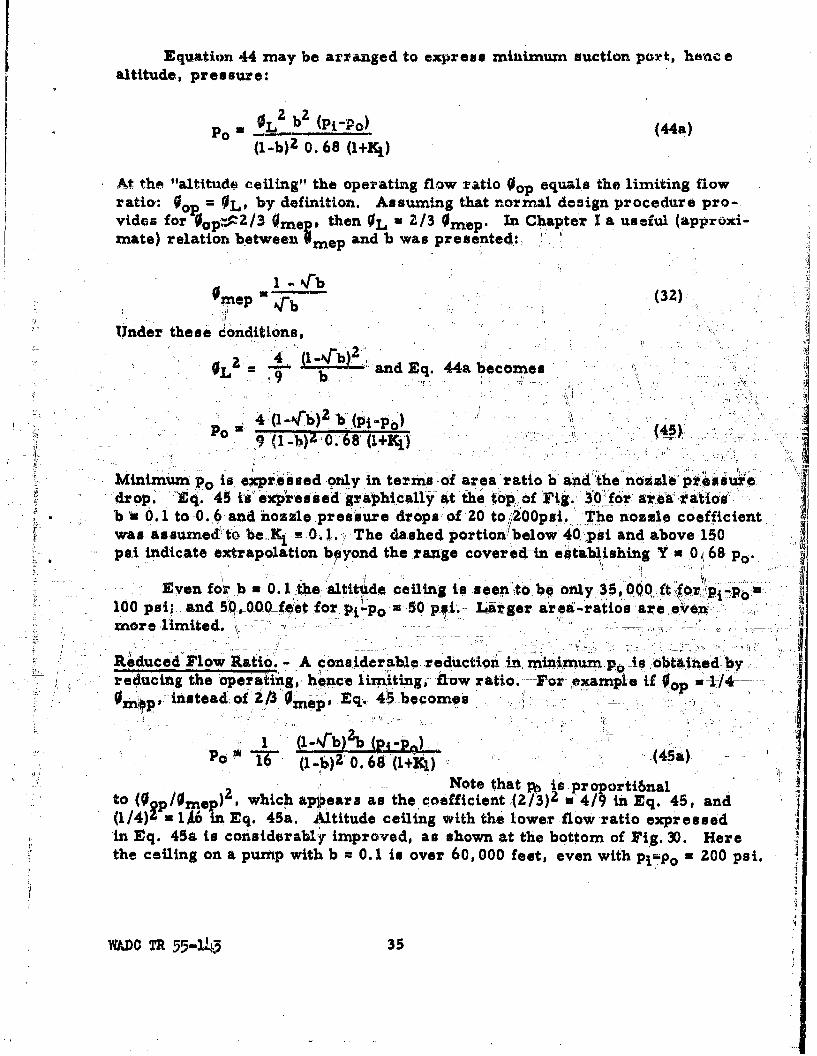
MininuPO sexpressed -only int -sof area ratio b* and the nozzlei preesure
drop. .4 is' expressed gahically at the top ,of Fig. 3for &*eat datof-b 'a 0. 1 to -0..6 and nozzle pressure drops of 20 to!2O0psl. The nozzle coefficient
wasasumd t b m:~0.1 The da~shed poto eo 0si and above 150pa~iindicate extrapolation b~yond the rauge covered-in establishing-Y n O,6 6 p0.
Eyen for 0.1 Ithe altitu.de coiling is seen to be only 3S, OQQ ft ,for,,,pj-100 psi; and50 .0-00 f.eet for, Pi-po a 50 x LA* ger- re rto r.eýemore limited. pýl. arartosaeee
Re~duced, Flow Ratio. - A co6nsider able r eduction in, minimmp 48 ba~e by:reducingthe operating, hence limiting flow ratiov For- exiample ifý0~ L /4
instead'of 1/34 :,,,'Eq,; 45-becomes-
1 (l~-Nf)b (p4papo (1-b6) 2 .0. 68 (i+Kl)(4)
Note that p i pro port16nalto(0/4)/Oulnep which ap~ears as the coefficient.(Z/3)2 w'4/9 in Eq. 45, and
(1/) 16 inEq. 45a. Altitude ceiling with the lower flow ratio expressed'in Eq. 4S& is considerably improved, as shown at the bottom of Fig. 30. Herethe ceiling on a pump with b 0. 1 is over 60, 000 feet, even with p~irp0 200 psi.
WADO TR 55-12I7; 35
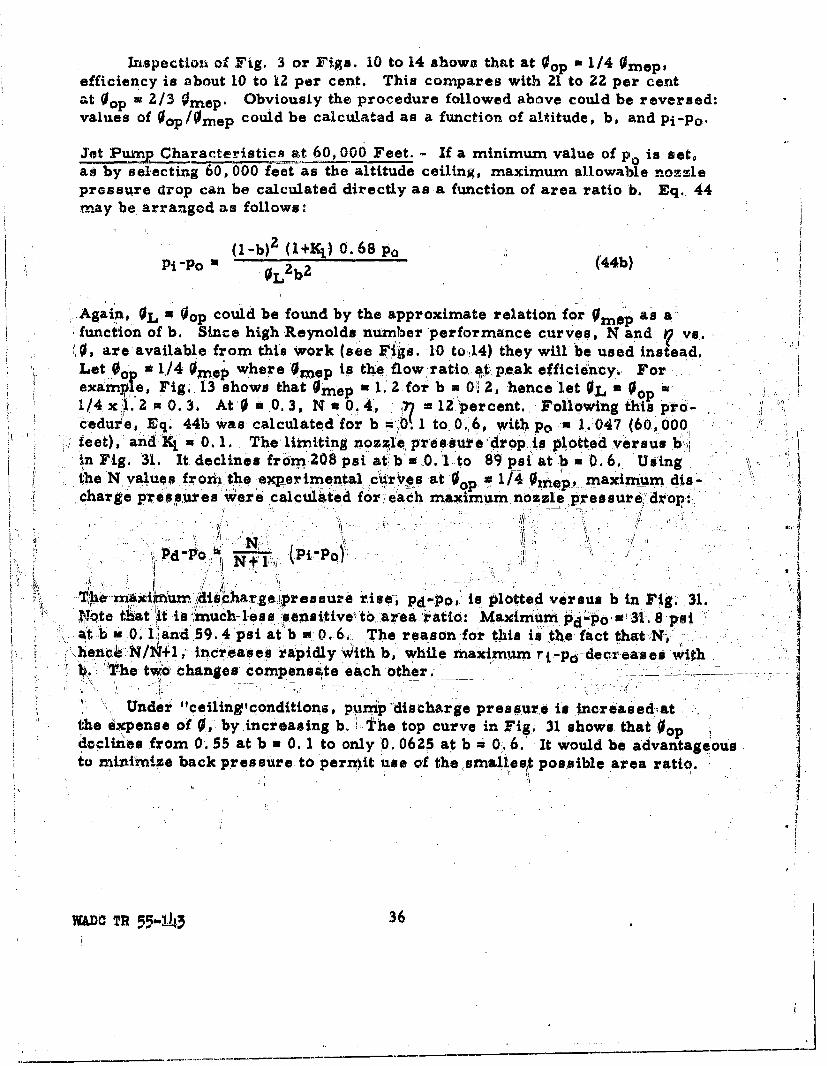
Inispectiozn of Fig. 3 or Figs. 10 to 14 shows~ that at 01op w 1/4 omepsefficiency is about 10 to 12 per cent. This compares with 21 to 22 per centat OOP a 2/3 0mep. Obviously the procedure followed above could be reversed:values Of gop /Omep could be calculated as a function of altitude, b, and pi -po.
jet am harctersti i;at 60, 000 Feet. - If a minimum value of p. is not,ad by selecting 60, 0 -00 feet a's the altitude calling, maximum allowable nozzlepressure drop can be calculated directly as a function of area ratio b. Eq.. 44may be. arran-ged as follows:-
(1 -b) 2 (K)068 PoPi -PO * 0 (44b)
.ýAgain., OL x Oop could be found by the approximate relation for 0'mei as afunction of b. Since high Reynolds number performance curves, N and vs.
0,are available from this work~ (see Ff a. 10 tW14) they will beuse'd instead.FLet 0~ a 1/4 Omep where Omep is the flow 'ratio aýt peak. efficiency., For
eximge, Fig.. 13 shows that.Oepr 1. 2 for a02,hceltL
cedure, Eq. 44b, was calculated for b = =1 ,06, with o31. 047 (6.0, 000
feet),: anid K1 0. 1. The llkrniting no~zj~e preesue'edrop As plotted versus b~iin Fig. 31. It. declines from Z08 psi at b w 0.1 to 89psfat'b= 0.6. 'Usingthe N values frorm the expermental cir~ a ~ ~14 mp maximum dis-
cago pressures were calulte for 'each maximum, no~zzle pres sure, drop:
Nt
Noe that is,,nxuc -ess sens'ittive ,to' area 'r~atio: Maximum pd-p ̀6 18 s
at - , lnd'59. 4 psit atl b a 0.6&., The' reason for this is the fact that- N'~hec~N/~!+, nceasg apdlywih , hile mkaxi,~i ri -decreases with
! ~.The two~ a:ge comnponsate each other.;
"Udr"celling conditions, iodshrepsueinIcaedtthe epneof 0,by incresn b.khe top curve in Fig.. 31 shows, that'Oodoclihies from 0,.55 at b o 0.1 to only 0. 0625 at b =' 0 6.' It would be advantageousto mialmiza back pressure to permit 'use of! the smnallest possible area ratio.
WADO TR 55-11i3 36
CHAPTER V
NOZZLE-THROAT SPACING, AND THROAT DESIGN
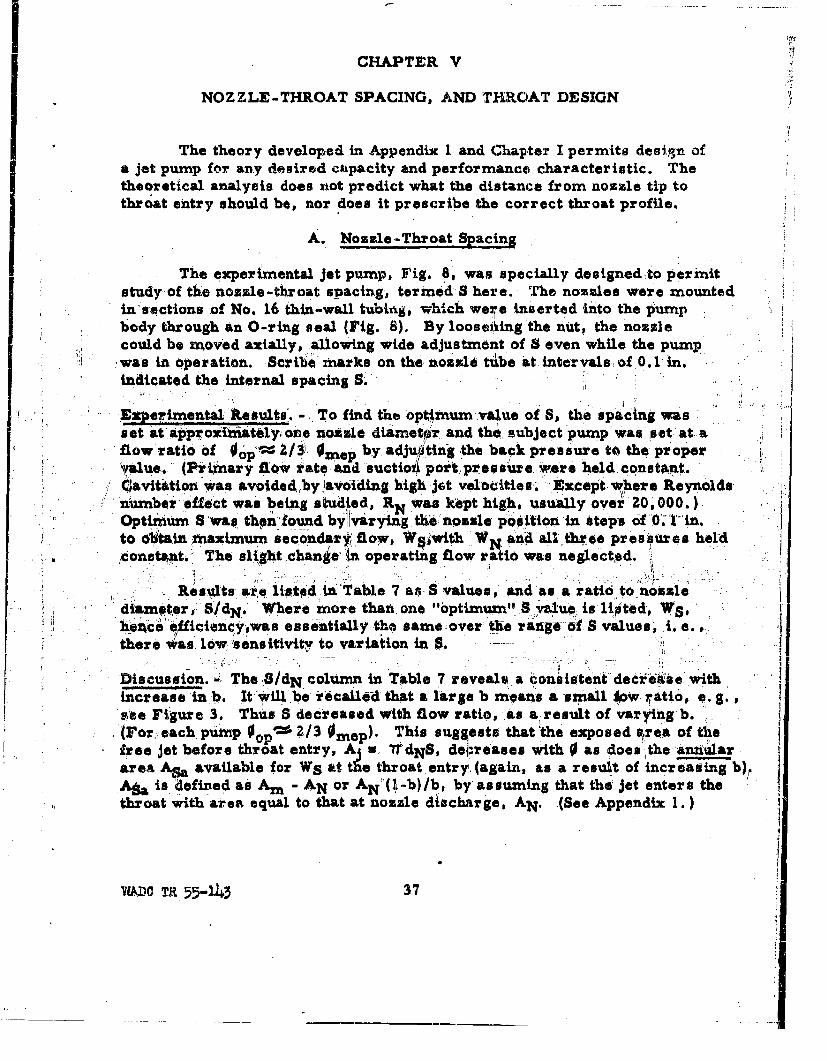
The theory developed in Appendix 1 and Chap-ter I permits designi ofa jet pumzp for any desired ciipacity and performance characteristic. Thetheoretical analysis does rnot predict what the distance from nozzle tip tothroat entry should be, nor does it prescribe the correct throat profile.
A. Nozzle-Throat Spacin~
The experimental jet pump, Fig. 8, was specially designed to permitstudy of the nozzle-throat spacing,, termed S here. The nozzles were mountedin sections -of No. 16 thin-wall tubing, which were inserted into the Pumpbody through an 0-ring seal (Fig. 8). By looseiiing the nut, the nozzlecould-be moved axially, allowing wide adjustment. of S even while the pump0-wasn in operation. Scribe m~arks on the' nozzle tube at intervals, of. 0. 1 in.indicated the internal spacing
]Fperýimentaljtesults.* - To find the optimum value of S, the spacing wasnet at approxithiatbly,;one nozzle diametir. and the, subject pump was set at aflow ratio of *op !/1. 0mep by adju~ttinj the back pressure to the propervlued (Primary flow rate andd suctio4 part~press ,urea were held. cdnst~nt.(.avitation was avoided.,by lavoiding high jet velocitie. c Except. 00ere Reynolds-
uumbe*k effect was being studied, RN was kept high, usually over 20, 000.),Optimum S wa, thn. found byikaryig thaozepsto:i tp fo nto 6 tan miaximum~ secondaryj flow, W8Swlth WN and aWll three presi~ures held,conat",L.' The slItght .chanie in operating flow ratio was negleckpd.
- eults &ae listed in Table 7 ar, S values, and as a ratio to'nozzleadiarnit~er, S/dN. Where more than one "optimum"0. v ale is Iti~ted, W5 ,hence eafficianc rpwas essentially the same over the range o aus ~.there a*as. Iow.'seonsitivity to var iation in S.--
Discuasson. -, The .S/dN column in Table 7 revealti-a consistentL decre'ase, with'increase in bl. It will ber recalled that a large b means a -smnall tow :ratio, 0.g.ofie Figure 3. Thus S decreased with flow ratio, as a. resut of var~fin~g b.(For: each, pump 0,'= 2/3 0 mep). This suggests that'the exposed aýrea of thefree jet before thr " t entry, A~ w. 7dNS, dai reases with 0 as does the A'raiulararea Asa available for WS at tie throat. entryl again, as a result of increasing b).
Aais, defined as Am - AN or AN(01-b) /b, by as su~mng that the jet entersa thethroat with area equal to that at nozzle discharge, AN. (See Appendix 1.)
VMD0 TR 55-143 37
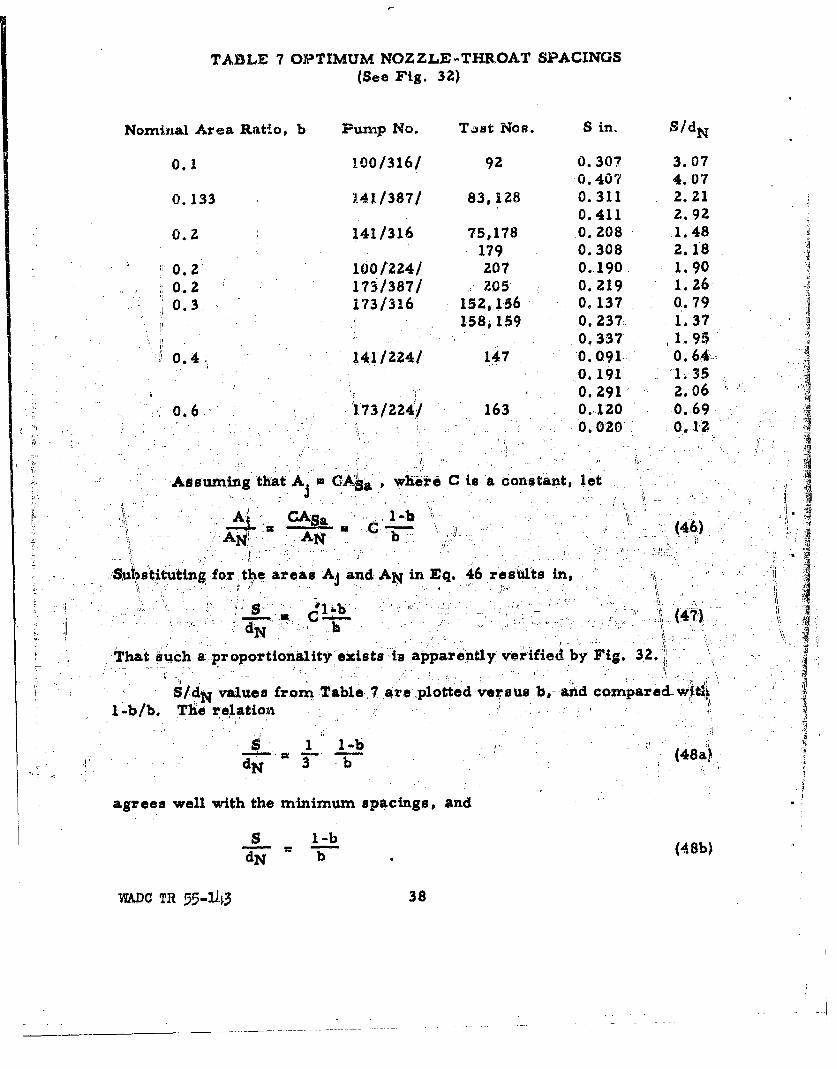
TABLE 7 OPTIMUM NOZZLE -THROAT SPACINGS(See Fig. 32)
Nominial Area Rixtio, b Pump No. Tist Nos. S in. S/dN
0.1 100/316/ 92 0.307 3.070.407 4.07
0.133 141/387/ 83,128 0.311 2.210.411 2.92
0.2 141/316 75,178 0.208 .1.48179 0.308 2.18
0.2 100/224/ 207 0-190. 1.900.2 173ý/387/ 205 0.219 1.260. 3. 173/316 152, 156 0, 137 0.79
158i,159 0. 237: 1.370.337 1.9
0,.4 A41/224/ 147 .0.091. 0. 64L0.191 1.35
0.291- 2.06
0.6 173/224/ 163 0.120 0.69
Assurning that A bi cAa whr s a cosat, let
CAS 1-b'AN C- (4)
SOtstituting for, tke areas Aj and AN in I~.46 results In,
C ~(47)
That such a, proportionality exists-iu apparently veriAfied by Fig. 32.1
g/dR values from Table, 7,are plotted versus b'- arid compared-witil1-_b/b. Thed relation
d -b (48a,N 3
agrees well with the minimumn spacings, and
- -i-- .(48b)
WADC TR 55-1)43 38
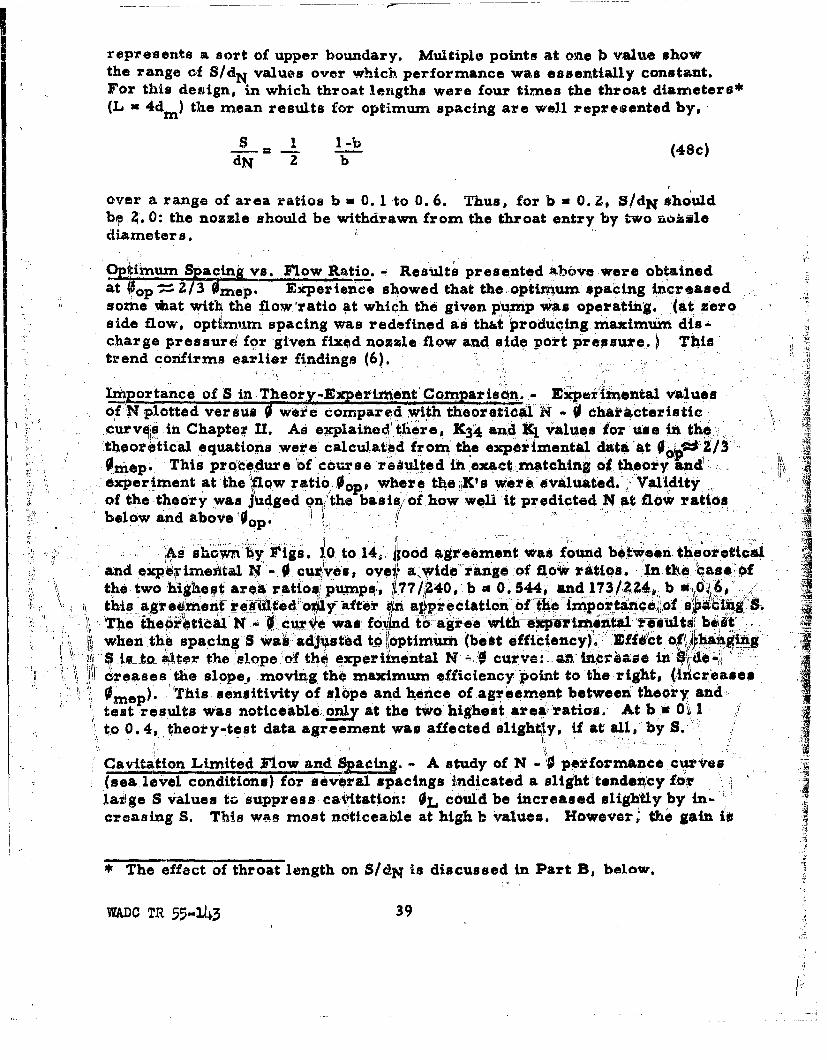
represents a sort of upper boundary. Multiple points at one b value showthe range of S/dN values over which performance was essentially constant.For this design, in which throat lengths were four times the throat diazn.kterl*(L a 4 dmn) the mean results for optimum spacing are well represented by,
S _ 14)(48c)dN 2 b
over a range of area ratios b a 0. 1 -to 0. 6. Thus, for b = 0.4Z S/dN *houldbe, 2. 0: the nozzle should be withdrawn from the throat entry by ttwo rmokslediameter s.
9pi'mmSpacing vs. Flow Ratio. Results presented kbbve -were obtainedat ýo 2 3 Omep. Experience showed that the optirmur spacing increasedsome mkat with the flow'ratlo at which the given pump was operating. '(at zeroside flow, optimum. spacing was redefined as' that produicing: maximuim discharge pressure' for given fixed nozzle flow and side Port pressure.) This.trend confirms earlier findings (6).
Izý.iortance of S in Theor.- eriment Corn~~arisdr . Ekp.*imental valueso~fN plotted versus 0wibie ciomparpdwt theoretical N -0 0 ch'cersicurves iCate .Asxplaiftaec~t thre, I 4 and Ki valuesa for use In ththeorti~cal equations we re calculat~d firom the experimental. data at 00:1:0/13Oz2iep. ý,This procedure of course rekulted in exact ma~tching of theory and~
exprien atth fow ratio where the A's were, evaluated.,Vldtof te teorywasJ~dged Qn1 the basisf'of how well it predicted N ptfljowrts
below. and above 10i
a- Ow Ny "is. iato 14..' ~ood ageement was found between theoretica
and exp'iiezta N,- cur'veu oel a ide" rang ffo~ ratios.,I the aae ~the two -highest area ratiosipump,, j177)-40 bu[4~ad73/IZ4,- b. 6this agrehien remtda ~ 1 fe n e preciatto ofteQ~rai~~f44 s
The te~r~icalN - curske was find to aree withaz~i~a ral~ etwhen 'the spacing S wias adjusetoopiu (bea fiiny.El'to~ign
Sis to- alter the spe`o tho axperine~ntlN '0cr:annrae inde'i6l ceases the slope moig h aximumn efficiency point to 'the right, (zIncreases
0mep Ths ensitivity of slope and hence of a~gweement between'theory. and..test results Was notic~eable".only at the t'~o highest area, ratios. At bv Og I~to 0.4, theory-test data agreement was affected slightly, if at all, by S.
CavtatonLimtedFlw and Spcin. A study of N - 0 erformance curves(sea level conditions) for several spacings indicated a slight tendency fOr4latige S valuesa to suppress cairitation: OL could be increased slightly by in-'creasing S. This was most noticeable at high b values. However; the gain tis
*The effect of throat length on S/dN is discussed in Part B, below,
WADO TR 554343 39
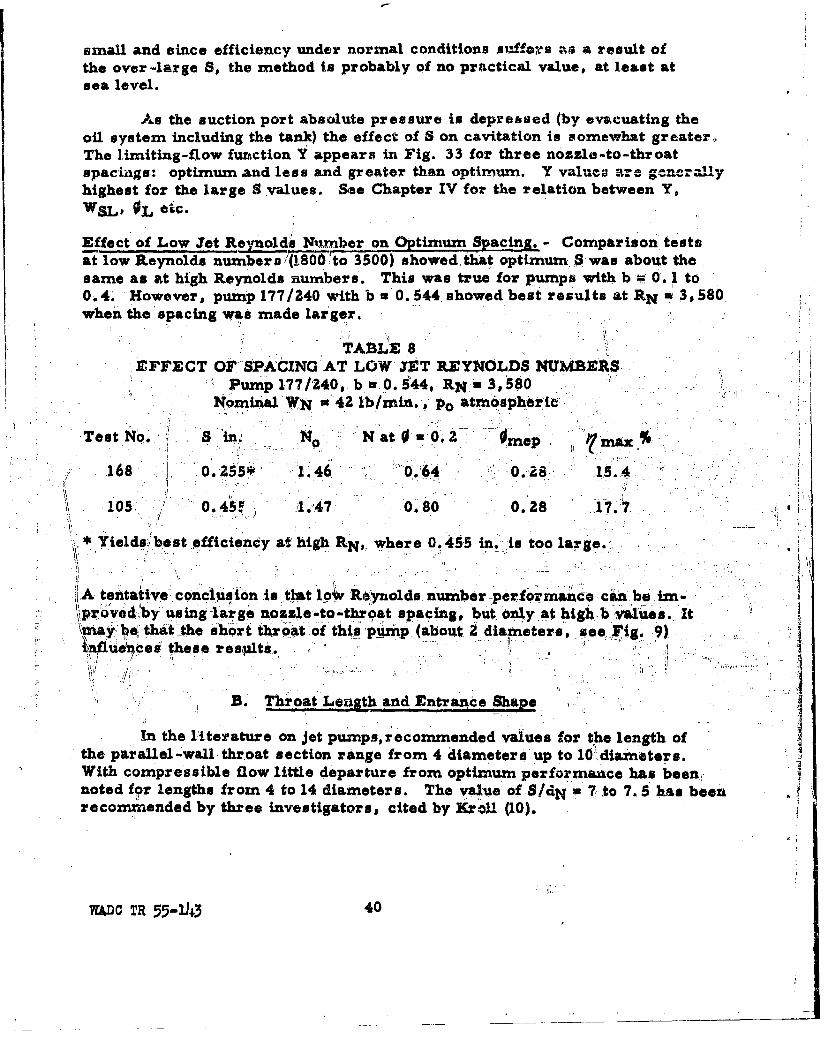
small and since efficiency under normal conditions suffers aa a result ofthe over -arge S, the method is probably of no practical value, at least atsea level.
-As the auction port absolute pressure in depreessed (by evacuating theoil system including the tank) the effect of S on cavitation in somewhat greater,The limiting-flow function Y appears in Fig. 33 for three noszzle-to-throatspacings: optimum and less and greater than optim-um, Y valuca a--c- agnealyyhighest for the large S values. See Chapter IV for the relation between Y,WSL, OL et~c.
Effect of Low Jet Reynoldi Number on Optimum Spacn.- Comparison testsat low Reynolds numbers (1800 to 3500) showed, that optimum ;s was about the.same as at high Reynolds numbers.. This was true for pumps with b tF 0. 1 to0. 4. However, pump 177/240 with b a 0. 544 showed best results at RN -3, 580.when the spacing was made lar~ger.
TA13LE8flFFECT.OF; SPACING AT LOW XET REYNOLDS NUMBERS
Pump 177 /240, be 0.5ý44,, RN. 3,58Nominal WN a 4,2 lb./mmi., p0 atmos.pherýic
'Test No#; S in) N0 Naak,
1 68 '0.255* 1'.46 0.64.' ~ 1.
105 0* 45 1.47 0.'80 0.28 .17.7.
*Yields best efficiency at high AN,- where 0. 455 in. Is too large.
ýIA tenatv conclus ion istou lp4~v Rnod nubrpromance ca be. un-m\proved ',by using la*;ge nozzle -to-throat spacing, but ounly at high b"alues-. I\itnay be tha the short to*tfthis ýpm (about- 2 diameters, see Wig. 9
Pýue#Pe* these respilti. '
B. Throat Lenath and Entrance Shape
In the literature on jet pumnps, recomnmended values for t~he length ofthe parlle -all throat setiorag from 4 diamter up to 1tdiameters.With compressible flow little departure from optimum performance has been,noted for lengths from 4 to 14 diameters. The value of S/dN Tto 7,5has been I1recommended by three investigators, cited by Kroll (10).
1WADC TR 55-343 40
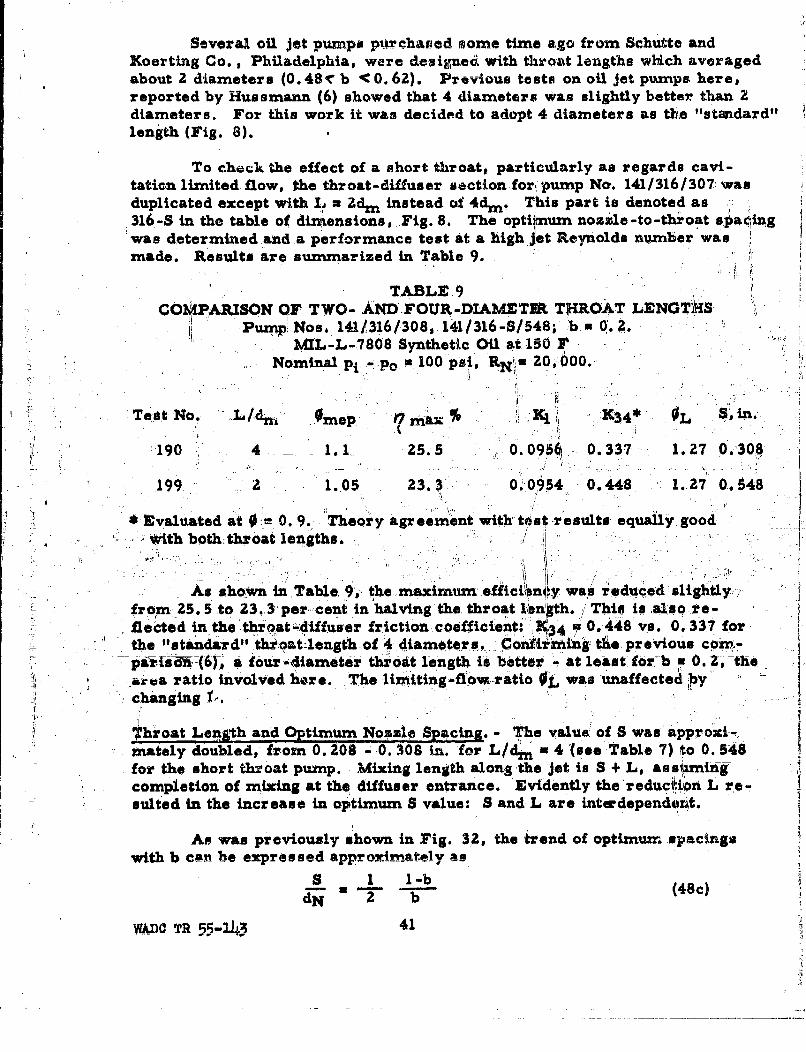
Several oil Jet pumpO purchatied, some time ago from Schutte andKoerting Co. , Philadelphia, were dosignoid with throat lengths vibich averagedabout 2 diametersa (0. 48,c b (C0. 62). Pr evious toests on oil jet pumps her e,reported by Hum smann (6) showed that 4 diameters *as slightly bet-ter than 2diameters. For this work it was decided to adopt 4 diameters as tbe "standard"length (Fig. 8).
To chack the effect of a short throat., particularly as regards cavi-tatieriz limited flow, the throat-diffuser section for, pump No. 141/316/307, wasduplicated except with L = Zd~m instead of 4d~m. This part is denoted ase316-S in the table of dimensitons,. Fig. 8. The qpti~num nozzle -to-throat s' cingwas determined and a performance test at a high Jet Reynolds number" wasmade. Results are summrarized in Table 9.
CO1~PMUSN OFTWO. TABLE, 9 f~GCOMARION F TO-AND FOUR-DIAMETER, THROAT LNtA
Pumpp Nos. 141/316/308, 141/316-S/548; b 0..MIL-L-7808 Synthetic Oil at.150 F
Nominal pj. - PO a 100 Pei., RN` .20,6000.
Test No. .L/dj,,, 0 me 7 7m"x Xj 34 * OL in
190 41"2. 0. 0956, 0.337, 1.27 0.3108
199, 2 1.05 23.3 0.09M4 0.448S 1.27 0.648
* vauae a 0=0. 9. Theory agreement with test resmults. equally. good,
wihboth throat lengths..
'As shown in, Table 9, the maximumL effici~n~y was, reoduce'd slightly,from 25. 5 to 23. 3 per, -cent in halving the. throat libn~th. ,,Thie s 19.4reIlected in the'thr-oat.1-diffuseor friction, coefficient: X~ . .4 0 3 othe "1sta nda-rd" thra~t_'lcngth of 4 ditame ters. Coratizming, tfi, previous com.-pawlsdi-(6),, a four -4iamette~r thtoat length is better -at least for-b 0. 2 -thearva ratio involVed haer. The limiting-flowt -ratio OLwas "unaffected bychanging 1
Ihioat Length and OtmmNozzle Spacing. The value' of S wast appr oil-mately doubled, from 0. 208 - -0. 308 in. for L/d~m a 4'(u*e'Table 7) to 0. 548for. the short throat pump. ,Mixing length along the jet is S + L, as siimizifcompletion of mixing at the diffuser entrance. IEvidently the'reducitio L re-sulted in the increase in optimum S value: S and L are intwdependart.
Am was previously shown in Fig. 32, the trend of optimum- spacingswith b can be expressed approximately an-
S I - (48c)
WA-DC TR 55-143 41
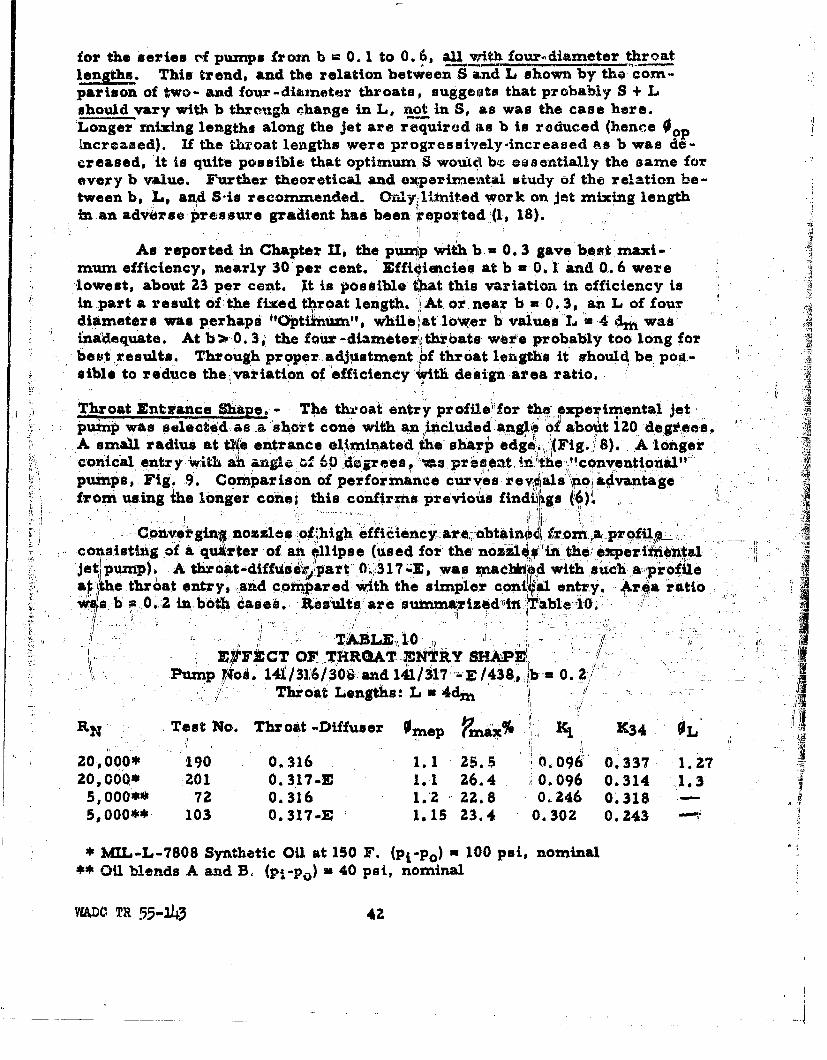
for the 'aores. cl pumps from b = 0. 1 to 0. 6, all. with four-diameter throatlengths. This trend, and the relation betw~een S and L shown by the comn-parison of two- and four-diameter throats, suggests that probably S + L,should vary with b thro~ugh change in L, not in S, as was the case here.Longer mixing lengths along the jet are required as b is reduced (hence OopIncreased). If the throat lengths were pr ogres sively -ncreased as b was de-creased, it is quite possible that optimum. S woulict bz oessontially the same foreverfy b value. Further theoretical and expenimeiata study of the relation be -tween b, ýL, aznd 8-is recomnmenided. 0killy limited work on jet mixing lengthin an adverse ýPres sure gradient has been ýreported`(l, 18).
As reported in Chapter UI, the pumrp with b -0. 3 gave beetnmaxi-mum efficiency, nearly 30 per cent. Efftimiacies at b a 0. 1 'and 0. 6 werelowest, about 23 per cent. It is. possible *~at this variation. in efficiency isin part a result of the fixed throat length. "At or. near b m0.3, an L of foudiameters was perhaps "Op0tfiiumr", while "at lower b values L "a 4 dm wasiniadequate. At b~ ýi0. 3, the four -diamneter': throats wezte probably too long forbest results. Through proper adjustment of throat lengths it shouldbe pos.-sibi. to reduce the variation of efficiency withi design. area'ratio.
Throat Entrance Sh4ape. -The throat entry profile' for the exeie lJ0t'pumpwas electeid as a. shor-t cone with an ~included 'angle o a-bou Z e~e
A sal rdis t heentrance elmx~td th shar p edge.,,' (ig 8.` A longerconical entr wit allde qrgc, Ocres sraa~'h"'ovninlpu~mps, Fig. 9. Coparison of performance curves e~l~odatg
nro s ing ihe longeor co'ne;, this confirms previousi findiijgs (6)
-Convir glinno slos to .othigh efficiencTyare, o-btain#4 ir-omi a. profileýcsisting of aqrtr of aft ollips e (4s ed for the nozzlis'in the, experiftilentaljet pmp).A throa-diffdailit,"part 0', 317..Z, was Maeblri'd wit~h such aoprofile
nettpup) anid copae with the simplr co a entry Area rati
7,.' 141 b ;P. 0.13 in, booth &ae.4slsar uzaie n ýthble 1J0.
TABLE 10EXPftCT Or THROT JNThY SHAP!I '
Pump 74os. 1i/31'6/30O -and 141/il17 -E /438. :'b-M 0. 2:,Throat Lengths: L 4dn .
RN1 Test No. Throat -Diffuser 0re P~* K. 1(34 0
20,000* '190 0.316 1.1 25.5 ,06 0.337 1.2720, 000* 201 0. 317 _E 1.1 26.4 .0.096 0.314 1.35, 000** 72 0.316 1.2 22.8 0 ý 46 0.3185, 000**' 103 0. 317 -E '1.15 23.4 0.302 0.243
* MI-L-7808 Synthetic Oil at 150 F. (pi-po) -100 psi, nominal**Oil blends A and B, (pi-p0 ) n 40 psi, nominal
W0D TRi 554-4.3 42
At both high and moderate Reyno'Jlds numbers the rounded throait eiitr aflcproduced better reaults. But the smnall gain hardly justified the added diffi-culty of machining, The ga&in in 0j, indic~ates that cavitation was 15uppres 'sadalightly by the gradual entrance curvature. Conclusion: The short conicalentrance, with rounded corner at the throat- bore, is recon~xnnded ovev aUnger cone, or the ellipse shape
oj*
II P
I I
-VD TR 5514 4.3
CHAPTER VI
THE JET PUMP AS A SCAVENGE PUMPThe Effect of Entrained Air in Oil
In the dry-sumnp lubrication system, used on most aircraft engines,oil supplied to the gears, bearings, etc., is collected at low points inpockets or sumps. This oil is usually removed by gear type scavenge pumpshaving a volumetric capacity 1. 5 to 6 times the oil rate into the engines. This
excess capacity is necessary for sievetal reasons;
a. To permit rapid removal df excess oil accumulated duringmaneauversa
b. To remove oil that to highlyr aerated in the sump, hence occupyinga large volume,
c. To maintain oil flow at hig1* altitudes wrhere the scavenge pumpvolumetric efficiency declikies due to low absolute inlet pressure.
Items (a) and (b). still applyif, the positive displiacment pum isr-placedwith a jet pump. Regarding-() it has been demonstrated (ClhapterIV)that in order to. reach extrerzie altitudes the. jet pumnp,,must be 'operated attlow riatios conaidei~abl~y less than thra maximnum efficiency point`(0~
1/Map) "This is simply acase~jof ýJToversizingll the pump td avoidcavi- .tation -limited flow,. and Is analog ju gerpump practice.
As a result of the excess capadzity the a cavenge, pump ..(gear or jet)handles a two-phace t-.-- -comp .,Lt ýOui~d: air mixed'in ol Ih'Part A, below' h
the cons equences,,ofthin departure £ro~in the clear oil Aidek "condition aret
As developed in C~hapter I and Appendix 1, jet pump perfotimace 'I"
described by the~pressure ratio,
Pd pd-
Pump efficielicy i. the product of N and the secondary-tio'.primary flow ratio0, izWS/WN,, The ratio of discharge -side port pres sure difference to th~enozzle prefisure drop may be expressed in ta'ms of N as'
ia&Dc Tit 55-143 44
Pd Po
PiP N+lI
In the usual application of a liquid jet pump, the nozzle and side fluids aresimilar. If instead of a. liquid, a two-phaset twro-comnpo'nent mixture is"rikd-p at the pumap suction, the mixcingproceas arnd the diffuser f~lowwill be altered. The nozzle flow, on the other hand, will be unaffected. Theexpression for Pd -p 0 is 'derived below to include th~e effect of air,
Nomenclature;
W mass flow rate, lb/secWt mass flow rate, lb/min
Q volumetric Alo 3ae t/rnin
P static pressure lbf/ft2 I
P total pressure, lf/t
p, st;atic pressure, psiIV v4plocity ft/secP dianuity, Ibm/trdeffkie~icy,rgravitational constant 'lbmft
area ratio AN/~ Ibjc
N dimensionless pressure itatiodP/'iPj flow ratio WS/Wt4
W volurnetric'flow ratio,# aerated oil to n~ozzle flo'wK1 , 2 , 3. friction loss"coefficients, see Chapter I.
Subscripts.
N primairy fluid at nozzle dischargeS secondary or pumped fluidA airAO aerated. oilio side flow entry tp pump
Iti nozzle entryA throat entrym throat exit, diffuser entryd pump discharge, diffusear outlet
'Map mtaximum efficienc~y point, on. the vs 0p1potop operating point on 0 axis
Side-Flow PressureDrop.at Throat Entry.ý - It is assumedthtamtreoair and oil flows from the side port entry region at p0 pressure into the throatat a, entering the annular area between jet and throat walls, Assuming iso-thermal flow, the enthalpy change in air phase is zero (6). Air evolved from
WADO TR 55-143 45
the oil due to the pressure drop is ignored. The enbrgy equation is,
j i -P 7a + - + -(49)a Zg fa
where the density f 0 a is that of the air -oil mixture. It is not independentof presaure as fort Cler o4 i.
fl Pa VSa22g
and multiply bdth sides by the downastrearri density:
Po Af VS02pa + 1 K Pa VSa2
02g a+(+ 2
Let~oA fa po f~a VSO2
+ Zg
Which for smail changes in density is satisfactory, particularly ,since the inlet*velocity head is "usUally negligible.
Eq. .49. then, becomesfaVSa 3
By continuity,
Va.ýý.WS +Wair.(1
Neglecting the air mass flow rate, and with 0*WS/1WN,I1-b
ASaisArnA14N AN arndWNu VNAN
Eq. 51 býC~ores,
VSa Pa r(I-b) (Z
Neglecting the. air maBsu flow rate, the mixture density at a, 'the throatentry, is defined as,
fa... (53)a S + Q QAs QS +QAa a
WYADC TR 5541h3 46
-,Ahe eUPanQs+QAag +9&
Combining Eqs. 50, 52, and 53,
~oA - (l+Ka G !!-()Z 0 W) (54)
If no air is present, ~U a x 0 and Eq. 54 reduces to Eq. 4, Appendix 1.
Momeiitun Relations in Throat. - As previously developed, the pressure rise* in the throat is the change in momentum between-entry aind eicitr less the -All-~
'friction drag loss. Again the weight oi the air will be dropped, as a neg-ligilie contribution to the input momentum.*
WN YN Sa~W VFl~t(ma (55)
Following thie procedure, for the clear oil case,-.let
The throat ezit velocity -Vwn s related to the nozzle velocity-as
By defilnition the -mixturea: dens ity at m. is,
+ ) .(57)
QS + QIAm QAm *where. jm, +N
As before: the air mas s flow rate is "nelected.
*Folsomn, Chemical Engineering Progress, v. 44, Oct. 1948,' p 765derived the morAentum equation for a liquid-jet air putinp consisting ofa straight tube without diffuser. For no oil side flow (0-0) and with nodiffuser, the above relations become similar to Folsoms.19
waDC TR 55-14.3 47
QAm is the volumnetric air flow rate at the, pressure (Pmn) and temn-perature (Li. e, oil teamperature) at the throat outlet.
Inserting the continuity relations, the momenturri equation becomes,
PM P a £...VNq [b + (ab 2- (Z+K3 ) b2(1+0). IW (58)
For no entrained air this reduces to Eq. 7.
Diffuser Energy uain - The equation is similar to that developed foroil flow only, except-that density is no longer a constant:
+ + (5.92m9Z Pd 9g An59
Multiply by f~m and let
fpd +' ~
which is satisfactory except for 'large- chang~es n detsity. The velocity' -head-in the outlet pipe from the jet pump is goiner a11,) negligible, Vd _;: P WihA
-2g I
and the expreassaion for Rmdeveloped alovej1 Eq. 59 becomes /
pdA -Prg(l-K 4 ) xL b(;+0), (l +Wzv) (60)2g
Side Port to Disc4harge Pressure Rise-. - By combiigq 4 8 ad. 60,Sis foundto be,
Pd -F- ' P'
PdA PbA . VN2 2 b 20W b- blK)~~ -2gb -b (1 b)~
G+3+ K4) b2 (1+0) (1+ U) in)) .(61)
Similarly, combining the nozzle energy equation
- V~ V 2 (1+-K' 1 )()a 2g
YVADC TR 55-14~j3 48
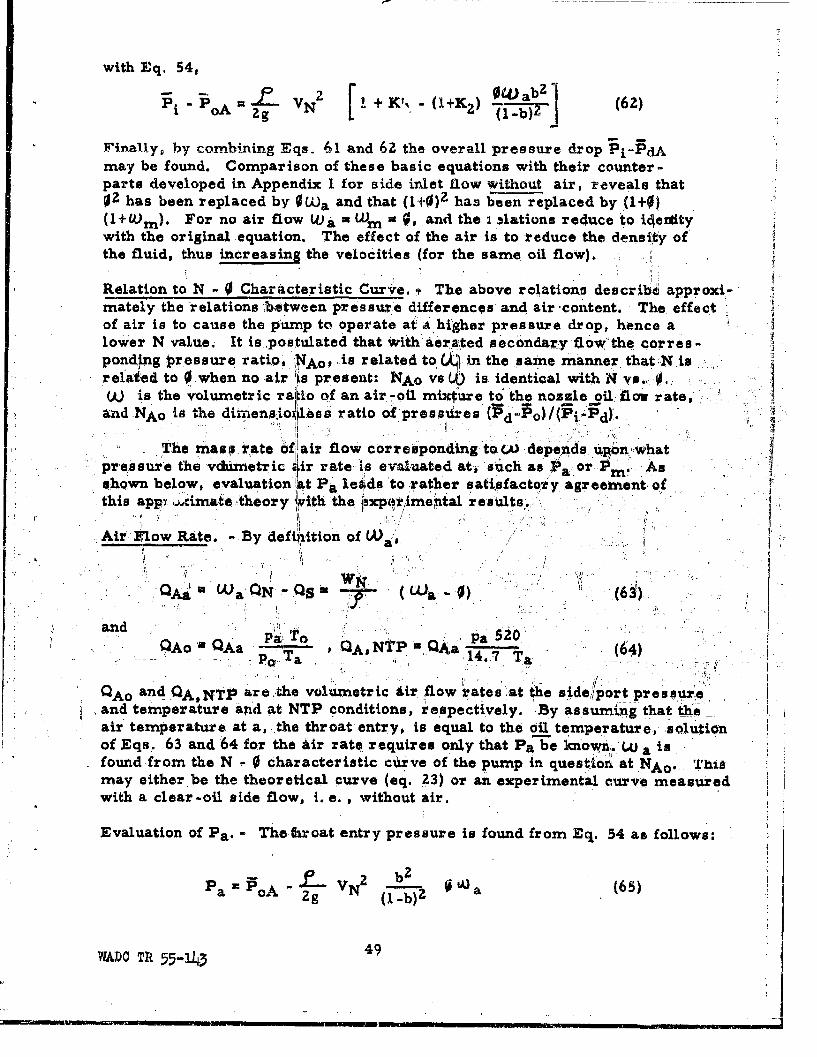
with Eq. 54,
- 2 00)Wab7]Pi- Po ' VNZ [+ K, (I +K2) -iz-j(62)
Finally, by comnbirdng Eqs. 61 and 62 the overall pressure drop P 1 -PdAmay be found. Comparison of these basic equations with their counter-parts developed in Appendix I for side irlet flow without air, reveals that02 has been replaced by OWa and that (1+0)2- has been replaced by (1+0)(I+ tom). For no air flow Wja = W'm 0.and the; 2 lations reduce to id~eiiitywith the original equation. The effect of the air is to reduce the density ofthe fluid, thus i~nc~reasing the velocities (for the same oil flow).
Relation to N - 0Characteristic Curve. .~The above relationo describ~i approxi,-mately the 'relations 'bttween pros sure differences and air "content. The, effectof air is to cause the pump to operate at A higher pressure drop, hence alower N value. It is ,postulated that with artdsecondary flow' "the corres-ponding pressure, ratio, 14Ao -is related to.G in the same manne~r that;N isreia ed to 0when no air 1W. presenut: NAO vs LA) Is identical with 14 ys o4.iW is the volumetric railo of an air,-oil mixture to the norzle oil flou rate, V"aad NAO is the dinnen~ojoy~ms ratio of prehs~dres (Vd-Po1)/(Pi'-Pd).
The Maso r ate 6flair flow corresponding to C.A depends 1106n, whatpreLssurethe vdwretric gir rate. is evaluated at,ý such as .Oaor iim, Asshown below, evaluation 'At Pa lee~ds to rather sattsfactoriy agreementý ofthis app (,ýCimnate theoryi irith'the, i#XP~rjme1ital 'results
Air Flow Rate. -. By defltiition of Wa
0 A.ý Wa-CN S (Wa -) (63)
andQAUaA PTo Pa 520ý
oa -- ,QNPUa 14.7 TA,(4
QAo and QA, NTp are the volumetr ic Air flow rates .at the side,/port pressureand temperature and at NTP conditions, reopectively. By assuminig that te-air temperature at a, the throat entry, is equal to the oil temperature, soutionof Eqs. 63 and 64 for, the aiir rato requires only that Pa be k'nown., LU a ifound from the N -0characteristic curve of the pump in quest-Ion, at NA0 .. 'Chiamay either be the theoretical curve (eq. 23) or an experimental curve measuredwith a clear -oil side flow, I. e. , without air.
Evaluation Of Pa*- The &roat entry pressure is found from Eq. 54 as follows:
7. bZPa PA VNLO a(65)~a~A -Zg (N I -b)
WADO TR 55-143 4
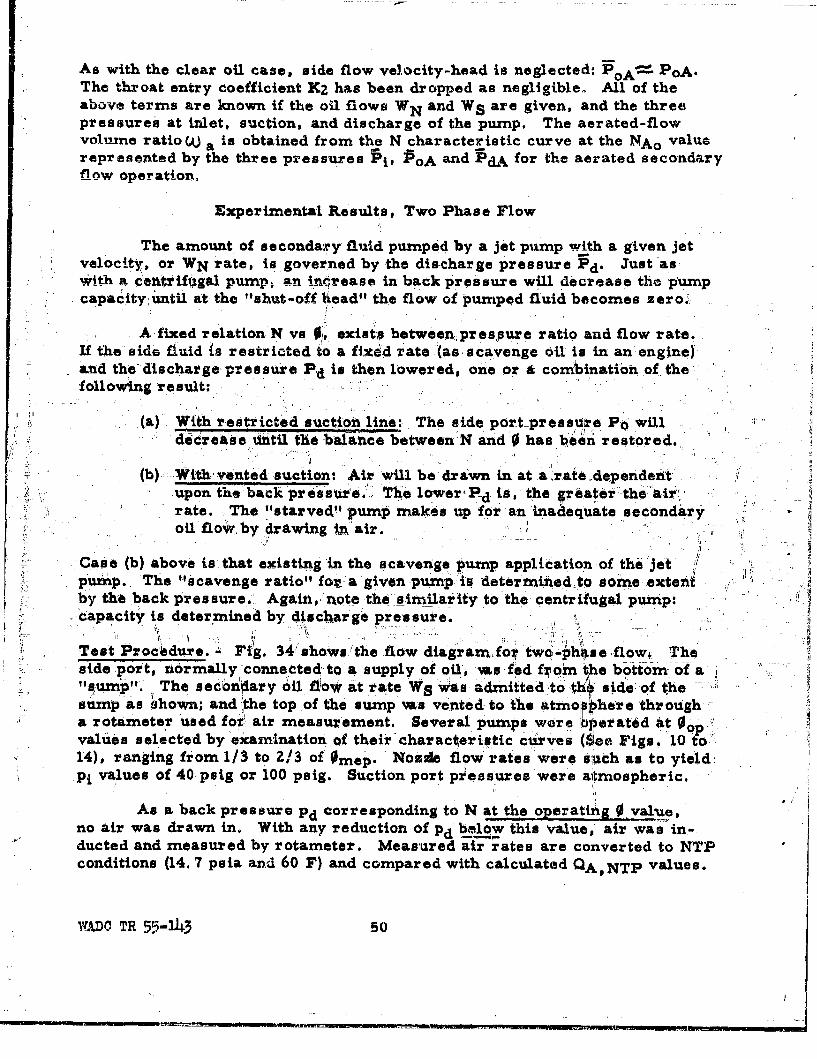
As with the clear oil case, side flow velocity-head is neglected: POA PoAWThe throat entry coefficient K2 has beon dropped as negligible. All of theabove terms are known if the oil flows WN and WS are given, and the threepressures at inlet, suction, and discharge of the pump. The aerated-flowvolume ratio WJ a 'a obtained from the N characteristic curve at the NA0 valuerepresented by the three pressures Pj, PoA and Pd.&~ for the aerated secondaryflow operation.
Experimental Results, Two Phase Flow
The amount. of secondar~y fluid pumped by a jet pump with a given jetvelocity, or WN rate, is governed by the discharge pressure Fd Just asi
with stcentriftigali pump. an iincý'ease in back pros sure will decrease the pumpcapac~ity::until atý the "shut-off )bead"l the flow of pumped fluid becomes zero.,
A fixed relation, N vs 0., exisifs betwe~en pres~sure ratio and flow rate.If the'side fiuid is restricted to a fixed rate -(as -scavenge oil is in an: engine)-and the discharge, pressure P-d io then lowered, one or A combi~natiionof. thefollowing result;
(a)' With trestricted auction, line:, The side port--pres~su PIwl-H ii '
decrease Until the balance betwe-en'N and 0 has been restored.
(1-(b)- With. ietd suction: Air will be draw 'in. at a ,rate dependenitupon th. back pres sure. The lower',Pd- is, the greater the air'rate. The "starved" pump. makesu fo an inadequate seodr
Case (b) oil flo~vy by drawing in *air.Cae b above is that existing 'in-the scavenge pum apcation of th, jeitpump., The "sicavenge ratio" 'for4 given pump is determined~to somne extentby the back pressure., Agaitho Aote the sim~ilarity to, the centrifugal pumnp:capacity is determined by 4ischArgo pressure.
Test Proc'idure. .4Fig.3 34 shows, the flow diagiram fo?' tw4-pas e fl ow, Theside port, normally connected to a supply of oil, %as fed fromn the bottomn of a"sunp"I.' The seconda~ry oil dio* at rate WS was admitte to side: of the
aupas ~hwn; and *he top of the sumnp %as vented to the atrnio~here througharotameter used fo air measurement. Several pumps were IbIperated at O
values selected by examination of their char acteristic curves (600e Figs. 10 to,`* 14), ranging from 1/3 to 2/3 of 0 mep. Noz*e flow rates were stach as to yield,
Pi values of 40 psig or 100 pa1g. Suction port pztess~ures were at~mospheric.
As a back pressur e Pd corresponding to N at the operatiing 0 valuie,no air was drawn in. With any -reduction of Pd be low this value, air was in-ducted and measured by rotameter. Measured arrates are converted to NTPconditions (14. 7 psia and 60 F) and compared with calculated QA, NTP values.
V;XDC TR 55-1J43 so
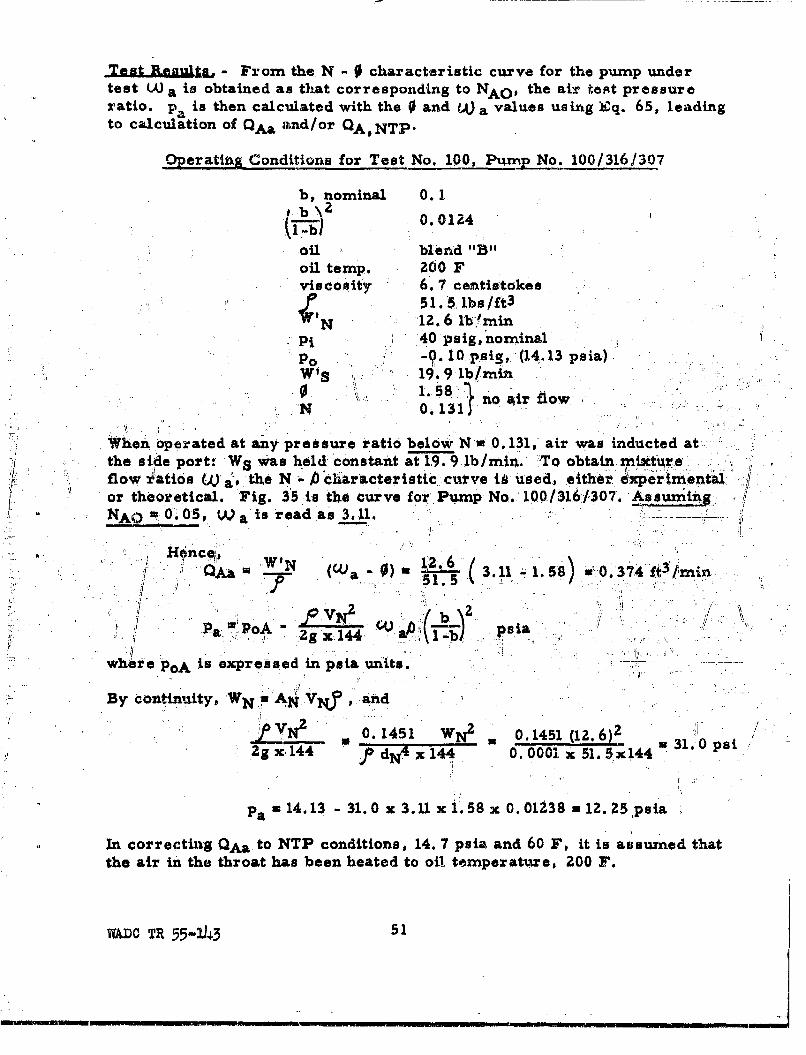
.TetjALoCWl A6 - From the N - 0characteristic curve for the pump wndertest W.A a is obtained as that corresponding to NAO, the air test pressureratio. p.is then calculated with the 0 and (A) a values using )iq. 65, leadingto calculation of QAa and/or OANTP-
Op2erating Conditions for Test No. 100, Pamnp No. 100/316/307
b, nominal 0.1
(tb 0.0124
onl blend "B3"oil temp. 200 Fviscoudty 6. 7 centistokes
5 1.5. lb s/ft3
N ~ 1z. 6 lb'?m=*Pi .40 psig, nominalp0 - .0l psig,- (14.13 psia).
W' 19. 9 lb/m.
0~n 1A8ir flow,-N 0. 1311 1
When operated at any pressure ratio below N w0.l1-1, air was inducted at'-the side port:, WS was held constant at 1.9. 9 lb/mm.n 'To obtain mixture
K flow iý8tioi A a' the N )caa teitic curve ii ueed, either nxeimentalor theoretical. Fig. 35 is the cur ve for Pumnp No.. 100/1M6/1307. Assumn
NAO 0.5, Wa'is read a~s 3.11.
Hnce;,!/
a1 - 1 0)31 .5 0. 7 t/i
NO1~ bPIa 0 ! wg14 aO~ psia
where poA to expressed in peia units.--
By ciontinuity, WN qA VeJ and
rN0.1451 W2 0. 1451 (12.6)2
.2gk.144 fdN 4 144 0.O0001 x51. Sxl44 3 0 1
Pa u14.13 31. 0 x3. x 1. 58 x0. 01238 12.25,poia
In correcting QAa. to NTP conditions, 14. 7 psia and 60 F, it is assumed thatthe air in the throat has been heated to oil, temperature, 200 F.
WADC TR, 55-143 5
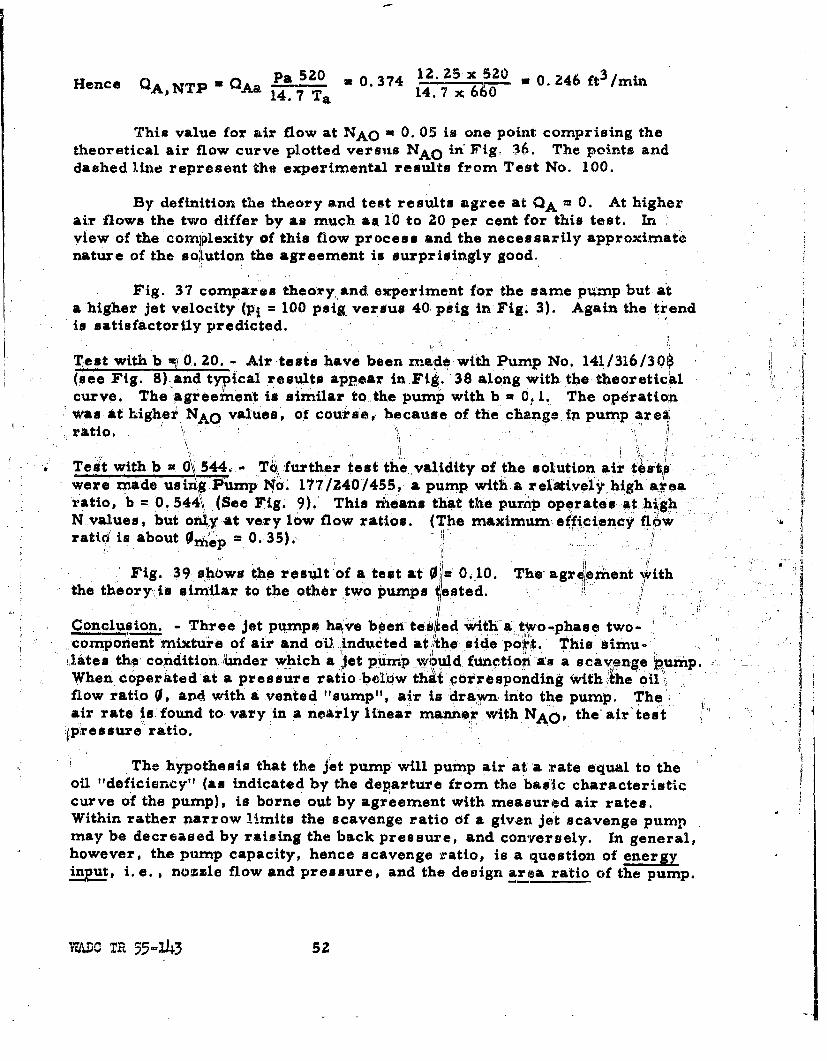
Hence QA, NTP = QAa Pa 520 0.374 12.25x 520 w 0. 246 ft3/min14.7 Ta 14.7 x f 4 -x6 60
This value for air flow at NAO = 0. 05 is one point comprising thetheoretical air flow curve plotted versus NAO in Fig. 36. The points anddashed line represent the experimental results from Test No. 100.
By definition the theory and test results agree at OA = 0. At higherair flows the two differ by as much as 10 to 20 per cent for this test. Inview of the complexity of this flow process and the necessarily approximatenature of the so•lution the agreement is surprisingly good.
Fig. 37 compares theory and experiment for the same pump but ata higher jet velocity (P1 = 100 puig versus 40 paig in Fig. 3). Again the trendis satisfactorily predicted.
Test with b ,0. 20. - Air tests have been made with Pump No. 141/316/30$(see Fig. 8) and typical results appear in Fig. 38 along with the theoreticalcurve. The agreement is similar to the pump with b = 0. 1. The opdrationwas at higher NAO values, of course, because of the change in pump arearatio.
Test with b = 0 544.,.. T6 further test the validity of the solution air t•s;t*pwere made using Pump a'. 177/Z40/455, a pump with a relively high atearatio, b = 0. 544.• (See Fig. 9). This means that the pump operates at hiOghN values, but only at very low flow ratios. (The maximurn efficiency flewratio is about r = 0. 35). Y
.. .. ...
th Fig. 39 shows the result of a test at 41= 0.i0. The agrolereent withthe theory is similar to the other two pumps tiested. "
Conclusion. - Three jet pumps have been tek`ted wthta two-phase two-component mixture of air and ol Uinducted at/the side po:et. This aimu"l•.tes the condition ,under which a jet pump would function as a scavenge pump.When coperated at a pressure ratio belbw that corresponding with ,`he oilflow ratio 0, and with a vented "sump", air is drawn into the pump. The,air rate is.'found to vary in a nearly linear manner with NAO, the air test.
ýpressure ratio.
The hypothesis that the jet pump will pump air at a rate equal to theoil "deficiency" (as indicated by the departure from the basic characteristiccurve of the pump), is borne out by agreement with measuribd air rates.Within rather narrow limits the scavenge ratio of a given jet scavenge pumpmay be decreased by raising the back pressure, and conversely. In general,however, the pump capacity, hence scavenge ratio, is a question of energyinut, i.e., no.zzle flow and pressure, and the design area ratio of the pump.
j T 55.-3 52
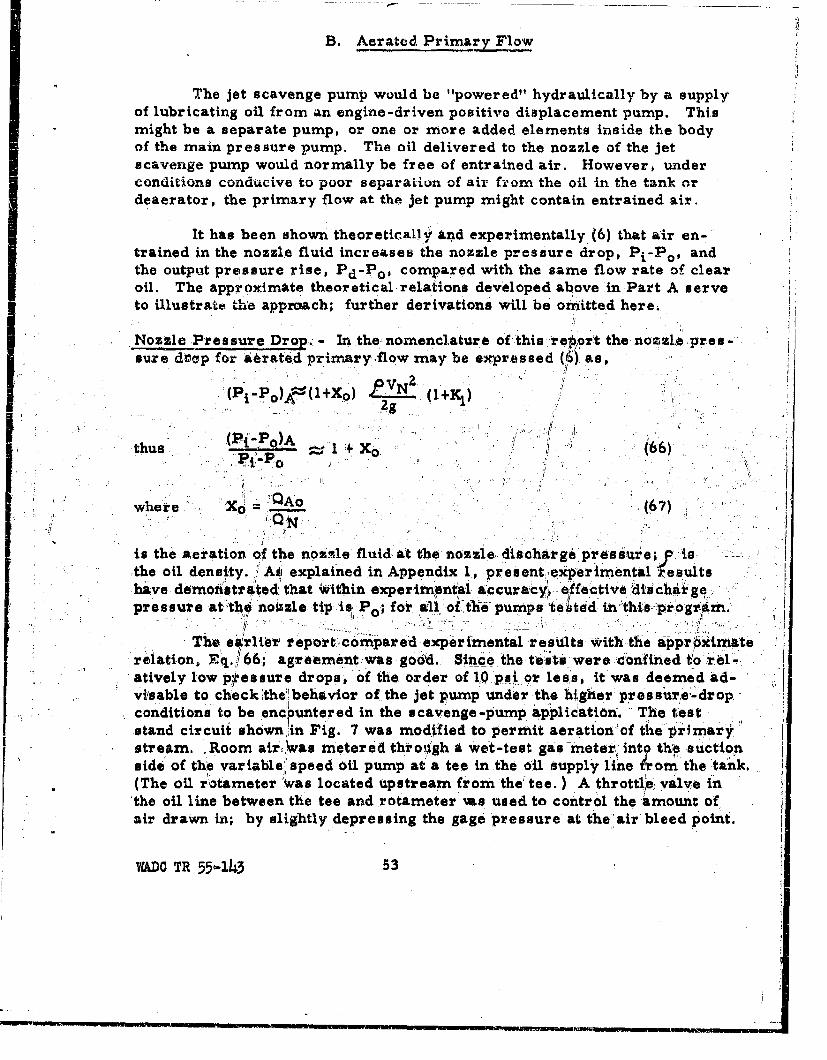
B. Aerated Primary Flow
The jet scavenge pump would be "powered" hydraulically by a. supply'of lubricating oil from an engine-driven positive displacement pump. Thismight be a separate pump, or one or more added elements inside the bodyof the main pressure pump. The oil delivered to the nozzle of the Jetscavenge pump would normally be free of entrained air. However, underconditions conducive to poor separation of air from the oil in thle tank ordeaerator, the primary flow at the jet pump might contain entrained air.
It has been shown theoreticallY and experimentally (6) that air en-trained in the nozzle fluid increases the nozzle pressure drop, Pi-P0 , andthe outpnt pressure rise, Pd-Po' compared with the same flow rate of clearoil. The approximate theoretical rela~tions developed above in Part A serveto illustrate tie, approach; further derivations will be" ornitte~d here.,
NozlePrssure Dro- In the nomenclature of this 'reporttenz pres-sur e drop for AerateBd primary -flow mnay be expressed (6) as,
I-o (2g (thus- Xi 1 (66)_
where. QAX (67
is the' aeration of the nozzle fluid a~t the nozzle .itschar-ge pressure;f is:teoil densi t A xly. A e epained in Appendix 1, present expierimental kesults
'have demostra ted, that Within exper'im~xtal accuracy., efiective dits:charige,pressure at the noizzle tip isý, Po; for all ofthie- pumps' tehted in t-iiispr'-o:rimrn
The eý'rlibv report."co'mpare'd experimental results *ith-the ap proxirtiaterelation, Eq'. .166; agreemekit was good.. Since the, testu ~were cýOnfined tdo rel-,atively low p;ýes sure drops, of the order of 1psorless, it was deemed ad-visable to check'the,'behavior of.the jet pump undermthe highier pr essaure, -drop:conditions to bie ýncl6 untered in the scavenge-pump application. The teststand circuit show:iMn Fig. 7 was mnodified to permit aeration of the primarystream. Room air 'w*as met ered through a wet-test gas meter into the. suctionside of the variable;! speed oil pump at a tee in the oil supply line ~om, the tan:k.(The oil rýotameter ýwas located utpstrearn from the.'tee.) A throttle", valve inthe oil line between the tee and rotameter ims used to control the amount ofair drawn in; by slightly depressing the gage pressure at the'air bleed point.
WADC TRt 55-.1h3 53
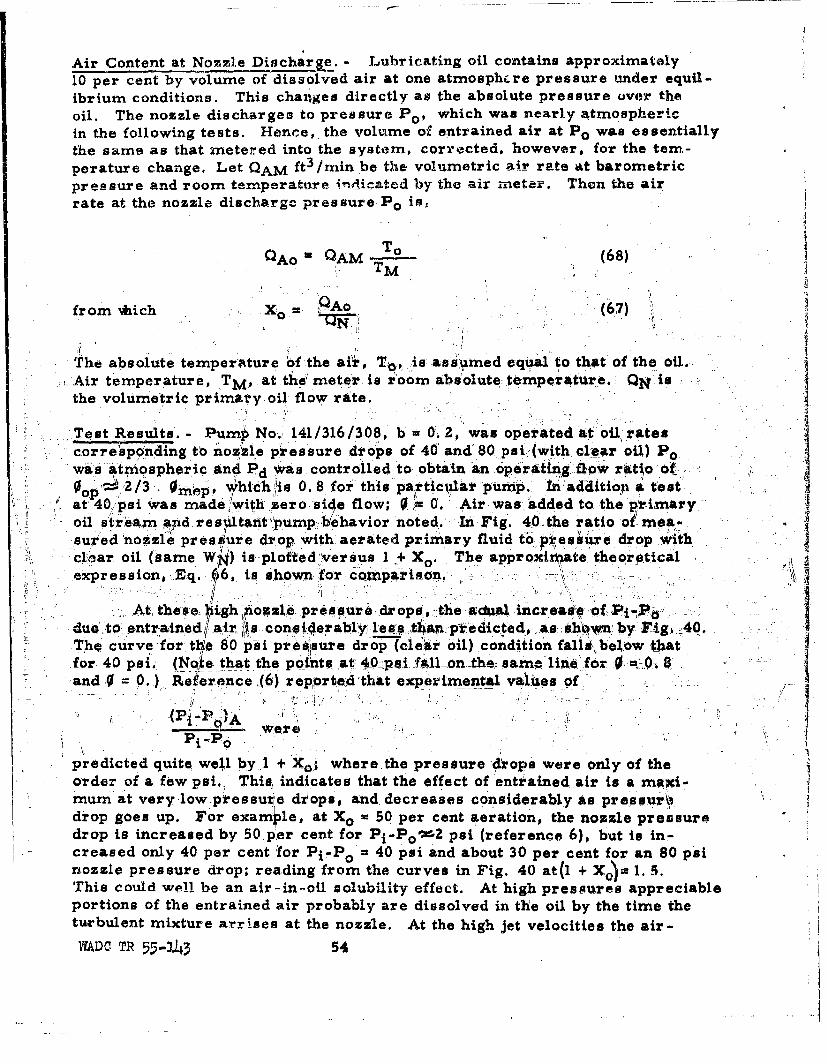
Air Content at Nozzle Discharje. - Lubricating oil contains approximately10 per cent by volume of dissolved air at one atmosphcre pressure under equil-ibriunr conditions. This changes directly as the absolute pressure over theoil. The nozzle discharges to pressure Po, which was nearly atmosphericin the following tests. Hence, the voluime of entrained air at P 0 was essentiallythe same as that metered into the system, corrected, however, for the temr-perature change, Let 0 AM ft 3 /min be the volumetric air rate at barometricpressure and room temperature indicated by the air nm±eter. Then the airrate at the nozzle discharge pressure PO is
QAo = QAM - (68)
from tich ¾b = •0A0 (
The absolute temperature of the air, T 0 , is assumed equal to that of the oil. A
.Air temperature, TM, at thef meter is room absolute temperature. QN is Isthe volumetric primary oil flow rate. I
Test Results. - Pump No. 141/316/308, b= 0.2, was operated at oilrates
corresponding to nozzle pressure drops of 40 and 80 psi (with clear oil) Powas aPtmospheric and d was controlled to obtain an operaiting ,fow ratto ot
=2.1Z3 0 mep' thich is 0. 8 for' this partle#1ar pump., InIa~dd~itioqP aL' tesat .atM40,.psi was made/,'with zero side flow; 0 .r= 0., Air was added to the pirimaryoil str6eam and resUltault'pump.hbehavior noted: In Fig. 40 the ratio o? mea-,sured nozzle pressure drop with aerated primary fluid to ptesiure drop withclo.c-ar oil (same Wp) is ploted versus I + Xo. The approximhate theoreticalexpression, -,Eq. 66, I s shown for comparison." "
At theoe piigh iozz1! prOssure driops6, the alcbl incr ie,a , of .Pi, ' Idue .t entrained/air :iis considerably lesas athan p qedicted, as::kwn byF _40.ThQ, curve -for t~le 80 psi pr.e sure drop (clear oil) condition falls, below thatfor. 40 psi. (Noke that the points at 40_psi-_f&llon-the same lint for : =. 0. 8and 0 = 0.) Ref-erence (6) repprted'that expqrimental values of
"were0Pi "P0
predicted quite well by.1 + Xo; where the pressure &dops were only of theorder of a few psi. This., indicates that the effect of entrained air is a maxi-mum at very low pressuzle diops, and decreases considerably as pressur\idrop goes up. For example, at Xo = 50 per cent aeration, the nozzle pressuredrop is increased by 50 p'er cent for Pi-PO.*-2 psi (reference 6), but is in-
creased only 40 per cent for Pi-Po = 40 psi and about 30 per cent for an 80 psinozzle pressure drop; reading from the curves in Fig. 40 at(l + X4,)= 1. 5.This could well be an air-in-oil solubility effect. At high pressures appreciableportions of the entrained air probably are dissolved in the oil by the time theturbulent mixture arrises at the nozzle. At the high jet velocities the air-
WA.DO TR 55-343 54
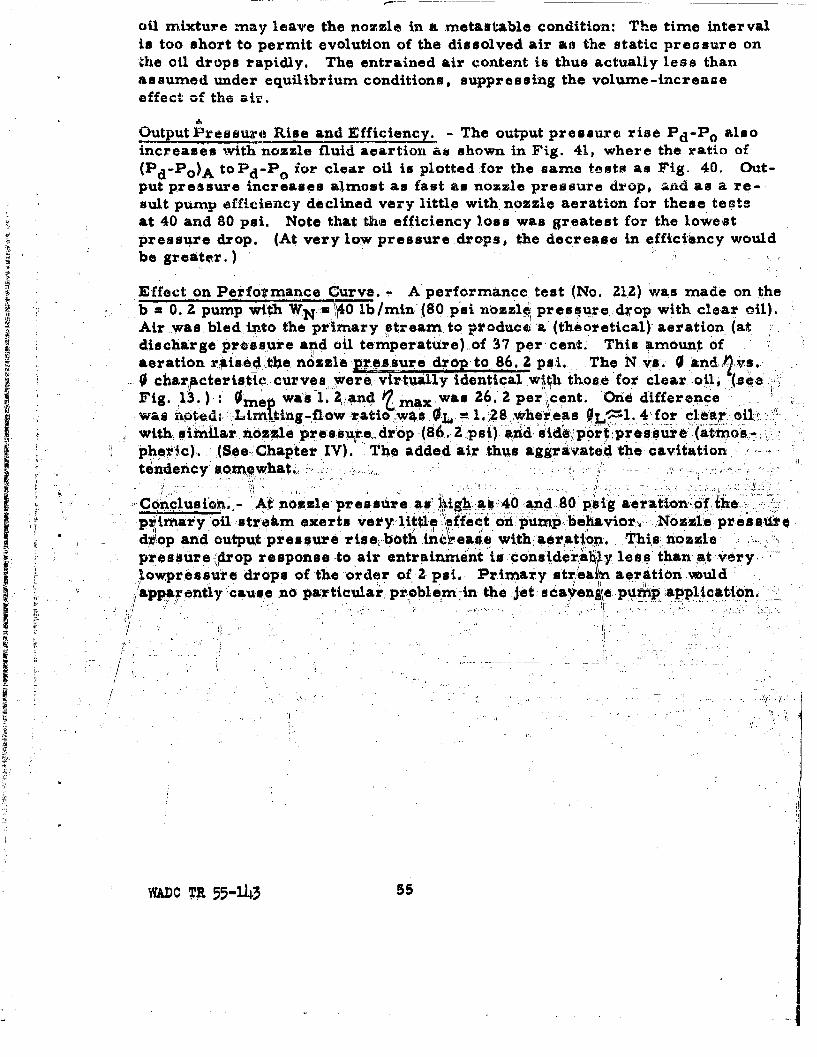
oil mixture may leave the noozzle in a mietautable condition: The time intervalio too short to permit evolution of the dissolved air asi the static preo sure onthe oil drops rapidly. The entrained air content is thus actually less thanassumed under equilibrium conditions, suppressing the volume-increaneeffect91 of the air.
Oujutrssur Rise and Efficiency. - The output pressu~re rise PdP alsoincreases with nozzle fluid acartion ars shown in Fig. 41, where the ratio of(Pd-Po)A t Pd-P0 ior clear oil is plotted for the same tests as Fig. 40. Out-put pressure increases almost as fast Ats nozzle pressure drop, and as a re-sult pumnp afficiency declined very little with, nozzle aeration for these test--at 40 and 80 psi. Note that the efficiency loss was greatest for the lowestpressure drop. (At very low pressure drops, the decrease in efficie~ncy wouldbe greater.)
Effect on Perfotrmance c~urve. - A performance. test (No. 21.2) was made on thevith %T='140 lb/mmn (80 p~si nbzzlep pressure..drop with clear oil).
Air was. bled. tnto the primary stream, to produce I a -(the'aor etical)- aer ation. (atdischarge: presasure and oil temperature)-of 37 per cent. This amount ofaeration rgis6A the nozzl-e pes~sure dr!op to 86. 2 psi. :The NMvs. 0and?)v.
* 0character istic, curves were, virtually identical wf#th thooe, for clear oil, seeFig.l): was 1. 2,.nd ý max. was 26. 2 percent. Ond differencwas 4oted: f LimnIting-7floQw ratio :wis OL ie 1. 28 S*herweas 0 L~~4 for cl16, ilwith; airxilar -no zzlea pr e-saue, dr'o'p, (8 6. 2 1s) a " id" otpesr aisphetic). (See- Chapter IV) The added air thus aggravated th avtiotendenicy someowhat.: -
'Conclusionx.,,- At noxsle: presaii.re as itigh. ai.4 and-80 p-si aeainfJhe
pwmay oi strakm exerts very little' effe'ct oh, pumpbhvoNzzepesrdf~op and output pressure riso both ine eaie' with; aer atiqn, This nrozxlepresisure,:4rop response -to air entra~inment is cO'ns'idera14y lessB than ait very.4lovipressure drops of the order of 2- psi. Primary streailn aeration vould.
II
WA.DC TR 55-1)43 55
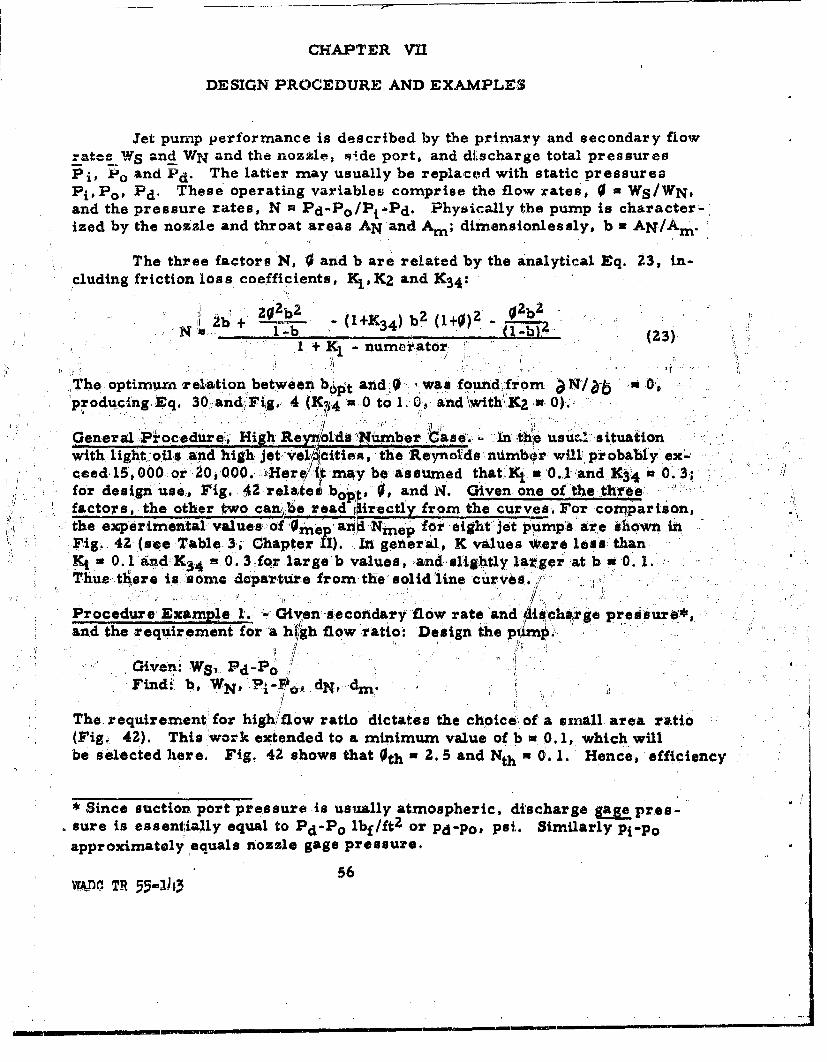
CHAPTER V71
DESIGN PROCEDURE AND EXAMPLES
Jet pum~p performance is described by the primary and secondary flowrates WS and WN and the nozzle, P;Ide port, and discharge total pressuresPi, Po and 1-1d. The latter may usually be replaced with static pressuresPPo Pd. These operatinig variables comprise the flow rates, 0*WS/WN,and the pressure rates, N = Pd-Po/Pi~lPd. Physically the pump is character-.ized by the nozzle and throat areas AN adA.; dimenslonles sly, b a AN/Am.
The three factors N, 0and b are related by the analytical Eq. 23, in-cluding friction loss coefficients, K., Kz and K34 :
;I2b, + -(l+-K 3 4 ) b2-(102 0bft-b (23)
1 + K1 uoiao
The: optirnturn 'relation between b6ot and 0- was fouh.nd from a NIab 04Prodqcfng.Vq. 3OandiFlg. 4 (K3j4 -0 to 1. 0:, and iwith',K2:iN 0).
General Pro~cedure,, High- Re3yr,,olda ,,Number Casei. - : n- :th~e a~ situationýwith light, oils and high j- el ities, 'the Reynol~ds ntimibor.will pr-obaibly ex-,
ced 5,00or20 00.~Hri t, may be wassumned that,ýX K 0_1 -and 13 .;for design use.,, Fig. 42 rela~tegi b0~ 1 0 and X. Given one of the three;factors, the other two cin.,,be read i~irectly from the curves. For cotnparison,th~e experimental values of 0ear11 "Nmne fbr eight jet pumnps6 ar~e shown in-
Fig. 4(see Table 3,, Chapte.F) In gener al,,- K values9 *er, less a thanKt 0. 1 and &K 4 0 0.3,for large 'b values,, iandislightylge atba0..Thus there is some departure from the, solid line -curves. /
Procedure- ExaMple 1.0 -; Given; secdridary flow rate and., 4iochiawe Pressu~re*,and the r equir ement for 'a high flow ratio'. Des~ign the pll=Pjt.
Given: Wg, Pd-FoFind&b WN, I dNdin
The. requirement for high/flow ratio dictates the choice of a smnall area ratio0(Fig. 42.). This 'work extended to a minimumn value of bm, 0. 1, which. will'be selected here. Fig. 42 shows that Oth * 2. 5 and Nth a0. 1. Hence, efficiency
*Since suction, port pressure is usually atmospheric, discharge gagepres-sure is essential~ly equal to PdP lbf /ft?- or Pd-Poe Psi. Similarly pi-poapproximately equals nozzle gage pressure.
56WkinlC TIR 55-243
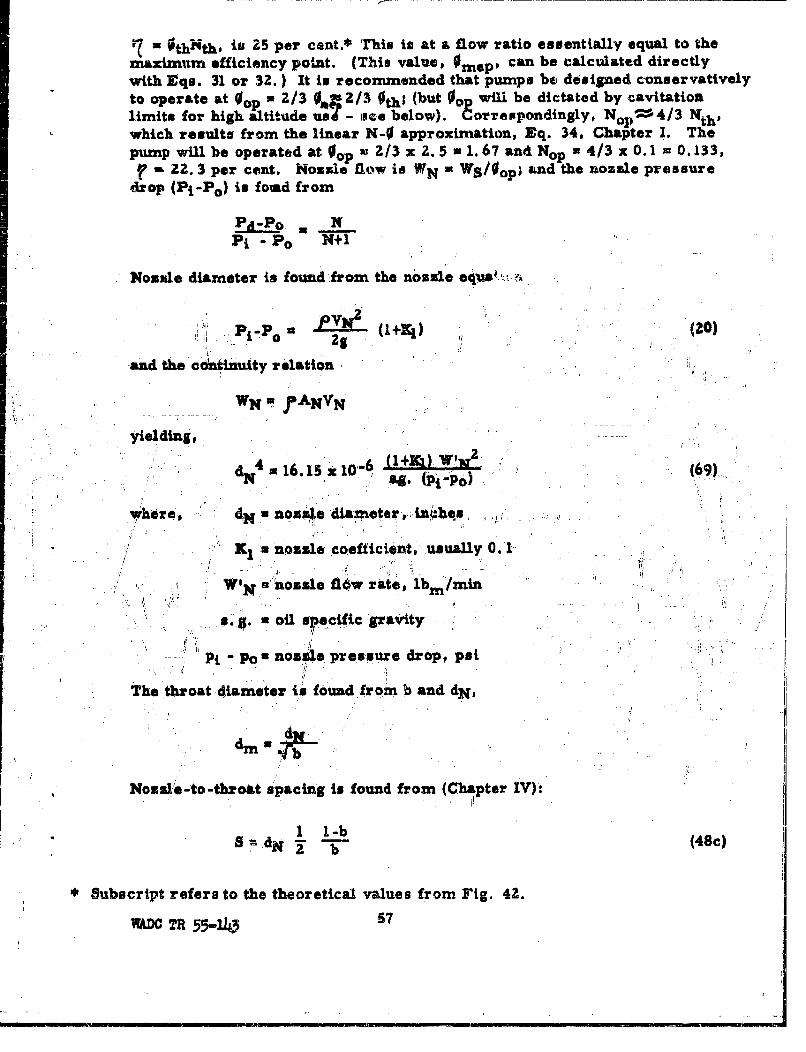
n OthNth. to 25 per cent.* T'his io at a flow ratio essentially equal to themaximum efficiency point. (This value, Omep, can be calculated directlywith Zqs. 31 or 32. ) It in recommended that pumps be designed conservativelyto operate at Oo 2/3 0 FAvs/3 Othl (but 0~will be dictated by cavitationlimits for high altitude, Us? - imee below). Torraeupondingly , NOP=4/3 Nthswhich results from then linear N-0 approximation, Eq. 34, Chapter 1. Theptump wil~lbe operated at00 o k 2/3 x2. 5 a 1.67and Nop = 4/3 x0. 1 =0.l133,
7-22. 3 per cent. Nozzle flow is WW WS/O0p; and the nozzle pressuredrop (Pj-P0) is found from
Pi1-Po N+l
Nozzle diameter is found from the mc~ssleequ
and the ciditinuity relationIWNU ft PANYVyielding,
W4 (Ot Po)
where, dN. a noz4e diameter, in'ie
a1 nozzle coefficient, usually 0. 1
NI0*4tozzle flow rate, ibm/mmd
13.g. 0 oil s5"cific gravity I -
Pi- Po nozzie pres-sure drop, psi
The. throat diameter i's found from b and dN,
dm L
Nozzle-to-throat spacing io found from (Chapter IV)-
I - (48c)
*Subscript refers to the theoretical values from F~ig. 42.
WADO TR 555-14j3 57
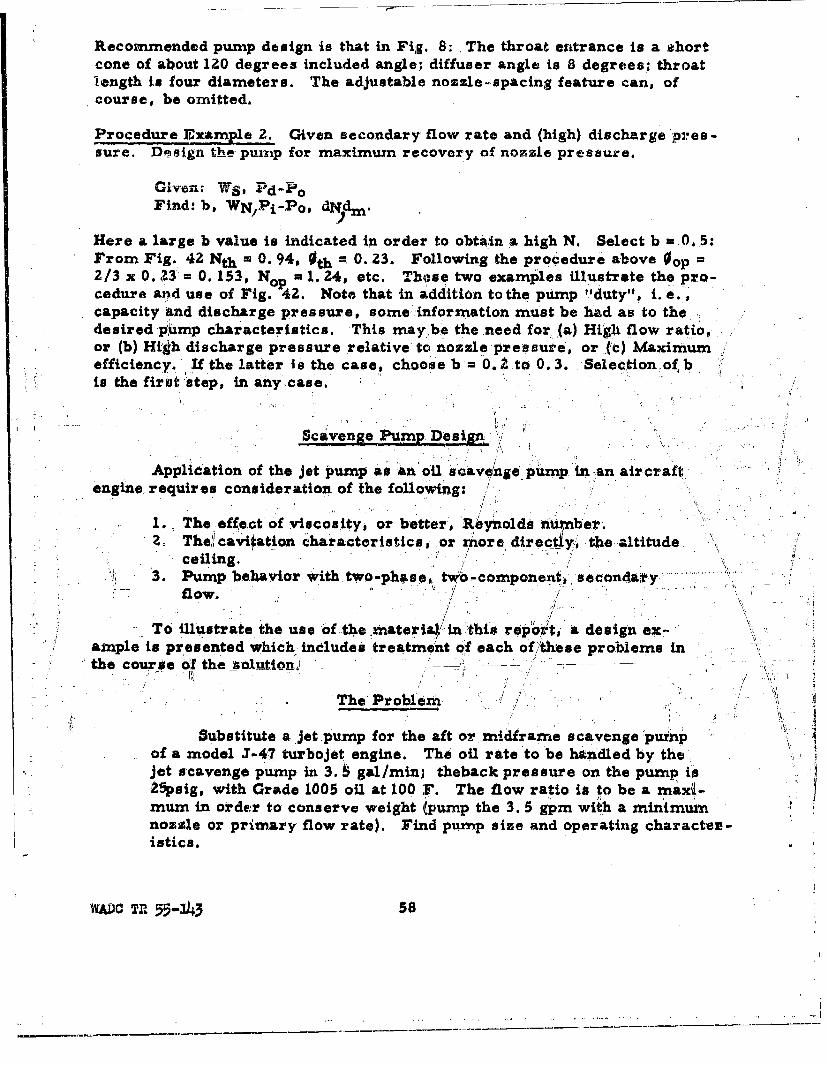
Recom-mended pump design is that in Fig. 8. The throat entrance is a shortcone of about 120 degrees included angle.; diffuser angle is 8 degrees; throatlength is four diameters. The adjustable nozzle-spacing feature can, ofcourse, be omitted.
Procedure Jixamnple 2. Given secondary, flow rate and (high) discharge pres-sure. Dneign the- pump for maximum recovery of nozzle pressure.
Find: b, WN,,Pi-Po, dN,.
Here a large b value is Indicated in order to obta 'in 'a high N. Select b = 0. 5:From Fig., 42 Nth = 0. 94, Oth = 0. Z3. Following the procedure above 0 op =2/3 x 0. 23''= 0. 153, Nop = 1. 24, etc. Those two examples illustrate the pro-cedure aoduse of Fig. 42. Note that in addition to the pump I'duty", i.e.',capacity and discharge pressure, some -information mus~t be htad as to thedesired pump characteristics. This may.be the need for_(a) HiigE flow ratio,or (b) High discharge pressure relative to nozzle pressute, or ('c) Maximumefficiency. If the latter is the case, choose b = '0. ý to 0. 3. Selection ofbis the firbt 'step, in any case.
Scavenge Pump. Desin
Application of the jet pump as ant oil scave~nge ppin an aircraftengine. requires consideration of the following:
1.. The effect'of viscosity, or better", 'Riyholds AmI~ner.Z. The'! lcav'itation characteristics, or more directly,ý the altitude,
ceiling.3. Pump behavior with two-phaso' twb-component, secondary .....
flow. 1/
To illustrate the use of the material' in this rep'oit a design ex-ample is presented which includes treatment of each of,/hese problems in
'the -course of the _"o utinn -
The Problem '-
Substitute a jet pump for the aft or midframe scavenge ý'uinpof a model J-47 turbojet engine. The oil rite to be handled by the'.jet scavenge pump in 3. ý ga1/min; theback pressure on the pump i ýs-215sig, with Grade 1005 oil, at 100 F. The flow ratio io to be a maxi1-mum in order to conserve weight ýPump the 3. 5 g"zm with a minimum'nozzle or primary flow rate). Find pump size and operating characteL%-istics.
WAPO TR 55-343 5
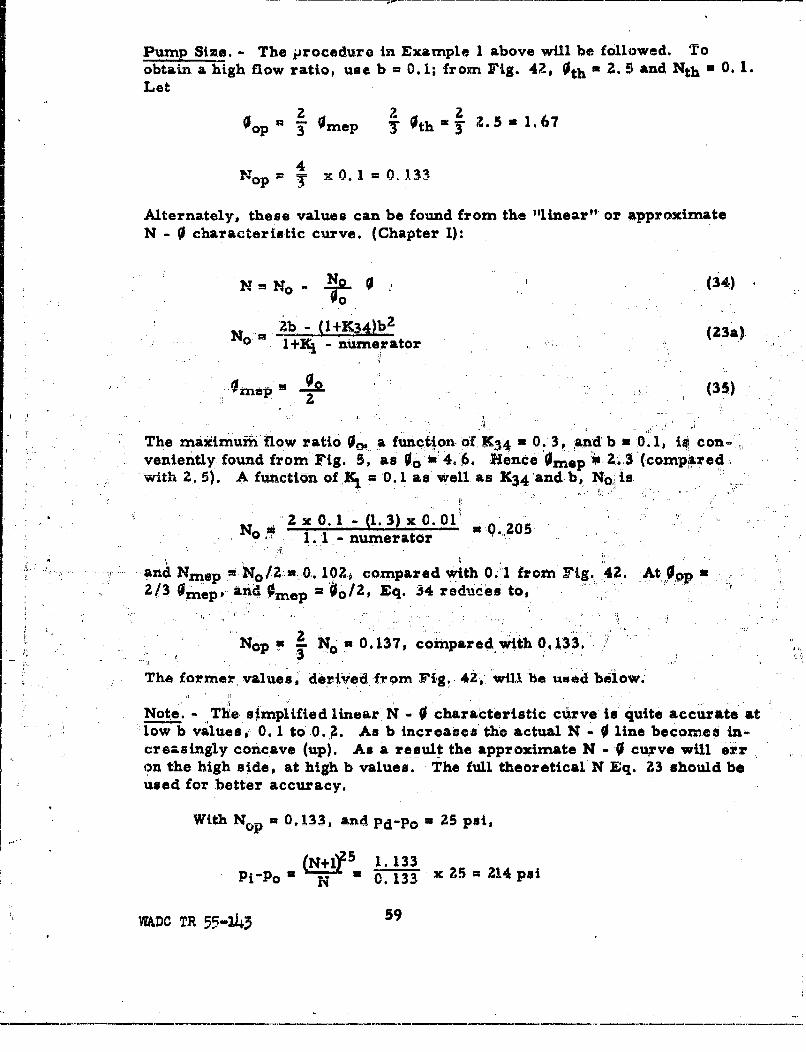
Pump Sl~m. - The procedure in Example 1 above will be followed. Toobtain a high flow ratio, use b =0. 1; from Fig. 42, Oth = 2. 5 and Nthw 0. 1.Let
a2O aOh=2 2. .6Oop' 3 0 mP 5 Th 2516
N =ix 0. 1 0.332
Alternately, these values can be found from the "linear", or approximateN - 0characteristic curve. (Chapter I):
N No-.n. (341)
N b -(+3)2 (23a)l+K1 - numnerator
Ornsp 00.2 (35.)
The maximurn flow -ratio 0~afuniction- of K34 u01.3, and b-01 scnveniently found from Fig. 5, as 0 in 4.,6. Hence Omep a 2. 3 (compa;red-with 2. 5). A function- of *X '0.1 as well 9s K3 4 'aiid b, No,: is
N0~2x0.1- (13) x 0. 01 *0.01.1 -numerator
and Nrnep No N0 2: 0,. 10 2 j. compar ed with 0."1 fromt Fig. 42. At! Opp2/3 Vmp Anid 0 me ='O0/2, Eq. 34 reduices to,
Nopu 2 N0.0. 13 7, compared withO0133.3.The former values, derived from Fig. 41, will be used below.
Note. - The, simplified linear. N -0characteristic curzve is' quite accurate atlow b values,: 0. 1 to 0. 2. As b increases'the actual N - 0 line becomes in-creasingly concave (up). As a result the approximate N - -0 curve will e .rron the high side, at high b values. The full theoretical'N Eq. ?.3 should beused for better accuracy.
With Nu = 0.133, and pd-Pom=Z5 Psi,
(N+1?5 1. 133Pi-po N *013-3 x 25 Z14 pat
W&DC TR 55-143 5
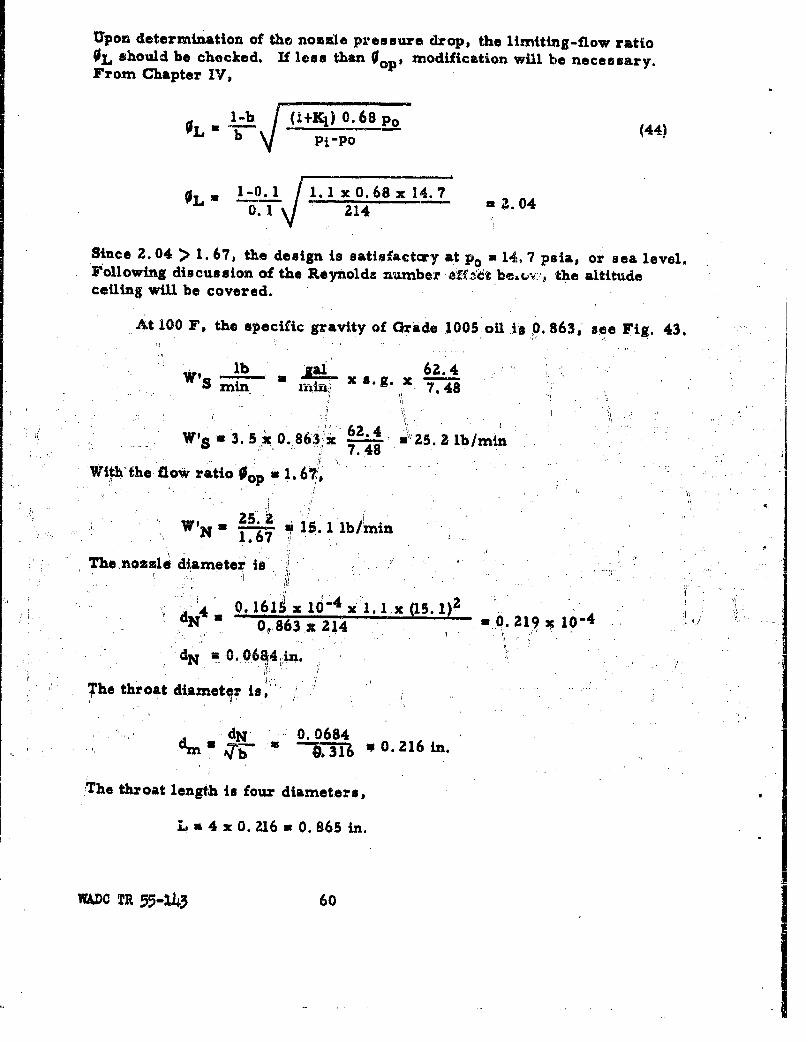
Upon determination of tho nozzle pressure drop, the limiting-flow ratioOL should be checked. If loes than Oomodification will be necessary.From Chapter IV,
L_. (i+ 1 )0.8 o (44)OL = 'bi-po
OL x1-01_ 1 1 lx 0. 68 x 1 14.7 7.00.1 214 .0
Since Z. 04 > 1. 67, the design is satisfactcry at p0 14. 7 psia, or sea level,Following discussion of the Reynolds nu~mber ef~ evthe altitudeceiling will be covered.
At 100 F, the specific gravity of Grade 1005 oil ts 0. 863.' see Fig. 43.
lb 62.4minn xxg1x7.48
Wts 3. 5"x0. 86.3 x L u25. 2.lb/min7.48
With the flow ratiol *167,
25.WfN 1.6 'i 1.5. 1 lbiznin
The nosulel dtameter Is
0. .161 x 10- x. 1. 1 x (15. 1)?."ONm 0ý 86 3 214 *.1x0
"dN 0.O06 14,in.
The throat dixmet~r is,
dx 0. 0684dImu 0 3.16 "O26 in.
The throat length is four diameters,
L a4 x0. 216 w0. 865 in.
WODO TR 55-143 60
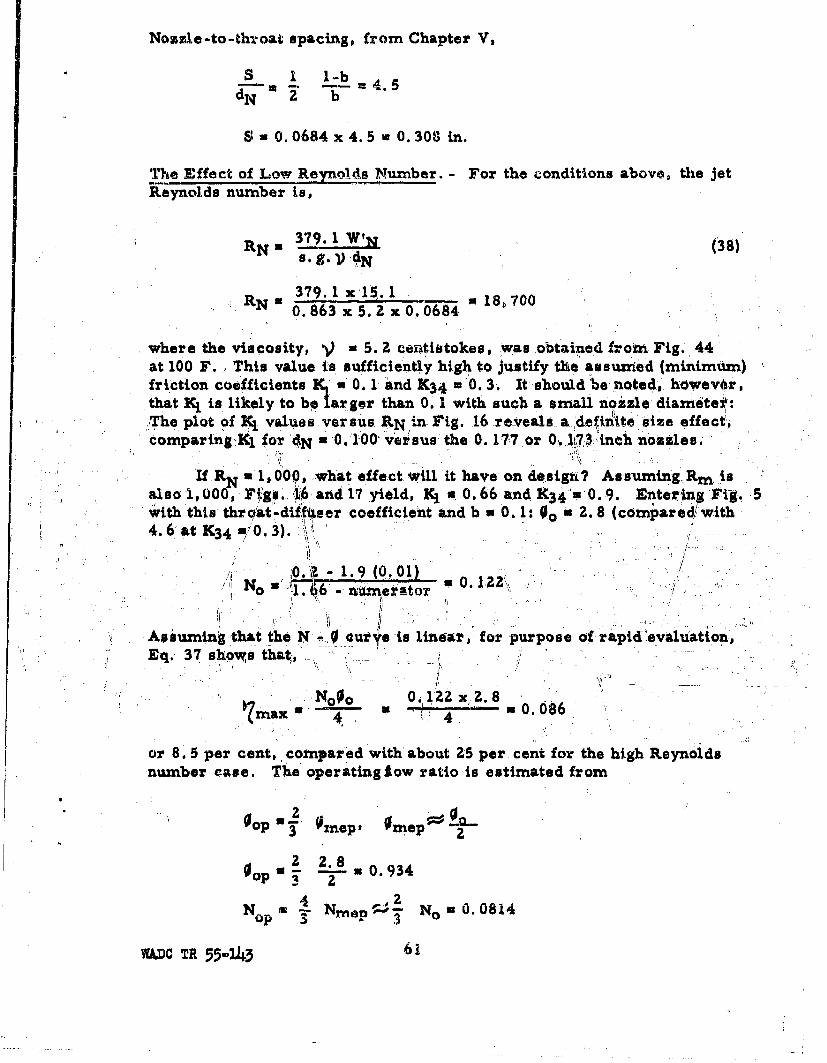
Nozzle -to -throat spacing, from Chapter V,
S I 1-b 4d~ 2 b
S = 0. 0684 x 4. 5 w 0. 308 in.
The Effect of Low Reynold. Number. - For the conditions above, the jetReynolds number is,
RN 379. 1 W'j (38)
379. 1 x1L5..1RN*0. 863 x 5. 2 x 00684 1870
where the viscosity, S . 2 certistokes, Was obtained fro Fig., 44at 100 F. ,This value is, sufficiently high to Justify the assumed (minimum).friction cooefficients K,*0. 1 .and K3 4 3 .3. It should be- noted#. howev4~r,that N1 is likely-to be larger than 0. 1 with such a small noz'zle diarmete*,:
Teplot of X1 vlevrssNin Fig. 16 reveals a defin'tte aiz effect'
comnparing Kl for 4N n 0 100' ver sus the 0. 177 ar 0ý,,1,7,3 Inch noazzlso
if RN 1* 100 0#,.what effe ct. will it have on design? AssumiuningRm, isalso Lo00, Fis 6and .7 yield, K~j a0. 66and X34u'0.-9- neigFg 5with this throat-difft~er coefficient and b a 0.1.: O0o is 2. 8 (comp~ar ed' with4.6 at X34 w`0.3). ,
0.0122 /
No 1.6,6 - n ieator
As suming that the N -, 0aurý,e is linear, for purpose of raipid evaluationEq. 37 shows that,- -
I, N0OOO 0122 X'2. 8(max 0 ..0.06
or 8 .5 per cent, compared with about 25 per. cent -for the high Reynoldsnumber case. The operating iow ratio is estimated from
~OP* Oznept 0 Mep~ 9
-0. 934
NOP Nmen NO 0 .0.0814
WAXC TR 55-243 6
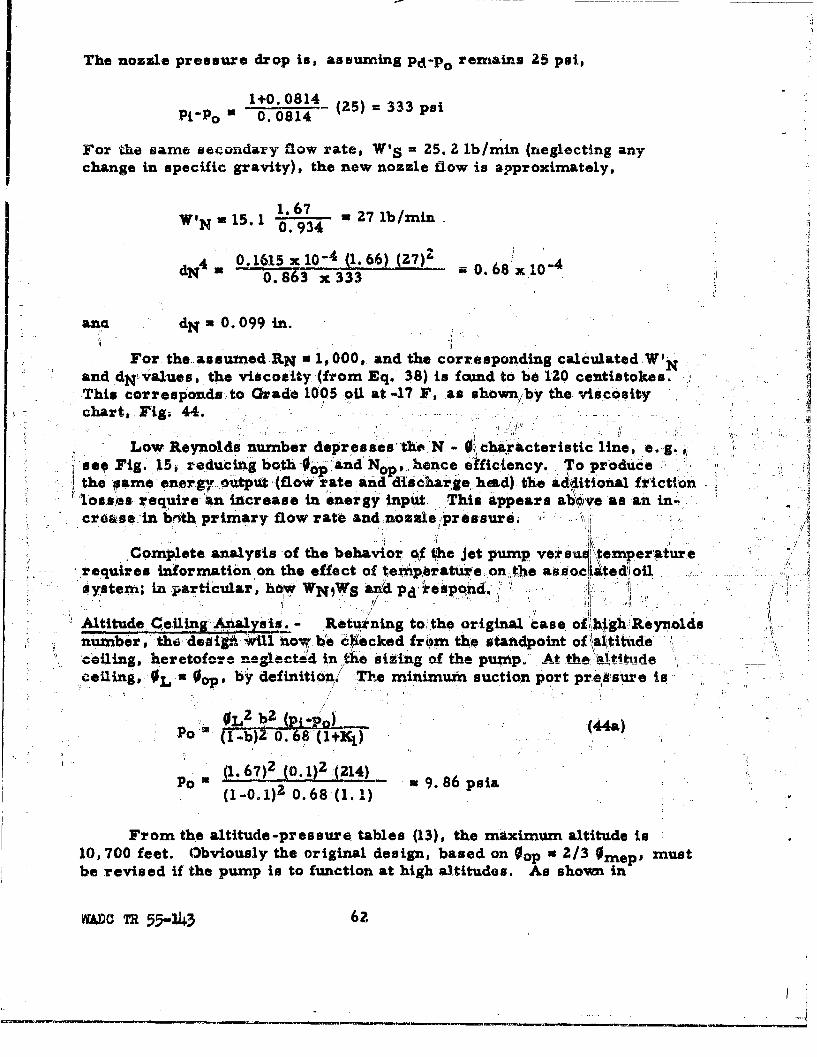
The nozzle pressure drop is, assuming Pd-P0 remains 25 psi,,
10. 0814
For the same secondary flow rate, W' 5 = 25. 2 lb/mim (neglecting anychange in specific gravity), the new nozzle flow is approximately,
WIN 5. 11.67 27l/iW'N~S~l0.934 b/n.
d4 0.1615xl10 -4 (1. 66) 0.68x1-4
dN0. 863 x 333 0 6x1
ana dNO.O099lin.
For the .assumned.RN .1,000,. and the corresponding calculatedW'Ncoresons o rae 00 ol t -7 , s hon~y hevicoi N
and dN values, the viscosity (from Eq. 38) is famd to be 120 centistokes.
chart,.Fig.; 44.
Low Reynolds number depresses-thee N - 0~characterisotic line e., 9. i,see Fig. 15,j r educ ing both 0o.and N0. hence efficiency. To produceý,the esame energy, outpuft (flowO rat and dcharge, head) th ditioimal frictionlos~sjss require 'kn increase 1in energy input; This appears a1o~ve as, an in-1crta~se.:in befth primary flow rate and nozzle/ pressure.
Complete. analysis -of the behavior o~f %he jet pump ve-,sus~j. temperatur~erquires information on the effect of temPtiate on he soie~i
systemx; in particular, hb*'WNIWS and Pd respond,
Alttue eilin Lýal aim.- Retuining to.'the original "'case, ofbi hghReynoldsnumber,~~~~ th eii wl o e hcked from. the -standpoint of Kaltitude
'ceiling,.heretofore neglecteýd in the siz-ing of the pumrnp. ,At the OAlt.ittileceiling I: L -Oop, b" definition,.I Th~e minimum suction port prek'suke. is
L Ž!Ri -io)_ (44a)Po 1~) 0. 68 (l+K1 )
(1. 7)2_ (0.1)2 ý(214) 9.6pi0 (1-0.1)2 0.68 (1.1
From the altitude -pressure tables (13), the maximum altitude is10, 700 feet. O~bviously the original design, based on 0 0p a 2/3 Omep, mustbe revised if the pump is to function at high altitudes. As shovi in
VIOD TR 55-.343 62
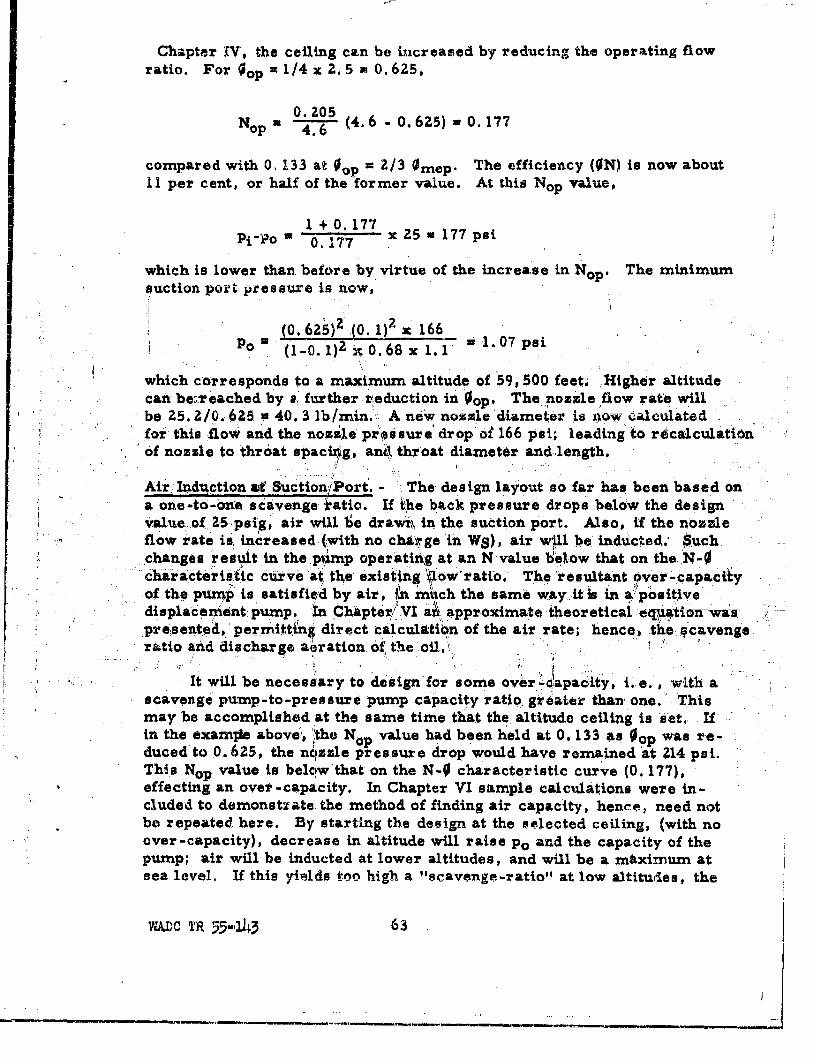
Chapter IV, the ceiling can be increased by reducing the operating flowratio. For Op=1/4 x 2. 5 ma 0. 625,
0.205-~ (4. 6-O0.625) wO. 177
compared with 0, 133 at 0. 2/3 Omep. The efficiency (ON) is now about11 per cent, or half of the ~former value. At; this Nop value,
1 + 0, 177mir _ 7 5 ma 177 psi
which is lower than, before by. virtue of the increase in Nop. The minimumauction port;pressure is now,
(0. 625)2 (0. 1)2-x 166por0 G1-0.1)7- k0. 68 x 1.1 -1. 07 psi
which corresponds to a maximumn altitude of 59, 500 feet. Higheir altitudecan be.,reachad by a, further rieduction in Oop. The nozzle flow rate willbe 25.2./0. 6zs5 * 40. 3 ib/min A new nozzle'diameter is now calculated-Cfor this flow an.h6nzl pras sure drop ol 166 psi; leading to rdcalcuatiof nozzle to throat spaciig, anil throat diameter and.,length.
Air. Induction af SuctioA/Pot. - i The, design layout so far has been based ona one-to-on~e scavenge iatio. If ile back pressure drops below the designvalue-f QI 5 psig, air will ýS. drawrl in the suction port. A~lso, if the nozzle
flo rte sincreased (with no caginWS), air will be. inducled'Sc-changes result in the pump operatinig at an N value býýow that on the N-Ochar Lacterist ic curve at the exisiing \i1ow'ratio.- The'resultant 6ver-capa~cityof the pump istsf'd by air, in rmtch the same way, it is in a positivedisplac'emeinti pump., In Chper'V aliapproXimaite tertcle~aiwapresented,'per Mittfn# direct calculttibn of the air rate; hence, the qscavengeratio and discharge ae'ration. of the oil. I
It will be necessary to design for some oveer-'4apacity, i.e.', with ascavenge pump-to -pres sure pump cpiyraogratrhaon.Timay be accomplished at the same time that the. altitude ceiling is set.. If
in heexm~1 aov,'he N, value had been held at 0. 133 as Opwas re-duced'to 0.62,50 the no`zzle pressure drop would have remained at Z14 psi.This N0 value is belo~w'that on the N-O characteristic curve (0. 177),effecting an over-capa~city. In Chapter VI sample calculations were in-cluded to demonstrate the method of finding air capacity, hence, need notbe repeated. here. By starting the design at the selected ceiling, (with noover -capacity), decrease in altitude will raise p0 and the capacity of thepump; air will be inducted at lower altitudes, and will be a maximum atsea level. If this yields too high a "s-cavenge -ratio" at low altitudles, the
YaJ)C TR 35-143 63
air rate can be reduced by increasing the back pressure on the pump,thus raising Nop. An altitude-responsive back-pressure valve might bethe answer if excessive air handling at low altitudes should prove trouble-some.
I ;
WAPC TR 55-143 64
CHAPTER VIU
CONCLUSIONS AND RECCOM).tKNiATIONS
Should the jet pump be employed as an oil scavenge pump in air -craft engines? It is not possible to give a clear~-cut yes or no answer tothe problem. The theoretical and experimental analyses reported hereinrevealed no reason prohibiting such an application. To win approval, theJet scavenge punnp must successfully camrpete with the, positive displacement(usually gear-type) pump now used. The two typBs are compared below.
Weight. An aluminum jet pump with;a No. 12 AN' aluminum tee as a body.weighs about 0. 7 lbs. This body size 4shbuld serve -to scavenge a 3. 5 gal /ixin_o~il flow. The midframe scavenge pumip (Model NC 193) on the J-47 enginehandles 3.)5,,gal/minat a nominal scave~nge ratio of 10/3. 5. Thib pumpweighs. about; 2. 7 lbs. With the driving gears, bracket's etc, u-navailable for*measurement, it is impossible to estimate such added; whtihanacucyThe total is probably, two or three times the gear pump weight along.
To the -0.7 lsjet pump weight must be added that of; the jprimnaryflow s~pply line and contained oil, and, AL 'primary suppl~y pump. * This might
bea spart iapie at a take-off pad, or an! el ement. added to an.existing, oil pump. As a crude guess, the weight of thip jet pump, five, feetof No., 12 h~os~e fittings,, and a, supply pump, miight be o~f the ýordAer of 5. or 6lbs., Therip is. probably some weight advaiitagp to. the ,jet pump, but no~tdecisively so.
PhysicAl Inotallation.- This c~omprises the chief advantage of the jer scaV~nge ,
pwiimp: It: can be produced at a fraction of the cost of a precision high-speedgear pump. Pc-,rered4 hydraulically, precise rmounting for gear alig~iner4 isavoided. The prima py fluid supply pump could be diriven at any cpixveniniitpower taeof -ons'the jet pump location wuld be unrestricted -by need
for accelss. to a mechanfical drive point.
The pumps tested in this work ;wrere equipped with the usal bod4ysurro unding the norzle-throat Ijunction, or mixi .ng point.% Secondary'. fluidenters at a tee inlet on one side. This body portion coul~d be eliminated in thescavenge pump application, affording full rad~ial entry of secondary fluid.
*Two or more jet scavenge pumps could be "powered" by on~e primary.supply pump.
V=~C TR 55-143 65
An optimum arrangement should obtain by installing the pumnp verticallyin the bottom of the sump, the wall faired into the throat entry. The nozzlecould be supported above on strruts, discharge downward into the open throat.
Engineering Design. - Unquestionably the process of originally designinga jet scavenge pump installation would be more complex than the selectionof a positive -displacement gear pump. Experience would probably point theway to simplier methods than the step-by-step method followed in this work,The jet pump must be finally selected in the light of ternperature effects(Reynolds number), and altitude effects. The latter largely dictates pumpdesign for air craft use.
Suggestions for Irrprovemeiit,. and Future Wi,,rk
1, The problem of low efficiency at low Reynolds number might respond tochauges in configuration of the jet pump. Turbulence inducing devicesin the niozzle could lower, the useful limit of jet Reynolds. numibek-, nowabout B.N 3, 000.
2.The use of a varable-a a nozzle (19 might ofer advantages bothasregards viscous efects and cavitation-itdflw
3. There is a!, need for'fu*z'the1', basic wor'x in determination of optimum de-.,design. ,Prosent excperimental results indic ite that optimumnlo~zzL61-to-'thro"at spacing and throit length are. interrelated wIthL area ratio., Propermatching of all tiree, vartiables might brink about an appreciable gain inoil, pump efficiency, possibly to 35 per cent, compared with the 25 to 30pe'ý,cent attained in these tests. (Although- area ratio is included in thetheory, mixing length ts not.)
4.The cavitation -limited flow phenom~enon *arvrants further s'tudy; also-Y measurements should be extended to. other oils and-other fluids such-,-as water, fuels, and hydraulic fluids.
Limiting-fl ow responds g~ornewhat to nozzle spacing. Other design,changes might help. The two-stage mixing zone -design _(4) should effect 'amarked improvement. A portion of the secondary flow could be mixed withthe high velocity primary jet; the -(slowed) otretam would. then entrain the,remainder of the secondary flow at A point Idow~astream.. Thus, the corn-; binatlon. of high flow ratio and high jet velocity at one point of mixing, isavoidedý
W&DC TR 55-143 66
1. "The Design of 3et Pumps", Flugel, G., NACA T. M. 982, 1939.
Z. "A Simple Air Ejector", Keenan, J. H., and Newmanan, Journal ofAppiedMecanicsý vol. 69, 1942, pp, A-317 to A-336.
3. "An Investigation of Ejector Design by Anal ysis and.F:Xperinment"lKeenan, 3. H., Newmann, E. P., Lustwerk, F., Journal of AppiliedMechanics vol. 77, 1950, pp 299-309.
4. "Hydraulics and Its Applications",, Gibson, Constable., London, 19300p264.
15. "The Water Jet Pump", Gosline, J. E. and O'BrtBien, M. P,.,, Univeruityof California Publications in, Engineerting, vol. 3,,14o. 3, 1934,pp,167 -190.
"6.Eduotoz's for Hydraulio.Systems Applied to Closed-Cirouit'W~brioation'ysems, Hussman, As W. WAPC Teoonioal Report 53.431,, Septembe r
1952, 'Wright~httersoh AFB, Ohio.
7 ý "Jet itnixing of Two Liquids", Folsom~, R.. G. and, Fer guo in,, 'C. X.,Trartsactions of'ASME,,Jan. 1949, pp. 73-77. '
8. "E'.errontary Mechanics of Fluids", Rouse, Hi. Wtl1ey, l)46,. p 171.
'9. "Elementary Fluid Mechanics"., VeiuiAwd, 3. K. Wile~y, 1940, p 257.
10.. "The Design of Jet pumps.", Kroll., ýA. E.6 dhemical, n~ginearing Prý$gres-,"vol. 1,, Feb. 1947, pp 2-4
11. "Centrifugal sand Axial Flow Pumnps"', Stepan~ff VA. 3. X.'Wiley, 1948,"p 413.
12. "'Design of Injectors for Low-Pressure Air Flow", McElr 6y,.G . E.,d.U. S. Buzeau'of Mines Tech. Paper 678, 1,945..
13. "Altitude -Pressure Tables. Based on the United S1ates Standard Atrmos-phere", Brombacher, W. G. , U.S. NACA Rept. No. .538, 1948.
14. "Friction Facto rs for Pipe Flow", by M oody, L. F. Trn.ASME~vol. 66, 1944, P 671.
15. "Gas Eva-lution in Liquids and Cavitation" by Schweitzer, P.1H. , andSzebehely, V.G., Journal of Applied Physics v 21 Dec. 1950, p 1218.
WKODC T11 55-3103 67I
16. "Properties of Specification MIL-L-7808 Oil (Synthetic Oil)", byMargolin, E. L. , Te~ch. Note. WONE 52-532-487, 11 August 1952,Wright Air Development Ce~nter, A1RDC, Wright Patterson AFB, Ohio.
17. "The Pum~ping Characteristics of Long Mixing Section Jet Pumps"by Fox, N. L. ,Douglas Aircraft Co.. Rept. SM-14385 Sept. 1952, p 13.
18. "Investigation of the Mixing of Parallel Flowing Plane Air Streams inthe Pressure Gradient of a Jet Eductor" by Ferguson, C. K. , M. S. Thesis,University of California. 1948.
19. "Injector -Impeller Pump", Patent No. 2,457,388, Dec. 28, 1948.Kenneth~ R. Lung.
-WADO TR 55-3413 6
Appendix I
Jet Pump Theory
As a jet of fluid penetrates a stagnant or slowvly moving fluid, a drag-ging action occurs on the boundary of the jet between the high- and low-ve-locity particles. Mixing occurs between the surface jet fluid and the low ve-locity fluid; and transfer of momenta accelerates the latter in the direction offlow. As the two flows progress, the mixture stream spreads. The undis-turbed high velocity core progressively decreases in diameter until it disap-pears. (See Fig. 1) Confined by parallel throat walls, the secondary fluidenters a region of decreasing area, that area being the annulus. between. the,mixture stream and the throat wall. At the throat entrance the annular areais the differencet between Jet and throat area.,, At the throat exit the mixture:stream has sprea~d until it'touches the wall of the throat. Then all of theSside fluid has beon mixed with the primary jet.
SAssumptions. - In bommop with other solutioni, the approach may be termedtan "approximate,' theory, since the details '6f the mixing process are, voidedby use oi irpulse-momentum reiations.
l.:, The flow streams are one-dimensional at throatlentranc-an•d exit.
2. Mixing is :€ompleted in the constant area throat, against an ýad-verse pressure gradient. / 1.
S , .. • .. .. , . ,•,. .
'/ 'I ,,
• I" " ,i I
V'I
VJaDCV TR 55-143 69
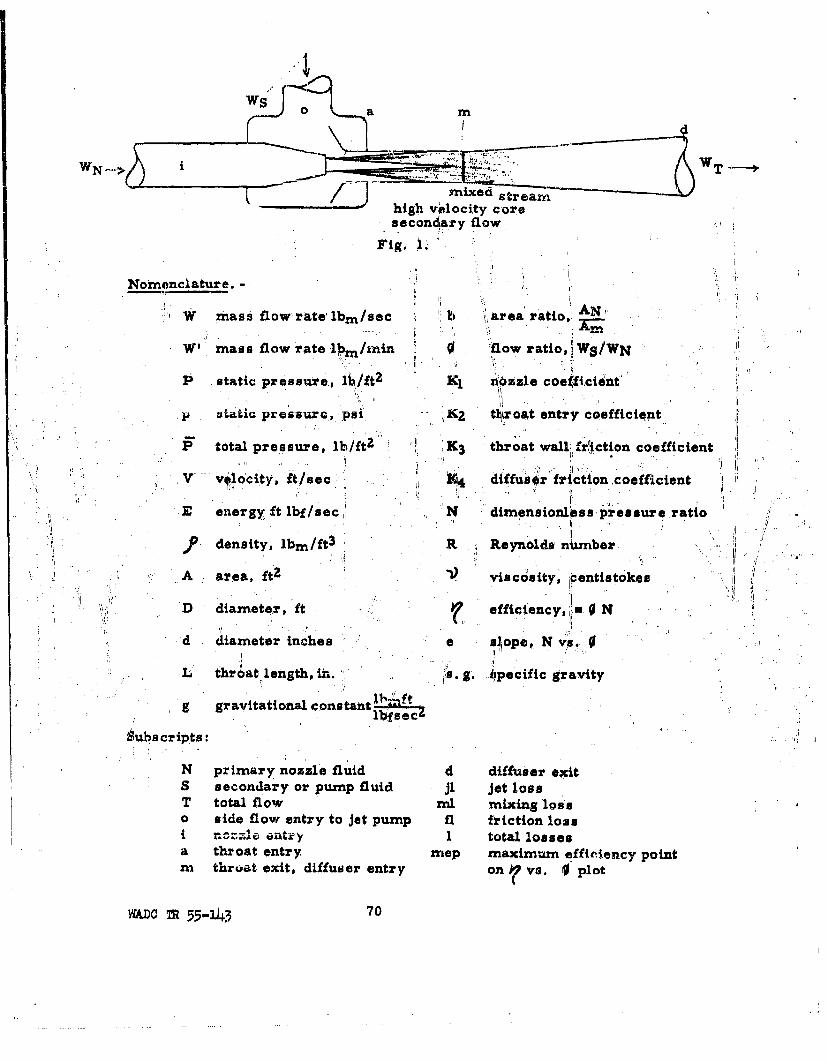
WT
mxdstreamnhigh velocity coresecond~ary flow
Fig. 1
Nomonclatur e. -
W mass flow rate, lbr/sec b Iarea ratio, A
W': mass flow rate lbrn/min 0 flow ratio, WS/WN
P static pressure., lb%/ft 2 IC1 nozzle coeifi~clent
a tatic pressure,: psi K2 tI~roAt entry co~efficient,
P total pressure, lbfiK hot wlfzction coefficient
V vel'city1 it/sec I diffus~r frijction, c oeff-icitent
E energy ft lbf /secj N dlimenstonl~asa pres oure ratio
.Pdensity, Ibm/ft 3 R Reynolds ntumber
A area, f 2 viscoslity, ~entistokes
D diameter, ft o' ffictency,;.u 0 N i
ýd diameter inches a sl8ope,. NVs.0
L b trat lengh in. g.pecific gravity
g graVitational constantbsacZ
Subscripts:
N primary nozzle fluid d diffuser exitS secondary or pump fluid ji jet lossaT total flow nil mixing log'so side flow entry to jet pump fl friction lossI r~L onrtky I total lossesa thr oat entr y Inep, maximum efficiency pointmn throat exit, diffuser entry on 7vs. 0' plot
WAD l 55-1140 70
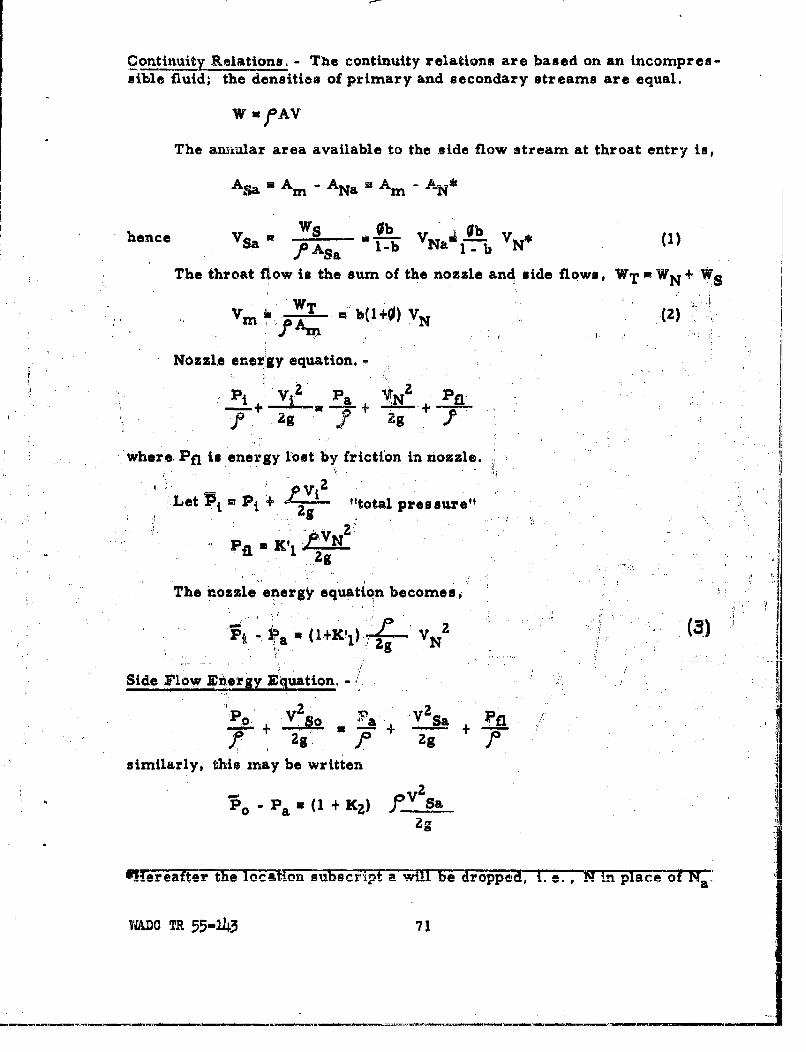
Continuity Relations. - The continuity relations are based on an incompres-
sible fluid; the densities of primary and secondary streams are equal.
W uffAV
The annular area available to the side flow stream at throat entry is,
Asa Am - ANa Am - AN*
Ws Ob " b
hence Va !ASa -b VNa I--VN* (1)
The throat flow is the sum of the nozzle and side flows, WT = WN + WS
: :JJAm
Nozzle energy equation. -
P1 V1~ Pa VN Pfl_ _+ .__ .. ...
Zg g
where, Pfl is energy lost by friction in nozzle.
*2Let P. Pt + "total pressure"
', • fl K'IZg2g
P;jiThe nozzle energgy equation becomes,
- ?a ~ 1K 1 g NI2g.3
Side Flow Energy Zquation. -
PO V, go a V2 ~a tj_ o+ • + + -S •-2g;. 2g 3
similarly, this may be written
Po " Fa =(I + KZ) ]:V sa
Zg
Mereafter the location subscript a will Be dropped, t. e., M in place of Na-
VL.DC TR 55-143 71
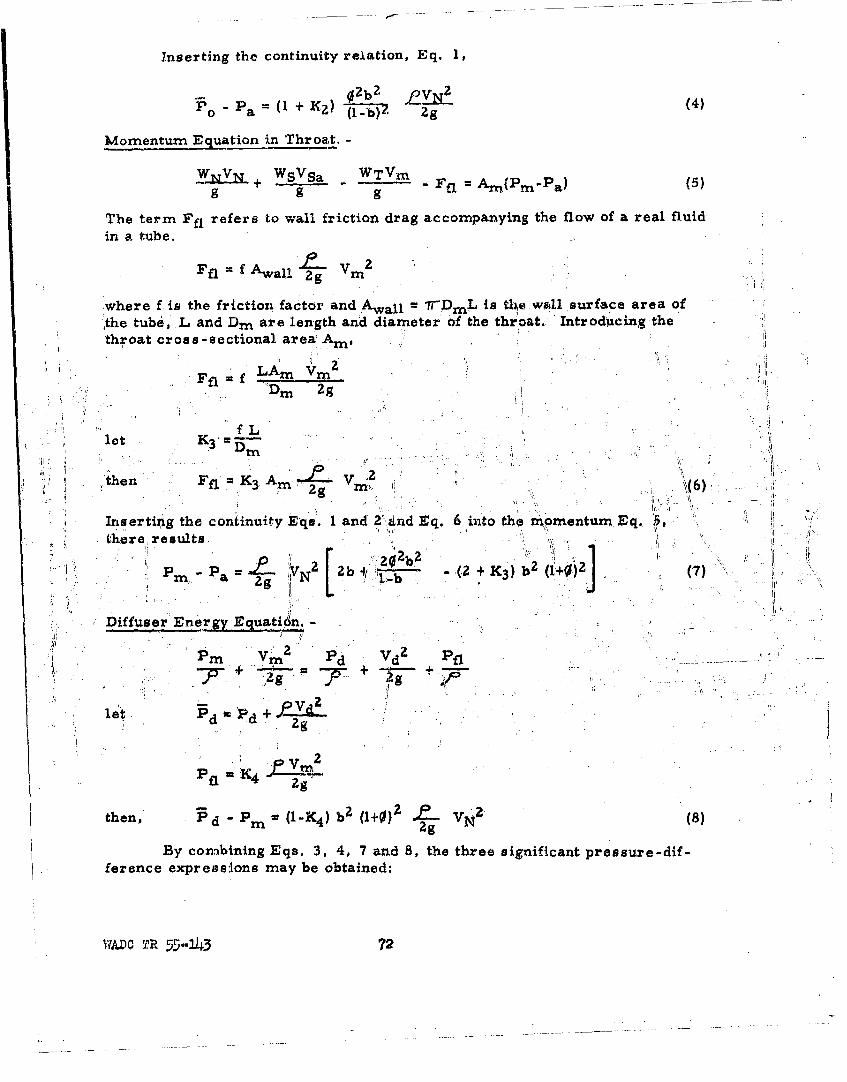
Inserting the continuity relation, Eq. 1,
-02b2Z PVN?ro -Pa =(1+ KZ)_J (l-)Z 2g (4)
Momentum Equation in Throat. -
WNV + S~ WTVin _Ffl =Ar(Pm-Pa)(59 (5)
The term Faj refers to wall friction drag accompanying the flow of a real fluidin a tube.
Flf Aa.. 2 g Vmn
,where f is the friction factor and Awall = iFPmL is the wall surfa~ce area of,the tube,' L and Dm are length and diameter of the throat.. 'Introducing the'throat cross-sectional area-LM
I. F~rnf LAm mDn 2g
f Llet K3 3
then K A g~ 6
Insertizig the continuity Eqs 1 and 2 find Eq. 6 into the momentum, Eq., 5,* thereresults.
p 2 K b2 (1+02 2] (7)'PM Pa Zg N [2b* .b (2 +K 3 )b(
Diffuser Energy Equati.8n. -
vm Pm d Vd2 Pfl'
let P g
d, Pd~ Zg
then, Pd PM ( 4) b2 (1+0)~ 2 .PV2 (8)
By combining Eqs. 3, 4, 7 and 8, the three significant pressure-dif-ference expressions may be obtained:
raDO c 55-a43 72
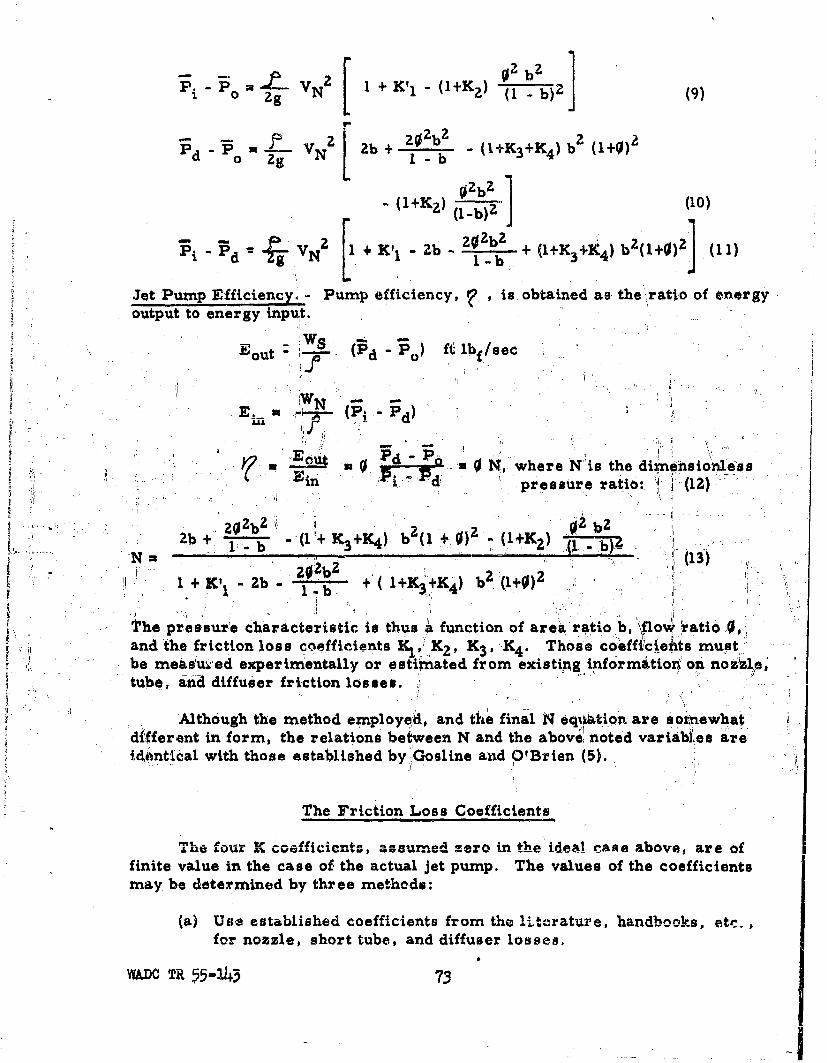
p.PUi.o VNZ [ 1+ X11 - (l+KZ) 02jb (9)
Pd 0 V VN- [ 2b + 2 - (I+K 3 +K4 ) b (1+0)2
02 bz I" (1+K 2 ) ( (10)S I1 (1 -b)
.i d = 2 1N + K'I - + (1+K-K 4 ) b2(+0)2 (11)
Jet Pump Efficiency: - Pump efficiency, • , is obtained as. the ratio of energyoutput to energy input.
E 0 t. ~ft lbf/secEout : P.(d -Po t b/e
NE. (PI I I
*0 *0 N4, where N is the dirnensiohlessrin • pressure ratio: :i (12)
2912b 2 2 2 b2Zb + --- - + +K 4 ) b(1 t.) - (I . I-
N. 22 (103)1+ K' 1 - 2b - -Ib + ( l+K+K4 ) b2 (1+0)2
i The pressure characteristic is thus a function of area ratio b, floW ratio 0,-and the friction loss coefficients I, K, K 3 , K4 . Those coefftciefits must
be meao'u:-ed experimentally or estimnated from existing information on nozile,tube, anrd diffuser friction losses.
Although the method employei, and the final N equAtion are soinewhatdifferent in form, the relations between N and the above" noted variabies areidintical with those established by,-Gosline and O'Brien (5).
The Friction Loss Coefficients
The four K co.ffici.ent's, as-esumr'ed zero Li, the i•eAal Came above, are of
finite value in the case of the actual jet pump. The values of the coefficientsmay be determined by three methods:
(a) Us•, established coefficients from the liatcrature, handbooks, etc.for nozzle, short tube, and diffuser losses.
WAXDC TR ý5-13 73
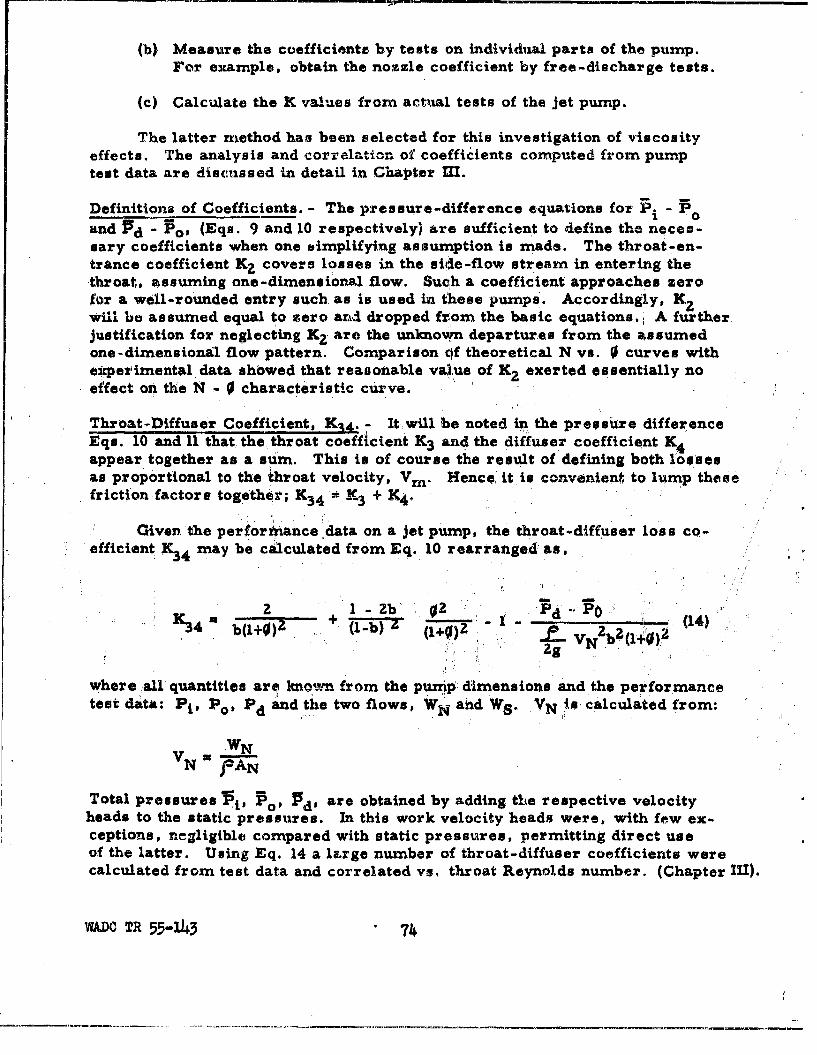
(b) Measure the coefficients by tests on individual parts of the pump.
For example, obtain the nozzle coefficient by free-discharge tests.
(c) Calculate the K values from actual tests of the jet pump.
The latter method has been selected for this investigation of viscosityeffects. The analysis and correlation of coefficients computed from pumptest data are discussed in detail in Chapter Ml.
Definitiona of Coefficients. - The pressure-difference equations for Pi - PO
and Pd - Po, (Eqs. 9 and 10 respectively) are sufficient to define the neces-sary coefficients when one simplifying assumption is made. The throat-en-trance coefficient KZ covers losses in the side-flow stream in entering thethroat, assuming one-dimensional flow. Such a coefficient approaches zerofor a well-rounded entry such as is used in these pumps. Accordingly, X2will be assumed equal to zero and dropped fr:om the basic equations.; A furtherjustification for neglecting K2 are the unknown departures from the assumedone-dimensional flow pattern. Comparison of theoretical N vs. 0 curves witheotperimental data showed that reasonable val~ue of K2 exerted essentially noeffect on the N - characteristic curve.
Throat-Diffuser Coefficient, KA4 . - Itwill be noted * the pressure difference
Eqs. 10 and 11 that the throat coefficient K3 and the diffuser coefficient K4appear together as a sum. This is of course the result of defining both lossesas proportional to the throat velocity, Vm. Hence it is convenient to lump thesefriction factors together; K3 4 X K3 + K4 .
Given the perforz*ance data on a jet pump, the throat-diffuser loss co-efficient K4 may be calculated from Eq. 10 rearranged as,
2 1 2-zb $2 - Pd -T(O+ (14)
2g
where all quantities are knon from the pump dimensions and the performancetest data: Pi, Po, Pd and the two flows, WN and WS. VN ,ýr calculated from:
,WNVN JAN
Total pressures V.i, Po, 5d, are obtained by adding the respective velocityheads to the static pressures. In this work velocity heads were, with few ex-ceptions, negligible compared with static pressures, permitting direct useof the latter. Using Eq. 14 a large number of throat-diffuser coefficients werecalculated from test data and correlated vs, throat Reynolds number. (Chapter III).
WADC TR 55-143 74
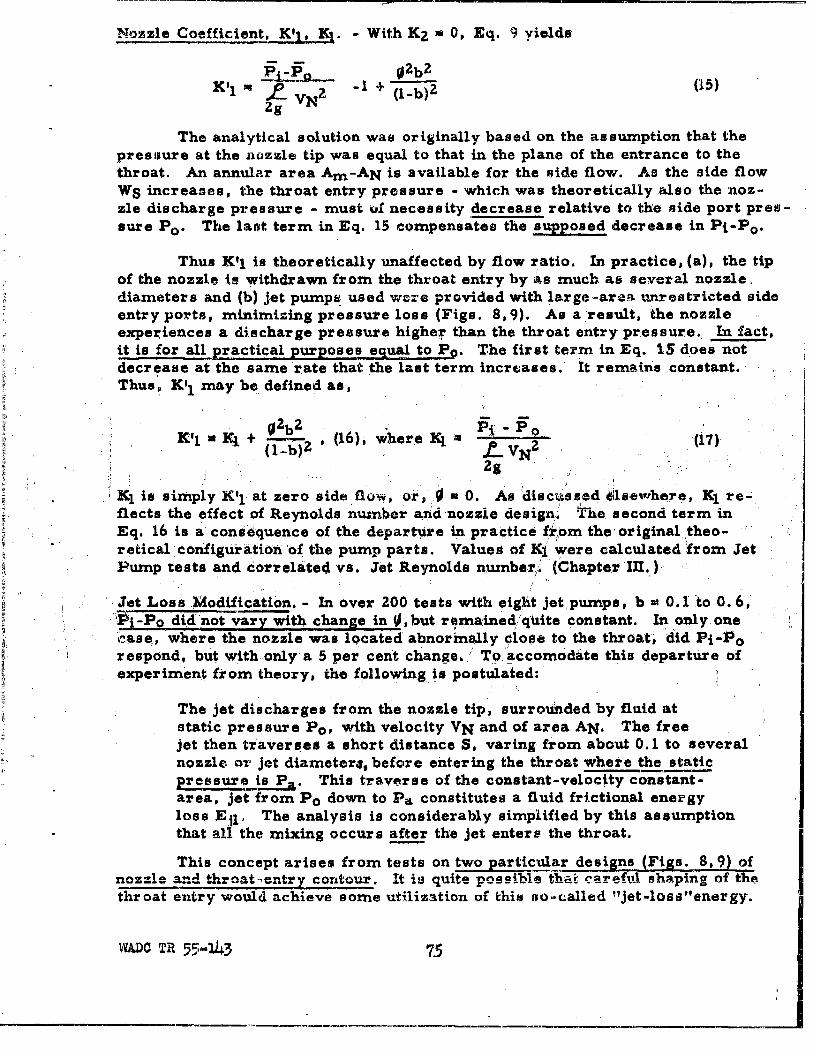
Nozzle Coefficient, Kli,..!. - With K2 * 0, Eq. 9 yields
P O2b2K.1 " VN2 -Z (1-b)2 (15)
Zg
The analytical solution was originally based on the assumption that thepresioure at the nozzle tip was equal to that in the plane of the entrance to thethroat. An annular area An1 -AN is available for the side flow. As the side flowWS increases, the throat entry pressure - which was theoretically also the noz-zle discharge pressure - must ol necessity decrease relative to the side port pres-sure Po. The last term in Eq. 15 compensates the supposed decrease in Pi-Po.
Thus K'l is theoretically unaffected by flow ratio. In practice, (a), the tipof the nozzle is withdrawn from the throat entry by as much as several nozzle,,diameters and (b) jet pumps used wore provided with large =ar.-. unrestricted sideentry ports, minimizing pressure loss (Figs. 8,9). As a result, the nozzleexperiences a discharge pressure higher than the throat entry pressure. In fact,it is for all practical purposes equal to P0 . The first term in Eq. 15 does notdecrease at the same rate that the last term increases. It remains constant.Thus, KI1 may be defined as,
1 + - (16,) where Y4 07)(1 -b£ VN2
2g
K1 is simply K'1 at zero side flow, or, 0 a 0. As discvssed 41se,'erhere, K1 re-flects the effect of Reynolds number arid nozzLe design. The second term inEq. 16 is a consequence of the departure in practice fOom the original ,theo-retical configuration of the pump parts. Values of Ki were calculated from JetPump tests and Correlated vs. Jet Reynolds numberi. (Chapter III.) JJet Loss Modification. - In over 200 tests with eight jet pumps, b * 0.1 'to 0.6,
'Pi-Po did not vary with change in ,,but remained quite constant. In only onecase, where the nozzle was located abnormally close to the throat, did Pi-Porespond, but with only a 5 per cent change., To accomodate this departure ofexperiment from theory, the following is postulated:
The jet discharges from the nozzle tip, surrounded by fluid atstatic pressure Po, with velocity VN and of area AN. The freejet then traverses a short distance S, varing from about 0.1 to severalnozzle or jet diameters, before entering the throat where the staticpressure i P This traverse of the constant-velocity constant-area, jet from Po down to Pa constitutes a fluid frictional energyloss Eil, The analysis is considerably simplified by this assumptionthat all the mixing occurs after the jet enters the throat.
This concept arises from tests on two particular designs (Figs. 8, 9) ofnozzle and throat-tntry contour. it is quite possible thai carefwl shaping of the
throat entry would achieve some utilization of this so-called "jet-loss"energy.
W1=.0 TR 55-143 7
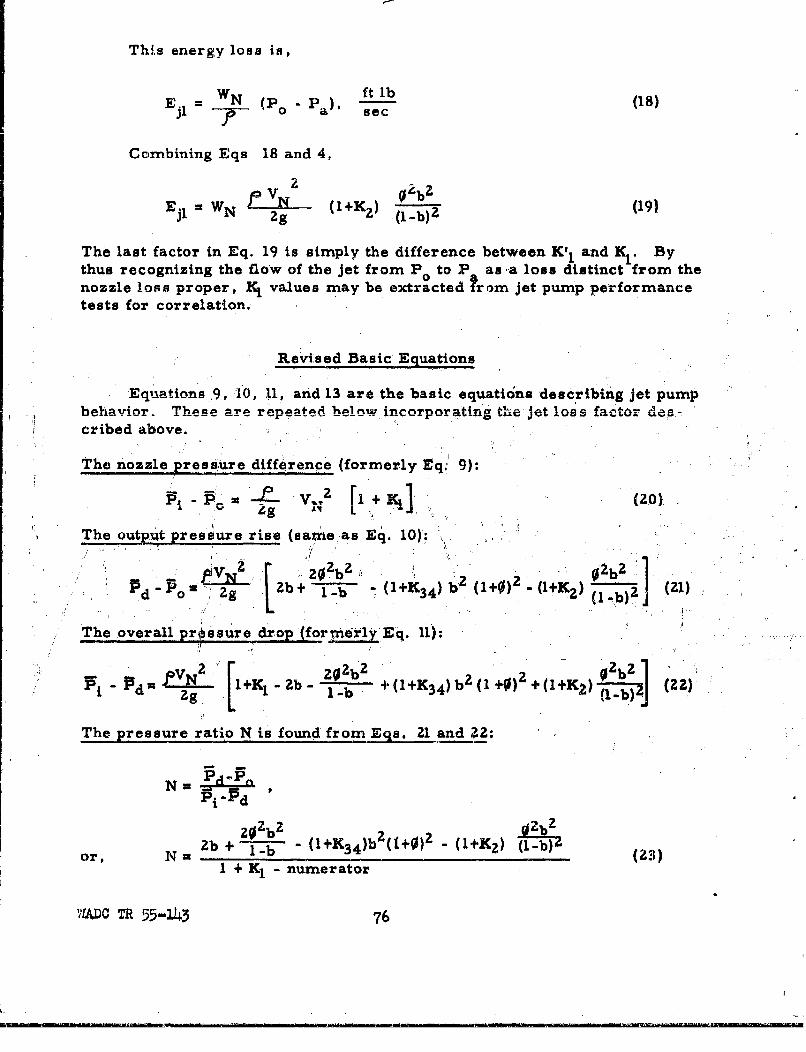
This energy loss is,
WN (P P) ft lb (18)Zj P=0 a sec
Combining Eqs 18 and 4,
E( WN VN (19)ji N 2g (1-b)2
The last factor in Eq. 19 is simply the difference between K'I and K1 . Bythus recognizing the flow of the jet from Po to P as a loss distinct from thenozzle loss proper, IK1 values may be extracted ?rom jet pump performancetests for correlation.
Revised Basic Equations
Equations .9, 10, 11, and 13 are the basic equations describing jet pumpbehavior. These are repeated below incorporating the jet loss factor desr-cribed above.
Thf nozzle pressure difference (formerly Eq.! 9):
2~ rFI+] (20).
The output pressure rise (same as Eq. 10):
prssure rise q . ..
.VN2 q 1 )2 "2 b 1 21
The overall pressure drop ro Eq....).
_____202 b 2 2 0b
-Pd •I+ -[2b - b 4(0+K 3 4 ) b 2-(1b+0) +2 +K2)(Ij 2 (00Pi il g1-b
The pressure ratio N is found from Eqs. 21 and 22:
N = i'd'
zCd~bZor,2b N ' I- (-+K 3 4)b 2 (1+0) 2 - (I+K 2 ) (1"b)
or, N = (23)
I + K1 - numerator
UADC TR 55-1h3 76
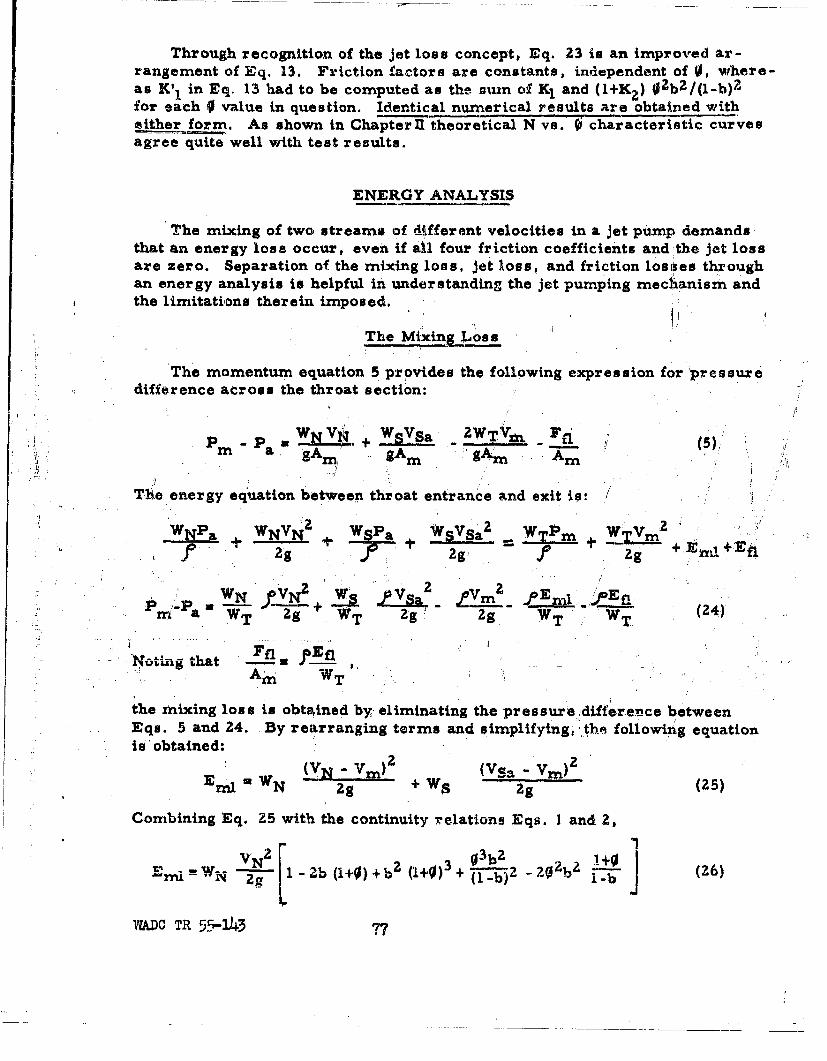
Through recognition of the jet loss concept, Eq. 23 is an improved ar-rangement of Eq. 13. Friction factors are constants, independent of 0, where-as K'1 in Eq. 13 had to be computed as the stun of K1 and (1+K 2 ) 0,2b 2 /(1-b) 2
for each 0 value in question. Identical numerical results are obtained witheither form. As shown in Chapterfl theoretical N vs. 0 characteristic curvesagree quite well with test results.
ENERGY ANALYSIS
The mixing of two streams of different velocities in a jet pump demandsthat an energy loss occur, even if all four friction coefficients and the jet lossare zero. Separation of the mixing loss. jet loss, and friction losabes throughan energy analysis is helpful in understanding the jet pumping mechanism andthe limitations therein imposed. I
"The Mixing L oss
The momentum equation 5 provides the following expression for pressuredifference across the throat section:
* pm *a WNvN + WsVSa ZWTV&L Ffi_ . _-a - (5);fr.a gAS gAm gAi Am
The energy equation between throat entrance and exit ipu
:k:a +WNV + WSPa WSVSa - WTPm + I r
. .f + 2g 2g f zg +JEzr +Efl
:WN 'V SA ZYIM, E i . P_m-a WT Zg WT "g 2g WT WT (24)
N b-In -A, PE'.Am WT
the mixing loss is obtained by eliminating the pressure .difference betweenEqs. 5 and 24. By rearranging terms and simplifyingr Jthe following equation"is "obtained:
""N N ( Vm. 2 (VSa - Vm2)2EmWg g (25)
Combining Eq. 25 with the continuity relations Eqs. I and 2,
VN2 2 0 303b 2 0 2 -62 (+0I! m wN Z L 1 Zb (1+0) +b + (I. -b)2
- i-b (26)
WAPC TR 5•-143 7?
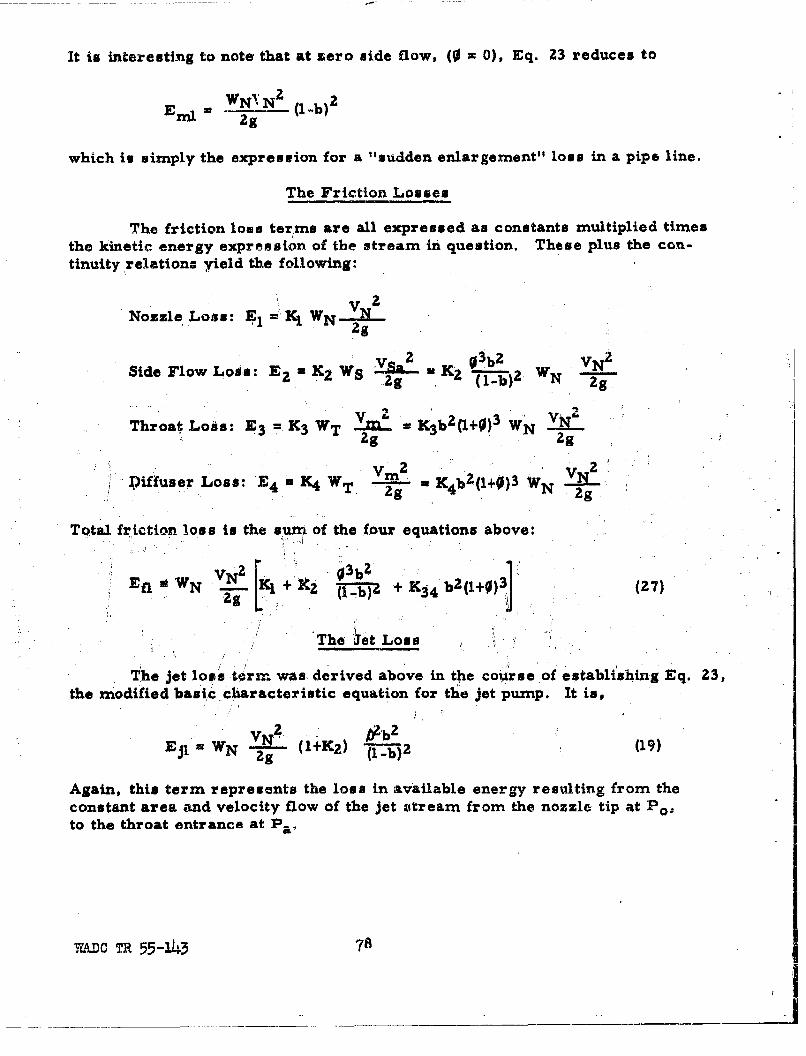
It is interesting to note that at zero side flow, (0 = 0), Eq. 23 reduces to
SW-N' (l-b)22g
which is simply the expression for a "sudden enlargement" loss in a pipe line.
The Friction Losses
The friction loas terms are all expressed as constants multiplied timesthe kinetic energy expression of the stream in question. These plus the con-tinuity relations yield the following:
1 W -VN 2Nozzle Loss: E-1=KIW 2g
Side Flow LoJ~s: E 2 -aK2 Ws .Xa...iK 2 2VN 2
Zg(l-.b)'N g
ZgZ V
Diffuser Loss: E K4 WT b 2 (1+0)3 W 2vN
2g
Total friction loss is the sum of the four equations above:
dW?, VN 2 E0 3b2 3 (7SEf N -- + K3 4 b2(l (27)
The Jet Loss
The jet lose t~rm was, derived above in the course .of establishing Eq. 23,
the modified basic characteristic equation for the jet pump. It is,
Ejl = WN -• +) (b 2 (19)
Again, this term represents the loss in available energy resulting from theconstant area and velocity flow of the jet aitream from the nozzle tip at Po,to the throat entrance at Pa.
WifOC TR 55-143 1 j__ _ __ ____ __ ___ __ ___ ___ ____ ___ - i
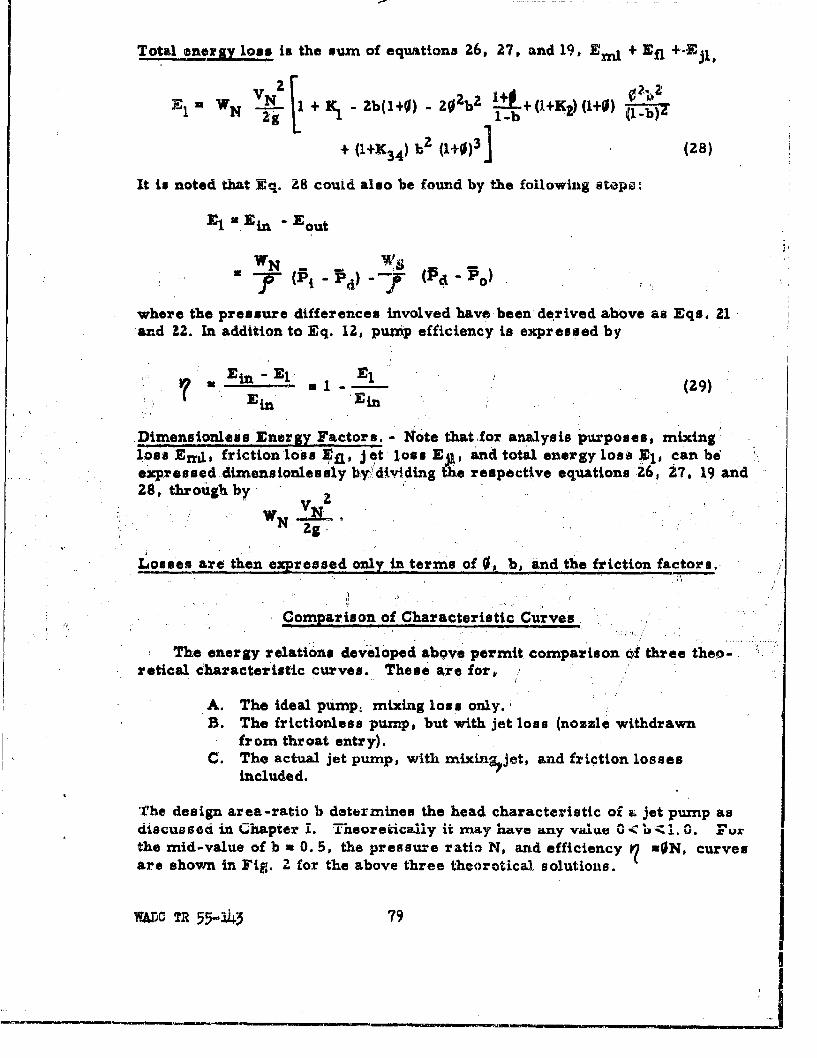
Total energy loss is the sum of equLtions 26, 27, and 19, Eml + Eft +.Ejlo
E w + X - 2b(1+) +(I+) (1+0)-zi -
+ (1+134) b2 (1+0)3 (28)
It is noted that Eq. 28 could also be found by the following steps:
E1 a Ein Eout
ZWN W
where the pressure differences involved have-been derived above as Eqs. 21and U2. In addition to Eq. 12, puznp efficiency is expressed by
Ein- El 1( El
Ein En(9
Dimensionless Energy Factors. - N~ote that for analysis purposes, mixingloss Erg, friction loss Eft, jet loss Ej3, and total energy loss El, can be'expressed dimensionlessly by'divlding the respective equations 26, 27, 19 and28, through by
, . ~WN..JL .
Losses are then expressed only in terms of 0, b, and the friction factors.
Comparison of Characteristic Curves.
The energy relations developed above permit comparison of three theo-.retical characteristic curves. These are for,
A. The ideal pumpt mixing loss only.B. The frictionless pump, but with jet loss (nozzle withdrawn
from throat entry).C. The actual jet pump, with mixina~jet, and friction losses
included.
"The design area-ratio b determines the head characteristic oi a jet pump asdiscussed in Chapter I. Theoretically it may have any value O- <1 <3. O. Furthe mid-value of b = 0. 5, the pressure ratio N, and efficiency ' -ON, curvesare shown in Fig. 2, for the above three theoretical solutions.
WADC TR1 55-343 79
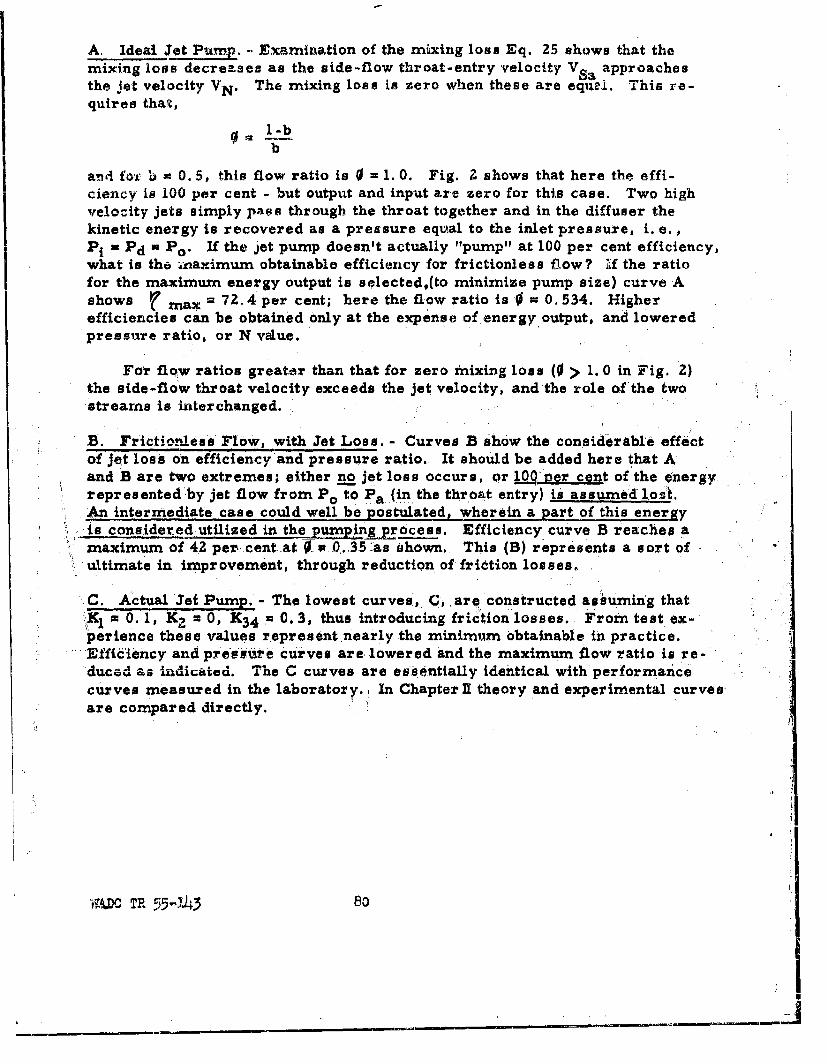
A. Ideal Jet Pum.. - Examination of the mixing loss Eq. 25 shows that themixing loss decreases as the side-flow throat-entry velocity VSa approachesthe Jet velocity VN . The mixing loss is zero when these are equel. This re-quires that,
1-bb
and fox b = 0. 5, this flow ratio is 0 =1. 0. Fig. 2 shows that here the effi-ciency is 100 per cent - but output and input are zero for this case. Two highvelocity jets simply pass through the throat together and in the diffuser thekinetic energy is recovered as a pressure equal to the inlet pressure, i. e.,PI - Pd = Po0 If the jet pump doesn't actually "pump" at 100 per cent efficiency,what is th 6 Anaximum obtainable efficiency for frictionless flow? If the ratiofor the maximum energy output is selected.(to minimize pump size) curve Ashows M a 72.4 per cent; here the flow ratio is 0 0. 534. Higher
efficiencies can be obtained only at the expense of energy output, and loweredpressure ratio, or N value.
For flow ratios greater than that for zero mixing loss (0> 1. 0 in Fig. 2)the side-flow throat velocity exceeds the jet velocity, and the role of the twostreams is interchanged.
B. Frlctionless Flow, with Jet Loss. - Curves B show the considerable effectof jet loss on efficiency and pressure ratio. It should be added here that Aand B are two extremes; either no jet loss occurs, or 100 per cent of the energyrepresented by jet flow from P 0 to P. (in the throat entry) is assumed loft.An intermediate case could well be postulated, wherein a part of this energyis considered utilized in the pu!ngyrocess. Efficiency curve B reaches amaximum of 42 perýcent at 0, 0.35 as shown. This (B) represents a sort ofultimate in improvement, through reduction of friction losses,
C. Actual Jet Pump. - The lowest curves, C, are constructed assuming thatmK = 0. 1, K2 = 0, K3 4 .a 0. 3, thus introducing friction losses. From test ex-
perience these values represent.nearly the minimum obtainable in practice..fficiency and pressuire curves are, lowered and the maximum flow ratio is re-duced as lndid;ated. The C curves are essentially identical with performancecurves measured in the laboratory.:! In Chapter 11 theory and experimental curvesare compared directly.
•DC TR n5-143 80
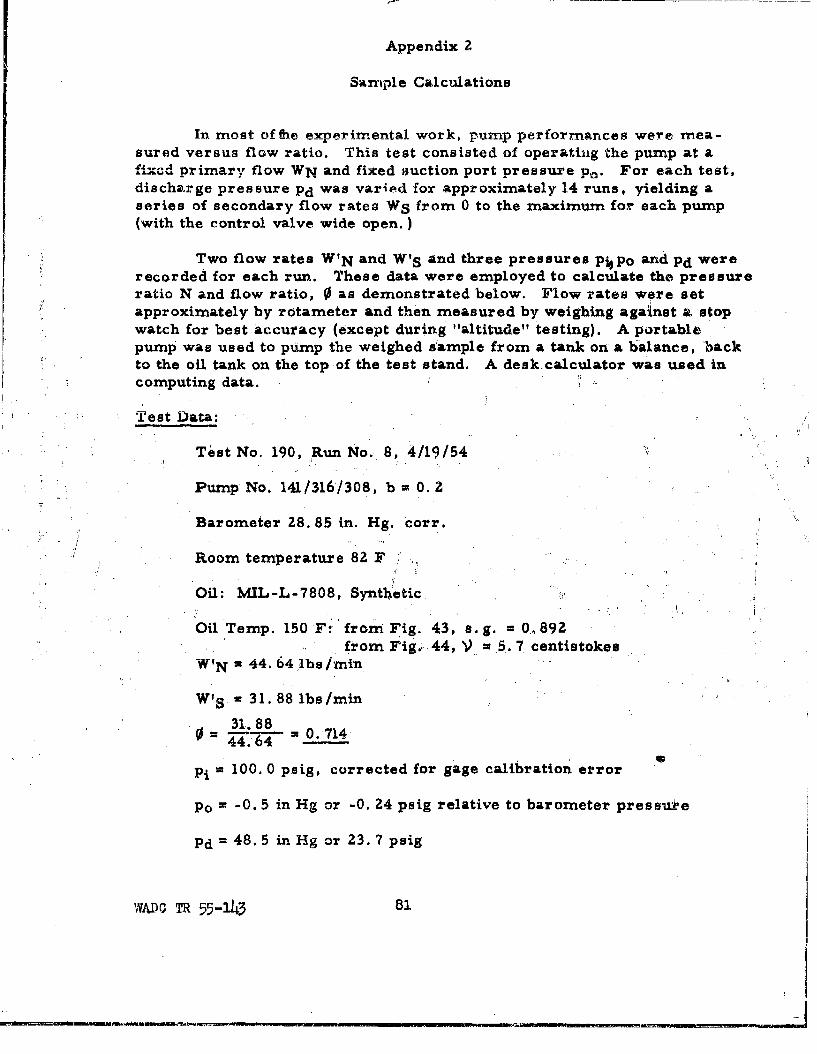
Appendix 2
Sample Calculations
In most of &e experimental work, pump performances were mea-sured versus flow ratio. This test consisted of operating the pump at afixcl primary flow WN and fixed suction port pressure p_. For each test.discharge pressure Pd was varied for approximately 14 runs, yielding aseries of secondary flow rates WS from 0 to the maximum for each pump(with the control valve wide open.)
Two flow rates W'N and W'S and three pressures PiPo and Pd wererecorded for each run. These data were employed to calculate the pressureratio N and flow ratio, 0 as demonstrated below. Flow rates were setapproximately by rotameter and then measured by weighing against a, stopwatch for best accuracy (except during "altitude" testing). A portablepump was used to pump the weighed sample from a tank on a balance, 'backto the oil tank on the top of the test stand. A desk calculator was used incomputing data.
Test Data:
Test No. 190, Run No. 8, 4/19/54
Pump No. 141/316/308, b= 0.Z
Barometer 28. 85 in. Hg. corr.
"Room temperature 82 F
Oil: MIL-L-7808, Synthetic A
Oil Temp. 150 F: from Fig. 43, s.g. 30.,892from Fig.,44, V * 5. 7 centlstokes
W'N = 44.64 lbs/imn"
W's =31.88 lbs/min
31.881 4.8 = 0.714
Pi = 100. 0 psig, corrected for gage calibration error
Po = -0. 5 in Hg or -0. 24 psig relative to barometer pressute
Pdf 48.5 in Hg or 23.7 psig
WRADO R 55-143 81
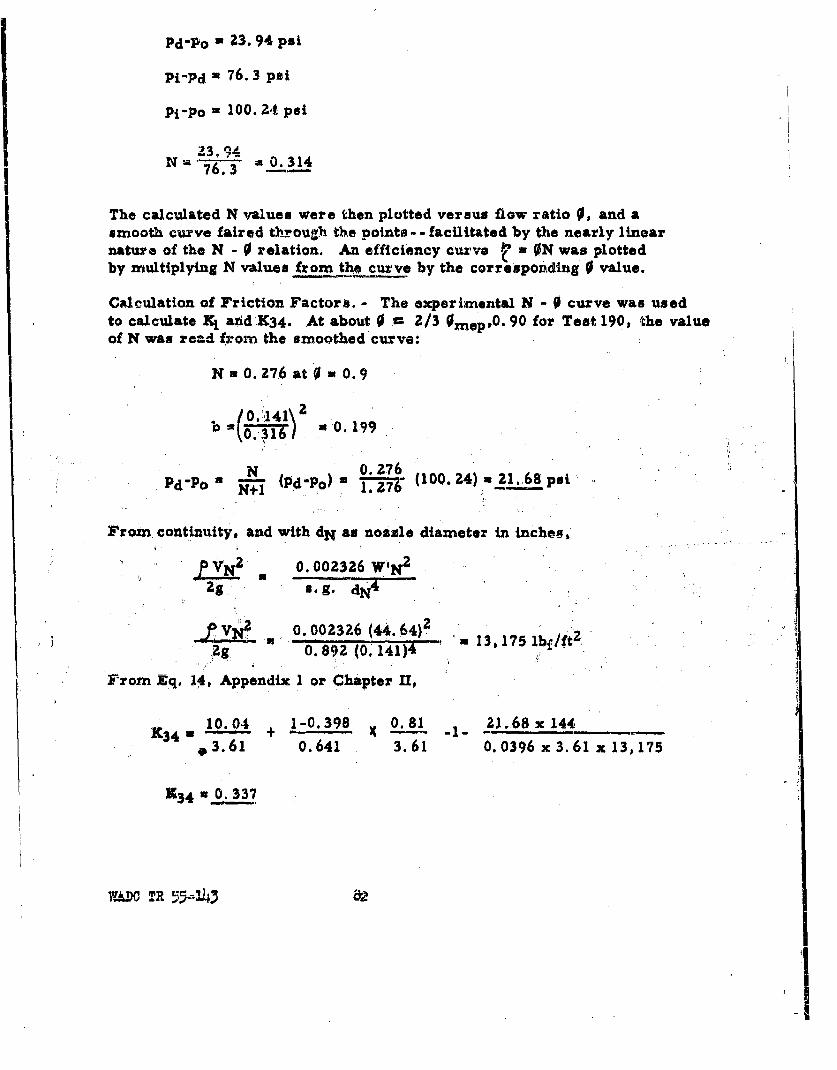
Pd-Po - 23.94 psi
Pi-Pd = 76.3 psi
PiPo" 100. 24 psi
•-. 7"£~
Na 76.3 -0.314
The calculated N values were then plotted versus flow ratio 0, and asmooth curve faired through the points-- facilitated by the nearly linearnature of the N - 0 relation. An efficiency curve O ON was plottedby multiplying N values from the curve by the corresponding 0 value.
Calculation of Friction Factors. - The experimental N- 0 curve was usedto calculate K1 andK34. At about 0 a 2/3 Oreep,0. 90 for Test 190, the valueof N was read from the smoothed curve:
N - 0. 276 at 0 0. 9
:31) 0.199
N 0.276Pd'Po N (Pd-Po) 1.7 (l00.24)=21.68psi
From continuity, and with dN as nozzle diameter in inches,
P VN 2 0.002326 W'N 2
ZS s.g. dN 4
Ye .0.002326 (44.64)2 '-13,175 lb•f 2Zg Oi 0.s92 (o0.141):4 id"
From Xq, 14, Appendix I or Chapter II,
10.04 ,1-0.398 81 21.68 x 144K34 = - - - + . .. X L,
*3.61 0.641 3.61 O. 039 6 x 3. 6 1 x 13,175
K3 4 x 0. 337
I
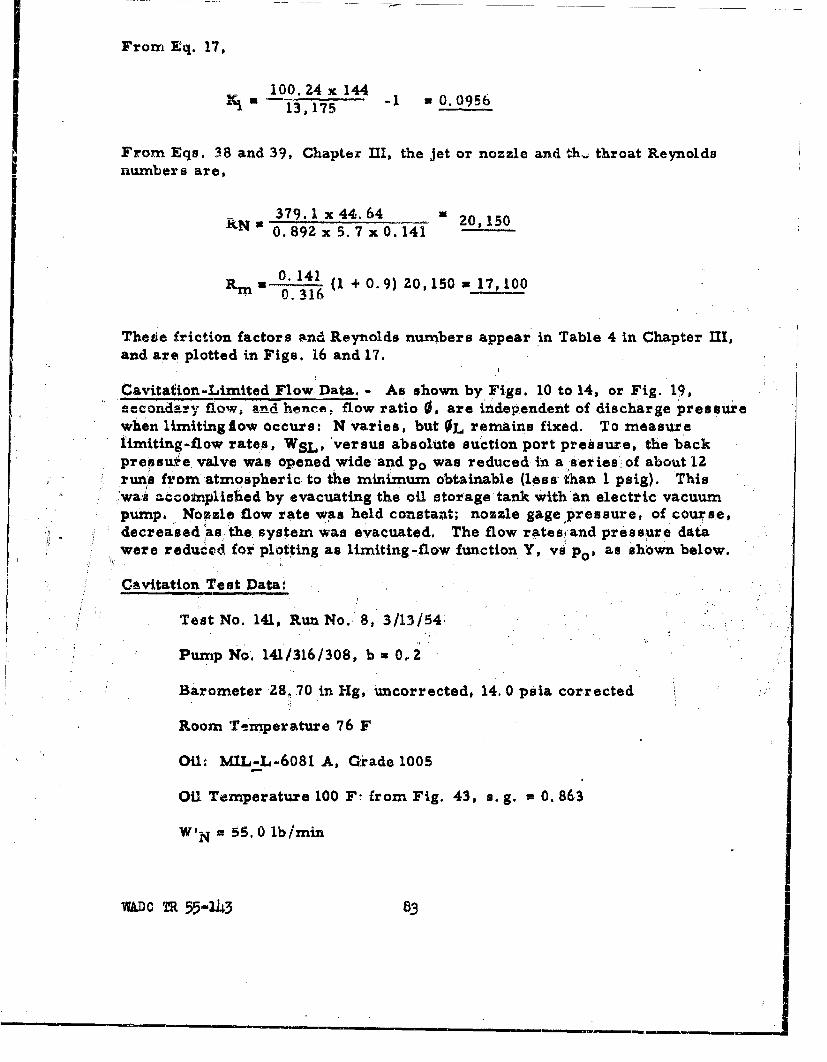
From Eq. 17,
100 24 1 x,144 -1 0. 0956
From Eqs. 38 and 39, Chapter III, the jet or nozzle and th..; throat Reynoldsnumbers are,
R 379.1 x44.64 20,1500.892 x 5.7 x 0. 141
R.m• 0.=-P 1 (1 + 0.9) 20,150 17,1000.316
TheSe friction factors and Reynolds numbers appear in Table 4 in Chapter III,and are plotted in Figs. 16 and 17.
Cavitation-Limited FlowData. - As shown by Figs. 10 to 14, or Fig. 19,aecondary flow, and hence, flow ratio 0, are independent of discharge pressurewhen limitingiow occurs: N varies, but OL remains fixed. To measurelimiting-flow rate', WSL, versus absolute suction port pressure, the backpressure valve was opened wide and Po was reduced in a seriesi of about 12run's from atmospheric to the minimum obtainable (less than 1 psig). Thiswas accomplished by evacuating the oil storage tank with an electric vacuumpump, Nozzle flow rate was held constant; nozzle gagepressure, of cou~se,
decreased as, the, system was evacuated. The flow rates' and pressure datawere reduced for plotting as limiting-flow function Y, vs Po, as shown below.
Cavitation Test Data:
Test No. 141, Run No. 8, 3/13/54.
Pump No. 141/316/308, b * 0.2
Barometer 28, 70 in Hg, uncorrected, 14. 0 psla corrected
Room Temperature 76 F
Oil. MIL-L-6081 A, Grade 1005
Oil Temperature 100 F! from Fig. 43, s. g. = 0. 863
W'N 55. 0 lb/mim
wAo m 55-143 83 j!1
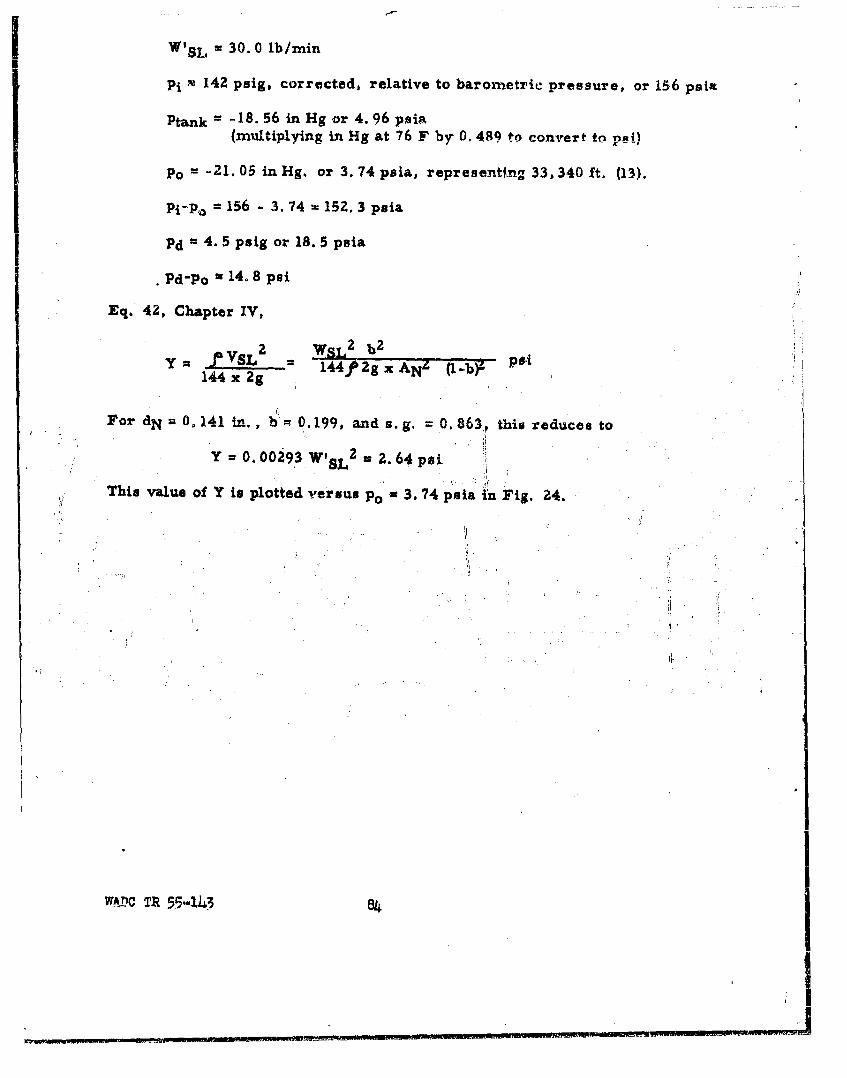
W1SL = 30. 0 lb/min
Pi m 142 psig, corrected, relative to barometric pressure, or 156 psia
Ptank = -18.56 in Hg or 4.96 psiau(mmItiplying in Hg at 76 F by 0. 489 to convert tn mill
Po = -21. 05 in Hg. or 3. 74 psia, representfng- 33,340 ft. (13).
pj-pP, = 156 - 3. 74 = 152. 3 psla
Pd a 4. 5 psig or 18. 5 psia
Pd'Po a 14.8 psi
Eq. 42, Chapter IV,
Y NIWSL 2 b 2
______- 144 2g x ANA (I1-by- P""144 x 2g
For dN 0.141 in., bm= 0.199, and s.g. 0.863, this reduces to
Y =0. 00293_ W'SL2 2. 64 psi
This value of Y it plotted versus p0 = 3. 74 psia in Fig. 24.
VAflO TR 5.5-14.3 84
,/., J
Appendix 3.
Theory Compared with Experimental Resultson Water Jet Pumps
The approximate theoretical approach presented at the end ofChapter I Nas originally proposed by Gosline and O'Brien (5) and enlargedupon by Stepanoff (11). It assumed that N versus -. is a straig't line, andaccor dingly
N=No- (34)
The theoretical Eq. 23 for N is considerably simplified when 0 = 0, here
2b - (l+K34) b2 (23a)No 1+Kq - numerator
The intercept ca the 0 axis, or maximum flow ratio, 0o, may be
found directly from Eq." 33. This is presented graphically in Fig. 5
entering with b and K 3 4 , On can be read from the curve..
In Fig. 45 the theoretical curves No versus b and 00 versus b are
presented for comparison with experimental values for No and Oo fromStepanoff (11) for water jet pumps. Wih KI = 0. 1 and K3 4 0. 0, 3, assu-ning
J aa high Reynolds number situation, the theory agrees well with water jetpump data. Later (unpubllshed).data from the same autbor1b•v fur er veri-
fied this agreement. Thus, the No and 00 relations may be applied to waterjet pump design.
Examination of the family ,of theoretical N - 0 curves, Fig. :3, shows
that at b * 0.1 and 0.2, the lines are nearly linear. But at high b valuea par-ticularly 0. 5 and 0, 6, the N - 0 lines are definitely concave up..ý Thus, useof a linear approximation would tend to be dangerously optirtistic at high b
values. Here the full theoretical N - 0 relatioh (Eq. 23) should be used
for precise work.
YJ.DC TR 55-1 43
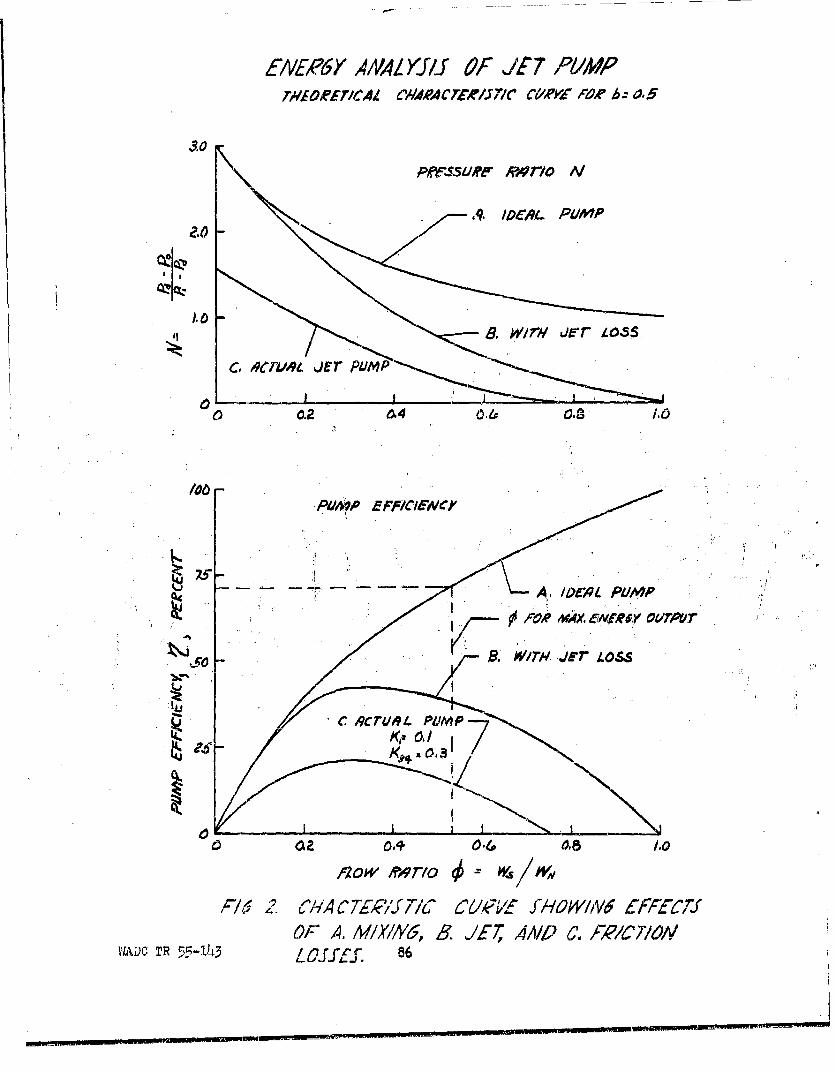
E/MVE6 A//A YJ/Jf Of IS7 RUMPTr#,CORPET/CAZ C/1AeACMWr5T/c CYj / 0.5
3.0
p~rssuq w a rrlosN
c.'9 IDCRL.i Pt/fPum
1.A.
C. #cc? 09rt#1 PUMP
00.2 04 0.1 418
OF A MIN,5,. . JT, A. /D../ PL//v)P
VID FORe 55A-143~ Q6TP.
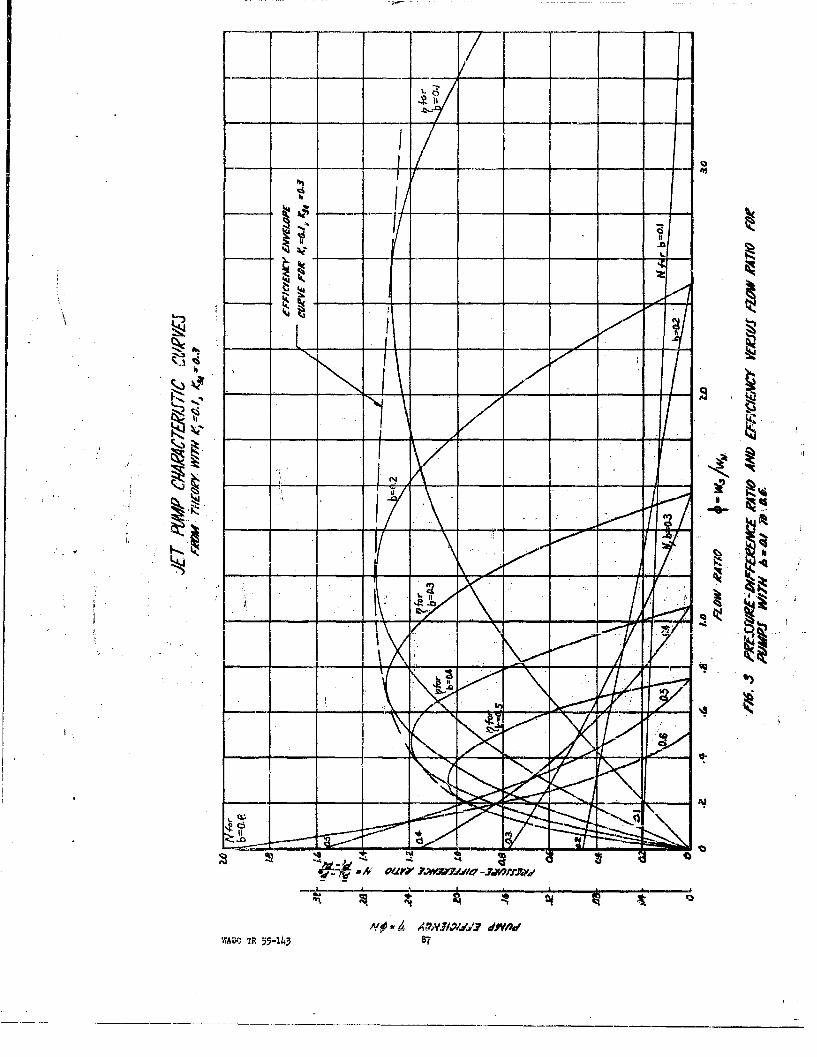
I~~1 ____ __
244AlI
A-
_ __G TR 5-.
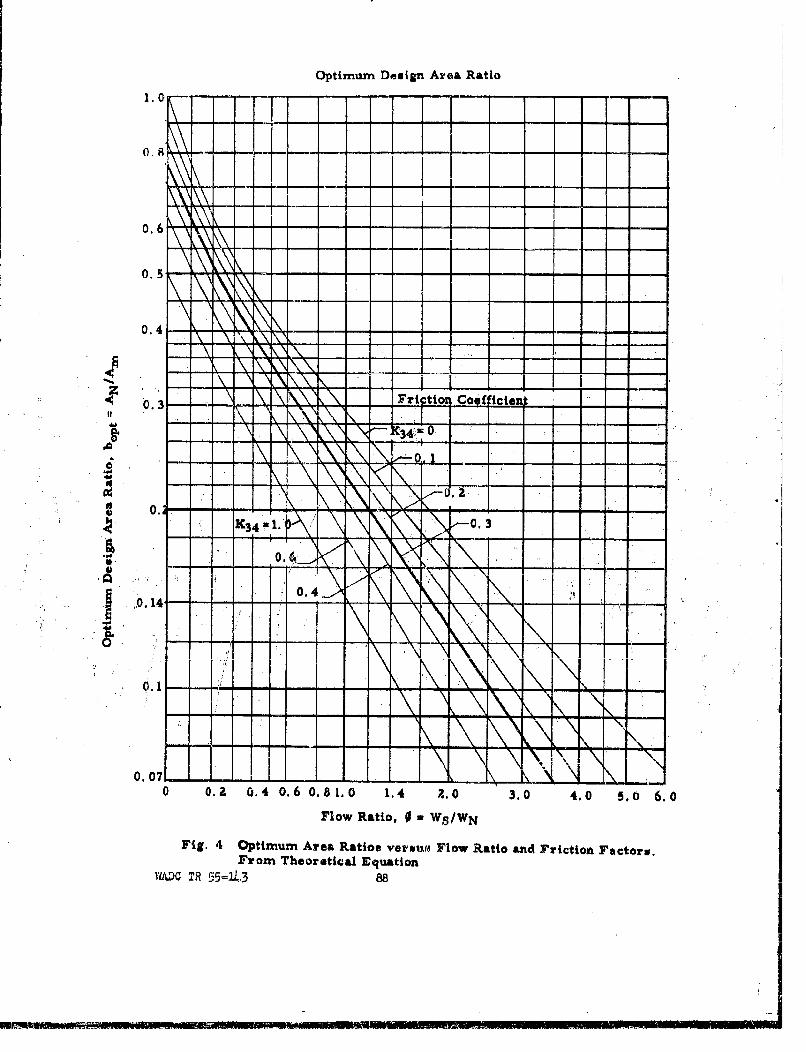
Optimum Design Area Ratio
:X: i - --0 . \\...
0.6 , ' -
x•0. 5
0.4
o ~\ 1 , I\ NA ' N
\\V\
0 - 1- -.I-
0.4 • " "-0 , 3 .
Flow Rtio, i , :W/W
Fig ... .4...tii'n \ , A \ea Rio ,esf lo ai ndFitonF co.
S0.: : :0 . \
From Theoeticl.Eqatio
Y.AC 1 R 55=J.L30. 88
N N~\
"i\ \7\441
0 0. 2- 0. 4 0. 6 0. a1. 0 1.4 Z..0 3.0 4.0 5.0 6.0
Flow Ratio, 0 , WS/WN
Fig. 4 Optimum Area Ratios veraue Flow R.atio and Friction Factors.
.From Theoretical Equation
;;•--•11 _•_;._::.. ... W'''.' C .... T.ER- -5... .... --55=. ...10. 88 _ . . .. • _=L ......... ... . ... .. . . .[ .. .' ..
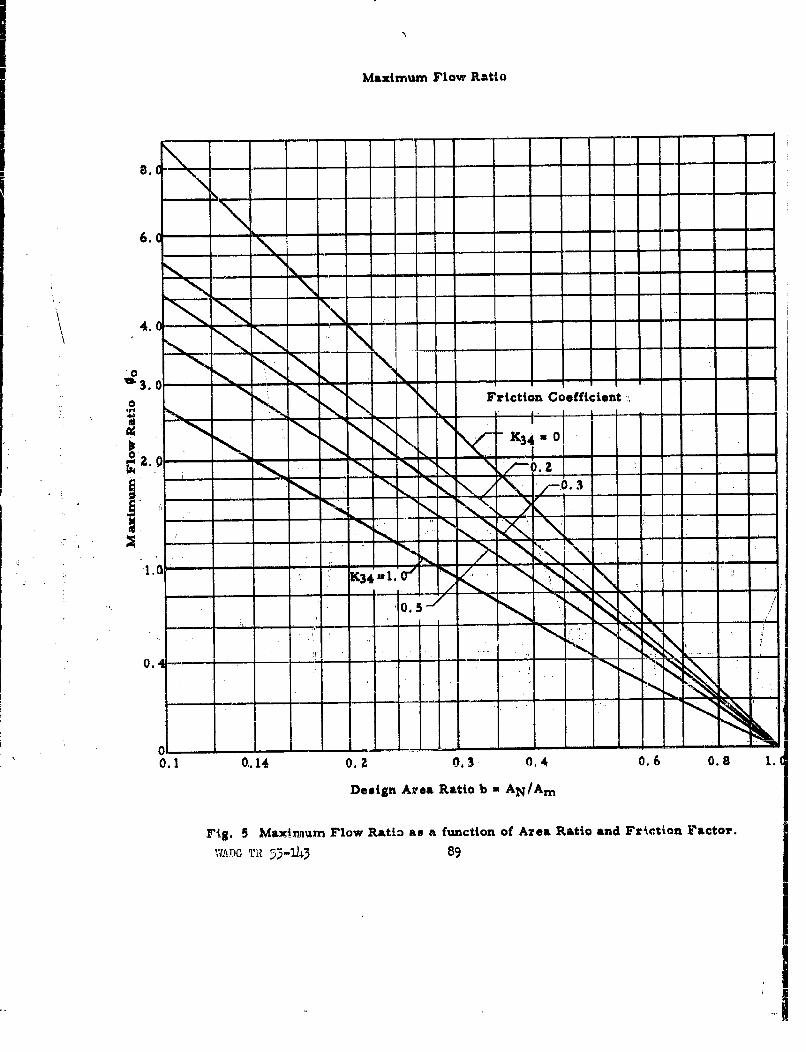
Maximum Flow Ratio
3~~~~~~a -- I
4.0-
'03.O -0--
.0 Friction Coefficient
0. .
0.1 0-.14 0.2 0,3 0.4 0.6 0.8 1
Design Area Ratio b uAN/Am
Fig. 5 Maximium Flow R~atio as a function of Area Ratio and Friction Factor.
WiADO Tit 53-143 59
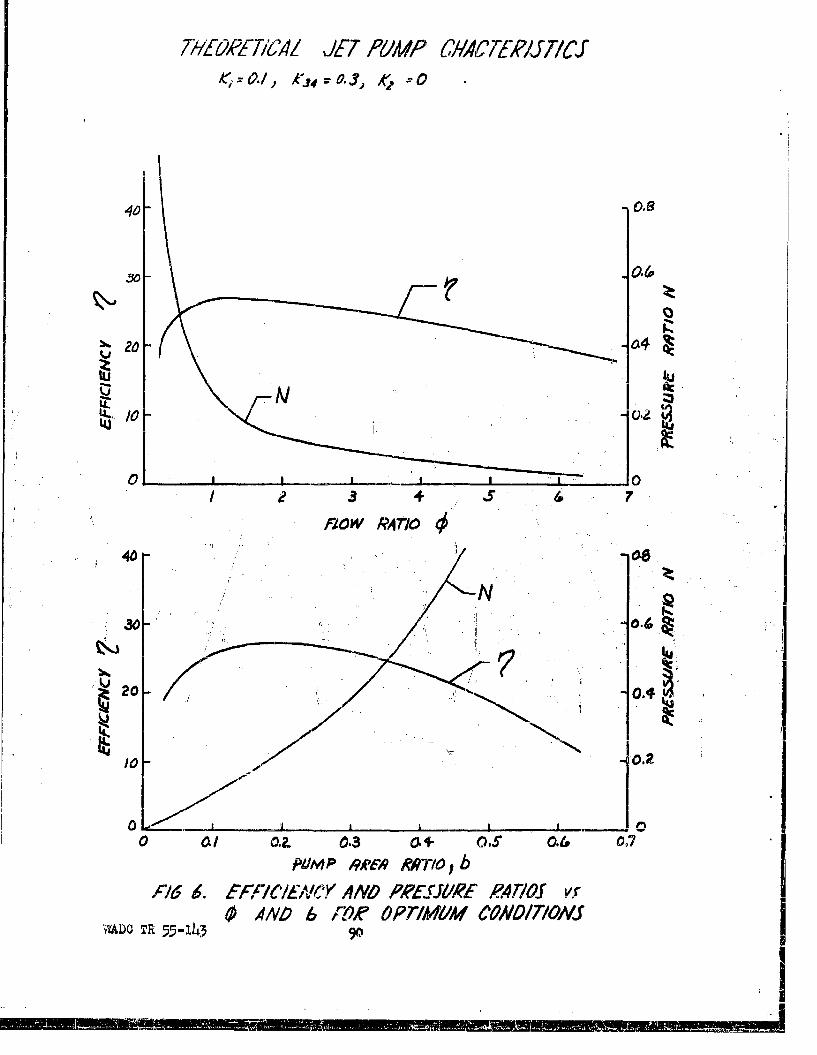
71-Vi[09ff2lhC4/ JET 1P6'M/ (214C17T2/J/CJ
/00
4004
tip
tIJR
0 a/6 OII. .t ,
Ren(A1 6 FXCK'N RSR M U
4N A 2rAMCODO-
iAAD IR5-~39
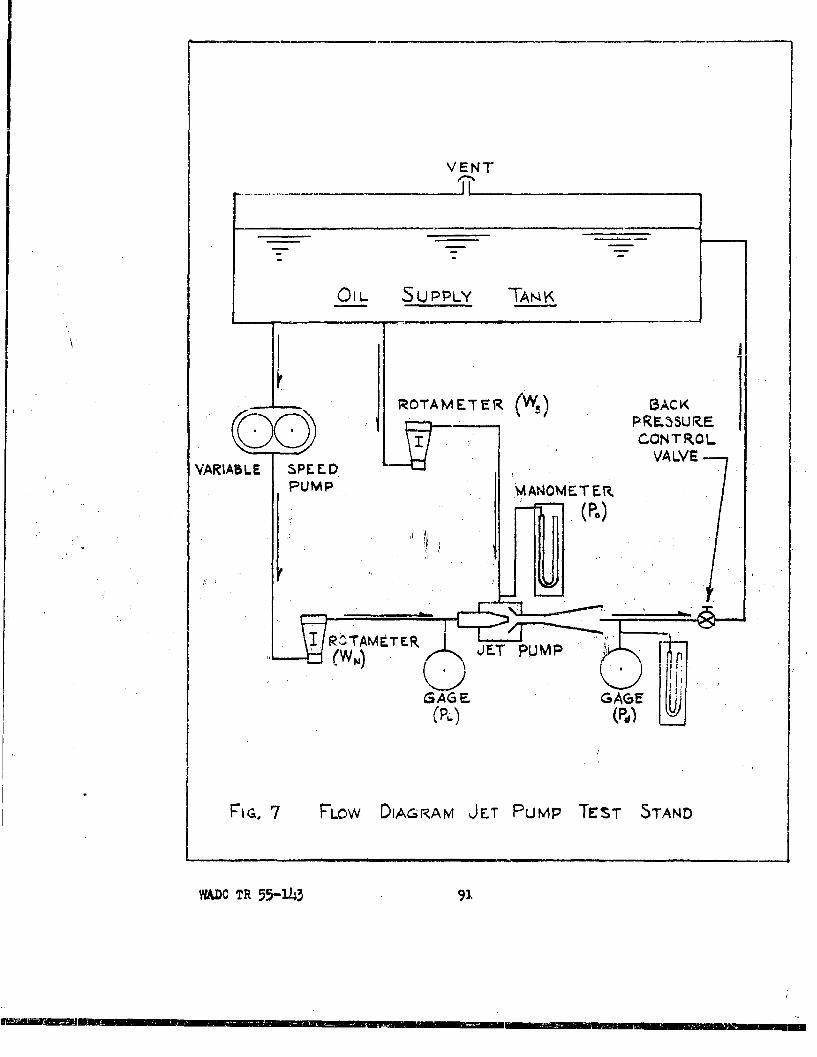
VENT
OIL SUPPLY TANK
ROTAMETER (WB) cACK' ~P RF..5 5U R.E
CONTROL
VALVEVARIABLE SPEED
PUMP MANOMETER,
(PO)
(Pb) (Pd) I___
FIG, '7 F'LOW DIAGrKAM JET PUMP TEST STAND
_-I
WADo TR 55-1413 91
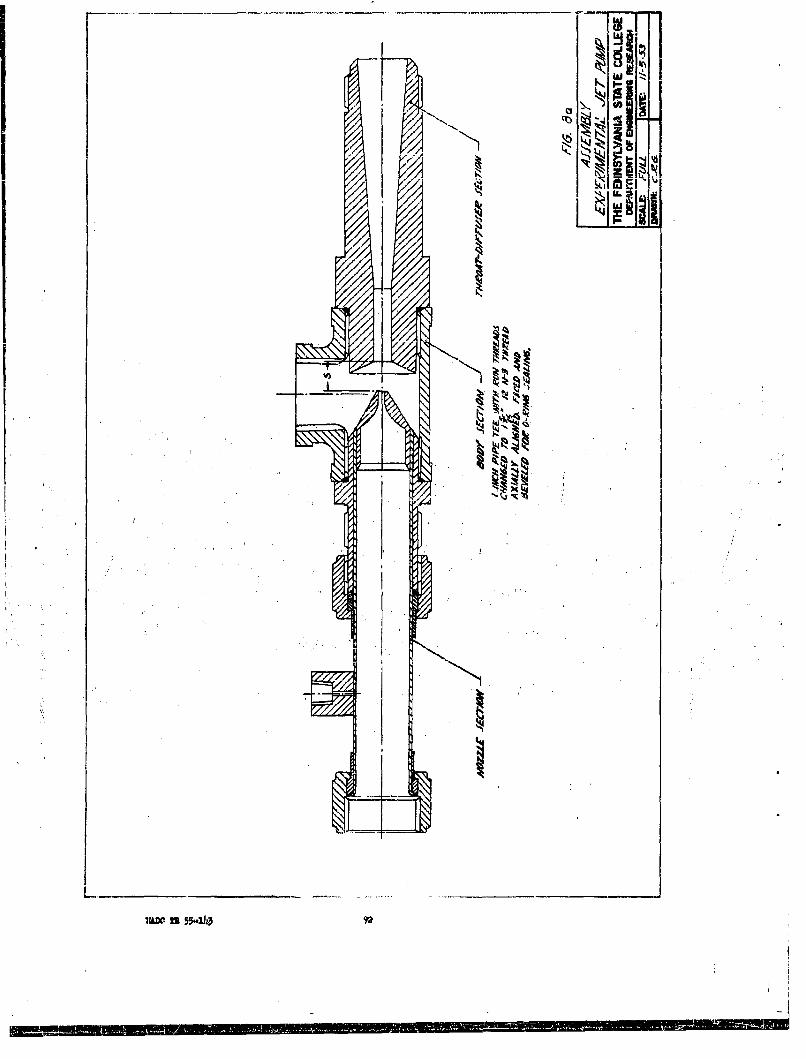
If.
UAWD !1 55--243 92
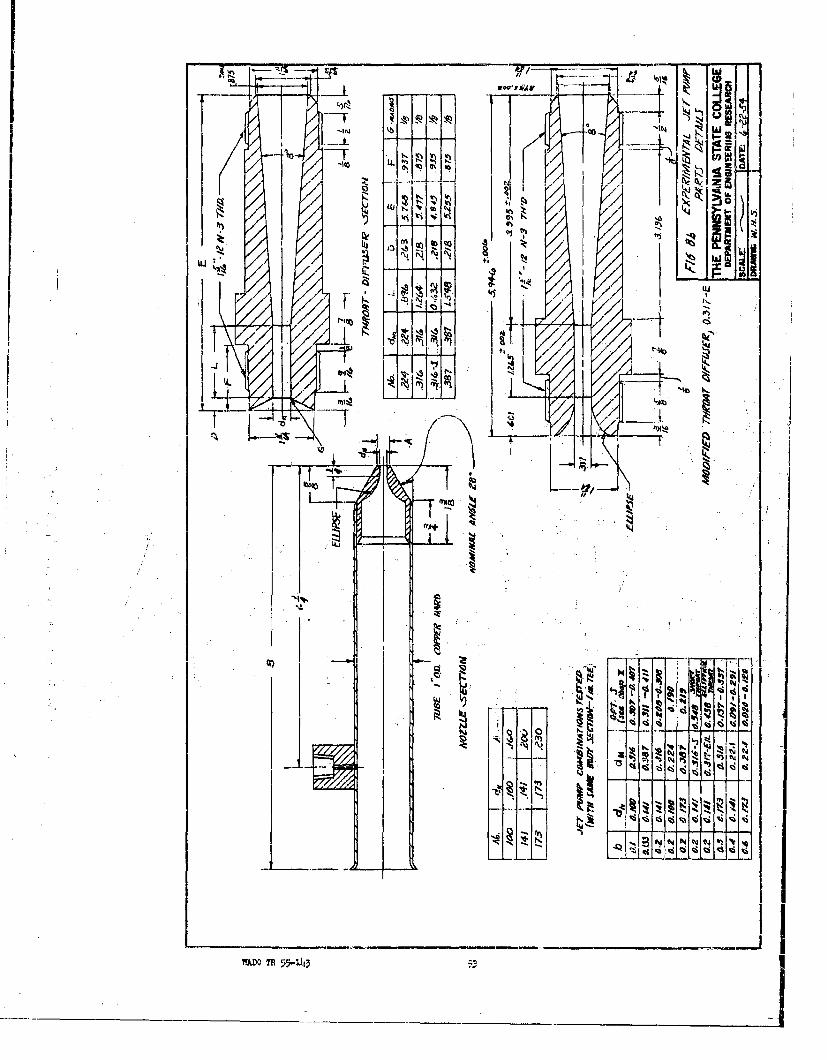
AF w
k0 z
V; ~ lei
/ iii-i K
I ~ I' H-
lie I.,
'44
z -ap 1%4 *-110i Iv
WO TR 55-i14
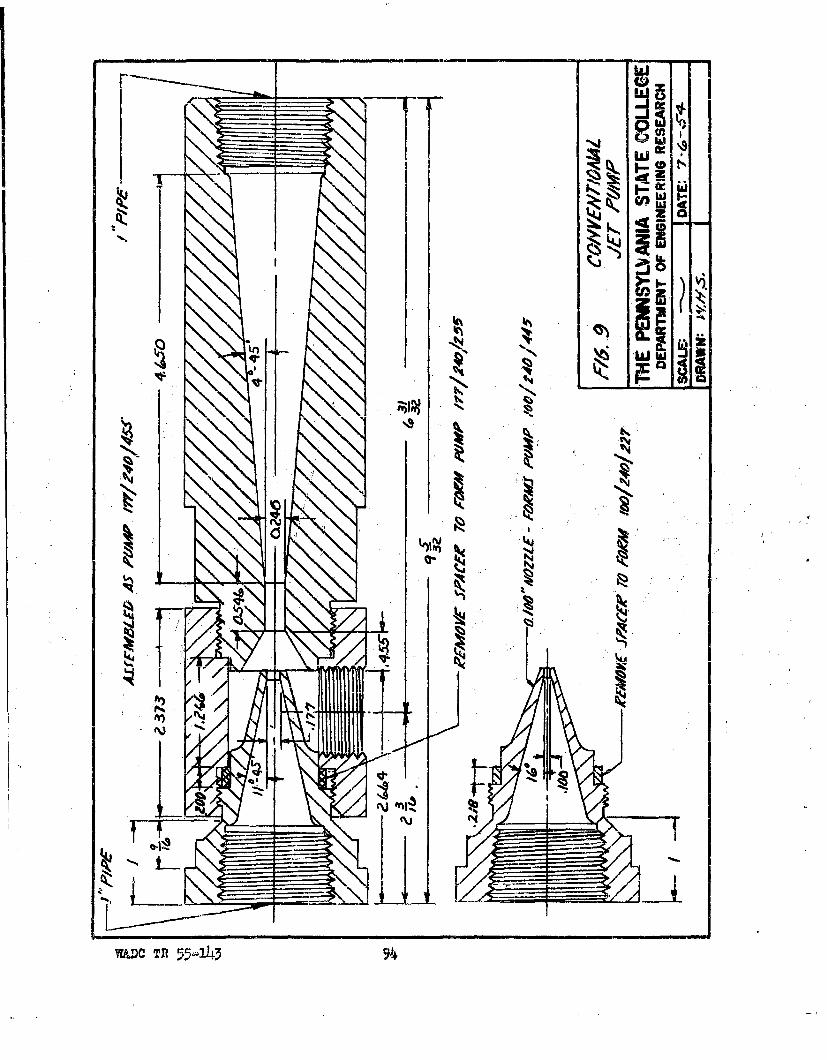
1 4jj(n
Nw
N0.
NN
00,
WD Tn5-139
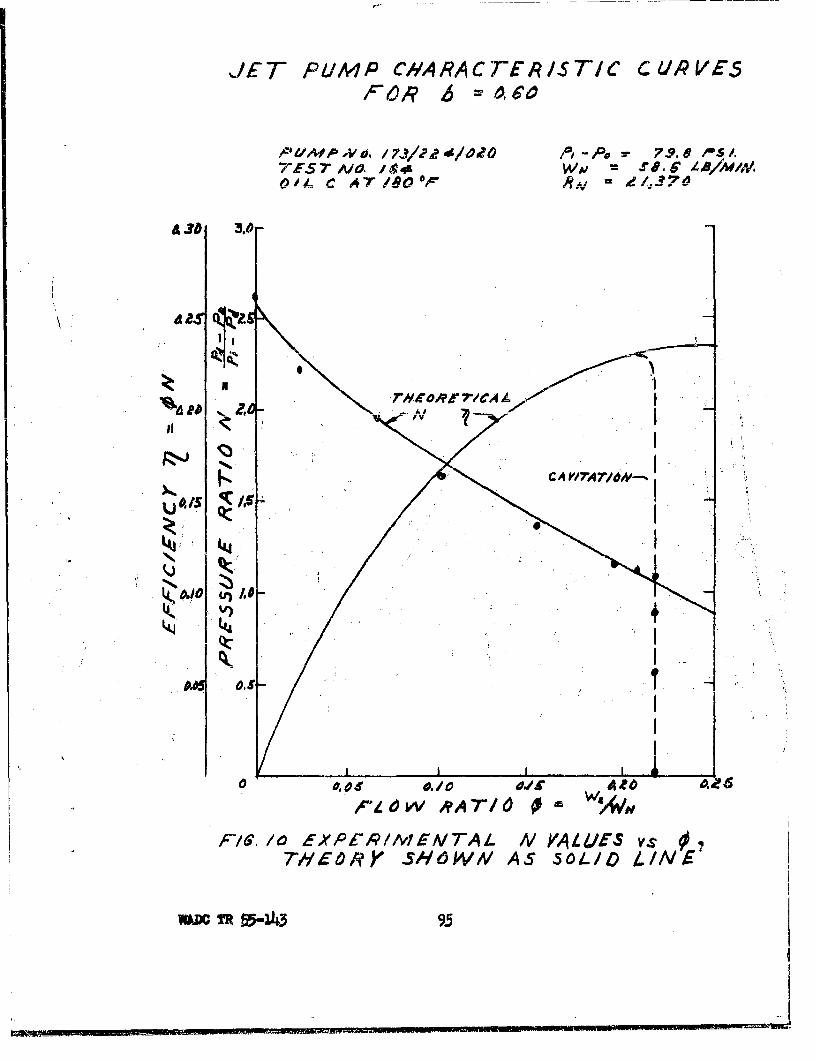
JET PUIMP CM4RACrTEA/ST/C CUR~VES
No.7 A/. X WV' CT6 4B/M/41WOIL C AT /8009 e - i.7 o
'44r# PM(ORI?77CA hI
IIc
C'/ A I~loN-
fk~O U/.D
.QC
PLOW RA TI 0 0 ra 4
FIG. /40 FXPERI/MIEATAL A/ VA LUES vsTH1EORY~ SHdWN AS .50L10I t/NR
um CTR m-143 9.5
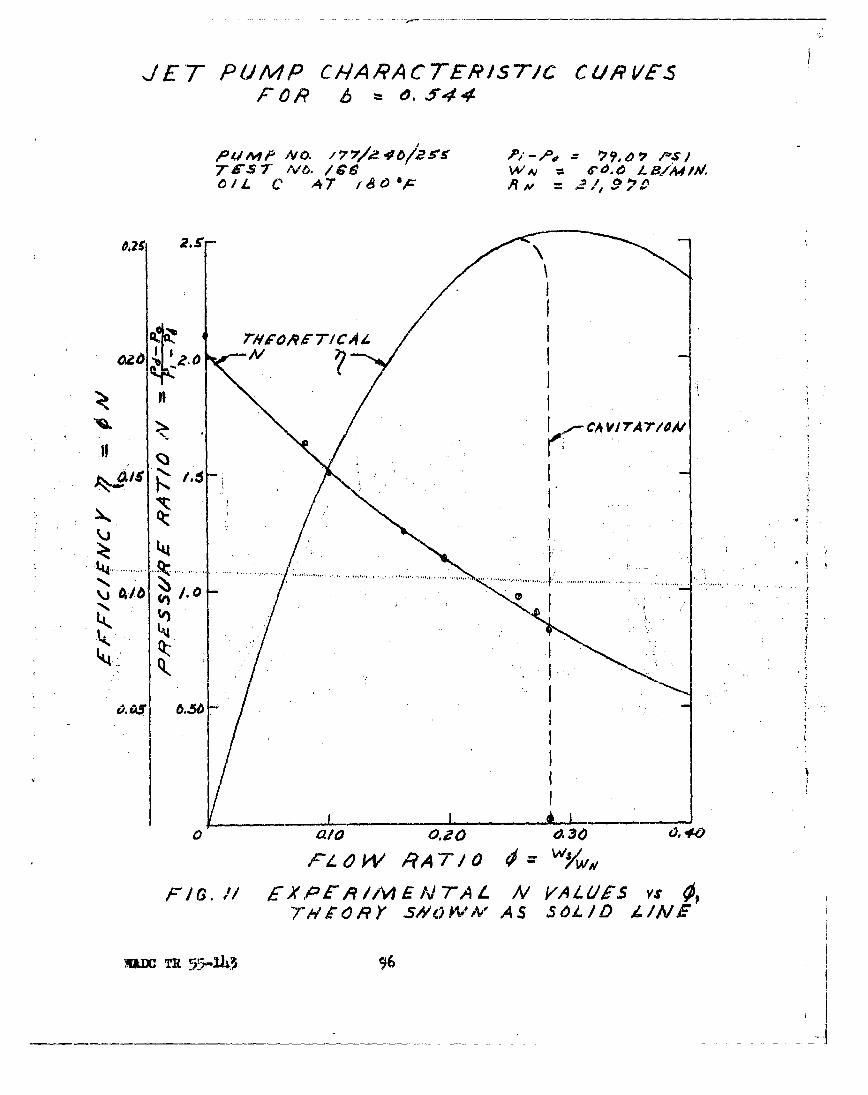
JIET PUMP CIM/AACTERIST/C CURPVESFOR ~6 .44
NUM Ad. / IZ- I- -S
OIL A 47 /dv`7 A
~ ~2.0 A'
b I CA V1 7A7/OA'
OA 1.5 I
0 .. 1z
W0A7.
FI. k)P5}MNA AI0C sOI7A~r R I50Vo S S64D AI
um TRI54ý9
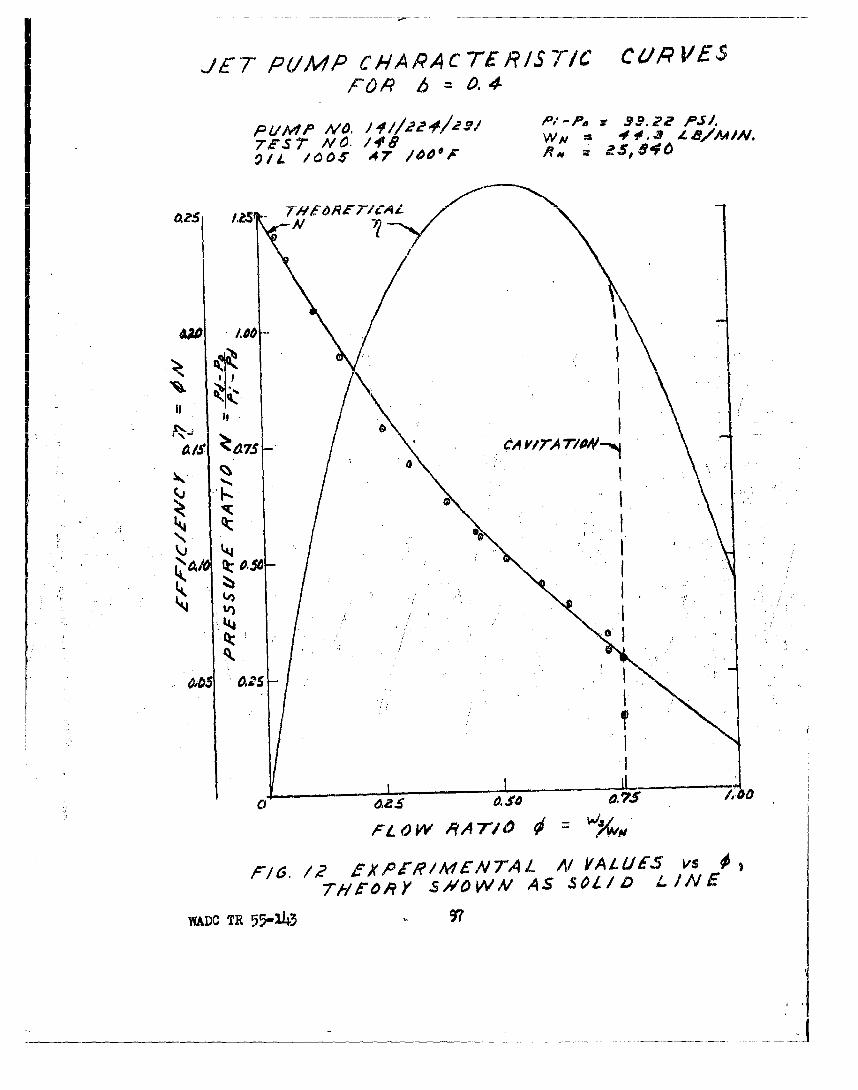
JE-T PU/MP CPARAACTERI/S f/C CU/QVES
RUP4' MO. PPar PS4~
TsFST' A10. 1/4'8 WAI. =4M
a/14 /00,T -47 /40VA P =I w S5
a~ ,~ -T~o~/CN
too1
CA Wr
S1 NA SLDI INF
I
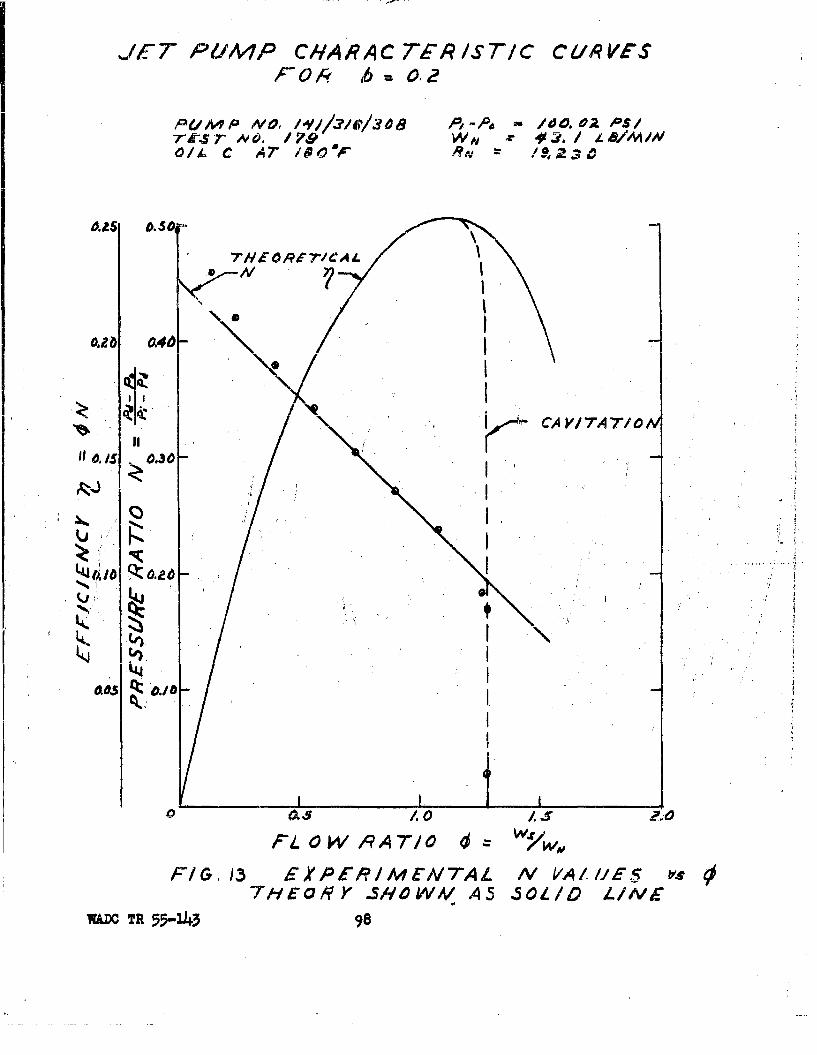
J//ET ROMP CHARAC TER/ST/C CU1RVtS
74F-r NO. 17,9 WN I2 ~aMN01A.. C A7" i040FP
CAa Yls 7A7
1h16.15 0.30
t'4'
LAI.
a25 0A4 I
FL CA W/7 RA7/0 w
405OR ISCW, A55L10I1
WADC TR 5/143 u
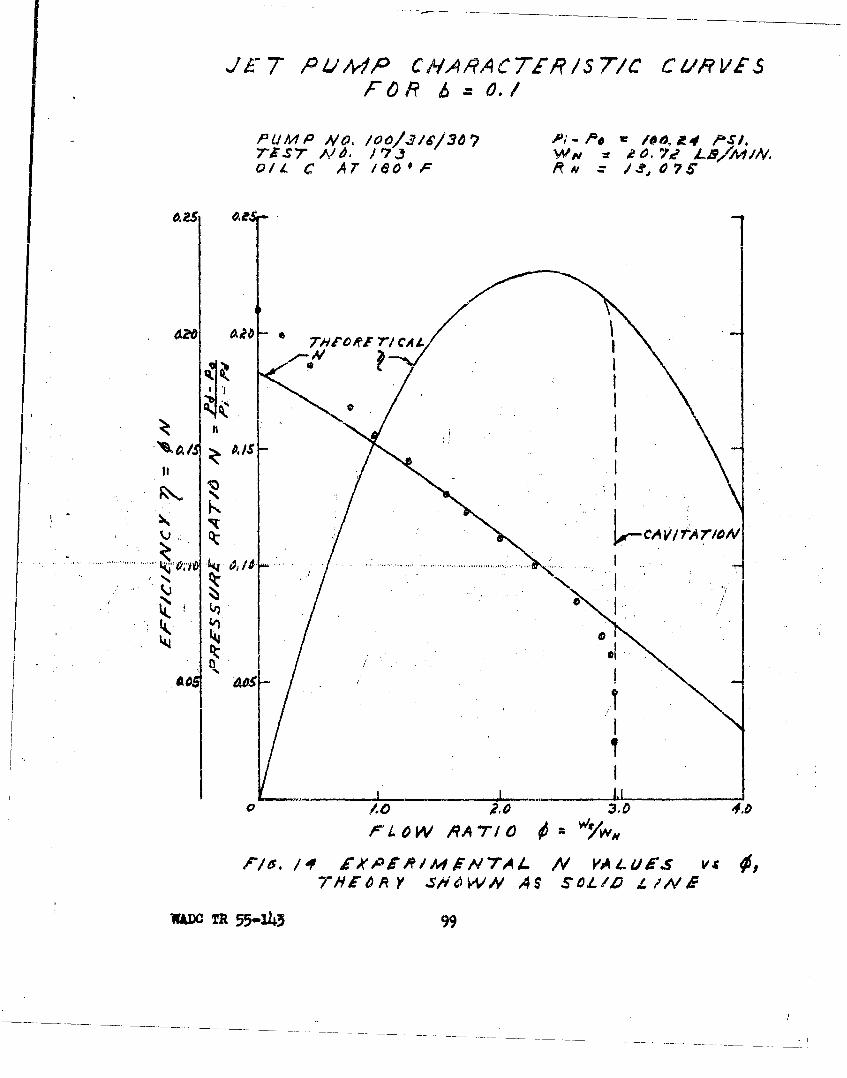
JET PR411P CM4ARACT"£R9$7/C CU11RVESFOR A
PUMP Vo, 1OO/3/C/3O7 /0 .0. .0 /d4 '-"s/7TXS7' A'. /73 Wi ;rR6.Z Lhl"I/Ioil C AT /eO' F . /, 07 "
* ?wRI-O Al CA 41
IIS,: CA V1 t 7"raON
'II
II
.... .. .. ....
'44s
0203.0) 4.0rLOW /•, RATIO 0 v''
,Fla. /f CA'arR1ARH7A4. IV VA4 vsTHEO A Y -li OWN AS S'OZ /.0 L/INS
WADC TR 55..143 99
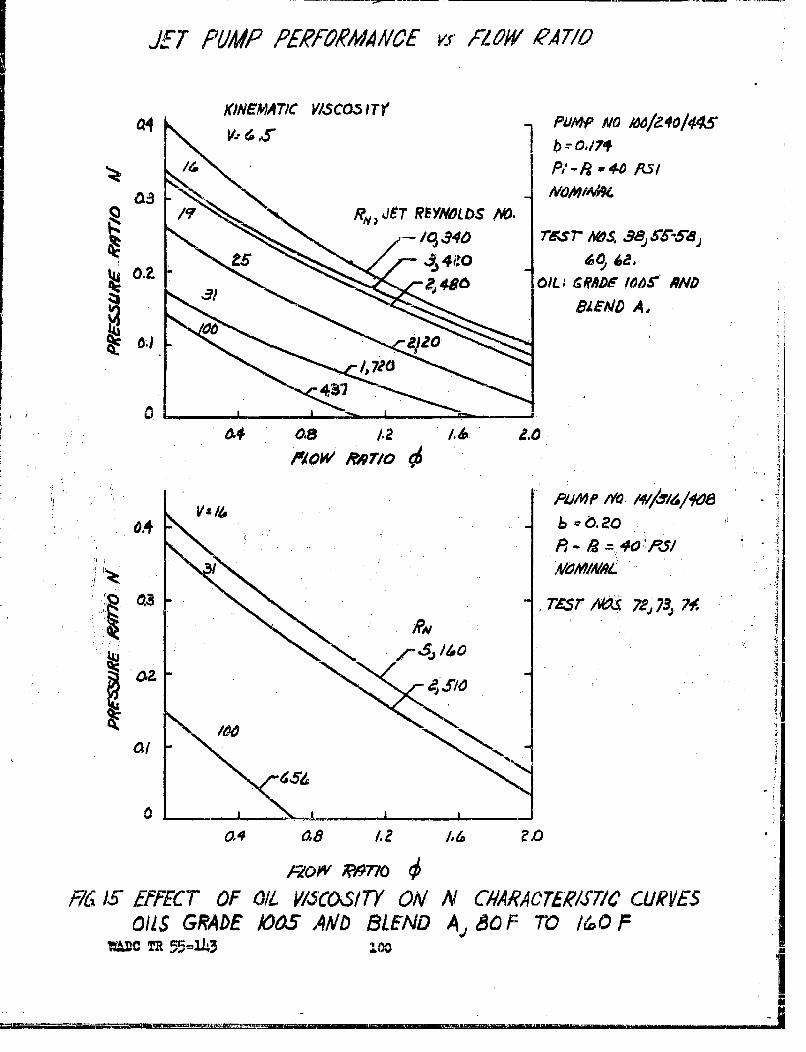
JET PUMP PE2EORMVA//CE y~r AZOW 47/0
KONSM A77C V1.5C0~5 I TYPU OIIM4L
v.- ev s b r 0,74
14;,40 Mr r AV4, 38j S- 5 8dj
4 l j 6 0L 6RADF 14r A9ND
BICND A,
a437
b -6.2
q. 08 1.: /4
e~slo
044 0b 112 /16 Zo
1-20W AW770
,F72 IS AffFEC T OF 0/1i b'/COS/7Y ON/VN C#AR~ACTrjP/J7/C CURAVES
0/IS GRADE /005 AND BLEND Aj &) F TO /6.O FUDC .R. 5-1-1 1I
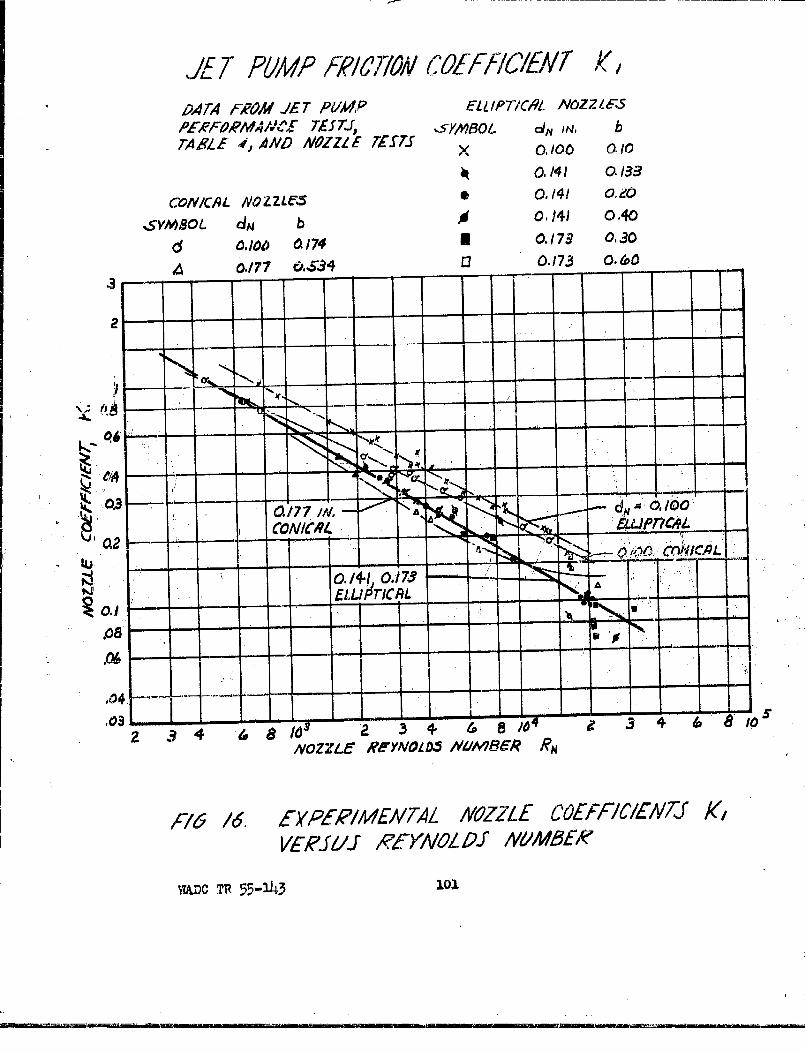
JU 7 P6/A-/ f2/CR/W)0 C OMff/6YT k4•
t2ATW F AM JET P11,M P ELLIPTIC&9 /V027Z16-,
PFA-EO2A7-4AA'CE, 7VS71, 1-5-ym'OL- dn IN, bT-ABRLE 4, AND NOZZE 7117TS x010 0
ik0.141 0.133
GO/V/C194 /OZZLC5 0,/4/ aleO
.SYMBOL dlN b At01141 0.40
d Odoo 0.174 9 0.173 0.30
4 0./77 0.4-34 03 0.173 0. 60
I~i~111 17 IM 01 /00c~a
-04
.0 4 ~8I l-' 34 i 4 t. a
NIOZZLE /?eYNOLD3 NVA4B8eR RN
Ff6 /6. yol-R2/M4ENTAL AIOZZLE Cc2EFF/C/EA'TJ KVEJE'JI/J PIEYAN01Af NOW&A'i~
WVC Tfl 55-JJ43 101
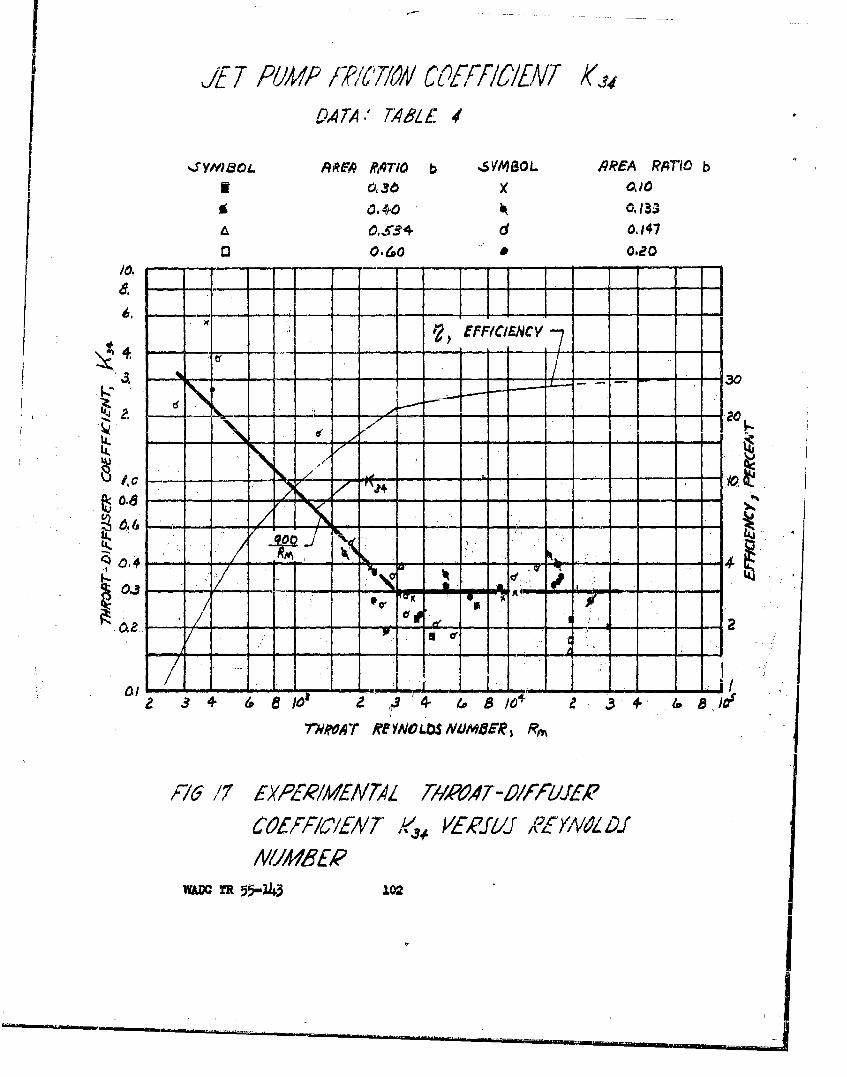
J4T 76P'UP ff~%ý4/ C([/IY/6/EV Ai,?DA4TA .' 748A 4 9 . ,
ARM A,4Tf0 -.SYMB1OL PQREA RorTIC b
013 x 40~i0-410 lk0.133
C.34d 0,)47I3 0 O.C0 0. 20
/0.4l- - -
/0 Z -4+
7WA Rf- IDSU8~ I.-
,V ZA
'3 V4 0
Y= Tit 102
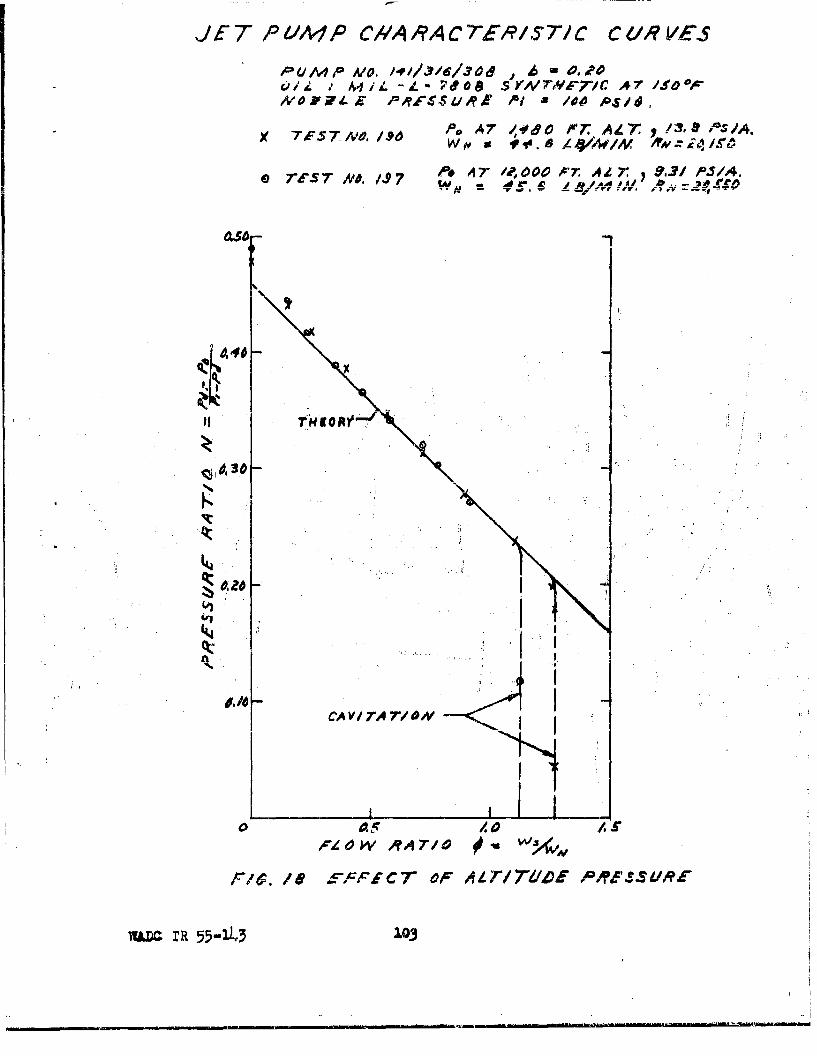
itFT R VAI P C//A RA'C 7ER15 7/C C UR VEAS
Pu/mp A/o. ~eI-013/6/30d6 O.O0 /1 ,4j iL -,4 - Pif0 S YN '7F7/ C A 7IS -0,4r
"//oFWE P'pi$~~ a1 , /, OP$/jSo
7X-' 7ESNO./196 Po AT 7.6 /,- 0Kr A L7' y /!3.0 & IA.
Q 'esT *7' N44, 19 #7 / JOO~ADIA 3./ P7.
44f
I Ni
"CA VIAT1O
Wk IR 551310
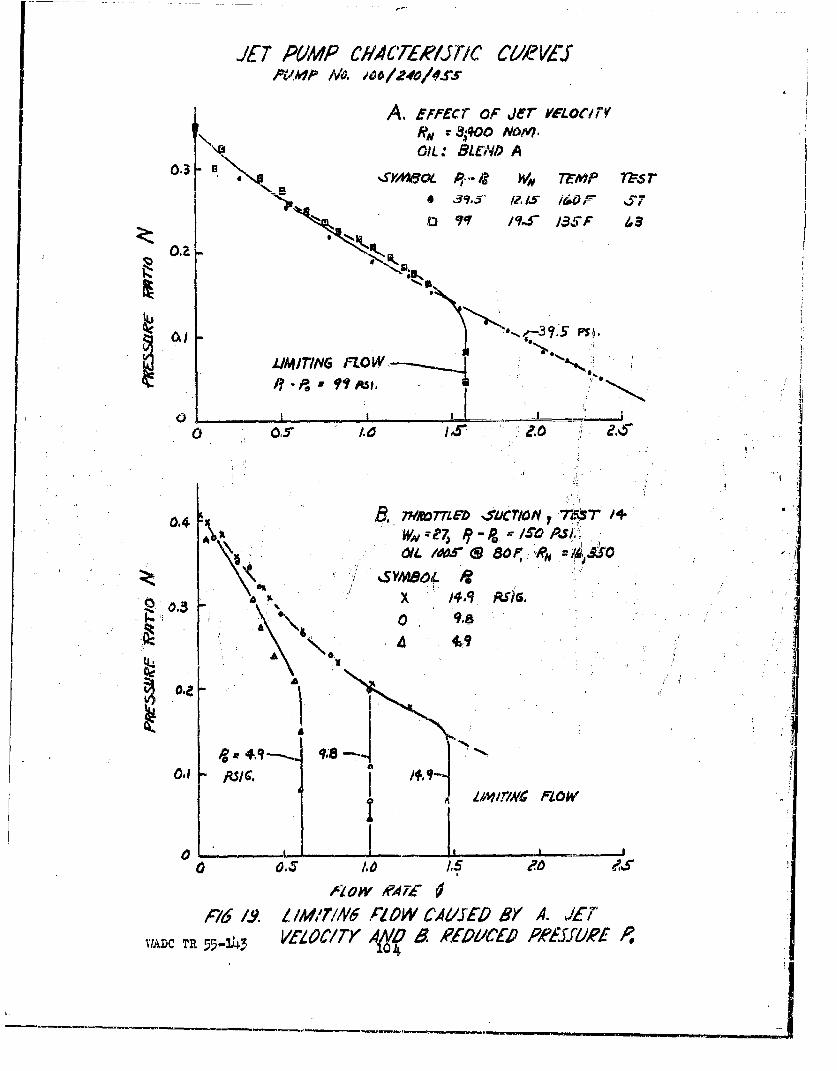
JE.T PROMP CbA4CT&E'iT/C CUReVY
A. cfpccr OF jer mnEoory
0111: BLEND A~ ,~ ? w.$ Trmp 7msr
a- 19-r! '7 /36-F /,3
o.ak '3,
0 0.5,10I Z.0
0.4 B.7W717-LFD IsdClroNV 4T1
0/4MAC(s80F, A "
z SYMB04 qx /4-9 RS I ra
0 9.8
a 4.9 91
I 11V~rITNS FLOW
0 .
P16 ~ / I/ M/T//6 P/OW $A1140~ 9)Y A. d/L
VIADC TR 55-4 V[ZOC/T" MAAO 8 AY'FDI/CED PAVEfLI26 P.
104I
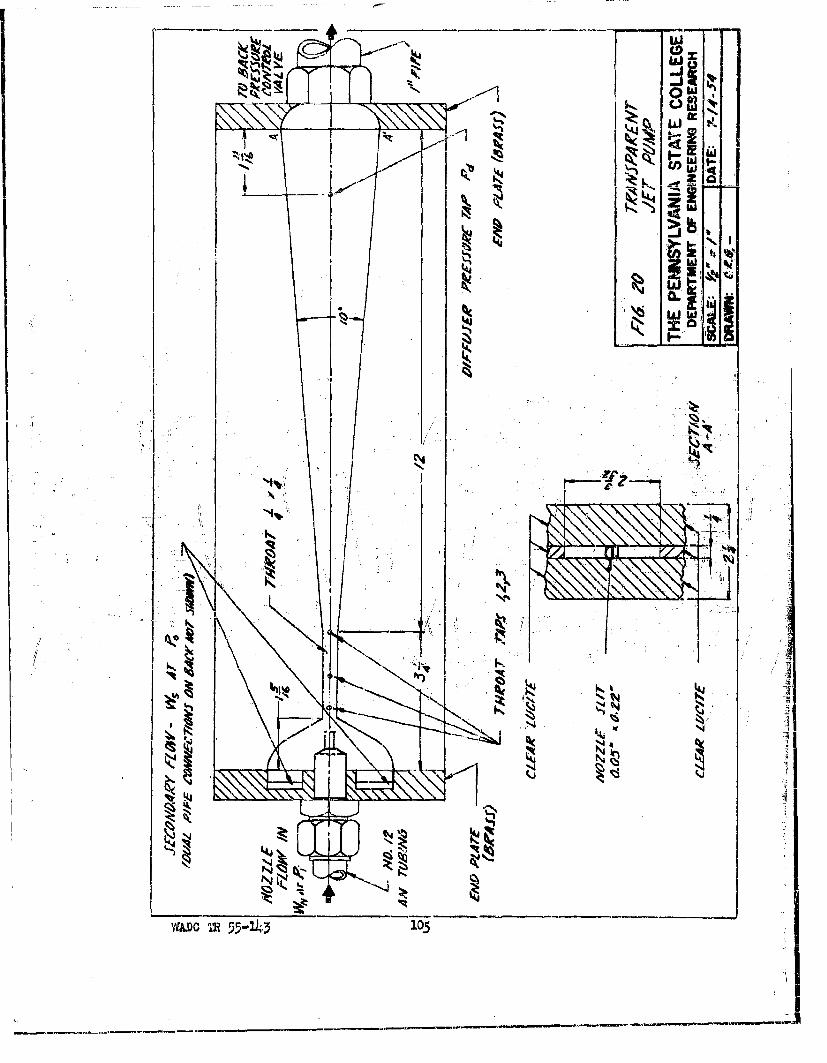
w
IAz
N ýZN
IUD TI 5514
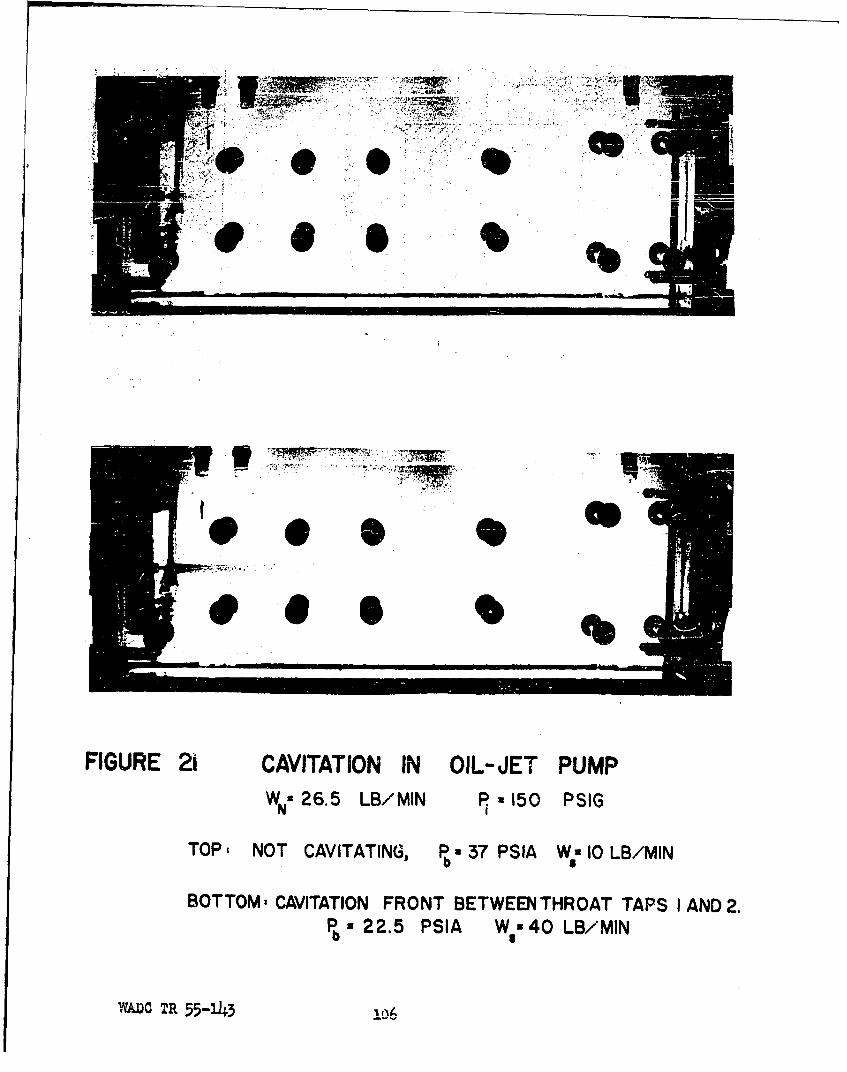
-fb
FIGURE 2'1 CAVITATION IN OIL- JET PUMPWNU 26.5 LB/MIN P a 15O PSIG
TOP: NOT CAVITATING., Pb a37 PSIA W a 10LB/MIN
BOTTOM, CAVITATION FRONT BETWEEN THROAT TAPS I AND 2.Pba22.5 PSIA Wls 40LB/MIN
WA.DC TR 55-143
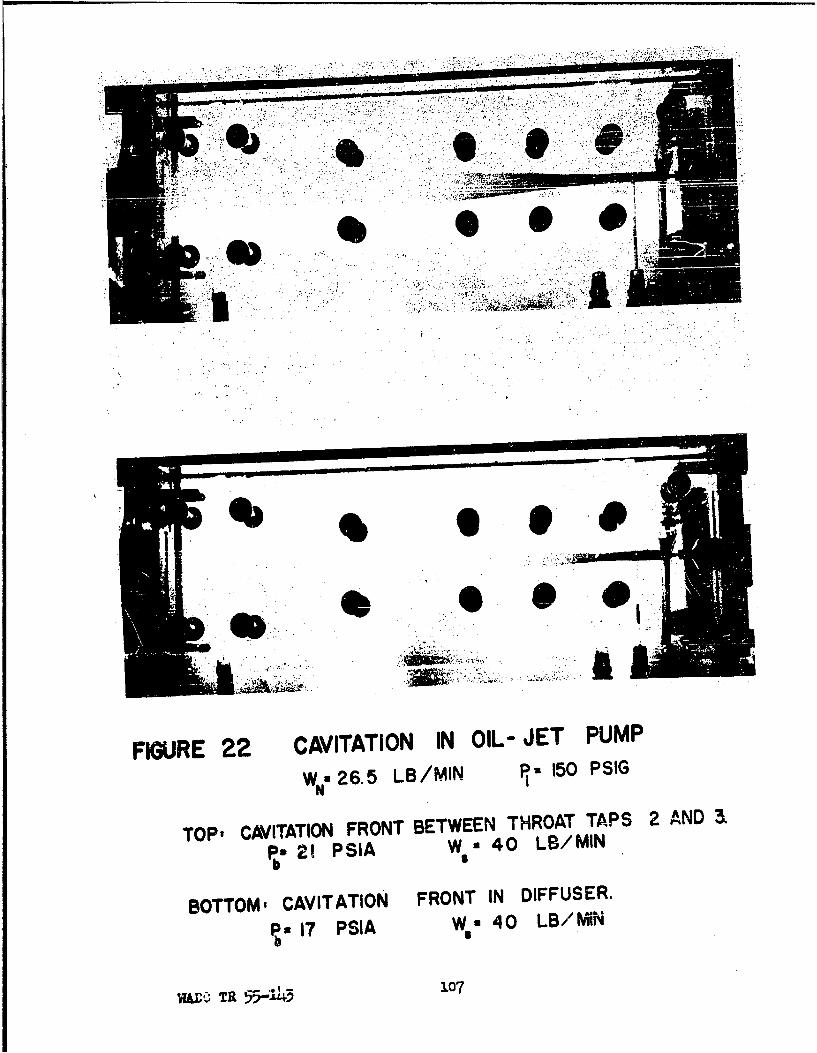
FIQJRE 2.2 CAVITATION IN OIL- JET PUMP
WU26.5 LB /MIN 10PI
TOP' CAVITATION FRONT BETWEEN THROAT TAPS 2 AND 3
Ps 21 PSIA W a 40 LB/MINb 5
BOTTOM, CAVITATION FRONT IN DIFFUSER.
Pbs 17 PSIA Wu40 LB/,MiN
WUX!. TR 55;-;u.O 107
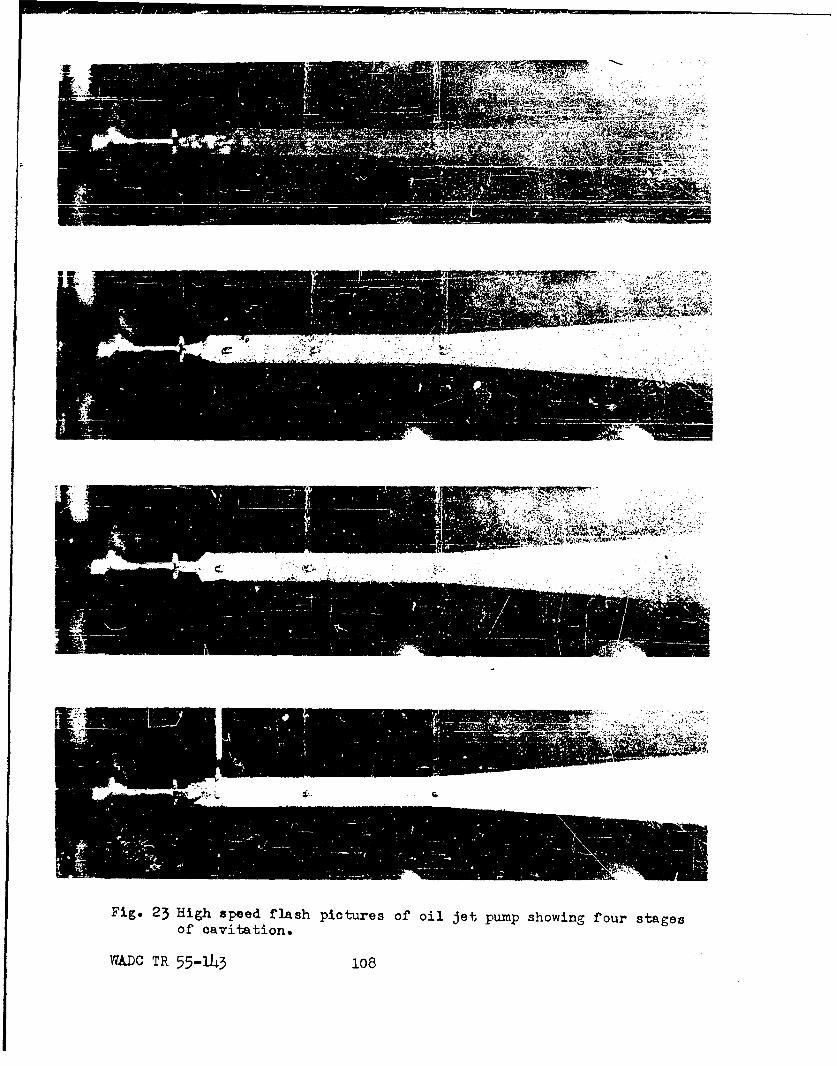
Fig. 23 High speed flash pictures 0i' oil jet, pump showing four stages
of cavitation.
WADC TR 55-143 108
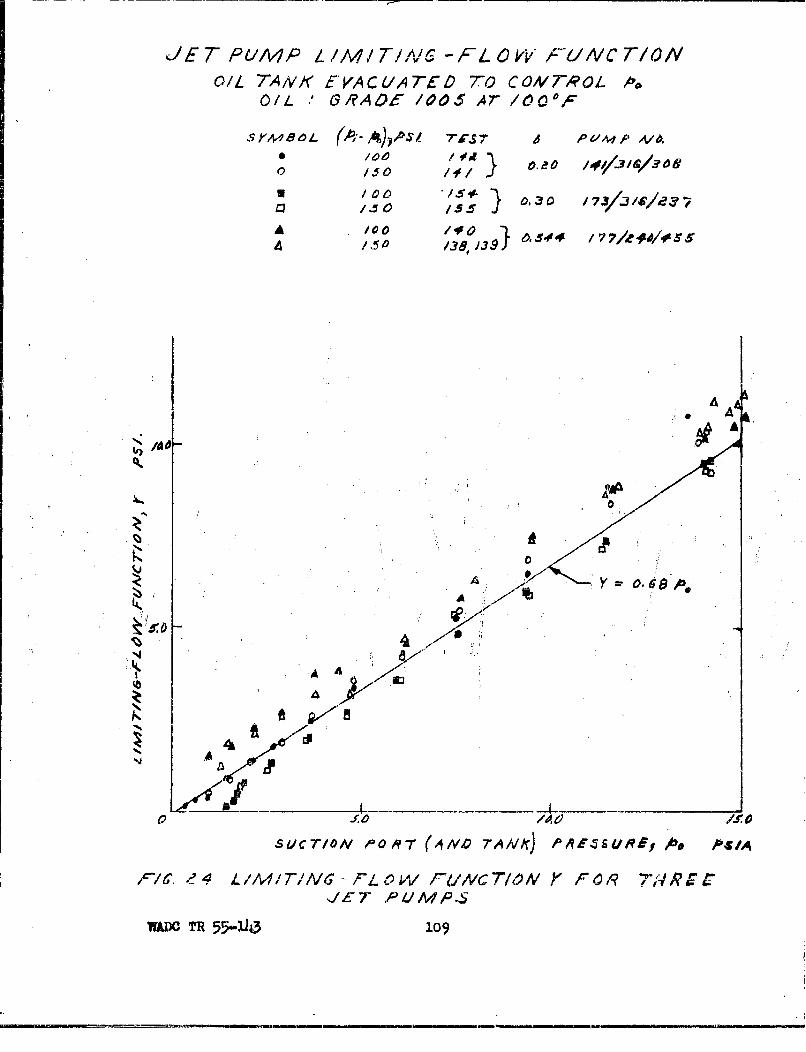
JET PMP //T/ All- - FLW F ,VUNCTION1
O/L TANVK E~'VACUATtV TO0 COMROL- Ia.OIL .' (9R'ADI /005 Ar 1600,F
*/ O
//I,
4 /~~00 /OJ
A ~ ~~~ 4A '&7kI.0
A
AA
/AA
4~A APAI
A
0 0 /J O
SUCTION P~ORT (.4Ivo TA/VA) P~h-ZSURE1 b. Df *A
WADC TIR 55-1)W l09
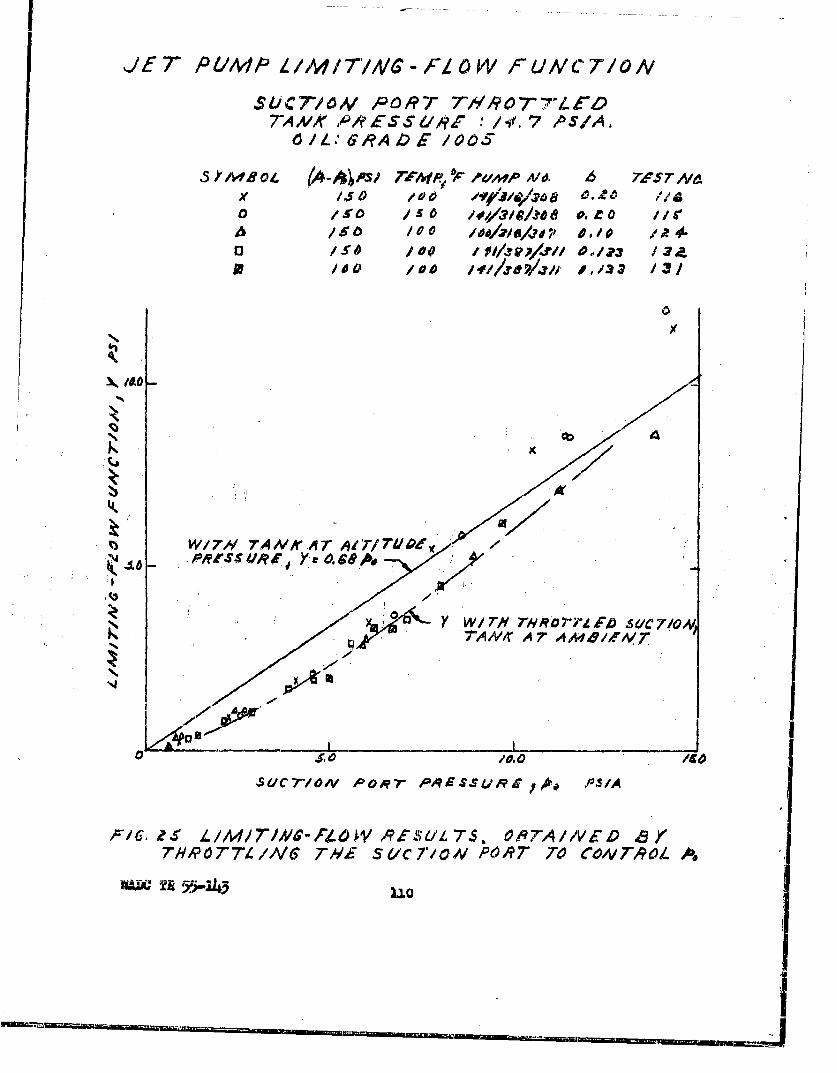
-IfT PUMP Z/A4/T/A/G -FocZIOW FrUNVCT7/0N
£tJCrlVO PORTP T11R0O7,4r07AA~IA P/?ESSUj' :/.f 7 ASIA.
I/L:G,9Ab /r 005
5 -Y IMN 01.(A-,*si 7,FT'MWP0 IF ooaP NOd. 6 eS7N,
)e 150 /&to av///O W- 1/-A
A /so /00 1 /6/ 0/1/dV ~D0,0 4o 10 /'i/4P/J/I 0 113 134
Nb 4
W/7/-/ 7ANKAllA 7 Ar/Tus96, /
'PN4 A A',1e~
440' A90M/,#V
sf/Cr/oN POO7-r PlREssugz# R-S/A
ZS. L/M/T/A/6-/NC4OWi PFSUL 7$S. Of7AqI/VED B YTH'/?OTTL/N6 779,E SU/CTION POe97 710 COWT,90rL A
MWi TE 5,5443 110
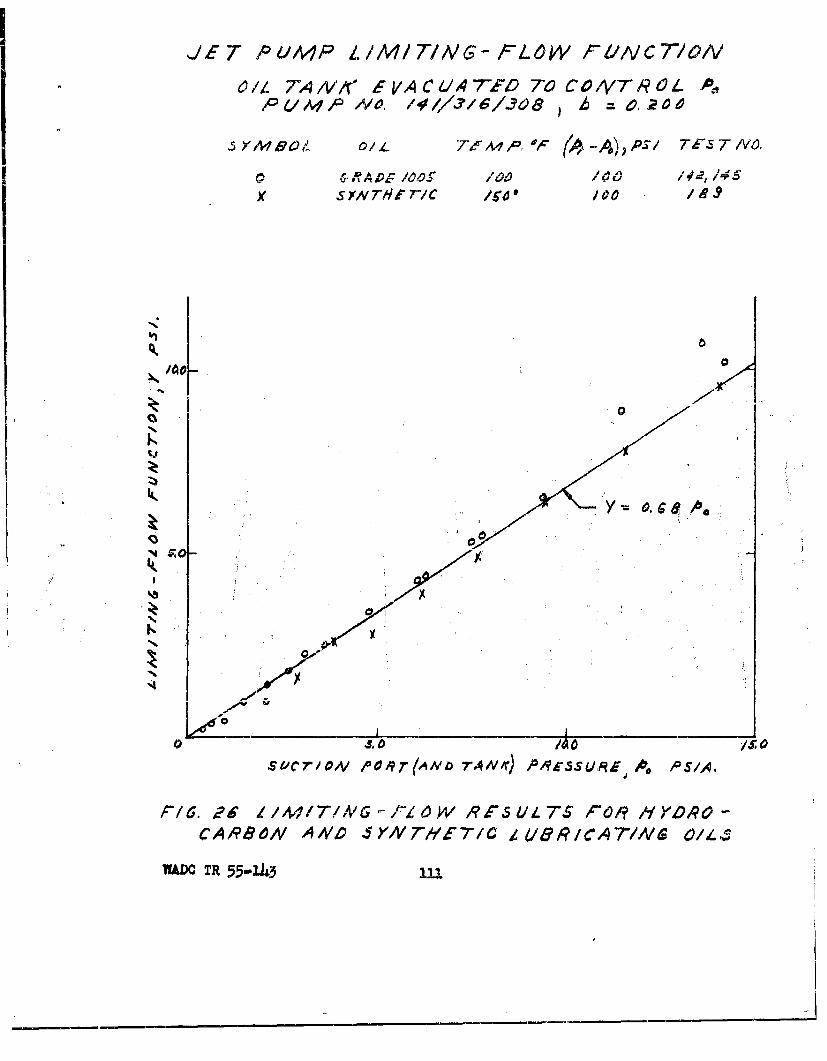
JET -RUMP LIAM/TIN'- FLOW F/INVC 770IV
C /Z TA4/ NlESVA C 41AT7Ft9 70 CO/VTA'V0L - A~P~'NAo. /6/3630 2e
S tsl O/Yz.7 rMR, OFPS ThES 7-VO,le jp A ri IA A i ^ J9 A 11 , 4
XSY/VT/9it 7C /511 /00
I=Afr)
suci0 0orAD7A l)PCSRF ~ SA
11IIGrowRS1T rqH5O
CA8NA'4yN'V71 18RCTN /-
WADC T 55-10
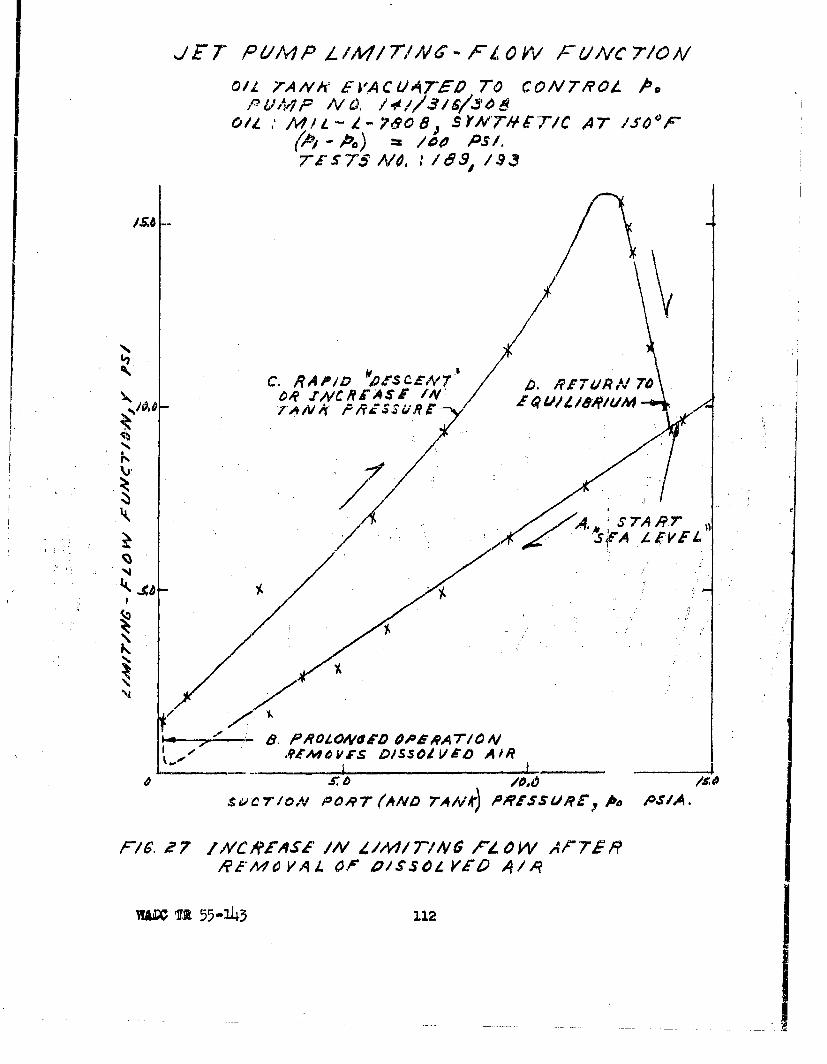
01Z 7AIVA- Cl'ACU#47-., 7T0 CON Tii A
(Al -A) = 400 Ps/.
TZI5S 7AId., ./9 /9
A~~ 7A R7'NT
frtM-o~S DISSOdVEOD A/iR
SO.CT/~oA PORTAMO 7AA P~sv~ AoASA
F/C. ?7 I&CR-ASF 11V Z/44T/ThV P-LOW ,04Tr7SRA'EM1oVA.L 0)v 1/S~SOLfr'F4O AIR/
WAX~ ME 55-143 112
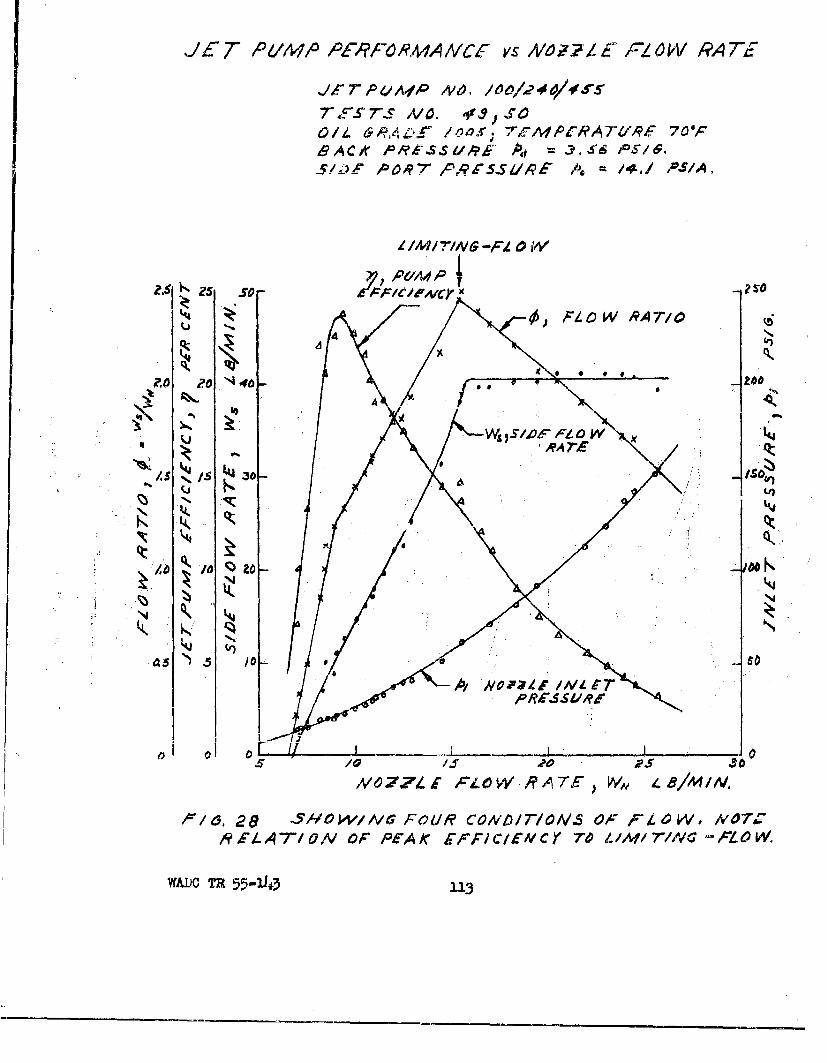
JT P 6119,o P&?-FO RM4A/4VIC vs A/oir?/E i- cZ0W RA TE
Jrr-7P4AIP 44,101,41rTE.FST'S NO. o.,ro/Z. Ck,4IA'ZIS /0,01; 7r/y/PCRATOW~ 70'F
S9AC~I AiS/A4 d 3-S6O3/
5"FPORi7 A;S1 A 4~ ,/,3~
41/MT/NO -FZ 0 WV
40 -O 256O
ps zcv iA /
Ilkk
4. 14KVP71 co'c0wRATFw I N
0, 28 SOWIC FOR CIND7-IOS 09 F 40 , l'O~C*
NFN7/,VO h K4F 1~'VYT .A17-AC- O
W'D% k R 551 1
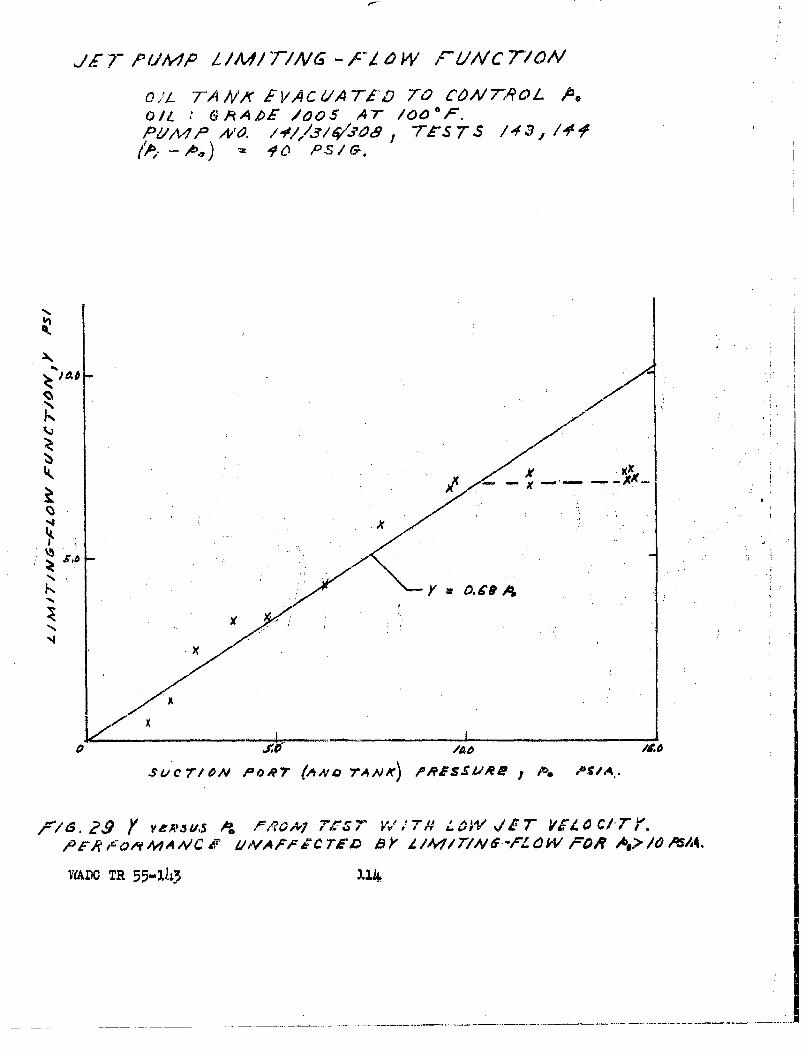
JET4, Z IAMP LMT//V6 -E16' 40W i,-IINC T42A
0; TA /Y,,' FIA C 41A TC6 7-0 CO6A/V7R 6L Ao0/1 ' AAOE loo5 A-r /00 0 c.
RZI'RV10. /1,#113412,094', tS TS /4 3 /#91
SO -,
11A
sucrl~~v oA~ tvo r~x) .RFSUM As PSAK
9S ?9 V& IJYJA.ZS ' v - Vl"7'Vil
'5 ,'oovM N~r )
kAD r:5-1ý
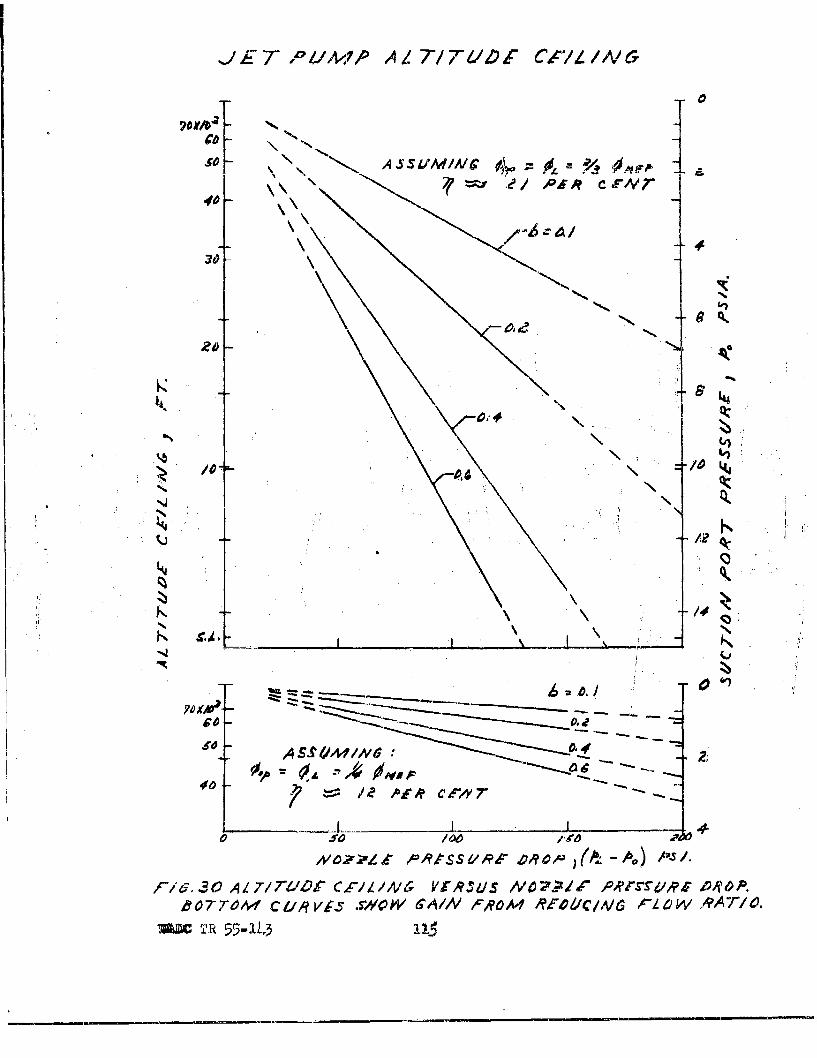
JET PU 4AVP A ZT/ 7410 F CdcU/A-' e
CD N
AS&MN6 SLMAC4 ~~~~
VJIP
F 9/
"0. IR5-4
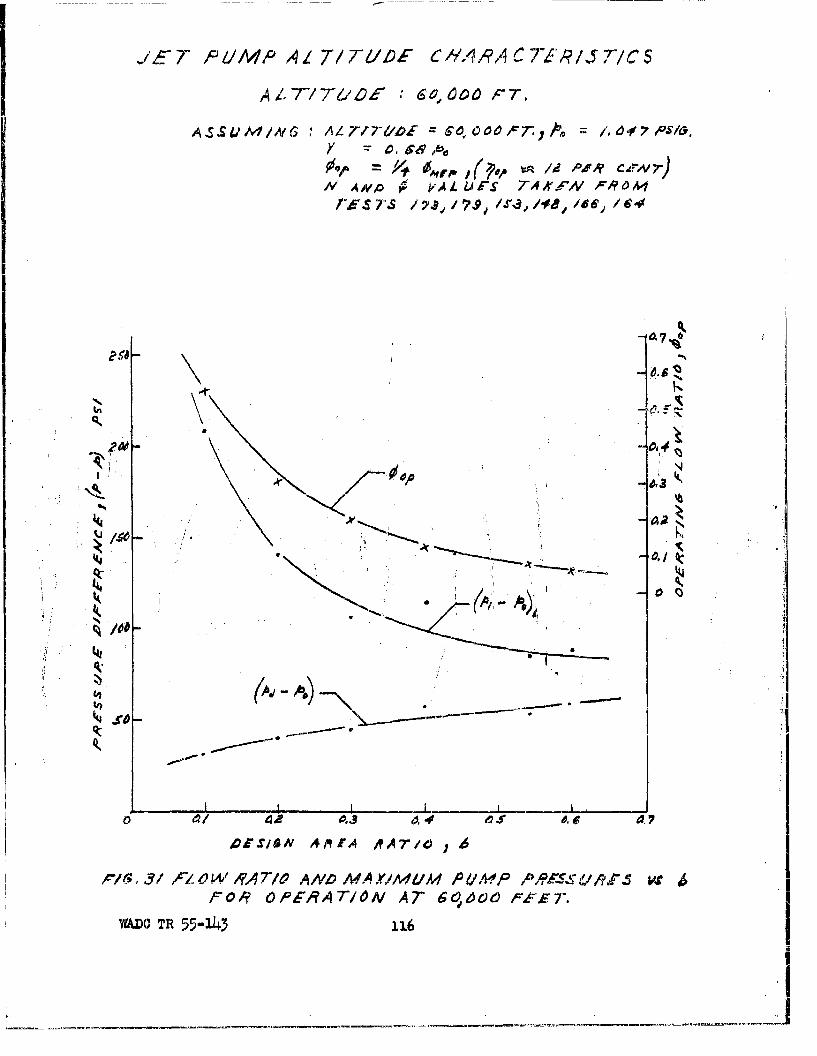
JE ýPUMP AZ T/ 711/O ClAARA C TITR/JTIC
AA*
y ~ .0 - e &
P.IA 14ILOAf
J~kAUFS AI(,r c-R 14J
I-E 7-
I')K
41 414 0
,OFS/S*V A,'lIA RAT/CD 6
4716,3 1/ A1LOW RA7T AND1 AMAXIA44WM PQMP " P.'?0 vrFORt OPERATION AT 60', 4 o PC7".
W&DO" TR 55-143 n~6
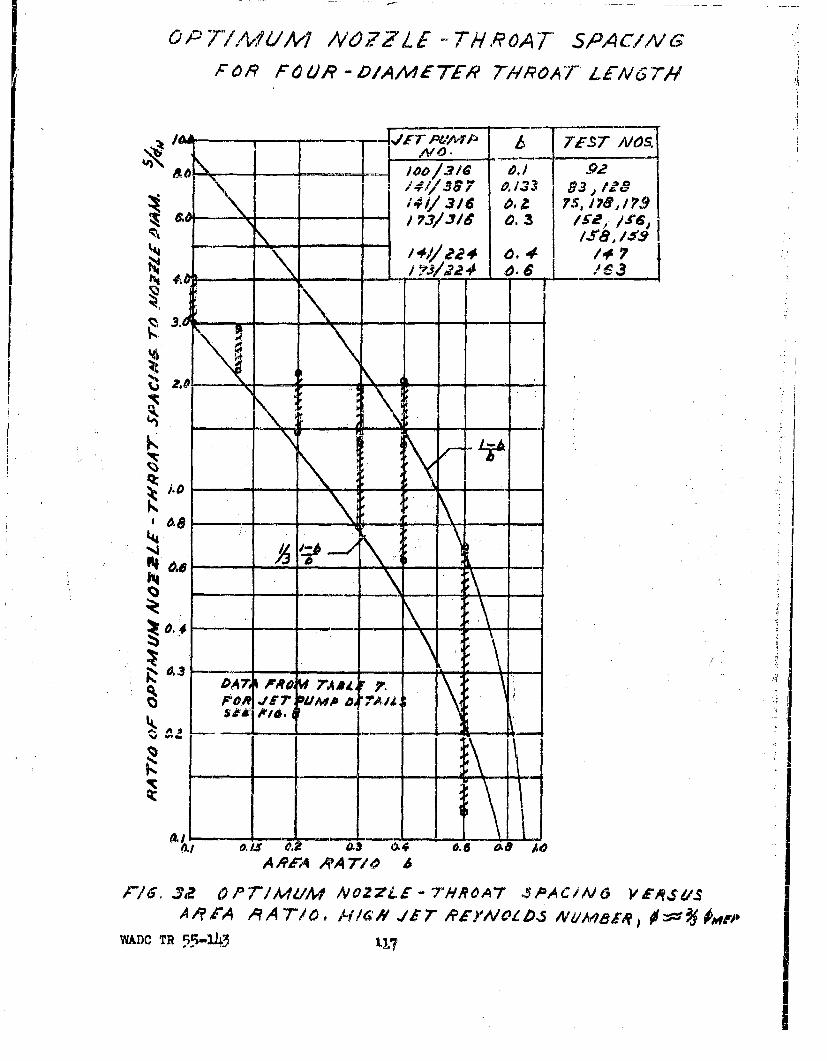
I, OPT/M~/M /V6ZZLE -'THROAT SP'ACIN/G6 /9 F 0 0R - D1A A4 E TjF6 11R 77A T LEI-V GT//o
MA lr rIF Pv'1p TEST' A/OS
-- ~~ii - /4/2 .
t,4P.O..~WR -4 -- -
i-LL
zo.- - - -
43 -- - -
0/3 O.* 0.3 a4 ). OD AOA REA AIAT77 4 A
r7s. JZ OPt/MUMI A'0271-74, ROA7 .$PACIAI6A,',A A RA 7-/0. P/C 'N ../6T ,947/OZDS A'ohl46A, R
WADC TR 55-1433.1
11-7
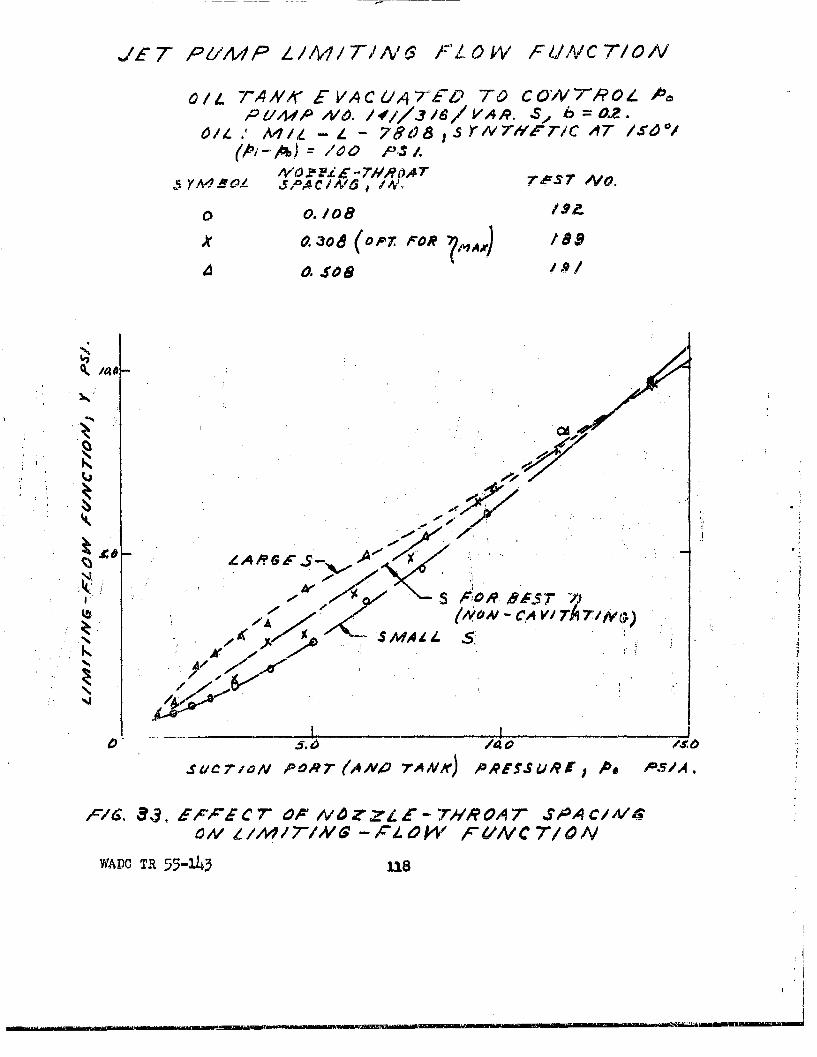
JET PU1MIP LIMIT/IN65 FLOOW F/UA/C TIOA
O/e. 7-A IAK E VA C A TE72 7-0 C OW"7-,0g P/PUIMP NO. 111Z3 16 / Vo,. b• = o20..
Zt/. ,' M/.t - L - 78e08 1S rIV 7YrT/TC AT7 15e4"/(p•-, = -/c' f'SZt
/vo• z £"-7#tR0,47-
/
A' ~ 0.306 (OP7 PORM)
4.. o,.,/.roe "'I .
A'4
CAV
/4
ISU 7/ON PORT (4AN' TANA'r) PFSS dii'jr p. PS/A.
Ic/1. 33, 6A C7- Of O4 -TZL S- 7rVROA 7 $A C1,41,Z/ L/,-1/ 7/ITNg - W LOW FUIVC C 7ON
AD-C TR 55-3. 118
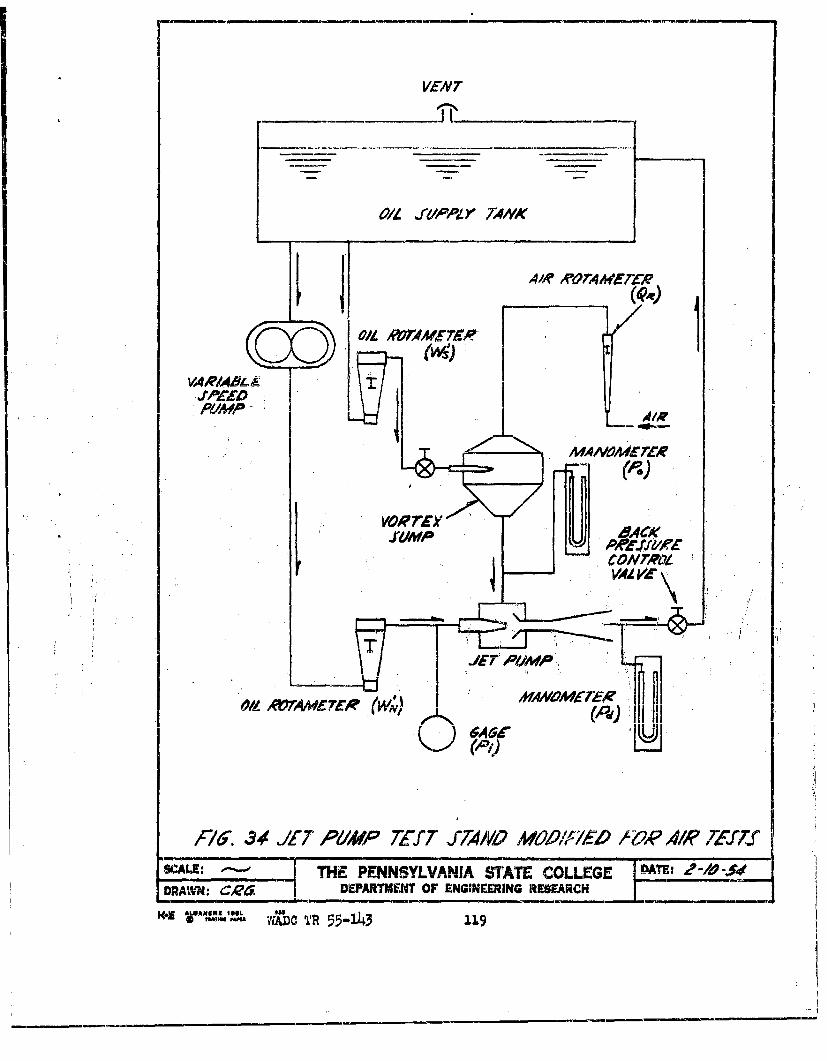
OIL J~r/PPIY 7*4/V
A/A'A6 AK07 TErrIRUM
I VOR r~rk
COA'T VO
/FET PJmPo'q
mN (Pd)ne(
SCALE: THE PENNSYLVANIA SPATE COLLEGE7 P-T' 49-10-S4
DRAWN:CA',~DEPARTMENT OF ENGINEERING RESEARCH
K. AUAI~ IL WXc TR 55-143 119
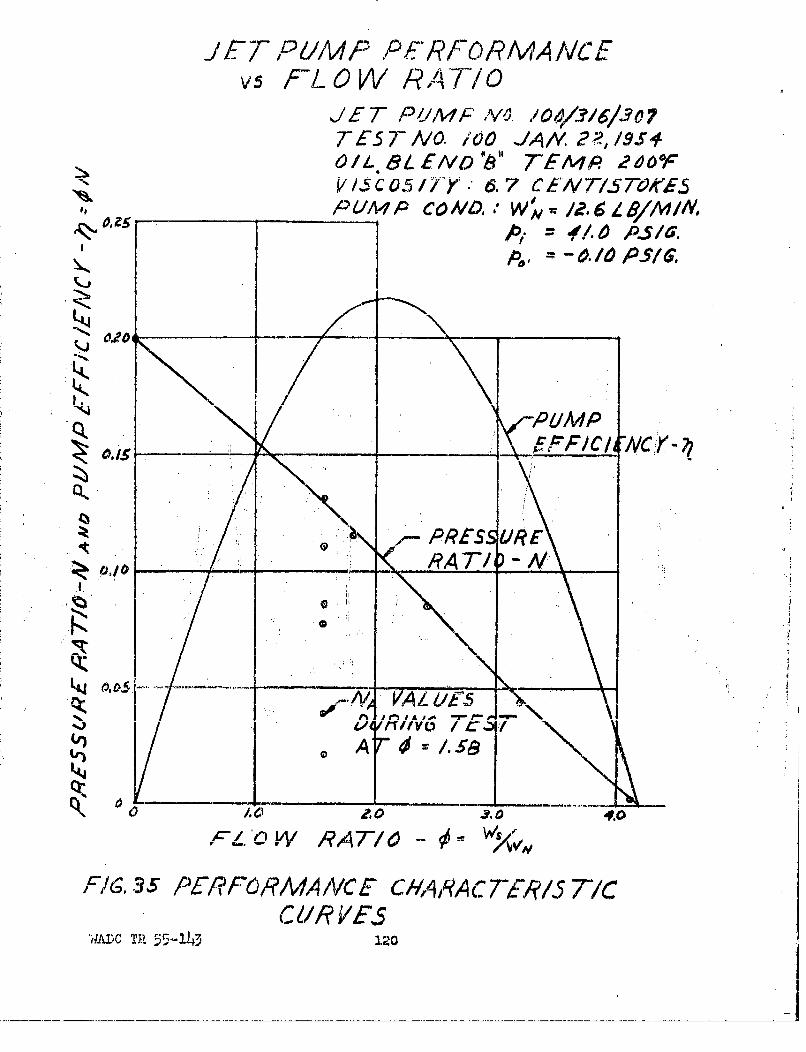
JECTrPUA1WiF PhFRPFO/?MA1NC Fv.5 FLO W PA T/C
JET PYJMF VJý 104/1316/3077-ES T A/0. /00 JAN/. R, /35O/L-.81EfVOD0 TE4P. 240OFV / 5C 05/Y 6. 7 CENT/5TIS 70or65P, ULMP C OA/O. Wv /R. 6 Z//W/MIN
Pi -fA S a
Q PUMP
L4FC/4Cr1
/1 ~ .4VA Z VF 4
rI n I AJ 1,o- -7-p 4-I4l Ifl /-/VV / C .D
If I
FLOW R9ATIO'-
/7,5PERfCPMIAiVCE CHA8A 9C Z7RY/S. TIC
WADC, TR ',)r,-143 120- _ ________
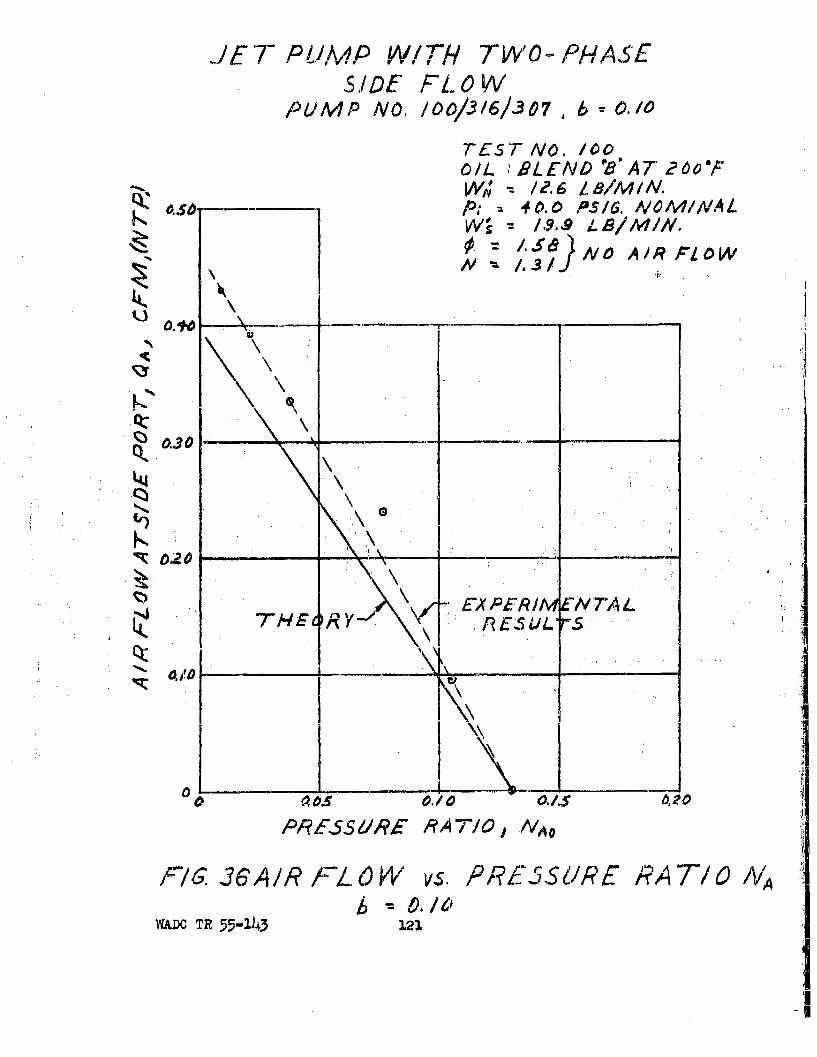
JET PUMI,4P WITH TWO-PHASESIDE FL 0 W
PUMP NO. /00/3/6/-307, b -- 0/0
TEST NO. /00OIL :RLEND 'B'AT 260-F
50 -,A-"•• 40.0 PS31. NOMINAL
0 Asa
k0.3 --
N•. 1.31o NOARFO
k _ _ _Nk !S020 - ___ _ _
'EX PC&/M EN TA L14%
PRESSOURE RATIO, N.A
F 6 A/R -FL. 0 W vs. PRE5SSURE RA TI"0 A/A
WADO TR.55-143 121
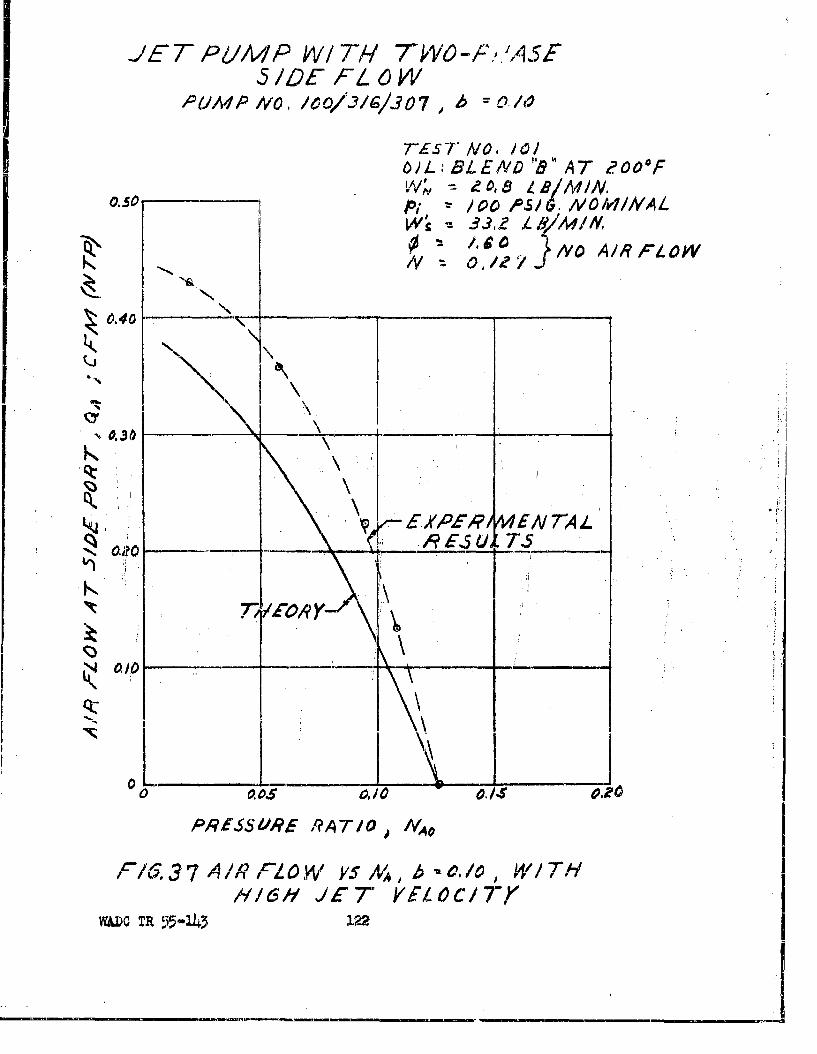
JE T P1V/bP WI T/-I "TWO-/,,.'ASE5 IDE FL 0 W
PUMAIP NO, /1o/03/1/307 , b =0/.
TES 7 NO. -/0/O)L :B LEND 'B " AT ? OOFwv # 2 , 8 LB/Ai,1V.0-50 •fi/00 P.5/6. NOMIINAL.
-- 33,2 L.'AI/N,0 "o ' O A IRFLOW/V 0 A'
"Z 0.40-
t 4 ...... ,
T MOIIyi
3 7A IRF 4 IsNb-e 01WT
' 4w
\AD EXR 55-14 1A22
iN o , I0 " ,,-
O4O•
PRIS•SU,9E /?AI7"o, NAQ,
F"/6.374// F'LO,•' V IysA, b 0, I $Y/W'T/A//6h JET YF. IOc/TY
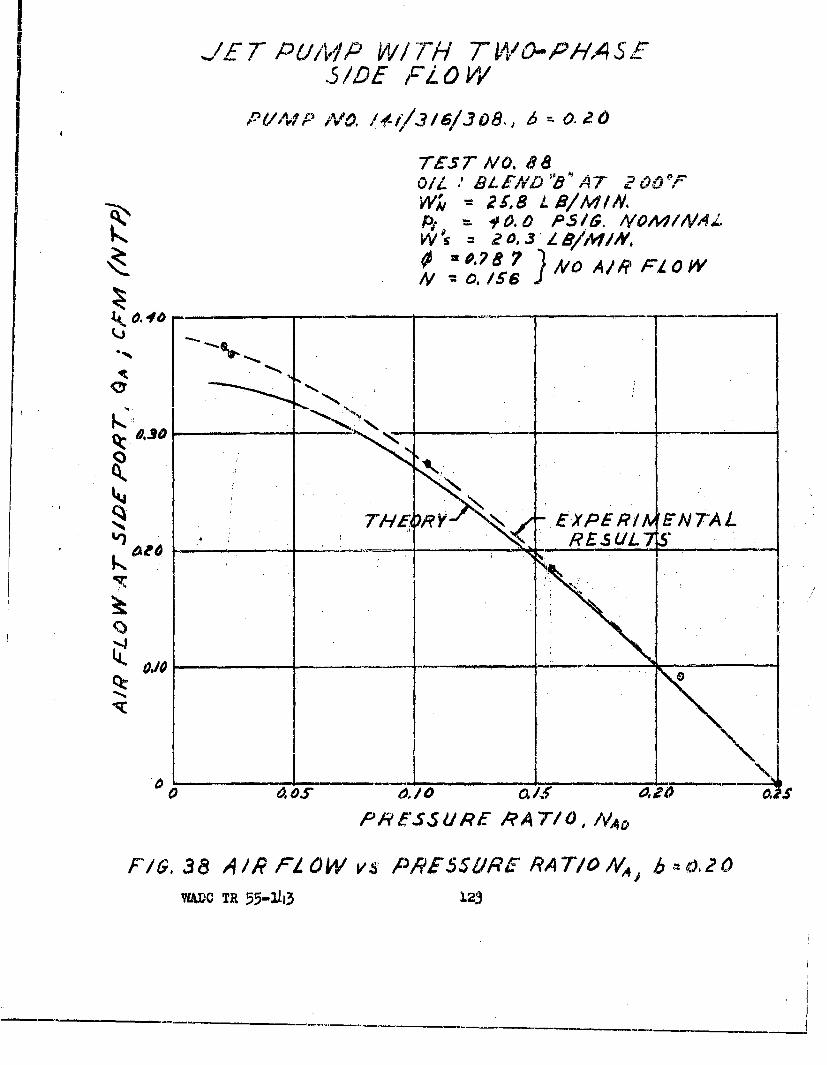
,IZ- ET PUi'P WITH T cl-PHASE5 IDE FL 0 V/
P4'7P No, b¥.i/3/6/3o8,, 6 o.20
1wTEST rO. 8 aO/I' Bl. 4FA'; m AT ,2 00OF
S- i = 2s,8 L&-/M!/.4K,. ,o.O P5/6. MOV/4o~wi..
01 20.87 NO AIR i/,F0W
°- I
k43
H -. EXPERI ENTALl l_ :"IRE.SUL .
05
FI;. 3l8 vsPRESSUR /
,I/j3 PLOW ,5 55-Rs1 RAT1O2V 4. b o.20
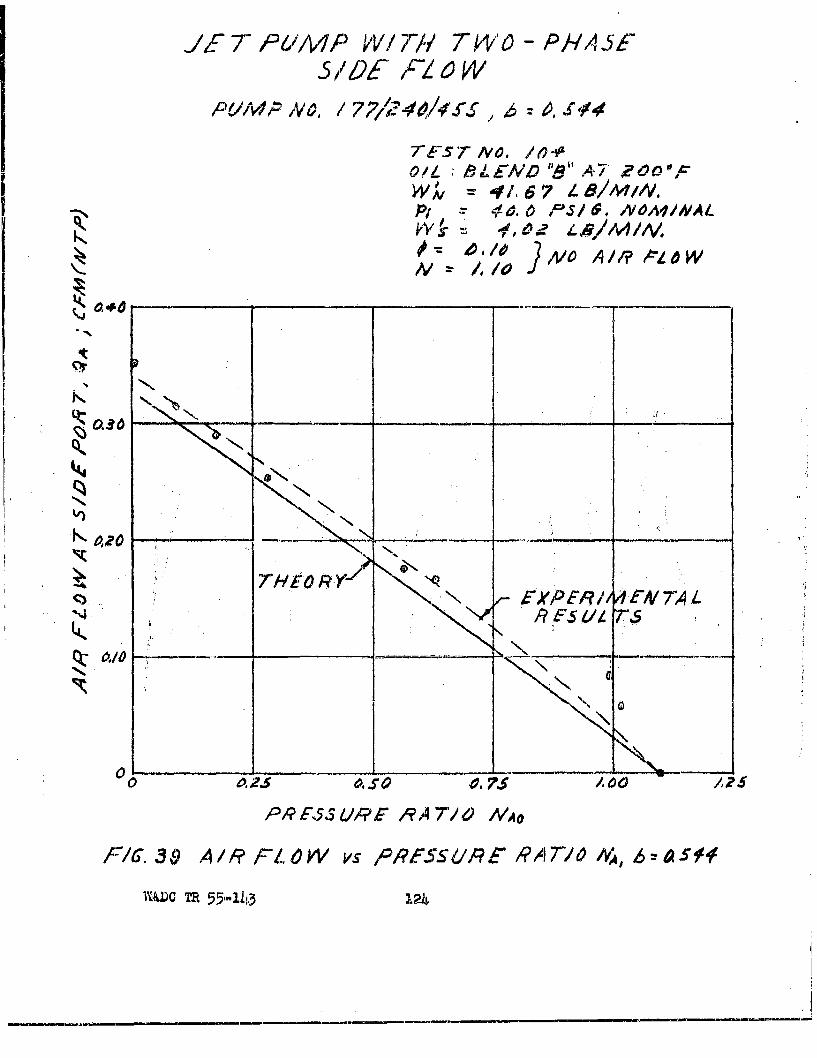
JET- P6/IP WVIT "/ TWVO - PHASE5/DtE ,Z c'L fV
P6/MP Nvo, 7 71?/24 44,rS, l6h T 4,£4
T757" IVO. /41 aO/L A'LEND "h" A7 R OOc'p
wv' 4/167 /.M//,V.P/ = 4A. 0 P$/rS .I /OAbVNAL
N A/-/ & W&1N A.,e
z 0VIC
THE ORY N XE/ 'T
R fFs U. r.
ItI
0 1 _ _. - .,. ----- - -- - ---
PI,,JU? RA 71 NA • L S
-- .i .. . . sJ . -
PPIE,33U/E /?ATU 7" /ANQ•
F-l. 39 A/R? FI- W vs PRESSUPES R A7TJ IVA, -a.S 1ff
TiALC TR 55-n1113 124
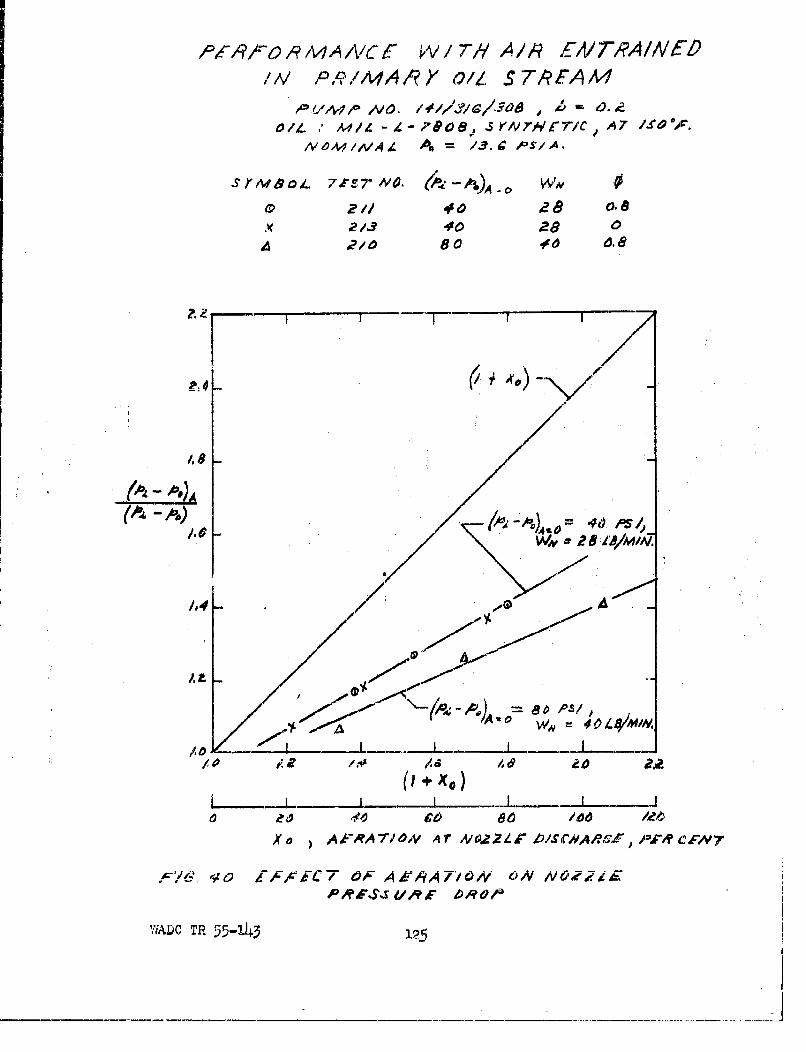
A4 -wA'ACC PV / TII A /,AZ ETM'A/A/F
/A/ P/-/A1AA?, OIL ST/?EAM4
12340 28 0
A / 80 10 .8
04,1
R4 . A
4 W__ _ _ _ __ _ _ _
f.9
(P + xo) -Iz pCO )5 /doM4
X A AFAA 7V N 4 rATo A/- j ls ~/cNAPARcz. prR eFAw
f~Y, ,rv[F~FC OF A&#'iAT/0A/ A01OV~ i
';AD)C TR 55-1-43 1295
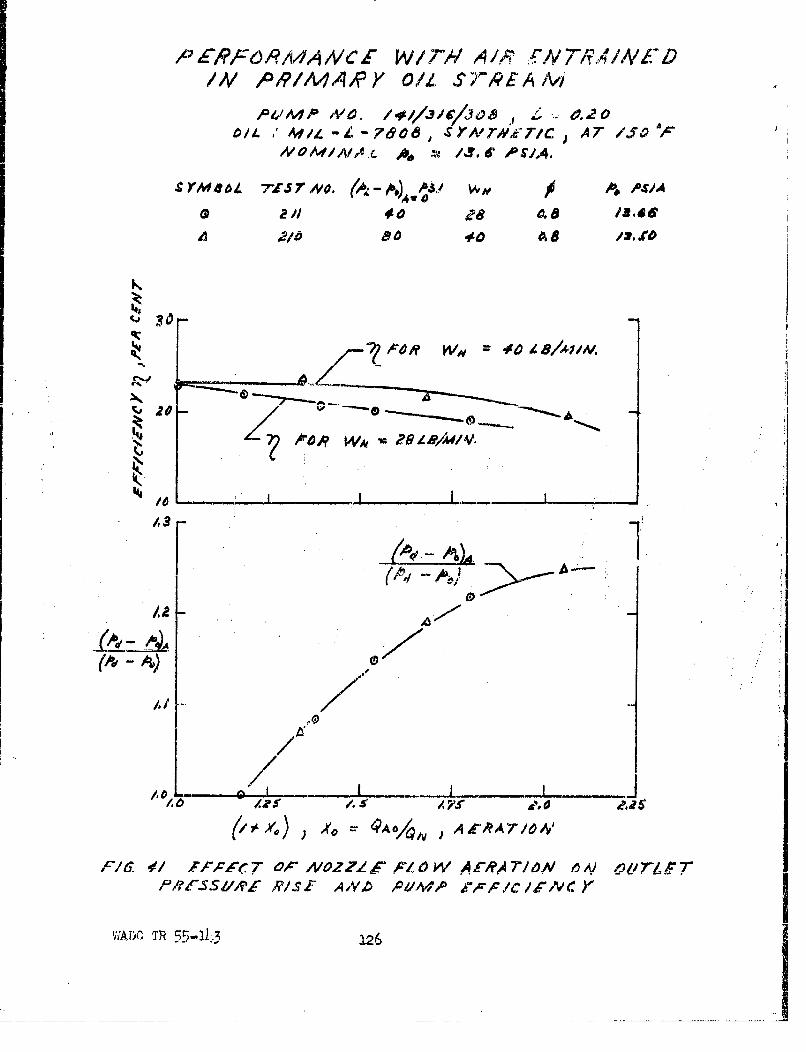
P £PFORIA4AAC [ W 7WIA AIR h-ý/V TATP.A/A/ INI/,V P9//I74,9Y OIL $79EA A-i
Oi f I'4 L - i - 7&60 a4,~l SrA'i7/c, ATr If0 ",x
symA.eol. A. /J 6,V44
Av
&-O W4, 4fO 81 /1V .
A3 AS
RIS- AN40blM,
(4-$C) 0RcF-1;.2
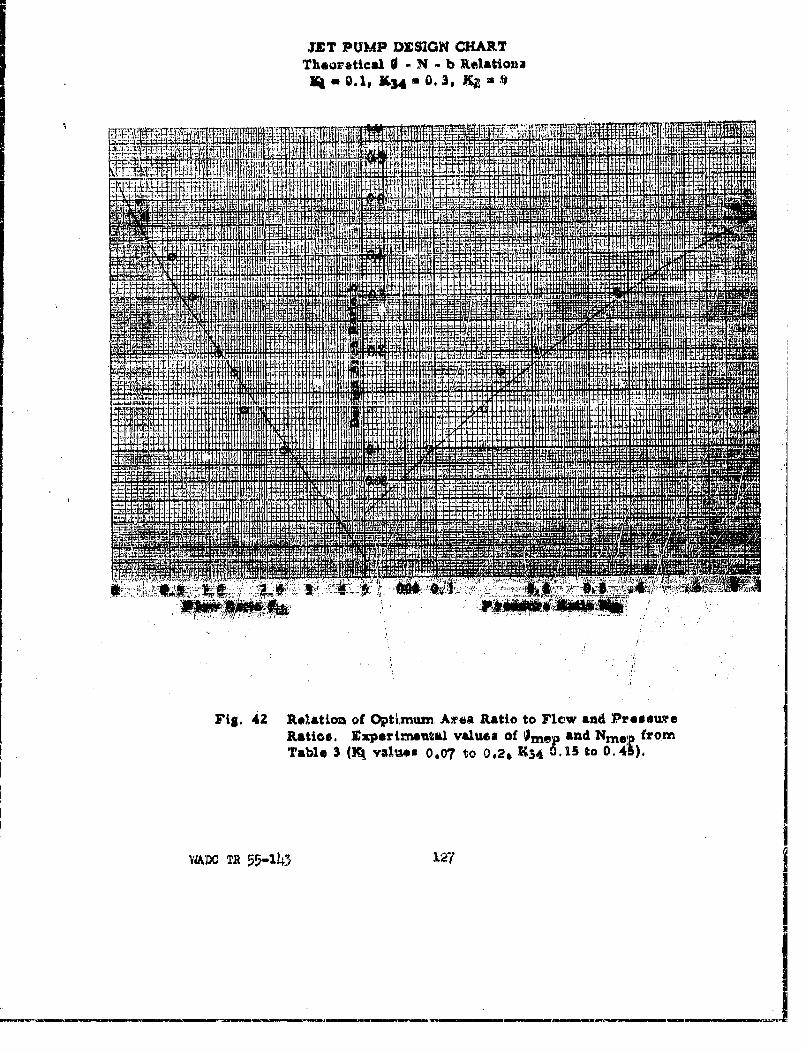
JET PUMP DESIGN #CHARTTheoretical 0 - N - b Relationa
Ki 0.1. K34m 0.,3 KZ =1
HIMI
RHtos !ge~iaua vaue ofNRe
VTRD FR5-14 2
KAIIflI
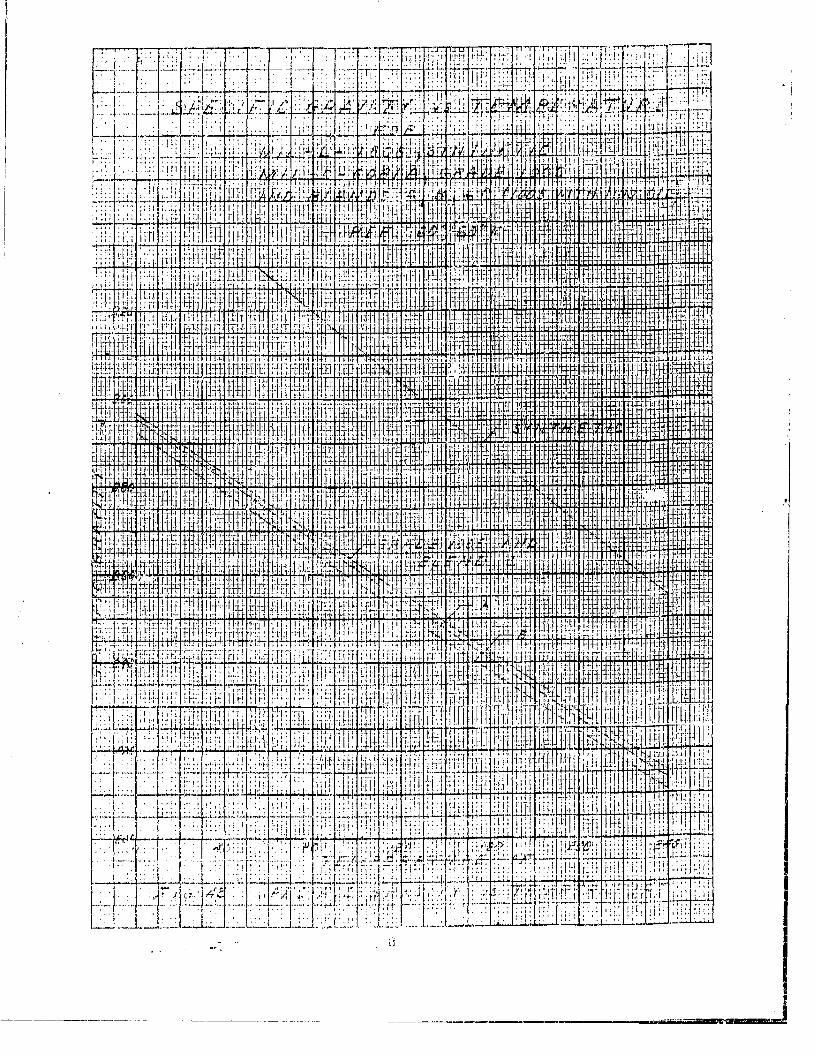
77 rr 7m" 7 ifl77f
144 it 1.4
111£''£
IF1
Hitt~f IIIL
Ij~~ ~~~~~ I-4 4
5 I~f .I .f'JI .~ .fl .t .
t~ I t 41~ l [~
Tij Y1 ~ T F '
I L..1 .ii iJ"l -I
i rI{~ i4
[S, K . .i 1A~ 'M:.{ ~ 4j~ ~i'Iki~ ~ i'{ iItl~llf
17:iif:if Iili.iI1A7r, i T ~jLi
IIIJI
-i - -TriIT I l 111 S
_'
# _X
.. - -
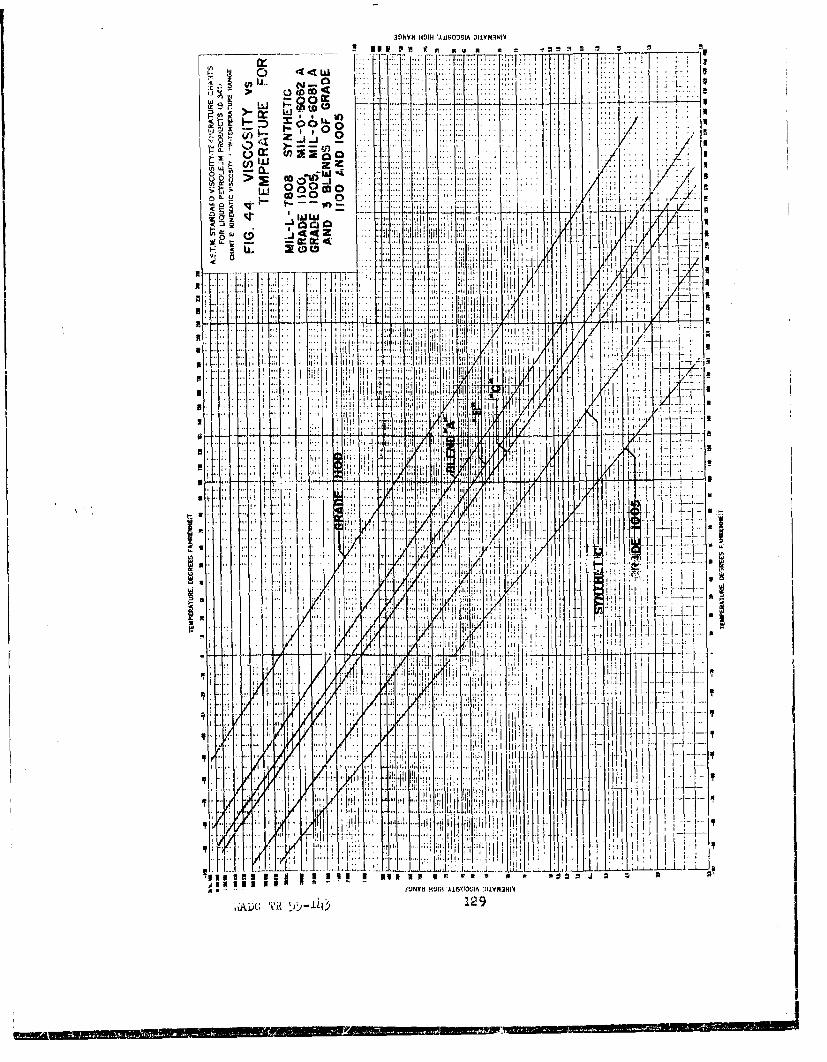
3II k HOW 'AMO UI 3 LYNIIi
~~~,,LL. ~ ~ ~ ~ -!51~ r 7T~) : ~ uH1..~P W -4W
V V)) I /
W O0 TI , Ii~
~J- t~co
414.. 9, z MI 1.1. !:!1!! 1I i*1;:: !
4~.1
.. ... ...1 4'
Ir ;_4
T l1
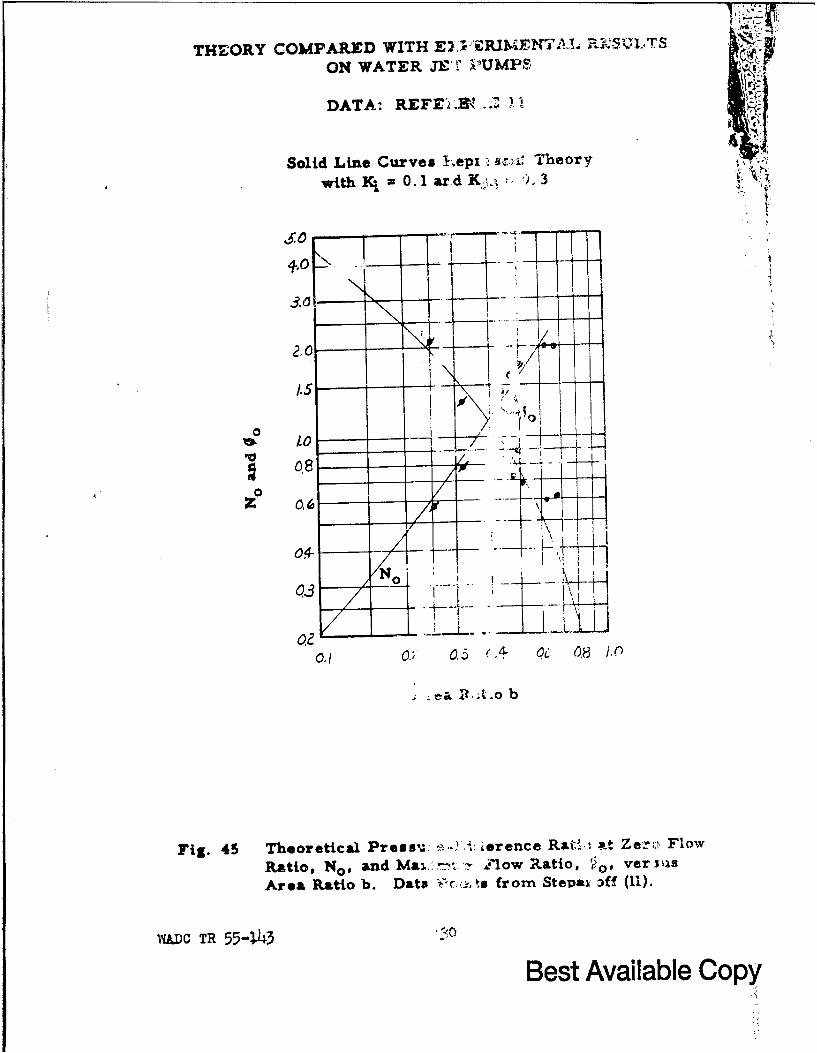
THEORY COMPARED WITH E2 RIM'!]7-L •$ ,TS
ON WATER JE"' PUMPS
DATA: REFEi.9 ZŽ. - 1 1
Solid Line Curves 1.epx -3 suý Theorywith K- 0o. 1 ard K: 3
,0 "
II
q• 0 ,"
ao
080
/ ?-41...' .
oll 0.; 0,5 e A 0. 0,8 i.)
e P .A•;.o b
Fig. 45 Theoretical Presov, s.-i : ierence Rat,.; X.t Ze.o,, Flow
Ratio, No, and Mai.,, r-n'. Zlow Ratio, vert s
Area Ratio b. Data ;.. from Stepay off (11),
WADC TR 55-lJ43
Best Available Copy