UNCG Sustainability - University of North Carolina ......Using the market-based method, UNCG’s...
25
University of North Carolina Greensboro Greenhouse Gas Inventory Report 2009-2018
Transcript of UNCG Sustainability - University of North Carolina ......Using the market-based method, UNCG’s...

University of North Carolina Greensboro Greenhouse Gas Inventory Report
2009-2018

2
TABLE OF CONTENTS
3 Introduction 5 Results
8 Other Trends & Next Steps 10 Contributors
Appendices
11 Scope Definitions
13 Infographics
3
INTRODUCTION
This report tracks the anthropogenic greenhouse gas (GHG) emissions, or carbon footprint, for the University of North Carolina at Greensboro (UNCG) campus for the fiscal years from 2009 to 2018. It provides details concerning the trend of UNCG’s greenhouse gas emissions dating back to 2009, the year UNCG first conducted an inventory and the year the University considers to be its baseline by which the University measures its progress in becoming climate neutral by 2050 – a goal stated in the University’s Climate Action Plan adopted in 2013. 1 Previous GHG reports conducted by UNCG utilized the Clean Air - Cool Planet Campus Carbon Calculator (CCC), which was originally developed in 2001 by the former non-profit Clean Air - Cool Planet, in partnership with the Sustainability Institute at the University of New Hampshire (UNH), and released to the public in 2004. UNH acquired the CCC in 2014. In their continued effort to develop a tool which provides as concise a measurement as possible, the Sustainability Institute at UNH discontinued the CCC in the spring of 2018 and replaced it with their new online calculator, the Sustainability Indicator Management and Analysis Platform (SIMAP),2 which UNCG used to determine the calculations for this report. As stated in the SIMAP User Guide,
…the carbon footprint is a measure of the greenhouse gases emitted from a campus’ activities. It includes all six greenhouse gases specified by the Kyoto Protocol: carbon dioxide (CO2), methane (CH4), nitrous oxide (N2O), hydrofluorocarbons (HFC), and perfluorocarbons (PFC), and sulfur hexafluoride (SF6). The platform was based on the workbooks provided by the Intergovernmental Panel on Climate Change (IPCC) for national-level inventories, and it incorporates data from the Fourth Assessment Report of the IPCC. SIMAP has adapted this IPCC data for use at institutions like a college or university but follows the same protocols.
SIMAP’s calculations also incorporate guidance provided by the Greenhouse Gas Protocol Initiative (GGPI), 3 which is a multi-stakeholder partnership of businesses, governments, and other interested parties that was established by the World Resources Institute and the World Business Council for Sustainable Development in 1998. In 2001, it published the GHG Protocol Corporate Standard, “a step-by-step guide for companies to use in quantifying their data.” In 2015, the GGPI provided additional guidance on measuring Scope 2 (purchased electricity) emissions and recommended companies report their Scope 2 emissions in two ways: using a location-based method and a market-based method. Both of which UNCG calculated using SIMAP.
1 https://sustainability.uncg.edu/wp-content/uploads/2016/06/UNCG-Climate-Action-Plan.pdf 2 https://sustainableunh.unh.edu/calculator 3 https://ghgprotocol.org

4
The location-based method uses emissions factors from the Emissions & Generation Resource Integrated Database (eGRID), which is a comprehensive inventory of data organized, collected, and administered by the Environmental Protection Agency and the Energy Information Administration4. It contains the environmental characteristics of almost all electric power generated in the United States based on available plant-specific data for all U.S. electricity generating plants that provide power to the electric grid and report data to the U.S. government. The eGRID provides emissions factors (average kilograms of CO2 per kWh from energy generation sources) for 24 regions within the United States. North Carolina (and UNCG) are within the SRVC region.
The market-based method was established in 2015 with the release of the Scope 2 Guidance from the GGPI. Its Scope 2 calculations differ from the location-based method’s in a few ways. It allows for the input of renewable energy generated on-site and for any renewable energy credits purchased by electricity users. 5 It also allows for the input of supplier-specific emissions factors, which in UNCG’s case are the emissions factors of its utility provider Duke Energy, in place of the eGRID emissions factors. Thus, where the location-based method places UNCG’s Scope 2 emissions in the context of energy generation sources (nuclear, coal, natural gas, etc.) within a larger geographical region, the market-based method localizes the university’s Scope 2 emissions to the sources generating the electricity it purchases directly from Duke Energy.
4 www.epa.gov/energy/emissions-generation-resource-integrated-database-egrid 5 UNCG does not currently purchase RECs and its significant first solar installation will come online in 2020 when construction of the Nursing & Instructional Building is complete.

5
RESULTS In 2007, UNCG became a member of the Association for the Advancement of Sustainability in Higher Education (AASHE) to further its campus efforts toward building a healthy and just world. As part of its membership, UNCG utilizes AASHE’s Sustainability Tracking, Assessment & Rating System (STARS), which measures and encourages sustainability in all aspects of higher education. While UNCG calculated its carbon footprint using both the location-based and market-based methods, AASHE STARS requires universities to report their greenhouse gas inventory using only the market-based method. For that reason, and because of its use of supplier-specific emissions factors, much of this report will focus on the results from the market-based method. Using the market-based method, UNCG’s carbon footprint for fiscal year 2018 is 68,368 MTeCO2 (metric ton equivalent of carbon dioxide), which is an 8% reduction from its 2009 footprint of 74,437 MTeCO2.
Using the location-based method, UNCG’s carbon footprint for fiscal year 2018 is 75,447 MTeCO2, which is a 5% reduction from its 2009 footprint of 79,649 MTeCO26.
6 All data dating back to 2009 was recalculated using SIMAP for both methods.
6
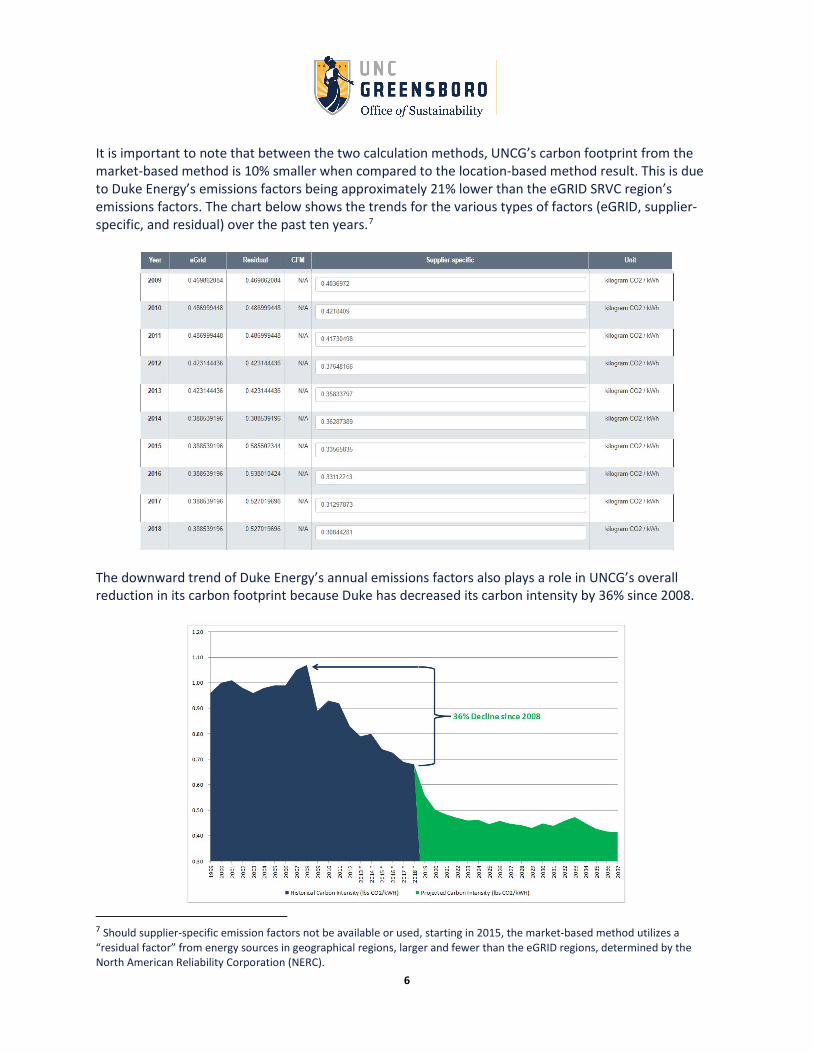
It is important to note that between the two calculation methods, UNCG’s carbon footprint from the market-based method is 10% smaller when compared to the location-based method result. This is due to Duke Energy’s emissions factors being approximately 21% lower than the eGRID SRVC region’s emissions factors. The chart below shows the trends for the various types of factors (eGRID, supplier-specific, and residual) over the past ten years.7
The downward trend of Duke Energy’s annual emissions factors also plays a role in UNCG’s overall reduction in its carbon footprint because Duke has decreased its carbon intensity by 36% since 2008.
7 Should supplier-specific emission factors not be available or used, starting in 2015, the market-based method utilizes a “residual factor” from energy sources in geographical regions, larger and fewer than the eGRID regions, determined by the North American Reliability Corporation (NERC).

7
Additionally, knowing the sources of Duke Energy electricity generation, 43% of which is from fossil fuels, is important because the greenhouse gases associated with UNCG’s purchased electricity account for the largest percentage (38.2%) of the University’s carbon footprint.8
UNCG Market-based Percentages
Duke Energy’s 2018 Carolinas’ Combined Fleet Energy Sources
(DEC & DEP Owned & Purchased)
8 More information about other sources of UNCG’s greenhouse gases can be found in the SIMAP Scope Definitions and additional infographics appendices at the end of this report.
8
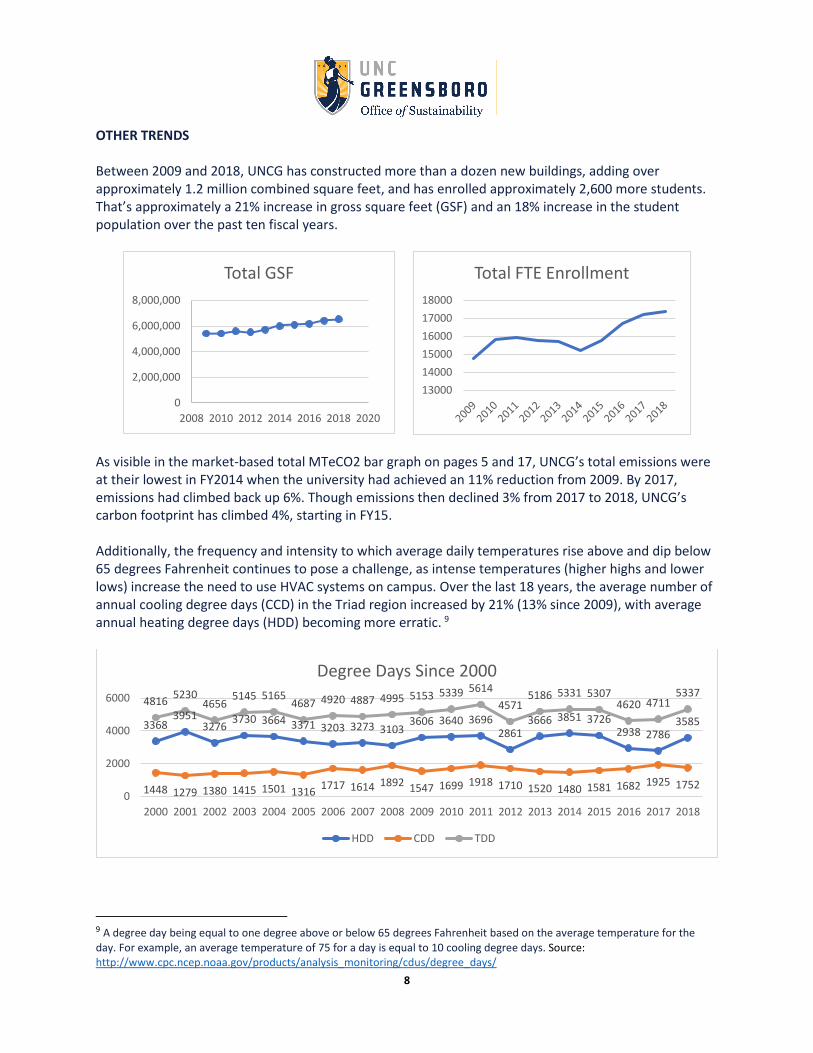
OTHER TRENDS Between 2009 and 2018, UNCG has constructed more than a dozen new buildings, adding over approximately 1.2 million combined square feet, and has enrolled approximately 2,600 more students. That’s approximately a 21% increase in gross square feet (GSF) and an 18% increase in the student population over the past ten fiscal years.
As visible in the market-based total MTeCO2 bar graph on pages 5 and 17, UNCG’s total emissions were at their lowest in FY2014 when the university had achieved an 11% reduction from 2009. By 2017, emissions had climbed back up 6%. Though emissions then declined 3% from 2017 to 2018, UNCG’s carbon footprint has climbed 4%, starting in FY15. Additionally, the frequency and intensity to which average daily temperatures rise above and dip below 65 degrees Fahrenheit continues to pose a challenge, as intense temperatures (higher highs and lower lows) increase the need to use HVAC systems on campus. Over the last 18 years, the average number of annual cooling degree days (CCD) in the Triad region increased by 21% (13% since 2009), with average annual heating degree days (HDD) becoming more erratic. 9
9 A degree day being equal to one degree above or below 65 degrees Fahrenheit based on the average temperature for the day. For example, an average temperature of 75 for a day is equal to 10 cooling degree days. Source: http://www.cpc.ncep.noaa.gov/products/analysis_monitoring/cdus/degree_days/
0
2,000,000
4,000,000
6,000,000
8,000,000
2008 2010 2012 2014 2016 2018 2020
Total GSF
130001400015000160001700018000
Total FTE Enrollment
33683951
3276 3730 3664 3371 3203 3273 31033606 3640 3696
28613666 3851 3726
2938 27863585
1448 1279 1380 1415 1501 1316 1717 1614 1892 1547 1699 1918 1710 1520 1480 1581 1682 1925 1752
4816 52304656
5145 51654687 4920 4887 4995 5153 5339 5614
45715186 5331 5307
4620 47115337
0
2000
4000
6000
2000 2001 2002 2003 2004 2005 2006 2007 2008 2009 2010 2011 2012 2013 2014 2015 2016 2017 2018
Degree Days Since 2000
HDD CDD TDD

9
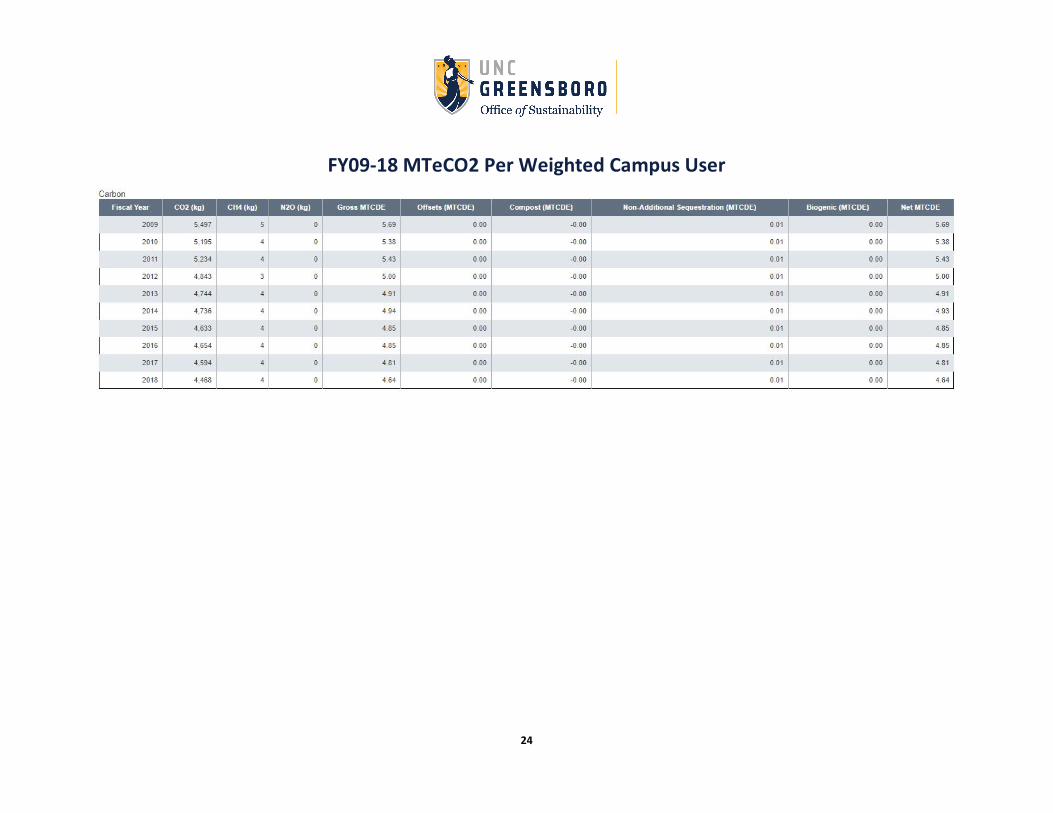
Despite those trends which lead to increased energy demand, thanks to UNCG’s commitments to improving its energy data analysis capabilities and to designing new buildings to United States Green Building Council’s LEED Silver standards, which improve efficiency in heating, cooling, and lighting buildings, the University has achieved a decrease of 24% MTeCO2 per 1000 gross square feet and a decrease of 18% MTeCO2 per weighted campus user since 2009. The positive impact of those commitments is also reflected in millions of dollars of avoided costs in utility bills and an 18% reduction of energy consumption per square foot since 2003 – about which more detail can be read in UNCG’s annual Strategic Energy Plan reports10.
MTeCO2 per 1000 GSF MTeCO2 per Weighted Campus Users
NEXT STEPS
The University of North Carolina at Greensboro will continue its commitments to achieving climate neutrality by 2050 and to meeting the goals of North Carolina Governor Roy Cooper’s Executive Order 80, which put the State on a path to reduce statewide greenhouse gas emissions to 40% below 2005 levels and to reduce energy consumption per square foot in state-owned buildings by at least 40% from the fiscal year 2002-2003 levels by 2025.
In that pursuit, UNCG will continue to analyze its carbon footprint and identify and improve best practices to reduce greenhouse gas emissions, particularly regarding pollutants that contribute a significant percentage of its emissions, e.g., purchased electricity, its campus vehicle fleet and use of stationary sources (distillate oil, natural gas, and propane), and student and employee commuting. UNCG will also work to identify gaps in its GHG data collection and improve best practices for collecting data that is as accurate as possible. That process will also include a continued multi-stakeholder examination and implementation of the University’s Campus Master Plan, Climate Action Plan, Strategic Energy Plan, and Transportation Plan.
10 https://sustainability.uncg.edu/action-areas/energy/

10
CONTRIBUTORS Nihal Al Raees, Energy Analyst, UNCG Randy Bennett, University Controller, UNCG Rochal Blackwell, Vertical Marketing Manager, Office Depot Douglas Cato, Campus Mechanical Engineer, UNCG Maggie Capone-Chrismon, Assistant Director, Space Utilization & Planning, UNCG Desiree Coltrane, Associate Director, Parking Operations & Campus Access Management, UNCG Andrew Currin, Assistant Director for Grounds, UNCG Brieana DeFlavio, Strategic Account Leader, Staples Gary Denny, HVAC Supervisor, UNCG Dr. Shanna N. Eller, Sustainability Coordinator, UNCG John Guffey, Spartan Printing, UNCG Ben Kunka, Waste Reduction & Recycling Surplus Warehouse Supervisor, UNCG Quita Loflin, Assistant Controller, UNCG Michael Logan, Director of Purchasing and Contracts, UNCG Sean MacInnes, Sustainability Specialist (Lead Author), UNCG John Millard, Account Executive, Duke Energy Scott Milman, Assistant Vice Chancellor for Campus Enterprises and Real Estate, UNCG Debbie Reynolds, Facilities Operations Accounting, UNCG Guy Sanders, Associate Director for Administrative Operations, Housing & Residence Life, UNCG Judy Smith, Director, Office of Space Utilization and Planning, UNCG Jorge Quintal, Associate Vice Chancellor for Facilities, Chief Sustainability Officer, UNCG Dr. Bill Zhang, Associate Director of Operations & External Reports, Institutional Research, UNCG

11
APPENDICES
SIMAP SCOPE DEFINITIONS
Scope 1 – Direct emissions from sources that are owned and/or controlled by your institution. This includes combustion of fossil fuels in college-owned facilities or vehicles, fugitive emissions from refrigeration, and emissions from on-campus agriculture or livestock husbandry. Your institution has complete control over these emissions, and they are no-one else’s responsibility. Examples of these generally include the following: • On-Campus Stationary Sources Emissions from all on-campus fuel combustion, excluding vehicle fuels • Direct Transportation Sources Emissions from all fuel used in the institution’s fleet (the vehicles it owns) • Agriculture N2O emissions from fertilizer use and CH4 emissions from animals (cattle, horses, etc.) • Refrigeration and other Chemicals Fugitive emissions from refrigerants and other sources Scope 2 – Indirect emissions from sources that are neither owned nor operated by your institution but whose products are directly linked to on campus energy consumption. This includes purchased energy: electricity, steam, and chilled water. Although your institution is not directly responsible for these emissions, it is strongly implicated. These emissions come from converting energy sources that release greenhouse gas emissions when used (fossil fuels) to energy sources that do not (electricity, steam, or chilled water). Although your institution did not burn the coal to make the electricity you use, someone had to, and although the electricity producer emitted the gasses, they did not use any of the energy produced. • Purchased Electricity Emissions from the production of any electricity the institution purchases off-campus • Purchased Steam Emissions from the production of steam purchased from off-campus • Purchased Chilled Water Emissions from the production of chilled water purchased from off-campus • Renewable Energy Certificates
12
Scope 3 – Other emissions attributed to your institution, deemed “optional” emissions by corporate inventories. This includes emissions from sources that are neither owned nor operated by your institution but are either directly financed (i.e. commercial air travel paid for by the institution) or are otherwise linked to the campus via influence or encouragement (i.e. air travel for study abroad programs, regular faculty, staff, and student commuting). Many Scope 3 emissions are considered “upstream” like the emissions associated with making and transporting plastic silverware. To prevent institutions from accounting for too many upstream emissions, most campuses define distinct financial or control boundaries to distinguish which Scope 3 emissions they are indeed responsible for. • Commuting Emissions from regular commuting by faculty, staff, or students (does NOT include student travel to and from home over breaks) (note – student commuting is generally considered to be under more institutional control than staff/faculty commuting) • Directly Financed Outsourced Transportation Emissions from travel that is paid for by the institution, but does not occur in fleet vehicles (business trips in commercial aircraft, staff travel in personal vehicles where mileage is reimbursed, etc.) • Study Abroad Air Travel Emissions from students flying to their study abroad location • Transportation and Distribution Losses from Purchased Energy Energy lost while transporting purchased electricity, steam, or chilled water to campus • Food Emissions from producing, transporting, preparing, consuming, and composting food • Upstream Emissions from Directly Financed Purchases Emissions associated with paper production, food production, fuel extraction, etc. • Solid Waste and Wastewater Emissions from managing the institution’s waste (incineration, landfilling, etc.)
12
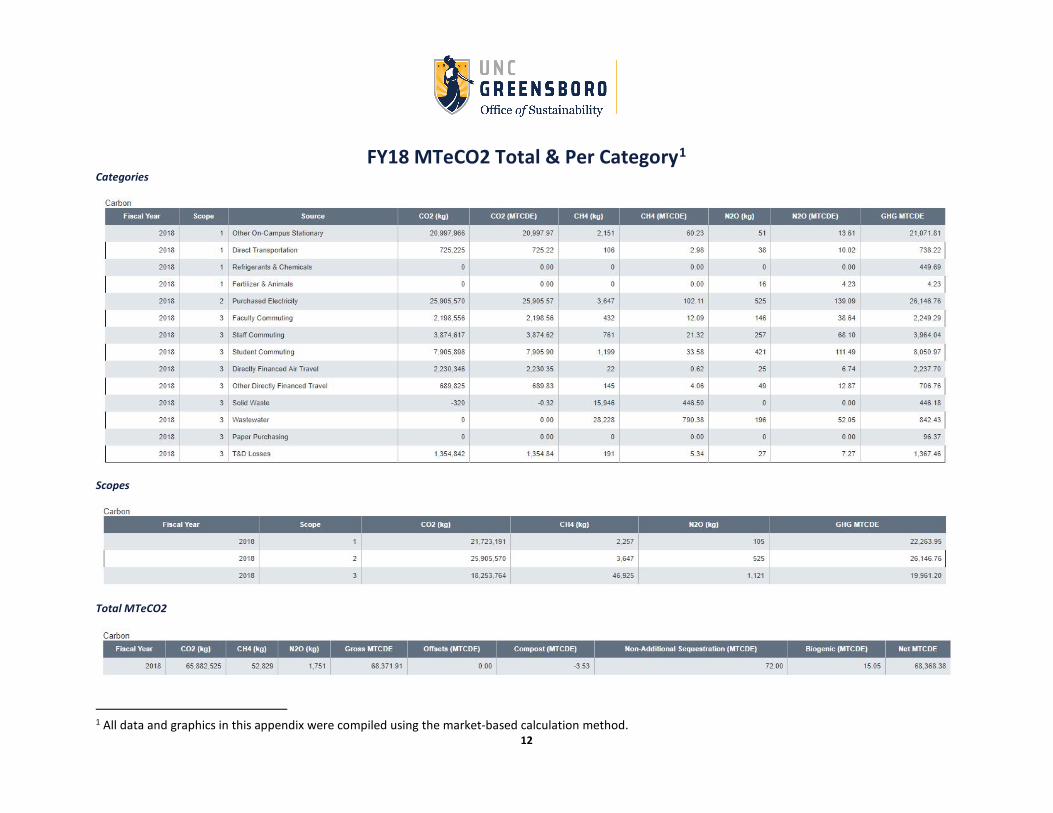
FY18 MTeCO2 Total & Per Category1 Categories
Scopes
Total MTeCO2
1 All data and graphics in this appendix were compiled using the market-based calculation method.

13
FY18 MTeCO2 % Per Category

14
FY18 MTeCO2 Per Category

15
FY18 MTeCO2 % Per Scope

16
FY09-18 MTeCO2

17
FY09-18 MTeCO2

18
FY09-18 MTeCO2 Per Scope

19
FY09-18 MTeCO2 Per Scope

20
FY09-18 MTeCO2 Per Category

21
FY09-18 MTeCO2 Per 1000GSF

22
FY09-18 MTeCO2 Per 1000GSF

23
FY09-18 MTeCO2 Per Weighted Campus User
24
FY09-18 MTeCO2 Per Weighted Campus User


![Jordan - International Youth Foundationtions. “I’m taking the English [training] because it was the one sub-ject that stopped me from passing my Tawjihi [Jordan’s equivalen-cy](https://static.fdocuments.in/doc/165x107/600b461987f6330dcf3de8fa/jordan-international-youth-foundation-tions-aoeiam-taking-the-english-training.jpg)