Uncertainty in rainfall prediction of land- falling tropical ... in rainfall prediction of...
56
Uncertainty in rainfall prediction of land- falling tropical cyclones over India: Impact of data assimilation School of Earth Ocean and Climate Sciences Indian Institute of Technology, Bhubaneswar India Krishna K. Osuri, Raghu Nadimpalli S.G. Gopalakrishnan, HRD, AOML U. C. Mohanty
Transcript of Uncertainty in rainfall prediction of land- falling tropical ... in rainfall prediction of...

Uncertainty in rainfall prediction of land-falling tropical cyclones over India:
Impact of data assimilation
School of Earth Ocean and Climate Sciences
Indian Institute of Technology, Bhubaneswar
India
Krishna K. Osuri, Raghu Nadimpalli
S.G. Gopalakrishnan,
HRD, AOML
U. C. Mohanty

OUTLINE
Introduction
Objective
Results • Realtime prediction of TC and associated inland rainfall
• Mesoscale data assimilation:
– Satellite derived wind data assimilation
– DWR reflectivity and radial wind observations
Conclusions

Coastal regions of India (particularly East coast) frequently receive heavy to very heavy rainfall due to landfalling Tropical Cyclones (TCs).
Precipitation is one of the difficult parameters to forecast/ simulate with NWP models.
In recent years, there have been significant improvement in prediction of track over NIO basin, but skill of numerical models need to be improved in
o Intensity prediction o Structure prediction o Inland rainfall prediction
This can be achieved some extent by o increased model resolution (at cloud resolving) o Improved model parameterization schemes o High resolution data assimilation
INTRODUCTION

Studies showed that the meso-scale/convective scale features are well resolved by improving the model initial condition with high spatial and temporal observations like DWR, satellite products, etc.
The ability to anticipate the formation, intensity and rainfall structure of landfalling TCs remains a major challenge for researchers as well as forecasters.

Objective
To improve the forecast skill of high resolution model for heavy rainfall associated with Landfalling tropical cyclones

Real time prediction of Tropical cyclones over North Indian Ocean

Basin Name (Intensity) Simulations period in 12-hr interval Observed Landfall No. of forecasts
Arabian
Sea
Cyclones
(5 TCs)
Gonu (SuCS) 00 UTC 2 – 12 UTC 5 June 2007 03UTC 6 June (over Oman) 8
Yemyin (CS) 00 and 12 UTC 25 June 2007 03 UTC 26 June 2
Phyan (CS) 12 UTC 9 – 00 UTC 11 Nov 2009 Between 10-11 UTC 11 Nov 4
Phet (VSCS) 12 UTC 31 May – 00 UTC 6 June 2010 12 UTC 6 June (LF-2) 12
Murjan (CS) 00 UTC 23 – 25 October 2012 18 UTC 25 October 2012 5
Bay of
Bengal
cyclones
(20 TCs)
Akash (CS) 12 UTC 13 – 12 UTC of 14 May 2007 00 UTC 15 May 3
Sidr (VSCS) 12 UTC 11 – 00 UTC 15 Nov 2007 15 UTC 15 Nov 8
Nargis (VSCS) 12 UTC 27 April – 00 UTC 2 May 2008 12 UTC 2 May 10
Rashmi (CS) 00 UTC 25 – 12 UTC 26 Oct 2008 00 UTC 27 Oct 4
KhaiMuk (CS) 12 UTC 13 – 12 UTC 15 Nov 2008 00 UTC 16 Nov 5
Nisha (CS) 12 UTC 25 – 26 Nov 2008 00 UTC 27 Nov 3
Bijli (CS) 12 UTC 14 – 00 UTC 17 Apr 2009 15 UTC 17 April 6
Aila (SCS) 12 UTC 23 – 00 UTC 25 May 2009 9 UTC 25 May 4
Ward (CS) 12 UTC 10 – 12 UTC 13 Dec 2009 9 UTC 14 Dec 7
Laila (VSCS) 12 UTC 17 – 19 May 2010 12 UTC 20 May 5
Giri (VSCS) 12 UTC 20 – 00 UTC of 22 Oct 2010 14 UTC 22 Oct 4
Jal (VSCS) 00 UTC of 4 – 7 Nov 2010 16 UTC 7 Nov 7
Thane (VSCS) 00 UTC 26 – 12 UTC 29 Dec 2011 00 UTC 30 Dec 8
Nilam (CS) 00 UTC 28 – 12 UTC 31 Oct 2012 15 UTC 31 Oct 2012 6
Mahasen (CS) 00 UTC 10 – 12 UTC 16 May 2013 9UTC 16 May 2013 13
PHAILIN (VSCS) 7-12 Oct 2013 17 UTC 12 Oct 2013 9
(SCS) Helen 19 – 22 Nov 2013 9 UTC 22 Nov 2013 6
Lehar (VSCS) 25 – 28 Nov 2013 9 UTC 28 Nov 2013 6
HudHud (VSCS) 7 – 12 Oct 2014 9 UTC 12 Oct 2014 10
Total Number of cyclones during 2007 – 13 164
TCs during 2007 – 2014 (Total 172 cases)

Model WRF model configuration
Dynamics Non-hydrostatic
Horizontal Resolution 27 km / 18 km / 9 km
Domain 3 N – 28 N and 78 E – 103 E (BOB)
5 N – 30 N and 48 E – 78 E (AS)
Time step 30s
Map projection Mercator
Horizontal Grid System Arakawa C- Grid
Vertical co-ordinates Terrain following hydrostatic pressure co-ordinates (51 levels)
Radiation Dudhia scheme for long and short wave radiation
Surface Layer Thermal Diffusion scheme
Cumulus scheme Kain Fristch
PBL scheme Yonsui University scheme
Micro physics WSM-3
Initial and boundary conditions
GFS model analysis and forecast fields (0.5 0.5 resolution)
TCs over Bay of Bengal Longitude: 77 E – 102 E Latitude : 3 N – 28 N Resolution : 9 km
TCs over Arabian Sea Longitude : 48 E – 78 E Latitude : 5 N – 28 N Resolution : 9 km IC & BC : GFS model (0.5x0.5)
WRF model configuration for cyclone prediction

TC Phailin (08 – 12 October 2013)
TC Phailin (96 hour) Forecast
based on 12 UTC of 8 October 2013
TC Phailin (72 hour) Forecast
based on 12 UTC of 9 October 2013
Landfall point error is 29 km
Time error 5 hrs ahead
Landfall point error is 16 km
Time error 2 hrs ahead
White line is
IMD OBS track
RED track is
Model Predicted

10
Comparison of Track
Prediction of TC PHAILIN With
Different operational Models
TC PHAILIN with different
initial conditions
Forecast length (hour)
Mean Track errors (km)

Time series of pressure drop at Gopalpur (landfall point)
Observed
Model averaged value

24-hr accumulated rainfall (cm) during landfall day for TC PHAILIN
(Number represents IMD OBSERVED RAINFALL at 108 stations)
72 hour forecast 24 hour forecast
Though model-predicted track was good, rainfall distribution and intensity is not realistic.
Observed peak rain
(~40 cm) is over
Northern parts of
Odisha
Model showed peak rainfall over South Odisha and Andhra Pradesh
Modelled
rainfall over
South
Odisha
Modelled
rainfall over
South
Odisha

0
5
10
15
20
25
30
35
40
Air
akhol
Anandpur
Ath
malik
Balik
uda
Banarp
al
Banpur
Barm
ul
Bijepur
Chaib
asa
Chandik
hol
Daitari
Daspalla
G U
dayag
iri
Hin
dol
Jaip
ur
Jhum
pura
K N
uag
aon
Keonjh
ag…
Kore
i
Madanpur …
Mohana
Nara
j
Nayag
arh
Nim
para
Odag
aon
Papunki
Phir
ing
ia
Puri
Rag
hunat…
Rajg
hat
Ram
pur
Sale
pur
Sukin
da
Telk
oi
Tig
iria
Tir
ing
OBS IMD
Model
24-hr accumulated rainfall (cm) during landfall day for TC PHAILIN
(Verification at 108 stations)
RMSE=7 cm
At most of the stations, model underestimated the rainfall. When compared with TRMM rainfall, Model overestimates the rainfall

IIT-BBS Storm Surge Prediction for TC PHAILIN
(84 Hours in Advance of Landfall)

Time series of Surge at different location along the
coast (TC PHAILIN)
15
PEAK SURGE ELEVATIONS AT THE BOUNDARY (IC:2013100912)
0
0.5
1
1.5
2
2.5
3
3.5
Vis
ha
kh
ap
atn
am
Srik
ak
ulu
m
La
nd
fall
Go
pa
lpu
r
Pu
ri
Pa
rad
ip
Dh
am
ara
Ch
an
dip
ur
§
2.24
2.933.18
2.55
-1
0
1
2
3
60 70 80 90
Time (hrs)
Sea s
urf
ace e
levati
on
(m
)
Left_LF
Landfall
Gopalpur
Puri

Visakhapatnam Airport
Disaster of “TC Hudhud” in
Visakhapatnam, India

Mean Track (km) and Intensity (Knots) Errors M
ea
n t
rac
k e
rro
rs (
km
)
Me
an
In
ten
sit
y E
rro
rs (
Kn
ots
)
HUDHUD Forecast (12 UTC 8 – 12 UTC 11 Oct 2014)
Landfall between 6-9 UTC 12 Oct 2014
with intensity of very severe cyclonic
storm (100 knots)
source: IMD
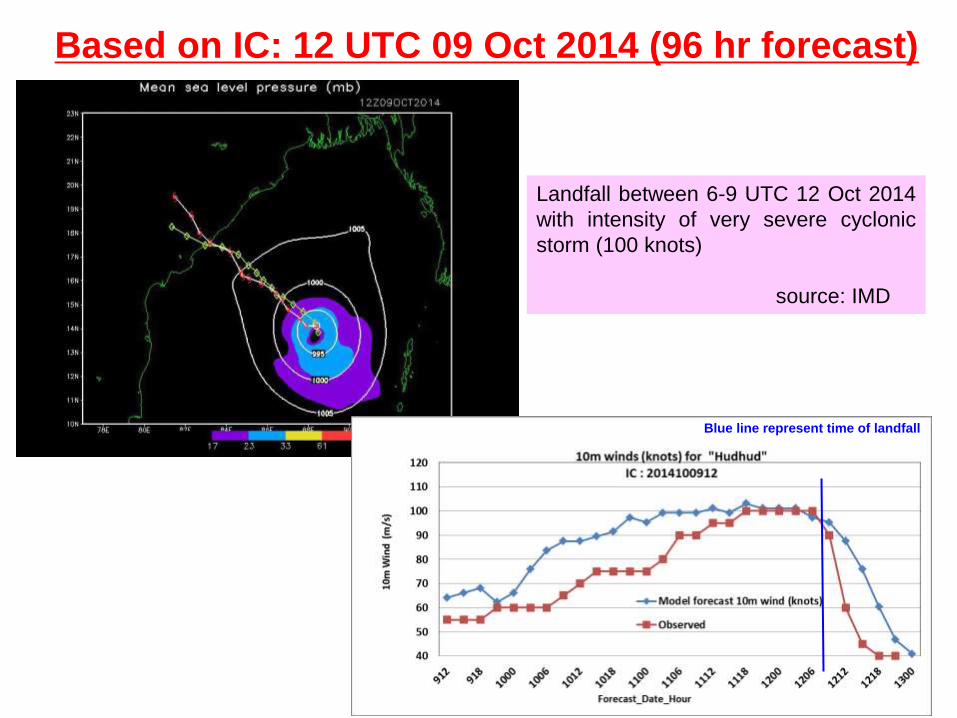
Based on IC: 12 UTC 09 Oct 2014 (96 hr forecast)
Landfall between 6-9 UTC 12 Oct 2014
with intensity of very severe cyclonic
storm (100 knots)
source: IMD
Blue line represent time of landfall

based on IC: 00 UTC 11 Oct 2014 (36 hr forecast)

24-hr accumulated rainfall prediction in real time
TRMM rainfall
Model predictions
96h fcst 72h fcst 48h fcst 24h fcst

24-hr accumulated rainfall (cm) during landfall day for HudHud
(Verification at 103 stations)
RMSE: 8 cm CC : 0.25
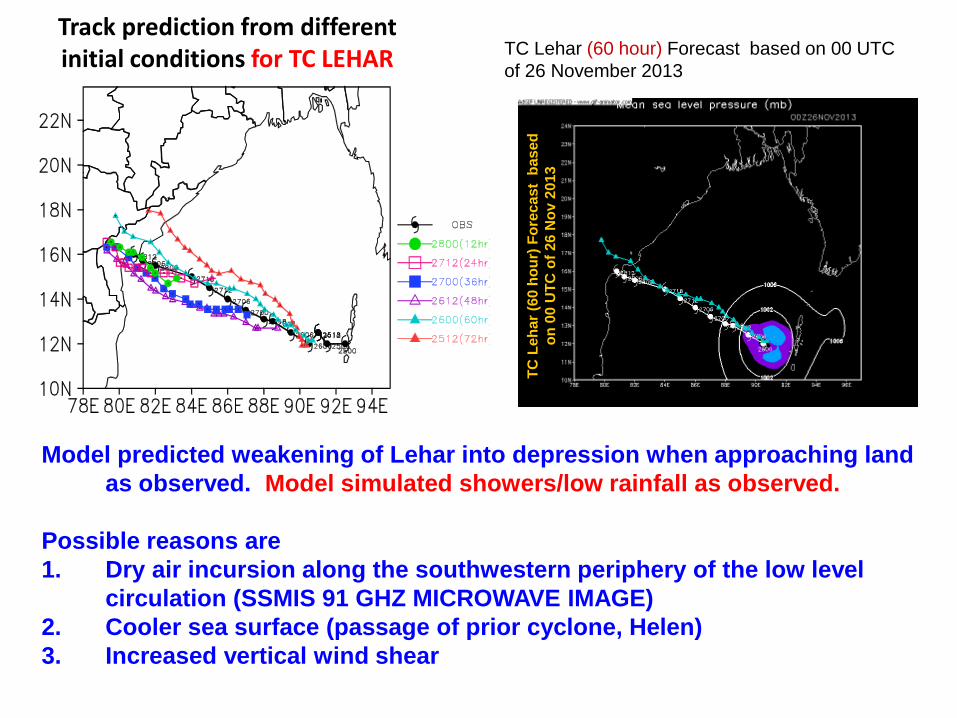
Track prediction from different initial conditions for TC LEHAR
Model predicted weakening of Lehar into depression when approaching land
as observed. Model simulated showers/low rainfall as observed.
Possible reasons are
1. Dry air incursion along the southwestern periphery of the low level
circulation (SSMIS 91 GHZ MICROWAVE IMAGE)
2. Cooler sea surface (passage of prior cyclone, Helen)
3. Increased vertical wind shear
TC Lehar (60 hour) Forecast based on 00 UTC
of 26 November 2013
TC
Leh
ar
(60 h
ou
r) F
ore
ca
st
bas
ed
on
00 U
TC
of
26 N
ov 2
01
3

VSCS “Madi” over Bay of Bengal (8 – 12 Dec 2013)
TC Madi (96 hour) Forecast based
on 12 UTC of 08 December 2013
Model predicted sudden return and weakening of Madi. It intensified to very severe cyclonic storm stage (64 – 119 knots) while moving northward till 12UTC 10 Dec.2013 After that, it suddenly returned back and started moving in southwest ward. It started loosing its intensity and reached to depression stage (<33knots) within one day.
Madi's pole ward track was explained by
the strong subtropical ridge located to the
east of the system.
Another subtropical ridge located over
India had steered the system
southwestward. On December 11, Madi's
LLCC became clearly exposed after dry air
wrapped around the southern part of the
system. This weakened Madi into a
Cyclonic Storm
OBSERVATIONAL facts

Mean track errors for NIO cyclones during 2007 - 2011
(under operational setup)
These error statistics are based on 100 TC cases
Initial cyclone vortex position error is
about 60 km
Recent cyclone Giri (20-22 Oct 2010)
Observed TC Location
Model TC Location
Mean Intensity Errors (10m winds m/s) Mean Errors for NIO TCs with different resolutions
11
3
14
0
18
6
24
8
31
6
37
5
10
6
12
9
16
9
22
2
29
1
35
9
10
4
11
5
14
1
20
4
27
4
32
9
0
100
200
300
400
500
12 24 36 48 60 72Forecast length (hour)
Me
an
DP
E (
km
)
27 km 18 km 9 km
Mean Errors for NIO TCs with different resolutions
-10
-11
-12
-13
-13
-12
-11
-10 -9 -8 -6 -6-8 -7 -8 -8 -8 -7 -7 -6 -6 -5 -4 -4
23
38
36 4
0
39 42
39 42
40 42
38
36
-25
-20
-15
-10
-5
0
5
10
6 12 18 24 30 36 42 48 54 60 66 72
Forecast length (hour)
Me
an
DP
E (
km
)
-55
-45
-35
-25
-15
-5
5
15
25
35
45
18 km 9 km % of improvement
Osuri et al. 2013, JAMC

Errors for recurving TCs
74
13
1
16
4
23
1
30
8
38
2
44
0
69
.03
12
8
14
9
22
0
28
4
34
7
41
3
65
10
9
12
8
19
3
24
5
33
0
39
0
0
100
200
300
400
500
600
700
0 12 24 36 48 60 72Forecast length (hour)
Me
an
DP
E (
km
)
27 km 18 km 9 km
Mean errors w.r.t Intensity at initialization at 27 km
resolution
81
13
1
17
6
21
1
30
0
33
4
42
1
60
11
8
14
6
20
1
28
5
32
9
41
2
51
92
12
9
16
5
23
3
26
4
33
0
0
100
200
300
400
500
600
700
0 12 24 36 48 60 72
Forecast length (hour)
Me
an
DP
Es
(k
m)
DD CS SCS
Mean errors for
recurving TCs
Mean track errors w.r.t
intensity at initialization
Improvement is significant
with high resolution for
recurving TCs.
Stronger cyclones can be
tracked with minimum errors
compared to marginal
cyclones or depressions.
0
0.05
0.1
0.15
0.2
0.25
0
2
4
6
8
10
12
14
16
25 50 75 100 125 150 175 200
ET
S
Bia
s
Thresholds (mm)
ETSBias
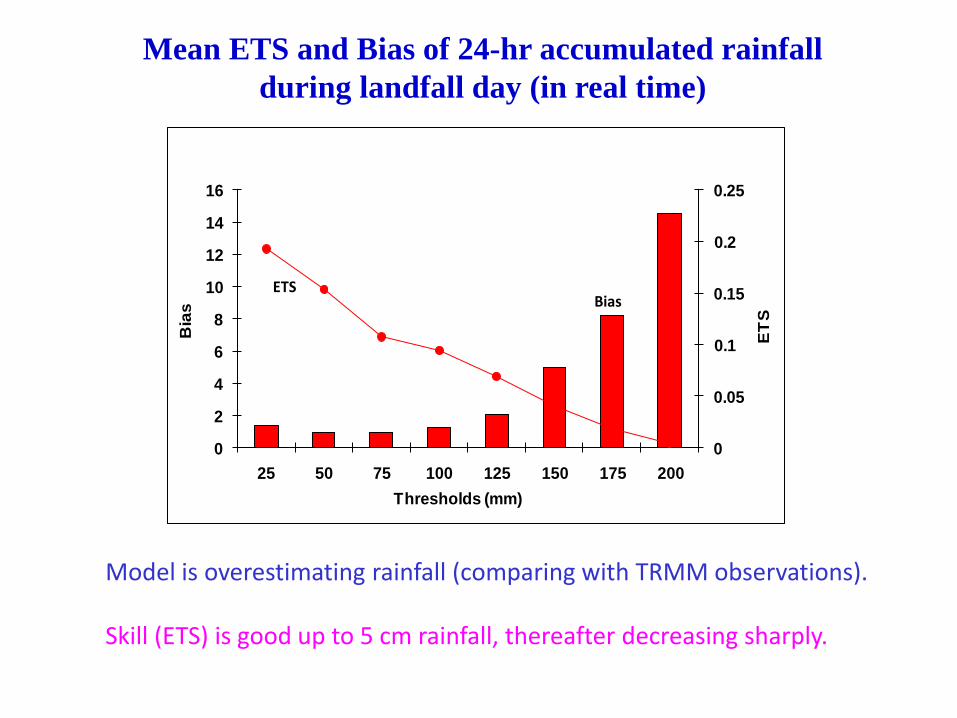
Mean ETS and Bias of 24-hr accumulated rainfall
during landfall day (in real time)
Model is overestimating rainfall (comparing with TRMM observations). Skill (ETS) is good up to 5 cm rainfall, thereafter decreasing sharply.
Impact of Satellite derived winds
Assimilation on Track and
Intensity
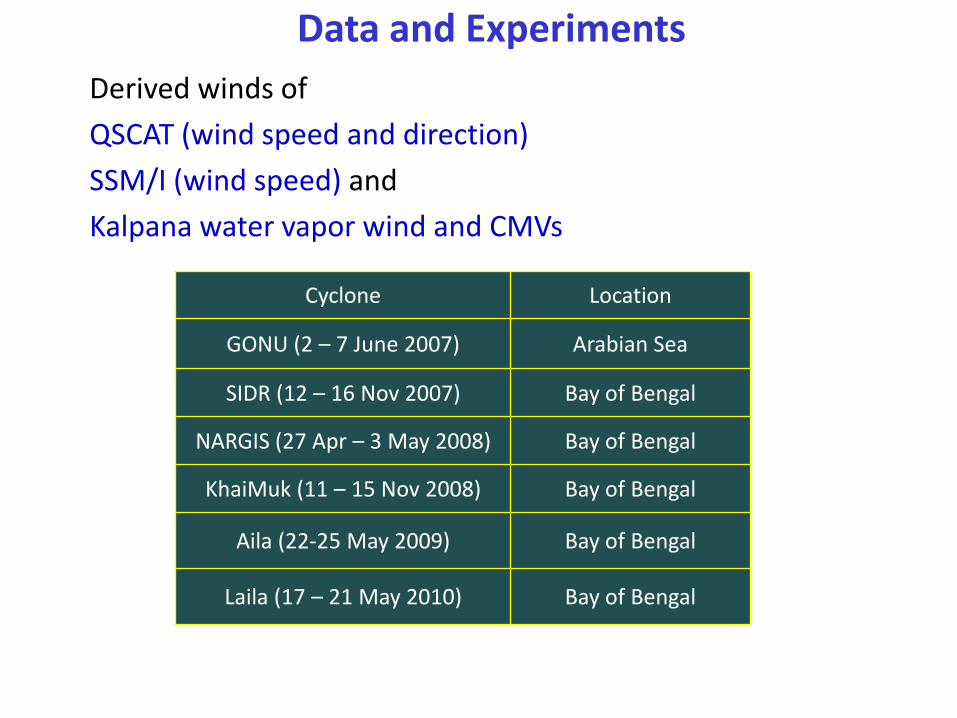
Derived winds of
QSCAT (wind speed and direction)
SSM/I (wind speed) and
Kalpana water vapor wind and CMVs
Cyclone Location
GONU (2 – 7 June 2007) Arabian Sea
SIDR (12 – 16 Nov 2007) Bay of Bengal
NARGIS (27 Apr – 3 May 2008) Bay of Bengal
KhaiMuk (11 – 15 Nov 2008) Bay of Bengal
Aila (22-25 May 2009) Bay of Bengal
Laila (17 – 21 May 2010) Bay of Bengal
Data and Experiments

o 2851 SSMI 2008042812
(b)
3374 QSCAT 2008042812 .
Satellite derived wind ingested into the model initial condition of TC NARGIS
o 377 Kalpana WV and CMVs
SSMI, QSCAT and Kalpana winds for 12 UTC of 28 April 2008
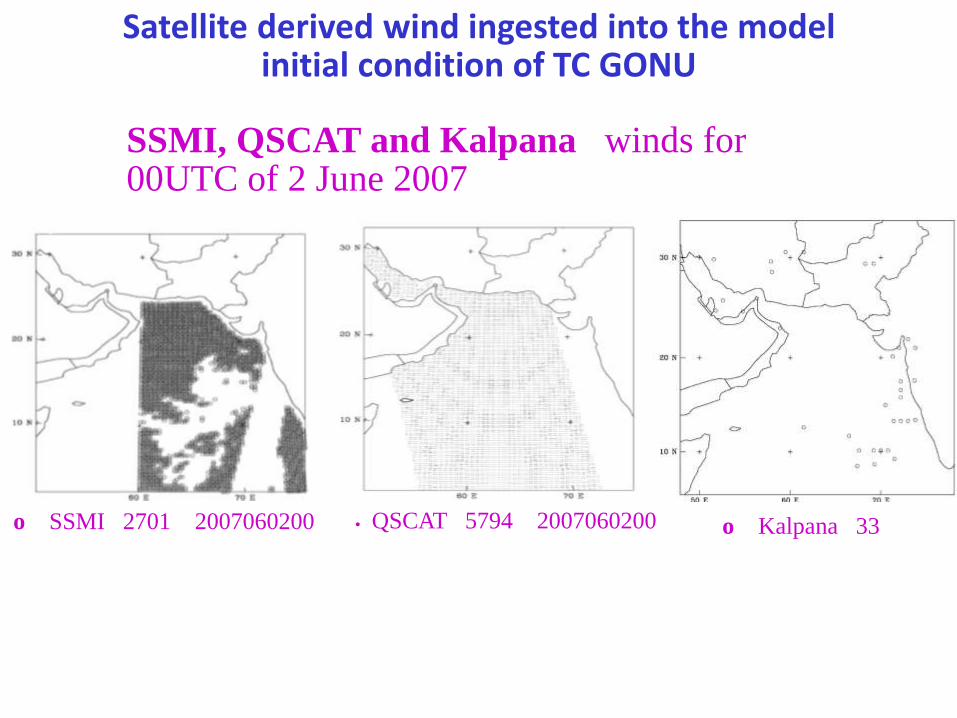
. QSCAT 5794 2007060200 o SSMI 2701 2007060200
Satellite derived wind ingested into the model initial condition of TC GONU
o Kalpana 33
SSMI, QSCAT and Kalpana winds for 00UTC of 2 June 2007

CNTL NARGIS 3DVAR
CNTL GONU 3DVAR
IC: 00UTC of 2 June 2007
Forecast length (hour) 2
4 c
ase
s M
ea
n V
DE
s (
km
)
120 1
76
199
291
261
327 366 4
25
99 1
32
157
228
169
176
199
224
0
50
100
150
200
250
300
350
400
450
12 24 36 48 60 72 84 96
CasesM
ea
n V
DE
s (
km
)
CNTL
3DVAR
1
0 m
win
d (
m s
-1)
IC: 00UTC of 2 June 2007
0
10
20
30
40
50
60
70
0200 0312 0500 0612 0800
Time (datehour)
10
m w
ind
(m
s-1
)
Time (ddhh)
GONU case IC: 12UTC of 28 April 2008
930
950
970
990
1010
28_12 29_12 30_12 01_12 02_12
Time (date_hour)
MS
LP
(h
Pa)
IMD
CNTL
3DVAR
Wind field at 925 hPa
Osuri et al., 2012, IJRS
Impact of Satellite winds on track and intensity of cyclones
An average 8 m/s error is improved in 3DVAR run
compared to CNTL run.

24-hr accumulated rainfall valid for landfall day (2-3 May 2008) for TC NARGIS
IC: 12UTC of 28 April
(c) 3DVAR (b) CNTL
(a) TRMM
30
24
18
12
8
4
1
cm
Improved track leads to improvement in rainfall structure with satellite data

Mean at landfall
0
1
2
3
4
5
6
7
25 50 75 100 125 150 175
Thresholds (mm)
Bia
s
0
0.05
0.1
0.15
0.2
0.25
0.3
0.35
ET
S
CNTL(Bias)
3DVAR(Bias)
CNTL(ETS)
3DVAR(ETS)
Mean (of 5 cases) ETS and Bias of 24-hr accumulated rainfall (mm) valid for landfall day
ETS - Lines Bias - histograms

24-hr accumulated rainfall valid for landfall day for SuCS GONU
Lan
dfa
ll o
ver
Om
an
6 –
7 J
un
e 2
00
7
Lan
dfa
ll o
ver
Iran
7
– 8
Ju
ne
20
07
30
24
18
12
8
4
1
cm
GONU has two landfalls 1) over Oman and 2) over Iran

0
5
10
15
20
25
25 50 75 100 125 150 175 200
Thresholds (mm)
Bia
s
0
0.1
0.2
0.3
0.4
ET
S
CNTL (Bias)
3DVAR (Bias)
CNTL (ETS)
3DVAR (ETS)
Mean (of 5 cases) ETS and Bias of 24-hr accumulated rainfall (mm) valid for landfall
ETS - Lines Bias - histograms

TRMM CNTL 3DVAR
24-hr accumulated rainfall valid for landfall day for SIDR (15 – 16 Nov 2007)
In Sidr case, the initial vortex is completely covered by QSCAT path.

Impact of DWR reflectivity and radial wind
on the rainfall prediction of
landfalling Tropical Cyclones over Bay of Bengal
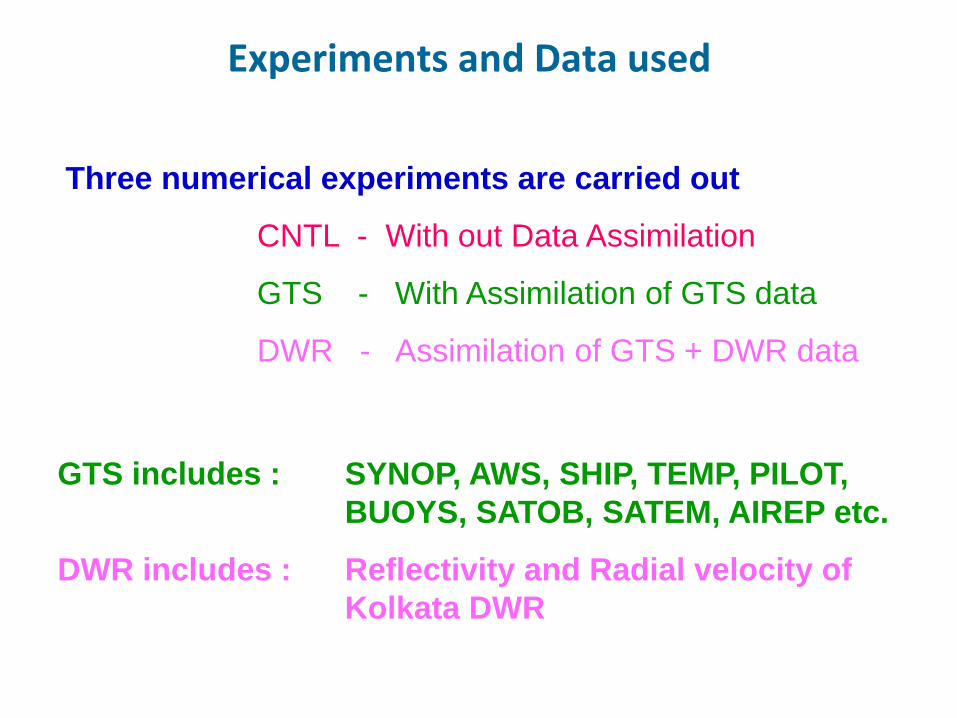
Experiments and Data used
Three numerical experiments are carried out
CNTL - With out Data Assimilation
GTS - With Assimilation of GTS data
DWR - Assimilation of GTS + DWR data
GTS includes : SYNOP, AWS, SHIP, TEMP, PILOT,
BUOYS, SATOB, SATEM, AIREP etc.
DWR includes : Reflectivity and Radial velocity of
Kolkata DWR

Cyclone
Name Cases Initial conditions
Data
density
Radar
Coverage
SIDR (Very
severe
cyclone)
Case–1 00 UTC of 13 Nov 2007 1911
Kolkata
DWR
Case–2 12 UTC of 13 Nov 2007 1868
Case–3 00 UTC of 14 Nov 2007 2702
Case–4 12 UTC of 14 Nov 2007 2657
Aila (Severe
cyclone)
Case–5 00 UTC of 23 May 2009 1995
Kolkata
DWR
Case–6 12 UTC of 23 May 2009 2467
Case–7 00 UTC of 24 May 2009 1937
Case–8 12 UTC of 24 May 2009 1869
Laila
(Severe
cyclone)
Case–9 12 UTC of 17 April 2010 1800
Chennai
DWR
Case–10 00 UTC of 18 April 2010 2556
Case–11 12 UTC of 18 April 2010 2532
Case–12 00 UTC of 19 April 2010 2300
Case–13 12 UTC of 19 April 2010 2433
Jal (Severe
cyclone)
Case–14 00 UTC of 6 Nov 2010 1250 Chennai
DWR Case–15 12 UTC of 6 Nov 2010 2364
Case–16 00 UTC of 7 Nov 2010 1950
80 E 90 E 100 E
30 N
20 N
10 N
EQ
2187 QSCAT
80 E 90 E 100 E
3239 SSMI
80 E 90 E 100 E
45 AIREP
80 E 90 E 100 E
54 SOUND
80 E 90 E 100 E
38 METAR
30 N
20 N
10 N
EQ 80 E 90 E 100 E
178 SYNOP
25 N
24 N
23 N
22 N
21 N
20 N
19 N 85E 86E 87E 88E 89E 90E 91E 92E
Kolkata DWR
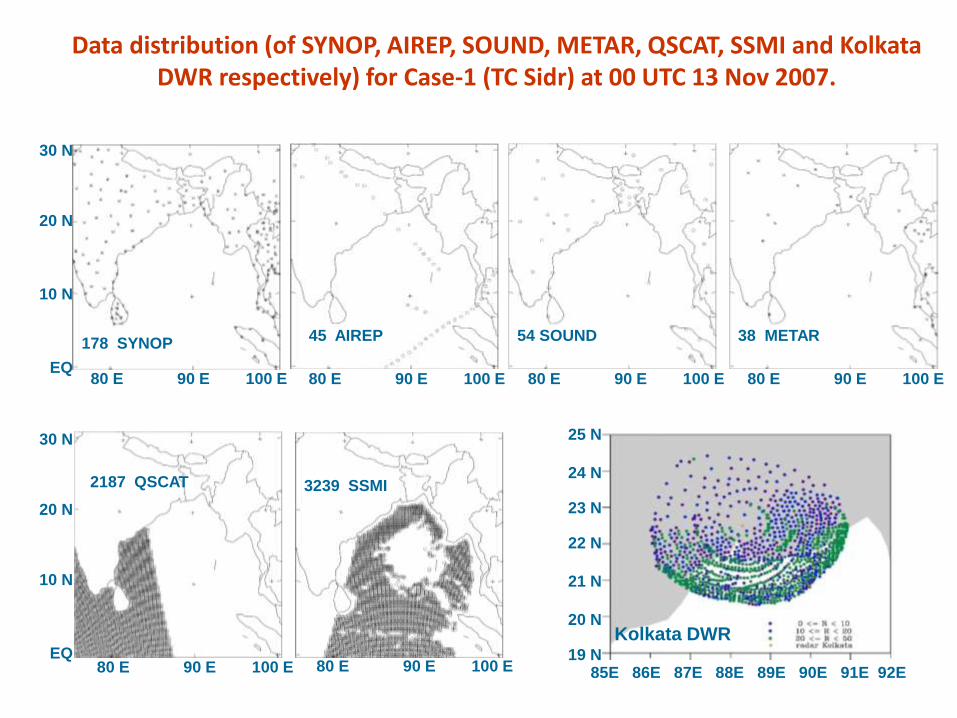
Data distribution (of SYNOP, AIREP, SOUND, METAR, QSCAT, SSMI and Kolkata DWR respectively) for Case-1 (TC Sidr) at 00 UTC 13 Nov 2007.

80 E 90 E 100 E
30 N
20 N
10 N
EQ
1923 SSMI
80 E 90 E 100 E
736 SATOB
80 E 90 E 100 E
33 AIREP
80 E 90 E 100 E
54 SOUND
80 E 90 E 100 E
41 METAR
30 N
20 N
10 N
EQ 80 E 90 E 100 E
204 SYNOP
16 N
15 N
14 N
13 N
12 N
11 N
10 N
9 N 77E 78E 79E 80E 81E 82E 83E 84E
Chennai DWR:
Data distribution (of SYNOP, AIREP, SOUND, METAR, QSCAT, SSMI and Kolkata DWR respectively) for Case-14 (TC Jal) at 00 UTC 6 Nov 2010.

As the rainfall structure and intensity prediction of Sidr is poorly predicted by the ARW model, this case is taken up to study the impact of DWR observations.
The cloud bands are observed by DWR Kolkata though it is far away from the DWR station and of course, when it approaches, the inner-core details are observed by the DWR.
Therefore, the experiments are conducted in two scenarios:
1. Impact of TC environment observed by the DWR on TC prediction
2. TC Inner-core observations on TC prediction

CN
TL (
No
Ass
imila
tio
n
GTS
dat
a A
ssim
ilati
on
DW
R+G
TS A
ssim
ilati
on
IMD Best track
CASE-1

TC-SIDR
10
15
20
25
30
35
40
45
50
55
60
1300 1312 1400 1412 1500 1512 1600 1612
Forecast hour (hrs)
10-m
win
d (
m/s
)
OBS CNTLGTS DWR
10m wind speed (m/s)
Time (date hour)
Assimilation of DWR TC environment observations

cm (b)
(c)
(d)
(a) TRMM CNTL GTS DWR
SIDR (15–16 Nov 2007)
AILA (25–26 May 2009)
Laila (20–21 May 2010)
Jal (7–8 Nov 2010
24-hr accumulated rainfall valid for landfall day

CASE – 1 (SIDR)
CASE – 5 (Aila)
Model simulated Reflectivity along with Observed
reflectivity

Assimilation of Inner-core observations from DWRs

CNTL DWR
TC symbol: Observed location of TC Laila at 12UTC 19 May 2010
Plus symbol: 6-hr cycled model generated initial vortex
CNTL simulated cyclone is continuously intensifying without landfall
While, DWR system showed improvement in track and landfall
Laila cyclone: Initial vortex position and structure
10-m winds (m/s)

winds
W vel &
Temp Anamoly
Titled vortex is improved with DWR observations, while both CNTL and GTS runs could not.
Warm core structure is also improved with DWR observations
CNTL GTS DWR
Laila cyclone: Inner-core improvements with DWR obs
TRMM CNTL GTS DWR
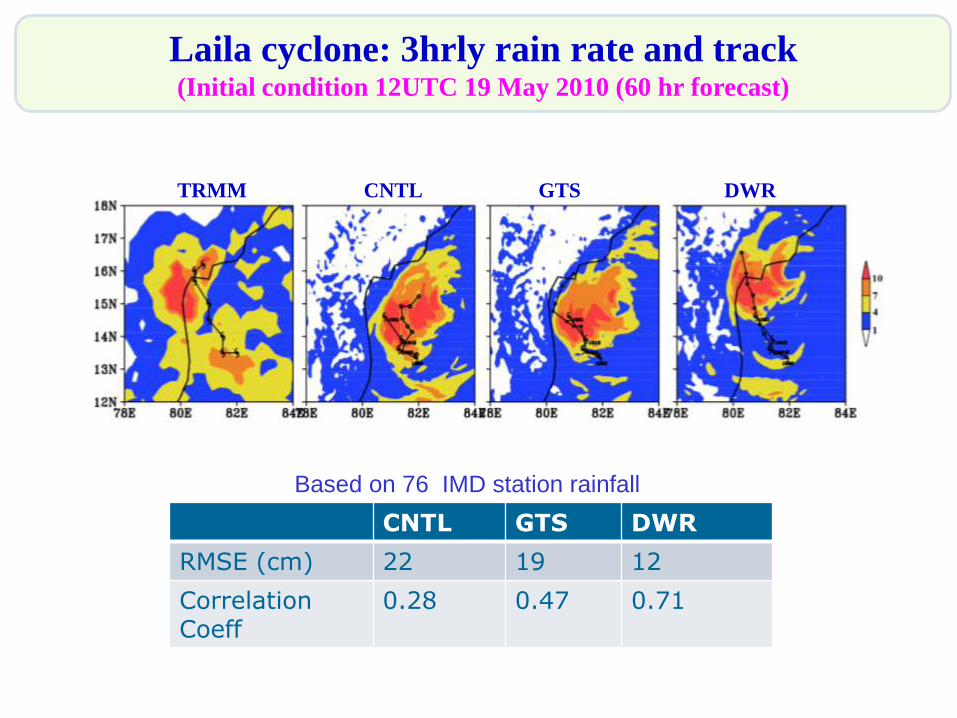
Laila cyclone: 3hrly rain rate and track (Initial condition 12UTC 19 May 2010 (60 hr forecast)
CNTL GTS DWR
RMSE (cm) 22 19 12
Correlation Coeff
0.28 0.47 0.71
Based on 76 IMD station rainfall

Impact of Microphysics: Inner-core Reflectivity
assimilation on Hydrometeors structure
WarmRain_Microphysics IcePhase_Microphysics
CNTL (no-data assimilation) Inner-core Reflectivity assimilation
contours (cloud water Mixing ratio); shaded (Rain water mixing ratio)

Impact of Microphysics: Inner-core Reflectivity
assimilation on Rainfall structure
CNTL
Reflectivity
Assimilation
CNTL
Reflectivity
Assimilation
TRMM Rainfall
WarmRain_Microphysics IcePhase_Microphysics
WarmRain_Microphysics IcePhase_Microphysics

Statistics based on 76 rainfall stations Warm-CNTL Ice-CNTL Warm-DWR Ice-DWR
Mean RMSE 17.4 15.0 13.5 8.05
Correlation -0.28 0.14 -0.21 0.44
Station Name Lat Long OBS Rain Warm-CNTL Ice-CNTL Warm-DWR Ice-DWR
Addanki 15.8 80.0 52 0 0 19 20
Bollapalli 15.9 80.1 20 0 0 16 14
Chimakurty 15.6 79.9 27 0 0 14 27
Darsi 15.8 79.7 18 0 0 11 20
Jarugaumalli 15.3 80.0 15 0 0 17 14
Kondepi 15.4 79.9 16 0 0 13 21
Korisapadu 15.8 80.0 15 0 1 17 16
Kothapatnam 15.4 80.2 26 0 0 15 18
Kurichedu 15.9 79.6 15 0 0 14 21
Maadipadu 15.6 80.0 28 0 1 16 24
Machavaram 16.5 80.7 19 0 0 5 16
Mangalagiri 16.4 80.6 15 0 0 4 10
N. G. Padu 15.6 80.1 17 0 0 16 16
Nakirekkallu 17.2 79.4 17 0 0 10 11
S.N. Padu 15.5 79.9 27 0 0 14 17
Savalyapuram 16.1 79.8 23 0 0 18 21
Tadepalle 16.8 81.5 18 0 2 0 9
Tallur 16.5 80.1 26 0 0 13 16
Vinukonda 16.0 79.7 25 0 0 20 23
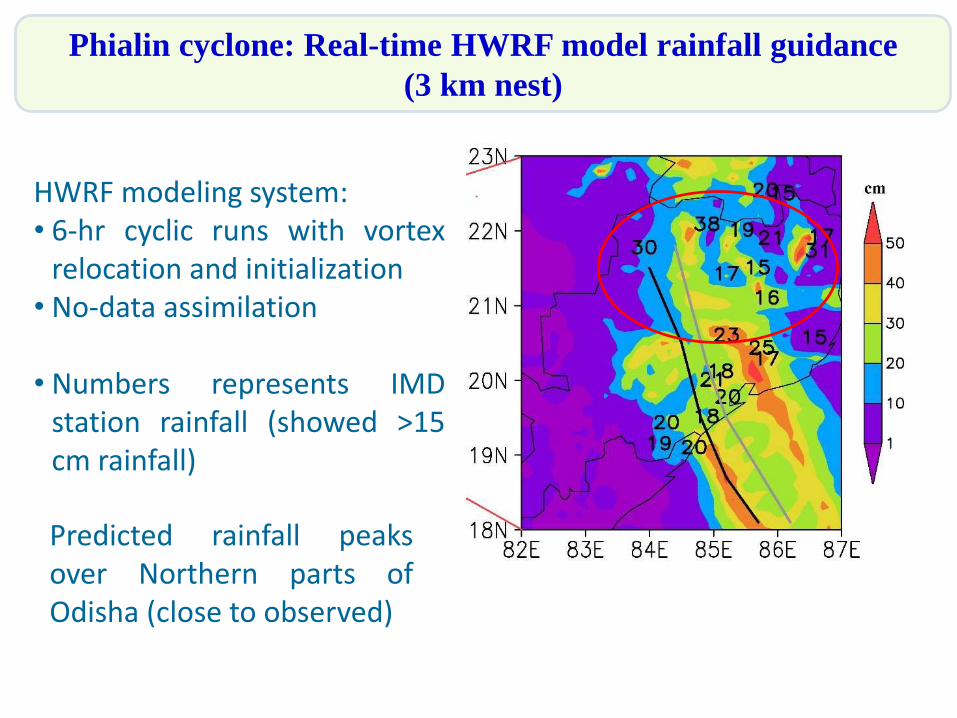
Phialin cyclone: Real-time HWRF model rainfall guidance
(3 km nest)
Predicted rainfall peaks over Northern parts of Odisha (close to observed)
HWRF modeling system: • 6-hr cyclic runs with vortex
relocation and initialization • No-data assimilation
• Numbers represents IMD
station rainfall (showed >15 cm rainfall)

The NWP model performance for the prediction of heavy rainfall due to landfalling Cyclones can be improved with mesoscale data assimilation Assimilation of DWR reflectivity and radial wind showed maximum impact on heavy rainfall simulation.
Improved track prediction correct the rainfall structure up to some extent, Needs further investigation.
Cloud resolving model is certainly a solution. Multi DWR data assimilation and Improved land surface conditions can further improve rainfall prediction
CONCLUSIONS

Thank You