Uncertainty Assessment of Optical Distance Measurements at ...
9
HAL Id: hal-02448852 https://hal-cnam.archives-ouvertes.fr/hal-02448852 Submitted on 11 Feb 2020 HAL is a multi-disciplinary open access archive for the deposit and dissemination of sci- entific research documents, whether they are pub- lished or not. The documents may come from teaching and research institutions in France or abroad, or from public or private research centers. L’archive ouverte pluridisciplinaire HAL, est destinée au dépôt et à la diffusion de documents scientifiques de niveau recherche, publiés ou non, émanant des établissements d’enseignement et de recherche français ou étrangers, des laboratoires publics ou privés. Uncertainty Assessment of Optical Distance Measurements at Micrometer Level Accuracy for Long-Range Applications Joffray Guillory, Maylis Teyssendier de la Serve, Daniel Truong, Christophe Alexandre, Jean-Pierre Wallerand To cite this version: Joffray Guillory, Maylis Teyssendier de la Serve, Daniel Truong, Christophe Alexandre, Jean-Pierre Wallerand. Uncertainty Assessment of Optical Distance Measurements at Micrometer Level Accuracy for Long-Range Applications. IEEE Transactions on Instrumentation and Measurement, Institute of Electrical and Electronics Engineers, 2019, 68 (6), pp.2260-2267. 10.1109/TIM.2019.2902804. hal-02448852
Transcript of Uncertainty Assessment of Optical Distance Measurements at ...

HAL Id: hal-02448852https://hal-cnam.archives-ouvertes.fr/hal-02448852
Submitted on 11 Feb 2020
HAL is a multi-disciplinary open accessarchive for the deposit and dissemination of sci-entific research documents, whether they are pub-lished or not. The documents may come fromteaching and research institutions in France orabroad, or from public or private research centers.
L’archive ouverte pluridisciplinaire HAL, estdestinée au dépôt et à la diffusion de documentsscientifiques de niveau recherche, publiés ou non,émanant des établissements d’enseignement et derecherche français ou étrangers, des laboratoirespublics ou privés.
Uncertainty Assessment of Optical DistanceMeasurements at Micrometer Level Accuracy for
Long-Range ApplicationsJoffray Guillory, Maylis Teyssendier de la Serve, Daniel Truong, Christophe
Alexandre, Jean-Pierre Wallerand
To cite this version:Joffray Guillory, Maylis Teyssendier de la Serve, Daniel Truong, Christophe Alexandre, Jean-PierreWallerand. Uncertainty Assessment of Optical Distance Measurements at Micrometer Level Accuracyfor Long-Range Applications. IEEE Transactions on Instrumentation and Measurement, Instituteof Electrical and Electronics Engineers, 2019, 68 (6), pp.2260-2267. �10.1109/TIM.2019.2902804�.�hal-02448852�

1
Abtract—We have developed a transportable distance meter
based on a 1550 nm laser diode that is intensity modulated at 5
GHz. This fiber-based prototype is realized using
telecommunication components that are reliable, largely available
and affordable. We have identified and quantified the different
sources of error when measuring with this technique a distance
between two positions of a same reflector. Minimizing these errors
and evaluating their uncertainties lead to a global uncertainty of 4
µm (k=1) up to 1 km. This value does not include the additional
errors caused by the evaluation of the atmospheric parameters.
This uncertainty has then been verified over 100 m by comparison
with an optical interferometer. The prototype was also tested
outdoors over 5.4 km and has shown a resolution of 25 µm for an
integration time of 10 ms. Distance measurements for long
distances with this prototype are still limited by the air refractive
index effect. Nevertheless, we have demonstrated that the
uncertainty on optical distances reached with this simple
technique is compatible with a future development of a two-
wavelength system with air index compensation.
Index Terms— Absolute Distance Measurement, Air refractive
index, Intensity modulation, Long-distance telemetry, Phase-
based distance measurement.
I. INTRODUCTION
CCURATE absolute distance measurements over several
kilometers are of great interest for several applications
such as the construction and surveying of huge structures, for
instance dams, colliders [1], tunnels [2], or geological faults [3].
Nowadays, the most accurate commercial optical Absolute
Distance Meters (ADMs) used for these applications claim a
standard uncertainty of 0.6 mm + 1 ppm up to 1 km (see
manufacturers specifications). Nevertheless, in the 1990’s,
better performances have been reached with the Mekometer
ME5000 from the former Kern company [2]. This instrument,
no longer manufactured, but still used by several geodetic
institutes, can achieve an accuracy (coverage factor, k=1) of 75
µm + 0.5 ppm, i.e. 575 µm at 1 km, with a recording of
meteorological conditions at each end of the line, and under
favorable atmospheric conditions [2]. However, for distances of
several kilometers, millimetric accuracy cannot be reached with
J. Guillory, D. Truong and J.-P. Wallerand are with Laboratoire commun de
métrologie LNE-CNAM, 1 rue Gaston Boissier, 75015 Paris, FR (email:
[email protected]). C. Alexandre is with Centre d’Etudes et de Recherche en Informatique et
Communications (CEDRIC), CNAM, 292 rue Saint Martin, 75003 Paris, FR.
classical Electronic Distance Meters (EDM) due to the
determination of the air refractive index: an accuracy of 1 mm
over 5 km implies a knowledge of the average temperature
along the optical path at 0.2 ºC, and of the average pressure at
75 Pa, which is in practice impossible to achieve with classical
sensors, especially for air temperature.
To overcome this physical limitation a two-wavelength
approach has been early proposed [5] and implemented [6,7]. A
commercial version was even manufactured in a few copies in
the 1990’s [8]. Its physical principle is based on the knowledge
of the model of the air index dispersion: measuring
simultaneously optical distances with two different
wavelengths allows to deduce the geometric distance, without
the need to measure air temperature and atmospheric pressure.
If we call D the true distance, L1 and L2 the optical distances
(defined as the product of the geometric lengths by the air
indexes n) at the wavelengths and , respectively, D is given
by:
1221112
12
11 ),( LLALLL
nn
nLD
airdry
(1)
with A a factor independent of atmospheric parameters under
assumption of dry air, a limit case giving a good approach of
the principle. A only depends on the couple of wavelengths
used. Formula (1) shows the price to pay to apply this method
efficiently: the A factor amplifies the uncertainty of the
difference L2-L1. Therefore, to obtain a given uncertainty uD on
the true distance, the optical path difference L2-L1 must be
determined with an uncertainty A times lower than the targeted
uncertainty. This A factor is equal to 47 for the couple of wavelengths 780
nm / 1550 nm, when group index is relevant [7]. Thus, to obtain
a sub-millimetric uncertainty on the true distance for this couple
of wavelengths, the uncertainty on the optical path difference
L1-L2 must be better than 20 μm. This performance is far from
being achieved with classical EDM instruments, even when
only dealing with the optical distances (i.e. without air index
determination), especially for distances of several kilometers.
The challenge lies in finding a technical solution enabling a
M. Teyssendier de la Serve is with Institut National de l’information
Géographique et forestière (IGN) , 73 avenue de Paris, 94165 Saint Mandé
Cedex, FR.
Uncertainty assessment of optical distance
measurements at micrometer level accuracy for
long-range applications
J. Guillory, M. Teyssendier de la Serve, D. Truong, C. Alexandre, and J.-P. Wallerand
A

2
good compromise between accuracy of optical distance
measurements at each wavelength, robustness of the system,
cost efficiency and ability to measure over several kilometers,
outdoors, in field conditions.
Many techniques have already been implemented for high
accuracy optical distance measurements, including two-colour
principle. Femto-second lasers have been widely used in recent
years, either as high frequency modulators [9,10] or as
multiwavelength generators for interferometry [11,12,13,14],
time-of-flight measurements [15], or combination of optical
interferometry and time-of-flight methods [16]. These
techniques can basically resolve one optical wavelength for
overcoming fringe ambiguity and so open the way to absolute
distance measurements with nanometer accuracy. Nevertheless,
they remain expensive and difficult to implement in an
instrument made for field measurements. Recently,
demonstration of interferometry with simultaneous
measurements at two wavelengths, 532 nm and 1064 nm, was
realized outdoors, showing sub-millimeter accuracy over 800 m
[17].
In this paper, the telemetric system we present is based on
the measurement of the RF phase of an intensity-modulated
laser diode after propagation in air. The use of fiber-optic
components of the telecommunication industry makes possible
the production of a compact, easy-to-use and affordable
instrument. This work is a first step towards the achievement of
an air refractive index compensated system for applications in
the field. Fig. 1 and 2 provide an overview of the developed
ADM, and of its compact design. We have quantified the
different sources of errors of this telemeter when measuring an
optical distance, i.e. the product of the air refractive index by
the mechanical distance. The resulting uncertainty budget refers
to the instrument itself and does not take into account the
atmospheric parameters and the mechanical offset of the
telemeter.
Fig. 1. Photograph of the ADM mounted on a tripod.
Fig. 2. Cross-section view of the optical head and of a hollow corner
cube with a clear aperture of 127 mm.
II. PRINCIPLE AND IMPLEMENTATION OF THE ADM
PROTOTYPE.
The ADM is based on the measurement of the phase shift ϕ
of a modulation frequency along a measurement path. As
shown by formula (2), this phase shift is proportional to the
distance L travelled by light:
RFfn
ckL
22
1 (2)
with c the speed of light in vacuum, n the group refractive
index of air, fRF the modulation frequency, and k an integer
number, called order, and corresponding to the number of times
that the phase of the amplitude modulation has rotated by 2π
during the propagation.
The operation principle of the telemeter is basically the same
as the one described in our previous publication [18].
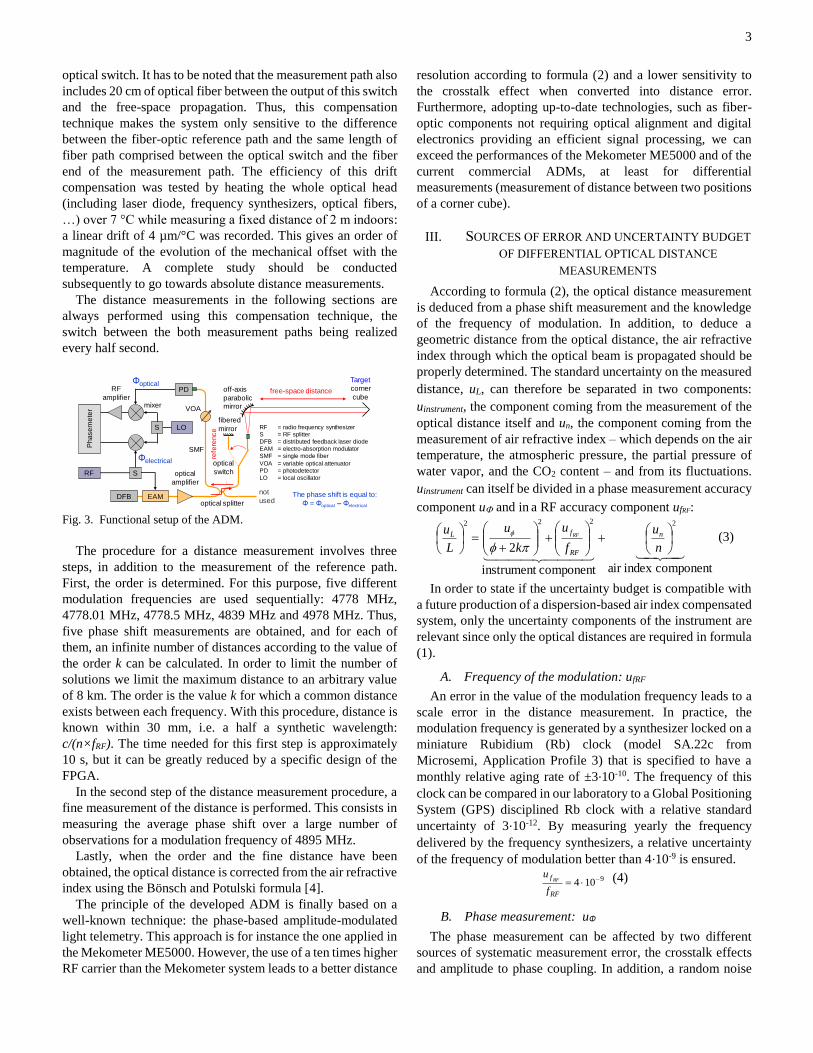
As depicted in Fig. 3, a 1550 nm optical carrier is emitted by
a Distributed FeedBack (DFB) laser diode and intensity
modulated by a RF carrier around 5 GHz thanks to a built-in
Electro-Absorption Modulator (EAM). This fiber-guided
optical signal is then emitted in free space and collimated by an
off-axis parabolic mirror for a long-distance propagation: the
spot size of 48 mm (at 1 % power level) is reflected back
towards the telemeter by a hollow corner cube. The returned
signal is finally directed towards a high-speed photodiode and
the phase of the photodetected RF signal is measured after a
frequency down-conversion at 10.75 MHz. A Variable Optical
Attenuator (VOA) sets the optical power received by the
photodetector around 50 µW to limit the amplitude to phase
coupling effect, as discussed in section III.B)2). Then RF
amplification stages adjust the RF power around 0 dBm for
optimum operation of the phasemeter. The phase measurement
is achieved digitally by a Field Programmable Gate Arrays
(FPGA) that integrates each individual phase measurement over
10 ms.
To compensate for phase variations in the fiber-optic and
electronic components, a fiber-optic reference distance of
around 20 cm is measured every second, then subtracted from
the free-space measurement. The switch from this reference
path to the measurement one is performed by a fiber-optic
FPGA-basedPhasemeter
Opticalhead
Leica carrier
GPSantenna
Finderscope
Off-axisparabolic
mirror
Poweradapter
15 VDC out
Weatherstation
RFsynthesizers
Opto-electronicsystem
Matlab graphicaluser interface
absolute distance betweentwo pillars40 mm
Finderscope
Off-axisparabolic
mirror
Fiber output(FC/APC
connector)
The opto-electronicsystem is located
on the optical head
Weatherstation
GPSantenna
Mounting base for asmall corner cube
Super-precisionball bearings forthe azimuth and
zenith axes
Customized LeicaGRT 247 carrier
Zenithscrew
Leica tribrachs
The Leica tribrachs are used to connect the EDM and its corner cube with the pillars
Spot sizeof 48 mm
Azimuthand zenith
brake knobs
ClearAperture
3
optical switch. It has to be noted that the measurement path also
includes 20 cm of optical fiber between the output of this switch
and the free-space propagation. Thus, this compensation
technique makes the system only sensitive to the difference
between the fiber-optic reference path and the same length of
fiber path comprised between the optical switch and the fiber
end of the measurement path. The efficiency of this drift
compensation was tested by heating the whole optical head
(including laser diode, frequency synthesizers, optical fibers,
…) over 7 °C while measuring a fixed distance of 2 m indoors:
a linear drift of 4 µm/°C was recorded. This gives an order of
magnitude of the evolution of the mechanical offset with the
temperature. A complete study should be conducted
subsequently to go towards absolute distance measurements.
The distance measurements in the following sections are
always performed using this compensation technique, the
switch between the both measurement paths being realized
every half second.
Fig. 3. Functional setup of the ADM.
The procedure for a distance measurement involves three
steps, in addition to the measurement of the reference path.
First, the order is determined. For this purpose, five different
modulation frequencies are used sequentially: 4778 MHz,
4778.01 MHz, 4778.5 MHz, 4839 MHz and 4978 MHz. Thus,
five phase shift measurements are obtained, and for each of
them, an infinite number of distances according to the value of
the order k can be calculated. In order to limit the number of
solutions we limit the maximum distance to an arbitrary value
of 8 km. The order is the value k for which a common distance
exists between each frequency. With this procedure, distance is
known within 30 mm, i.e. a half a synthetic wavelength:
c/(n×fRF). The time needed for this first step is approximately
10 s, but it can be greatly reduced by a specific design of the
FPGA.
In the second step of the distance measurement procedure, a
fine measurement of the distance is performed. This consists in
measuring the average phase shift over a large number of
observations for a modulation frequency of 4895 MHz.
Lastly, when the order and the fine distance have been
obtained, the optical distance is corrected from the air refractive
index using the Bönsch and Potulski formula [4].
The principle of the developed ADM is finally based on a
well-known technique: the phase-based amplitude-modulated
light telemetry. This approach is for instance the one applied in
the Mekometer ME5000. However, the use of a ten times higher
RF carrier than the Mekometer system leads to a better distance
resolution according to formula (2) and a lower sensitivity to
the crosstalk effect when converted into distance error.
Furthermore, adopting up-to-date technologies, such as fiber-
optic components not requiring optical alignment and digital
electronics providing an efficient signal processing, we can
exceed the performances of the Mekometer ME5000 and of the
current commercial ADMs, at least for differential
measurements (measurement of distance between two positions
of a corner cube).
III. SOURCES OF ERROR AND UNCERTAINTY BUDGET
OF DIFFERENTIAL OPTICAL DISTANCE
MEASUREMENTS
According to formula (2), the optical distance measurement
is deduced from a phase shift measurement and the knowledge
of the frequency of modulation. In addition, to deduce a
geometric distance from the optical distance, the air refractive
index through which the optical beam is propagated should be
properly determined. The standard uncertainty on the measured
distance, uL, can therefore be separated in two components:
uinstrument, the component coming from the measurement of the
optical distance itself and un, the component coming from the
measurement of air refractive index – which depends on the air
temperature, the atmospheric pressure, the partial pressure of
water vapor, and the CO2 content – and from its fluctuations.
uinstrument can itself be divided in a phase measurement accuracy
component u and in a RF accuracy component ufRF:
componentindexair component instrument
2
2222
n
u
f
u
k
u
L
u n
RF
fL RF
(3)
In order to state if the uncertainty budget is compatible with
a future production of a dispersion-based air index compensated
system, only the uncertainty components of the instrument are
relevant since only the optical distances are required in formula
(1).
A. Frequency of the modulation: ufRF
An error in the value of the modulation frequency leads to a
scale error in the distance measurement. In practice, the
modulation frequency is generated by a synthesizer locked on a
miniature Rubidium (Rb) clock (model SA.22c from
Microsemi, Application Profile 3) that is specified to have a
monthly relative aging rate of ±3·10-10. The frequency of this
clock can be compared in our laboratory to a Global Positioning
System (GPS) disciplined Rb clock with a relative standard
uncertainty of 3·10-12. By measuring yearly the frequency
delivered by the frequency synthesizers, a relative uncertainty
of the frequency of modulation better than 4·10-9 is ensured.
9104 RF
f
f
uRF (4)
B. Phase measurement: uΦ
The phase measurement can be affected by two different
sources of systematic measurement error, the crosstalk effects
and amplitude to phase coupling. In addition, a random noise
RF
LOS
S optical
amplifier
mixer
Phase
me
ter
RF
amplifierfree-space distance
Target
EAMDFBnot
used
corner
cube
Φelectrical
optical splitter
Φoptical
RF = radio frequency synthesizer
S = RF splitter
DFB = distributed feedback laser diode
EAM = electro-absorption modulator
SMF = single mode fiber
VOA = variable optical attenuator
PD = photodetector
LO = local oscillator
SMF
PD off-axis
parabolicmirrorVOA
optical
switch
fibered
mirror
The phase shift is equal to:
Φ = Φoptical – Φelectrical
refe
rence
4
limits the resolution of the telemeter for a given integration
time. The systematic measurement errors have been minimized
during the design phase of the instrument so that they do not
lead to correction. Nevertheless, measurement uncertainty on
these errors have been quantified. At the end, the uncertainty on
the phase measurement can be expressed as follow:
randomPMAMcrosstalk uuuLk
u2
/22
2
(5)
1) Crosstalk effect: ucrosstalk
A RF leakage of the modulation frequency from the emission
stages to the reception ones leads to the addition of a spurious
signal to the ideal measurement signal. This leakage, due to
poor optical or electromagnetic isolations in some components,
and excessive RF radiations from other ones, induces a cyclic
error, sinusoidal with the distance, that depends on the relative
phase and relative amplitude between the crosstalk and the ideal
signal. The period of this cyclic error is equal to half a synthetic
wavelength, i.e. 30 mm in practice. The Signal to Crosstalk
Ratio (SCR), expressed in dB, is quantified by measuring the
amplitudes of the signals at intermediate frequency, i.e. 10.75
MHz, at the phasemeter input, when an optical beam is
received, then when it is interrupted. The amplitude (half peak-
to-peak) of this cyclic error can be well approximated by:
20/][10][
]/[
4
1][ dBSCR
RF
crosstalkMHzf
smcµmA
(6)
As this error is a sine function, its probability density
function is an arcsine distribution and its variance is half the
square of the amplitude of the periodic error [19]. The
uncertainty component due to crosstalk is so:
20/104
1
2
1
2][ SCR
RF
crosstalkcrosstalk
f
cAµmu
(7)
In the developed system, the crosstalk level is typically -75
dBm and the signal level 0 dBm, i.e. a SCR of 75 dB, which
corresponds to an uncertainty component of 0.6 µm (k=1).
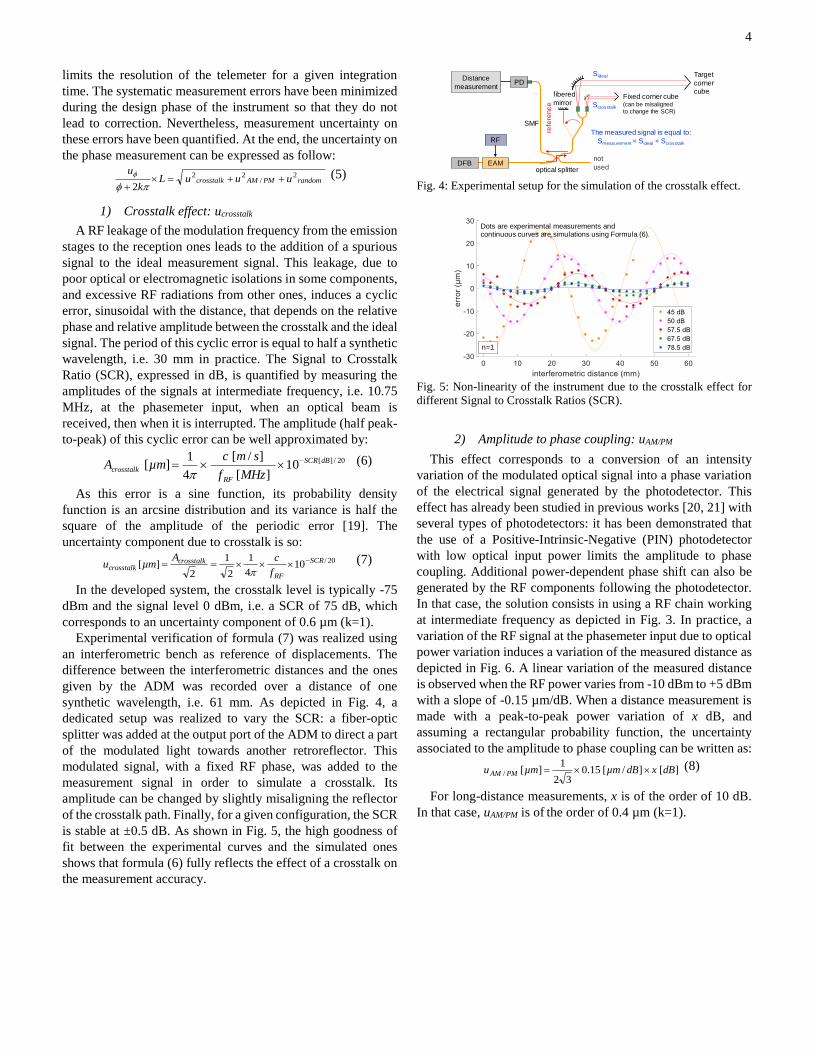
Experimental verification of formula (7) was realized using
an interferometric bench as reference of displacements. The
difference between the interferometric distances and the ones
given by the ADM was recorded over a distance of one
synthetic wavelength, i.e. 61 mm. As depicted in Fig. 4, a
dedicated setup was realized to vary the SCR: a fiber-optic
splitter was added at the output port of the ADM to direct a part
of the modulated light towards another retroreflector. This
modulated signal, with a fixed RF phase, was added to the
measurement signal in order to simulate a crosstalk. Its
amplitude can be changed by slightly misaligning the reflector
of the crosstalk path. Finally, for a given configuration, the SCR
is stable at ±0.5 dB. As shown in Fig. 5, the high goodness of
fit between the experimental curves and the simulated ones
shows that formula (6) fully reflects the effect of a crosstalk on
the measurement accuracy.
Fig. 4: Experimental setup for the simulation of the crosstalk effect.
Fig. 5: Non-linearity of the instrument due to the crosstalk effect for
different Signal to Crosstalk Ratios (SCR).
2) Amplitude to phase coupling: uAM/PM
This effect corresponds to a conversion of an intensity
variation of the modulated optical signal into a phase variation
of the electrical signal generated by the photodetector. This
effect has already been studied in previous works [20, 21] with
several types of photodetectors: it has been demonstrated that
the use of a Positive-Intrinsic-Negative (PIN) photodetector
with low optical input power limits the amplitude to phase
coupling. Additional power-dependent phase shift can also be
generated by the RF components following the photodetector.
In that case, the solution consists in using a RF chain working
at intermediate frequency as depicted in Fig. 3. In practice, a
variation of the RF signal at the phasemeter input due to optical
power variation induces a variation of the measured distance as
depicted in Fig. 6. A linear variation of the measured distance
is observed when the RF power varies from -10 dBm to +5 dBm
with a slope of -0.15 µm/dB. When a distance measurement is
made with a peak-to-peak power variation of x dB, and
assuming a rectangular probability function, the uncertainty
associated to the amplitude to phase coupling can be written as:
][]/[15.032
1][/ dBxdBµmµmu PMAM (8)
For long-distance measurements, x is of the order of 10 dB.
In that case, uAM/PM is of the order of 0.4 µm (k=1).
Distance
measurement
EAMDFBnot
used
Target
cornercube
optical splitter
SMF
PD
fibered
mirror
The measured signal is equal to:
Smeasurement = Sideal + Scrosstalk
refe
rence
RF
Sideal
Scrosstalk
Fixed corner cube(can be misaligned
to change the SCR)
Dots are experimental measurements andcontinuous curves are simulations using Formula (6).
n=1

5
Fig. 6. Variation of the measured distance as a function of the detected
RF power at intermediate frequency.
3) Random noise: urandom
The standard deviation of a short distance measurement, in a
quiet environment without amplitude variation (no amplitude to
phase coupling) and without distance variation (no visible
crosstalk effect), is 0.8 µm for a sample of 6000 points during
60 s. Using formula (2) to convert distance variations into phase
variations for a modulation frequency around 5 GHz, this value
corresponds to a phase noise of 2/37500 for 10 ms of
integration time. For comparison to an optical interferometer at
633 nm, this would correspond to a distance noise of 8 pm. Fig.
7 shows this relative distance measurement obtained in
laboratory conditions for a distance of 244 mm. This internal
random noise is then quantified by:
µmurandom 8.0 (9)
Fig. 7. Relative distance as a function of time. n=1 means that no air
refractive index correction was applied.
C. Air refractive index: un
The uncertainty on the air refractive index can be classified
into two components, un average and un turbulences.
The first component, un average, is linked to the correction
made by the operator. In general, the latter calculates the
average air refractive index along the optical path using
physical models such as Edlén or Bönsch and Potulski which
have an accuracy of 3·10-8. Hence, the uncertainty on the air
refractive index will mainly depend on our capacity to measure
properly the different atmospheric parameters: the air
temperature, the pressure, the partial pressure of water vapor,
and the CO2 content. As indicators, an error of 1 ºC on the
measured temperature has an impact of 1 mm/km and an error
of 100 Pa on the pressure has an impact of 270 µm/km.
The second component, un turbulences, is linked to the dynamic
variations in air density. As observed in our measurements, the
latter bring a turbulence-induced noise at the instrument level
that depends on the measured distance and on the atmospheric
conditions.
Outdoors, in quiet atmospheric conditions, we observe a
short-term random noise due to the fluctuations of the
atmospheric parameters of only 3.3 µm over 864 m, for an
integration time of 10 ms for each data point (Fig. 8).
Fig. 8. Data points obtained over 864 m at FGI baseline (Nummela,
Finland).
Tests have also been conducted over longer distances, over
4.1 km, in harsh conditions: it was a warm and sunny day with
temperatures around 35 °C and important beam scintillations.
Under these conditions, as there is no active pointing servo
system to keep the optical head on the corner cube, it is
necessary to regularly slightly realign the optical head in the
vertical direction to optimize the received signal. The results
have shown standard deviations up to 40 µm over 20 s of
measurement. This is the maximum observed standard
variations for such distances.
The extra random noise due to atmospheric turbulences is
therefore quantified by values from 3 µm/km in quiet
environments to 10 µm/km in harsh conditions:
99 1010103 n
u sturbulencen (10)
D. Uncertainty budget
A global uncertainty budget for the measurement of a
mechanical displacement (distance between two positions of a
same reflector) can be formally written, taking into account the
different sources of uncertainty listed above, as following:
2
2
2
2
2
2
2/
222
2
2
Ln
uL
n
uuuuL
f
uu
sturbulencenaveragenrandomPMAMcrosstalk
RF
f
LRF
The component coming from the measurement of the optical
distance itself, uinstrument, is obtained by omitting air index
components in this expression. It is below 4 µm (k=1) for
distances less than 1 km. For a distance of 1 km, peak-to-peak
amplitude variations of the signal of 10 dB and a SCR of 75 dB,
the uncertainty of the instrument is:
µm
µm
uuuLf
uu randomPMAMcrosstalk
RF
f
instrument
RF
1.4
8.04.06.010104 222299
2/
222
2
2
The uncertainty budget of the instrument, excluding air index
Slope of -0.15 µm/dB
0 10 20 30 40 50 60-4
-3
-2
-1
0
1
2
3
4
time (s)
rela
tive
dis
tan
ce
(µ
m)
relative distance = distance – mean( distance )
mean ~ 244 mm
n=1 σ = 0.8 µm
1 2 3 4 5 6 7 8 9 10 11-150
-100
-50
0
50
100
rela
tive
dis
tan
ce
(µ
m)
time (min)
n=1
relative distance = distance – mean( distance )
mean = 864 m 373 mm 740 µm
average standard deviation over short periods of 20 s:σ = 3.3 µm

6
determination and mechanical offset of the instrument, is
summarized in Table 1.
Standard
uncertainty
component
Source of
uncertainty
Standard
uncertainty
Sensitivity
coefficient Contribution
𝑢𝑓𝑅𝐹
accuracy of the
modulation
frequency
4 · 10-9 fRF Hz L / fRF m.s 4 · 10-9 L µm †
𝑢𝑐𝑟𝑜𝑠𝑠𝑡𝑎𝑙𝑘
value of the
signal to
crosstalk ratio 10-75/20 / √2 c / (4π fRF) m 0.6 µm * †
𝑢𝐴𝑀/𝑃𝑀 variations of
the signal
amplitude 10 / 2√3 dB -0.15 µm/dB 0.4 µm **
𝑢𝑟𝑎𝑛𝑑𝑜𝑚
random noise
on the phase
measurement
0.17 mrad 4.7 µm/mrad 0.8 µm
* for SCR of 75 dB ** for peak-to-peak amplitude variations of 10 dB † for fRF = 5 GHz
Combined standard
uncertainty 𝑢𝑘=1(𝐿) = √(1.1 µm)2 + (4 · 10−9 𝐿)2
Table 1: Uncertainty budget for differential optical distance
measurements with the telemeter prototype.
IV. VALIDATION OF THE UNCERTAINTY ESTIMATION
AND RANGE OF OPERATION
Validation of the uncertainty budget should be conducted by
comparison to a reference system with an uncertainty better
than or equivalent to the claimed uncertainty of the developed
instrument. This was done up to 100 m using a linear bench
whose displacement is measured by a 633 nm interferometer.
In that case environmental parameters are well controlled and
have a negligible effect on the comparison.
A. Comparison to a 100 m interferometric displacement
The telemeter was compared to a 50m-long interferometric
bench, indoors, in a controlled environment. As depicted in Fig.
9, the interferometric beam was propagated over 50 m while the
telemeter beam was propagated over 100 m thanks to a double
round trip. The interferometric distance has so been multiplied
by a factor of two for the comparison.
Fig. 9. Setup realized for the comparison between a linear
interferometer and the developed ADM.
The difference between twice the interferometric distance at
633 nm and the ADM distance at 1550 nm was lower than 2 µm
the first day (versus 8 µm the second day) with a standard
deviation of only 1.0 µm (versus 2.2 µm the second day). As
both instruments do not operate at the same wavelength, a small
error can occur if atmospheric parameters are not properly
estimated. Nevertheless, this error is negligible at the
micrometer scale: if temperature measurement is made with an
error of 1°C, this implies only 100 nm error in the comparison.
Fig. 10. Error as a function of the interferometric displacement.
During the comparison, the SCR was always higher than 75
dB. Formula (7) shows that in that case the uncertainty
component associated to crosstalk is lower than 1.5 µm, which
is compatible with the comparison depicted in Fig. 10.
B. Resolution and range of operation outdoors
Fig. 11. Measurement of 100 µm steps displacement of the corner cube
after a propagation over 5.4 km in air.
The telemeter has been tested over 5.4 km, above an urban area,
between the roofs of two buildings located in Paris (LNE
building) and nearby Paris (Meudon observatory). Two weather
stations were installed at each end of the line: temperatures were
8.2 °C and 10 °C, pressures 1003.6 hPa and 992.9 hPa (the
Meudon observatory is located about 80 m above the LNE
building), and relative humidities 57 % and 68 % in Paris and
Meudon, respectively. The sky was overcast with a ~14 km/h
wind. The short term (15 s) sample standard deviations were
between 10 µm and 40 µm for 10 ms of integration time for
each individual measurement point.
Arpent ADM
working at1550 nm
moving carriage with
a large corner cube
0 m10 m20 m30 m40 m50 m
small
cornercube
linear
interferometerworking at 633 nm
beam-splitter andfixed corner cube
plane
mirrors
movement
0 20 40 60 80 100-8
-6
-4
-2
0
2
4
6
8
twice interferometric displacement (m)
err
or
(µm
)
day 1
day 2n calculated
0 2 4 6 8 10
-1000
-800
-600
-400
-200
0
time (min)
rela
tive
dis
tan
ce
(µ
m)
measured displacements
applied displacements
Pointsused toplot theFig. 12
0 2 4 6 8 10
-1.0
-0.8
-0.6
-0.4
-0.2
0
rela
tive
dis
tan
ce
(m
m)
time (min)
displacements
position zero
applied displacements
estimated driftn = 1
n estimated
0 2 4 6 8 10
-1.0
-0.8
-0.6
-0.4
-0.2
0
rela
tive
dis
tan
ce
(m
m)
time (min)
displacements
position zero
applied displacements
estimated drift
Polynomial correctionbased on the estimateddrift

7
The 5.4 km distant corner cube was moved by steps of 100
µm thanks to a micrometric translation stage, from 0 mm to -1
mm, then from -1 mm to 0 mm. Between each step, additional
measurements of the 0 mm position were realized to estimate
the distance drift that occurred during the 10 min measurement
due to the evolution of the atmospheric parameters. As depicted
in Fig. 11, at the top, a polynomial drift has been considered
(red curve). A distance variation of 200 µm for 10 minutes, as
the one depicted in Fig. 11 (in the plot above), corresponds to a
variation of the average temperature along the 5.4 km path of
only 0.04 °C, for which drift of the instrument is negligible. At
the bottom, we easily distinguish the distance variations despite
the atmospheric disturbances.
For each position of the corner cube a distribution of the
measured distances can be plotted. In Fig. 12, histograms of the
measurement values obtained at the three last positions of Fig.
11 are depicted. We obtain normal distributions with standard
deviations between 21 µm and 28 µm. These values correspond
to the instrument resolution (1σ) at 5.4 km.
Fig. 12. Distribution of the recorded distances for three corner cube
positions.
V. CONCLUSION
We have developed a robust, compact, and easily
transportable distance meter.
Indoors, in a controlled environment, its uncertainty for a
displacement measurement is around 2 µm (k=1) up to 100 m.
Outdoors, in quiet environmental conditions, the measurement
resolution is 3 µm (1σ) over 850 m. In field conditions and
urban environment, the resolution of the prototype is around 25
µm for 5.4 km of measured distance (10.8 km of propagation).
The accuracy of the mechanical distance measured by the
prototype is still limited by air index determination along the
propagation path of the optical beam. However, the uncertainty
obtained for optical path measurement with the prototype is
compatible with a future improvement of the setup by the
addition of a second wavelength in order to partially
compensate the air index effect. This second wavelength could
be obtained by frequency doubling of the 1550 nm light. Even
if implementation of all fiber-optic system for both wavelengths
is more complex, this has already been demonstrated in [22]. In
that case millimeter uncertainty on a distance measurement
could be reached over 5 km without air temperature and
pressure measurement.
ACKNOWLEDGMENT
This work was partially funded within the European
Metrology Research Programme (EMRP) as JRPs SIB60
Surveying and IND53 Luminar. The authors are very grateful
to J. Cali and S. Durand from École Supérieure des Géomètres
et Topographes (ESGT) for the availability of their
interferometric bench. They are also very grateful to J. Jokela
from Finnish Geospatial Research Institute (FGI) for the
availability of their baseline and for his assistance during
measurements. First design of the FPGA based phasemeter was
realized within the project 7-BLAN-0309-01 of the ANR
(French National Agency for Research), coordinated by M.
Lintz from Observatoire de la Côte d’Azur.
REFERENCES
[1] J. Gervaise, “First results of the geodetic measurements carried out with
the Terrameter, two wavelength electronic distance measurement
instrument”. Proc. Of Geodätischen Seminar über Electrooptische
Präzisionsstreckenmessung, Munich, Germany, pp. 213-229, January
1984. [online] Available: http://doczz.com.br/doc/1162343/schriftenreihe---universit%C3%A4t-der-bundeswehr-m%C3%BCnchen, Accessed on
July 3, 2018.
[2] C.J. Curtis, “Calibration and use of the Mekometer ME5000 in the survey of the Channel Tunnel”. Proceedings of the Workshop the use and
calibration of the Kern ME5000 Mekometer, Stanford Linear Accelerator
Center, Stanford University, Stanford, California, USA, pp. 67-82, June 18-19,1992. [online] Available:
http://www.slac.stanford.edu/pubs/slacreports/reports03/slac-r-403.pdf,
Accessed on July 3, 2018. [3] USGS Eathquake Hazards Program. “Two-color Electronic Distance Meter
(EDM)”. [online] Available:
https://earthquake.usgs.gov/monitoring/deformation/edm/, Accessed on July 3, 2018.
[4] G. Bönsch and E. Potulski, “Measurement of the refractive index of air
and comparison with modified Edlén’s formulae”, Metrologia, vol. 35, n°. 2, pp. 133-139, 1998, DOI: 10.1088/0026-1394/35/2/8.
[5] P. L. Bender and J. C. Owens, “Correction of optical distance
measurements for the fluctuating atmospheric index of refraction” J. Geophys. Res., vol. 70, n°.10, pp. 2461-2462, May 1965, DOI:
10.1029/JZ070i010p02461.
[6] K. B. Earnshaw and J. C. Owens, “A dual wavelength optical distance measuring instrument which corrects for air density” IEEE J. Quantum
Electron., vol.3, n°.11, pp. 544-550, 1967, DOI:
10.1109/JQE.1967.1074403. [7] K.B. Earnshaw and E.N. Hernandez, “Two-Laser Optical Distance-
Measuring Instrument that Corrects for the Atmospheric Index of
Refraction”, Appl. Opt., Vol. 11, n°. 4, pp. 749-754, April 1972. DOI: 10.1364/AO.11.000749.
[8] G. R. Huggett, “Two-color terrameter,” Tectonophysics, vol. 71, pp. 29–39, 1981, DOI. 10.1016/0040-1951(81)90044-5.
[9] N. R. Doloca, K. Meiners-Hagen, M. Wedde, F. Pollinger and A. Abou-
Zeid, “Absolute distance measurement system using a femtosecond laser as a modulator”, Meas. Sci. Technol., vol. 21, n°11, 7pp, September 2010,
DOI: 10.1088/0957-0233/21/11/115302.
[10] K. Minoshima and H. Matsumoto, “High-accuracy measurement of 240-m distance in an optical tunnel by use of a compact femtosecond laser”,
Appl. Opt., vol. 39, n° 30, pp. 5512-5517, 2000, DOI:
10.1364/AO.39.005512. [11] S. A. van den Berg, S. T. Persijn, G. J. P. Kok, M. G. Zeitouny and N.
Bhattacharya, “Many-Wavelength Interferometry with Thousands of
Lasers for Absolute Distance Measurement”, Phys. Rev. Lett., vol. 108, n° 18, May 2012, DOI: 10.1103/PhysRevLett.108.183901.
[12] K. Minoshima, K. Arai and H. Inaba, “High-accuracy self-correction of
refractive index of air using two color interferometry of optical frequency combs”, Opt. Express, vol. 19, n°27, pp. 26095–26105, 2011, DOI:
10.1364/OE.19.026095.
[13] H. J. Kang, B. J. Chun, Y. S. Jang, Y. J. Kim and S. W. Kim, “Real-time compensation of the refractive index of air in distance measurement”, Opt.
-50 0 50 100 150 200 2500
5
10
15
20
25
30
35
displacement (µm)
me
asu
rem
en
ts
mean = 15 µmσ = 28 µm
mean = 97 µmσ = 23 µm
mean = 200 µmσ = 21 µm
8
Express, vol. 23, n° 20, pp. 26377–26385, 2015, DOI: 10.1364/OE.23.026377.
[14] G. Wu, K. Arai, M. Takahashi, H. Inaba and K. Minoshima, “High-
accuracy correction of air refractive index by using two-color heterodyne
interferometry of optical frequency combs”, Meas. Sci. Technol., vol. 24,
n°1, 015203, Dec. 2012, DOI: 10.1088/0957-0233/24/1/015203.
[15] J. Lee, Y.-J. Kim, K. Lee, S. Lee and S.-W. Kim, “Time-of-flight measurement with femtosecond light pulses”, Nat. Photonics, vol. 4, pp.
716-720, Aug. 2010, DOI: 10.1038/nphoton.2010.175.
[16] I. Coddington, C. Swann, L. Nenadovic and N. Newbury, “Rapid and precise absolute distance measurements at long range”, Nat. Photonics,
vol. 3, pp. 351-356, May 2009, DOI: 10.1038/nphoton.2009.94.
[17] K. Meiners-Hagen, T. Meyer, J. Mildner and F. Pollinger, “SI-traceable absolute distance measurement over more than 800 meters with sub-
nanometer interferometry by two-color inline refractivity compensation”,
Appl. Phys. Let., vol.111, n° 19, 191104, Nov. 2017, DOI: 10.1063/1.5000569.
[18] J. Guillory, R. Smíd, J. García-Márquez, D. Truong, C. Alexandre and J-
P. Wallerand, “High resolution kilometric range optical telemetry in air by RF phase measurement”, Rev. Sci. Instrum., Vol. 87, n°7, 075105, 2016,
DOI: 10.1063/1.4954180.
[19] JCGM 101:2008, “evaluation of measurement data-supplement 1 to the “guide to the expression of uncertainty in measurements”-propagation of
distributions using a Monte Carlo method”, page 23. [online] Avalailble:
https://www.bipm.org/utils/common/documents/jcgm/JCGM_101_2008_E.pdf, Accessed on July 3, 2018.
[20] J. Guillory, J. García-Márquez, C. Alexandre, D. Truong and J-P. Wallerand, “Characterization and reduction of the amplitude-to-phase
conversion effects in telemetry”, Meas. Sci. Technol., vol. 26, 084006
(7pp), Jul. 2015, DOI: 10.1088/0957-0233/26/8/084006. [21] D-H. Phung, M. Merzougui, C. Alexandre and M. Lintz, “Phase
Measurement of a Microwave Optical Modulation: Characterisation and
Reduction of Amplitude-to-Phase Conversion in 1.5 μm High Bandwidth Photodiodes”, IEEE Journal of Lightwave Technology, vol. 32, n°20, pp
3759- 3767, March 2014, DOI: 10.1109/JLT.2014.2312457.
[22] J. Guillory, J-P. Wallerand, D. Truong, R. Smíd and C. Alexandre, “Towards kilometric distance measurments with air refractive index
compensation”, 3rd Joint International Symposium on Deformation
Monitoring (JISDM), Vienna, Austria, 30 March - 1 April, 2016. [online]
Avalailble: http://www.fig.net/resources/proceedings/2016/2016_03_jisd
m_pdf/nonreviewed/JISDM_2016_submission_27.pdf
View publication statsView publication stats