Uncertainty and Its Propagation Through Calculations Engineering Experimental Design Valerie L....
22
Uncertainty and Its Propagation Through Calculations Engineering Experimental Design Valerie L. Young
-
Upload
dylan-fisher -
Category
Documents
-
view
220 -
download
2
Transcript of Uncertainty and Its Propagation Through Calculations Engineering Experimental Design Valerie L....
Uncertainty and Its Propagation Through
CalculationsEngineering Experimental Design
Valerie L. Young

Uncertainty
• No measurement is perfect– Our estimate of a range likely to include the true value
is called the uncertainty (or error)
• Uncertainty in data leads to uncertainty in calculated results– Uncertainty never decreases with calculations, only
with better measurements
• Reporting uncertainty is essential– The uncertainty is critical to decision-making– Estimating uncertainty is your responsibility

Today’s Topics . . .
• How to report uncertainty– The numbers– The text
• Identifying sources of uncertainty
• Estimating uncertainty when collecting data
• Uncertainty and simple comparisons
• Propagation of error in calculations

Reporting Uncertainty – The Numbers
• Experimental data and results always shown asxbest ± x
• Uncertainty gets 1 significant figure– Or 2 if it’s a 1, if you like
• Best estimate gets rounded consistent with uncertainty– Keep extra digits temporarily when calculating

Examples
• Right(6050 ± 30) m/s
(10.6 ± 1.3) gal/min
(-16 ± 2) °C
(1.61 ± 0.05) 1019 coulombs
• Wrong(6051.78 ± 32.21) m/s
(-16.597 ± 2) °C

Fractional Uncertainty
x / |xbest |
• Also called “relative uncertainty” x is “absolute uncertainty”
x / |xbest | is dimensionless (no units)
• Example(-20 ± 2) °C 2 / |-20| = 0.10
-20 °C ± 10 %

Reporting Uncertainty – The Text
• You must explain how you estimated each uncertainty. For example:
The reactor temperature was (35 ± 2) °C. The uncertainty. . .. . .is estimated based on the thermometer scale.
. . .is given by the manufacturer’s specifications for the thermometer.
. . .is the standard deviation of 10 measurements made over the 30 minutes of the experiment.
. . .represents the 95% confidence limits for 10 measurements made over the 30 minutes of the experiment.

Reporting Uncertainty – The Text
• You must explain how you estimated each uncertainty. For example:
The reactor temperature was (35 ± 2) °C. The uncertainty. . .. . .is the standard deviation of 10 measurements made
over the 30 minutes of the experiment.
. . .represents the 95% confidence limits for 10 measurements made over the 30 minutes of the experiment.
These estimates of uncertainty include both the precision of temperature control on the reactor and the precision of the measurement technique. They do not account for the accuracy of the measurement technique.
Precision vs. Accuracy
• Precision
• Accuracy

Estimating Uncertainty from Scales
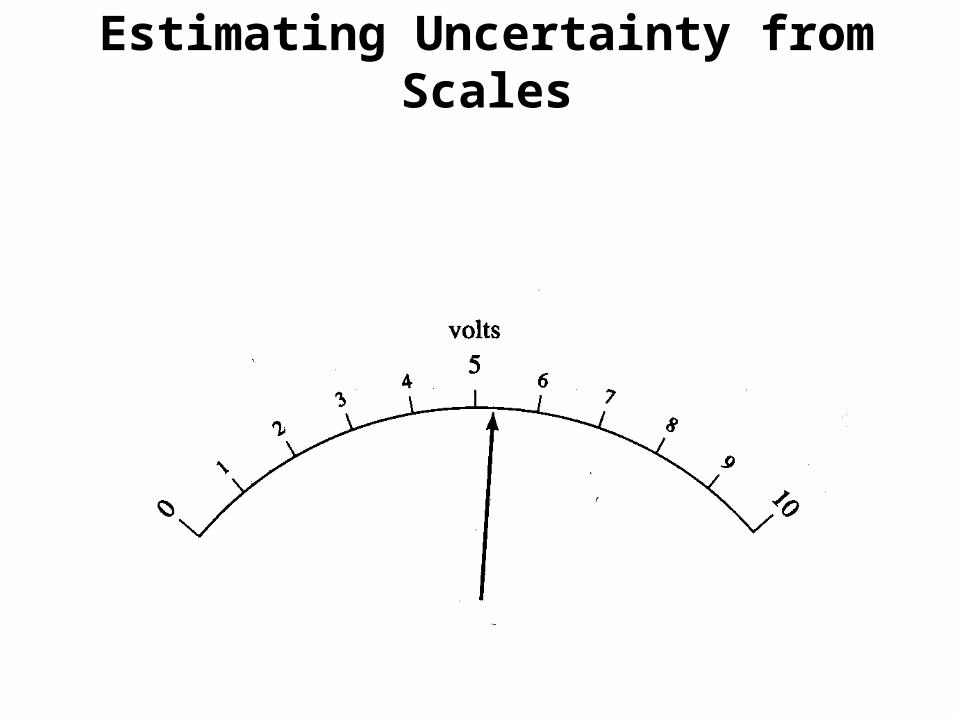
Estimating Uncertainty from Scales

Graphical Display of Data and Results
Figure 1. Cell reproduction declines exponentially as the mass of growth inhibitor present increases. Vertical error bars represent standard deviation of 5 replicate measurements for one growth plate.
0
50
100
150
200
250
0 1 2 3 4 5 6 7 8 9Growth Inhibitor Added, g
Ce
lls in
FO
V a
fte
r 6
Ho
urs

Experimental Results and Conclusions
• A single measured number is uninteresting
• An interesting conclusion compares numbers– Measurement vs. expected value– Measurement vs. theoretical prediction– Measurement vs. measurement
• Do we expect exact agreement?– No, just “within experimental uncertainty”

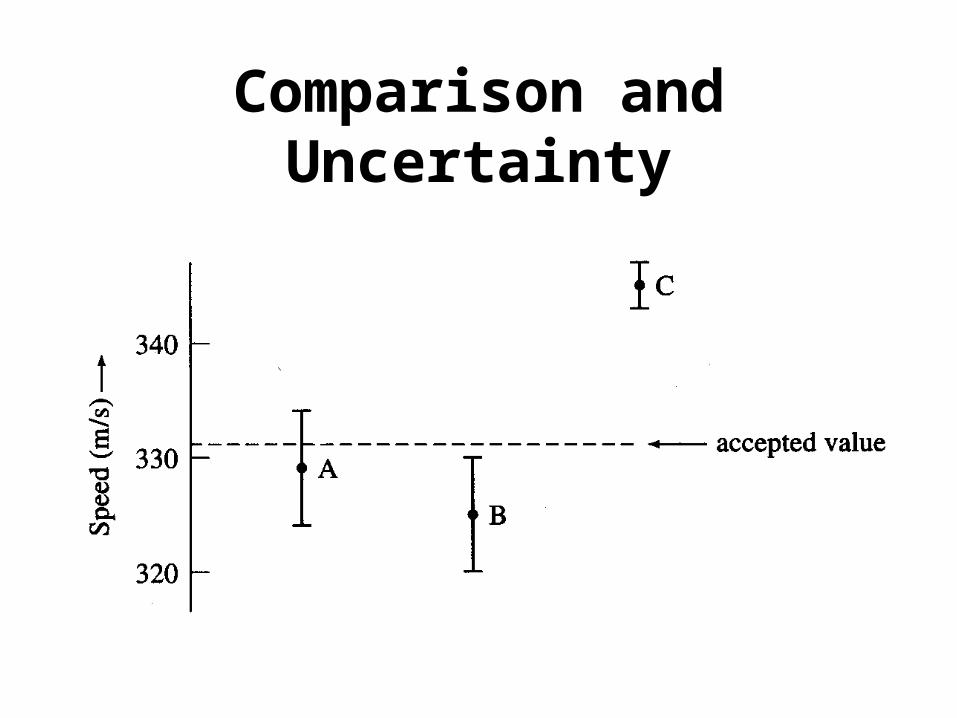
Comparison and Uncertainty
Comparison and Uncertainty

Comparison and Uncertainty
• xbest ± x means . . .
xtrue is probably between xbest - x and xbest + x
(later we’ll make “probably” quantitative)
• Two values whose uncertainty ranges overlap are not significantly different– They are “consistent with one another”
• A value just outside the uncertainty range may not be significantly different– More on this later (hypothesis testing)

Propagation of Uncertainties
• We often do math with measurementsDensity = (m ± m) / (V ± V)
What is the uncertainty on the density?
• “Propagation of Error” estimates the uncertainty when we combine uncertain values mathematically
• NOTE: don’t use error propagation if you can measure the uncertainty directly (as variation among replicate experiments)

Simple Rules
• Addition / Subtraction, q = x1 + x2 – x3 – x4
q = sqrt((x1)2+(x2)2+(x3)2+(x4)2)
• Multiplication / Division, q = (x1x2)/(x3x4)q/|q| = sqrt((x1/x1)2+(x2/x2)2+(x3/x3)2+(x4/x4)2)
• 1-Variable Functions, q = ln(x)q = |dq/dx| x |1/x| x

General Formula for Error Propagation
• q = f(x1,x2,x3,x4)
q = sqrt(((q/ x1) x1)2 + ((q/ x2) x2)2 + ((q/ x3) x3)2 + ((q/ x4) x4)2 )

User Beware!
• Error propagation assumes that the relative uncertainty in each quantity is small– Weird things can happen if it isn’t, particularly
for functions like ln– e.g., ln(0.5 ± 0.4) = -0.7 ± 0.8– In this case, I suggest assuming that the relative
error in x is equal to the relative error in f(x)
• Don’t use error propagation if you can measure the uncertainty directly (as variation among replicate experiments)

• You pour the following into a batch reactor:– (100 ± 1) ml of 1.00 M NaOH in water– (1000 ± 1) ml of water– (1000 ± 1) ml of water
• What is the concentration of NaOH in the batch reactor?
Sample Calculation

Sample Calculation
([NaOH] VNsOH) / (VNaOH+Vwater+Vwater))
The concentration of NaOH in the reactor is (0.0476 ± 0.0007)M. The uncertainty was estimated by propagation of error, using the measurement uncertainties in the volumes added, and assuming an uncertainty of ± 0.01 M in the concentration of the 1.00 M NaOH solution. Note that writing 1.00 M implies an uncertainty of 0.01 M.