Uncertainty Analysis of Methods Used to Measure … Eisenhower Boulevard, Suite 8 The Amman...
99
2550 Eisenhower Boulevard, Suite 8 The Amman Building, Port Everglades Fort Lauderdale, Florida 33316 US www.shipwright.biz // office (954) 745-9430 Uncertainty Analysis of Methods Used to Measure Ship Fuel Oil Consumption Submitted to: International Maritime Organization (IMO) 4 Albert Embankment, London, SE1 7SR Submitted by: J. Travis Hunsucker, Dylan Przelomski, Alex Bashkoff, John Dixon Shipwright LLC 2550 Eisenhower Blvd, Suite 8, Fort Lauderdale, Florida, USA 23 January 2018
Transcript of Uncertainty Analysis of Methods Used to Measure … Eisenhower Boulevard, Suite 8 The Amman...
2550 Eisenhower Boulevard, Suite 8 The Amman Building, Port Everglades
Fort Lauderdale, Florida 33316 US www.shipwright.biz // office (954) 745-9430
Uncertainty Analysis of Methods Used to Measure Ship Fuel Oil Consumption
Submitted to:
International Maritime Organization (IMO) 4 Albert Embankment, London, SE1 7SR
Submitted by:
J. Travis Hunsucker, Dylan Przelomski, Alex Bashkoff, John Dixon Shipwright LLC 2550 Eisenhower Blvd, Suite 8, Fort Lauderdale, Florida, USA
23 January 2018
2550 Eisenhower Boulevard, Suite 8 The Amman Building, Port Everglades
Fort Lauderdale, Florida 33316 US www.shipwright.biz // office (954) 745-9430
i // SHIPWRIGHT LLC
Executive Summary
The International Maritime Organization (IMO) has been actively estimating the CO2 emissions
from shipping for over the past decade. The results have been published in the First, Second, and
Third Greenhouse Gas Studies (IMO 2015). Amendments to MARPOL Annex VI entering into
force on 1 March 2018 will require ships to submit annual fuel oil consumption data to the IMO.
The three most widely used methods for collecting data on annual fuel oil consumption are the
bunker delivery note (BDN), monitoring tank level indicators (TLI), and using flow metering. The
IMO convened this study to examine the uncertainty for each of these methods.
The study estimated the uncertainty for each of these methods using 550,000 tonnes of measured
fuel oil consumption from approximately 46 ships owned or operated by three companies.
Key Findings
1. Annual fuel oil consumption determined from BDN and TLI data were in close agreement;
whereas, the values determined from flowmeter data were systematically lower with the
differences larger than what can be reasonably associated with fuel oil processing. The
relatively large variance of the flowmeter data when compared to the BDN and TLI data
suggest that the flowmeter data contain considerable amounts of random error.
2. An uncertainty analysis at a 95% confidence interval estimated that for all of shipping, the
annual HFO fuel consumption determined from TLI and flowmeter data would have the
following differences when compared to BDN data.
• TLI: 0.33% ± 1.8%
• Flowmeter: -12% ± 6.5%
It is unknown if the relatively poor agreement of the flowmeter data in comparison to BDN
and TLI sources are a coincidental artifact unique to these companies or if these findings
are emblematic of accuracy problems observed in other types of shipboard data.
3. Combining the results with the literature survey for this study, the overall uncertainty for
each of the fuel oil measurement methods was estimated as follows:
• BDN: 3% for HFO and MGO/MDO
• TLI: 5% for HFO and MGO/MDO
• Flowmeter: 8% for HFO and 10% for MGO/MDO
ii // SHIPWRIGHT LLC
TABLE OF CONTENTS
Executive Summary ....................................................................................................................... i Acronyms ...................................................................................................................................... iii 1.0 Introduction .......................................................................................................................... 1 2.0 Background .......................................................................................................................... 1
2.1 Fuel Oil Life Cycle ......................................................................................................... 2 2.2 Ship Bunkering ............................................................................................................... 3 2.3 Tank Level Indicator ...................................................................................................... 3 2.4 Flowmeters ..................................................................................................................... 3 2.5 Uncertainties in Fuel Oil Measurements ........................................................................ 3
2.5.1 Bunker Delivery Notes ....................................................................................... 4
2.5.2 Tank Level Indicators ......................................................................................... 4
2.5.3 Flowmeters ......................................................................................................... 4 2.5.4 Fuel Oil Processing ............................................................................................ 5
2.6 Practical Advantages and Disadvantages ....................................................................... 5
3.0 Methodology ......................................................................................................................... 6
3.1 Data Collection ............................................................................................................... 6
3.1.1 Company A ......................................................................................................... 6
3.1.2 Company B ......................................................................................................... 7 3.1.3 Company C ......................................................................................................... 8
3.2 Data Analysis ................................................................................................................. 8
4.0 Results and Discussion ....................................................................................................... 12
4.1 Company A ................................................................................................................... 12
4.1.1 Company A HFO .............................................................................................. 12 4.1.2 Company A MGO ............................................................................................ 13
4.1.3 Company A Collective Analysis ...................................................................... 15
4.2 Company B ................................................................................................................... 15
4.2.1 Company B HFO .............................................................................................. 17 4.2.2 Company B MGO ............................................................................................ 18
4.2.3 Company B Collective Analysis ...................................................................... 19
4.3 Company C ................................................................................................................... 20
4.3.1 Company C HFO .............................................................................................. 20 4.3.2 Company C MGO and MDO ........................................................................... 22
4.3.3 Company C Collective Analysis ...................................................................... 23
4.4 Combined ..................................................................................................................... 24
4.4.1 Combined HFO Analysis ................................................................................. 24
4.4.2 Combined MGO and MDO Analysis ............................................................... 26 4.4.3 Combined Collective Analysis ......................................................................... 28
4.5 Estimated Uncertainties ................................................................................................ 29 4.6 Discussion .................................................................................................................... 30
4.6.1 Accuracy of Annual Fuel Oil measured by BDN and TLI ............................... 30
iii // SHIPWRIGHT LLC
4.6.2 Influence of Sample Size .................................................................................. 32
4.7 Estimated Overall Uncertainty ..................................................................................... 32
5.0 Conclusions ......................................................................................................................... 33 6.0 Acknowledgments .............................................................................................................. 34 7.0 Bibliography ....................................................................................................................... 34 8.0 Appendix I: Worked Example with Estimated Uncertainties ....................................... 36 9.0 Appendix II: Measured FO Consumption for all Ships ................................................. 37
Acronyms
BDN Bunker Delivery Note
HFO Heavy Fuel Oil
LSHFO Low-Sulfur Heavy Fuel Oil
LSMGO Low-Sulfur Marine Gas Oil
MDO Marine Diesel Oil
MGO Marine Gas Oil
ROB Remaining Onboard
TLI Tank Level Indicator

2550 Eisenhower Boulevard, Suite 8 The Amman Building, Port Everglades
Fort Lauderdale, Florida 33316 US www.shipwright.biz // office (954) 745-9430
1 // SHIPWRIGHT LLC
1.0 Introduction
The Third IMO Greenhouse Gas Study 2014 (IMO 2015) found that from 2007 to 2012 on average,
shipping contributed to approximately 3.1% of global CO2 emissions. These emissions are largely
estimated from different values for fossil fuel consumption. To improve the accuracy of the
estimation, Regulation 22A was added to chapter 4 of MARPOL Annex VI. The regulation, which
will enter into force on 1 March 2018, requires all ships of 5,000 gross tonnage and above to submit
annual fuel oil consumption data.
While several methods are available for collecting data on a ship's fuel oil consumption - the three
most widely used and as reflected in the 2016 Guidelines for the development of a Ship Energy
Efficiency Management Plan (SEEMP) (resolution MEPC.282(70)) are the bunker delivery note,
tank monitoring, and flow metering. At present, there are limited quantitative data available to
describe the uncertainty of each of the methods. The broad goal of this study is to examine the
uncertainty for these three fuel oil consumption measurement methods adopted by the MEPC 70
for Regulation 22A:
1. Bunker delivery notes (BDN)
2. Bunker fuel oil tank monitoring, through tank level indicators (TLI)
3. Flowmeters
Specifically, the study was designed to complete the following:
1. Review the three methods identified in the 2016 SEEMP Guidelines for measuring fuel oil
consumption on ships, including the practical and economic advantages and disadvantages
of utilizing each method.
2. Undertake studies and analyses to determine the degree of uncertainty of each of the three
methods used to measure fuel oil consumption on ships.
3. Examine, in general terms, the degree of uncertainty in relation to the context of the
potential data set.
4. Identification of how the ascertained uncertainty for each of the three fuel oil consumption
measurement methods could be utilized when preparing the Secretary-General's annual
report for the MEPC.
To achieve these goals, data from approximately 46 ships owned or operated by three companies,
spanning several industry sectors, consisting of 550,000 tonnes of measured fuel oil consumption
were examined over a 1-year interval.
2.0 Background
Several qualitative studies have examined the accuracy associated with the different fuel oil
consumption measurement methods (Faber et al. 2013). They estimated the BDN data are 1% to
5% accurate, TLI data are 2% to 5% accurate, and flowmeter data have an accuracy of 3% or
better.

2 // SHIPWRIGHT LLC
For the purposes of this study and the upcoming Regulation 22A, the estimations of uncertainty
and quality of the measurements are in reference to the annual fuel oil consumption determined
from the sources. It should be noted, however, that each measurement method records the fuel oil
consumption at different points in the fuel oil life cycle and as such, the measurements are actually
different values. According to the estimates for oil residue (sludge) tank capacity in the Unified
Interpretation to Regulation 12.3.1 of MARPOL Annex I, approximately 1.5% of HFO and 0.5%
of MDO are expected to be produced as sludge.
2.1 Fuel Oil Life Cycle
A simplified generic life cycle of fuel oil aboard a ship, adapted from Winkler (1992), can be
described as follows: 1) In a process referred to as bunkering, fuel oil is loaded through deck fill
connections to large storage tanks aboard the ship, 2) Fuel oil is then taken from the storage tanks
to smaller settling tanks where solids and water settle-out, 3) After the settling tanks, fuel oil is
sent through purifiers and filters designed to remove water and/or particulates, 4) After the
additional filtering, fuel oil is discharged into the service tanks, 5) Fuel oil pumps draw from the
service tanks and deliver the fuel oil to viscosity control heaters and final filtration before entering
the main engine, 6) Fuel oil that is not burned in the main engine is recirculated back to the fuel
oil inlet. Throughout this process, the fuel oil consumption is measured at several locations (Figure
1).
The fuel oil quantity measured during bunkering operations is reported in the BDN as determined
by the company that sold the fuel oil and the Chief Engineer onboard the ship. Once the fuel oil
is onboard the ship, the tank levels are measured frequently by a vessel management system and/or
the ship’s crew. By determining the change in tank level and volume, the total fuel oil consumption
can be calculated. Lastly, as the fuel oil is pumped into the engine(s), flowmeters can precisely
determine the amount of fuel oil entering and exiting the engine, and thus the fuel oil consumption
can be calculated.
Figure 1: Generic description of fuel oil life cycle and consumption measurement. Colors
indicate the method used to measure the fuel-oil consumption, BDN (orange), TLI (blue), and
flowmeters (green).
While this general description (Figure 1) will vary from ship to ship, the main point is that the
mass of the original fuel oil loaded from bunkering is fundamentally changed by the processes of
the shipboard fuel oil system. The fuel oil quantity measured during bunkering, by tank level
indicators, and flowmeters are different quantities.
Whilst the following sections are not intended to be all-encompassing descriptions, they do provide
a generalized estimate as to the anticipated differences between the mass of the fuel oil measured
during bunkering, in the tanks, and by the flowmeters.
3 // SHIPWRIGHT LLC
2.2 Ship Bunkering
In typical bunkering operations, a bunker barge will moor alongside the vessel receiving fuel. Fuel
oil tanks are sounded, and vessel draught, heel, and trim are recorded before fuel oil is pumped
from the barge to the receiving vessel. Samples are taken during the transfer to monitor the fuel
oil properties. The company selling the fuel oil typically measures the fuel oil by volume and
converts to mass using the density of the fuel oil. Several samples of the fuel oil are taken during
the transfer process and tested by a third-party to verify the properties. After the fuel oil is onboard
the ship, the crew determines the onboarded fuel oil volume by measuring the changes in fuel oil
tank levels.
The ship receives a BDN, which includes information such as the port of bunkering, date of
delivery, fuel supplier contact information, oil product name, quantity delivered, density at 15°C,
and sulfur content. The BDN must be signed by the Chief Engineer of the receiving vessel.
2.3 Tank Level Indicator
There are many types of tank gauges used in the marine industry, including pressure gauges,
ultrasonic gauges, and float level sensors. In addition to the automatic level indicators, tanks levels
are frequently determined using manual soundings. Regardless of the method used to measure the
tank level, the volume is determined from the tank tables. These tables use a three-dimensional
model of the tank to provide fuel oil volume with given ullages or soundings. The mass of fuel in
a tank can be found using the volume of fuel oil in the tank and the density of the fuel, corrected
for the fuel temperature.
2.4 Flowmeters
The flowmeters used in the marine industry measure the bulk flow rates either in terms of a mass
flow rate (kg/hr) or a volume flow rate (m3/hr). While there are several types of volumetric
flowmeters, one commonly used is the positive displacement type, which works by measuring the
mechanic displacement of a component isolated in a fixed volume with a given fluid (Tavoularis
2005). The mass flow rate is determined using a Coriolis mass flowmeter. The basic principle
behind the Coriolis mass flowmeter is that fluid passes through a vibrating bent tube, as the angular
velocity increases so does the acceleration from the Coriolis effect (Tavoularis 2005). This exerts
a torsion in the bent tube with a time delay occurring between the two ends that is directly
proportional to the mass flow rate. The Coriolis mass flowmeter is generally understood to give
more precise measurements of the flow rates; however, these instruments are typically more
expensive.
2.5 Uncertainties in Fuel Oil Measurements
All fuel oil measurements contain some level of uncertainty, meaning that the true value of the
measured quantify is not ‘exactly’ known. The difference between the true and measured value is
referred to as the error. Since the true value is needed to determine the error, an uncertainty

4 // SHIPWRIGHT LLC
estimate accompanies measured values. This estimate states that at a given confidence level, the
true value of the measured quantity is within a specified range.
The uncertainty estimates are referred to as Type A or Type B by ISO (1993). Type A uncertainties
are those that can be determined using statistical analysis and Type B uncertainties are those that
evaluated by means other than statistical analysis. The fuel oil measurement methods contain both
Type A and Type B uncertainties with the following sections outlining some of the possible
sources of error.
2.5.1 Bunker Delivery Notes
There are several ways that the amount of fuel delivered to a vessel can be incorrectly reported
during bunkering operations. A person in charge of delivering bunker fuel could record the transfer
from one tank to another prior to delivering the fuel to the vessel, a bunker barge reporting higher
fuel amounts by recirculating some of the fuel from the flow meter back to the supply pump
suction, inaccurate flowmeters on the bunkering barge, or aerated fuel delivered to the vessel,
causing what is known as the “cappuccino effect”, in which the flow meter measures total volume,
including entrained air (Ford, 2012). Additionally, the BDN measurements do not account for
onboard fuel oil processing.
2.5.2 Tank Level Indicators
There are several sources of possible error in determining the fuel oil consumption from TLI’s:
instrumentation providing the wrong tank ullage; incorrect geometries for the three-dimensional
tank models; not accurately accounting for internal structures inside the tank; and conversion of
volume to mass using standardized density.
2.5.3 Flowmeters
There are several sources of uncertainty in the flow rates measured by the flowmeters: error in the
instrumentation; thermal expansion of fuel oil; and volume to mass conversion with standardized
densities.
All flowmeters contain some bias error that affect all measurements. These values, also referred
to as systematic error, are determined by the manufacturer or during a calibration for a given
instrument. Volumetric flowmeters generally have a larger bias error in comparison with the
Coriolis mass flowmeters. Typical systematic errors for volumetric flowmeters range from 0.5%
to 1.0+% of the reading, whereas error values for the mass flowmeters are typically between 0.1%
and 0.2% and can be less.
Flowmeters that use volumetric flow rates to determine mass fuel oil consumption can contain
error due to thermal expansion of the fuel. Fuel oil consumption measured using inlet and outlet
volume flow meters rely on accurate density readings based on fuel temperature. A single standard
density value is sometimes used, leading to an error in the reported mass consumption. Based on
data from ships in this study, a 10°C temperature difference caused an error of 0.7%, owing to
density fluctuations.

5 // SHIPWRIGHT LLC
2.5.4 Fuel Oil Processing
The total mass of bunkered fuel contains impurities, such as water and high-density sludge that
cannot be burned in the main consumers. This mass is filtered out in settling tanks and fuel
purifiers before the fuel is consumed. Typically, water content in bunker fuel is about 0.1% to
0.2% (Chinoy, 2013), with a maximum allowable water content set by ISO 8217 at 0.5%. Water
in fuel oil can lead to the production of additional sludge. Onboard settling tanks and fuel purifiers
help to remove water and sludge. Fuel oil settling tanks are designed so that sludge and entrained
water is drained, and purifiers separate impurities based on specific gravity.
Oil from leaks, spills, and overflows can also accumulate in the bilge forming oily bilge water,
sludge, and slops that are all collected in oily bilge tanks. The oily bilge is then processed through
an oily water separator that separates and discharges water from waste oil. The waste oil is then
burned in the ship’s boiler. Waste that is too dense to be burned is cleaned out of the sludge tanks
periodically and offloaded for proper disposal. In addition to fuel oil processes to remove mass,
additives are often dissolved in the fuel oil stream to improve performance and longevity of the
equipment.
2.6 Practical Advantages and Disadvantages
The previous sections outlined, in a generalized manner, the basic concepts of each fuel oil
consumption measurement method, including some of the advantages and disadvantages of each.
A concise comparison of the three methods is presented to highlight the practical advantages and
disadvantages of each (Table 1).
Table 1: Practical advantages and disadvantages of determining the annual fuel oil consumption
using three different measurement methods.
Measurement Advantages Disadvantages
BDN • Practices exist for strict custody transfer
• Financial incentive for accurate
measurements
• Low frequency measurements
• Multiple independent measurements
• No extra equipment needed
• Can be verified using manual methods
• Trade in volume but sell in
mass
• ROB required to determine
annual consumption
• Incorrect reporting due to
malpractice and/or error
• Fuel oil processing alters the
fuel oil consumed
TLI • Used for stability calculations
• Equipment already onboard most
vessels
• Can be verified using manual methods
• Instrumentation error
• Calibration can be inaccurate
• Measured volume might not
reflect actual mass
Flowmeter • Potential for high precision
measurement
• Monitored onboard
• Can measure mass
• High frequency
• Instrumentation error
• Measured volume might not
reflect mass
• Can be very expensive
6 // SHIPWRIGHT LLC
3.0 Methodology
The main focus of this study was to analyze data collected from in-service ships. To accomplish
this, a large number of shipping companies and organizations were contacted and invited to
participate. In total, approximately 30 different shipping companies were contacted, either through
personal connections, introduction from the IMO Secretariat, or through a vessel
owner/management group. Of the companies contacted, five expressed interest in participating in
the study. Of those five, one company could not provide data as they were in the middle of an
acquisition merger and one company could not provide data because there where technical
disruptions in the database.
There were three companies that provided data for this study – with 16 ships for Company A, 15
for Company B, and 27 for Company C. The number of useable ships was actually lower due to
issues with data quality and availability as discussed in the following sections.
3.1 Data Collection
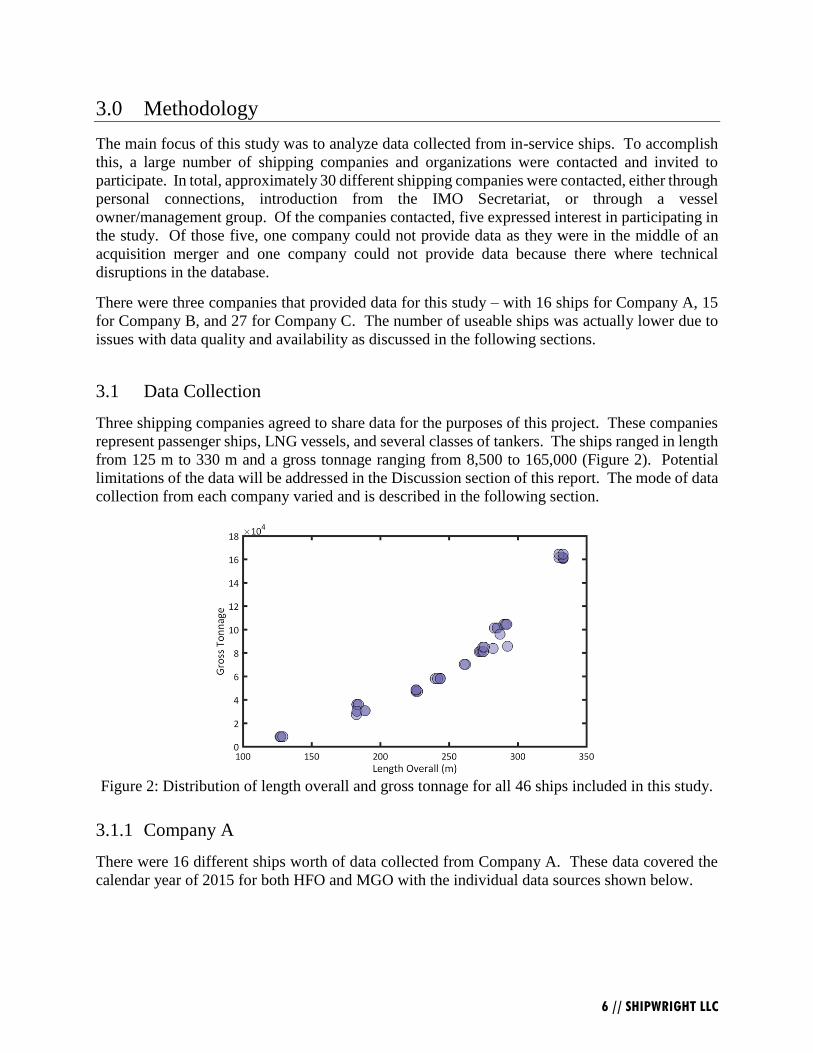
Three shipping companies agreed to share data for the purposes of this project. These companies
represent passenger ships, LNG vessels, and several classes of tankers. The ships ranged in length
from 125 m to 330 m and a gross tonnage ranging from 8,500 to 165,000 (Figure 2). Potential
limitations of the data will be addressed in the Discussion section of this report. The mode of data
collection from each company varied and is described in the following section.
Figure 2: Distribution of length overall and gross tonnage for all 46 ships included in this study.
3.1.1 Company A
There were 16 different ships worth of data collected from Company A. These data covered the
calendar year of 2015 for both HFO and MGO with the individual data sources shown below.

7 // SHIPWRIGHT LLC
• Bunker Delivery Notes- BDN receipts
• Fuel oil tank monitoring- Annual summation from log books with Remaining Onboard
(ROB) quantities for first and last day
• Flowmeter- daily totals from noon day reports
3.1.1a Bunker Delivery Note
BDN receipts were supplied for both the HFO and MGO. These receipts contained the fuel oil
quantity per the receipt and the value per the Chief Engineer.
3.1.1b Fuel Oil Tank Monitoring
The fuel consumption determined from the fuel oil tank monitoring was given as a singular value
taken from the logbooks.
3.1.1c Flowmeter
The flowmeter used by Company A was a Coriolis mass flowmeter with a manufacturer estimated
uncertainty of 0.20% of the reading. Company representatives stated that the volumetric flow was
recorded then converted to a mass using the density from the BDN. Flowmeter readings were
given daily in values of tonnes. It is currently unclear as to why Company A measured the
flowmeter data in units of volume and not mass.
3.1.2 Company B
Approximately 15 different ships from Company B were originally identified to be used in this
study. Initial analysis and discussion with company representatives identified that a large number
of ships used fuel oil emulsification. This is where water is injected into the fuel stream to improve
engine performance. The inclusion of water can introduce errors in the measurement of the mass
flow rate.
After the exclusion of ships using fuel oil emulsion, the number of ships from Company B for this
study was reduced to three. Data were supplied for both the HFO and MGO consumption during
the calendar year of 2016 with the individual sources listed below.
• Bunker Delivery Notes- List of BDN data including port location, date, fuel grade, and
quantity
• Fuel oil tank monitoring- Daily values of both HFO and MGO consumption
• Flowmeter- Average mass/hour consumption at 30-minute intervals recorded from vessel
performance monitoring program
3.1.2a Bunker Delivery Note
A table of BDN data were supplied with the date, port, grade, and fuel oil quantity.
3.1.2b Fuel Oil Tank Monitoring
Fuel consumption data were given for HFO and MGO. The data were supplied for each leg of a
voyage. The dates taken were at the completion of the leg and there were no ROB data available.
8 // SHIPWRIGHT LLC
3.1.2c Flowmeter
Company B used a Coriolis mass flowmeter. While the exact model is currently unspecified, these
types of flowmeter typically have a manufacturer’s specified uncertainty estimation as <0.1%.
The average kilogram per hour readings given every 30 minutes were integrated using the
trapezoidal rule in Matlab (MATLAB 2017a). No data tags were present with the flowmeter data
to distinguish fuel oil type. The data were measured in mass flow, such that the total comparison
would still be valid. There were, however, significant periods of time where no flowmeter data
were recorded. Whilst the source of the data outage is not known, potential contributors will be
addressed in the Discussion section.
3.1.3 Company C
There were data from 27 different ships from Company C. No fuel oil tank monitoring data were
available. These data covered multiple date ranges spanning from 2014 to 2017 for HFO, MGO,
and MDO with the individual data sources shown below.
• Bunker Delivery Notes- List of BDN data showing port location, date, fuel grade, densities,
receipt quantity, and quantity per Chief Engineer
• Fuel oil tank monitoring- No data were available
• Flowmeter- daily totals from noon day reports
Only the data from 2016 were included in this analysis.
3.1.3a Bunker Deliver Note
A table of BDN data were supplied with the date, port, grade, fuel oil quantity, and other tested
parameters.
3.1.3b Flowmeter
Company C used a positive displacement flowmeter. While the specific model is currently
unknown, these types of flowmeters are typically less accurate than the mass flowmeters and have
an estimated manufacturer’s uncertainty of around 0.5% of the reading.
The positive displacement flowmeter measures the volumetric flow rate. These values were
converted to mass using density from the BDN’s. However, the company representative indicated
that the lack of temperature correction for the engine fuel oil supply and return leads to inaccuracies
in the measured data. Furthermore, the representative indicated that these numbers vary more as
the vessels transit into warmer or cooler water.
The flowmeter data included HFO, LSHFO, MGO, LSMGO, and MDO data. The LSHFO data
were combined with the HFO data and the LSMGO data were combined with the MGO data.
3.2 Data Analysis
One of the main challenges with the analyzing the data was to ensure that the fuel oil consumption
data were measured over the same time interval. The TLI and the flowmeter data typically reported

9 // SHIPWRIGHT LLC
the fuel oil consumption daily, whilst the bunkering occurred on a weekly or monthly basis.
Additionally, the BDN’s measure the fuel oil brought onboard the ship at a specific point in time.
To account for these discrepancies, total consumption determined from the BDN data was
calculated by summing all the BDN’s and adding the ROB from the first of the year and
substracting the ROB at the end of the year (Eq 1).
BDN Cons. = ∑ BDN′s + ROB Jan. 1 − ROB Dec 31 (1)
The fuel oil consumption measured from the BDN’s, TLI’s, and flowmeters was plotted against
time using a cumulative summation to look for any gross error. Analyses of these figures, indicated
there were some vessels with fuel oil consumption measurements indicative of gross error
(Figure 3). Cumulative fuel consumption data are presented for all vessels in Appendix II.
Figure 3: Cumulative measured fuel oil consumption for Ship C23 showing a rapid increase in
reported flowmeter value indicative of measurement error.
In addition to ensuring the fuel oil consumption measurements occurred over the same interval,
the other main challenge arose due to establishing reference values for comparison of the fuel oil
consumption measurement methods.
Since the ‘exact’ true value for the fuel oil consumption cannot be determined, a common baseline
value is needed to establish a reference point. While it is generally believed that the raw data from
the flowmeters are more precise than those from the BDN’s and TLI’s (Jones 2009, Faber et al.
2013), initial analysis of the data in this study indicated a large variance of the annual fuel oil
consumption measured from flowmeter data when compared to values determined from BDN’s
and TLI’s.

10 // SHIPWRIGHT LLC
The BDN data were chosen as the baseline for this study because the measurements are
independently determined from two different sources as indicated on the BDN- the Chief Engineer
and the BDN receipt. Analysis of the difference between the fuel oil per the Chief Engineer and
the BDN receipt showed that there were no significant differences (Figure 4, Figure 5, and Figure
6). These redundant and independent measurements are necessitated due to the significant
financial transactions and typically preclude frequent gross error (>5%) in the BDN data set.
The data presented in the following figures are given as the mass measured per the Chief Engineer
minus the mass determined from the BDN receipt. Positive percentages indicate the Chief
Engineer had a larger mass measurement than what was reported from the BDN receipt. Another
important distinction is that copies of the actual BDN receipts were provided for Ships 1 to 16,
whereas the values for Ships 20 to 46 were included in a spreadsheet. Only one value was given
for Ships 17 to 19 with no distinction between the BDN receipt and Chief Engineer.
Figure 4: Difference between bunkered HFO determined from Chief Engineer and the BDN receipt
for one calendar year.
For the HFO, there are only three different ships with differences greater than 2%. Ship 27 had
one BDN receipt value that appeared to be entered incorrectly into the spreadsheet, the Chief’s
value was 1,796 tons whereas the BDN receipt was marked 180.005 tons. This discrepancy
strongly suggests that human error in cataloging the data accounted for the difference. The
difference from Ship 32 is dominated by one entry where the difference between the Chief
Engineer and the BDN receipt is approximately 1,500 tons. Ship 38 had a percent difference of
2.2% which was approximately 40 tons between two different bunkerings. Removing the value
for Ship 27, the average difference is reduced to 0.4% and the standard deviation is 1.2%.
The differences were smaller for the MDO and MGO data. Only Ship 29 had a difference greater
than ± 2% for the MDO values (Figure 5). This was due to a 7 ton difference in one of the
bunkerings. The MGO values had slightly larger differences, with three ships having differences
greater than ± 2% (Figure 6). Ship 25 had a difference of 2.4% due to a 10 ton difference. Similar
to the HFO, Ship 27 had an error that appears to be associated with entering the value incorrectly
into the spreadsheet. The value from the BDN receipt appears to have been copied from the
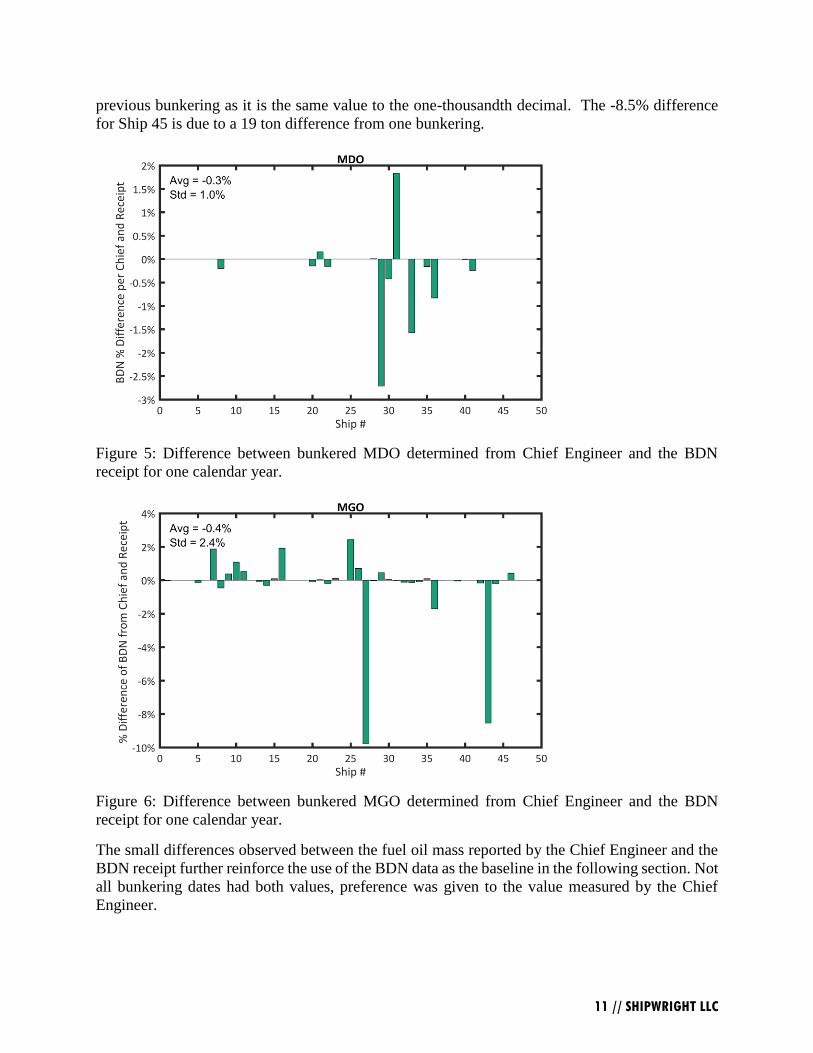
11 // SHIPWRIGHT LLC
previous bunkering as it is the same value to the one-thousandth decimal. The -8.5% difference
for Ship 45 is due to a 19 ton difference from one bunkering.
Figure 5: Difference between bunkered MDO determined from Chief Engineer and the BDN
receipt for one calendar year.
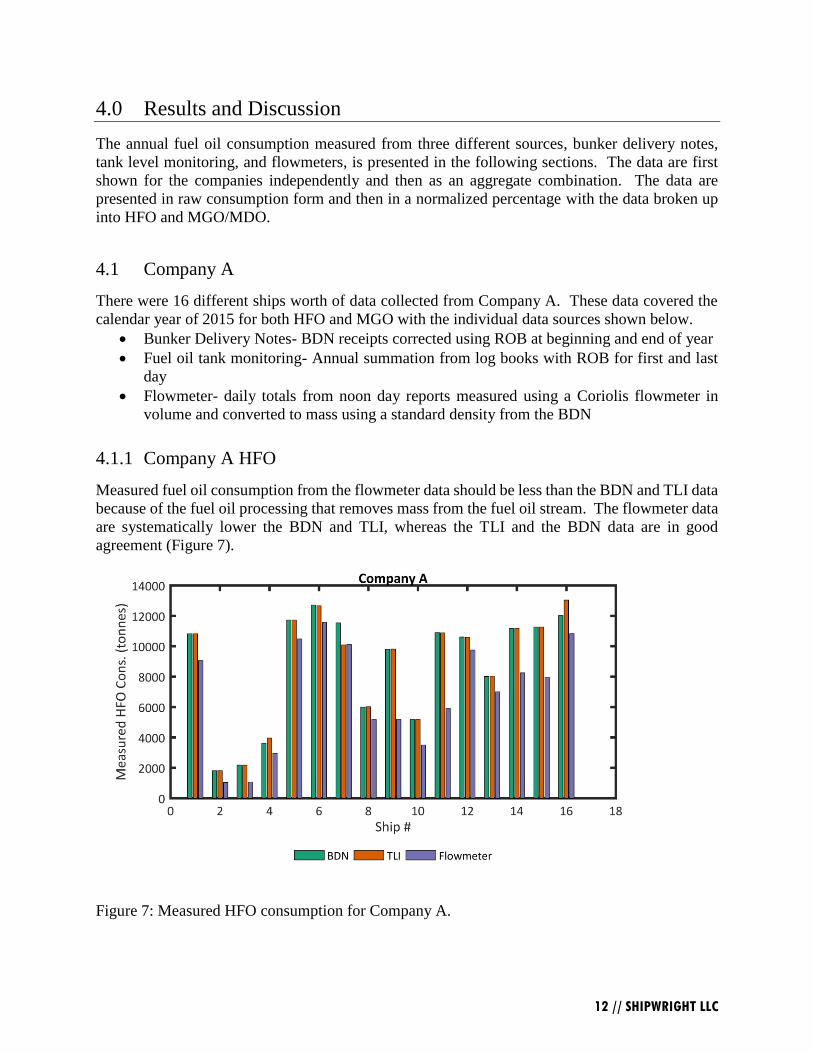
Figure 6: Difference between bunkered MGO determined from Chief Engineer and the BDN
receipt for one calendar year.
The small differences observed between the fuel oil mass reported by the Chief Engineer and the
BDN receipt further reinforce the use of the BDN data as the baseline in the following section. Not
all bunkering dates had both values, preference was given to the value measured by the Chief
Engineer.
12 // SHIPWRIGHT LLC
4.0 Results and Discussion
The annual fuel oil consumption measured from three different sources, bunker delivery notes,
tank level monitoring, and flowmeters, is presented in the following sections. The data are first
shown for the companies independently and then as an aggregate combination. The data are
presented in raw consumption form and then in a normalized percentage with the data broken up
into HFO and MGO/MDO.
4.1 Company A
There were 16 different ships worth of data collected from Company A. These data covered the
calendar year of 2015 for both HFO and MGO with the individual data sources shown below.
• Bunker Delivery Notes- BDN receipts corrected using ROB at beginning and end of year
• Fuel oil tank monitoring- Annual summation from log books with ROB for first and last
day
• Flowmeter- daily totals from noon day reports measured using a Coriolis flowmeter in
volume and converted to mass using a standard density from the BDN
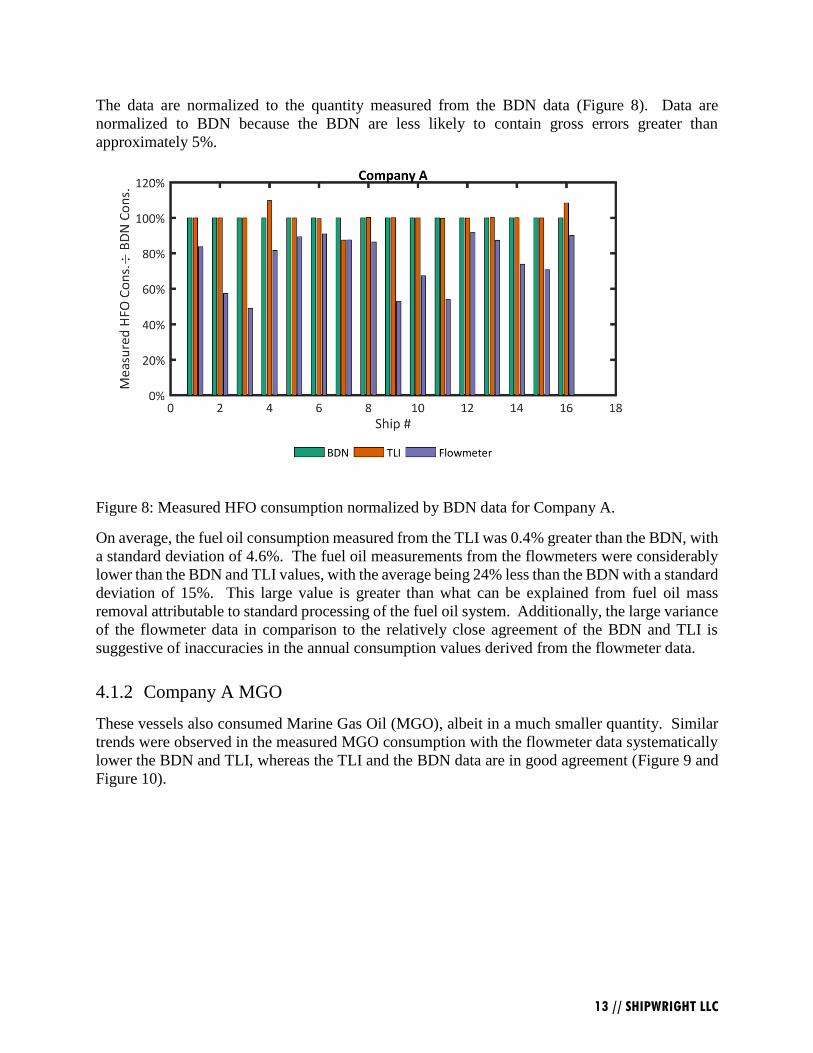
4.1.1 Company A HFO
Measured fuel oil consumption from the flowmeter data should be less than the BDN and TLI data
because of the fuel oil processing that removes mass from the fuel oil stream. The flowmeter data
are systematically lower the BDN and TLI, whereas the TLI and the BDN data are in good
agreement (Figure 7).
Figure 7: Measured HFO consumption for Company A.
13 // SHIPWRIGHT LLC
The data are normalized to the quantity measured from the BDN data (Figure 8). Data are
normalized to BDN because the BDN are less likely to contain gross errors greater than
approximately 5%.
Figure 8: Measured HFO consumption normalized by BDN data for Company A.
On average, the fuel oil consumption measured from the TLI was 0.4% greater than the BDN, with
a standard deviation of 4.6%. The fuel oil measurements from the flowmeters were considerably
lower than the BDN and TLI values, with the average being 24% less than the BDN with a standard
deviation of 15%. This large value is greater than what can be explained from fuel oil mass
removal attributable to standard processing of the fuel oil system. Additionally, the large variance
of the flowmeter data in comparison to the relatively close agreement of the BDN and TLI is
suggestive of inaccuracies in the annual consumption values derived from the flowmeter data.
4.1.2 Company A MGO
These vessels also consumed Marine Gas Oil (MGO), albeit in a much smaller quantity. Similar
trends were observed in the measured MGO consumption with the flowmeter data systematically
lower the BDN and TLI, whereas the TLI and the BDN data are in good agreement (Figure 9 and
Figure 10).

14 // SHIPWRIGHT LLC
Figure 9: Measured MGO consumption for Company A.
Figure 10: Measured MGO consumption normalized by BDN data for Company A.
On average, the TLI consumption was 1.5% less than the values determined from the BDN data,
with a standard deviation of 7.5%. Flowmeter consumption measurements were on average 60%
less than the BDN values, with a standard deviation of 17 %.

15 // SHIPWRIGHT LLC
4.1.3 Company A Collective Analysis
Both the HFO and MGO measured fuel oil consumption showed very similar trends, with BDN
and TLI data in relatively good agreement and the flowmeter consumption data systematically
less. Additionally, the variance in the TLI data with respect to the values from the BDN data is
considerably lower than the variance in the flowmeter data (Table 2).
Table 2: Average and standard deviation of fuel oil measurements compared to BDN data for
Company A.
Average % difference compared to
BDN
Standard deviation of % difference
compared to BDN
TLI Flowmeter TLI Flowmeter
HFO 0.37% -24% 4.6% 15%
MGO -1.5% -60% 7.5% 17%
4.2 Company B
Data from three different ships were supplied during the calendar year of 2016 with the individual
sources shown below.
• Bunker Delivery Notes- List of BDN data showing port location, date, fuel grade, and
quantity
• Fuel oil tank monitoring- Daily values showing both HFO and MGO consumption
• Flowmeter- Average mass/hour consumption at 30-minute intervals recorded from vessel
performance monitoring program determined from a Coriolis mass flowmeter
There was no differentiation in the flowmeter data with respect to the fuel oil type. Additionally,
examining the trends in the fuel oil consumption for all three vessels indicated periodic data
outages and gross error in the flowmeter data (Figure 11, Figure 12, and Figure 13).

16 // SHIPWRIGHT LLC
Figure 11: Measured fuel oil consumption during 2016 for Ship B1.
Figure 12: Measured fuel oil consumption during 2016 for Ship B2.

17 // SHIPWRIGHT LLC
Figure 13: Measured fuel oil consumption during 2016 for Ship B3.
4.2.1 Company B HFO
While the flowmeter data appear to contain relatively large gross errors, the data are shown in the
following figures for completeness. Additionally, there were no tags associated with the flowmeter
data to indicate if the fuel oil being consumed was HFO or MGO.
Similar to Company A, the annual fuel oil measurements determined from the BDN and TLI
sources are in relatively close agreement (Figure 14 and Figure 15).
Figure 14: Measured HFO consumption for Company B.

18 // SHIPWRIGHT LLC
Figure 15: Measured HFO consumption normalized by BDN data for Company B.
On average, the fuel oil consumption measured from the TLI was 0.12% larger than the BDN, with
a standard deviation of 3.6%. The fuel oil measurements from the flowmeters were not considered
for a comparative analysis for Company B because of what appears to be large errors in the fuel
oil consumption derived from the flowmeter data. The relatively close agreement between the
BDN and the TLI data is similar to what is observed for Company A.
4.2.2 Company B MGO
These vessels also consumed MGO with similar trends observed in the measured consumption
with the BDN and TLI values in relatively good agreement (Figure 16 and Figure 17).
Figure 16: Measured MGO consumption for Company B.

19 // SHIPWRIGHT LLC
Figure 17: Measured MGO consumption normalized by BDN data for Company B.
On average, the TLI data were -1.3% with a standard deviation of 5.1%. The flowmeter data did
not indicate the type of fuel oil consumed.
4.2.3 Company B Collective Analysis
Similar to the results from Company A and as indicated in the background section, the HFO and
MGO measured fuel oil consumption showed the BDN and TLI data to be in relatively good
agreement (Table 3). The flowmeter data are not shown in the combined analysis because the
cumulative summation of the consumption data shows what appears to be gross error in the fuel
oil measurements.
Table 3: Average and standard deviation of fuel oil measurements compared to BDN data for
Company B.
Average % difference compared to
BDN
Standard deviation of % difference
compared to BDN
TLI Flowmeter TLI Flowmeter
HFO 0.12% N/A 3.6% N/A
MGO -1.3% N/A 5.1% N/A

20 // SHIPWRIGHT LLC
4.3 Company C
Fuel oil consumption data were supplied for 27 different ships from Company C. While the raw
data covered a multi-year period, only the calendar year of 2016 was examined. Additionally, no
fuel oil tank monitoring data were supplied.
• Bunker Delivery Notes- List of BDN data showing port location, date, fuel grade, densities,
receipt quantity, and quantity per Chief Engineer
• Fuel oil tank monitoring- No data were available
• Flowmeter- daily totals from noon day reports determined from a volumetric flowmeter
The vessels from Company C reported consumptions for HFO, MGO, and MDO. There were
several vessels where there could have been some misreporting of MGO and MDO (Table 4). To
avoid any confusion, and to keep a similar grouping as Companies A and B, the MGO data were
combined with the MDO data.
Table 4: Comparison of annual MDO and MGO consumption (tonnes) for Company C vessels.
MGO MDO
Ship # Flowmeter BDN Flowmeter BDN
C1 702 358 0 352
C2 915 656 0 301
C3 682 642 181 121
C8 376 1,845 852 0
C9 5,624 4,790 0 1,055
C10 1,292 1,219 0 666
C11 1,426 838 0 805
C12 0 2,842 5,179 3,151
C13 607 530 0 100
C14 694 475 0 300
C15 401 935 242 0
C17 6,095 1,592 0 5,986
C20 4,352 805 25 4,374
C22 7,046 0 2,539 11,394
4.3.1 Company C HFO
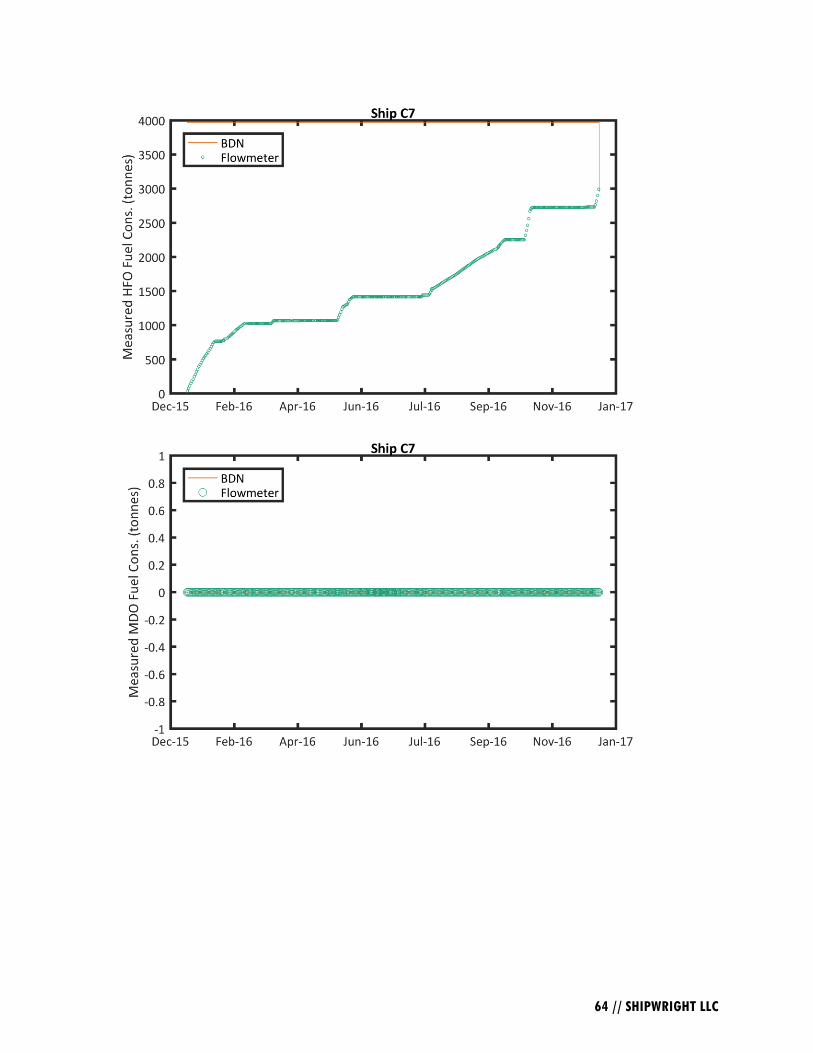
Several of the ships from Company C did not have HFO data for 2016. Ships C7 and C21 did not
have any HFO BDN data for 2016, the measured HFO consumption derived from the flowmeter

21 // SHIPWRIGHT LLC
data was 2,990 tonnes for ship C7 and 0 tonne for ship C21. Additionally, ship C20 did not have
any HFO flowmeter data whereas the BDN values indicated a consumption of 867 tonnes. Both
the BDN and flowmeter data are not included for these vessels in the following figures showing
the HFO consumption for Company C (Figure 18 and Figure 19).
Figure 18: Measured HFO consumption for Company C.
Figure 19: Measured HFO consumption normalized by BDN data for Company C.
The differences between the measured HFO consumption from BDN’s and flowmeters for ships
C6, C9, and C17 were greater than 100%. Discarding these three vessels, the average difference
between the BDN and flowmeter was -2% with a standard deviation of 17%.

22 // SHIPWRIGHT LLC
4.3.2 Company C MGO and MDO
The MGO and MDO fuel oil consumption were combined for Company C to mitigate any potential
error due to misreporting of the data and to keep the fuel oil consumption consistent with the other
two shipping companies.
Similar to the HFO consumption for Company C, several of the vessels did not have any MGO
and/or MDO consumption for 2016. There were no BDN data for ships C5 and C19 for 2016,
flowmeter data from those ships measured an annual fuel oil consumption of 373 tonnes and 793
tonnes respectively. Of note is that the vessels bunkered some MGO in 2015 and 2017. The
comparison of the MGO/MDO consumption does not include the data from these ships (Figure 20
and Figure 21).
Figure 20: Measured MGO and MDO consumption for Company C.

23 // SHIPWRIGHT LLC
Figure 21: Measured MGO and MDO consumption normalized by BDN data for Company C.
The comparison of the MGO and MDO consumption determined from flowmeter and BDN data
show a large disagreement for Ship C7. Disregarding this vessel, the flowmeter data were on
average 16% less than the BDN values with a standard deviation of 15%.
4.3.3 Company C Collective Analysis
Similar to Company A, the annual fuel oil consumption measured by flowmeters were less than
the values determined using the BDN’s (Table 5). Moreover, the relatively large variance suggests
the errors for one or both of these measurement methods are not systematic in nature, but rather
from independent sources.
Table 5: Average and standard deviation of fuel oil measurements compared to BDN data for
Company C.
Average % difference compared to
BDN
Standard deviation of % difference
compared to BDN
TLI Flowmeter TLI Flowmeter
HFO N/A -2.0% N/A 17%
MGO and
MDO N/A -16% N/A 15%

24 // SHIPWRIGHT LLC
4.4 Combined
The results for the fuel oil consumption measurements are presented for all 46 ships from three
different shipping companies. Not all the data from every ship were included in the analysis, as
some vessels did not include one of the fuel oil measurement methods and several vessels had data
that appeared to contain some level of error.
The flowmeter data from ships B1, B2, and B3 were not included due to the presence of what
appears to be gross error. The TLI values for all the vessels from Company C were not included
because the data were not supplied during the original data acquisition.
Note that each individual ship used in the combined analysis, regardless of company, was treated
as an independent sample. This approach was adopted, as the error in the measured fuel oil
consumption for each ship was taken as independent and not a function of the specific company.
The relative similarities in the differences between the TLI and flowmeter data compared with the
BDN values observed for all three companies supported this approach.
4.4.1 Combined HFO Analysis
The HFO data for ships C7 and C21 were not included because there were no bunkering records
for 2016. The measured HFO consumption for ships C6, C9, and C17 were not included because
there were differences between BDN and flowmeter values greater than 100%.
After the spurious data were removed, the following data remained: 19 ships for the HFO TLI and
37 ships for the HFO flowmeter. The TLI and flowmeter data were plotted against the values
determined from the BDN (Figure 22). A linear polynomial line was fitted to both the TLI and
flowmeter data.
Figure 22: HFO consumption measured with TLI and flowmeters compared with BDN. The
solid lines show a linear polynomial line fitted to the respective data.

25 // SHIPWRIGHT LLC
The slope of the two lines are nearly identical, with the TLI having a slope of 0.99 and the
flowmeter best fit line a value of 1.01. The relatively good agreement and the slope of both lines
approaching unity, shows that the aggregate accumulation of all three data sources are in generally
good agreement for the measured HFO consumption.
Examining the differences between each of the data points and normalizing the quantities to the
BDN data show the average and variance of the differences between the three data sources (Figure
23 and Figure 24).
Figure 23: Percent difference of the HFO consumption measured from BDN and TLI data.
Figure 24: Percent difference of the HFO consumption measured from BDN and flowmeter data.

26 // SHIPWRIGHT LLC
The TLI data are in much better agreement than the flowmeter data with the TLI data being 0.33%
larger than the BDN data with a standard deviation of 4.4%. The flowmeter data were not as
agreeable, as the data had an average difference of 12% lower than the BDN data and a standard
deviation of 19%.
4.4.2 Combined MGO and MDO Analysis
The MGO data from ships C5 and C19 were not included because there were no BDN records for
2016 and the data from ship C7 were omitted because the difference between the total fuel
consumption from the flowmeter and BDN was greater than 100%.
After the spurious data were removed, the following data remained: 19 ships for the MGO/MDO
TLI and 40 ships for the MGO/MDO flowmeter. The TLI and flowmeter data were plotted against
the values determined from the BDN (Figure 25). A linear polynomial line was fitted to both the
TLI and flowmeter data.
Figure 25: MGO and MDO consumption measured with TLI and flowmeters compared with BDN.
The solid lines show a linear polynomial line fitted to the respective data.
Similar to the HFO data, the slope of the linear best-fit line indicates a relatively good agreement
between the aggregate BDN and TLI data for the measured MGO/MDO consumption. The
aggregate flowmeter data, however, are not in good agreement with the with the BDN data.
The difference between each of the data points normalized to the values for the BDN data show
the average and variance between all the three data sources for the MGO/MDO consumption
(Figure 26 and Figure 27).

27 // SHIPWRIGHT LLC
Figure 26: Percent difference of the MGO and MDO consumption measured from BDN and TLI
data.
Figure 27: Percent difference of the MGO and MDO consumption measured from BDN and
flowmeter data.
Similar to the HFO data, the MGO/MDO TLI data are in much better agreement with the BDN
data, with the TLI data being 1.5% less than the BDN data with a standard deviation of 7.1%. The
flowmeter data were not as agreeable, with the data average difference 34% lower than the BDN
data and a standard deviation of 27%.

28 // SHIPWRIGHT LLC
4.4.3 Combined Collective Analysis
The percent differences of all the TLI and flowmeter data in comparison to the BDN data are very
similar for the three companies and the analysis of all vessels combined (Table 6).
The average differences between the TLI and BDN data were small, with the HFO values ranging
from 0.12% to 0.37% and the MGO/MDO ranging from -1.3% to -1.5%. The standard deviation
of the differences ranged from 3.6% to 4.6% for the HFO and 5.1% to 7.5% for the MGO/MDO.
The average differences for the flowmeter and the BDN data were larger than the TLI data, with
the flowmeter data being on average 2% to 24% less than the BDN values for the HFO data and
16% to 60% less than the MGO/MDO data. There was also more variance in the difference
between the flowmeter and BDN data, with the standard deviations ranging from 15% to 19% for
the HFO data and 15% to 27% for the MGO/MDO data.
Table 6: Average and standard deviation of fuel oil measurements compared to BDN data for
Companies A, B, and C and all vessels combined.
FO
Average % difference
compared to BDN
Standard deviation of %
difference compared to BDN
TLI Flowmeter TLI Flowmeter
Company A
HFO 0.37% -24% 4.6% 15%
MGO -1.5% -60% 7.5% 17%
Company B
HFO 0.12% N/A 3.6% N/A
MGO -1.3% N/A 5.1% N/A
Company C
HFO N/A -2.0% N/A 17%
MGO and
MDO N/A -16% N/A 15%
Combined
HFO 0.33% -12% 4.4% 19%
MGO and
MDO -1.5% -34% 7.1% 27%

29 // SHIPWRIGHT LLC
4.5 Estimated Uncertainties
The bunker delivery notes have been reported to have an accuracy ranging from 1% to 5%, tank
level monitoring an accuracy of 2% to 5%, and flowmeter data an accuracy of 3% or better (Faber
et al. 2013). Whilst these values are qualitative in nature, they are generally accepted in standard
industry practice (Jones 2009, personal communication).
To determine the absolute quantitative error for each of the annual fuel oil consumption
measurements methods, a ‘true’ consumption value is needed. Due to a myriad of factors, this
value cannot be practically determined in a ‘field’ setting during continuous ship operation.
Since the ‘exact’ true value for the fuel oil consumption cannot be determined, some baseline value
is needed to establish a reference point. The BDN data were chosen as the reference value in this
study because the multiple independent measurements for the BDN data typically preclude
frequent gross error (>5%) in the data set. Additionally, by selecting the values from the BDN
data as a reference, the uncertainty for the flowmeter and TLI data can be estimated with respect
to the values from the BDN’s.
Whilst this approach will not determine the exact error, comparison of data from the three different
measurement methods does provide insight to the overall quality of the data that can be used to
estimate the overall uncertainty. Moreover, since the errors from each of the ships are taken as
independent, the Student’s t-distribution can be used to estimate the variance for all of shipping
using a relatively small sample population (46 ships in this study). Limitations of this approach
will be addressed in the Discussion section 4.6.
The standard deviation and degrees of freedom from the sample population (vessels in this study),
were used to estimate the overall uncertainty in the TLI and flowmeter data in comparison with
the BDN data for the parent population (all of shipping). This estimation was undertaken using
the Student’s t-distribution at a 95% confidence level from Coleman and Steele (2009).
The uncertainty estimation found that the difference between annual consumption determined from
TLI and BDN data is estimated to have a difference of 0.33% ± 1.8% for HFO and -1.5% ± 3.4%
for MGO/MDO. The estimated uncertainty in the difference between the flowmeter and the BDN
data are -12% ± 6.5% for the HFO and -34% ± 8.6%.
Table 7: Estimated mean and uncertainty values when compared to BDN data at a 95%
confidence level.
TLI Flowmeter
HFO 0.33% ± 1.8% -12% ± 6.5%
MGO/MDO -1.5% ± 3.4% -34% ± 8.6%
The relatively similarity between the TLI and BDN data are in reasonable agreement with the
estimate that approximately 1.5% and 0.5% of HFO and MDO respectively can become sludge.
Additionally, some error associated with the measurement of BDN values could also account for
the differences in the TLI and BDN data in Table 7. The flowmeter data, however, have

30 // SHIPWRIGHT LLC
differences that are significantly larger than what can be reasonably attributed to fuel oil processing
and inaccuracy in the BDN data. It should be cautioned, however, that these uncertainty
estimations are based on a relatively small sample in comparison to the total number of vessels in
shipping.
Additionally, the relatively close agreement of the BDN and TLI data in comparison to the values
determined from the flowmeters does not necessarily indicate that the BDN and TLI data are more
accurate because 1) the relatively close comparison of the BDN and TLI data can be partially
attributed to the tank level monitoring being used to determine ROB values incorporated into the
annual BDN consumption measurements and 2) the fuel oil processing can alter the mass of the
measured fuel oil consumption downstream of the BDN and TLI measurement locations before
the point where the flowmeter data are collected.
The relatively large variance of the flowmeter data, even after all obvious outliers were removed,
is, however, indicative of random error negatively affecting the quality of the annual fuel oil
consumption measurement determined from the flowmeter. Moreover, all three shipping
companies having larger variance of the flowmeter data in comparison to the BDN and TLI values,
further indicates the annual consumption determined from flowmeter data are of poor quality. This
is not to say that the raw data determined from flowmeters are inaccurate, rather, the annual fuel
oil consumption determined from the flowmeter values appears to contain error.
4.6 Discussion
While the TLI and BDN data appear to be in relative agreement, the differences between the annual
fuel oil consumption measured by flowmeters with respect to the BDN data (-12% ± 6.5% for
HFO and -34% ± 8.6% for MGO/MDO) are significantly larger than what has been previously
estimated (Faber et al. 2013) and accepted as standard in the shipping industry (Jones 2009,
personal communication).
While the sources of these differences are not definitely known, there are several possibilities when
interpreting these results:
• Annual fuel oil consumption measured from TLI and BDN are more accurate than values
measured from flowmeter data
• Relatively poor agreement of the flowmeter data in comparison to BDN and TLI sources
is a coincidental artifact of this study due to a relatively small sample size and does not
reflect all of shipping
4.6.1 Accuracy of Annual Fuel Oil measured by BDN and TLI
The main finding from this study is that the annual fuel oil consumption measured using BDN and
TLI data are in significantly better agreement than the annual fuel oil consumption determined
using flowmeter data. This suggests that the annual fuel oil consumption determined from TLI
and BDN data are more accurate. Possible reasons for this are discussed in the following sections.

31 // SHIPWRIGHT LLC
4.6.1a Measurement Redundancy in TLI and BDN Data
During the bunkering process, the crew measures the tank levels before and after the bunkering
operations to independently check the volume of the fuel oil bunkered. This means that two
parties, both with substantial financial incentives, are independently measuring the BDN values.
Both the BDN and TLI data are typically verified using manual tank soundings; whereas, the crew
cannot independently verify the data from a flowmeter using a manual method.
The tank level gauges are frequently monitored and reported as part of the stability reports. An
inaccurate tank level sensor should be observed during these calculations and a manual sounding
could be used in place of a malfunctioning tank level sensor to determine the volume in a fuel oil
tank.
The engineers monitor the flowmeter data onboard the ship, but if a flowmeter malfunctions, the
instrument can be bypassed with no practical means of taking a manual redundant measurement.
4.6.1b Flowmeter Data Outages and Sampling Frequency
The frequency of flowmeter measurements (several measurements per second) could also lead to
errors in the determination of annual fuel consumption because the large number of measurements.
Taking an approximate sampling frequency of 1 Hz, the annual fuel oil consumption calculated
from flowmeter data would be based on millions of measurements. Whereas the annual fuel oil
consumption calculated from TLI and BDN data would be determined using 1000’s or 10’s of
measurements respectively. This several orders of magnitude increase in measurement points can
cause the annual fuel oil consumption determined from flowmeter data to be more susceptible to
error. The error could be caused by data outages from instrumentation malfunction, manual
bypassing, and/or recording errors from software and hardware. Additionally, the large number
of measurements can lead to an accumulation of error over time.
4.6.1c Error in Flowmeter Measurements
The individual flowmeter measurements can have errors attributable to calculating mass from a
standard density, mixed fuel oil, improper flowmeter installation, and systematic error associated
with a specific instrument.
Flowmeters that use volumetric flow rates to determine mass fuel oil consumption can contain
error due to thermal expansion of the fuel. A single standard density value is sometimes used with
inlet and outlet volumetric flowmeters, leading to an error in the reported mass consumption.
Based on data from ships in this study, a 10°C temperature difference caused an error of
approximately 0.7%, owing to density fluctuations.
As ships transit through Emission Control Areas (ECA), the type of fuel oil consumed changes.
This change is continuous and, if not catalogued properly, can lead to inaccuracy in the fuel oil
consumption determination.
Systematic error and improper installation are thought to be minimal contributors to the overall
error in the flowmeter measurements. Typical flowmeter manufacturers estimate that the overall
systematic error is less than 1%.
32 // SHIPWRIGHT LLC
While different types of flowmeters are susceptible to various installation errors, most instruments
require careful consideration of placement to minimize accelerations in the flow field and to ensure
proper alignment. The requirements to mitigate any installation effects are well-documented.
4.6.2 Influence of Sample Size
This study analyzed approximately 550,000 tonnes of fuel oil consumption from 46 ships over a
one-year period. There are approximately 26,000 ships of 5,000 gross tonnage and above that are
anticipated to provide data for Regulation 22A (IMO Secretariat, personal communication, 2018).
Therefore, the data in this study accounts for approximately 0.2% of the ships anticipated to report
total annual fuel oil consumption.
While this is a relatively small percentage, these results provide insight into the expected quality
of the data that will be received during the adoption of Regulation 22A.
The relative similarities observed across all ships in this study are incorporated into the estimated
uncertainties of the differences between the annual fuel oil consumption measurement methods.
For HFO, it is estimated at a 95% confidence level that the annual fuel oil consumption measured
using TLI data will have a difference of 0.33% ± 1.8% when compared with BDN data. The annual
fuel oil consumption measured using flowmeter data is estimated to have a difference of -12% ±
6.5% when compared with BDN data.
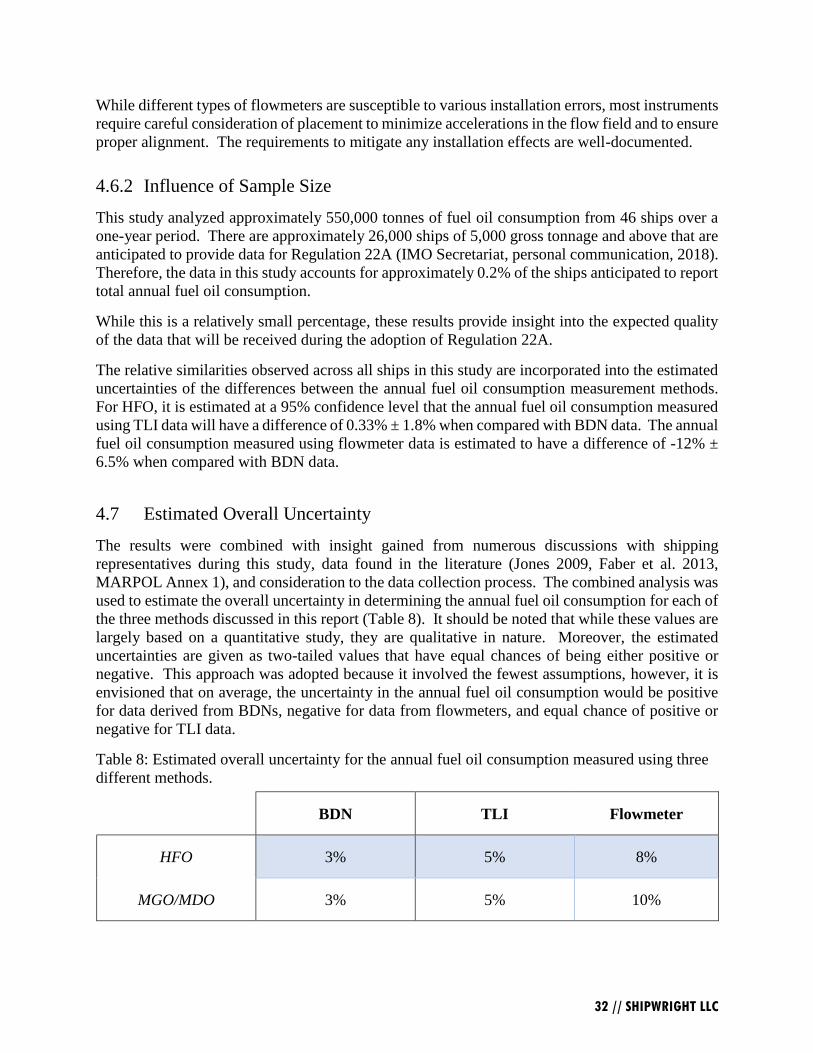
4.7 Estimated Overall Uncertainty
The results were combined with insight gained from numerous discussions with shipping
representatives during this study, data found in the literature (Jones 2009, Faber et al. 2013,
MARPOL Annex 1), and consideration to the data collection process. The combined analysis was
used to estimate the overall uncertainty in determining the annual fuel oil consumption for each of
the three methods discussed in this report (Table 8). It should be noted that while these values are
largely based on a quantitative study, they are qualitative in nature. Moreover, the estimated
uncertainties are given as two-tailed values that have equal chances of being either positive or
negative. This approach was adopted because it involved the fewest assumptions, however, it is
envisioned that on average, the uncertainty in the annual fuel oil consumption would be positive
for data derived from BDNs, negative for data from flowmeters, and equal chance of positive or
negative for TLI data.
Table 8: Estimated overall uncertainty for the annual fuel oil consumption measured using three
different methods.
BDN TLI Flowmeter
HFO 3% 5% 8%
MGO/MDO 3% 5% 10%
33 // SHIPWRIGHT LLC
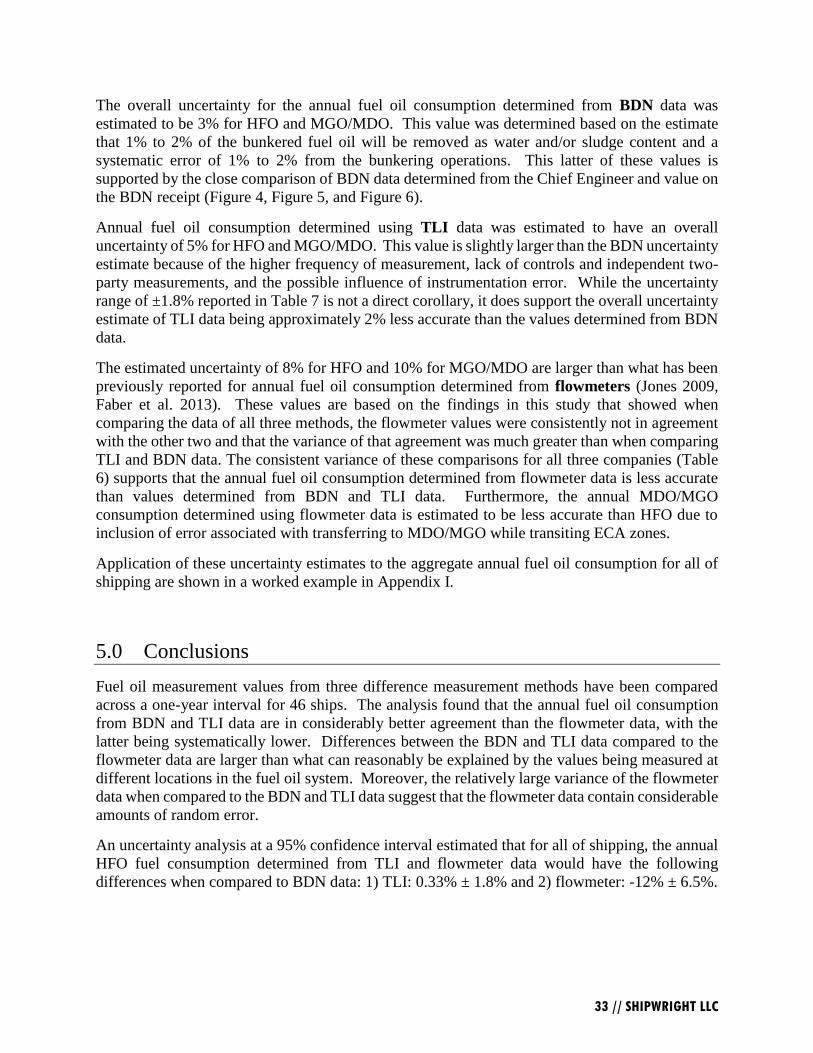
The overall uncertainty for the annual fuel oil consumption determined from BDN data was
estimated to be 3% for HFO and MGO/MDO. This value was determined based on the estimate
that 1% to 2% of the bunkered fuel oil will be removed as water and/or sludge content and a
systematic error of 1% to 2% from the bunkering operations. This latter of these values is
supported by the close comparison of BDN data determined from the Chief Engineer and value on
the BDN receipt (Figure 4, Figure 5, and Figure 6).
Annual fuel oil consumption determined using TLI data was estimated to have an overall
uncertainty of 5% for HFO and MGO/MDO. This value is slightly larger than the BDN uncertainty
estimate because of the higher frequency of measurement, lack of controls and independent two-
party measurements, and the possible influence of instrumentation error. While the uncertainty
range of ±1.8% reported in Table 7 is not a direct corollary, it does support the overall uncertainty
estimate of TLI data being approximately 2% less accurate than the values determined from BDN
data.
The estimated uncertainty of 8% for HFO and 10% for MGO/MDO are larger than what has been
previously reported for annual fuel oil consumption determined from flowmeters (Jones 2009,
Faber et al. 2013). These values are based on the findings in this study that showed when
comparing the data of all three methods, the flowmeter values were consistently not in agreement
with the other two and that the variance of that agreement was much greater than when comparing
TLI and BDN data. The consistent variance of these comparisons for all three companies (Table
6) supports that the annual fuel oil consumption determined from flowmeter data is less accurate
than values determined from BDN and TLI data. Furthermore, the annual MDO/MGO
consumption determined using flowmeter data is estimated to be less accurate than HFO due to
inclusion of error associated with transferring to MDO/MGO while transiting ECA zones.
Application of these uncertainty estimates to the aggregate annual fuel oil consumption for all of
shipping are shown in a worked example in Appendix I.
5.0 Conclusions
Fuel oil measurement values from three difference measurement methods have been compared
across a one-year interval for 46 ships. The analysis found that the annual fuel oil consumption
from BDN and TLI data are in considerably better agreement than the flowmeter data, with the
latter being systematically lower. Differences between the BDN and TLI data compared to the
flowmeter data are larger than what can reasonably be explained by the values being measured at
different locations in the fuel oil system. Moreover, the relatively large variance of the flowmeter
data when compared to the BDN and TLI data suggest that the flowmeter data contain considerable
amounts of random error.
An uncertainty analysis at a 95% confidence interval estimated that for all of shipping, the annual
HFO fuel consumption determined from TLI and flowmeter data would have the following
differences when compared to BDN data: 1) TLI: 0.33% ± 1.8% and 2) flowmeter: -12% ± 6.5%.

34 // SHIPWRIGHT LLC
Combining the results with the literature survey for this study, the overall uncertainty of each of
the fuel oil measurement methods was estimated as follows:
• BDN: 3% for HFO and MGO/MDO
• TLI: 5% for HFO and MGO/MDO
• Flowmeter: 8% for HFO and 10% for MGO/MDO
It should be cautioned, however, that these uncertainty estimations are based on a relatively small
sample with comparison to total number of vessels in shipping. Future work should utilize data
collected from at least two sources during the verification process to expand the number of
additional data from multiple different shipping companies. Additionally, it is not known if the
relatively poor agreement of the flowmeter data in comparison to BDN and TLI sources is a
coincidental artifact unique to these companies or if these findings are emblematic of accuracy
problems observed in other types of shipboard data.
6.0 Acknowledgments
The authors would like to express their sincere gratitude to Transport Canada for providing the
funding for this research and Dr. Edmund Hughes and Mr. Camille Bourgeon of the International
Maritime Organization for supporting this study. The authors are also indebted to the many
individuals and companies who wish to remain nameless that assisted in the data acquisition
process.
7.0 Bibliography
Chinoy, KH. 2013. Tricks of the Bunker Trade: Fuel Delivered with High Water Content.
Retrieved from Ship & Bunker: https://shipandbunker.com/news/features/bunker-quality-
quantity/639868-tricks-of-the-bunker-trade-fuel-delivered-with-high-water-content
Coleman, HW, Steele, WG. 2009. Experimentation, validation, and uncertainty analysis for
engineers. John Wiley & Sons.
Faber, JF, Nelissen, D, Smit, ME. 2013. Monitoring of Bunker Fuel Consumption: Report. CE
Delft.
Ford, MC. 2012. A Master's Guide to Using Fuel Oil Onboard Ships. London, UK: American
Bureau of Shipping.
International Maritime Organization (IMO). 2015. Third IMO GHG Study 2014. International
Maritime Organization, London, UK.
International Organization for Standardization (ISO). 1993. Guide to the Expression of
Uncertainty in Measurement, Geneva.
Jones, S. Critical Mass. 2009. Bunkerspot, Vol 6, No. 1. Pp. 42-43

35 // SHIPWRIGHT LLC
MATLAB Release 2017a, The MathWorks, Inc., Natick, Massachusetts, United States.
Tavoularis, S. 2005. Measurement in Fluid Mechanics. Cambridge University Press.
Winkler, MF. 1992. Fuels and Fuel Treatment Chapter. Book: Marine Engineering. Ed. Roy
Harrington. SNAME, Jersey City, NJ.

36 // SHIPWRIGHT LLC
8.0 Appendix I: Worked Example with Estimated Uncertainties
A worked example is provided in the following section to show how the overall uncertainty
estimates in Table 8 can be used to estimate the uncertainty for aggregate data sets.
Suppose that 10 ships have supplied data as shown in Table 9, the total estimated uncertainty can
be determined by applying the uncertainty estimate to each individual ship.
Table 9: Fictitious fuel oil consumption values and associated uncertainty estimates used for
worked example.
HFO
(tonnes)
MDO/MGO
(tonnes) Source
Estimated Uncertainties
HFO MDO/MGO
Ship A 9,353 1,341 BDN 280.59 40.23
Ship B 5,602 1,043 BDN 168.06 31.29
Ship C 7,017 1,861 BDN 210.51 55.83
Ship D 5,055 550 BDN 151.65 16.5
Ship E 9,327 621 BDN 279.81 18.63
Ship F 8,712 1,430 BDN 261.36 42.9
Ship G 6,795 911 TLI 339.75 45.55
Ship H 9,680 369 TLI 484 18.45
Ship I 6,510 2,237 Flowmeter 520.8 223.7
Ship J 5,256 224 Flowmeter 420.48 22.4
Total 73,307 10,587 3,117.01 515.48
Alternatively, the estimated uncertainties can be applied to the proportional distribution of the fuel
oil measurement methods as determined by distribution of mass and not the number of ships. For
example, the BDN measurement method is used by 60% of the ships in Table 9, 20% use TLI, and
20% use flowmeter. The mass distribution for HFO is slightly different:
(9,353+5,602+7,017+5,055+9,327+8,712)÷73,307=61.5% for BDN, 22.5% for TLI, and 16.0%
for flowmeter. The mass distribution is the value used to determine the percentage overall
uncertainty. The total percentage uncertainty for this fictitious example can be determined as
61.5% ∗ 3% + 22.5% ∗ 5% + 16.0% ∗ 8% = 4.25%.
This approach can also be used to estimate the total uncertainty of the aggregate data that will be
received during the data collection in Regulation 22A. Envisioning 80% of the measured fuel oil
consumption will be determined using BDN data, 15% using TLI data, and 5% from flowmeters
(IMO Secretariat, personal communication, 2018), the overall uncertainty can be estimated as
approximately 3.6%.

37 // SHIPWRIGHT LLC
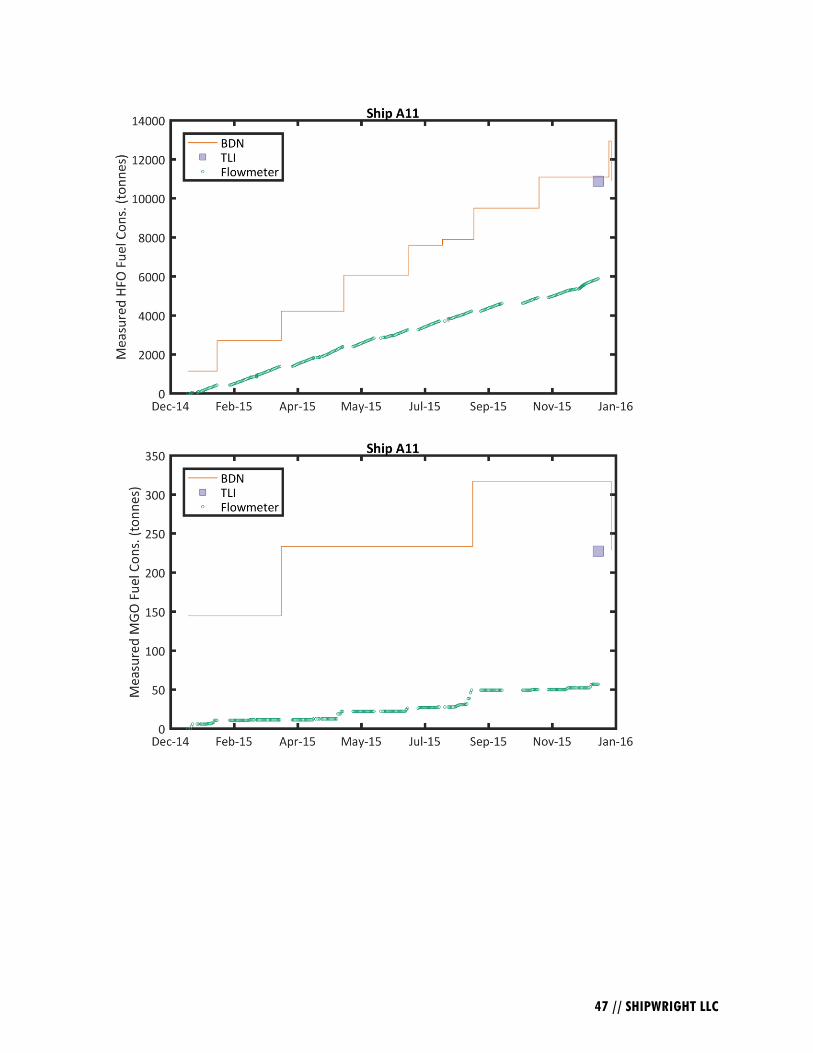
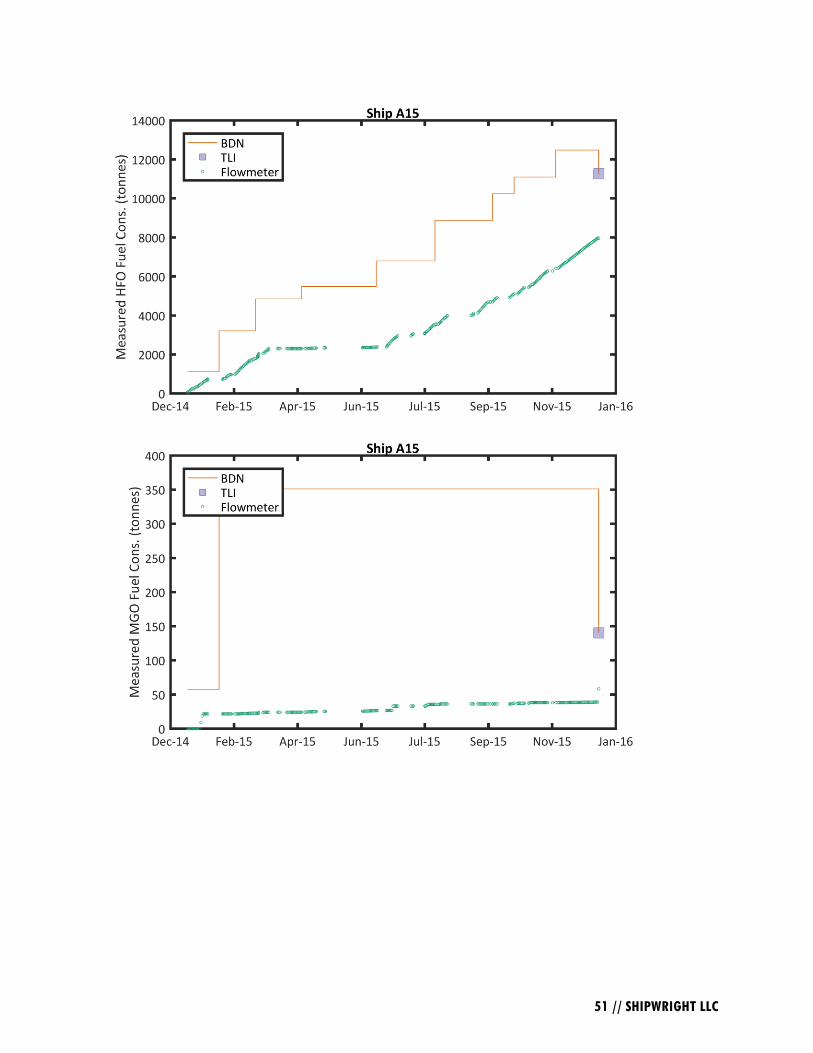
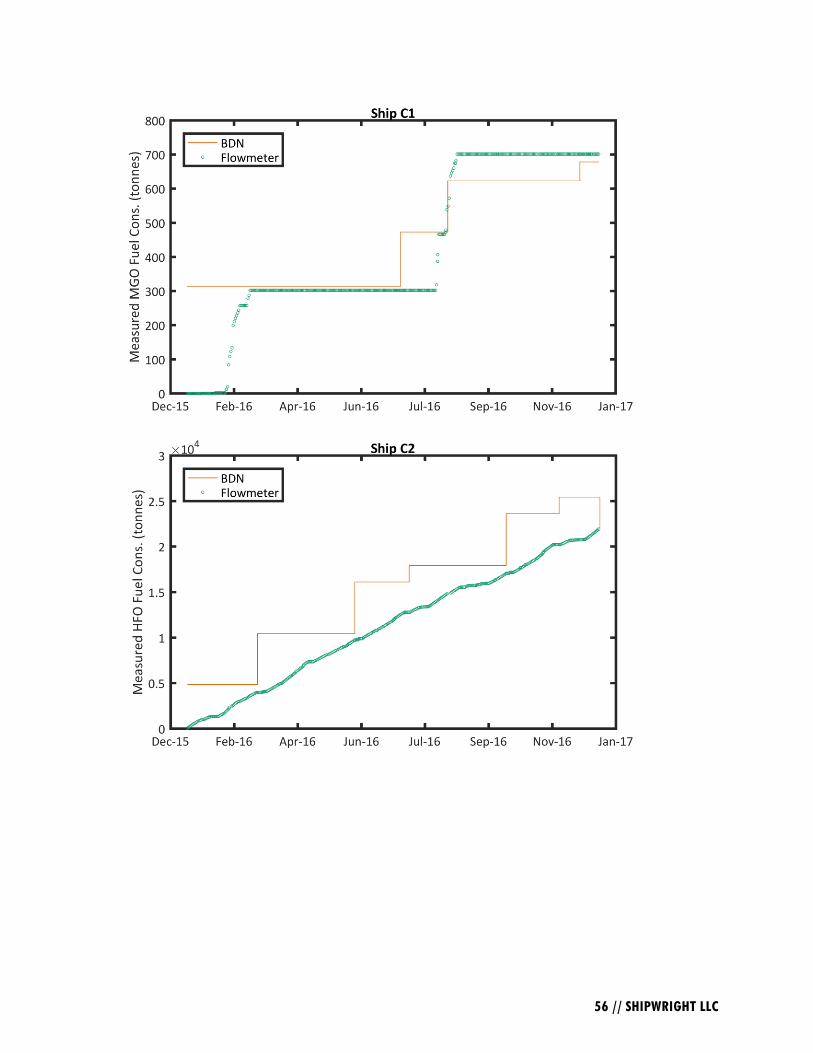
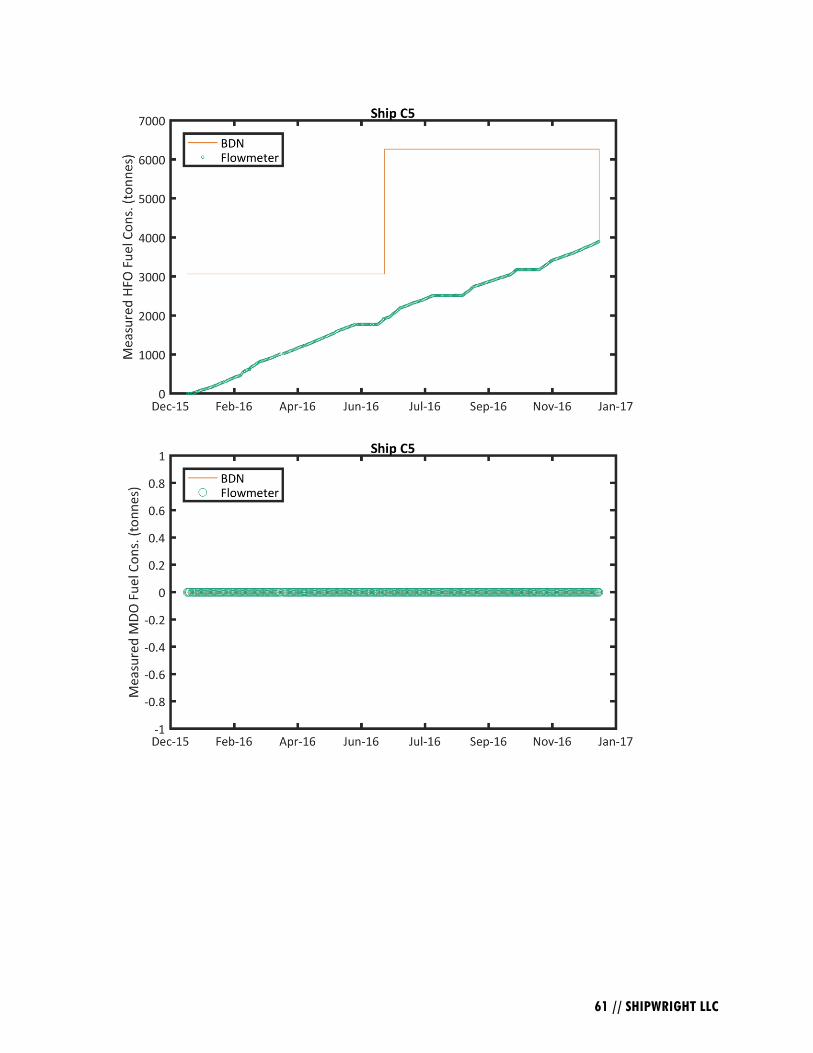
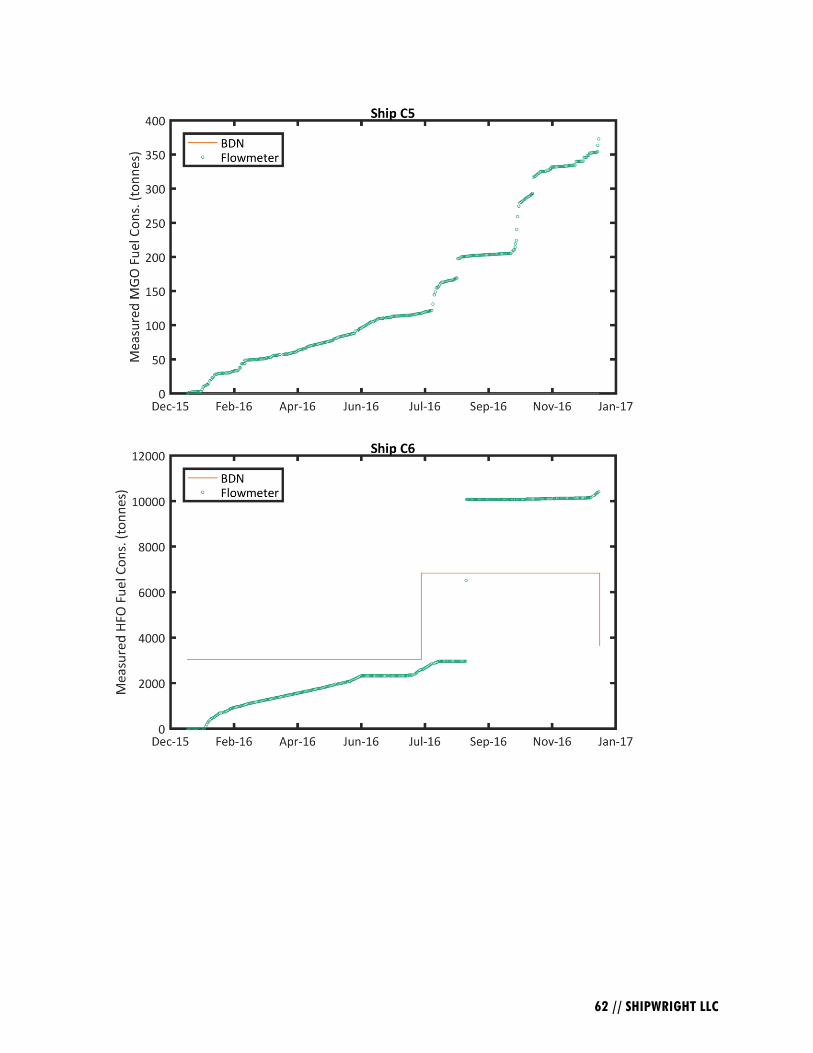
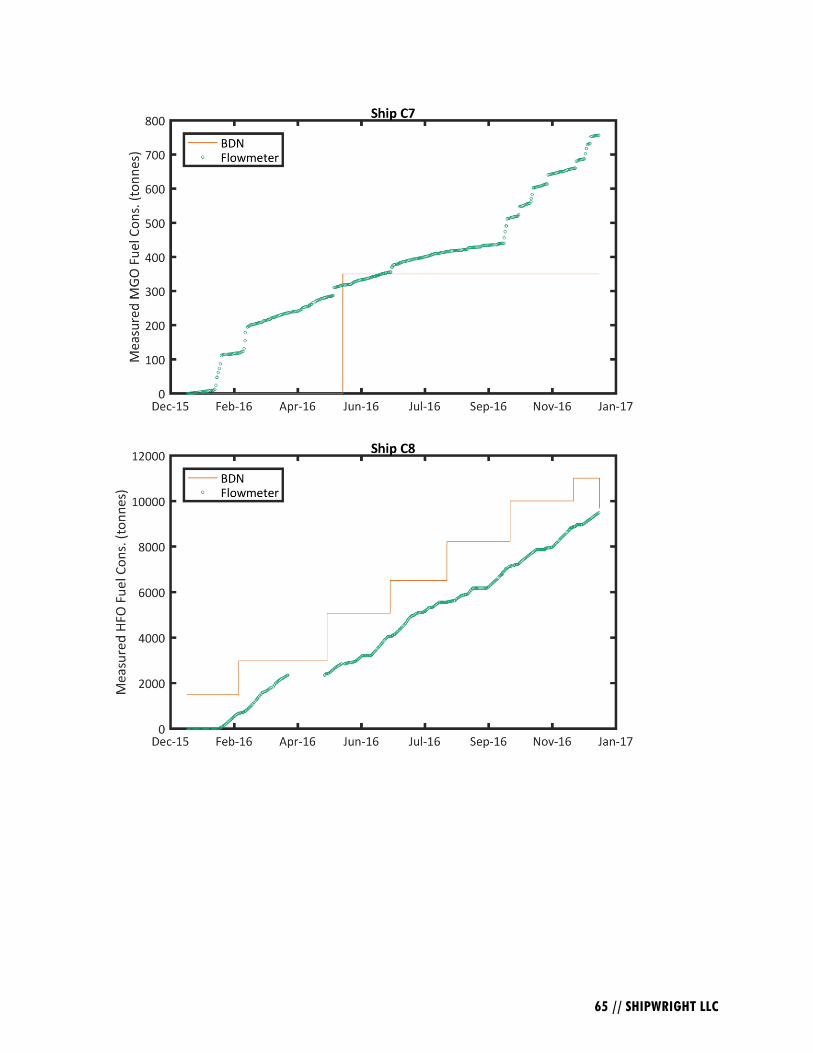
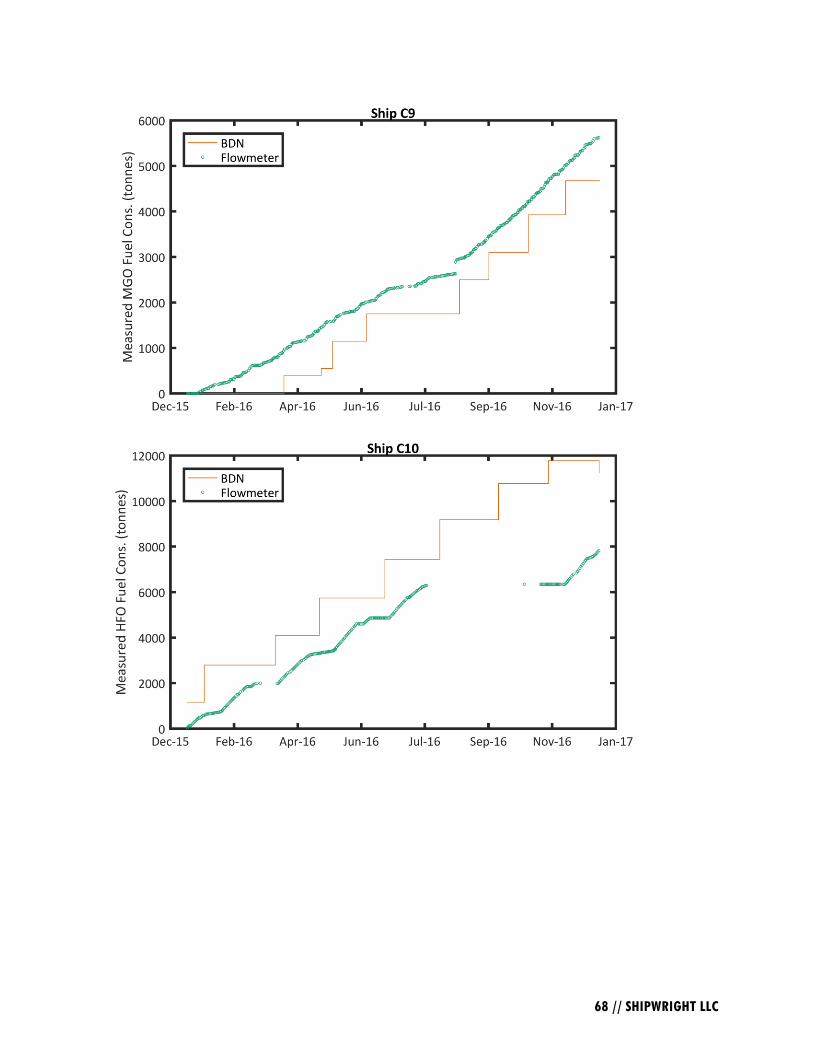
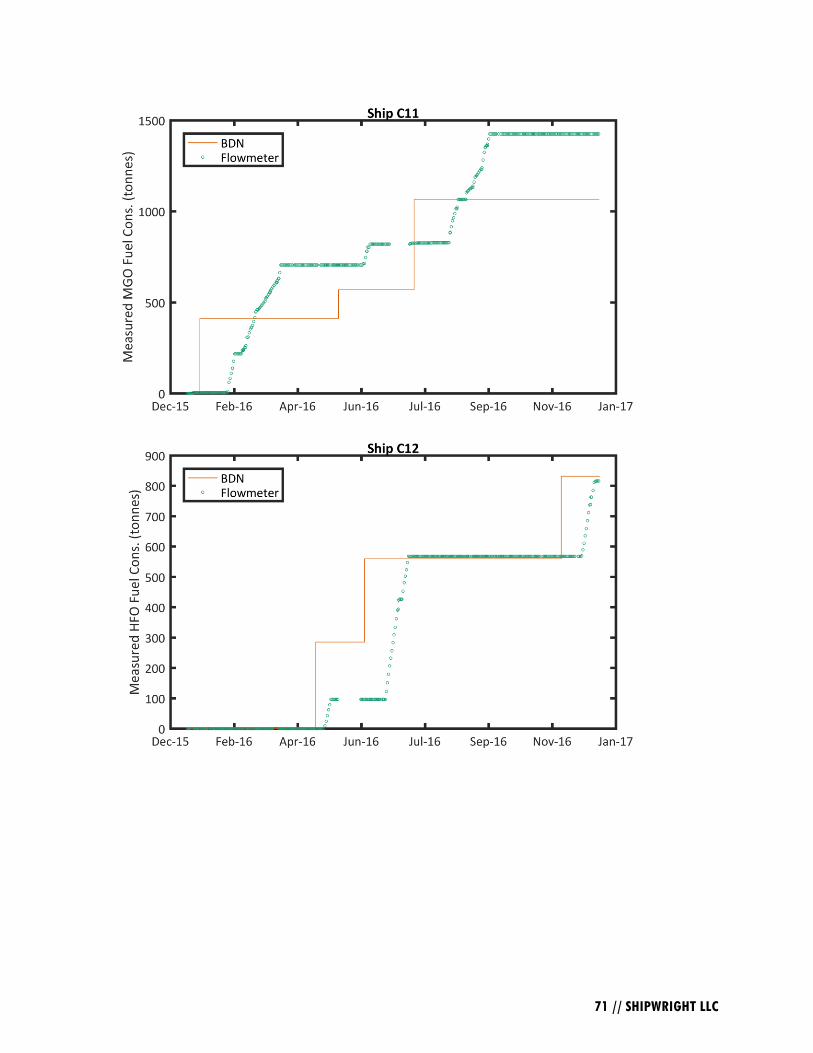
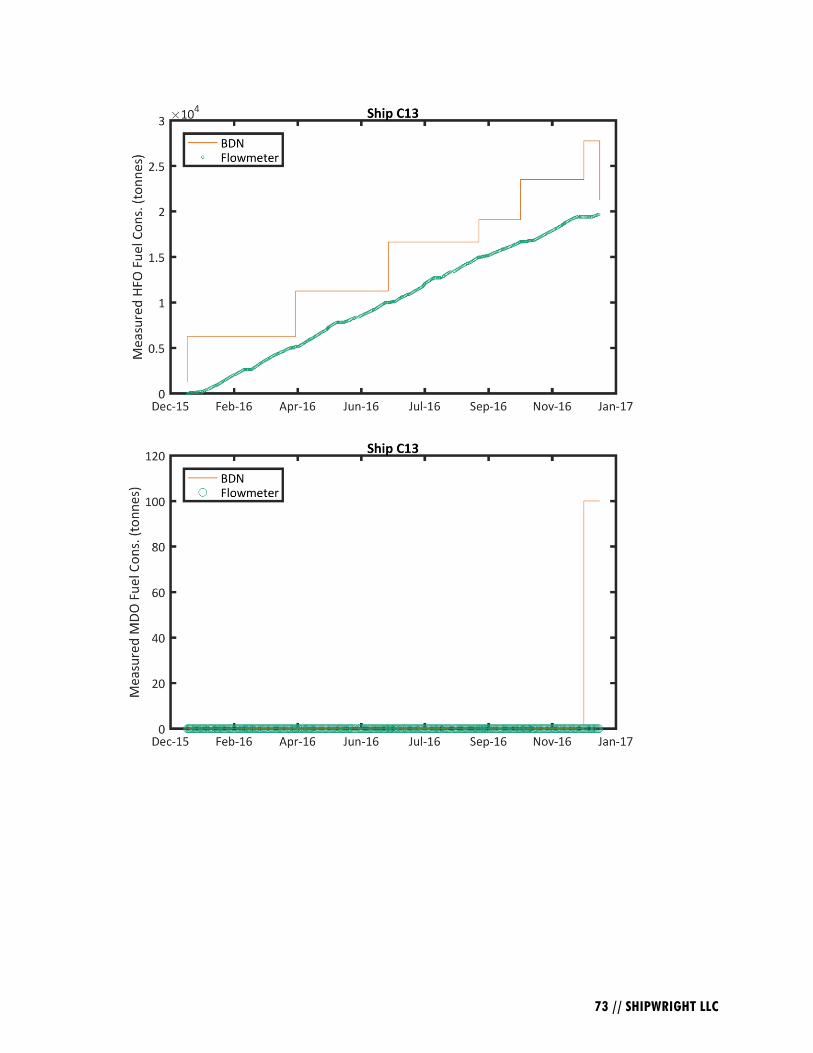
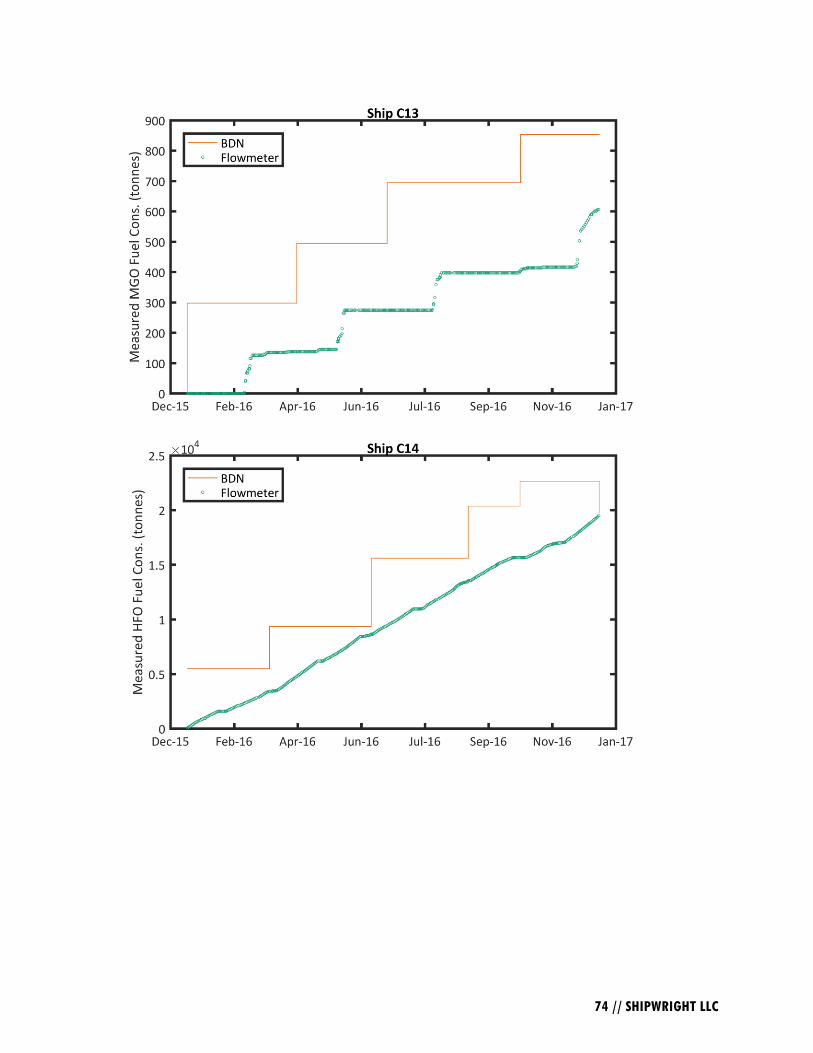
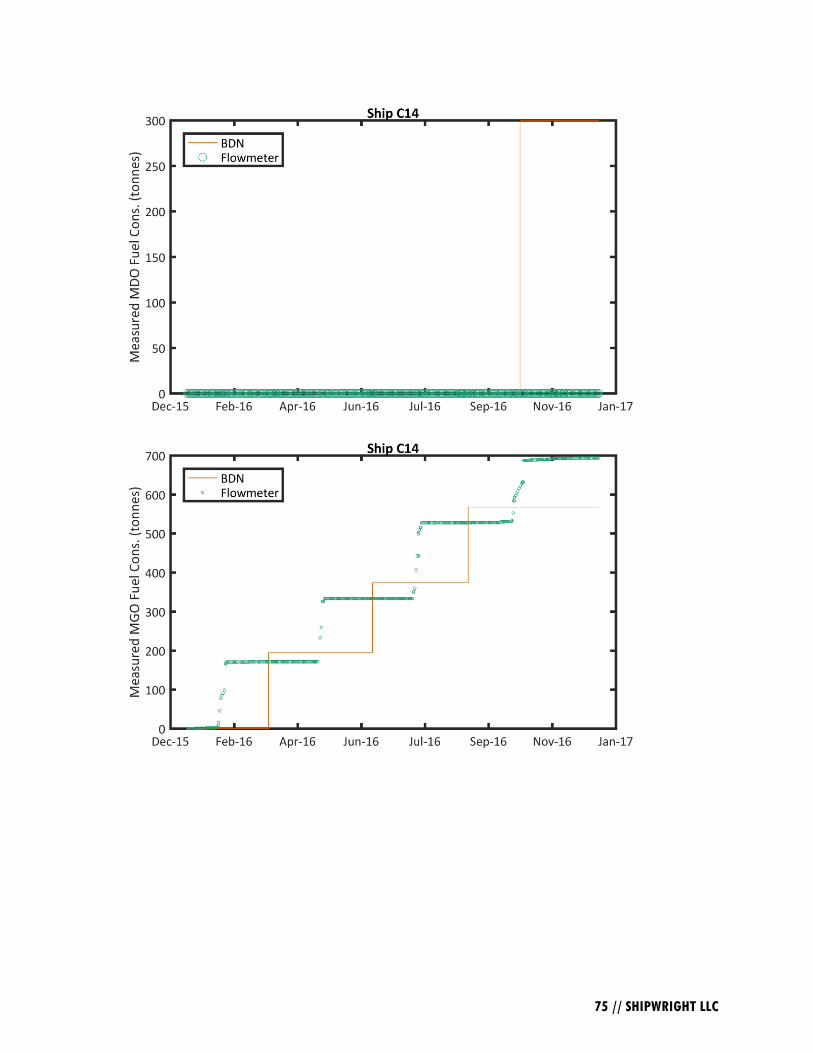
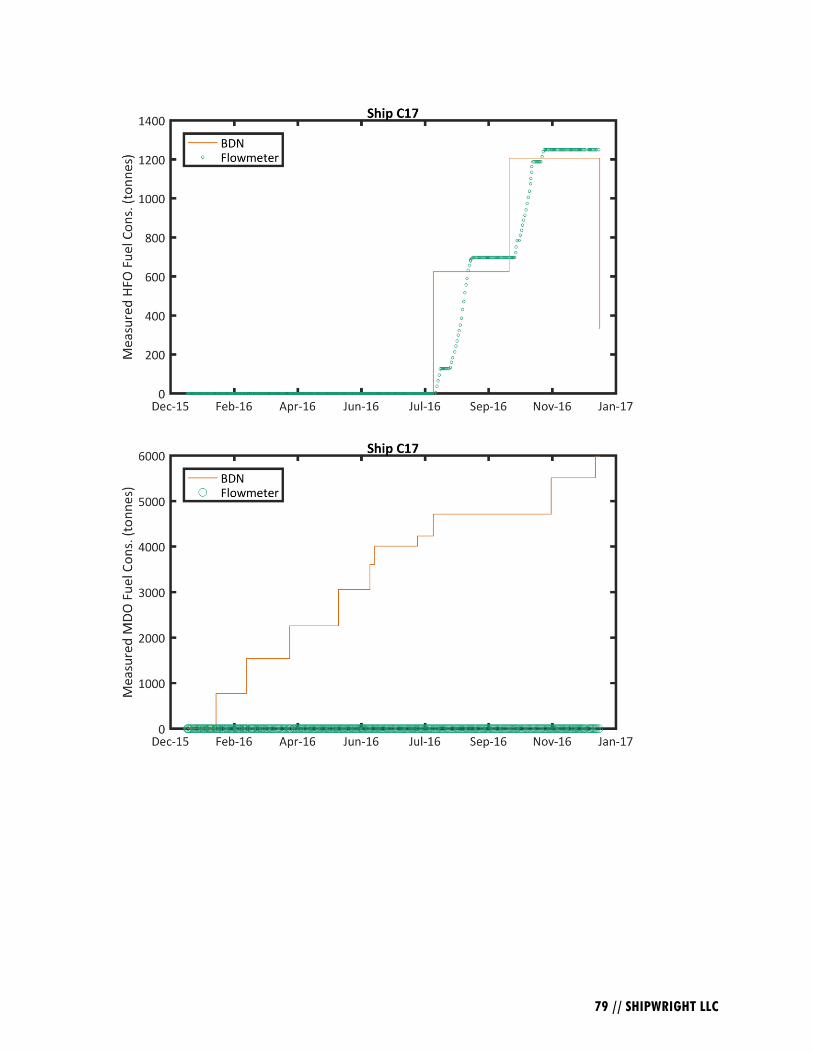
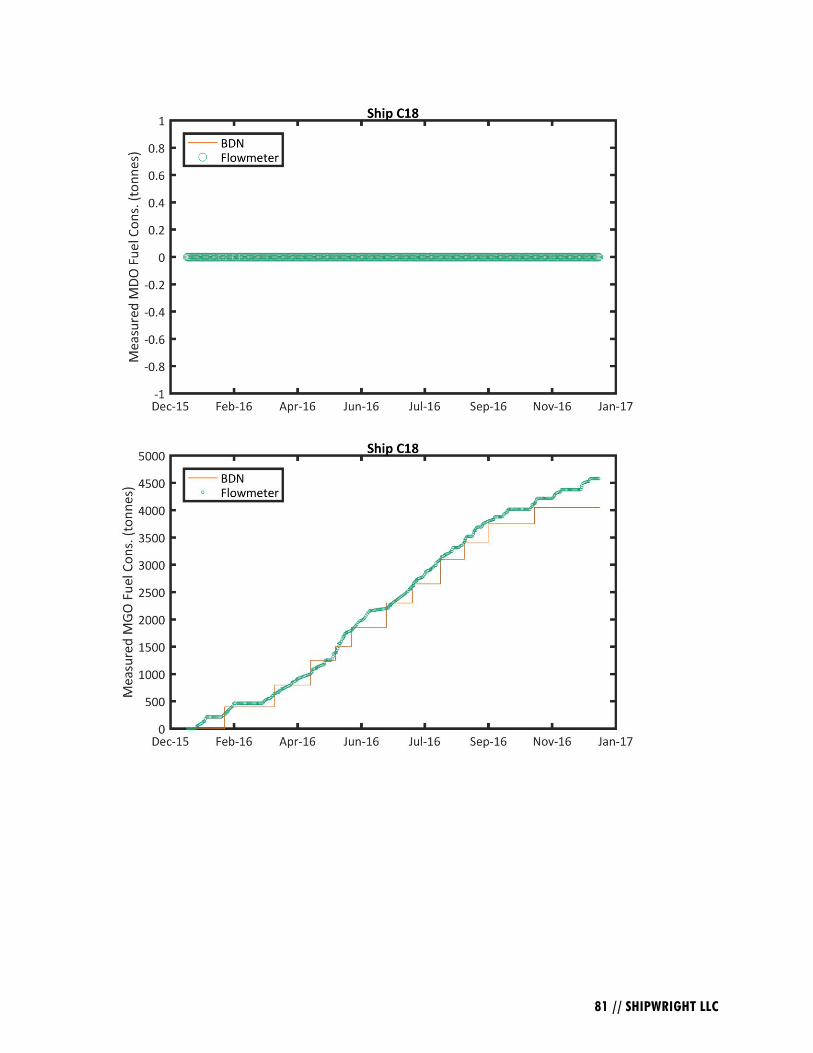
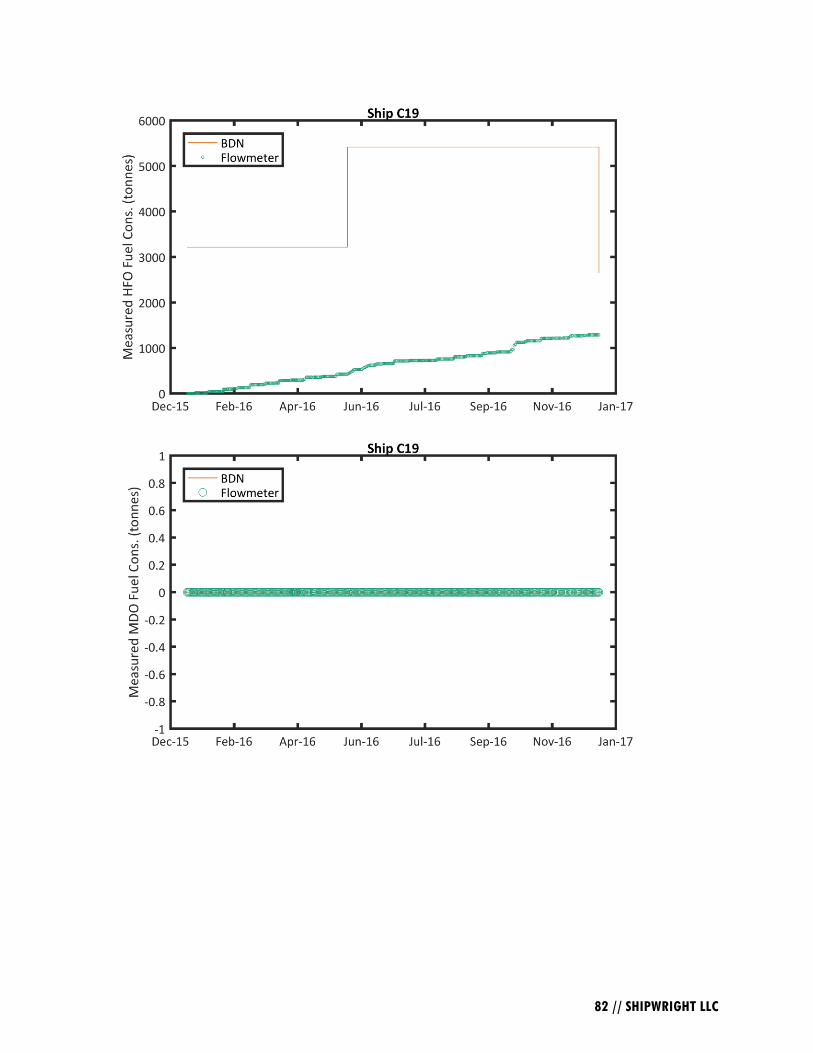
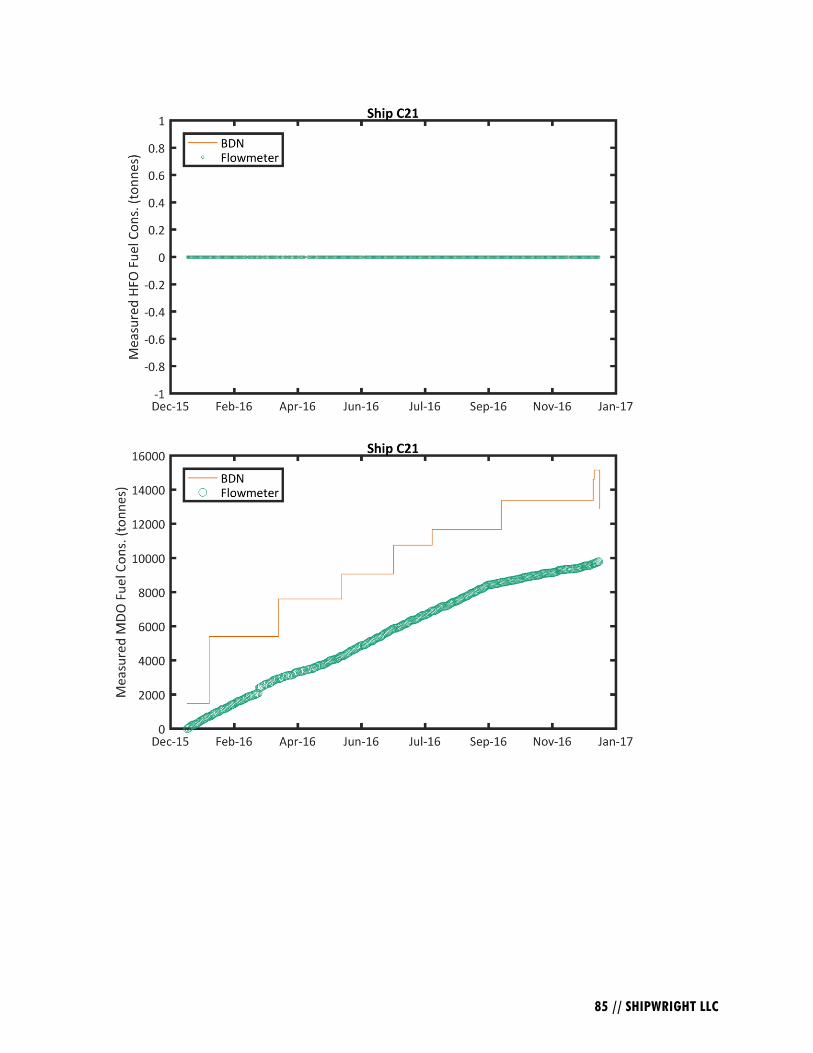
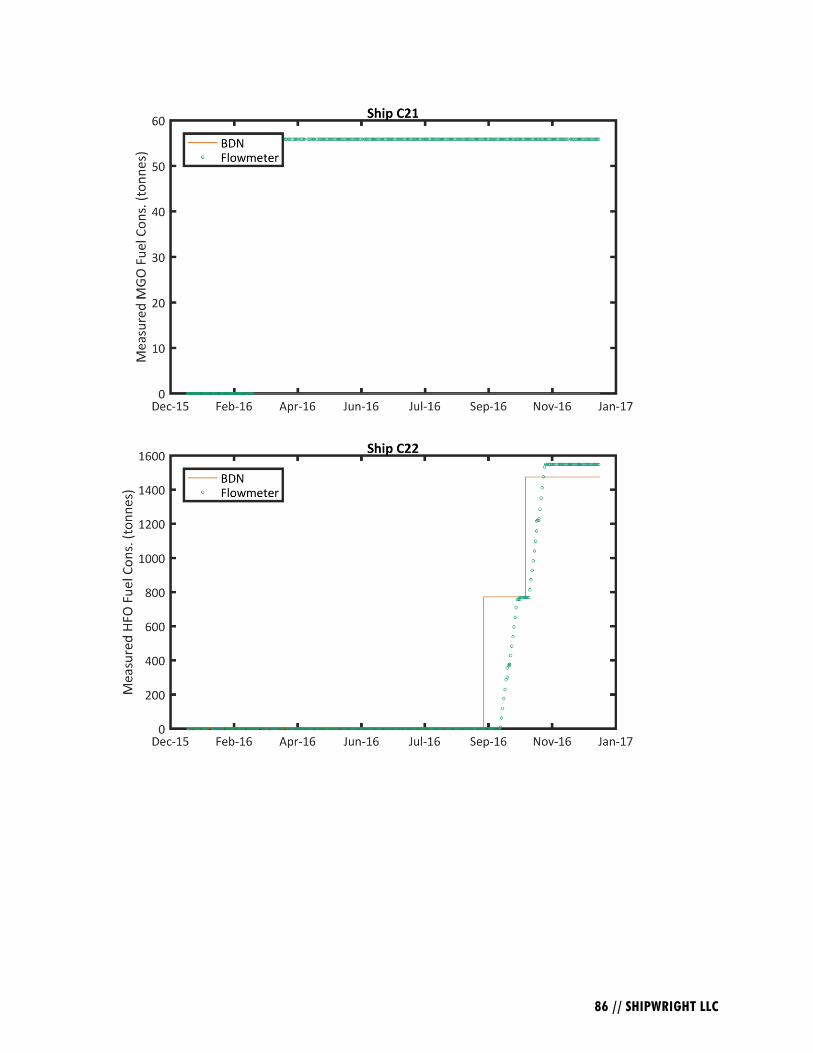
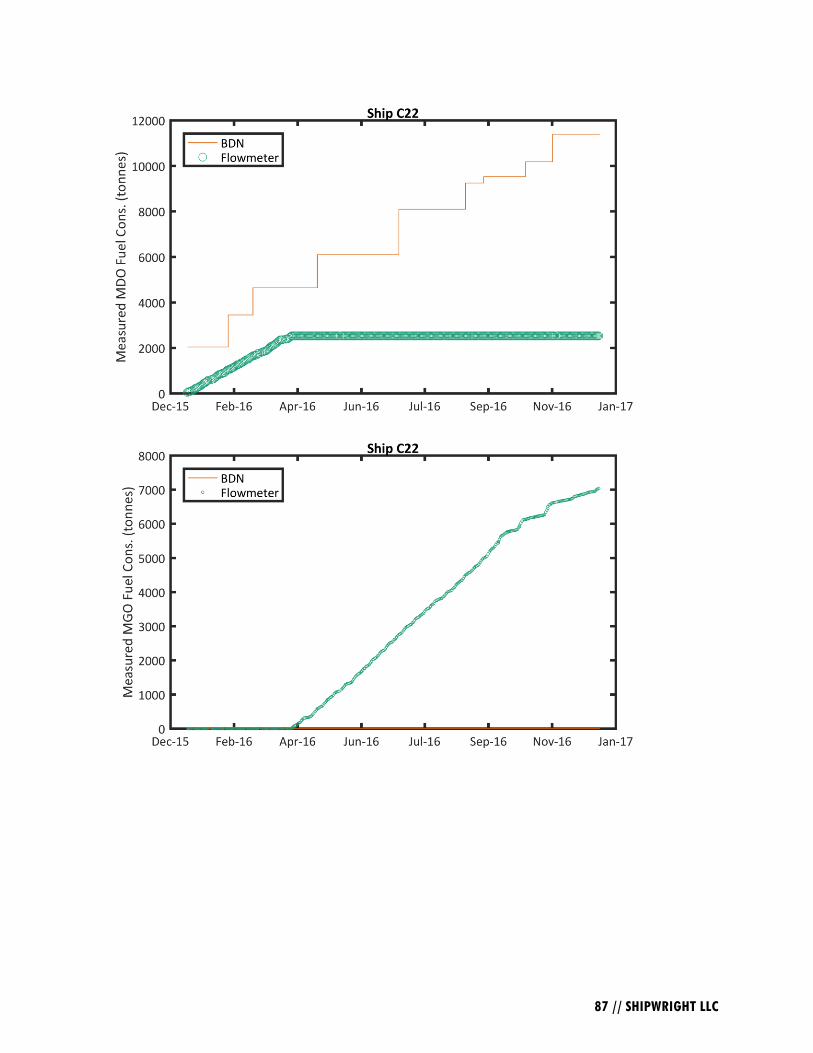
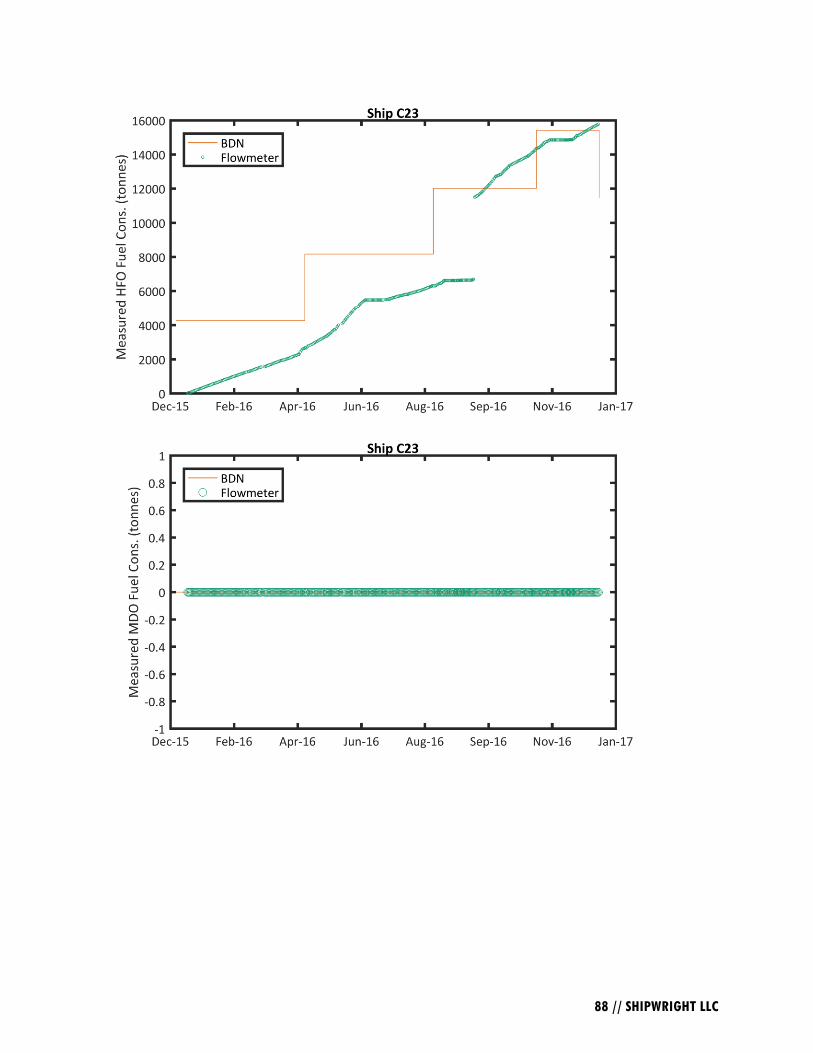
9.0 Appendix II: Measured FO Consumption for all Ships
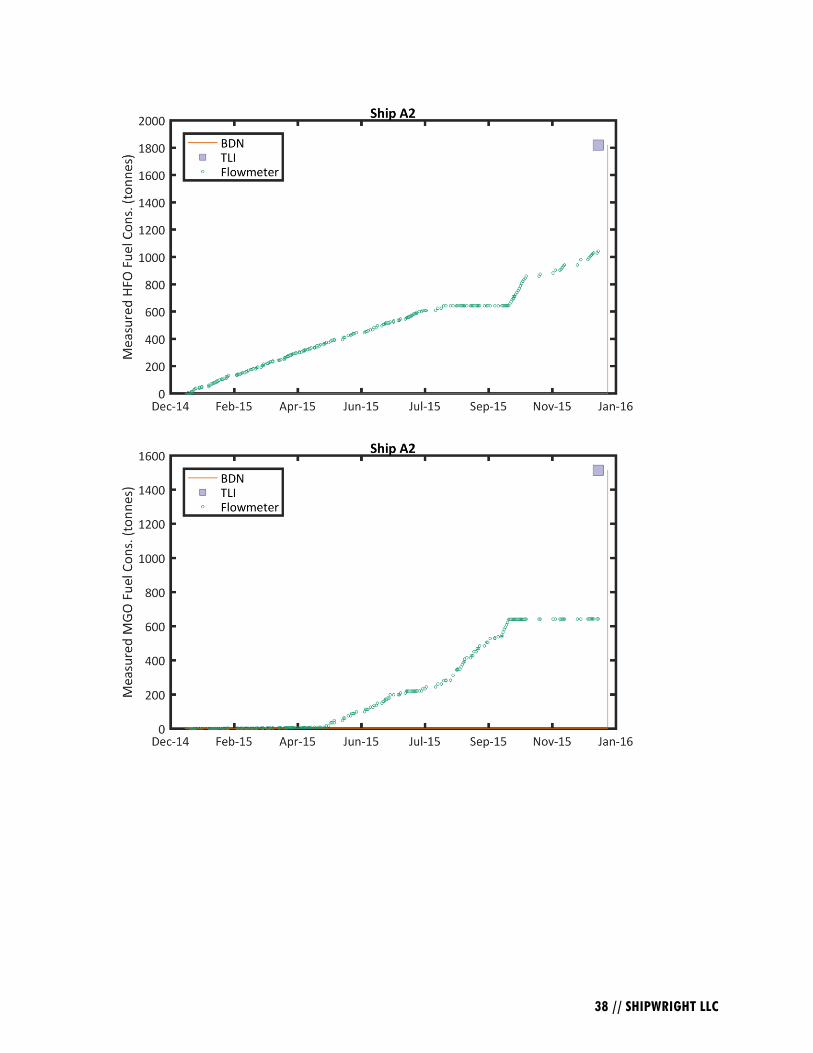
38 // SHIPWRIGHT LLC
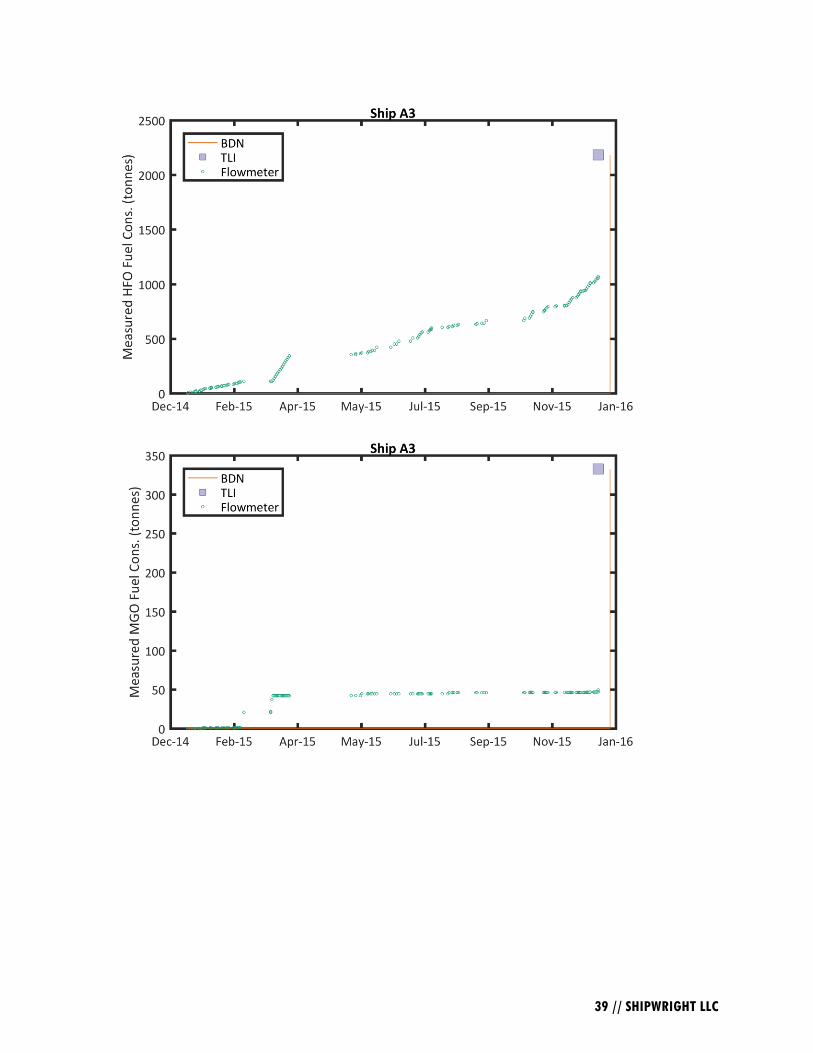
39 // SHIPWRIGHT LLC

40 // SHIPWRIGHT LLC

41 // SHIPWRIGHT LLC
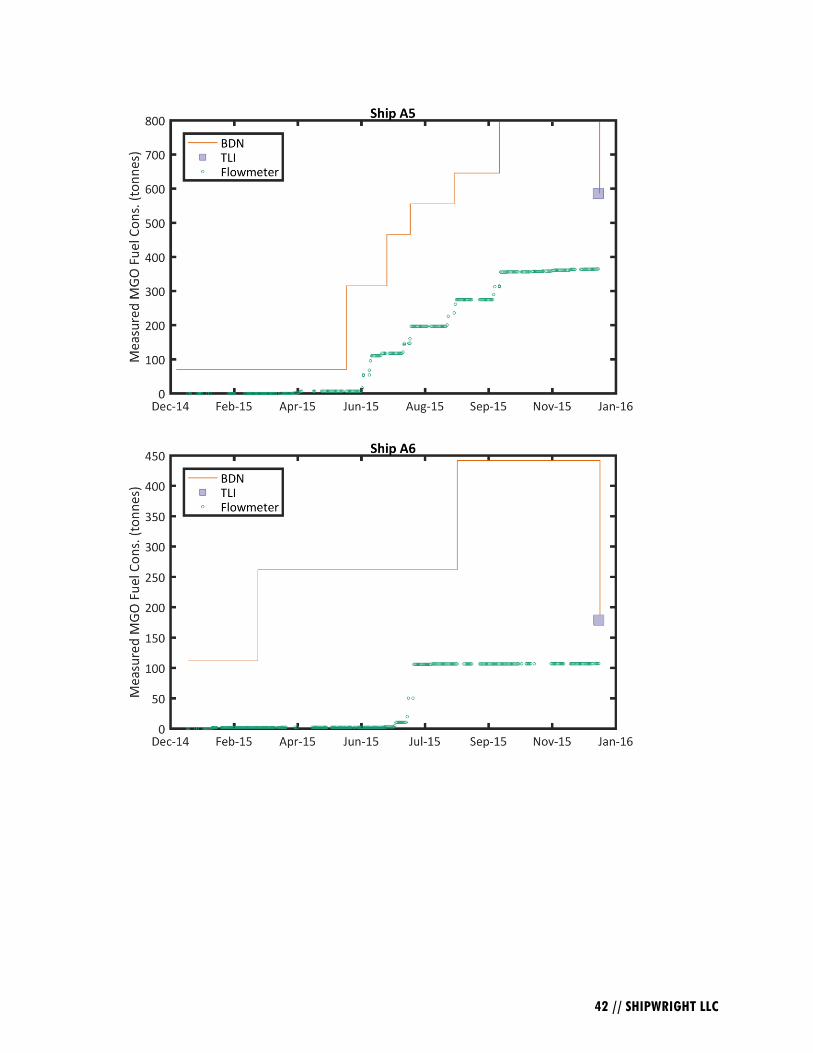
42 // SHIPWRIGHT LLC

43 // SHIPWRIGHT LLC

44 // SHIPWRIGHT LLC

45 // SHIPWRIGHT LLC

46 // SHIPWRIGHT LLC
47 // SHIPWRIGHT LLC

48 // SHIPWRIGHT LLC

49 // SHIPWRIGHT LLC

50 // SHIPWRIGHT LLC
51 // SHIPWRIGHT LLC

52 // SHIPWRIGHT LLC

53 // SHIPWRIGHT LLC

54 // SHIPWRIGHT LLC

55 // SHIPWRIGHT LLC
56 // SHIPWRIGHT LLC

57 // SHIPWRIGHT LLC

58 // SHIPWRIGHT LLC

59 // SHIPWRIGHT LLC

60 // SHIPWRIGHT LLC
61 // SHIPWRIGHT LLC
62 // SHIPWRIGHT LLC

63 // SHIPWRIGHT LLC
64 // SHIPWRIGHT LLC
65 // SHIPWRIGHT LLC

66 // SHIPWRIGHT LLC

67 // SHIPWRIGHT LLC
68 // SHIPWRIGHT LLC

69 // SHIPWRIGHT LLC

70 // SHIPWRIGHT LLC
71 // SHIPWRIGHT LLC

72 // SHIPWRIGHT LLC
73 // SHIPWRIGHT LLC
74 // SHIPWRIGHT LLC
75 // SHIPWRIGHT LLC

76 // SHIPWRIGHT LLC

77 // SHIPWRIGHT LLC

78 // SHIPWRIGHT LLC
79 // SHIPWRIGHT LLC

80 // SHIPWRIGHT LLC
81 // SHIPWRIGHT LLC
82 // SHIPWRIGHT LLC

83 // SHIPWRIGHT LLC

84 // SHIPWRIGHT LLC
85 // SHIPWRIGHT LLC
86 // SHIPWRIGHT LLC
87 // SHIPWRIGHT LLC
88 // SHIPWRIGHT LLC

89 // SHIPWRIGHT LLC

90 // SHIPWRIGHT LLC

91 // SHIPWRIGHT LLC

92 // SHIPWRIGHT LLC

93 // SHIPWRIGHT LLC

94 // SHIPWRIGHT LLC

95 // SHIPWRIGHT LLC