UNCERTAINTIES IN DOSE COEFFICIENTS FROM INGESTION OF … · Paper UNCERTAINTIES IN DOSE...
23
Paper UNCERTAINTIES IN DOSE COEFFICIENTS FROM INGESTION OF 131 I, 137 Cs, AND 90 Sr A. Iulian Apostoaei* and Laurence F. Miller † Abstract—Quantification of uncertainties in doses from intakes of radionuclides is important in risk assessments and epidemi- ologic studies of individuals exposed to radiation. In this study, the uncertainties in the doses per unit intake (i.e., dose coefficients) for ingestion of 131 I, 137 Cs, and 90 Sr by healthy individuals have been determined. Age-dependent thyroid dose coefficients were derived for 131 I. The analysis for 131 I uses recent measurements of thyroid volume obtained by ultra- sonography, which indicate a thyroid mass lower than that previously obtained using autopsy measurements. The coeffi- cients for 137 Cs are determined using the relationship between the biological half-lives and the amount of potassium in the human body. The most recent International Commission on Radiological Protection biokinetic model was employed to determine the uncertainties for 90 Sr. For 137 Cs and 90 Sr, the dose coefficients represent exposure in adulthood and they were determined for all organs of radiological importance. The uncertainty in the estimated dose coefficients represent state of knowledge estimates for a reference individual, and they are described by lognormal distributions with a specified geomet- ric mean (GM) and geometric standard deviation (GSD). The estimated geometric means vary only slightly from the dose coefficients reported by ICRP publications. The largest uncer- tainty is observed in the dose coefficients for bone surface (GSD 2.6), and red bone marrow (GSD 2.4) in the case of ingestion of 90 Sr. For most other organs, the uncertainty in the 90 Sr dose coefficients is characterized by a GSD of 1.8 (or less for some organs). For 131 I, the uncertainty in the thyroid dose coefficients is well represented by a GSD of 1.7 for both sexes and all ages other than infants for whom a GSD of 1.8 is more appropriate. The lowest uncertainties are obtained for the dose coefficients from ingestion of 137 Cs (GSD 1.24 for males; 1.4 for females). A dominant source of uncertainty in the ingestion dose coefficients is the variation of the biokinetic parameters. For 131 I, the largest contribution to the uncertainty comes from the variation in the thyroid mass, but the contribution of the biokinetic parameters is comparable. The biokinetic parame- ters with the largest contribution to the uncertainty are (a) the fractional uptake from blood to thyroid in the case of ingestion of 131 I, (b) the absorbed fraction from the gastrointestinal tract (f 1 ) in the case of 90 Sr, and (c) the amount of potassium in the body for 137 Cs. The contribution to the uncertainty of the absorbed fraction (which accounts for the fraction of energy deposited in the target organ) is the smallest contributor to the uncertainty in the dose coefficients for most organs. To reduce the uncertainty in the dose estimated for a real individual, one should determine the above-mentioned parameters for the specified individual rather than to rely on assumptions for a reference individual. Health Phys. 86(5):460 – 482; 2004 Key words: 131 I; 137 Cs; 90 Sr; internal dose INTRODUCTION Background Ingestion of radioactive material is a major contrib- utor to the doses to members of the public exposed to accidental or routine releases of radioactivity and a potential exposure pathway for workers in the nuclear industry. Radiation doses expressed per unit intake (Gy Bq 1 or Sv Bq 1 ) are usually referred to as “dose coefficients,” “dose factors,” or “dose conversion fac- tors.” Dose coefficients published to date are regarded as central estimates for large populations. Within any given human population, people differ substantially from each other, and there are differences among human popula- tions as well. Many physical and physiological parame- ters influencing absorption and movement of a radioac- tive substance in the human body vary from one individual to another, introducing uncertainties due to inter-individual variability. In addition, some parameters are not well known, and one must therefore deal with uncertainty due to lack of knowledge about the true means and variances of these parameters. The two types of uncertainty can be combined if the assessment end point is the lack of knowledge in the dose to a reference individual, but they must be separated if the assessment end point is a variability of doses in a population (e.g., a cohort used for epidemiological studies; IAEA 1989; NCRP 1996). In many exposure assessment studies, doses are estimated for a hypothetical individual, often referred to as a “target” or “reference” individual, who is assumed to be representative of members of a given population. By * SENES Oak Ridge, Inc., 102 Donner Drive, Oak Ridge, TN 37830; † The University of Tennessee, Department of Nuclear Engi- neering, 315 Pasqua Engineering Bldg., Knoxville, TN 37996-2300. For correspondence or reprints contact: A. I. Apostoaei, SENES Oak Ridge, Inc., 102 Donner Drive, Oak Ridge, TN 37830, or email at [email protected]. (Manuscript received 24 March 2003; revised manuscript re- ceived 14 October 2003, accepted 30 December 2003) 0017-9078/04/0 Copyright © 2004 Health Physics Society 460
Transcript of UNCERTAINTIES IN DOSE COEFFICIENTS FROM INGESTION OF … · Paper UNCERTAINTIES IN DOSE...
Paper
UNCERTAINTIES IN DOSE COEFFICIENTS FROM INGESTIONOF 131I, 137Cs, AND 90Sr
A. Iulian Apostoaei* and Laurence F. Miller†
Abstract—Quantification of uncertainties in doses from intakesof radionuclides is important in risk assessments and epidemi-ologic studies of individuals exposed to radiation. In this study,the uncertainties in the doses per unit intake (i.e., dosecoefficients) for ingestion of 131I, 137Cs, and 90Sr by healthyindividuals have been determined. Age-dependent thyroiddose coefficients were derived for 131I. The analysis for 131I usesrecent measurements of thyroid volume obtained by ultra-sonography, which indicate a thyroid mass lower than thatpreviously obtained using autopsy measurements. The coeffi-cients for 137Cs are determined using the relationship betweenthe biological half-lives and the amount of potassium in thehuman body. The most recent International Commission onRadiological Protection biokinetic model was employed todetermine the uncertainties for 90Sr. For 137Cs and 90Sr, thedose coefficients represent exposure in adulthood and theywere determined for all organs of radiological importance. Theuncertainty in the estimated dose coefficients represent state ofknowledge estimates for a reference individual, and they aredescribed by lognormal distributions with a specified geomet-ric mean (GM) and geometric standard deviation (GSD). Theestimated geometric means vary only slightly from the dosecoefficients reported by ICRP publications. The largest uncer-tainty is observed in the dose coefficients for bone surface(GSD � 2.6), and red bone marrow (GSD � 2.4) in the case ofingestion of 90Sr. For most other organs, the uncertainty in the90Sr dose coefficients is characterized by a GSD of 1.8 (or lessfor some organs). For 131I, the uncertainty in the thyroid dosecoefficients is well represented by a GSD of 1.7 for both sexesand all ages other than infants for whom a GSD of 1.8 is moreappropriate. The lowest uncertainties are obtained for the dosecoefficients from ingestion of 137Cs (GSD � 1.24 for males; 1.4for females). A dominant source of uncertainty in the ingestiondose coefficients is the variation of the biokinetic parameters.For 131I, the largest contribution to the uncertainty comes fromthe variation in the thyroid mass, but the contribution of thebiokinetic parameters is comparable. The biokinetic parame-ters with the largest contribution to the uncertainty are (a) thefractional uptake from blood to thyroid in the case of ingestionof 131I, (b) the absorbed fraction from the gastrointestinal tract(f1) in the case of 90Sr, and (c) the amount of potassium in the
body for 137Cs. The contribution to the uncertainty of theabsorbed fraction (which accounts for the fraction of energydeposited in the target organ) is the smallest contributor to theuncertainty in the dose coefficients for most organs. To reducethe uncertainty in the dose estimated for a real individual, oneshould determine the above-mentioned parameters for thespecified individual rather than to rely on assumptions for areference individual.Health Phys. 86(5):460–482; 2004
Key words: 131I; 137Cs; 90Sr; internal dose
INTRODUCTION
BackgroundIngestion of radioactive material is a major contrib-
utor to the doses to members of the public exposed toaccidental or routine releases of radioactivity and apotential exposure pathway for workers in the nuclearindustry. Radiation doses expressed per unit intake (GyBq�1 or Sv Bq�1) are usually referred to as “dosecoefficients,” “dose factors,” or “dose conversion fac-tors.” Dose coefficients published to date are regarded ascentral estimates for large populations. Within any givenhuman population, people differ substantially from eachother, and there are differences among human popula-tions as well. Many physical and physiological parame-ters influencing absorption and movement of a radioac-tive substance in the human body vary from oneindividual to another, introducing uncertainties due tointer-individual variability. In addition, some parametersare not well known, and one must therefore deal withuncertainty due to lack of knowledge about the truemeans and variances of these parameters. The two typesof uncertainty can be combined if the assessment endpoint is the lack of knowledge in the dose to a referenceindividual, but they must be separated if the assessmentend point is a variability of doses in a population (e.g., acohort used for epidemiological studies; IAEA 1989;NCRP 1996).
In many exposure assessment studies, doses areestimated for a hypothetical individual, often referred toas a “target” or “reference” individual, who is assumed tobe representative of members of a given population. By
* SENES Oak Ridge, Inc., 102 Donner Drive, Oak Ridge, TN37830; † The University of Tennessee, Department of Nuclear Engi-neering, 315 Pasqua Engineering Bldg., Knoxville, TN 37996-2300.
For correspondence or reprints contact: A. I. Apostoaei, SENESOak Ridge, Inc., 102 Donner Drive, Oak Ridge, TN 37830, or email [email protected].
(Manuscript received 24 March 2003; revised manuscript re-ceived 14 October 2003, accepted 30 December 2003)
0017-9078/04/0Copyright © 2004 Health Physics Society
460

accepting the existence of uncertainty, one accepts thepossibility that the dose to a real individual could begreater or less than the dose to the “reference” individualobtained using standard dose coefficients.
Uncertainties in dosimetry can affect the outcome ofan epidemiological study. Such an effect was shown forthe Japanese Survivors of the atomic bombings of Hiro-shima and Nagasaki (Pierce et al. 1990). The randomerrors associated with an individual survivor dose wereon the order of 30–40% and produced an increase in theestimated excess relative risk per unit dose (ERR1Sv), ascompared to the ERR1Sv obtained by ignoring the randomerrors, of 4.3–7.2% for leukemia and of 6.8–11.4% forall other cancers combined.
The importance of uncertainty in dosimetry has longbeen recognized, but only recently have there beenattempts to quantify it. In the early 1980’s, the analysis ofuncertainty in internal dosimetry was called “imprecisionanalysis.” Uncertainties in the doses to the thyroid fromingestion of 131I were estimated by Dunning andSchwartz (1981) and later by Killough and Eckerman(1986). Schwartz and Dunning (1982) analyzed theimprecision induced by the variability of the biologicalcharacteristics in estimating the effective dose fromingestion of 137Cs. As part of the effort to reconstructdoses to off-site individuals exposed to fallout fromnuclear weapons tests at the Nevada Test Site, ananalysis of the uncertainties in dose factors for 89/90Sr,136/137Cs, and 131I was performed by Ng et al. (1990) andfor 131I by the NCI (1997). The uncertainties in thethyroid dose factors from ingestion of 131I by adults werere-estimated by Hamby and Benke (1999) and Harvey etal. (2003) using a more complex biokinetic model. Thereconstruction of doses from historical releases of radio-activity from the Oak Ridge Reservation prompted anevaluation of the uncertainties in the ingestion dosefactors for 131I, 137Cs, 90Sr, and, for the first time, for 60Coand 106Ru (Apostoaei et al. 1998, 1999a, 1999b). Theuncertainty in the dose coefficients for ingestion of 90Srby adults was further investigated by Apostoaei (2001).
In a few cases, uncertainties in ingestion dosefactors have been estimated by eliciting the opinion ofdosimetry experts. By analyzing the available biokineticdata and their relevancy to the human population, theexperts were asked to make subjective (or judgmental)statements about the uncertainty in the dose factors.Bouville et al. (1994) estimated the uncertainties in theeffective‡ dose coefficients for 23 radionuclides. Theuncertainties were expressed as “a factor of n.” The
limits of a 90% confidence interval for each dosecoefficient were obtained by dividing and multiplying,respectively, the ICRP recommended ingestion dosefactor by n.
In 1998 the Nuclear Regulatory Commission (NRC)and the Commission of the European Community (CEC)published an expert elicitation report for uncertainties ininternal dosimetry (Goossens et al. 1998). However, thisreport showed large discrepancies between both thecentral values and the magnitude of uncertainty in thedose factors produced by individual experts.
Recently, the U.S. Environmental ProtectionAgency (U.S. EPA) published Federal Guidance ReportNo. 13 (Eckerman et al. 1999), which providesradionuclide-specific radiogenic cancer risk coefficientsfor the U.S. population based on age-dependent dosim-etry and risk models. The risk coefficients for ingestion(risk Bq�1) are obtained by integrating the time-dependent absorbed dose-rate to a given tissue multipliedby the cancer risk per unit absorbed dose. To analyze theuncertainties, the risk coefficients are grouped in a fewbroad categories. The risk coefficients for ingestion of137Cs, 90Sr, and 131I have been assigned to categorieshaving uncertainty factors of 4, 5, and 7, respectively.
Currently, both the National Council on RadiationProtection and Measurements (NCRP) and the Interna-tional Commission on Radiological Protection (ICRP)are investigating the reliability of ingestion dose coeffi-cients. NCRP has already published a report (NCRP1998) that addresses the problem of uncertainties in theinternal dosimetry in a general manner, discussing thesources of uncertainty in the gastrointestinal tract model,the respiratory tract model, the biokinetic models and thedosimetric models.
The purpose of the present paperThe present paper focuses on 131I, 137Cs, and 90Sr,
which are some of the most important radionuclides inthe field of radiation protection with respect to membersof the public. They are fission products with a highfission yield, and, if released into the environment, theyare readily transferred through the food chain. Sources ofexposure to 131I include releases from nuclear facilities,fallout from nuclear weapons detonations (Table 1), andadministration for medical reasons. The main source of90Sr and 137Cs in the environment is fallout of nuclearweapons detonations (Table 1). In addition, 90Sr was themain radionuclide released from Mayak, a Russian nu-clear weapons facility (Mokrov et al. 2000), and is part ofthe ongoing epidemiological studies of the individualsexposed to releases from Mayak (Seligman 2000;Degteva et al. 2000).
‡ The effective dose is the sum of the weighted doses in all thetissues and organs of the body (ICRP 1991). The tissue weightingfactors are based on the probability of stochastic effects given auniform irradiation of the body.
461Dose coefficients from ingestion of 131I, 137Cs, and 90Sr ● A. I. APOSTOAEI AND L. F. MILLER

The study focuses on “reference” individuals whoare assumed to be in a good state of health. The resultsfor adults are applicable to both members of the publicand radiation workers. The magnitude of uncertainties inthe dose coefficients from ingestion of 131I, 137Cs, and 90Srare expressed for each sex and for various ages atexposure. This paper brings a number of advancementsin the area of uncertainty in internal dosimetry. Theanalysis for ingestion of 131I makes use of the most recentthyroid mass measured by ultrasonography, a methodthat is less prone to errors than autopsy and that allowsin-vivo examinations of large populations. The dosecoefficients for 137Cs are obtained using the relationshipbetween the biological half-lives and the amount ofpotassium in the human body. For 90Sr, the most recentICRP biokinetic model was used to derive the uncertain-ties. Also, as opposed to previous studies that addressedthe uncertainty in effective doses, this work focuses ondoses to specific organs.
MATERIALS AND METHODS
The dose coefficients are derived using the ICRPmethodology (ICRP 1979; Eckerman 1994). The dose fora unit intake is given by the total energy deposited byradiation in the target organ divided by the mass of theorgan. The total energy deposited is calculated as thenumber of nuclear transformations (nt) occurring in anysource organ multiplied by the energy deposited in thetarget organ by each nuclear transformation. The numberof nuclear transformations is given by the integratedactivity in the source organ, which, in turn, is predictedby the biokinetic model. The dosimetric model gives theenergy deposited per nuclear transformation.
To estimate uncertainties in the dose coefficients,available human metabolic data were collected andanalyzed to derive the uncertainty in the parameters ofthe biokinetic model. Necessary correlations between theparameters were imposed when calculations were per-formed. Similarly, the available data on the masses of thetarget organs and on the fraction of energy deposited inthe target organ were gathered, and uncertainties aboutthese quantities were expressed.
Probability language was used to express the uncer-tainties. Probability distributions were defined for allbiokinetic and dosimetric parameters, and the Monte-Carlo method was used for propagation of uncertaintiesin the derivation of the dose coefficients. The calculatedingestion dose coefficients are obtained as probabilitydistributions. The uncertainties around a geometric mean(GM) are presented as geometric standard deviations(GSD) and also as 95% confidence intervals of thesedistributions.
The most important contributors to the uncertaintyin a given organ dose coefficient are determined using amethod called “sensitivity analysis” (NCRP 1996) or“importance analysis” (Morgan and Henrion 1990),based on the rank correlations between the calculateddose coefficient and each individual biokinetic and do-simetric parameter. The individual parameters contribut-ing to the dose coefficients are then grouped into threecategories for a clearer summarization and interpretationof the results: a) the biokinetic model, which accounts forthe number of nuclear transformations in a given sourceorgan as obtained by integrating the time-dependentactivities predicted by the biokinetic model; b) theenergy deposition, which accounts for the absorbed
Table 1. Amount of radionuclides released into the environment from various large historical sources.a
Location of source Purpose Period of release Activity (PBqb)
131IWindscale, UK Nuclear reactor accident October 1957 0.74Oak Ridge, TN Radioactive Lanthanum Production 1944−1956 0.33 to 1.6Savannah River, GA Nuclear fuel reprocessing 1955−1962 2.2Hanford, WA Plutonium production 1944−1956 33Chernobyl, Ukraine Nuclear reactor accident April−May 1986 1700Nevada Test Site, NV Nuclear weapons testing 1952−1957 5600Global falloutc Nuclear weapons testing 1952−1962 675,000
137CsChernobyl, Ukraine Nuclear reactor accident April−May 1986 85Global falloutc Nuclear weapons testing 1952−1962 948
90SrMayak Plant, Russia Weapons production 1949−1995 0.96Chernobyl, Ukraine Nuclear reactor accident April−May 1986 8.1Global falloutc Nuclear weapons testing 1952−1962 622
a References: Buzulukov and Dobrynin 1993; Mokrov et al. 2000; UNSCEAR 2000; Hoffman et al. 2002; Bouville et al. 2002.b 1 PBq � 1015 Bq.c This denotes the activity released from worldwide nuclear weapons tests, available to be deposited onto the ground as fallout. Itincludes the contribution of the detonations at the Nevada Test Site.
462 Health Physics May 2004, Volume 86, Number 5

fraction (AF); and c) the mass, which accounts for themass of the target organ and for the whole-body mass.Determination of the most important contributors to theuncertainty is a powerful method to identify directionsfor further research that can lead to increased accuracyand decreased uncertainty in dose estimation. The fol-lowing sections present the details of the methods usedfor each individual radionuclide.
The dose coefficients are reported in units of “SvBq�1”, where “Sv” represents the equivalent dose ob-tained using a radiation-weighting factor equal to 1.0,with no associated uncertainty. When estimating riskfrom exposure to radiation, the effectiveness of differenttypes of radiation should be taken into account by usingfactors (Kocher et al. 2003) specially determined for thereference radiation of concern, and for which the uncer-tainties have been quantified. It is expected that suchradiation effectiveness factors are still unity for ingestionof 137Cs and 90Sr, but they may be larger than 1.0 foringestion of 131I.
131I
After contaminated food is ingested, 131I is rapidlyand almost completely absorbed into the bloodstream(ICRP 1989), from where it is metabolized in the samemanner as stable iodine. Iodine is used by the thyroidgland in production of two significant thyroid hormones,thyroxine (T4) and triiodothyronine (T3). After forma-tion, the hormones are stored inside the follicles of thegland, at concentrations about 30 times larger than theconcentration in blood (Guyton 1991). In an adult,hormones are stored in sufficient amounts to supply thebody with its normal requirement for 2 to 3 mo. Thestorage period defines the biological half-life of iodine inthe thyroid, which is estimated at about 80 d in adults(ICRP 1979). This long storage time allows most of the131I to decay before the hormones are released to blood,thus irradiating the thyroid gland (the radiological half-life is 8.04 d). As a result, recycling of 131I into the bloodcontributes little to the thyroid dose for a given intake of131I. Organs other than the thyroid receive a negligibledose compared to the dose to the thyroid and aregenerally not considered in radiological assessments. Theuptake of iodine by the thyroid, the storage time in thegland, and the thyroid mass (or size) are dependent on theage of the individual. Late teenage and adult femaleshave, on average, lower thyroid masses than males of thesame age.
Types of radiation emitted131I is a beta emitter. Various gamma rays follow the
beta decay before stable state of 131Xe is reached. The
sum of all average beta energies per nuclear transforma-tion is 0.19 MeV. The total gamma energy emitted is0.38 MeV/nt.
Biokinetic model for 131IIn this paper, dose coefficients for the thyroid gland
are calculated using the most recent data on the mass ofthe thyroid obtained by ultrasonography, and the mostimportant contributors to the uncertainty in the thyroiddose coefficients are identified. Dose coefficients fororgans other than thyroid are not addressed.
The amount of radioactivity present in the thyroid isestimated using a biokinetic model containing two com-partments: plasma and thyroid (Killough and Eckerman1986). This model neglects the recycling of iodine,which is a very good approximation for adults andteenagers, but it could underestimate the thyroid dose byno more than 10% for very young children, who have amore rapid turnover of iodine.
The dose coefficient for 131I is given by the follow-ing equations:
DF � f1 � IA � SEE (1)
and
IA ��a � �1�
��R � �1� ��R � �2�, (2)
where
DF � the dose coefficient (Sv Bq�1);f1 � the fraction of ingested 131I reaching blood;
IA � the integrated activity burden of 131I in thethyroid for a unit intake (d);
SEE � specific effective energy (Sv Bq�1 d�1);a � the fractional uptake of 131I from the blood to
the thyroid (unitless);�1 � removal rate of iodine from blood (d�1);�2 � removal rate of iodine from the thyroid gland
(d�1); and�R � 131I radioactive decay rate (d�1)
The specific effective energy (SEE) is the energydeposited per unit mass of thyroid from the nucleartransformations produced by an activity of 1 Bq stored inthe thyroid gland for 1 d. SEE depends on the fraction ofenergy absorbed in the gland. The largest contribution tothe SEE is the non-penetrating radiation (beta radiation,conversion electrons, and Auger electrons), which isessentially all absorbed in the thyroid. The contributionof the penetrating radiation (gamma and x radiation) ismuch less important. The SEE can be empirically ex-pressed as a function of thyroid mass (Mth):
463Dose coefficients from ingestion of 131I, 137Cs, and 90Sr ● A. I. APOSTOAEI AND L. F. MILLER

SEE �g
Mth� h �Mth�
p . (3)
If the mass of the thyroid is expressed in grams, the fittedparameters are g � 0.406, h � 0.01014, and p � �0.666(Killough and Eckerman 1986). When these parametervalues are used, the resulting SEE is expressed in units ofrad mCi�1 h�1. Before using the calculated SEE, a unittransformation is performed to obtain the values ex-pressed in Sv Bq�1 d�1. The unit transformation factor is1.54 � 108 Sv Bq�1 d�1 per rad mCi�1 h�1. Theuncertainties in the fraction of energy deposited in thethyroid gland by the gamma radiation and electronsemitted by 131I are negligible compared to the uncertaintyin the thyroid mass, so the uncertainty in SEE is givenentirely by the uncertainty in the thyroid mass.
Derivation of the removal rates from blood (�1) andthyroid (�2) is based on measurements of iodine levels inthe thyroid after an intravenous (I.V.) injection of aknown amount of radioiodine. Normally, the maximumactivity in the thyroid is observed about 24 h (tmax) afterinjection, after which it decreases slowly. The activitylevel is measured at (at least) two moments of time (t1
and t2) after the injection. The measurements are usuallyperformed 24–48 h (close to the peak activity) and about15 d after the injection. Based on this, an “apparent”half-life (T�) describing the decline of the activity ofiodine in the thyroid can be determined. The rate con-stants of iodine in the blood (�1) and thyroid (�2) arederived from the measured “apparent” half-life (T�),which depends on age and sex (Killough and Eckerman1986).
The measured “apparent” biological half-life (T�)and the fraction of iodine taken up by the thyroid fromthe blood (a) were reviewed by Dunning and Schwartz(1981), who found that the observed values follow
lognormal distributions. They grouped the data in fourage groups: (a) newborns, (b) children ages 0.5 to 2 y, (c)children and teenagers ages 6 to 16 y, and (d) adults (age�18 y).
For the uptake fraction (a), the fitted lognormaldistributions reported by Dunning and Schwartz (1981)produce values larger than 100%, which do not have anyphysical significance. Also, other investigators (VanMiddlesworth 1954; NCI 1997) indicate that the uptakefraction should slowly decrease with age at exposure, afact not completely reflected by the data from Dunningand Schwartz (1981). To avoid uptake fractions largerthan 1, log-triangular distributions have been used in thisstudy (Table 2). The modes of these distributions werechosen to reproduce a slow decrease of the uptakefraction with age (Van Middlesworth 1954; NCI 1997).
The apparent half-life was assumed to have a log-normal distribution with GSD of 1.8 for all age groups.The medians of the distributions agree with the generalobservation that iodine turnover by the thyroid is greatestfor infants and decreases with age at exposure. Piecewiselinear interpolation between age groups was done byassigning the reported distributions (Table 2) to ages 0(newborn), 1, 15, and 20 y.
Absorption from the gastrointestinal tractCurrently, ICRP assumes that iodine absorption
from the gastrointestinal tract into blood is extremelyrapid and complete. In reality, the absorption is verylarge, but probably never 100%, because of, for instance,incomplete digestion. Thus, it is reasonable to assign asmall variation to this absorption fraction. In this study auniform distribution between 90% and 100% was se-lected to describe the fraction of 131I absorbed from thegastrointestinal tract (f1).
Table 2. Probability distribution functions describing the uncertainty in the biological half-life (T�) and the fractionaluptake from blood to thyroid (a) based on the data reviews by Dunning and Schwartz (1981) and NCI (1997).
Age groupa Parameter Units95% confidence interval
ShapeLowerb limit Centralc value Upperb limit
Newborn T� d 4.7 15 47.5 Lognormala % 21 45 99 Log-triangular
Child T� d 6.3 20 63.3 Lognormal0.5−2 y a % 17 37 81 Log-triangular
Adolescent T� d 15.7 50 158 Lognormal6−16 y a % 16 35 77 Log-triangular
Adult T� d 26.8 85 269 Lognormal�18 yrs a % 11 25 55 Log-triangular
a The following age division is reported by Dunning and Schwartz (1981): newborn � �0.5 y; child � 0.5–2 y; adolescent � 6–16y; adult � �18 y.b For the lognormal distributions, “lower” and “upper” limits represent the 2.5th percentile and the 97.5th percentile, respectively. Forthe log-triangular distributions, they represent the minimum and the maximum values.c For the lognormal distributions, the “central” value represents the median of the distribution. For the log-triangular distributions, itrepresents the mode.
464 Health Physics May 2004, Volume 86, Number 5
Thyroid massNumerous studies report measurements of the thy-
roid mass obtained by autopsy (Mochizuki et al. 1963;Kereiakes et al. 1965; Kay et al. 1966; Dunning andSchwartz 1981; Killough and Eckerman 1986). How-ever, most of the sets of measurements are incomplete,either because some age groups were not included orbecause few measurements are available for a specificage group. Modern ultrasonography methods are superiorto autopsy because they can be used to determine thethyroid volumes in members of large populations. Themasses of the thyroids can be calculated from themeasured volumes using the normal density of thethyroid tissue. As a result, better distributions of thethyroid masses in the population are becoming available.Ultrasonography is also a superior method because is notsubject to the errors induced the actual harvesting of thetissue. Fast removal and weighting of the thyroid isrequired during autopsy to avoid the loss of blood, but,due to the butterfly shape of the thyroid, removal ofadditional tissue is likely, especially for thyroids of smallchildren.
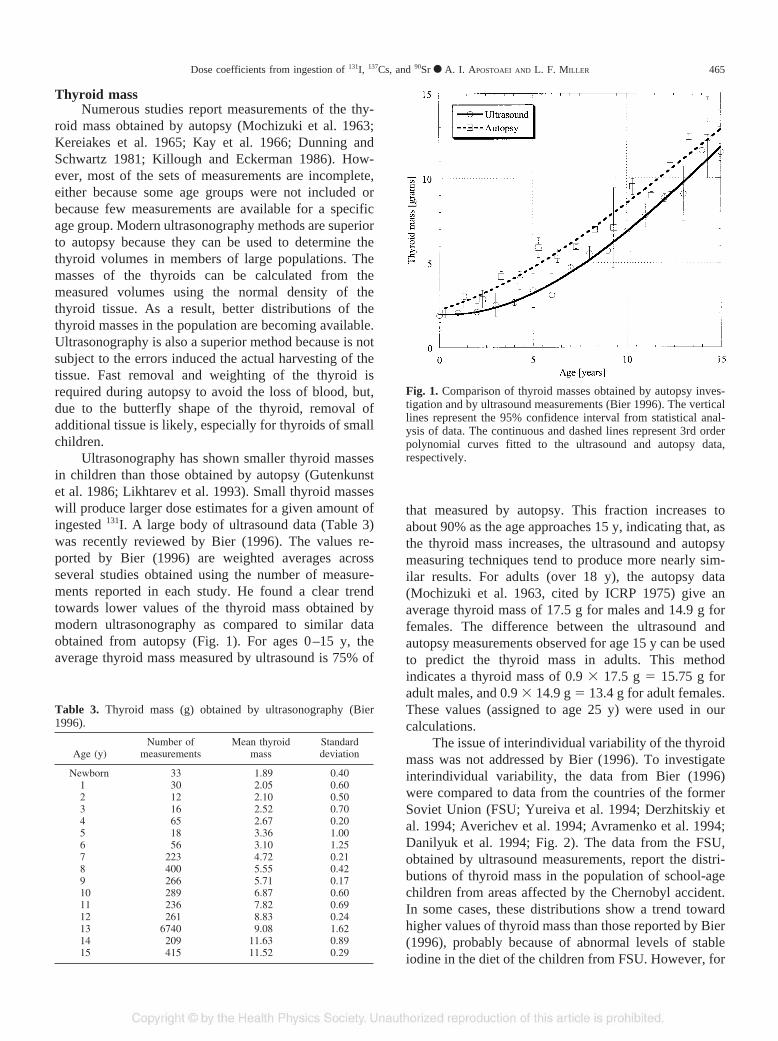
Ultrasonography has shown smaller thyroid massesin children than those obtained by autopsy (Gutenkunstet al. 1986; Likhtarev et al. 1993). Small thyroid masseswill produce larger dose estimates for a given amount ofingested 131I. A large body of ultrasound data (Table 3)was recently reviewed by Bier (1996). The values re-ported by Bier (1996) are weighted averages acrossseveral studies obtained using the number of measure-ments reported in each study. He found a clear trendtowards lower values of the thyroid mass obtained bymodern ultrasonography as compared to similar dataobtained from autopsy (Fig. 1). For ages 0–15 y, theaverage thyroid mass measured by ultrasound is 75% of
that measured by autopsy. This fraction increases toabout 90% as the age approaches 15 y, indicating that, asthe thyroid mass increases, the ultrasound and autopsymeasuring techniques tend to produce more nearly sim-ilar results. For adults (over 18 y), the autopsy data(Mochizuki et al. 1963, cited by ICRP 1975) give anaverage thyroid mass of 17.5 g for males and 14.9 g forfemales. The difference between the ultrasound andautopsy measurements observed for age 15 y can be usedto predict the thyroid mass in adults. This methodindicates a thyroid mass of 0.9 � 17.5 g � 15.75 g foradult males, and 0.9 � 14.9 g � 13.4 g for adult females.These values (assigned to age 25 y) were used in ourcalculations.
The issue of interindividual variability of the thyroidmass was not addressed by Bier (1996). To investigateinterindividual variability, the data from Bier (1996)were compared to data from the countries of the formerSoviet Union (FSU; Yureiva et al. 1994; Derzhitskiy etal. 1994; Averichev et al. 1994; Avramenko et al. 1994;Danilyuk et al. 1994; Fig. 2). The data from the FSU,obtained by ultrasound measurements, report the distri-butions of thyroid mass in the population of school-agechildren from areas affected by the Chernobyl accident.In some cases, these distributions show a trend towardhigher values of thyroid mass than those reported by Bier(1996), probably because of abnormal levels of stableiodine in the diet of the children from FSU. However, for
Table 3. Thyroid mass (g) obtained by ultrasonography (Bier1996).
Age (y)Number of
measurementsMean thyroid
massStandarddeviation
Newborn 33 1.89 0.401 30 2.05 0.602 12 2.10 0.503 16 2.52 0.704 65 2.67 0.205 18 3.36 1.006 56 3.10 1.257 223 4.72 0.218 400 5.55 0.429 266 5.71 0.1710 289 6.87 0.6011 236 7.82 0.6912 261 8.83 0.2413 6740 9.08 1.6214 209 11.63 0.8915 415 11.52 0.29
Fig. 1. Comparison of thyroid masses obtained by autopsy inves-tigation and by ultrasound measurements (Bier 1996). The verticallines represent the 95% confidence interval from statistical anal-ysis of data. The continuous and dashed lines represent 3rd orderpolynomial curves fitted to the ultrasound and autopsy data,respectively.
465Dose coefficients from ingestion of 131I, 137Cs, and 90Sr ● A. I. APOSTOAEI AND L. F. MILLER

a given age group, the distribution of thyroid massesobserved in the FSU children, normalized for a centralvalue of the thyroid mass for that age group, gives anindication of the interindividual variability for any pop-ulation of children. A geometric standard deviation wasobtained from the comparison of FSU data with Bier(1996) data for which lognormal distributions with dif-ferent GSDs were applied. A GSD of 1.5 was determinedto be the best representation of uncertainty in thyroidmass due to interindividual variability of the thyroidmass. In conclusion, the uncertainty in the thyroid massis expressed using lognormal distributions having aver-age values from Bier (1996; Table 3) and a geometricstandard deviation of 1.5 applied to all age groups.
Results and discussion—131IThe estimates of the 95% confidence intervals for
the age-specific thyroid dose coefficients are shown inFig. 3 for females and are listed in Table 4 for selectedages at exposure and both sexes. A common geometricstandard deviation (GSD) of 1.7 can be used to describethe uncertainty in the dose coefficients for ingestion of131I for all age groups and both sexes. For ingestion of 131Iby infants a GSD of 1.8 is appropriate. The medians ofthe uncertainty distributions for each dose factor areclose to the values recommended by ICRP (2000).However, the ICRP dose coefficients are regarded asaverages across large populations, and thus they shouldalso be compared with the means of the uncertaintydistributions. The estimated means are 10–40% largerthan the ICRP coefficients. One expects larger values fordose coefficients estimated in this work because lowervalues for thyroid masses and larger values of uptakefractions (a) for children were used. However, the“apparent” biological half-life (T�) used in this studyproduces a removal rate of 131I from the thyroid glandgreater than the removal rate of 131I from the thyroid usedby ICRP, a difference that reduces the increase intro-duced by the lower thyroid mass and the faster clearanceof iodine from plasma.
The sensitivity analysis identifies the variables thatare major contributors to the uncertainty in the estimates
Fig. 3. Comparison of the thyroid dose coefficients for ingestion of131I calculated for females in this study to the most recent valuesrecommended by ICRP (2000). The dotted lines represent thelower and upper bounds of a 95% confidence interval. Forchildhood exposures (age �15 y), the thyroid dose coefficients formales are the same with those for females. For adults, the dosecoefficients for males are about 15% lower than dose for females.
Fig. 2. Comparison of thyroid masses from Bier (1996) and fromthe Gomel and Bryansk Regions (former Soviet Union), whichwere affected by the Chernobyl accident. The uncertainty in thethyroid masses reported by Bier (1996) was described by alognormal distribution with a geometric standard deviation of 1.5.The upper and lower bounds delimit a 95% confidence interval.The numbers in parentheses represent the number of samples forthe FSU data.
466 Health Physics May 2004, Volume 86, Number 5

of the dose coefficients. The analysis was performed forselected age groups. The major contributor to the uncer-tainty in the dose per unit intake is the thyroid mass(about 50%), followed by the fractional uptake fromblood (a; 35–40%). The biological elimination ratesfrom blood (�1) and from the thyroid (�2) have a lowcontribution that also decreases as the age at exposureincreases. The contribution of uncertainty in the absorp-tion from the gastrointestinal tract to blood is negligibleat all ages.
Therefore, to estimate the thyroid dose for a givenindividual, one should ideally obtain specific values forthe thyroid mass and the fractional uptake for thatindividual, and concentrate less on the retention time ofthe iodine in the thyroid gland. The thyroid mass for agiven individual could be obtained by direct measure-ment of thyroid volume using ultrasound techniques orby using relationships between thyroid mass and othereasy-to-measure characteristics such as body mass orbody height. Further research is necessary to identify amethod for assessing the fractional uptake of iodine bythe thyroid gland as a function of individual characteris-tics (without additional use of radioiodine as a tracer).
The dominant contribution of the thyroid mass to theuncertainty in the dose coefficients also has anotherimplication. For an individual who has multiple expo-sures at different ages, the dose coefficients are highlycorrelated, and this correlation must be taken into ac-count in the calculation of doses. That is, if an individualhas a relatively small thyroid in one year, it is likely thathe will still have a relatively small thyroid in thefollowing years, and thus a relatively high dose coeffi-cient applies to him in every year. However, the corre-lation is not complete because some variation in therelative size of the thyroid may occur, but, more impor-tantly, because, the fractional uptake (a) may vary bysome degree from one exposure to the next, according to
the metabolic state of the individual. When calculatingthyroid doses from multiple intakes of 131I, it is better toconsider full correlation between dose coefficients foreach exposure than to assume that they are independent,so the uncertainty in total dose is not underestimated.
137Cs
Cesium biokinetic is correlated with potassium dis-tribution and movement in the human body due to thegood chemical equivalence (Leggett 1986). After inges-tion, cesium (as potassium) is distributed rather uni-formly throughout the body, and thus the doses to allorgans are similar. This study concentrates on the dosecoefficients for ingestion of 137Cs by healthy adults. Sexdifferences are taken into account for the biokineticparameters, for the gamma energy absorption fractions,and for individual organ masses.
Emitted energies137Cs is a beta emitter that decays 94.6% of the time
into 137mBa, which further decays into its stable state byemitting 661 keV gamma radiations (89.8% of the time).Per nuclear transformation of 137Cs, the energy of emittedgamma and x rays is 0.564 MeV, while the averageenergy of emitted beta radiation is 0.249 MeV (ICRP1983). The uncertainty in these energy values is thoughtto be small compared to other sources of uncertainty thataffect the dose coefficients, so it was neglected.
Absorption from the gastrointestinal tractMost studies agree that cesium in inorganic form is
totally and rapidly absorbed into blood from the gastro-intestinal tract (ICRP 1975, 1989; Leggett 1986). How-ever, in some instances (e.g., 137Cs in contaminated meatingested by humans), the absorption fraction (f1) wasfound to be marginally lower, varying from 72% to 85%with a mean of 80.4% (Talbot et al. 1993). In this paper,
Table 4. Age-specific thyroid dose coefficients (� 10�7 Sv Bq�1) for ingestion of 131I.
Age at exposurea
This study
ICRP (2000)95% confidence interval
Mean GSDLower limit Median Upper limit
Newborn 15 39 118 47 1.8 371 10 36 105 41 1.7 365 8.5 23 65 27 1.7 2110 4.8 12 36 14 1.7 1015 2.5 6.5 16 7.4 1.7 6.8
20 (males) 1.6 4.7 12 5.5 1.6adult (males)b 1.6 4.2 11 4.8 1.6 4.320 (females) 1.9 5.0 13 5.9 1.6adult (females)b 1.7 4.9 12 5.7 1.6 4.3
a The median values of the dose coefficients for an age at exposure t � 20, can be obtained from the following 5th order polynomials:• Males: 10�7 � (38.576–1.2712 t � 0.71089 t2 0.096161 t3 � 0.0047536 t4 8.3594 10�5 t5) in Sv Bq�1.• Females: 10�7 � (38.605–1.3625 t � 0.66881 t2 0.089501 t3 � 0.0043344 t4 7.4676 10�5 t5) in Sv Bq�1.b The values for adults were obtained for age at exposure 25 y, but they are applicable to adults exposed at ages � 25.
467Dose coefficients from ingestion of 131I, 137Cs, and 90Sr ● A. I. APOSTOAEI AND L. F. MILLER

values in a range from 80% to 100% were considered tobe plausible for f1, and a triangular distribution having aminimum of 80% and a mode and a maximum of 100%was chosen to represent the uncertainty in this parameter.The average of this distribution is 93%.
Biokinetics of 137CsAbsorbed cesium is easily transported to all organs
and tissues. The most widely accepted approach is thatcesium is uniformly distributed in the body. This ap-proach is considered valid for the calculations done inthis work. Cesium is excreted in urine and feces, with theamount in urine being about 4 times larger than that infeces.
Since the half-life of the 137Cs in-growing decayproduct is very short (2.55 min), a reasonable assumptionis that the sites of decay for 137mBa should be the same asthose of its parent 137Cs. The location of 137mBa when itdecays is important because a large portion of the energyresponsible for the delivered dose comes from 137mBa andnot from 137Cs. There is some experimental evidence that137mBa migrates from its parent. By determining thedistribution of 137Cs and 137mBa in rats within a fewminutes after death, Wasserman et al. (1959) demon-strated some dissociation of 137mBa from administered137Cs. According to this evidence, 137mBa would followthe biokinetics of elemental barium, which has someaffinity for bone and is also rapidly transferred fromblood to the intestinal contents. The doses to the boneand to the gastrointestinal tract organs might change asa result of such a change in the biokinetic model.However, this evidence is inconclusive, and it has notyet been incorporated into the ICRP models. Such amodification of the models was not considered in thiswork, either.
The currently accepted biokinetic model consists oftwo compartments for the total body (ICRP 1979, 1989,1993), one with a fast and one with a slow turnover ofcesium. The fraction transferred to the fast turnovercompartment is denoted as a, and the default valuerecommended by ICRP is 10%. The default ICRP valuesfor the biological half-times for the fast and the slowcompartments in adults are T1 � 2 d and T1 � 110 d,respectively. The longest biological half-life is muchsmaller than the radioactive half-life of 137Cs (30 y).
Parameters a, T1 and T2 are related to the amount ofpotassium in the body. Using experimental data, Leggett(1986) derived relationships between these parametersand the amount of potassium in the total body.
Denoting by Kt the amount of potassium in thewhole body (expressed in grams), the relationships formales are
a � 0.81 � exp� � 0.014 Kt� (4a)
T1 � 18 � exp� � 0.016 Kt� (4b)
T2 � � 1.22 � 0.72 Kt. (4c)
In the above equations, the half-lives are expressedin days, and parameter a is a unitless fraction. Similarrelationships were derived for females (eqn 5a, b, c) foran amount of potassium greater than 43 g (Leggett 1986).For amounts of potassium less than 43 g, the relation-ships for males (eqn 4a, b, c) apply for females as well:
a � 0.89 � exp� � 0.016 Kt� (5a)
T1 � 14 � exp� � 0.01 Kt� (5b)
T2 � � 17.1 � 1.09 Kt. (5c)
In this study, the amount of potassium in the totalbody (Kt) was estimated by multiplying the concentrationof potassium in the human body [g kg�1 of total body;Anderson (1963)] and the human body mass (kg) asprovided by ICRP Publication 23 (1975; Table 5). Theuncertainty distribution for Kt is calculated by propagat-ing the uncertainties in the reported concentration ofpotassium (Kt) and whole body mass. Then, parametersa, T1, and T2 are derived using eqns (4) and (5) (Table 6).Similar distributions for parameters a, T1, and T2 arereported by Schwartz and Dunning (1982), but theyfound little or no correlation between these parametersand body mass or potassium amount.
Absorption fraction (AF)The energy of the emitted beta radiation is assumed
to be completely absorbed within each organ. The ab-sorbed fractions [AF(T4S)] for gamma radiation areobtained by multiplying the specific absorbed fraction[SAF(T4S)] reported by ICRP (Stabin et al. 1995; Cristyand Eckerman 1987) by the default mass of each targetorgan (T). For 137Cs, the source of radiation (S) is thewhole body. The absorbed fractions for gamma radiationare affected by uncertainties due to the lack of knowledge
Table 5. Total body mass and potassium concentration in adultmales and females.a
MeanStandard
Deviation Units
MalesBody massb 68.8 10.5 kgbody mass
Potassium concentration 2.08 0.375 gpotassium per kgbody mass
FemalesBody massb 56.9 8.6 kgbody mass
Potassium concentration 1.68 0.45 gpotassium per kgbody mass
a Total body mass minus the mass of the gastrointestinal tract contents.b Sources of data: ICRP (1975) for the body mass; Anderson (1963) forpotassium concentration.
468 Health Physics May 2004, Volume 86, Number 5
about the precise position and shape of each target organ,the relative size of the whole body and of each targetorgan, and by statistical uncertainties introduced by themethods used to solve the radiation transport problem.No full quantification of these uncertainties is available.However, given the current advancements in the MonteCarlo methods for radiation transport, it is expected thatthe statistical uncertainties are much smaller than the
uncertainties related to the size and position of differentorgans.
The absorbed fraction for similar target organs inmales (body weight � 70 kg) and in females (bodyweight � 58 kg) varies by less than 30% for all organsother than bone and muscle. For most organs the varia-tion in the absorbed fraction is even less than 20%. Thevariation in the absorbed fraction for muscles is about40% because males have less fat and more muscle thanfemales. The 95% confidence interval for the variation ofthe body mass in adult males is 48 to 90 kg (ICRP 1975).For females, the 95% confidence interval is 40 to 74 kg(ICRP 1975). As the body mass varies within theseconfidence intervals, the absorbed fraction varies bymore than 30%, but the variation is probably not largerthan 50%. In the absence of better information, theuncertainty in the absorbed fraction for gamma radiationfor all target organs was assumed to be 50%. A log-uniform distribution with the limits defined by a factor of1.5 above and below the ICRP recommended absorbedfraction was used in this paper.
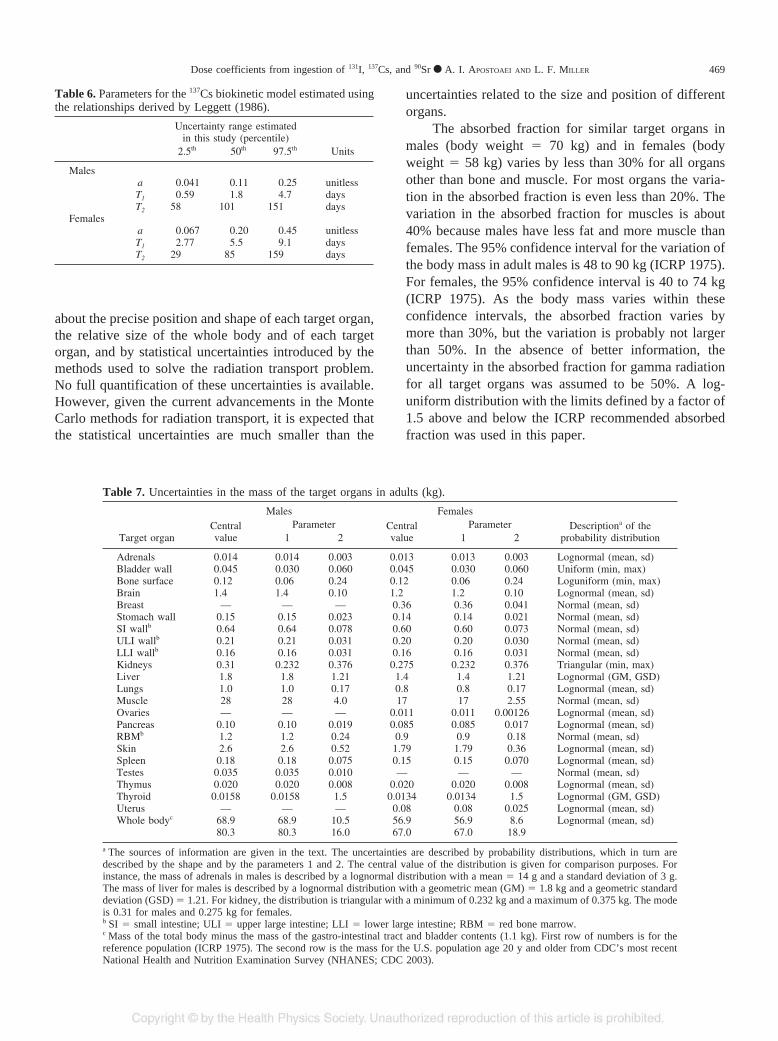
Table 7. Uncertainties in the mass of the target organs in adults (kg).
Target organ
Males FemalesDescriptiona of the
probability distributionCentralvalue
Parameter Centralvalue
Parameter1 2 1 2
Adrenals 0.014 0.014 0.003 0.013 0.013 0.003 Lognormal (mean, sd)Bladder wall 0.045 0.030 0.060 0.045 0.030 0.060 Uniform (min, max)Bone surface 0.12 0.06 0.24 0.12 0.06 0.24 Loguniform (min, max)Brain 1.4 1.4 0.10 1.2 1.2 0.10 Lognormal (mean, sd)Breast — — — 0.36 0.36 0.041 Normal (mean, sd)Stomach wall 0.15 0.15 0.023 0.14 0.14 0.021 Normal (mean, sd)SI wallb 0.64 0.64 0.078 0.60 0.60 0.073 Normal (mean, sd)ULI wallb 0.21 0.21 0.031 0.20 0.20 0.030 Normal (mean, sd)LLI wallb 0.16 0.16 0.031 0.16 0.16 0.031 Normal (mean, sd)Kidneys 0.31 0.232 0.376 0.275 0.232 0.376 Triangular (min, max)Liver 1.8 1.8 1.21 1.4 1.4 1.21 Lognormal (GM, GSD)Lungs 1.0 1.0 0.17 0.8 0.8 0.17 Lognormal (mean, sd)Muscle 28 28 4.0 17 17 2.55 Normal (mean, sd)Ovaries — — — 0.011 0.011 0.00126 Lognormal (mean, sd)Pancreas 0.10 0.10 0.019 0.085 0.085 0.017 Lognormal (mean, sd)RBMb 1.2 1.2 0.24 0.9 0.9 0.18 Normal (mean, sd)Skin 2.6 2.6 0.52 1.79 1.79 0.36 Lognormal (mean, sd)Spleen 0.18 0.18 0.075 0.15 0.15 0.070 Lognormal (mean, sd)Testes 0.035 0.035 0.010 — — — Normal (mean, sd)Thymus 0.020 0.020 0.008 0.020 0.020 0.008 Lognormal (mean, sd)Thyroid 0.0158 0.0158 1.5 0.0134 0.0134 1.5 Lognormal (GM, GSD)Uterus — — — 0.08 0.08 0.025 Lognormal (mean, sd)Whole bodyc 68.9 68.9 10.5 56.9 56.9 8.6 Lognormal (mean, sd)
80.3 80.3 16.0 67.0 67.0 18.9
a The sources of information are given in the text. The uncertainties are described by probability distributions, which in turn aredescribed by the shape and by the parameters 1 and 2. The central value of the distribution is given for comparison purposes. Forinstance, the mass of adrenals in males is described by a lognormal distribution with a mean � 14 g and a standard deviation of 3 g.The mass of liver for males is described by a lognormal distribution with a geometric mean (GM) � 1.8 kg and a geometric standarddeviation (GSD) � 1.21. For kidney, the distribution is triangular with a minimum of 0.232 kg and a maximum of 0.375 kg. The modeis 0.31 for males and 0.275 kg for females.b SI � small intestine; ULI � upper large intestine; LLI � lower large intestine; RBM � red bone marrow.c Mass of the total body minus the mass of the gastro-intestinal tract and bladder contents (1.1 kg). First row of numbers is for thereference population (ICRP 1975). The second row is the mass for the U.S. population age 20 y and older from CDC’s most recentNational Health and Nutrition Examination Survey (NHANES; CDC 2003).
Table 6. Parameters for the 137Cs biokinetic model estimated usingthe relationships derived by Leggett (1986).
Uncertainty range estimatedin this study (percentile)
Units2.5th 50th 97.5th
Malesa 0.041 0.11 0.25 unitlessT1 0.59 1.8 4.7 daysT2 58 101 151 days
Femalesa 0.067 0.20 0.45 unitlessT1 2.77 5.5 9.1 daysT2 29 85 159 days
469Dose coefficients from ingestion of 131I, 137Cs, and 90Sr ● A. I. APOSTOAEI AND L. F. MILLER

Organ massesProbability distributions describing the uncertainty
in the organ masses were developed for each target organ(Table 7) from detailed information presented by ICRP(1975). The uncertainties describe, to the extent possible,the inter-individual variability of the mass for thatparticular organ. In some cases, the original publicationscited by ICRP Publication 23 were used for more detailand additional explanations [e.g., Spitzka (1904) for theweight of the lungs; Tipton and Cook (1969) and Eve(1966) for the gastrointestinal tract organs]. For thyroidgland, the mass estimated using ultrasound measure-ments of the thyroid volume was used as describedearlier in this paper. Data on the bone surfaces and thered bone marrow are summarized by ICRP (1995), and adiscussion of the uncertainties is given by Apostoaei(2001).
The whole-body mass for adults was taken to be 70kg for males (SD � 10.5 kg) and 58 kg for females(SD � 8.6 kg; ICRP 1975). These distributions describea population of 20–30-y-old individuals, which wasconsidered the “reference” population in this study. Thecontemporary U.S. adult population (ages 20 y and older)has a distribution of the whole-body mass values biasedtowards larger values. According to the data for recentyears (1988–1994) reported by CDC’s National Healthand Nutrition Examination Survey (NHANES; CDC2003), the whole body mass of the U.S. males is 81.5 kg(SD � 16 kg) for ages 20 y and older. Similarly, thewhole body mass of U.S. females is 68 kg (SD � 18.9
kg) for age 20 y and older. The dose coefficientspresented in this paper are estimated using the referencepopulation defined using the ICRP values. However,dose coefficients obtained using the U.S. populationwhole body mass distributions are also provided.
The individual organ masses were assumed to befully correlated with the whole body mass. That is, it wasassumed that an individual with a large body mass willalso have a large mass for the muscles, lungs, liver,gastrointestinal tract, or other organs. This correlationshould not be regarded as a strict relationship. Obviously,the mass of a given organ may depend on other physicalparameters (e.g., body height) or on metabolic status(e.g., hormonal balance). However, it is more realistic touse such a correlation than to assume that individualorgan masses are entirely independent of the total bodymass.
RESULTS AND DISCUSSION—137Cs
The probability distributions obtained for the esti-mated dose coefficients for ingestion of 137Cs can befitted very well by either normal or lognormal distribu-tions. The mean and the median of each dose coefficientare almost equal. The geometric standard deviations(GSD) are about 1.24 for males and 1.40 for females(Table 8), and the coefficients of variation (CV) areabout 25% for males and 40% for females. The largeruncertainty observed for females is due to the largervariation of the amount of potassium in a population of
Table 8. Organ-specific dose coefficients (Sv Bq�1) for ingestion of 137Cs by adults.
OrganaMales Females
2.5th percentile 50th percentile 97.5th percentile GSD 2.5th percentile 50th percentile 97.5th percentile GSD
Adrenals 6.8 � 10�9 1.2 � 10�8 1.9 � 10�8 1.25 3.7 � 10�9 1.2 � 10�8 2.3 � 10�8 1.39Bladder wall 6.6 � 10�9 1.2 � 10�8 1.8 � 10�8 1.24 3.3 � 10�9 1.0 � 10�8 1.9 � 10�8 1.38Bone Surface 6.6 � 10�9 1.2 � 10�8 1.9 � 10�8 1.27 3.0 � 10�9 9.5 � 10�9 1.9 � 10�8 1.41Brain 5.3 � 10�9 1.0 � 10�8 1.5 � 10�8 1.23 2.9 � 10�9 9.4 � 10�9 1.8 � 10�8 1.40Breast 2.8 � 10�9 8.9 � 10�9 1.7 � 10�8 1.40ST wall 6.3 � 10�9 1.1 � 10�8 1.7 � 10�8 1.22 3.7 � 10�9 1.1 � 10�8 2.0 � 10�8 1.37SI wall 6.5 � 10�9 1.2 � 10�8 1.8 � 10�8 1.24 3.7 � 10�9 1.2 � 10�8 2.2 � 10�8 1.38ULI wall 6.6 � 10�9 1.1 � 10�8 1.7 � 10�8 1.23 3.8 � 10�9 1.1 � 10�8 2.2 � 10�8 1.38LLI wall 7.4 � 10�9 1.4 � 10�8 2.2 � 10�8 1.26 4.5 � 10�9 1.3 � 10�8 2.7 � 10�8 1.44Kidneys 6.3 � 10�9 1.1 � 10�8 1.9 � 10�8 1.28 3.2 � 10�9 1.0 � 10�8 2.0 � 10�8 1.41Liver 6.7 � 10�9 1.2 � 10�8 1.9 � 10�8 1.26 3.4 � 10�9 1.1 � 10�8 2.1 � 10�8 1.40Lungs 6.1 � 10�9 1.1 � 10�8 1.7 � 10�8 1.25 3.1 � 10�9 9.4 � 10�9 1.8 � 10�8 1.39Muscle 6.0 � 10�9 1.1 � 10�8 1.6 � 10�8 1.23 3.1 � 10�9 9.9 � 10�9 1.9 � 10�8 1.39Ovaries 3.5 � 10�9 1.1 � 10�8 2.2 � 10�8 1.40Pancreas 7.0 � 10�9 1.2 � 10�8 1.9 � 10�8 1.23 3.5 � 10�9 1.2 � 10�8 2.1 � 10�8 1.36Red Marrow 7.1 � 10�9 1.3 � 10�8 1.9 � 10�8 1.24 4.2 � 10�9 1.3 � 10�8 2.4 � 10�8 1.39Skin 5.2 � 10�9 9.3 � 10�9 1.4 � 10�8 1.23 2.7 � 10�9 8.5 � 10�9 1.6 � 10�8 1.38Spleen 6.3 � 10�9 1.2 � 10�8 1.9 � 10�8 1.27 3.5 � 10�9 1.1 � 10�8 2.2 � 10�8 1.40Testes 6.3 � 10�9 1.1 � 10�8 1.7 � 10�8 1.24Thymus 6.6 � 10�9 1.2 � 10�8 1.9 � 10�8 1.27 3.4 � 10�9 1.1 � 10�8 2.2 � 10�8 1.41Thyroid 7.0 � 10�9 1.3 � 10�8 2.0 � 10�8 1.26 3.5 � 10�9 1.1 � 10�8 2.1 � 10�8 1.39Uterus 3.6 � 10�9 1.2 � 10�8 2.2 � 10�8 1.38Remainder 5.9 � 10�9 1.1 � 10�8 1.6 � 10�8 1.23 3.0 � 10�9 9.9 � 10�9 1.9 � 10�8 1.38
a ST � stomach; SI � small intestine; ULI � upper large intestine; LLI � lower large intestine.
470 Health Physics May 2004, Volume 86, Number 5

females (Table 5). Even though the body weight has asimilar variation in the population for males and forfemales, the concentration of potassium has a largervariation for females; that is, for the same body weight,the concentration of potassium varies more amongwomen than among men.
However, the magnitude of the uncertainty is verysimilar among organs because the main contributor to theuncertainty in the dose coefficients (more than 80%) isthe biokinetic model, which affects all organs in the sameway. The mass and the absorbed fraction for eachindividual organ have only a small impact on the overalluncertainty. Also, the effect of uncertainty assigned tothe fraction absorbed from the gastrointestinal tract (f1) isnegligible.
The estimated 95% confidence intervals for the dosecoefficients encompass the ICRP values for 137Cs (Fig.4). However, the averages (and medians) of the estimateddose coefficients are lower than the dose coefficientscurrently reported by the ICRP for adults. The differ-ences range from 2–18% for males and 2–27% forfemales, depending on the organ. The reason for thelower dose coefficients is the shorter retention of 137Cspredicted by Leggett (1986) (i.e., T2 � 101 d for malesand T2 � 85 d for females; Table 6), as compared to theretention assumed by ICRP (T2 � 110 d). A secondaryreason is the fraction absorbed from the gastrointestinaltract (f1): ICRP recommends a default f1 � 1, while
values slightly less than 1 were used in this study. Thedifferences are uniform among organs, again due to thesame biokinetics.
The results shown here (Table 8) are for ingestion of137Cs by adults. If similar calculations were to be per-formed for children, no sex differences in the dosecoefficients are expected for exposures at ages less than7 y. For children above 7 y of age, slight changes withsex should be observed in the 137Cs biokinetic parameters(Leggett 1986). Above 10 y of age, males and femalesstart showing differences in the concentration of potas-sium (Anderson and Langham 1959), and for individualsolder than 15 y, the total body mass and the masses ofmany organs are sex-dependent. Uncertainties in the137Cs ingestion dose coefficients for exposure in child-hood are expected to be larger than the uncertainties inthe dose coefficients for adults (GSD �1.4 for males andGSD �1.6 for females).
For a larger body weight, the calculations show alonger residence time of 137Cs in the body, which wouldnormally lead to a higher dose due to a larger amount ofenergy deposited in the body. However, since the dose isthe energy divided by the mass, the effect of the longerresidence time is practically eliminated by the higherbody mass. Thus, the dose coefficients for 137Cs (Table 8)are not affected significantly when the body mass for theU.S. population (Table 7) is used. The dose coefficientsin Table 8 can be applied to assessments for members ofthe U.S. population.
90Sr
This study focused on the uncertainties in the dosecoefficients for ingestion of 90Sr, and it has explored thechanges with age and the effect of sex in the dosecoefficients for healthy adults. The available data on 90Srbiokinetics in humans, on the energy deposited in eachorgan, and on the masses of the organs were collectedand analyzed to derive probability distribution functionsdescribing the uncertainty in each parameter of themodel. Necessary correlations between parameters wereimposed before the uncertainties were propagatedthrough the biokinetic and dosimetric models usingMonte Carlo methods. Throughout this work, the uncer-tainties represent, to the extent possible, interindividualvariation of the given parameter. In those cases whendata were insufficient to clearly describe the interindi-vidual variability, the uncertainty describes the range ofpossible values obtained by professional judgment fromthe available information.
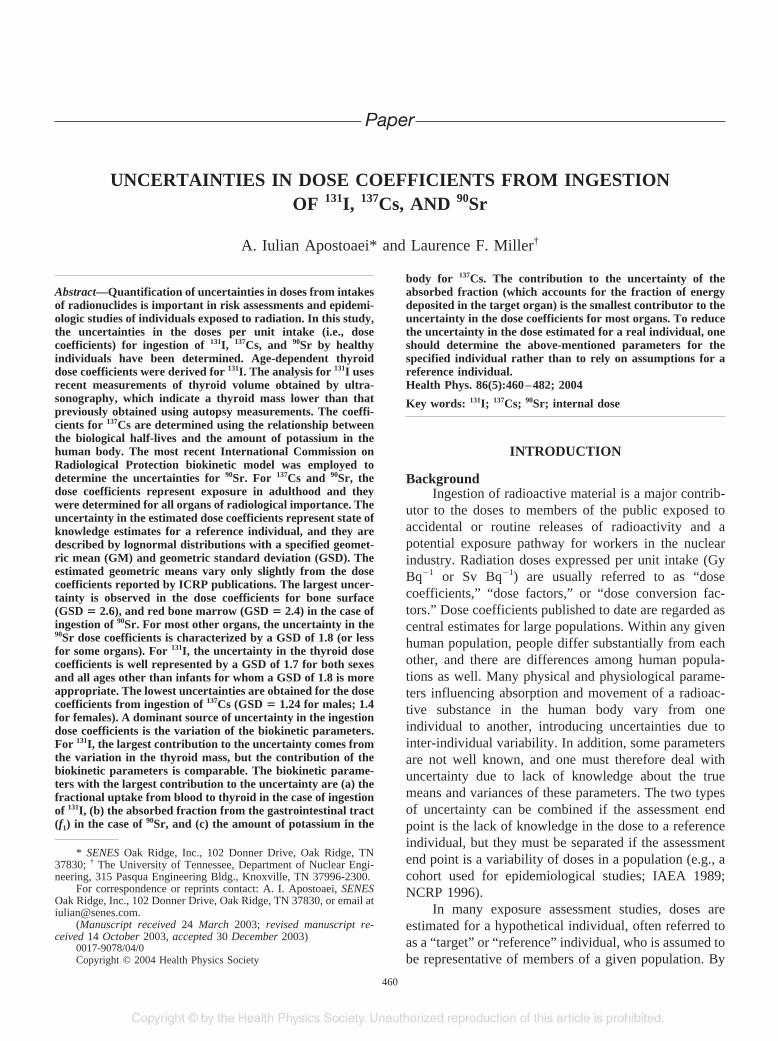
The ICRP’s most recently developed biokineticmodel developed for ingestion of 90Sr was employed forthe estimation of the dose coefficients (Fig. 5; ICRP
Fig. 4. Comparison of two dose coefficients for ingestion of 137Csestimated in this study to the most recent values recommended byICRP (2000). For the values estimated in this study, the centralvalue is the median, and the vertical lines represent the 95%confidence interval. The distributions obtained for males are wellrepresented by lognormal distributions, while the distributions forfemales deviate slightly from lognormal (i.e., they are closer tonormal distributions).
471Dose coefficients from ingestion of 131I, 137Cs, and 90Sr ● A. I. APOSTOAEI AND L. F. MILLER

1993). The movement of strontium in the human body isassumed to be well described by a set of first-orderdifferential equations of the form
dqi
dt� �
j
�jiqj � ��i � �R� qi i,j � 1 . . . n , (6)
where n is the number of compartments, �j,i are thetransfer rates between compartments (from j to i), �i isthe removal rate from compartment i, �R is the radioac-tive decay rate, and i is the compartment representing thecurrent “source” organ S. In Fig. 5 the transfer rates areexpressed as �j,i � aj,i � �j, where aj,i is the fraction ofmaterial leaving compartment j that reaches compart-ment i, and �j is the removal rate from compartment j.The sum of all fractions leaving a compartment must beequal to 1 (i.e., i � 1
aj, i � 1).The biokinetic model for 90Sr is described by eigh-
teen compartments (Qi, i � 1,18) and has fifteen non-
zero removal rates (�i, i � 1,15), sixteen fractionaltransfers between compartments (aj,i, i,j � 1,16) (count-ing only the ones different from 0 and 1), and a total of28 transfer rates (�j,i) between compartments. The pa-rameter values, their dependencies, and their interrela-tionships have been described previously by Apostoaei(2001). The concentration of 90Sr predicted by the bio-kinetic model was used to determine the number ofnuclear transformations in each organ. Then, organspecific dose coefficients were computed based on theprinciples of internal dosimetry (ICRP 1979; Eckerman1994) by using the mass of the target organ (MT) and thefraction of energy emitted from each source organ (S)that is absorbed in the organ of interest [AF(T4S)].
The organ-specific dose factors were calculated forthree major cases defined as follows:
● Case A1: The biokinetic parameters are for an adultand show no age dependency. 90Y, the radioactive
Fig. 5. The biokinetic model for 90Sr/90Y (gastrointestinal model metabolic model). The values of the biologicalhalf-life (T1/2), mean residence time (Tr) and the fractional transfer coefficients (ai,j) are the default values used in theICRP model (ICRP 1993). For the case in which 90Y was assumed to have different biokinetics than 90Sr (see text), acompartment describing the liver was added to the model. According to ICRP (1979), the flux of 90Y leaving plasmais divided among liver (15%), bone surfaces (50%), other soft tissues (10%), and prompt excretion (25%). 90Yaccumulated in any organ has an infinite retention time. All compartments of the above biokinetic model other than liver,bone surfaces and soft tissues are “turned off” for 90Y.
472 Health Physics May 2004, Volume 86, Number 5

progeny of 90Sr, was assumed to have the same kineticsas its parent, 90Sr;
● Case A2: The biokinetic parameters represent an adult,but age-dependencies are considered. Again, 90Y wasassumed to have the same kinetics as its parent, 90Sr;and
● Case B1: The biokinetic parameters are for an adultand show no age dependency. However, 90Y wasassumed to have different kinetics from its parent, 90Sr,as described by the ICRP Publication 30 biokineticmodel for 90Y (ICRP 1979).
The first step in the determination of uncertainties iningestion dose coefficients is to quantify the uncertaintyin the parameters of the biokinetic and dosimetric mod-els. The parameters are based on data obtained as a resultof investigations of strontium metabolism in humanssubject to scientific experiments and accidental expo-sures. Human data on chemically similar elements (e.g.,calcium) were used to complement the human data forstrontium. The analysis of data for deriving modelparameter distributions follows the logic used by Leggett(1992) to select the default parameter values for the ICRPbiokinetic model for 90Sr. No statistical fitting or param-eter optimization was performed by Leggett (1992) forthe entire strontium model, but “initial selections weremade for individual parameter values based on the bestavailable evidence for the pathway considered, and then,due to the interdependence of the parameter values,repeated ‘tuning’ of initial selections was performed untilsatisfactory fits to available human data were obtained.”A similar method was applied in this work. However, theparameters were derived as probability distribution func-tions, and comparisons with the experimental data con-sist of two equally important aspects: a) the predictedcentral value should reproduce the observed centraltendency of the data, and b) the range of the predictedvalues at any moment in time should cover interindi-vidual variation of the data for that moment. For exam-ple, Fig. 6 shows predicted activity concentrations ofstrontium as a function of time against observed concen-trations obtained in humans given I.V. injections ofradioactive strontium.
RESULTS AND DISCUSSION—90Sr
The doses per unit of ingested activity of 90Sr werecalculated for 22 organs. However, because of thespecific biokinetics of 90Sr, only 7 organs show differentdoses (i.e., bone surface, red bone marrow, bladder,stomach, small intestine, upper large intestine, and lowerlarge intestine), while the rest of the organs receive thesame dose. The dose coefficients were calculated for
each sex separately, but also for both combined. Thelatter calculations follow the ICRP approach. That is, thebiokinetic parameters represent both sexes combined,and the organs are defined as for the ICRP hermaphroditephantom (organ masses represent a male, but the phan-tom contains female organs such as breast and uterus).The sex-dependent dose coefficients are presented forCase A1 for an exposure at age 20 y (Table 9). Thesedose coefficients are obtained by integrating up to age70 y, and thus represents committed doses. The sex-independent dose coefficients obtained for cases A1, A2,and B1 described above are compared with the ICRPcoefficients in Fig. 7. Median values estimated in thiswork are slightly lower than the values published byICRP (1993). One of the main reasons for this differenceis the lower value for uptake from the gastrointestinaltract (f1) used in this work. ICRP (1993) used f1 � 0.3,while, in this work, the central value of the distributionfor f1 is 0.23 (Apostoaei 2002), which is 23% lower thanthe ICRP value. Also, the elimination rate of strontiumfrom trabecular bone derived in this work (0.22 y�1;Apostoaei 2001) is larger than the value used by ICRP(0.18 y�1), a difference that affects mainly the dosecoefficients for the bone surfaces and to red bonemarrow. In addition, for the organs of the gastrointestinaltract, ICRP (1993) assumes no reduction of the dose tothe sensitive cells in the walls of an organ due to thepotential attenuation of the beta radiation emitted fromthe organ contents. In this work, a reduction factoraccounting for this effect was used as described byApostoaei (2001). This reduction factor is importantespecially for the upper and lower large intestine, forwhich the dose from radioactivity in the organ contentsdominates over the dose from the systemic radioactivity.
Age dependencyOnly four of the biokinetic parameters were identi-
fied to have a variation with age for adults. These fourparameters are the fractional transfers of strontium fromplasma to cortical and trabecular bone, and the removalrates from the cortical and trabecular bone, respectively.For most of the other parameters there are not enoughdata to fully analyze the age dependency. However, thevariation with age for most biokinetic parameters (if any)is expected to be very mild. For the absorption from thegastrointestinal tract (f1), the transfer of strontium toexcreta, and the half-life of strontium in the non-exchangeable bone volume there are sufficient data for arigorous statistical analysis, but no statistically signifi-cant age dependency is evident. In addition, no agedependency is observed for the fraction of the energyabsorbed in an organ, and the age dependency in the
473Dose coefficients from ingestion of 131I, 137Cs, and 90Sr ● A. I. APOSTOAEI AND L. F. MILLER

organ masses has a negligible affect on the dose coeffi-cients compared to the size of the uncertainty ranges forthe same dose coefficients.
The variation of the dose coefficients with age atexposure is shown in Fig. 8, where the dose coefficientsrepresent dose delivered over a period of time fromexposure to age 70 y. The variation of the dose coeffi-cients with age at exposure is important for estimation ofdoses from continuous exposures. Such doses can beobtained by multiplying the intake by the dose coeffi-cients at each age and then summing over all ages.
Dose coefficients as a function of attained age (i.e.,the dose from the time of exposure to a specified age) canalso be useful, for example, for calculating quantitiessuch as the probability of cancer causation from aparticular exposure. The variation of the dose coeffi-cients with attained age is shown in Fig. 8 for exposuresat age 20 y.
The differences between the dose coefficients ob-tained in Case A1 (age-independent parameters) and inCase A2 (age-dependent parameters) are small comparedwith the magnitude of the uncertainties in the dose
Fig. 6. Comparison of predicted and observed concentrations of strontium in humans after a single I.V. injection. Thepredicted values (solid lines) were obtained assuming age-independent parameters (Case A1). The dotted lines representthe estimated 95% confidence interval about the predicted concentration at a given time. Unconnected symbols representthe concentrations observed in the studies indicated in the legend.
474 Health Physics May 2004, Volume 86, Number 5

factors and compared to the variation of the dose coef-ficients with age at exposure and attained age. Also, theuncertainties for the two sets of dose coefficients arecomparable. These results are not surprising becausedose is a cumulative quantity. Even though some param-eters are age dependent, when the dose is integrated overtime, the result is similar to that obtained with age-averaged parameters values.
In the age-at-exposure curve for Case A2, a mini-mum is observed for exposure at age 35 y (Fig. 8); this isthe result of the low plasma to bone transfer for that age(Apostoaei 2001). The largest difference between CaseA1 and Case A2 is about 40% (observed for bonesurfaces and red bone marrow; Fig. 8). This difference issmall compared to the uncertainties in the dose coeffi-cients (a factor of 6 for bone surfaces and 5 for red bonemarrow).
The attained-age curves also show that the commit-ted dose is essentially reached about 30 y after exposurefor the bone surfaces and 20 y after exposure for the redbone marrow and for organs other than bladder and lowerand upper large intestine (Fig. 8). The dose to the latterorgans is dominated by the dose from the activity in thecontents of these organs, and thus the committed dose isreached much faster (in about 10 y for bladder and in 1or 2 y for the upper and lower large intestine; Apostoaei2001).
Fig. 7. Dose coefficients from ingestion of 90Sr estimated in thiswork. The vertical lines represent the 95% confidence intervals.The results are presented for three different cases: A1 � age-independent biokinetic parameters and same kinetics for 90Sr and90Y; A2 � age-dependent biokinetic parameters and same kineticsfor 90Sr and 90Y; and B1 � age-independent biokinetic parametersand different kinetics for 90Sr and 90Y. All results are obtainedassuming an exposure at age 20 y and an integration period of 50 y(i.e., they represent committed doses). The dose factors publishedby ICRP (1993) are included for comparison purposes.
Table 9. Organ-specific dose coefficients (Sv Bq�1) for ingestion of 90Sr by an adult male, for Case A1 (age-independentbiokinetic parameters and same kinetics for 90Sr and 90Y), for the reference population.
OrganaMales Females
2.5th percentile 50th percentile 97.5th percentile GSD 2.5th percentile 50th percentile 97.5th percentile GSD
Adrenalsb 2.1 � 10�10 5.7 � 10�10 1.7 � 10�9 1.76 2.5 � 10�10 7.0 � 10�10 2.1 � 10�9 1.76Bladder wallb 4.6 � 10�10 1.2 � 10�9 2.8 � 10�9 1.59 5.0 � 10�10 1.3 � 10�9 3.2 � 10�9 1.60Bone Surface 5.6 � 10�8 3.5 � 10�7 1.9 � 10�6 2.47 4.0 � 10�8 2.7 � 10�7 1.5 � 10�6 2.61Brainb 2.1 � 10�10 5.7 � 10�10 1.7 � 10�9 1.76 2.5 � 10�10 7.0 � 10�10 2.1 � 10�9 1.76Breastb 2.5 � 10�10 7.0 � 10�10 2.1 � 10�9 1.76ST wallb 2.9 � 10�10 7.1 � 10�10 1.8 � 10�9 1.60 3.4 � 10�10 8.4 � 10�10 2.2 � 10�9 1.62SI wallb 4.0 � 10�10 8.5 � 10�10 2.0 � 10�9 1.51 4.5 � 10�10 9.7 � 10�10 2.3 � 10�9 1.53ULI wallb 1.7 � 10�9 3.4 � 10�9 6.8 � 10�9 1.45 1.8 � 10�9 3.6 � 10�9 6.9 � 10�9 1.44LLI wall 7.1 � 10�9 1.6 � 10�8 4.5 � 10�8 1.67 7.3 � 10�9 1.6 � 10�8 4.5 � 10�8 1.67Kidneysb 2.1 � 10�10 5.7 � 10�10 1.7 � 10�9 1.76 2.5 � 10�10 7.0 � 10�10 2.1 � 10�9 1.76Liverb 2.1 � 10�10 5.7 � 10�10 1.7 � 10�9 1.76 2.5 � 10�10 7.0 � 10�10 2.1 � 10�9 1.76Lungsb 2.1 � 10�10 5.7 � 10�10 1.7 � 10�9 1.76 2.5 � 10�10 7.0 � 10�10 2.1 � 10�9 1.76Muscleb 2.1 � 10�10 5.7 � 10�10 1.7 � 10�9 1.76 2.5 � 10�10 7.0 � 10�10 2.1 � 10�9 1.76Ovariesb 2.1 � 10�10 5.7 � 10�10 1.7 � 10�9 1.76 2.5 � 10�10 7.0 � 10�10 2.1 � 10�9 1.76Pancreasb 2.1 � 10�10 5.7 � 10�10 1.7 � 10�9 1.76 2.5 � 10�10 7.0 � 10�10 2.1 � 10�9 1.76Red Marrow 2.8 � 10�8 1.5 � 10�7 6.0 � 10�7 2.25 2.5 � 10�8 1.4 � 10�7 7.3 � 10�7 2.40Skinb 2.1 � 10�10 5.7 � 10�10 1.7 � 10�9 1.76 2.5 � 10�10 7.0 � 10�10 2.1 � 10�9 1.76Spleenb 2.1 � 10�10 5.7 � 10�10 1.7 � 10�9 1.76 2.5 � 10�10 7.0 � 10�10 2.1 � 10�9 1.76Testesb 2.1 � 10�10 5.7 � 10�10 1.7 � 10�9 1.76Thymusb 2.1 � 10�10 5.7 � 10�10 1.7 � 10�9 1.76 2.5 � 10�10 7.0 � 10�10 2.1 � 10�9 1.76Thyroidb 2.1 � 10�10 5.7 � 10�10 1.7 � 10�9 1.76 2.5 � 10�10 7.0 � 10�10 2.1 � 10�9 1.76Uterusb 2.5 � 10�10 7.0 � 10�10 2.1 � 10�9 1.76Remainderb 2.1 � 10�10 5.7 � 10�10 1.7 � 10�9 1.76 2.5 � 10�10 7.0 � 10�10 2.1 � 10�9 1.76
a ST � stomach; SI � small intestine; ULI � upper large intestine; LLI � lower large intestine.b The dose coefficients in this table are for individuals of a reference population (ICRP 1975) for whom the whole-body mass is 70kg for males and 58 kg for females (see Table 7 for assigned uncertainties).
475Dose coefficients from ingestion of 131I, 137Cs, and 90Sr ● A. I. APOSTOAEI AND L. F. MILLER

The uncertainty in the dose coefficients does notchange significantly with age at exposure or attained agefor bladder, the gastrointestinal organs, or the soft tissueorgans. For bone surface the uncertainty varies with ageat exposure from a GSD of 2.5 at age 20 y to a GSD of2.0 at age 69 y, while for red bone marrow it variesbetween the same ages from a GSD of 2.3 to a GSD of1.8. The variation with attained age of the uncertainty for
these two organs is comparable in magnitude to thevariation with age at exposure with the difference that thelargest uncertainties occur at the highest attained ages.
Sex dependencyOf all biokinetic parameters analyzed for 90Sr, only
the removal rate of strontium from the trabecular bonewas found to depend on sex, and that only slightly. For
Fig. 8. Age-at-exposure (left column) and attained-age (right column) dependency of the dose coefficients fromingestion of 90Sr. In the left column, the values represent the dose per unit intake delivered from the indicated age atexposure to age 70 y. In the right column, the values represent the dose per unit intake at age 20 y to the indicatedattained age. The vertical lines are the 95% confidence intervals about the estimated dose factors. “Other organs” refersto organs other than the bone structures, bladder, and gastrointestinal tract.
476 Health Physics May 2004, Volume 86, Number 5
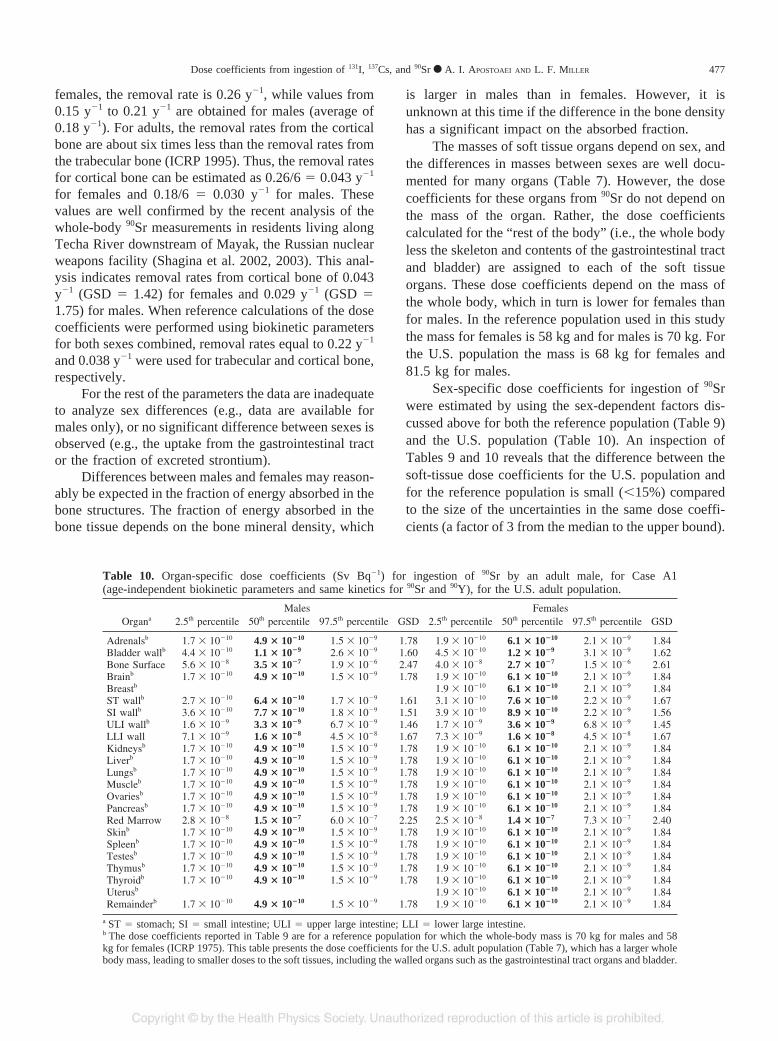
females, the removal rate is 0.26 y�1, while values from0.15 y�1 to 0.21 y�1 are obtained for males (average of0.18 y�1). For adults, the removal rates from the corticalbone are about six times less than the removal rates fromthe trabecular bone (ICRP 1995). Thus, the removal ratesfor cortical bone can be estimated as 0.26/6 � 0.043 y�1
for females and 0.18/6 � 0.030 y�1 for males. Thesevalues are well confirmed by the recent analysis of thewhole-body 90Sr measurements in residents living alongTecha River downstream of Mayak, the Russian nuclearweapons facility (Shagina et al. 2002, 2003). This anal-ysis indicates removal rates from cortical bone of 0.043y�1 (GSD � 1.42) for females and 0.029 y�1 (GSD �1.75) for males. When reference calculations of the dosecoefficients were performed using biokinetic parametersfor both sexes combined, removal rates equal to 0.22 y�1
and 0.038 y�1 were used for trabecular and cortical bone,respectively.
For the rest of the parameters the data are inadequateto analyze sex differences (e.g., data are available formales only), or no significant difference between sexes isobserved (e.g., the uptake from the gastrointestinal tractor the fraction of excreted strontium).
Differences between males and females may reason-ably be expected in the fraction of energy absorbed in thebone structures. The fraction of energy absorbed in thebone tissue depends on the bone mineral density, which
is larger in males than in females. However, it isunknown at this time if the difference in the bone densityhas a significant impact on the absorbed fraction.
The masses of soft tissue organs depend on sex, andthe differences in masses between sexes are well docu-mented for many organs (Table 7). However, the dosecoefficients for these organs from 90Sr do not depend onthe mass of the organ. Rather, the dose coefficientscalculated for the “rest of the body” (i.e., the whole bodyless the skeleton and contents of the gastrointestinal tractand bladder) are assigned to each of the soft tissueorgans. These dose coefficients depend on the mass ofthe whole body, which in turn is lower for females thanfor males. In the reference population used in this studythe mass for females is 58 kg and for males is 70 kg. Forthe U.S. population the mass is 68 kg for females and81.5 kg for males.
Sex-specific dose coefficients for ingestion of 90Srwere estimated by using the sex-dependent factors dis-cussed above for both the reference population (Table 9)and the U.S. population (Table 10). An inspection ofTables 9 and 10 reveals that the difference between thesoft-tissue dose coefficients for the U.S. population andfor the reference population is small (�15%) comparedto the size of the uncertainties in the same dose coeffi-cients (a factor of 3 from the median to the upper bound).
Table 10. Organ-specific dose coefficients (Sv Bq�1) for ingestion of 90Sr by an adult male, for Case A1(age-independent biokinetic parameters and same kinetics for 90Sr and 90Y), for the U.S. adult population.
OrganaMales Females
2.5th percentile 50th percentile 97.5th percentile GSD 2.5th percentile 50th percentile 97.5th percentile GSD
Adrenalsb 1.7 � 10�10 4.9 � 10�10 1.5 � 10�9 1.78 1.9 � 10�10 6.1 � 10�10 2.1 � 10�9 1.84Bladder wallb 4.4 � 10�10 1.1 � 10�9 2.6 � 10�9 1.60 4.5 � 10�10 1.2 � 10�9 3.1 � 10�9 1.62Bone Surface 5.6 � 10�8 3.5 � 10�7 1.9 � 10�6 2.47 4.0 � 10�8 2.7 � 10�7 1.5 � 10�6 2.61Brainb 1.7 � 10�10 4.9 � 10�10 1.5 � 10�9 1.78 1.9 � 10�10 6.1 � 10�10 2.1 � 10�9 1.84Breastb 1.9 � 10�10 6.1 � 10�10 2.1 � 10�9 1.84ST wallb 2.7 � 10�10 6.4 � 10�10 1.7 � 10�9 1.61 3.1 � 10�10 7.6 � 10�10 2.2 � 10�9 1.67SI wallb 3.6 � 10�10 7.7 � 10�10 1.8 � 10�9 1.51 3.9 � 10�10 8.9 � 10�10 2.2 � 10�9 1.56ULI wallb 1.6 � 10�9 3.3 � 10�9 6.7 � 10�9 1.46 1.7 � 10�9 3.6 � 10�9 6.8 � 10�9 1.45LLI wall 7.1 � 10�9 1.6 � 10�8 4.5 � 10�8 1.67 7.3 � 10�9 1.6 � 10�8 4.5 � 10�8 1.67Kidneysb 1.7 � 10�10 4.9 � 10�10 1.5 � 10�9 1.78 1.9 � 10�10 6.1 � 10�10 2.1 � 10�9 1.84Liverb 1.7 � 10�10 4.9 � 10�10 1.5 � 10�9 1.78 1.9 � 10�10 6.1 � 10�10 2.1 � 10�9 1.84Lungsb 1.7 � 10�10 4.9 � 10�10 1.5 � 10�9 1.78 1.9 � 10�10 6.1 � 10�10 2.1 � 10�9 1.84Muscleb 1.7 � 10�10 4.9 � 10�10 1.5 � 10�9 1.78 1.9 � 10�10 6.1 � 10�10 2.1 � 10�9 1.84Ovariesb 1.7 � 10�10 4.9 � 10�10 1.5 � 10�9 1.78 1.9 � 10�10 6.1 � 10�10 2.1 � 10�9 1.84Pancreasb 1.7 � 10�10 4.9 � 10�10 1.5 � 10�9 1.78 1.9 � 10�10 6.1 � 10�10 2.1 � 10�9 1.84Red Marrow 2.8 � 10�8 1.5 � 10�7 6.0 � 10�7 2.25 2.5 � 10�8 1.4 � 10�7 7.3 � 10�7 2.40Skinb 1.7 � 10�10 4.9 � 10�10 1.5 � 10�9 1.78 1.9 � 10�10 6.1 � 10�10 2.1 � 10�9 1.84Spleenb 1.7 � 10�10 4.9 � 10�10 1.5 � 10�9 1.78 1.9 � 10�10 6.1 � 10�10 2.1 � 10�9 1.84Testesb 1.7 � 10�10 4.9 � 10�10 1.5 � 10�9 1.78 1.9 � 10�10 6.1 � 10�10 2.1 � 10�9 1.84Thymusb 1.7 � 10�10 4.9 � 10�10 1.5 � 10�9 1.78 1.9 � 10�10 6.1 � 10�10 2.1 � 10�9 1.84Thyroidb 1.7 � 10�10 4.9 � 10�10 1.5 � 10�9 1.78 1.9 � 10�10 6.1 � 10�10 2.1 � 10�9 1.84Uterusb 1.9 � 10�10 6.1 � 10�10 2.1 � 10�9 1.84Remainderb 1.7 � 10�10 4.9 � 10�10 1.5 � 10�9 1.78 1.9 � 10�10 6.1 � 10�10 2.1 � 10�9 1.84
a ST � stomach; SI � small intestine; ULI � upper large intestine; LLI � lower large intestine.b The dose coefficients reported in Table 9 are for a reference population for which the whole-body mass is 70 kg for males and 58kg for females (ICRP 1975). This table presents the dose coefficients for the U.S. adult population (Table 7), which has a larger wholebody mass, leading to smaller doses to the soft tissues, including the walled organs such as the gastrointestinal tract organs and bladder.
477Dose coefficients from ingestion of 131I, 137Cs, and 90Sr ● A. I. APOSTOAEI AND L. F. MILLER

The uncertainties in the soft tissue dose coefficients aresimilar for males and females.
The dose coefficients for the walls of the gastroin-testinal tract contain a contribution of the radiationemitted from the content of these organs. This contribu-tion is small for stomach, and is dominant for the lowerportion of the large intestine. Thus, the dose coefficientsfor stomach are larger by 20% for females than for males(i.e., like any other soft tissue), but practically nodifference between sexes is obtained for the lower largeintestine.
The dose coefficients for bone surface and red bonemarrow are lower for females than for males becausefemales show, on average, a larger loss of strontium frombone structures. However, females have a lower red bonemarrow mass than males (due to a lower skeleton massand volume), while no difference between males andfemales is considered for bone surfaces (Table 7). Thus,for bone surfaces the dose coefficients for females arelower than the dose coefficients for males by about 25%.For the red bone marrow, the difference between sexes isonly 5%. The uncertainties in the bone surface and redbone marrow dose coefficients for females are larger thanthe uncertainties in the same dose coefficients for males(Table 9). The removal rate of strontium from bone is notonly larger for females, but it has also a larger variationin the population than the removal rate for males. Themagnitude of the uncertainties in the individual dosefactors is much larger than the differences between thedose coefficients for the two sexes (Fig. 9).
Different kinetics for 90Sr and 90YThe kinetics of 90Y are not identical to the kinetics of
its parent, 90Sr. Experimental data on 90Y (ICRP 1979)indicate that yttrium tends to accumulate in liver morethan in other soft tissue organs and that a substantiallylarger fraction of yttrium is transferred from plasma tobones than in the case of strontium.
To investigate the potential impact of the differentkinetics, dose coefficients were estimated using thekinetic model of yttrium proposed by the ICRP (ICRP1979; Eckerman et al. 1999). This model specifies thatyttrium leaves plasma with a half-time of 0.25 d, and that50% goes to bone, 25% to excretion, 15% to liver, and10% to other soft tissues. In all organs of the body 90Y isretained indefinitely. The uptake from the gastrointesti-nal tract (f1) is 10�4. The transfer from plasma totrabecular and cortical bone is assumed to be the same asfor 90Sr (i.e., trabecular bones receive 50% more yttriumthan the cortical bones). Similarly, the fraction that goesto excretion is divided 1/4 to feces and 3/4 to urine, thesame as for 90Sr.
The organ dose coefficients obtained using thiskinetic model for 90Y are practically identical to the dosesobtained when 90Y is assumed to have the same kineticsas its parent, 90Sr. The only significant difference isobserved for bladder, where the dose for Case B1 islower by 50% than the dose for Case A1 (Fig. 7). Thedifference is given by the half-time of yttrium in plasma,which is longer than for strontium, resulting in a lowerestimate of the overall transfer from plasma to thebladder. Even though liver is considered a separate organin the yttrium biokinetic model, the dose coefficient forliver for Case B1 is practically identical to the dosecoefficient for Case A1 (less than 1% difference). That is,the results for liver are similar to the ones presented inFig. 7 for other organs.
These calculations are based on the assumption thatonly 90Sr is initially ingested. In reality, any food items orpotable liquids in which 90Sr is present can contain 90Y inequilibrium with its parent. Thus, ingestion of 1 Bq of90Sr usually means ingestion of 1 Bq of 90Y as well. Sinceyttrium is poorly taken up from the gastrointestinal tract(f1 � 10�4) as compared to strontium (f1 � 0.23), thedoses to organs other than the gastrointestinal tract arenot changed because of the additional ingestion of 90Y.The following dose coefficients to the gastrointestinaltract organs are obtained for the case when both radio-nuclides are ingested: a) stomach � 1.7 � 10�9 Sv Bq�1
(95% C.I., 8.6 � 10�10–3.2 � 10�9); b) small intestine �2.4 � 10�9 Sv Bq�1 (95% C.I., 1.2 � 10�9–6.3 � 10�9);c) upper large intestine � 1.3 � 10�8 Sv Bq�1 (95% C.I.,7.1 � 10�9–2.2 � 10�8); and d) lower large intestine �4.3 � 10�8 Sv Bq�1 (95% C.I., 2.0 � 10�8–1.1 � 10�7).
Fig. 9. Sex differences in the dose coefficients for ingestion of 90Srby adults. Note that the left vertical axis applies to bone surfaceand red bone marrow and is different from the right vertical axisthat applies for soft tissue organs.
478 Health Physics May 2004, Volume 86, Number 5

These dose coefficients are larger than the dose coeffi-cients obtained for ingestion of 90Sr alone by factors of2.2 for stomach, 2.7 for small intestine, 4.1 for upperlarge intestine, and 2.7 for lower large intestine.
Sensitivity analysisThe sensitivity analysis performed on the dose
coefficients for 90Sr indicates that, for all organs, theuncertainty in the biokinetic model parameters dominatesthe uncertainty in the estimated dose coefficients (morethan 80% for most organs). For most organs, the secondmost important contributor is the mass of the targetorgan, while energy deposition (absorbed fraction) hasthe lowest contribution.
The uncertainty in the mass of bone surface has arelatively large contribution to the uncertainty in the dosecoefficient for bone surface. As opposed to other targetorgans, there is little information about the mass of thebone surfaces. Even the definition of “bone surface” isdebated among investigators. The mass of bone surface isknown within a factor of 2, an uncertainty substantiallylarger than the uncertainty in the mass of other organs.
The energy deposition is important for the lowerlarge intestine, and, for the upper large intestine, evenmore important than the mass. For these organs, a goodportion of the dose to the radio-carcinogenic cells§ comesfrom radiation emitted from the organ contents, forwhich attenuation varies between 10 and 100% (Apos-toaei 2001).
The uncertainty introduced by the biokinetic modelcan be further decomposed to identify the importantbiokinetic parameters. For the bone surface and the redbone marrow, the fractional transfer of 90Sr from the bonesurface to the exchangeable bone volume is the mostimportant contributor (a536 � a233 � 36%; Fig. 5),followed by the absorption fraction from the gastrointes-tinal tract (f1; 20%). For the upper and the lower largeintestine, the uncertainty in the removal rate of 90Srdominates (�85%) the uncertainty in the biokinetics,while the absorption fraction (f1) contributes only 6–8%.For the other soft tissue organs (stomach and smallintestine included), the most important parameter is theabsorption fraction (f1; 45%).
SUMMARY AND CONCLUSIONS
The uncertainties in the organ-specific dose coeffi-cients for ingestion of 131I, 137Cs, and 90Sr by healthyindividuals have been determined based on a number ofadvancements in the area of uncertainty in internal
dosimetry. The analysis for 131I uses measurements ofthyroid volume obtained by recently developed ultra-sonography methods, which indicate a thyroid masslower than previously obtained using autopsy measure-ments. The coefficients of 137Cs are determined using therelationship between the biological half-lives and theamount of potassium in the human body. The most recentICRP biokinetic model was employed to determine theuncertainties for 90Sr. Sex-dependency of the dose coef-ficients has been investigated for all three radionuclides.Age-dependent thyroid dose coefficients were derivedfor 131I, while for 137Cs and 90Sr the dose coefficientsrepresent exposure in adulthood for all organs includedin the ICRP list of dose coefficients (ICRP 1993).
Generally, the probability distributions describingthe uncertainties in the estimated dose coefficients can befitted to lognormal distributions. For exposure to 137Cs,the uncertainty in the distributions can be fitted wellusing either normal or lognormal distributions (for someorgans a normal distribution provides a slightly betterfit).
A comparison to the dose coefficients reported byICRP indicated that the geometric means of the estimateddose coefficients are different from the dose coefficientsreported by ICRP but only by small amounts comparedto the magnitude of the dose coefficients. The averagedose coefficients for ingestion of 131I are slightly largerthan the ICRP coefficients. The effect of the lowerthyroid mass (as obtained from ultrasound measure-ments) is compensated to a high degree by the half-life inthe thyroid used in this study, which is shorter than thedefault ICRP value. The estimated dose coefficients for137Cs and 90Sr are slightly lower than the ICRP coeffi-cients due to our assumed lower uptake from the gastro-intestinal tract, as well as to other parameters (e.g.,shorter retention of 137Cs predicted by our model; largerelimination rate of 90Sr from the trabecular bone).
The largest uncertainty is observed for bone(GSD � 2.6) and red bone marrow (GSD � 2.4) dosecoefficients from ingestion of 90Sr by females. The samedose coefficients for males have only slightly loweruncertainties (Table 9). For other organs, the uncertaintyin the 90Sr dose coefficients is characterized by a GSD of1.5 for the small and upper large intestine, 1.6 forstomach and bladder wall, 1.7 for lower large intestine,and 1.8 for all other organs. For ingestion of 131I, a GSDof 1.7 can be used for the thyroid dose coefficients for allages and both sexes. For ingestion of 131I by infants, aGSD of 1.8 is appropriate. The uncertainties in the dosecoefficients from ingestion of 137Cs are described by aGSD of 1.24 for males and 1.4 for females where thelarger uncertainty observed for females is due to largervariation of the amount of potassium in females. The
§ The radio-carcinogenic cells in the gastrointestinal tract wall arelocated between the surface of the intestine and a few layers of cellsbelow the surface.
479Dose coefficients from ingestion of 131I, 137Cs, and 90Sr ● A. I. APOSTOAEI AND L. F. MILLER

uncertainties in the dose coefficients for ingestion of137Cs are small compared with uncertainties in the dosecoefficients for ingestion of the other two radionuclides.
For ingestion of 131I, sex differences occur only forindividuals older than 15 y of age, with females having alarger dose coefficient than males due to a lower thyroidmass (Table 4). The 131I dose coefficients have the sameuncertainty for both males and females. For ingestion of90Sr, for soft tissue organs, the dose coefficients forfemales are larger by about 20% than the dose coeffi-cients for males due to the average lower body mass offemales. The uncertainties in these 90Sr dose coefficientsare similar for both males and females (Table 9). Thedose coefficients for bone surface and red bone marroware lower for females than for males because femalesshow, on average, a larger removal rate of strontium frombone structures. For bone surfaces the dose coefficientsfor females are lower than the dose coefficients for malesby about 25%. For red bone marrow, the differencebetween sexes is only 5%. The uncertainties in the bonesurface and red bone marrow dose coefficients forfemales are larger than the uncertainties in the same dosecoefficients for males (Table 9).
The sensitivity analyses indicate that the uncertaintyintroduced by the variability in the biokinetic parametersis the dominant source of uncertainty in the ingestiondose coefficients for 137Cs and 90Sr. For 131I, the bioki-netic parameters contribute about 30–40% of the totaluncertainty in the dose coefficients (depending on theage at exposure), while the contribution of the thyroidmass is about 50%. The uncertainty in the absorbedfraction (the fraction of energy deposited in the targetorgan) is the smallest contributor to the uncertainty in thedose coefficients for most organs. The absorbed fractionis an important contributor to the uncertainty only for theupper and lower large intestine in the case of ingestion of90Sr. For these organs, the dose to the intestinal wall isdominated by the radiation emitted from the contents,and the estimated energy deposited in the wall is highlyuncertain. The biokinetic parameters with the largestcontribution to the uncertainty are a) the fractionaluptake from blood to thyroid in the case of ingestion of131I, b) the absorbed fraction from the gastrointestinaltract (f1) in the case of 90Sr, and c) the amount ofpotassium in the body for 137Cs. To reduce the uncer-tainty in the dose estimated for an individual, one ideallywould determine the above-mentioned parameters for thespecified individual. In the case of exposure to 131I, theknowledge of the actual thyroid mass for that individualwould also highly reduce the uncertainty in the thyroiddose.
Acknowledgments—This work was funded, in part, by the Centers forDisease Control and Prevention under Grant No. R32/CCR416742-02. Theauthors are grateful to Keith F. Eckerman of the Life Sciences Division,Oak Ridge National Laboratory, Oak Ridge, TN, Gary T. Smith of theDepartment of Radiology and Medicine, University of Tennessee MedicalCenter, Knoxville, TN, and to F. Owen Hoffman of SENES Oak Ridge,Inc., Oak Ridge, TN, for their ideas and comments on different parts of thiswork. The authors thank Kathleen M. Thiessen of SENES Oak Ridge, Inc.,for the technical review and editing of this paper.
REFERENCES
Anderson EC, Langham WH. Average potassium concentra-tion of the human body as a function of age. Science130:713–714; 1959.
Anderson EC. Three-component body composition analysisbased on potassium and water determinations. Ann NYAcad Sci 110:189–122; 1963.
Apostoaei AI, Lewis CJ, Hammonds JH, Hoffman FO. Uncer-tainties in doses from ingestion of Cs-137, Sr-90, Co-60,Ru-106, and I-131. Health Phys 74:S14; 1998.
Apostoaei AI, Burns RE, Hoffman FO, Ijaz T, Lewis CJ, NairSK, Widner TE. Iodine-131 releases from radioactive lan-thanum processing at the X-10 site in Oak Ridge, Tennes-see—An assessment of historical quantities released, off-site radiation doses, and potential excess risks of thyroidcancer. Tennessee Department of Health, Reports of theOak Ridge Dose Reconstruction, Vols 1 and 1A: The Reportof Project Task 1. Nashville, TN: Tennessee Department ofHealth; 1999a.
Apostoaei AI, Blaylock BG, Caldwell B, Flack S, Gouge JH,Hoffman FO, Lewis CJ, Nair SK, Reed EW, Thiessen KM,Thomas BA, Widner TE. Radionuclides released to theClinch River from White Oak Creek on the Oak RidgeReservation—An assessment of historical quantities re-leased, off-site radiation doses, and health risks. TennesseeDepartment of Health, Reports of the Oak Ridge DoseReconstruction, Vols 4 and 4A. The Report of Project Task4. Nashville, TN: Tennessee Department of Health; 1999b.
Apostoaei AI. Determination of the uncertainties in radiationdoses from ingestion of 90Sr. Knoxville, TN: University ofTennessee; 2001. Dissertation.
Apostoaei AI. Absorption of strontium from the gastrointesti-nal tract into plasma in healthy human adults. Health Phys83:56–65; 2002.
Averichev AA, Karevskaya IV, Steputin LA, Korobkova LP,Fokina MM, Kovalev AI, Aksyonov AS, Troyanova NN.Results of the examination of the health status of children inthe southern-western rayons of Bryansk Oblast. Klincy CityChildren’s Hospital. In: A Report on the 1994 ChernobylSasakawa Project Workshop, Moscow, May 16–17, 1994.Tokyo, Japan: Sasakawa Memorial Health Foundation;1994:51–69.
Avramenko AI, Elagin VV, Nikiforova NV, Semoushina SV,Grinko VI, Nedozhdy AV, Kochubey SS. Results of theexamination of children in Kiev Oblast. Kiev RegionalHospital No. 2, Sasakawa-Chernobyl Diagnostic Center. In:A Report on the 1994 Chernobyl Sasakawa Project Work-shop, Moscow, May 16–17, 1994. Tokyo, Japan: SasakawaMemorial Health Foundation; 1994:71–91.
Bauer G, Ray RD. Kinetics of strontium metabolism in man.J Bone Joint Surg 40-A:171–186; 1958.
Bier SG. Thyroid mass in children: A comparison of autopsyand ultrasound data. Knoxville, TN: Nuclear EngineeringDepartment, University of Tennessee, Knoxville; 1996.Thesis.
480 Health Physics May 2004, Volume 86, Number 5

Bishop M, Harrison GE, Raymond WHA, Sutton A, Rundo J.Excretion and retention of radioactive strontium in normalmen following a single intravenous injection. Int J Rad Biol2:125–142; 1960.
Bouville A, Eckerman K, Griffith W, Hoffman FO, Leggett R,Stubbs J. Evaluating the reliability of biokinetic and dosi-metric models and parameters used to assess individualdoses for risk assessment purposes. Radiat Protect Dosim53:211–215; 1994.
Bouville A, Simon SL, Miller CL, Beck HL, Anspaugh LR,Bennett BG. Estimates of doses from global fallout. HealthPhys 82:690–705; 2002.
Buzulukov YP, Dobrynin YL. Release of radionuclides duringthe Chernobyl accident. In: Merwin SE, Balonov MI, eds.The Chernobyl papers: Doses to the Soviet population andearly health effects studies. Richland, WA: Research Enter-prises; 1993: 3–21.
Centers of Disease Control and Prevention. National Healthand Nutrition Examination Survey (NHANES). Availableat: http://www.cdc.gov/nchs/nhanes.htm. Accessed on 27September 2003.
Comar CL, Wasserman RH, Ullberg S, Andrews GA. Stron-tium metabolism and strontium-calcium discrimination inman. Proc Soc Exp Biol Med 95:386–391; 1957.
Cristy M, Eckerman KF. Specific absorbed fractions of energyat various ages from internal photon sources. VII. Adultmale. Oak Ridge, TN: Oak Ridge National Laboratory;ORNL/TM-8381:7; 1987.
Danilyuk VV, Petrova AA, Saiko AS, Danilyuk LV, StotskayaLP, Rudnitskii SS, Sokolovskii IN, Goncharenko OE. Re-sults of the examination of children residing in the northernrayons of Zhitomir Oblast. Korosten Inter-Area MedicalDiagnostic Center. In: A report on the 1994 ChernobylSasakawa Project Workshop, Moscow, May 16–17, 1994.Tokyo, Japan: Sasakawa Memorial Health Foundation;1994:93–114.
Degteva MO, Vorobiova MI, Kozheurov VP, Tol EI. Dosereconstruction system for the exposed population livingalong the Techa River. Health Phys 78:542–554; 2000.
Derzhitskiy VE, Panasyuk GD, Derzhitskaya NK, DemidenkoAN, Kalimullin VA, Anikina IV, Cot VA, Masyakin VB.Results of the examination of the health status of children inGomel Oblast, 1991–1993. Chernobyl Sasakawa Project.Gomel Specialized Medical Dispensary. In: A Report on the1994 Chernobyl Sasakawa Project Workshop, Moscow,May 16–17, 1994. Tokyo, Japan: Sasakawa MemorialHealth Foundation; 1994:25–50.
Dunning DE Jr., Schwartz G. Variability of human thyroidcharacteristics and estimates of dose from ingested I-131.Health Phys 40:661–675; 1981.
Eckerman KF. Dosimetric methodology of the ICRP. In:Raabe, OG, ed. Internal radiation dosimetry. Health PhysicsSociety 1994 Summer School. Madison, WI: Medical Phys-ics Publishing; 1994.
Eckerman KF, Leggett RW, Nelson CB, Puskin JS, RichardsonACB. Cancer risk coefficients for environmental exposureto radionuclides. Washington, DC: U.S. EnvironmentalProtection Agency; Federal Guidance Report No. 13; EPA402-R-99-001; 1999.
Eve IS. A review of the physiology of the gastrointestinal tractin relation to radiation doses from radioactive materials.Health Phys 12:131–161; 1966.
Goossens LHJ, Harrison JD, Kraan BCP, Cooke RM, HarperFT, Hora SC. Probabilistic accident consequence uncer-tainty analysis. Uncertainty assessment for internal dosim-etry, Vol 2, Appendices. In: A report prepared for the U.S.
Nuclear Regulatory Commission and for the Commission ofthe European Communities. Albuquerque, NM: SandiaNational Labs; NUREG/CR-6571; EUR 16773; SAND98-0119; 1998.
Fujita M. Absorption of Sr-90 in man. Health Phys 11:47–60;1965.
Gutenkunst R, Smolarek H, Hasenpusch U, Stubbe P, FriedrichHJ, Wood WG, Scriba PC. Goitre epidemiology: Thyroidvolume, iodine excretion, thyroglobulin and thyrotropin inGermany and Sweden. Acta Endocrinologica 112:494–501;1986.
Guyton AC. Textbook of medical physiology. Philadelphia:W. B. Saunders Company; 1991.
Hamby DM, Benke RR. Uncertainty of the iodine-131 inges-tion dose factor. Radiat Protect Dosim 82:245–256; 1999.
Harvey RP, Hamby DM, Benke RR. Age-specific uncertaintyof the I-131 ingestion dose conversion factor. Health Phys84:334–343; 2003.
Hoffman FO, Apostoaei AI, Thomas BA. A perspective onpublic concerns about exposure to fallout from the produc-tion and testing of nuclear weapons Health Phys 82:736–748; 2002.
International Atomic Energy Agency. Evaluating the reliabilityof predictions made using environmental transfer models.Vienna: IAEA; Safety Series 100; 1989.
International Commission on Radiological Protection. Reportof the Task Group on Reference Man. Oxford: PergamonPress; ICRP Publication 23; 1975.
International Commission on Radiological Protection. Limitsfor intake of radionuclides by workers. Oxford: PergamonPress; ICRP Publication 30; 1979.
International Commission on Radiological Protection. Radio-nuclide transformations: Energy and intensity of emissions.Oxford: Pergamon Press; ICRP Publication 38, Ann ICRP11–13; 1983.
International Commission on Radiological Protection. Age-dependent doses to members of the public from intake ofradionuclides: Part 1. Oxford: Pergamon Press; ICRP Pub-lication 56, Ann ICRP 20(2/3); 1989.
International Commission on Radiological Protection. 1990Recommendations of the International Commission on Ra-diological Protection. Oxford: Pergamon Press; ICRP Pub-lication 60; Ann ICRP 21(1–3); 1991.
International Commission on Radiological Protection. Age-dependent doses to members of the public from intake ofradionuclides: Part 2, Ingestion dose coefficients. Oxford:Pergamon Press; ICRP Publication 67, Ann ICRP 23(3/4);1993.
International Commission on Radiological Protection. Basicanatomical and physiological data for use in radiologicalprotection: The skeleton. Oxford: Pergamon Press; ICRPPublication 70; 1995.
International Commission on Radiological Protection. Data-base of dose coefficients: Workers and members of thepublic. Version 2.0.1. Oxford: Pergamon Press; 2000.
Kay C, Abrahams S, McClain P. The weight of normal thyroidglands in children. Arch Path 82:349–352; 1966.
Kereiakes JG, Seltzer RA, Blackburn B, Saenger EL. Radio-nuclide doses to infants and children: A plea for a standardchild. Health Phys 11:999–1004; 1965.
Killough GG, Eckerman KF. Age- and sex-specific estimationof dose to a normal thyroid from clinical administration of131I. Oak Ridge, TN: Oak Ridge National Laboratory;ORNL/TM-9800, NUREG/CR-3955; 1986.
Kocher DC, Apostoaei AI, Hoffman FO. Radiation effective-ness factors (REFs) for use in calculating probability of
481Dose coefficients from ingestion of 131I, 137Cs, and 90Sr ● A. I. APOSTOAEI AND L. F. MILLER

causation of radiogenic cancers. Oak Ridge, TN: SENESOak Ridge Inc; 2003.
Leggett RW. Predicting the retention of Cs in individuals.Health Phys 50:747–759; 1986.
Leggett RW. A generic age-specific biokinetic model forcalcium like elements. Radiat Protect Dosim 41:183–198;1992.
Likhtarev IA, Dobroskok IA, Ilyin LA, Krasnoschekova GP,Likhtareva TM, Smirnov BI, Sobolev EP, Shamov VP,Shapiro EL. A study of certain characteristics of strontiummetabolism in a homogeneous group of human subjects.Health Phys 28:49–60; 1975.
Likhtarev IA, Gulko GM, Kairo IA, Sobolev BG, ChepurnoyNI, Cheban AK, Nikonov DA, Djachkov IA, Proehl P, RothP. Reliability and accuracy of the 131I thyroid activitymeasurements performed in the Ukraine after the Chernobylaccident in 1986. Neuherberg, Germany: GSF-Institut furStrahlenschutz; 1993.
Mays CW, Lloyd RD, Christensen WR, Atherton DR, Pitch-ford GS. Radium metabolism in man. Radiation Res 19:210;1963.
Mochizuki Y, Mowafy R, Pasternak B. Weights of humanthyroids in New York City. Health Phys 9:1299–1301;1963.
Mokrov Y, Glagolenko Y, Napier B. Reconstruction of radio-nuclide contamination of the Techa river caused by liquidwaste discharge from radiochemical production at theMayak Production Association. Health Phys 79:15–23;2000.
Morgan MG, Henrion M. A guide to dealing with uncertaintyin quantitative risk and policy analysis. New York: Cam-bridge University Press; 1990.
National Cancer Institute. Estimated exposure and thyroiddoses received by the American people from iodine-131fallout following Nevada atmospheric nuclear bomb tests.Washington, DC: U.S. Department of Health and HumanServices. National Institute of Health. National CancerInstitute; 1997.
National Council on Radiation Protection and Measurements.A guide for uncertainty analysis in dose and risk assess-ments related to environmental contamination. Bethesda,MD: NCRP Commentary No. 14; 1996.
National Council on Radiation Protection and Measurements.Evaluating the reliability of biokinetic and dosimetric mod-els and parameters used to assess individual doses for riskassessment purposes. Bethesda, MD: NCRP Commentary15; 1998.
Neer R, Berman M, Fisher, L, Rosenberg LE. Multicompart-mental analysis of calcium kinetics in normal adult males.J Clin Invest 46:1364–1379; 1967.
Newton D, Harrison GE, Rundo J, Kang C, Warner AJ.Metabolism of Ca and Sr in late adult life. Health Phys59:433–442; 1990.
Ng YC, Anspaugh LR, Cederwall RT. ORERP internal doseestimates for individuals. Health Phys 59:693–713; 1990.
Pierce DA, Stram DO, Vaeth M. Allowing for random errors inradiation dose estimates for the atomic bomb survivor data.
Radiation Res 123:275–284; 1990.Schulert AR, Peets EA, Laszio D, Spencer H, Charles M,
Samachson J. Comparative metabolism of strontium andcalcium in man. Int J Appl Radiat Isotop 4:144–153; 1959.
Schwartz G, Dunning DE Jr. Imprecision in estimates of dosefrom ingested Cs-137 due to variability in human biologicalcharacteristics. Health Phys 43:631–643; 1982.
Seligman P. The U.S.–Russian radiation health effects researchprogram in the southern Urals. Health Phys 79:3–8; 2000.
Shagina NB, Tolstykh EI, Degteva MO, Kozheurov VP,Tokareva EE, Anspaugh LR, Napier BA. Update andimprovements in a model for the biokinetics of strontium.U.S.–Russian Joint Coordinating Committee on RadiationEffects Research, Project 1.1. Final Report for milestone 3,Part 2. Urals Research Center for Radiation Medicine,Chelyabinsk, Russian Federation and University of Utah,Salt Lake City, Utah. Chelyabinsk: Urals Research Centerfor Radiation Medicine; 2002.
Shagina NB, Tolstykh EI, Zalyapin VI, Degteva MO, Kozheu-rov VP, Tokareva EE, Anspaugh LR, Napier BA. Evalua-tion of age and gender dependencies of the rate of strontiumelimination 25–45 years after intake: Analysis of data fromresidents living along the Techa River. Rad Research159:239–246; 2003.
Spitzka EA. A note on the true weight of the human lungs.Am J Anatomy iii(V); 1904.
Stabin MG, Watson EE, Cristy M, Ryman JC, Eckerman KF,Davis JL, Marshall D, Gehlen MK. Mathematical modeland specific absorbed fractions in the nonpregnant adultfemale and at the end of each trimester of pregnancy. OakRidge, TN: Oak Ridge National Laboratory; ORNL/TM-12907; 1995.
Talbot RJ, Newton D, Warner AJ, Walters B, Sherlock JC.Human uptake of Cs-137 in mutton. Health Phys 64:600–604; 1993.
Tipton IH, Cook MJ. Weight of the total gastrointestinal tractand its subfractions. Health Physics Division AnnualProgress Report for Period Ending July 31, 1969. ORNL4446:301–302; 1969.
United Nations Scientific Committee on the Effects of AtomicRadiation. Sources and effects of ionizing radiation. NewYork: United Nations. UNSCEAR 2000 Report to theGeneral Assembly, with Scientific Annexes. Vol I: Sources;2000.
Van Middlesworth L. Radioactive iodine uptake of normalnewborn infants. Am J Dis Child 88:9; 1954.
Wasserman RH, Twardock AR, Comar CL. Metabolic disso-ciation of short-lived Ba-137m from its Cs-137 parent. Sci129:568–569; 1959.
Yureiva ND, Rafeenko SM, Sharipov VF, Krupnik TA, Dol-beshkin NK, Kovalev VM. Results of the investigation ofthe health status of children in Mogilev Oblast. In: A Reporton the 1994 Chernobyl Sasakawa Project Workshop. Mos-cow, May 16–17, 1994; Tokyo, Japan: Sasakawa MemorialHealth Foundation; 1994:1–23.
f f
482 Health Physics May 2004, Volume 86, Number 5