UNAUDITED RESULTS FOR THE PERIOD ENDED 30 JUNE 2014 ...
88
Hong Kong Exchanges and Clearing Limited and The Stock Exchange of Hong Kong Limited take no responsibility for the contents of this document, make no representation as to its accuracy or completeness and expressly disclaim any liability whatsoever for any loss howsoever arising from or in reliance upon the whole or any part of the contents of this document. (incorporated in Hong Kong with limited liability) (Stock Code: 13) UNAUDITED RESULTS FOR THE PERIOD ENDED 30 JUNE 2014 HIGHLIGHTS For the six months ended 30 June 2014 For the six months ended 30 June 2013 HK$ millions HK$ millions Change Total Revenue 1 204,485 199,079 +3% EBITDA 1 46,812 44,939 +4% EBIT 1 30,870 29,888 +3% Profit attributable to ordinary shareholders, before property revaluation and profits on disposal of investments and others 13,522 12,010 +13% Property revaluation, after tax - 32 N/A Profits on disposal of investments and others, after tax 2 14,921 356 +4,091% Profit attributable to ordinary shareholders 28,443 12,398 +129% Earnings per share HK$6.67 HK$2.91 +129% Recurring earnings per share 3 HK$3.17 HK$2.82 +13% Interim dividend per share HK$0.66 HK$0.60 +10% Special dividend per share HK$7.00 - N/A Note 1: Total revenue, earnings before interest expenses and other finance costs, tax, depreciation and amortisation (“EBITDA”) and earnings before interest expenses and other finance costs and tax (“EBIT”) include the Group’s proportionate share of associated companies’ and joint ventures’ respective items. Total revenue, EBITDA and EBIT were adjusted to exclude non-controlling interests’ share of results of HPH Trust for the six months ended 30 June 2014 and 2013. See Note 3 of the accounts on the details of the adjustments. Note 2: Profits on disposal of investments and others, after tax for the six months ended 30 June 2014 which comprises the Group’s share of the gain arising from Power Assets Holdings Limited’s separate listing of its Hong Kong electricity business of HK$16,066 million, partly offset by the provisions of HK$652 million on the impairment of goodwill and store closures of the Marionnaud businesses to exit Poland and down-size operations in Portugal and Spain and the Group’s share of operating losses of Vodafone Hutchison Australia (“VHA”) of HK$493 million for the first half of 2014. The 2013 comparative comprises the one-time net gain after tax of HK$958 million, arising from the completion of the Orange Austria transaction, partly offset by the Group’s share of operating losses of VHA for the first half of 2013 of HK$602 million. Note 3: Recurring earnings per share is calculated based on profits attributable to ordinary shareholders before property revaluation after tax and profits on disposal of investments and others after tax. HWL 2014 Interim Results Page 1 of 55
Transcript of UNAUDITED RESULTS FOR THE PERIOD ENDED 30 JUNE 2014 ...

Hong Kong Exchanges and Clearing Limited and The Stock Exchange of Hong Kong Limited take no responsibility for the contents of this document, make no representation as to its accuracy or completeness and expressly disclaim any liability whatsoever for any loss howsoever arising from or in reliance upon the whole or any part of the contents of this document.
(incorporated in Hong Kong with limited liability)
(Stock Code: 13)
UNAUDITED RESULTS FOR THE PERIOD ENDED 30 JUNE 2014 HIGHLIGHTS For the six
months ended 30 June 2014
For the six months ended 30 June 2013
HK$ millions HK$ millions Change
Total Revenue1 204,485 199,079 +3%
EBITDA1 46,812 44,939 +4% EBIT1 30,870 29,888 +3%
Profit attributable to ordinary shareholders, before property revaluation and profits on disposal of investments and others
13,522 12,010 +13%
Property revaluation, after tax - 32 N/AProfits on disposal of investments and others,
after tax2 14,921 356 +4,091%
Profit attributable to ordinary shareholders 28,443 12,398 +129%
Earnings per share HK$6.67 HK$2.91 +129%Recurring earnings per share3 HK$3.17 HK$2.82 +13%Interim dividend per share HK$0.66 HK$0.60 +10%Special dividend per share HK$7.00 - N/A Note 1: Total revenue, earnings before interest expenses and other finance costs, tax, depreciation and amortisation (“EBITDA”) and earnings before
interest expenses and other finance costs and tax (“EBIT”) include the Group’s proportionate share of associated companies’ and joint ventures’ respective items. Total revenue, EBITDA and EBIT were adjusted to exclude non-controlling interests’ share of results of HPH Trust for the six months ended 30 June 2014 and 2013. See Note 3 of the accounts on the details of the adjustments.
Note 2: Profits on disposal of investments and others, after tax for the six months ended 30 June 2014 which comprises the Group’s share of the gain arising from Power Assets Holdings Limited’s separate listing of its Hong Kong electricity business of HK$16,066 million, partly offset by the provisions of HK$652 million on the impairment of goodwill and store closures of the Marionnaud businesses to exit Poland and down-size operations in Portugal and Spain and the Group’s share of operating losses of Vodafone Hutchison Australia (“VHA”) of HK$493 million for the first half of 2014. The 2013 comparative comprises the one-time net gain after tax of HK$958 million, arising from the completion of the Orange Austria transaction, partly offset by the Group’s share of operating losses of VHA for the first half of 2013 of HK$602 million.
Note 3: Recurring earnings per share is calculated based on profits attributable to ordinary shareholders before property revaluation after tax and profits on disposal of investments and others after tax.
HWL 2014 Interim Results Page 1 of 55
Total revenue grew 3% to HK$204,485 million. EBITDA and EBIT, before property revaluation and profits on disposal of investments and
others, grew 4% and 3% respectively. Profit attributable to ordinary shareholders and earnings per share for the first half of 2014
were HK$28,443 million and HK$6.67 respectively, a 129% increase compared to the first half of 2013, of which HK$13,522 million or HK$3.17 per share were recurring, a 13% increase over the same period last year.
A special dividend to the shareholders of HK$7.00 per share, amounting to approximately HK$30 billion was paid in May 2014.
HWL 2014 Interim Results Page 2 of 55

Chairman’s Statement The Group’s operations delivered solid performances in the first half of 2014 and the Group overall demonstrated resilience to certain challenging economic and market conditions through its diversified business and geographical portfolio. Results The Group’s recurring profit attributable to ordinary shareholders for the period ended 30 June 2014, before property revaluation gains and profits on disposal of investments and others, was HK$13,522 million, a 13% increase compared to HK$12,010 million in the first half of 2013. Recurring earnings per share of HK$3.17 increased by 13% from HK$2.82 in the first half of 2013. Profits on disposal of investments and others, after tax in the first half of 2014 of HK$14,921 million comprise the Group’s share of the gain arising from Power Assets Holdings Limited (“Power Assets”)’s separate listing of its Hong Kong electricity business of HK$16,066 million, partly offset by provisions of HK$652 million on the impairment of goodwill and store closures of the Marionnaud businesses to exit Poland and down-size operations in Portugal and Spain and Hutchison Telecommunications (Australia) (“HTAL”)’s 50% share of Vodafone Hutchison Australia (“VHA”)’s operating losses for the first half of 2014 of HK$493 million. This is compared to the first half of 2013 of HK$356 million, which comprises the one-time net gain, after tax of HK$958 million recognised on completion of the Orange Austria acquisition transaction, partly offset by HTAL’s 50% share of VHA’s operating losses for the first half of 2013 of HK$602 million. Profit attributable to ordinary shareholders reported for the period ended 30 June 2014 increased 129% to HK$28,443 million from HK$12,398 million for the first half of 2013. Strategic alliance with Temasek In April 2014, the Group entered into a strategic alliance with Temasek Holdings (Private) Limited (“Temasek”) with Temasek acquiring a 24.95% equity interest in A.S. Watson Holdings Limited for approximately HK$44 billion, resulting in an increase of approximately HK$39 billion in the Group’s shareholders’ funds. The net proceeds from the strategic alliance with Temasek of approximately HK$43 billion were partly used for a special dividend distribution of HK$7.00 per share, amounting to approximately HK$30 billion, which was declared on Wednesday, 16 April 2014 and paid on Wednesday, 14 May 2014. The net impact of this transaction, after the distribution of the special dividend, resulted in an increase of shareholders’ funds of HK$9 billion. Interim Dividend The Board declares the payment of an interim dividend of HK$0.66 per share (30 June 2013 – HK$0.60 per share), an increase of 10%, payable on Wednesday, 10 September 2014 to those persons registered as shareholders of the Company on Friday, 29 August 2014, being the record date for determining shareholders’ entitlement to the interim dividend.
HWL 2014 Interim Results Page 3 of 55

Ports and Related Services1
The ports and related services division’s throughput grew 5% to 39.6 million twenty-foot equivalent units (“TEU”) in the first six months of 2014. Total revenue of HK$17,270 million was 2% higher than the same period last year mainly due to throughput growth in all segments. EBITDA and EBIT increased 4% and 2% to HK$5,607 million and HK$3,531 million respectively, mainly due to strong performances of the Europe segment and the Mainland China and other Hong Kong segment in the first half of the year, partly offset by the lower contribution from the Asia, Australia and others segment. The growth in EBIT was slightly below the growth in EBITDA due to higher depreciation charges of HK$114 million, mainly relating to new facilities in Mexico and Panama and the newly opened ports in Spain and Australia. The division is expected to maintain a steady performance for the remainder of the year with a total of 284 operating berths by the end of 2014, a net increase of 2 berths in the second half of 2014 and a net increase of 6 berths for the year. Growth in this division is expected to accelerate modestly in the coming years as the new berths and ports reach fully operational status which, in ordinary course, is typically around two to three years from launch of commercial operation. Property and Hotels The property and hotels division reported total revenue of HK$7,462 million, a 33% decrease compared to the first half of 2013, primarily due to lower development sales and deferrals in the completion of various development projects in the Mainland and in Singapore to the second half of the year. Several markets in which the Group operates have seen aggressive discounting from developers driven by tight liquidity constraints and high funding costs. The Group has elected not to be a price leader in these markets as it believes better prices for its premium developments can be achieved within a reasonable time frame. EBITDA and EBIT decreased 35% and 36% to HK$3,873 million and HK$3,703 million respectively, mainly due to the lower sales in the first half of this year mentioned above, partly offset by growth in the recurring rental income base. The division’s 11.8 million square foot portfolio of rental properties in Hong Kong, together with its attributable share of 1.6 million square foot portfolio in the Mainland and overseas, reported solid occupancy and steady rental growth during the first six months of the year. Reported rental income, including the share of rental income from the commercial properties of our hotels division, increased 7% from the same period last year to HK$2,208 million mainly due to higher rental renewal rates. The division’s portfolio is of a high quality, is well located and is expected to continue performing well in the second half of 2014. The division’s hotel portfolio comprising 11 hotels of over 8,500 rooms, in which the Group has an average effective interest of approximately 63%, reported a 4% increase in EBIT to HK$519 million mainly due to improvements of the Bahamas operations, partly offset by lower average room and occupancy rates in the hotels in the Mainland as well as certain hotels in Hong Kong. The Group’s current property development activities are principally focused on the Mainland and Singapore. In the first half of 2014, the division completed an attributable share of approximately 2.9 million square feet in gross floor area of residential and commercial properties. In addition, the division also achieved contracted sales of an attributable interest of approximately 1.6 million square feet during the period and recognised sales on an attributable interest of approximately 1.7 million square feet of developed properties, primarily in the Mainland. Current attributable interest in landbank, largely held through joint ventures with Cheung Kong (Holdings) Ltd (“CKH”), can be
Note 1 : Total revenue, EBITDA and EBIT were adjusted to exclude non-controlling interests’ share of results of HPH Trust for the six months
ended 30 June 2014 and 2013.
HWL 2014 Interim Results Page 4 of 55

developed into approximately 80 million square feet of mainly residential property. Depending on the market conditions and outlook, the division targets to complete an attributable share of approximately 5.1 million square feet gross floor area of residential and commercial properties during the second half of 2014 in 11 cities in the Mainland and in Singapore. Retail2 The retail division delivered another period of strong revenue, earnings and cashflow growth in the first half of 2014. Store numbers totalling 10,812 stores in 25 markets represent an increase of 231 stores in the period up to 30 June 2014. Total revenue of HK$77,398 million, EBITDA of HK$6,611 million and EBIT of HK$5,336 million, were all 9% higher than the first half of 2013. The division reported like-for-like sales growth of 2.3% for the first half of 2014. In Asia, the like-for-like sales growth was 1.6% and it was 2.9% in Europe. The health and beauty segment overall reported strong double digit growth for the first half of 2014, with EBITDA and EBIT increasing by 17% and 19% respectively. However, this was partly offset by the negative performance of the retail businesses in Hong Kong. Despite European economies experiencing only modest recoveries during the first half of 2014, the Group’s health and beauty operations in Europe overall were able to deliver strong earnings contribution with EBITDA and EBIT growth of 19% and 23% respectively, through a 7% increase in the portfolio of stores compared to 30 June 2013, comparable store sales growth of 2.9% as mentioned above, effective cost control measures and favourable foreign exchange rate impacts. Health and beauty operations in the Mainland grew total revenue by 14%, mainly driven by high quality new store openings as well as strong comparable store sales growth of 4.3% in the period. EBITDA and EBIT growth remained robust at 20% and 19% respectively in the first half of 2014. Improving consumer sentiment in the majority of the retail markets in which the Group’s health and beauty segment operates and increasing customer loyalty and brand recognition provide a positive momentum for this division in the second half of 2014. Cheung Kong Infrastructure Cheung Kong Infrastructure Holdings Limited (“CKI”), our Hong Kong listed subsidiary, announced profit attributable to shareholders of HK$24,119 million, which includes its share of gain, after consolidation adjustments, arising from Power Assets’ separate listing of its Hong Kong electricity business on the Main Board of the Stock Exchange of Hong Kong Limited in January 2014. Underlying operations continue to deliver strong performances and the newly acquired Enviro Waste Services Limited and AVR-Afvalverwerking B.V. also contributed to the solid results of this division for the first half of 2014. CKI continued to invest in businesses with attractive earnings and cash flow profiles and to diversify its investment portfolio during the period. During the first half of 2014, a CKI-led joint-venture with CKH, announced the acquisition of Park’N Fly, an off-airport parking business in Canada for approximately C$381 million (approximately HK$2,720 million), and a CKI-led consortium with CKH and Power Assets, entered into a Bid Implementation Agreement in respect of a takeover bid for all the shares of Envestra Limited (“Envestra”), 17.46% currently owned by CKI, a distributor of natural gas in Australia which is listed on the Australian Securities Exchange, for a cash consideration of A$1.32 per share. The acquisition of Park’N Fly was completed on
Note 2 : The Marionnaud business has been excluded from the retail division for the six months ended 30 June 2014 and 2013, and included under
“Others” following the Group’s strategic review of the retail division in 2013.
HWL 2014 Interim Results Page 5 of 55

25 July 2014 and the completion of Envestra’s takeover, which is conditional on satisfaction or waiver of the relevant conditions precedent, is expected in the second half of this year. Husky Energy Husky Energy, our associated company listed in Canada, announced profit attributable to shareholders of C$1,290 million, a growth of 13% over the same period last year primarily reflecting higher average commodity prices realised in Western Canada, improved natural gas prices and increased production. Average production in the first six months of 2014 was 329,800 barrels of oil equivalent per day (“BOEs per day”) compared to 315,600 BOEs per day in the first six months of 2013. The first of the three fields to be developed at the Liwan deep-water natural gas development (“Liwan project”) located in the South China Sea achieved first gas at the end of March 2014 and gas sales to the Guangdong market natural gas grid commenced in late April 2014. Production from the Liwan project is being sold on a continuous basis into the Guangdong natural gas market. Natural gas liquids that are separated from the gas sales at the Gaolan gas plant are also being sold into the Guangdong market. The first phase of the Sunrise Energy oil sands development (“Sunrise project”) in Canada is advancing towards start-up by the end of 2014 and is expected to ramp up production over an 18 to 24 month period to produce up to 60,000 barrels per day (30,000 barrels per day net to Husky Energy’s 50% working interest). 3 Group Europe The Group’s registered 3G customer base in Europe increased 1% during the period and totalled over 26.9 million customers as at 30 June 2014, of which approximately 22.6 million were active, a 2% increase during the period. 3 Group Europe reported total revenue of HK$31,063 million, a 3% increase over the same period last year. EBITDA and EBIT grew by 15% and 23% to HK$6,504 million and HK$2,282 million respectively. 3 Group Europe overall continued to achieve positive EBITDA less capex for the period, which reflects continued contribution of this division through improvements in the underlying operating performances and a well-disciplined operating and capital expenditure profile. On 15 July 2014, the Group completed the acquisition of O2 Ireland for €780 million with an additional deferred payment of €70 million payable upon achievement of certain agreed financial targets. 3 Group Europe is expected to further increase its contribution to the Group’s overall results due to the division’s highly competitive network assets and service offerings, stringent cost controls across all operations and the continued realisation of cost synergies from the recently completed acquisitions in Austria and Ireland. Hutchison Telecommunications Hong Kong Hutchison Telecommunications Hong Kong Holdings (“HTHKH”), our Hong Kong listed telecommunications subsidiary operating in Hong Kong and Macau, announced profit attributable to shareholders of HK$323 million and earnings per share of 6.70 HK cents, a decrease of 44% compared to same period last year. As of 30 June 2014, HTHKH had approximately 3.6 million active mobile customers in Hong Kong and Macau.
HWL 2014 Interim Results Page 6 of 55

Hutchison Asia Telecommunications As of 30 June 2014, Hutchison Asia Telecommunications (“HAT”) had approximately 46.5 million active customers, a 7% increase from 31 December 2013. Reported total revenue of HK$3,506 million was an increase of 18% compared to the same period last year, reflecting the increase in customer base in Indonesia as a result of the completion of a major network rollout in the third quarter of 2013 and an increased average spend per user in Vietnam. EBITDA of HK$502 million in the first half of 2014 is a turnaround from an LBITDA of HK$59 million for the same period last year, driven by revenue growth in Indonesia and Vietnam. LBIT of HK$76 million in the first half of 2014 is an 89% reduction against the same period last year. HAT will continue to focus on growing its customer base and customer service revenues in Indonesia. Finance & Investments and Others The contribution from this division mainly represents returns earned on the Group’s holdings of cash and liquid investments as well as results of other small operating units. The increase in contribution in the first six months of 2014 was mainly due to profits from the disposal of certain listed equity investments and other investments. During the first six months of 2014, the Group raised HK$21,401 million from the debt market and HK$43,696 million from the strategic alliance with Temasek, and repaid debts as they matured and partially early repaid certain long-term borrowings and notes of HK$16,931 million. The Group’s weighted average cost of debt remained unchanged at 3.2% for the first half of 2014 compared to the same period last year. At 30 June 2014, the Group’s consolidated cash and liquid investments totalled HK$120,824 million and consolidated debt amounted to HK$229,031 million, resulting in consolidated net debt of HK$108,207 million and net debt to a net total capital ratio of 17.1%. The Group will continue to closely monitor its liquidity and debt profile and expects its consolidated Group net debt to net total capital ratio to remain less than 25% for the foreseeable future.
HWL 2014 Interim Results Page 7 of 55

Outlook In the first half, although weak global economic conditions and government policies and restrictions continue to affect several markets and geographies in which the Group operates, generally improving trends first noted in the second half of 2013 continued into 2014, leading to a constructive outlook for the Group’s businesses overall for the second half of 2014. Whilst economic and political uncertainty will remain a challenge for the remainder of 2014, the Group will adhere to its fundamental principle of always acting in the best long-term interest of its shareholders. The Group will continue pursuing a strategy of “Advancing with Stability”, with the objective to achieving for its shareholders sustainable recurring earnings growth and maintaining a strong financial and liquidity profile. Barring unforeseen material adverse external developments, I expect that the Group will continue to meet these objectives in the second half of 2014. I continue to have confidence in the Group’s prospects. I would like to thank the Board of Directors and all our dedicated employees around the world for their continued loyalty, diligence, professionalism and contributions to the Group. Li Ka-shing Chairman Hong Kong, 31 July 2014
HWL 2014 Interim Results Page 8 of 55

Hutchison Whampoa Limited
2014 Interim Report
9
Operations Highlights
Ports and Related Services (1)
30 June 2014 30June2013 Changein HK$ millions HK$millions Change localcurrency
TotalRevenue 17,270 16,891 +2% +2%
EBITDA 5,607 5,410 +4% +3%
EBIT 3,531 3,449 +2% +2%
Contributed8%,12%and12%respectivelytototalrevenue,EBITDAandEBIToftheGroup.
Throughputgrew5%to39.6milliontwenty-footequivalentunits(“TEU”)duringthefirstsixmonthsof2014ascomparedtothesameperiodlastyear.Majorcontributorstothedivision’soverallthroughputgrowthareasfollows:
Change (millionsTEU) Change
HPHTrust +0.6 +5%
MainlandChinaandotherHongKong +0.6 +11%
Europe +0.3 +5%
Asia,AustraliaandOthers +0.2 +1%
EBITDAwas4%higherthanthesameperiodlastyearmainlyduetothestrongperformancesoftheEuropesegmentandtheMainlandChinaandotherHongKongsegment,partlyoffsetbytheeffectofstart-uplossesoftheAustralianports,lowercontributionsfromMexicoandIndonesia,aswellaslowershareofEBITDAinMalaysiaastheGroup’sshareofresultsdecreasedfrom31.45%to23.55%subsequenttotheIPOofWestportsHoldingsBhd.inOctober2013.
EBITincreasedby2%inthefirsthalfof2014.ThegrowthinEBITwasslightlybelowthegrowthinEBITDAduetohigherdepreciationchargesofHK$114milliononnewfacilitiesinMexicoandPanamaandthenewlyopenedportsatBarcelonainSpainandBrisbaneandSydneyinAustralia.
InMarch2014,HPHTrustdivested60%ofitsequityinterestinAsiaContainerTerminals(“ACTHK”)tothenewlyestablishedjointventurewithCOSCOPacificLimited(40%)andChinaShippingTerminalDevelopment(HongKong)CompanyLimited(20%).HPHTrustcurrentlyownsaneffectiveinterestof40%inACTHK.
Note1: Totalrevenue,EBITDAandEBITwereadjustedtoexcludenon-controllinginterests’shareofresultsofHPHTrustforthesixmonthsended30June2014
and2013.
HWL 2014 Interim Results Page 9 of 55

Hutchison Whampoa Limited
2014 Interim Report
10
Property and Hotels
30 June 2014 30June2013 Changein HK$ millions HK$millions Change localcurrency
TotalRevenue 7,462 11,186 -33% -33%
EBITDA 3,873 5,918 -35% -34%
EBIT 3,703 5,742 -36% -35%
Contributed4%,8%and12%respectivelytototalrevenue,EBITDAandEBIToftheGroup.
EBITDAfrominvestmentpropertiestotalledHK$2,000millioninthefirsthalfof2014,an8%increasemainlyduetothecontinuingtrendofhigherrentalrenewalratesandimprovementsinoccupancylevels.
EBITDAfromhoteloperationsincreasedby1%toHK$639millionascomparedtothefirstsixmonthsof2013,mainlyduetoanimprovementintheresultsfromoperationsintheBahamas,partlyoffsetbyloweraverageroomandoccupancyratesinthehotelsintheMainlandaswellascertainhotelsinHongKong.
EBITDAfromdevelopmentproperties,gainsondisposalandothersdeclined64%toHK$1,234millioninthefirsthalfof2014primarilyduetolowerdevelopmentsales, inparticular inTier1andTier2citieswherepricecompetitionwasmost intense,anddeferrals in thecompletionofvariousdevelopmentprojectsintheMainlandandinSingaporetothesecondhalfoftheyear.
TheGroup’scurrentattributablelandbank(includingdirectinterestsanditsproportionateshareofinterestsheldbyjointventuresandassociatedcompanies)canbedevelopedintoapproximately80millionsquarefeetofmainlyresidentialproperty,ofwhich97%issituatedintheMainlandand3%intheUKandSingapore.Thislandbankcomprises41projectsin22citiesand,dependingonmarketconditionsandoutlook,isexpectedtobedevelopedinphasesoverseveralyears.
InJuly2014,theGroupcompletedthedisposalofitsinterestintheShanghaiOrientalFinancialCenter,onwhichtheGroupgeneratedanafter-taxgainofapproximatelyHK$1,800million.
Retail
30 June 2014 30June2013(2) Changein HK$ millions HK$millions Change localcurrency
TotalRevenue 77,398 71,258 +9% +7%
EBITDA 6,611 6,068 +9% +8%
EBIT 5,336 4,911 +9% +8%
TotalStoreNumbers 10,812 10,004 +8% N/A
Contributed38%,14%and17%respectivelytototalrevenue,EBITDAandEBIToftheGroup.
HWL 2014 Interim Results Page 10 of 55

Hutchison Whampoa Limited
2014 Interim Report
11
30 June 2014 30June2013(2) ChangeinTotal Revenue HK$ millions HK$millions Change localcurrency
Health&BeautyChina 9,840 8,653 +14% +14%
Health&BeautyAsia 10,344 9,785 +6% +9%
Health&BeautyWesternEurope 31,063 27,722 +12% +6%
Health&BeautyEasternEurope 7,121 6,320 +13% +14%
Health & Beauty Subtotal 58,368 52,480 +11% +9%
OtherRetail(3) 19,030 18,778 +1% +1%
Total Retail 77,398 71,258 +9% +7% – Asia 39,214 37,179 +5% +6%
– Europe 38,184 34,079 +12% +7%
Comparable Stores Sales Growth (%) (4) – in local currency 30 June 2014 30June2013(2)
Health&BeautyChina +4.3% +1.4%
Health&BeautyAsia +3.9% +6.0%
Health&BeautyWesternEurope +3.0% +3.5%
Health&BeautyEasternEurope +2.8% +4.1%
Health & Beauty Subtotal +3.3% +3.8%
OtherRetail(3) -0.9% +1.2%
Total Retail +2.3% +3.2% – Asia +1.6% +2.7%
– Europe +2.9% +3.6%
Store Numbers 30 June 2014 30June2013(2) Change
Health&BeautyChina 1,799 1,524 +18%
Health&BeautyAsia 1,838 1,741 +6%
Health&BeautyWesternEurope 4,758 4,601 +3%
Health&BeautyEasternEurope 1,874 1,621 +16%
Health & Beauty Subtotal 10,269 9,487 +8%
OtherRetail(3) 543 517 +5%
Total Retail 10,812 10,004 +8% – Asia 4,180 3,782 +11%
– Europe 6,632 6,222 +7%
HWL 2014 Interim Results Page 11 of 55

Hutchison Whampoa Limited
2014 Interim Report
12
Retail (continued)
30 June 2014 30June2013(2) ChangeinEBITDA HK$ millions HK$millions Change localcurrency
Health&BeautyChina 1,974 1,651 +20% +20%
Health&BeautyAsia 870 824 +6% +10%
Health&BeautyWesternEurope 2,045 1,701 +20% +14%
Health&BeautyEasternEurope 908 780 +16% +14%
Health & Beauty Subtotal 5,797 4,956 +17% +15%
OtherRetail(3) 814 1,112 -27% -27%
Total Retail 6,611 6,068 +9% +8% – Asia 3,659 3,588 +2% +3%
– Europe 2,952 2,480 +19% +14%
EBITDA Margin % 30 June 2014 30June2013(2)
Health&BeautyChina 20% 19%
Health&BeautyAsia 8% 8%
Health&BeautyWesternEurope 7% 6%
Health&BeautyEasternEurope 13% 12%
Health & Beauty Subtotal 10% 9%
OtherRetail(3) 4% 6%
Total Retail 9% 9% – Asia 9% 10%
– Europe 8% 7%
Note2: Firsthalfof2013resultsexcludeMarionnaudresults inthecomparativesasthebusiness isno longerreportedunderthisdivisionfollowingtheGroup’s
strategicreviewofitsretaildivisionin2013.
Note3: OtherRetailincludesPARKnSHOP,Fortress,WatsonsWine,Nuance-Watsonandmanufacturingoperationsforwaterandbeveragebusinesses.
Note4: Comparablestoresalesgrowthrepresentsthepercentagechangeinrevenuecontributedbystoreswhich,asatthefirstdayoftherelevantfinancialyear(a)
havebeenoperatingforover12monthsand(b)havenotundergonemajorresizingwithintheprevious12months.
HWL 2014 Interim Results Page 12 of 55

Hutchison Whampoa Limited
2014 Interim Report
13
Cheung Kong Infrastructure (5), subsidiary listed on The Stock Exchange of Hong Kong Limited
30 June 2014 30June2013 HK$ millions HK$millions Change
TotalRevenue 22,264 20,133 +11%
EBITDA 11,819 11,469 +3%
EBIT 8,945 8,940 —
Contributed11%,25%and29%respectivelytototalrevenue,EBITDAandEBIToftheGroup.
ReportedEBIT,aftertheGroup’sassetvaluationconsolidationadjustments,ofHK$8,945millionwasflatascomparedtothesameperiodlastyearduetoearningsgrowthfromitsUKoperationsandfullsix-monthcontributionsofthenewlyacquiredoperations(EnviroWasteServicesLimitedandAVR-AfvalverwerkingB.V.),beinglargelyoffsetbythelowercontributionfromtheHongKongelectricitybusinessfollowingitsseparatelistinginJanuary2014.
Note5: AftertheGroup’sassetvaluationconsolidationadjustments.
Husky Energy (6), associated company listed on Toronto Stock Exchange
30 June 2014 30June2013 Changein HK$ millions HK$millions Change localcurrency
TotalRevenue 28,660 29,911 -4% +3%
EBITDA 8,145 7,991 +2% +9%
EBIT 4,329 4,152 +4% +12%
TheGroup’sshareofHuskyEnergy’sresultscontributed14%,18%and14%respectivelytototalrevenue,EBITDAandEBIToftheGroup.
Note6: AftertheGroup’sassetvaluationconsolidationadjustments.
HWL 2014 Interim Results Page 13 of 55

Hutchison Whampoa Limited
2014 Interim Report
14
3 Group Europe
30 June 2014 30June2013 Changein HK$ millions HK$millions Change localcurrency
Total Revenue 31,063 30,101 +3% -3% –Netcustomerservicerevenue 23,950 22,037 +9% +3%
–Handsetrevenue 6,490 7,417 -12%
–Otherrevenue 623 647 -4%
Netcustomerservicemargin(7) 18,844 16,831 +12% +6% Net customer service margin % 79% 76%
Othermargin 368 507 -27% TotalCACs (10,036) (10,624) +6%
Less:Handsetrevenue 6,490 7,417 -12%
TotalCACs(netofhandsetrevenue) (3,546) (3,207) -11%
Operatingexpenses (9,162) (8,470) -8% Opex as a % of Net customer service margin 49% 50%
EBITDA 6,504 5,661 +15% +9% EBITDA margin % (8) 26% 25%
Depreciation&Amortisation (4,222) (3,807) -11%
EBIT 2,282 1,854 +23% +16%
Capex(excludinglicence) (4,876) (4,167) -17%
EBITDAlessCapex 1,628 1,494 +9%
Licence(9) (4) (2,674) N/A
Contributed15%,14%and7%respectivelytototalrevenue,EBITDAandEBIToftheGroup.
Note7: Netcustomerservicemarginrepresentsnetcustomerservicerevenuedeductingdirectvariablecosts(includinginterconnectionchargesandroamingcosts).
Note8: EBITDAmargin%representsEBITDAasa%oftotalrevenueexcludinghandsetrevenue.
Note9: Licencecostsat30June2014representincidentalcostsinrelationtolicencesacquiredintheprioryear.
3 Group Europe Overall
30 June 2014 30June2013
Contractcustomersasapercentageofthetotalregisteredcustomerbase 59% 59%
Contractcustomers’contributiontothenetcustomerservicerevenuebase(%) 89% 87%
Averagemonthlychurnrateofthetotalcontractregisteredcustomerbase(%) 1.6% 1.7%
Activecontractcustomersasapercentageofthetotalcontractregisteredcustomerbase 98% 97%
Activecustomersasapercentageofthetotalregisteredcustomerbase 84% 82%
6monthsdatausageperactivecustomers(Gigabyte) 12.2 8.8
HWL 2014 Interim Results Page 14 of 55
Hutchison Whampoa Limited
2014 Interim Report
15
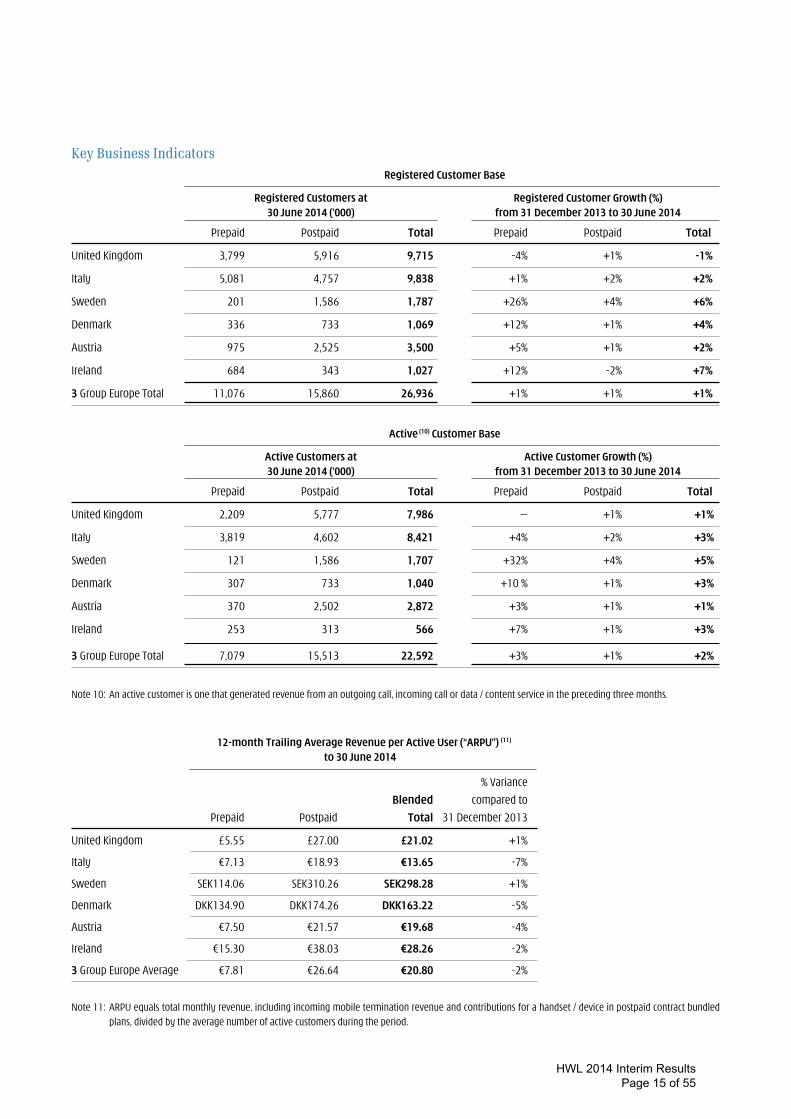
Key Business Indicators
Registered Customer Base
Registered Customers at Registered Customer Growth (%) 30 June 2014 (’000) from 31 December 2013 to 30 June 2014
Prepaid Postpaid Total Prepaid Postpaid Total
UnitedKingdom 3,799 5,916 9,715 -4% +1% -1%
Italy 5,081 4,757 9,838 +1% +2% +2%
Sweden 201 1,586 1,787 +26% +4% +6%
Denmark 336 733 1,069 +12% +1% +4%
Austria 975 2,525 3,500 +5% +1% +2%
Ireland 684 343 1,027 +12% -2% +7%
3GroupEuropeTotal 11,076 15,860 26,936 +1% +1% +1%
Active (10) Customer Base
Active Customers at Active Customer Growth (%) 30 June 2014 (’000) from 31 December 2013 to 30 June 2014
Prepaid Postpaid Total Prepaid Postpaid Total
UnitedKingdom 2,209 5,777 7,986 — +1% +1%
Italy 3,819 4,602 8,421 +4% +2% +3%
Sweden 121 1,586 1,707 +32% +4% +5%
Denmark 307 733 1,040 +10% +1% +3%
Austria 370 2,502 2,872 +3% +1% +1%
Ireland 253 313 566 +7% +1% +3%
3GroupEuropeTotal 7,079 15,513 22,592 +3% +1% +2%
Note10: Anactivecustomerisonethatgeneratedrevenuefromanoutgoingcall,incomingcallordata/contentserviceintheprecedingthreemonths.
12-month Trailing Average Revenue per Active User (“ARPU”) (11)
to 30 June 2014
%Variance
Blended comparedto
Prepaid Postpaid Total 31December2013
UnitedKingdom £5.55 £27.00 £21.02 +1%
Italy €7.13 €18.93 €13.65 -7%
Sweden SEK114.06 SEK310.26 SEK298.28 +1%
Denmark DKK134.90 DKK174.26 DKK163.22 -5%
Austria €7.50 €21.57 €19.68 -4%
Ireland €15.30 €38.03 €28.26 -2%
3GroupEuropeAverage €7.81 €26.64 €20.80 -2%
Note11: ARPUequalstotalmonthlyrevenue,includingincomingmobileterminationrevenueandcontributionsforahandset/deviceinpostpaidcontractbundled
plans,dividedbytheaveragenumberofactivecustomersduringtheperiod.
HWL 2014 Interim Results Page 15 of 55

Hutchison Whampoa Limited
2014 Interim Report
16
Key Business Indicators (continued)
12-month Trailing Net Average Revenue per Active User (“Net ARPU”) (12)
to 30 June 2014
%Variance
Blended comparedto
Prepaid Postpaid Total 31December2013
UnitedKingdom £5.55 £18.96 £15.22 +1%
Italy €7.13 €18.93 €13.65 -7%
Sweden SEK114.06 SEK224.51 SEK217.76 +3%
Denmark DKK134.90 DKK161.90 DKK154.33 -4%
Austria €7.50 €17.84 €16.45 -6%
Ireland €15.30 €30.48 €23.96 -1%
3GroupEuropeAverage €7.81 €21.21 €17.06 -2%
12-month Trailing Net Average Margin per Active User (“Net AMPU”) (13) to 30 June 2014
%Variance
Blended comparedto
Prepaid Postpaid Total 31December2013
UnitedKingdom £4.79 £14.85 £12.04 —
Italy €5.48 €14.32 €10.37 -5%
Sweden SEK81.78 SEK191.98 SEK185.25 +6%
Denmark DKK116.44 DKK140.81 DKK133.97 -3%
Austria €6.45 €14.26 €13.21 -2%
Ireland €11.02 €24.80 €18.88 —
3GroupEuropeAverage €6.28 €16.79 €13.53 -1%
Note12: NetARPUequalstotalmonthlyrevenue,includingincomingmobileterminationrevenuebutexcludingcontributionsforahandset/deviceinpostpaidcontract
bundledplans,dividedbytheaveragenumberofactivecustomersduringtheperiod.
Note13: NetAMPUequals totalmonthly revenue, including incomingmobile termination revenuebutexcludingcontributions forahandset /device inpostpaid
contractbundledplans, lessdirectvariablecosts(includinginterconnectionchargesandroamingcosts)(i.e.netcustomerservicemargin),dividedbythe
averagenumberofactivecustomersduringtheperiod.
3 GroupEurope’snetARPUandnetAMPU,whichexcludethemonthlycontributionsforahandset/deviceinpostpaidcontractbundledplans,ona12-monthtrailingaverageactivecustomerbasis,decreased2%and1%to€17.06and€13.53respectivelycomparedtothefullyear2013.Despitethesedecreasesnetcustomerservicerevenueandnetcustomerservicemarginincreasedby3%and6%respectivelyinlocalcurrencymainlyduetotheenlargedactivecustomerbasecomparedtothesameperiodlastyear.
HWL 2014 Interim Results Page 16 of 55

Hutchison Whampoa Limited
2014 Interim Report
17
United Kingdom
30 June 2014 30June2013 GBP millions GBPmillions Change
Total Revenue 974 1,002 -3% –Netcustomerservicerevenue 723 667 +8%
–Handsetrevenue 241 321 -25%
–Otherrevenue 10 14 -29%
Netcustomerservicemargin 556 519 +7% Net customer service margin % 77% 78%
Othermargin 4 11 -64% TotalCACs (358) (457) +22%
Less:Handsetrevenue 241 321 -25%
TotalCACs(netofhandsetrevenue) (117) (136) +14%
Operatingexpenses (211) (206) -2% Opex as a % of Net customer service margin 38% 40%
EBITDA 232 188 +23% EBITDA margin % 32% 28%
Depreciation&Amortisation (109) (102) -7%
EBIT 123 86 +43%
Capex(excludinglicence) (116) (87) -33%
EBITDAlessCapex 116 101 +15%
Licence (0.3) (225) N/A
30 June 2014 30June2013
Totalregisteredcustomerbase(millions) 9.7 9.2
Totalactivecustomerbase(millions) 8.0 7.5
Contractcustomersasapercentageofthetotalregisteredcustomerbase 61% 60%
Contractcustomers’contributiontothenetcustomerservicerevenuebase(%) 90% 88%
Averagemonthlychurnrateofthetotalcontractregisteredcustomerbase(%) 1.6% 1.6%
Activecontractcustomersasapercentageofthetotalcontractregisteredcustomerbase 98% 97%
Activecustomersasapercentageofthetotalregisteredcustomerbase 82% 82%
3UKexperiencedanotherperiodofstrongunderlyingresults,reportingEBITDAandEBITgrowthof23%and43%to£232millionand£123millionrespectively.ThisreflectsthegrowthinnetcustomerservicemarginandlowertotalCACsaswellascontinuingstringentcostcontrols.
HWL 2014 Interim Results Page 17 of 55

Hutchison Whampoa Limited
2014 Interim Report
18
Italy
30 June 2014 30June2013 EUR millions EURmillions Change
Total Revenue 815 891 -9% –Netcustomerservicerevenue 662 684 -3%
–Handsetrevenue 139 185 -25%
–Otherrevenue 14 22 -36%
Netcustomerservicemargin 502 496 +1% Net customer service margin % 76% 73%
Othermargin 13 22 -41% TotalCACs (259) (270) +4%
Less:Handsetrevenue 139 185 -25%
TotalCACs(netofhandsetrevenue) (120) (85) -41%
Operatingexpenses (323) (299) -8% Opex as a % of Net customer service margin 64% 60%
EBITDA 72 134 -46% EBITDA margin % 11% 19%
Depreciation&Amortisation (143) (139) -3%
LBIT (71) (5) -1,320%
Capex(excludinglicence) (151) (187) +19%
EBITDAlessCapex (79) (53) -49%
30 June 2014 30June2013
Totalregisteredcustomerbase(millions) 9.8 9.5
Totalactivecustomerbase(millions) 8.4 7.7
Contractcustomersasapercentageofthetotalregisteredcustomerbase 48% 48%
Contractcustomers’contributiontothenetcustomerservicerevenuebase(%) 75% 82%
Averagemonthlychurnrateofthetotalcontractregisteredcustomerbase(%) 2.2% 2.4%
Activecontractcustomersasapercentageofthetotalcontractregisteredcustomerbase 97% 94%
Activecustomersasapercentageofthetotalregisteredcustomerbase 86% 80%
TheincreasinglycompetitiveenvironmentintheItalianmarketcontinuedtoaddpressureto3Italy’srevenuegrowthandresultedinhighertotalCACstoacquireorretainqualitycustomers.Togetherwiththeincreasedoperatingcoststosupportanenlargednetwork,3Italyreporteda46%lowerEBITDAto€72millionandaLBITof€71millionforthefirsthalfof2014.Theoperationisexpectedtoimproveitsperformanceinthesecondhalfof2014throughenhancingitscustomerandtariffmix.
HWL 2014 Interim Results Page 18 of 55

Hutchison Whampoa Limited
2014 Interim Report
19
Sweden
30 June 2014 30June2013 SEK millions SEKmillions Change
Total Revenue 3,054 2,699 +13% –Netcustomerservicerevenue 2,123 1,833 +16%
–Handsetrevenue 827 760 +9%
–Otherrevenue 104 106 -2%
Netcustomerservicemargin 1,811 1,455 +24% Net customer service margin % 85% 79%
Othermargin 26 55 -53% TotalCACs (1,127) (1,012) -11%
Less:Handsetrevenue 827 760 +9%
TotalCACs(netofhandsetrevenue) (300) (252) -19%
Operatingexpenses (666) (641) -4% Opex as a % of Net customer service margin 37% 44%
EBITDA 871 617 +41% EBITDA margin % 39% 32%
Depreciation&Amortisation (380) (346) -10%
EBIT 491 271 +81%
Capex(excludinglicence) (392) (461) +15%
EBITDAlessCapex 479 156 +207%
30 June 2014 30June2013
Totalregisteredcustomerbase(millions) 1.8 1.6
Totalactivecustomerbase(millions) 1.7 1.6
Contractcustomersasapercentageofthetotalregisteredcustomerbase 89% 90%
Contractcustomers’contributiontothenetcustomerservicerevenuebase(%) 96% 97%
Averagemonthlychurnrateofthetotalcontractregisteredcustomerbase(%) 1.4% 1.2%
Activecontractcustomersasapercentageofthetotalcontractregisteredcustomerbase 100% 100%
Activecustomersasapercentageofthetotalregisteredcustomerbase 95% 95%
3Swedenreportedanincreaseinnetcustomerservicerevenueandmarginmainlyduetotheenlargedactivecustomerbaseandthecompletionofthetransitiontoanon-subsidisedhandsetmodelinitscustomerbaseattheendof2013.ThismarginimprovementispartlyoffsetbyhighertotalCACsandoperatingexpenses,resultingintheoperationreportinga41%improvementinEBITDAtoSEK871millionandanEBITimprovementof81%toSEK491millionforthefirsthalfof2014.
HWL 2014 Interim Results Page 19 of 55

Hutchison Whampoa Limited
2014 Interim Report
20
Denmark
30 June 2014 30June2013 DKK millions DKKmillions Change
Total Revenue 1,008 930 +8% –Netcustomerservicerevenue 887 827 +7%
–Handsetrevenue 92 62 +48%
–Otherrevenue 29 41 -29%
Netcustomerservicemargin 772 708 +9% Net customer service margin % 87% 86%
Othermargin 13 27 -52% TotalCACs (216) (172) -26%
Less:Handsetrevenue 92 62 +48%
TotalCACs(netofhandsetrevenue) (124) (110) -13%
Operatingexpenses (315) (309) -2% Opex as a % of Net customer service margin 41% 44%
EBITDA 346 316 +9% EBITDA margin % 38% 36%
Depreciation&Amortisation (146) (138) -6%
EBIT 200 178 +12%
Capex(excludinglicence) (69) (91) +24%
EBITDAlessCapex 277 225 +23%
30 June 2014 30June2013
Totalregisteredcustomerbase(millions) 1.1 0.9
Totalactivecustomerbase(millions) 1.0 0.9
Contractcustomersasapercentageofthetotalregisteredcustomerbase 69% 72%
Contractcustomers’contributiontothenetcustomerservicerevenuebase(%) 77% 81%
Averagemonthlychurnrateofthetotalcontractregisteredcustomerbase(%) 2.7% 2.5%
Activecontractcustomersasapercentageofthetotalcontractregisteredcustomerbase 100% 100%
Activecustomersasapercentageofthetotalregisteredcustomerbase 97% 98%
DespiteintensepricecompetitiondrivingdownnetARPU,3Denmarkreportedanincreaseinnetcustomerservicerevenueandmargin,primarilyduetotheenlargedcustomerbase.EBITDAofDKK346millionandEBITofDKK200millionrepresentedanimprovementof9%and12%respectivelyagainstthesameperiodlastyear,reflectingnetcustomerservicemargincontributionandgoodcostcontrolunderchallengingconditions.
HWL 2014 Interim Results Page 20 of 55

Hutchison Whampoa Limited
2014 Interim Report
21
Austria
30 June 2014 30June2013 EUR millions EURmillions Change
Total Revenue 342 369 -7% –Netcustomerservicerevenue 271 306 -11%
–Handsetrevenue 58 57 +2%
–Otherrevenue 13 6 +117%
Netcustomerservicemargin 222 230 -3% Net customer service margin % 82% 76%
Othermargin 10 6 +67% TotalCACs (70) (75) +7%
Less:Handsetrevenue 58 57 +2%
TotalCACs(netofhandsetrevenue) (12) (18) +33%
Operatingexpenses (104) (128) +19% Opex as a % of Net customer service margin 47% 56%
EBITDA 116 90 +29% EBITDA margin % 41% 29%
Depreciation&Amortisation (37) (38) +3%
EBIT 79 52 +52%
Capex(excludinglicence) (53) (35) -51%
EBITDAlessCapex 63 55 +15%
30 June 2014 30June2013
Totalregisteredcustomerbase(millions) 3.5 3.3
Totalactivecustomerbase(millions) 2.9 2.8
Contractcustomersasapercentageofthetotalregisteredcustomerbase 72% 74%
Contractcustomers’contributiontothenetcustomerservicerevenuebase(%) 93% 94%
Averagemonthlychurnrateofthetotalcontractregisteredcustomerbase(%) 0.6% 0.8%
Activecontractcustomersasapercentageofthetotalcontractregisteredcustomerbase 99% 99%
Activecustomersasapercentageofthetotalregisteredcustomerbase 82% 85%
3AustriacontinuedtobenefitfromtherealisationofadditionalcostsynergiesfollowingtheacquisitionofOrangeAustriain2013,whichcontributedtotheEBITDAandEBITgrowthof29%and52%to€116millionand€79millionrespectivelyforthefirsthalfof2014.
HWL 2014 Interim Results Page 21 of 55

Hutchison Whampoa Limited
2014 Interim Report
22
Ireland
30 June 2014 30June2013 EUR millions EURmillions Change
Total Revenue 97 87 +11% –Netcustomerservicerevenue 80 72 +11%
–Handsetrevenue 13 14 -7%
–Otherrevenue 4 1 +300%
Netcustomerservicemargin 63 56 +13% Net customer service margin % 79% 78%
Othermargin 2 — N/A TotalCACs (22) (23) +4%
Less:Handsetrevenue 13 14 -7%
TotalCACs(netofhandsetrevenue) (9) (9) —
Operatingexpenses (59) (47) -26% Opex as a % of Net customer service margin 94% 84%
LBITDA (3) — N/A LBITDA margin % -4% —
Depreciation&Amortisation (22) (18) -22%
LBIT (25) (18) -39%
Capex(excludinglicence) (60) (21) -186%
LBITDAlessCapex (63) (21) -200%
30 June 2014 30June2013
Totalregisteredcustomerbase 1,027,000 901,000
Totalactivecustomerbase 566,000 508,000
Contractcustomersasapercentageofthetotalregisteredcustomerbase 33% 42%
Contractcustomers’contributiontothenetcustomerservicerevenuebase(%) 72% 76%
Averagemonthlychurnrateofthetotalcontractregisteredcustomerbase(%) 1.3% 1.2%
Activecontractcustomersasapercentageofthetotalcontractregisteredcustomerbase 91% 81%
Activecustomersasapercentageofthetotalregisteredcustomerbase 55% 56%
Asa resultofan improvedactivecustomerbase,3 Ireland reportedan increase innetcustomerservice revenueandmarginduring theperiod.However,thisimprovementhasbeenfullyoffsetbyanincreaseinoperatingcostsandhigherdepreciationcharge.TheoperationreportedaLBITDAandLBITof€3millionand€25millionrespectivelyforthefirsthalfof2014.
On15July2014,theGroupcompletedtheacquisitionofO2IrelandfromTelefonica.Therestructuringexercisetocombine3IrelandandO2Irelandoperationswillbeginandthecombinedoperationisexpectedtoprovideameaningfulcontributionto3GroupEuropein2015.
HWL 2014 Interim Results Page 22 of 55

Hutchison Whampoa Limited
2014 Interim Report
23
Hutchison Telecommunications Hong Kong Holdings (14), subsidiary listed on The Stock Exchange of Hong Kong Limited
30 June 2014 30June2013 HK$ millions HK$millions Change
TotalRevenue 6,227 6,149 +1%
EBITDA 1,230 1,509 -18%
EBIT 538 834 -35%
Contributed3%,3%and2%respectivelytoeachoftotalrevenue,EBITDAandEBIToftheGroup.
Note14: AftertheGroup’sconsolidationandreclassificationadjustments.
Hutchison Asia Telecommunications
30 June 2014 30June2013 HK$ millions HK$millions Change
TotalRevenue 3,506 2,981 +18%
EBITDA(LBITDA) 502 (59) +951%
LBIT (76) (697) +89%
Contributed2%and1%respectivelytototalrevenueandEBITDAoftheGroupandanegative0.2%toEBIToftheGroup.
HATwillcontinuetogrowitscustomerbase,particularlyinIndonesia,whereamajornetworkrolloutwascompletedinthethirdquarterof2013andthe3Gfootprintisnowextendedto150citiescovering86%ofthepopulation.TheoperationhasachievedpositiveEBITDAoperationallyinboththesecondhalfof2013andthefirsthalfof2014.
HTAL (50% share of joint venture Vodafone Hutchison Australia), subsidiary listed on Australian Securities Exchange
30 June 2014 30June2013 AUD millions AUDmillions Change
AnnouncedTotalRevenue 863 872 -1%
AnnouncedEBIT(LBIT) 6 (34) +118%
AnnouncedLossAttributabletoShareholders (79) (96) +17%
VHAcontinued themomentumof its turnaround plan in thefirsthalfof theyearwith further improvements inbothoperationalandfinancialperformances.Duringtheperiod,VHAalsocontinuedtoinvestinthenetwork,addingonaveragemorethan100new4Gsiteseachmonthandthisisexpectedtoincreaseto300newsitesamonthlaterin2014.Furtherprogressisanticipatedinthesecondhalfoftheyear,withadditionalfinancialimprovementsexpected.
HWL 2014 Interim Results Page 23 of 55

Hutchison Whampoa Limited
Condensed Consolidated Income Statementfor the six months ended 30 June 2014
As restatedNote 2
2014 2013Note HK$ millions HK$ millions
Revenue 3 130,734 123,262 Cost of inventories sold (52,368) (48,655) Staff costs (17,360) (16,524) Telecommunications customer acquisition costs (11,118) (11,751) Depreciation and amortisation 3 (8,348) (7,699) Other operating expenses (27,198) (26,166) Change in fair value of investment properties - 7 Profits on disposal of investments and others 4 (1,213) (116) Share of profits less losses after tax of:
Associated companies before profits on disposal of investmentsand others 5,036 5,225
Joint ventures 5,039 5,509 Associated companies’ profits on disposal of investments and
others 4 20,554 -
3 43,758 23,092
Interest expenses and other finance costs 5 (3,904) (4,335) Profit before tax 39,854 18,757 Current tax 6 (1,638) (1,925) Deferred tax 6 (996) (896)
Profit after tax 37,220 15,936
Allocated as : Profit attributable to non-controlling interests and holders ofperpetual capital securities (8,777) (3,538)
Profit attributable to ordinary shareholders of the Company 28,443 12,398
Earnings per share for profit attributable to ordinary shareholders of the Company 7 HK$ 6.67 HK$ 2.91
Details of distribution paid to the holders of perpetual capital securities, special dividend paid and interim dividend payable to the ordinary shareholders of the Company are set out in note 8.
Unaudited
HWL 2014 Interim Results Page 24 of 55

Hutchison Whampoa Limited
Condensed Consolidated Statement of Comprehensive Incomefor the six months ended 30 June 2014
As restatedNote 2
2014 2013HK$ millions HK$ millions
Profit after tax 37,220 15,936
Other comprehensive income (losses)
Items that will not be reclassified to profit or loss:Remeasurement of defined benefit obligations recognised directly in
reserves (124) 116 Share of other comprehensive income (losses) of associated companies (131) 60 Share of other comprehensive income (losses) of joint ventures (18) (180) Tax relating to items that will not be reclassified to profit or loss 29 2
(244) (2)
Items that have been reclassified or may be subsequently reclassified to profit or loss:
Available-for-sale investmentsValuation gains recognised directly in reserves 653 127 Valuation gains previously in reserves recognised in income
statement (165) (57) Gains (losses) on cash flow hedges arising from forward foreign
currency contracts and interest rate swap contracts recognised directly in reserves (183) 157
Gains (losses) on translating overseas subsidiaries’ net assets recognised directly in reserves 3,028 (7,802)
Share of other comprehensive income (losses) of associated companies (245) (3,413) Share of other comprehensive income (losses) of joint ventures 514 (1,747) Tax relating to items that have been reclassified or may be subsequently
reclassified to profit or loss (74) (18)
3,528 (12,753)
Other comprehensive income (losses) after tax 3,284 (12,755)
Total comprehensive income 40,504 3,181
Allocated as : Attributable to non-controlling interests and holders ofperpetual capital securities (9,140) (2,827)
Attributable to ordinary shareholders of the Company 31,364 354
Unaudited
HWL 2014 Interim Results Page 25 of 55
Hutchison Whampoa Limited
Condensed Consolidated Statement of Financial Positionat 30 June 2014
Unaudited Audited30 June 31 December
2014 2013Note HK$ millions HK$ millions
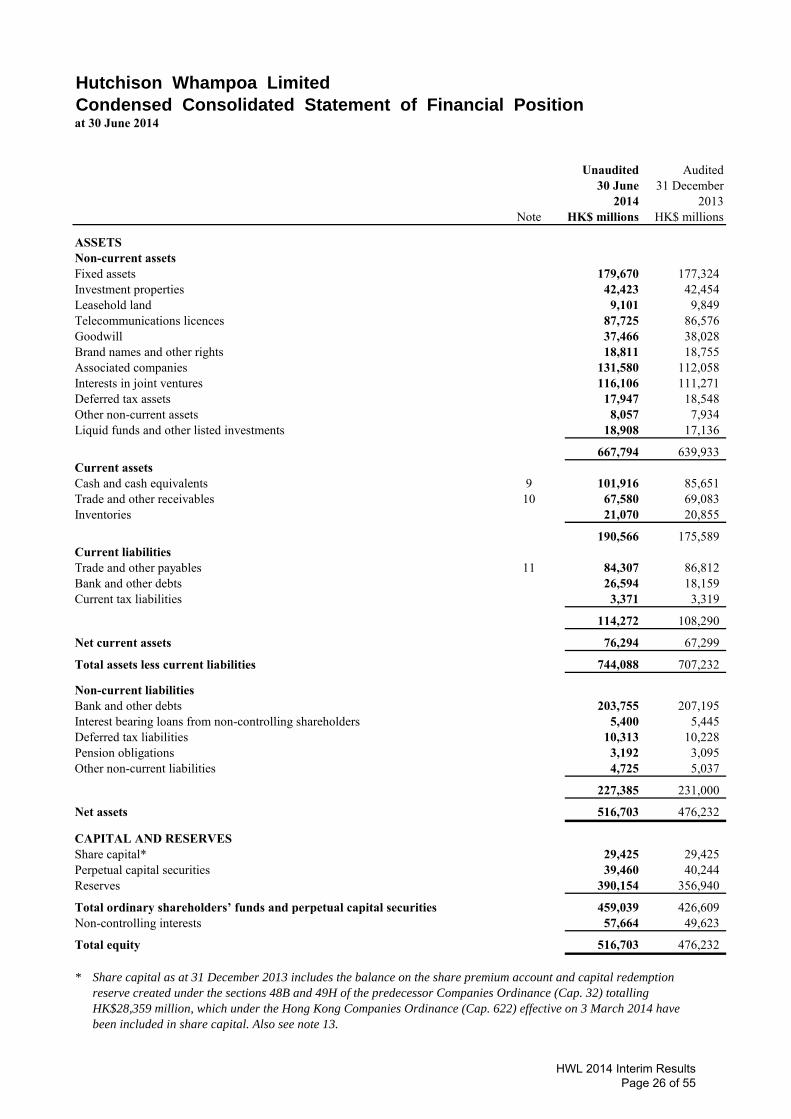
ASSETSNon-current assetsFixed assets 179,670 177,324 Investment properties 42,423 42,454 Leasehold land 9,101 9,849 Telecommunications licences 87,725 86,576 Goodwill 37,466 38,028 Brand names and other rights 18,811 18,755 Associated companies 131,580 112,058 Interests in joint ventures 116,106 111,271 Deferred tax assets 17,947 18,548 Other non-current assets 8,057 7,934 Liquid funds and other listed investments 18,908 17,136
667,794 639,933 Current assetsCash and cash equivalents 9 101,916 85,651 Trade and other receivables 10 67,580 69,083 Inventories 21,070 20,855
190,566 175,589 Current liabilities Trade and other payables 11 84,307 86,812 Bank and other debts 26,594 18,159 Current tax liabilities 3,371 3,319
114,272 108,290
Net current assets 76,294 67,299
Total assets less current liabilities 744,088 707,232
Non-current liabilitiesBank and other debts 203,755 207,195 Interest bearing loans from non-controlling shareholders 5,400 5,445 Deferred tax liabilities 10,313 10,228 Pension obligations 3,192 3,095 Other non-current liabilities 4,725 5,037
227,385 231,000
Net assets 516,703 476,232
CAPITAL AND RESERVESShare capital* 29,425 29,425 Perpetual capital securities 39,460 40,244 Reserves 390,154 356,940
Total ordinary shareholders’ funds and perpetual capital securities 459,039 426,609 Non-controlling interests 57,664 49,623
Total equity 516,703 476,232
* Share capital as at 31 December 2013 includes the balance on the share premium account and capital redemption
reserve created under the sections 48B and 49H of the predecessor Companies Ordinance (Cap. 32) totalling
HK$28,359 million, which under the Hong Kong Companies Ordinance (Cap. 622) effective on 3 March 2014 have
been included in share capital. Also see note 13.
HWL 2014 Interim Results Page 26 of 55

Hutchison Whampoa Limited
Condensed Consolidated Statement of Changes in Equityfor the six months ended 30 June 2014
Total ordinaryshareholders’
Holders of funds andperpetual perpetual Non- Unaudited
Other Retained capital capital controlling TotalShare capital (a) reserves (b) profit Sub-total securities securities interests equity
HK$ millions HK$ millions HK$ millions HK$ millions HK$ millions HK$ millions HK$ millions HK$ millions
At 1 January 2014 * 29,425 13,760 343,180 386,365 40,244 426,609 49,623 476,232
Profit for the period - - 28,443 28,443 990 29,433 7,787 37,220 Other comprehensive income (losses) - 3,103 (182) 2,921 - 2,921 363 3,284
Total comprehensive income - 3,103 28,261 31,364 990 32,354 8,150 40,504
Dividends paid relating to 2013 - - (7,248) (7,248) - (7,248) - (7,248) Special dividends paid - - (29,843) (29,843) - (29,843) - (29,843) Dividends paid to non-controlling interests - - - - - - (2,445) (2,445) Distribution paid on perpetual capital
securities - - - - (1,341) (1,341) - (1,341) Equity contribution from non-controlling
interests - - - - - - 43,730 43,730 Redemption of capital securities by a
subsidiary - - - - - - (2,340) (2,340) Share option lapsed - (4) 4 - - - - - Unclaimed dividends write back - - 5 5 - 5 - 5 Repurchase of perpetual capital
securities (c) - - (25) (25) (433) (458) - (458) Relating to purchase of non-controlling
interests - (66) - (66) - (66) (27) (93) Relating to deemed dilution of subsidiary
companies - 39,029 (2) 39,027 - 39,027 (39,027) -
- 38,959 (37,109) 1,850 (1,774) 76 (109) (33)
At 30 June 2014 29,425 55,822 334,332 419,579 39,460 459,039 57,664 516,703
At 1 January 2013 * 29,425 18,091 320,369 367,885 23,634 391,519 47,022 438,541
Profit for the period - - 12,398 12,398 773 13,171 2,765 15,936 Other comprehensive income (losses) - (12,045) 1 (12,044) - (12,044) (711) (12,755)
Total comprehensive income (losses) - (12,045) 12,399 354 773 1,127 2,054 3,181
Dividends paid relating to 2012 - - (6,523) (6,523) - (6,523) - (6,523) Dividends paid to non-controlling interests - - - - - - (2,084) (2,084) Distribution paid on perpetual capital
securities - - - - (689) (689) - (689) Equity contribution from non-controlling
interests - - - - - - 107 107 Share option schemes of subsidiaries - (2) - (2) - (2) 1 (1) Issuance of perpetual capital securities (c) - - - - 17,879 17,879 - 17,879 Transaction costs in relation to issuance of
perpetual capital securities - - (153) (153) - (153) - (153) Repurchase of perpetual capital
securities (c) - - (97) (97) (1,446) (1,543) - (1,543) Relating to acquisition of subsidiary
companies - - - - - - 2 2 Relating to purchase of non-controlling
interests - (8) - (8) - (8) 1 (7) Relating to partial disposal of subsidiary
companies - 52 - 52 - 52 (52) -
- 42 (6,773) (6,731) 15,744 9,013 (2,025) 6,988
At 30 June 2013 * 29,425 6,088 325,995 361,508 40,151 401,659 47,051 448,710
* Share capital as at 1 January 2014, 30 June 2013 and 1 January 2013 include the balance on the share premium account and capital redemption reserve created
under the sections 48B and 49H of the predecessor Companies Ordinance (Cap. 32) totalling HK$28,359 million, which under the Hong Kong Companies
Ordinance (Cap. 622) effective on 3 March 2014 have been included in share capital. Also see note (a).
Attributable to
Ordinary shareholders
HWL 2014 Interim Results Page 27 of 55

Hutchison Whampoa Limited
Condensed Consolidated Statement of Changes in Equityfor the six months ended 30 June 2014
(a) In accordance with the transitional provisions set out in section 37 of Schedule 11 to the Hong Kong Companies Ordinance (Cap. 622), on 3 March 2014, the amounts standing to the credit of the share premium account and capital redemption reserve
created under the sections 48B and 49H of the predecessor Companies Ordinance (Cap. 32) have become part of the Company’s share capital.
(b) Other reserves comprise exchange reserve, revaluation reserve, hedging reserve and other capital reserves. As at 30 June 2014, exchange reserve surplus amounted to HK$11,080 million (1 January 2014 - HK$6,789 million and 30 June 2013 - deficit of HK$386 million), revaluation reserve surplus amounted to HK$3,992 million (1 January 2014 - HK$3,883 million and 30 June 2013 - HK$3,669 million), hedging reserve deficit amounted to HK$535 million (1 January 2014 - HK$440 million and 30 June 2013 - HK$699 million) and other capital reserves surplus amounted to HK$41,285 million (1 January 2014 - HK$3,528 million and 30 June 2013 - HK$3,504 million). Revaluation surplus (deficit) arising from revaluation to market value of listed debt securities and listed equity securities which are available for sale are included in the revaluation reserve. Fair value changes arising from the effective portion of hedging instruments designated as cash flow hedges are included in the hedging reserve.
(c) During the six months ended 30 June 2014, the Group had repurchased US$55 million (approximately HK$433 million) (30 June 2013 - US$185 million, approximately HK$1,446 million) nominal amount of subordinated guaranteed perpetual capital securities (the “perpetual capital securities”) that were originally issued in October 2010 at an aggregate nominal amount of US$2,000 million (approximately HK$15,600 million).
In May 2013, a wholly owned subsidiary company of the Group issued perpetual capital securities with a nominal amount of €1,750 million (approximately HK$17,879 million) for cash, which are classified as equity under Hong Kong Financial Reporting Standards.
HWL 2014 Interim Results Page 28 of 55

Hutchison Whampoa Limited
Condensed Consolidated Statement of Cash Flows for the six months ended 30 June 2014
2014 2013Note HK$ millions HK$ millions
Operating activitiesCash generated from operating activities before interest expenses and
other finance costs, tax paid and changes in working capital 12 (a) 29,716 29,032 Interest expenses and other finance costs paid (3,562) (4,037) Tax paid (1,404) (1,907) Funds from operations 24,750 23,088 Changes in working capital 12 (b) (3,608) (5,489)
Net cash from operating activities 21,142 17,599
Investing activitiesPurchase of fixed assets and investment properties (7,887) (8,342) Additions to leasehold land - (19) Additions to telecommunications licences (6) (2,676) Additions to brand names and other rights (170) (30) Purchase of subsidiary companies 12 (c) - (17,499) Additions to other unlisted investments and long term receivables (620) (2) Repayments from associated companies and joint ventures 2,868 9,068 Purchase of and advances to (including deposits from) associated
companies and joint ventures (4,045) (5,080) Proceeds on disposal of fixed assets, leasehold land, investment
properties and other assets 718 4,206 Proceeds on disposal of subsidiary companies 12 (d) - 520 Proceeds on disposal of associated companies 575 47 Proceeds on disposal of other unlisted investments 178 - Cash flows used in investing activities before additions to / disposal
of liquid funds and other listed investments (8,389) (19,807) Disposal of liquid funds and other listed investments 1,217 6,095 Additions to liquid funds and other listed investments (2,242) (124)
Cash flows used in investing activities (9,414) (13,836)
Net cash inflow before financing activities 11,728 3,763
Unaudited
HWL 2014 Interim Results Page 29 of 55

Hutchison Whampoa Limited
Condensed Consolidated Statement of Cash Flows for the six months ended 30 June 2014
2014 2013HK$ millions HK$ millions
Financing activitiesNew borrowings 21,401 23,373 Repayment of borrowings (16,931) (44,935) Issue of shares by subsidiary companies to non-controlling shareholders
and net loans from (to) non-controlling shareholders 43,615 80 Redemption of capital securities by a subsidiary (2,340) - Payments to acquire additional interests in subsidiary companies (93) (8) Proceeds on issue of perpetual capital securities, net of transaction costs - 17,726 Repurchase of perpetual capital securities (458) (1,543) Dividends paid to non-controlling interests (2,225) (2,096) Distributions paid on perpetual capital securities (1,341) (689) Dividends paid to ordinary shareholders (37,091) (6,523)
Cash flows from (used in) financing activities 4,537 (14,615)
Increase (decrease) in cash and cash equivalents 16,265 (10,852) Cash and cash equivalents at 1 January 85,651 107,948
Cash and cash equivalents at 30 June 101,916 97,096
30 June 30 June2014 2013
HK$ millions HK$ millionsAnalysis of cash, liquid funds and other listed investmentsCash and cash equivalents, as above 101,916 97,096 Liquid funds and other listed investments 18,908 17,164
Total cash, liquid funds and other listed investments 120,824 114,260 Total principal amount of bank and other debts 229,031 231,957 Interest bearing loans from non-controlling shareholders 5,400 5,572
Net debt 113,607 123,269 Interest bearing loans from non-controlling shareholders (5,400) (5,572)
Net debt (excluding interest bearing loans from non-controlling shareholders) 108,207 117,697
Unaudited
HWL 2014 Interim Results Page 30 of 55

Notes
1 Basis of preparation
The financial information is extracted from the Group’s unaudited condensed interim accounts which have been prepared in accordance with Hong Kong Accounting Standard (“HKAS”) 34 “Interim Financial Reporting” issued by the Hong Kong Institute of Certified Public Accountants (“HKICPA”). The financial information should be read in conjunction with the 2013 annual accounts, which have been prepared in accordance with Hong Kong Financial Reporting Standards (“HKFRS”).
2 Significant accounting policies
The interim accounts have been prepared under the historical cost convention except for certain properties and financialinstruments which are stated at fair values.
The accounting policies applied and methods of computation used in the preparation of the interim accounts are consistent with those used in the 2013 annual accounts, except for the adoption of the new and revised standards, amendments and interpretations issued by the HKICPA that are relevant to the Group’s operations and mandatory for annual accounting periods beginning 1 January 2014. The effect of the adoption of these new and revised standards, amendments andinterpretations was not material to the Group’s results of operations or financial position.
The Group adopted HKFRS 11 in 2013. The full year effect of this adoption, mainly reflecting a change in classification ofcertain equity-accounted for investments recorded by listed subsidiary, Cheung Kong Infrastructure on adoption of the same standard, was recorded in the results for the 2013 financial year and reported in the 2013 annual accounts. HKAS 34 requires the use of the same accounting policies uniformly throughout the year and accordingly, the Group has restated the 2013 interim accounts to conform to this policy.
The effects of the adoption of HKFRS 11 to the Group’s financial statements is a reclassification of certain comparativeline items within the respective statement in the consolidated accounts, as explained below, and has no impact on theGroup’s results or total equity.
HWL 2014 Interim Results Page 31 of 55
2 Significant accounting policies (continued)
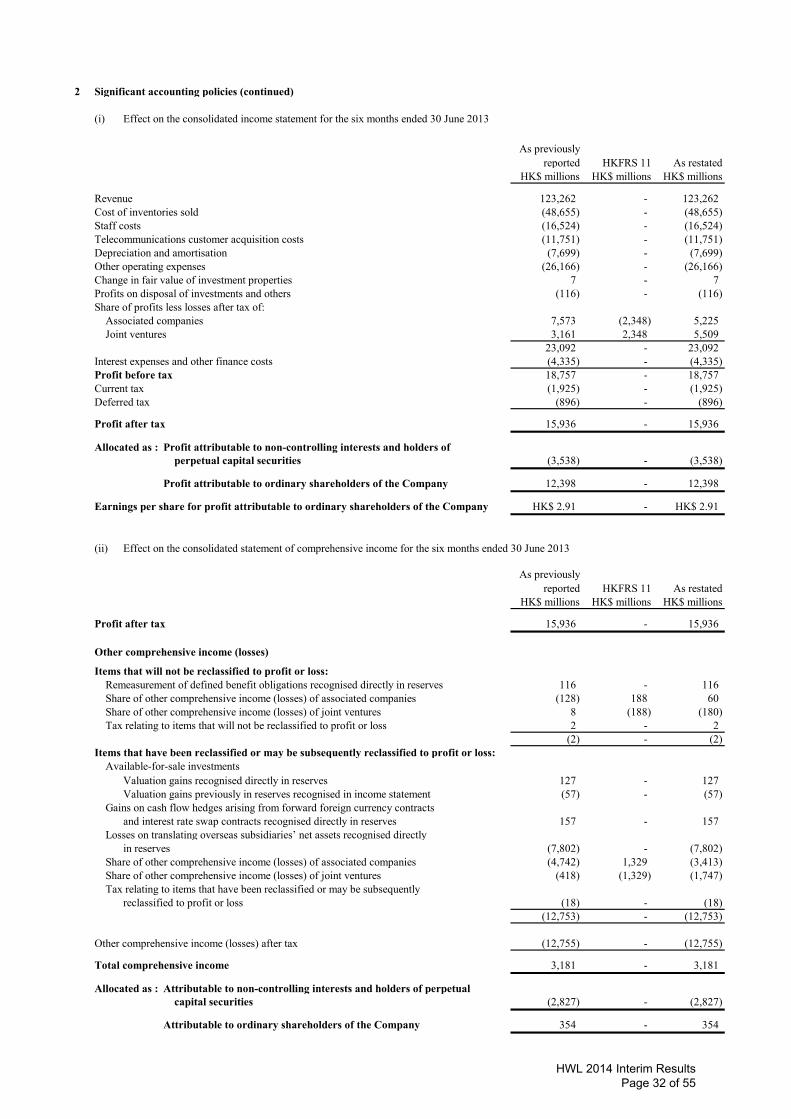
(i) Effect on the consolidated income statement for the six months ended 30 June 2013
As previously reported HKFRS 11 As restated
HK$ millions HK$ millions HK$ millions
Revenue 123,262 - 123,262 Cost of inventories sold (48,655) - (48,655) Staff costs (16,524) - (16,524) Telecommunications customer acquisition costs (11,751) - (11,751) Depreciation and amortisation (7,699) - (7,699) Other operating expenses (26,166) - (26,166) Change in fair value of investment properties 7 - 7 Profits on disposal of investments and others (116) - (116) Share of profits less losses after tax of:
Associated companies 7,573 (2,348) 5,225 Joint ventures 3,161 2,348 5,509
23,092 - 23,092 Interest expenses and other finance costs (4,335) - (4,335) Profit before tax 18,757 - 18,757 Current tax (1,925) - (1,925) Deferred tax (896) - (896)
Profit after tax 15,936 - 15,936
Allocated as : Profit attributable to non-controlling interests and holders of perpetual capital securities (3,538) - (3,538)
Profit attributable to ordinary shareholders of the Company 12,398 - 12,398
Earnings per share for profit attributable to ordinary shareholders of the Company HK$ 2.91 - HK$ 2.91
(ii) Effect on the consolidated statement of comprehensive income for the six months ended 30 June 2013
As previously reported HKFRS 11 As restated
HK$ millions HK$ millions HK$ millions
Profit after tax 15,936 - 15,936
Other comprehensive income (losses)
Items that will not be reclassified to profit or loss:Remeasurement of defined benefit obligations recognised directly in reserves 116 - 116 Share of other comprehensive income (losses) of associated companies (128) 188 60 Share of other comprehensive income (losses) of joint ventures 8 (188) (180) Tax relating to items that will not be reclassified to profit or loss 2 - 2
(2) - (2) Items that have been reclassified or may be subsequently reclassified to profit or loss:
Available-for-sale investmentsValuation gains recognised directly in reserves 127 - 127 Valuation gains previously in reserves recognised in income statement (57) - (57)
Gains on cash flow hedges arising from forward foreign currency contracts and interest rate swap contracts recognised directly in reserves 157 - 157
Losses on translating overseas subsidiaries’ net assets recognised directly in reserves (7,802) - (7,802)
Share of other comprehensive income (losses) of associated companies (4,742) 1,329 (3,413) Share of other comprehensive income (losses) of joint ventures (418) (1,329) (1,747) Tax relating to items that have been reclassified or may be subsequently
reclassified to profit or loss (18) - (18) (12,753) - (12,753)
Other comprehensive income (losses) after tax (12,755) - (12,755)
Total comprehensive income 3,181 - 3,181
Allocated as : Attributable to non-controlling interests and holders of perpetual capital securities (2,827) - (2,827)
Attributable to ordinary shareholders of the Company 354 - 354
HWL 2014 Interim Results Page 32 of 55

3 Operating segment information
The following presents information regarding the Group’s operating segments for the six months ended 30 June 2014 and 2013. Saved as disclosed in the notes below, the column headed as Company and Subsidiaries refers to the Company and subsidiary companies’ respective items and the column headed as Associates and JV refers to the Group’s share of associated companies’ and joint ventures’ respective items.
The Group’s telecommunications division consists of a 65.01% interest in Hutchison Telecommunications Hong Kong Holdings, which is listed on the Stock Exchange of Hong Kong, Hutchison Asia Telecommunications, an 87.87% interest in the AustralianSecurities Exchange listed Hutchison Telecommunications (Australia) (“HTAL”), which has a 50% interest in a joint venture company, Vodafone Hutchison Australia Pty Limited (“VHA”), and 3 Group Europe with businesses in 6 countries in Europe.
Finance & Investments and Others is presented to reconcile to the totals included in the Group’s income statement and statement of financial position. As additional information, “Others” is presented as a separate line item, within Finance & Investments and Others, which covers the activities of other Group areas which are not presented separately and includes Hutchison Water, Hutchison Whampoa (China), Hutchison E-Commerce and corporate head office operations, the Marionnaud business, listed subsidiary Hutchison China MediTech, listed subsidiary Hutchison Harbour Ring and listed associate Tom Group. “Finance &Investments” within Finance & Investments and Others represents returns earned on the Group’s holdings of cash and liquidinvestments.
Prior period corresponding segment information that is presented for comparative purposes has been restated to conform to changes adopted in the second half of 2013.
Revenue from external customers is after elimination of inter-segment revenue. The amounts eliminated are mainly attributableto Property and hotels of HK$198 million (30 June 2013 - HK$190 million) and Hutchison Telecommunications Hong Kong Holdings of HK$83 million (30 June 2013 - HK$70 million).
(a) The following is an analysis of the Group’s revenue by operating segments:
Company and Associates Company and AssociatesSubsidiaries and JV Total Subsidiaries and JV Total
HK$ millions HK$ millions HK$ millions % HK$ millions HK$ millions HK$ millions %
Ports and related services 13,587 3,683 17,270 8% 13,182 3,709 16,891 9%Hutchison Ports Group other than
HPH Trust 13,565 2,355 15,920 8% 13,119 2,410 15,529 8%HPH Trust# 22 1,328 1,350 - 63 1,299 1,362 1%
Property and hotels 3,547 3,915 7,462 4% 3,319 7,867 11,186 6%Retail 61,890 15,508 77,398 38% 57,470 13,788 71,258 36%Cheung Kong Infrastructure 2,999 19,265 22,264 11% 2,246 17,887 20,133 10%Husky Energy - 28,660 28,660 14% - 29,911 29,911 15%3 Group Europe 31,052 11 31,063 15% 30,098 3 30,101 15%Hutchison Telecommunications Hong
Kong Holdings 6,227 - 6,227 3% 6,149 - 6,149 3%Hutchison Asia Telecommunications 3,506 - 3,506 2% 2,981 - 2,981 1%Finance & Investments and Others 7,926 2,709 10,635 5% 7,817 2,652 10,469 5%
Finance & Investments 733 436 1,169 - 659 376 1,035 - Others 7,193 2,273 9,466 5% 7,158 2,276 9,434 5%
130,734 73,751 204,485 100% 123,262 75,817 199,079 100%Non-controlling interests’ share of
HPH Trust’s revenue - 438 438 - 413 413 130,734 74,189 204,923 123,262 76,230 199,492
# represents the Group’s attributable share of HPH Trust’s revenue based on the effective shareholdings in HPH Trust during 2014.Revenue reduced by HK$438 million and HK$413 million for the six months ended 30 June 2014 and 2013 respectively, beingadjustments to exclude non-controlling interests’ share of revenue of HPH Trust.
RevenueSix months ended 30 June 2014 Six months ended 30 June 2013
HWL 2014 Interim Results Page 33 of 55

3 Operating segment information (continued)
(b) The Group uses two measures of segment results, EBITDA (see note 3(m)) and EBIT (see note 3(n)). The following is an analysis of the Group’s results by operating segments by EBITDA:
Company and Associates Company and AssociatesSubsidiaries and JV Total Subsidiaries and JV Total
HK$ millions HK$ millions HK$ millions % HK$ millions HK$ millions HK$ millions %
Ports and related services 3,833 1,774 5,607 12% 3,653 1,757 5,410 12%Hutchison Ports Group other than
HPH Trust 3,814 1,091 4,905 10% 3,594 1,118 4,712 10%HPH Trust# 19 683 702 2% 59 639 698 2%
Property and hotels 2,667 1,206 3,873 8% 2,798 3,120 5,918 13%Retail 5,331 1,280 6,611 14% 4,950 1,118 6,068 13%Cheung Kong Infrastructure 1,154 10,665 11,819 25% 1,264 10,205 11,469 26%Husky Energy - 8,145 8,145 18% - 7,991 7,991 18%3 Group Europe 6,516 (12) 6,504 14% 5,676 (15) 5,661 13%Hutchison Telecommunications Hong
Kong Holdings 1,192 38 1,230 3% 1,480 29 1,509 3%Hutchison Asia Telecommunications 502 - 502 1% (59) - (59) - Finance & Investments and Others 1,495 1,026 2,521 5% 404 568 972 2%
Finance & Investments 1,577 436 2,013 4% 1,239 376 1,615 4%Others (82) 590 508 1% (835) 192 (643) -2%
EBITDA before property revaluation and profits on disposal of investments and others 22,690 24,122 46,812 100% 20,166 24,773 44,939 100%
Profits on disposal of investments(see note 4) - 20,554 20,554 569 - 569
Non-controlling interests’ share of HPH Trust’s EBITDA - 279 279 - 290 290
EBITDA (see note 12(a)) 22,690 44,955 67,645 20,735 25,063 45,798
Depreciation and amortisation (8,348) (7,704) (16,052) (7,699) (7,462) (15,161) Change in fair value of investment
properties - - - 7 27 34 Others (see note 4) (652) (561) (1,213) - (685) (685) Group’s share of the following income
statement items of associated companies and joint ventures:Interest expenses and other
finance costs - (3,434) (3,434) - (2,927) (2,927) Current tax - (4,240) (4,240) - (3,298) (3,298) Deferred tax - 1,185 1,185 - (511) (511) Non-controlling interests - (133) (133) - (158) (158)
13,690 30,068 43,758 13,043 10,049 23,092
# represents the Group’s attributable share of HPH Trust’s EBITDA based on the effective shareholdings in HPH Trust during 2014. EBITDA reduced by HK$279 million and HK$290 million for the six months ended 30 June 2014 and 2013 respectively, being adjustments to exclude non-controlling interests’ share of EBITDA of HPH Trust.
Six months ended 30 June 2014 Six months ended 30 June 2013EBITDA (LBITDA) (m)
HWL 2014 Interim Results Page 34 of 55

3 Operating segment information (continued)
(c) The following is an analysis of the Group’s results by operating segments by EBIT:
Company and Associates Company and AssociatesSubsidiaries and JV Total Subsidiaries and JV Total
HK$ millions HK$ millions HK$ millions % HK$ millions HK$ millions HK$ millions %
Ports and related services 2,349 1,182 3,531 12% 2,327 1,122 3,449 12%Hutchison Ports Group other than
HPH Trust 2,330 797 3,127 10% 2,268 781 3,049 10%HPH Trust# 19 385 404 2% 59 341 400 2%
Property and hotels 2,557 1,146 3,703 12% 2,682 3,060 5,742 19%Retail 4,363 973 5,336 17% 4,066 845 4,911 16%Cheung Kong Infrastructure 997 7,948 8,945 29% 1,167 7,773 8,940 30%Husky Energy - 4,329 4,329 14% - 4,152 4,152 14%3 Group Europe
EBITDA before the following non-cash items: 6,516 (12) 6,504 5,676 (15) 5,661
Depreciation (3,716) - (3,716) (3,370) - (3,370) Amortisation of licence fees and
other rights (506) - (506) (437) - (437) EBIT (LBIT) - 3 Group Europe 2,294 (12) 2,282 7% 1,869 (15) 1,854 6%
Hutchison Telecommunications Hong Kong Holdings 538 - 538 2% 829 5 834 3%
Hutchison Asia Telecommunications (76) - (76) - (697) - (697) -2%Finance & Investments and Others 1,320 962 2,282 7% 224 479 703 2%
Finance & Investments 1,577 436 2,013 7% 1,239 376 1,615 5%Others (257) 526 269 - (1,015) 103 (912) -3%
EBIT before property revaluation and profits on disposal of investments and others 14,342 16,528 30,870 100% 12,467 17,421 29,888 100%
Change in fair value of investment properties - - - 7 27 34
EBIT 14,342 16,528 30,870 12,474 17,448 29,922
Profits on disposal of investmentsand others (see note 4) (652) 19,993 19,341 569 (685) (116)
Non-controlling interests’ share of HPH Trust’s EBIT - 169 169 - 180 180
Group’s share of the following income statement items of associated companies and joint ventures:Interest expenses and other
finance costs - (3,434) (3,434) - (2,927) (2,927) Current tax - (4,240) (4,240) - (3,298) (3,298) Deferred tax - 1,185 1,185 - (511) (511) Non-controlling interests - (133) (133) - (158) (158)
13,690 30,068 43,758 13,043 10,049 23,092
# represents the Group’s attributable share of HPH Trust’s EBIT based on the effective shareholdings in HPH Trust during 2014. EBIT reduced by HK$169 million and HK$180 million for the six months ended 30 June 2014 and 2013 respectively, being adjustments to exclude non-controlling interests’ share of EBIT of HPH Trust.
Six months ended 30 June 2014 Six months ended 30 June 2013EBIT (LBIT) (n)
HWL 2014 Interim Results Page 35 of 55

3 Operating segment information (continued)
(d) The following is an analysis of the Group’s depreciation and amortisation by operating segments:
Company and Associates Company and AssociatesSubsidiaries and JV Total Subsidiaries and JV Total
HK$ millions HK$ millions HK$ millions HK$ millions HK$ millions HK$ millions
Ports and related services 1,484 592 2,076 1,326 635 1,961 Hutchison Ports Group other than HPH Trust 1,484 294 1,778 1,326 337 1,663 HPH Trust# - 298 298 - 298 298
Property and hotels 110 60 170 116 60 176 Retail 968 307 1,275 884 273 1,157 Cheung Kong Infrastructure 157 2,717 2,874 97 2,432 2,529 Husky Energy - 3,816 3,816 - 3,839 3,839 3 Group Europe 4,222 - 4,222 3,807 - 3,807 Hutchison Telecommunications Hong Kong Holdings 654 38 692 651 24 675 Hutchison Asia Telecommunications 578 - 578 638 - 638 Finance & Investments and Others 175 64 239 180 89 269
Finance & Investments - - - - - - Others 175 64 239 180 89 269
8,348 7,594 15,942 7,699 7,352 15,051 Non-controlling interests’ share of HPH Trust’s
depreciation and amortisation - 110 110 - 110 110 8,348 7,704 16,052 7,699 7,462 15,161
# represents the Group’s attributable share of HPH Trust’s depreciation and amortisation based on the effective shareholdings in HPH Trust during 2014. Depreciation and amortisation reduced by HK$110 million and HK$110 million for the six months ended 30 June 2014 and 2013 respectively, being adjustments to exclude non-controlling interests’ share of depreciation and amortisation of HPH Trust.
(e) The following is an analysis of the Group’s capital expenditure by operating segments:
Fixed assets, Fixed assets,investment Telecom- Brand names investment Telecom- Brand names
properties and munications and properties and munications andleasehold land licences other rights Total leasehold land licences other rights TotalHK$ millions HK$ millions HK$ millions HK$ millions HK$ millions HK$ millions HK$ millions HK$ millions
Ports and related services 1,002 - 1 1,003 1,799 - 1 1,800 Hutchison Ports Group
other than HPH Trust 1,002 - 1 1,003 1,799 - 1 1,800 HPH Trust - - - - - - - -
Property and hotels 36 - - 36 247 - - 247 Retail 720 - - 720 720 - - 720 Cheung Kong Infrastructure 221 - 12 233 173 - - 173 Husky Energy - - - - - - - - 3 Group Europe (o) 4,749 4 127 4,880 4,154 2,674 13 6,841 Hutchison Telecommunications
Hong Kong Holdings 420 2 30 452 562 2 16 580 Hutchison Asia
Telecommunications 646 - - 646 608 - - 608 Finance & Investments
and Others 93 - - 93 98 - - 98 Finance & Investments - - - - - - - - Others 93 - - 93 98 - - 98
7,887 6 170 8,063 8,361 2,676 30 11,067
Six months ended 30 June 2013
Depreciation and amortisation
Six months ended 30 June 2014
Six months ended 30 June 2014 Six months ended 30 June 2013
Capital expenditure
HWL 2014 Interim Results Page 36 of 55

3 Operating segment information (continued)
(f) The following is an analysis of the Group’s total assets by operating segments:
Investments Investmentsin associated in associated
Deferred companies and Deferred companies andSegment tax interests in Total Segment tax interests in Totalassets (p) assets joint ventures assets assets (p) assets joint ventures assets
HK$ millions HK$ millions HK$ millions HK$ millions HK$ millions HK$ millions HK$ millions HK$ millions
Ports and related services 72,780 167 26,178 99,125 71,164 169 27,548 98,881 Hutchison Ports Group
other than HPH Trust 72,780 167 12,407 85,354 71,164 169 13,483 84,816 HPH Trust - - 13,771 13,771 - - 14,065 14,065
Property and hotels 50,345 21 44,960 95,326 53,049 21 42,839 95,909 Retail 38,462 734 5,012 44,208 39,329 670 5,035 45,034 Cheung Kong Infrastructure 21,908 21 110,020 131,949 20,134 21 85,589 105,744 Husky Energy - - 52,416 52,416 - - 51,833 51,833 3 Group Europe (q) 236,590 16,640 13 253,243 235,401 17,265 18 252,684 Hutchison Telecommunications
Hong Kong Holdings 19,042 332 536 19,910 19,169 369 715 20,253 Hutchison Asia
Telecommunications 23,174 1 - 23,175 20,785 1 - 20,786 Finance & Investments
and Others 130,426 29 3,026 133,481 114,614 30 4,831 119,475 Finance & Investments 105,597 - - 105,597 89,947 - - 89,947 Others 24,829 29 3,026 27,884 24,667 30 4,831 29,528
592,727 17,945 242,161 852,833 573,645 18,546 218,408 810,599 Reconciliation item@ - 2 5,525 5,527 - 2 4,921 4,923
592,727 17,947 247,686 858,360 573,645 18,548 223,329 815,522
@ the reconciliation item comprises total assets of HTAL.
(g) The following is an analysis of the Group’s total liabilities by operating segments:
Current & Current &non-current non-current
borrowings (s) borrowings (s)
and other Current & and other Current &Segment non-current deferred tax Total Segment non-current deferred tax Total
liabilities (r) liabilities liabilities liabilities liabilities (r) liabilities liabilities liabilitiesHK$ millions HK$ millions HK$ millions HK$ millions HK$ millions HK$ millions HK$ millions HK$ millions
Ports and related services 16,564 27,641 4,812 49,017 17,031 28,559 4,843 50,433 Hutchison Ports Group
other than HPH Trust 16,564 27,641 4,812 49,017 17,031 28,559 4,843 50,433 HPH Trust - - - - - - - -
Property and hotels 4,350 413 2,730 7,493 4,156 409 2,730 7,295 Retail 23,329 14,993 1,354 39,676 24,670 87 1,066 25,823 Cheung Kong Infrastructure 5,620 16,464 1,638 23,722 5,200 13,443 1,532 20,175 Husky Energy - - - - - - - - 3 Group Europe 23,548 84,930 863 109,341 23,630 101,565 930 126,125 Hutchison Telecommunications
Hong Kong Holdings 3,970 4,982 401 9,353 3,860 5,447 356 9,663 Hutchison Asia
Telecommunications 2,978 1,384 2 4,364 3,151 1,550 3 4,704 Finance & Investments
and Others 7,004 89,667 1,884 98,555 8,085 84,776 2,087 94,948 Finance & Investments - 82,464 - 82,464 - 78,011 - 78,011 Others 7,004 7,203 1,884 16,091 8,085 6,765 2,087 16,937
87,363 240,474 13,684 341,521 89,783 235,836 13,547 339,166 Reconciliation item@ 136 - - 136 124 - - 124
87,499 240,474 13,684 341,657 89,907 235,836 13,547 339,290
@ the reconciliation item comprises total liabilities of HTAL.
Total assets
Company and Company andSubsidiaries Subsidiaries
Total liabilities30 June 2014 31 December 2013
30 June 2014 31 December 2013
HWL 2014 Interim Results Page 37 of 55

3 Operating segment information (continued)
Additional information in respect of geographical locations
(h) Additional disclosures of the Group’s revenue by geographical location are shown below:
Company and Associates Company and AssociatesSubsidiaries and JV Total Subsidiaries and JV Total
HK$ millions HK$ millions HK$ millions % HK$ millions HK$ millions HK$ millions %
Hong Kong 27,234 3,622 30,856 15% 26,429 4,246 30,675 15%Mainland China 14,761 6,812 21,573 11% 13,050 9,267 22,317 11%Europe 61,447 26,973 88,420 43% 57,379 23,255 80,634 41%Canada (t) 33 28,534 28,567 14% 49 29,983 30,032 15%Asia, Australia and others 19,333 5,101 24,434 12% 18,538 6,414 24,952 13%Finance & Investments
and Others 7,926 2,709 10,635 5% 7,817 2,652 10,469 5%130,734 73,751 204,485 (1) 100% 123,262 75,817 199,079 (1) 100%
(1) see note 3(a) for reconciliation to total revenue included in the Group’s income statement.
(i) Additional disclosures of the Group’s EBITDA by geographical location are shown below:
Company and Associates Company and AssociatesSubsidiaries and JV Total Subsidiaries and JV Total
HK$ millions HK$ millions HK$ millions % HK$ millions HK$ millions HK$ millions %
Hong Kong 3,874 1,544 5,418 12% 4,504 2,187 6,691 15%Mainland China 2,430 2,847 5,277 11% 2,061 4,009 6,070 14%Europe 10,392 8,622 19,014 41% 8,813 7,398 16,211 35%Canada (t) 30 7,849 7,879 17% 36 7,878 7,914 18%Asia, Australia and others 4,469 2,234 6,703 14% 4,348 2,733 7,081 16%Finance & Investments
and Others 1,495 1,026 2,521 5% 404 568 972 2%EBITDA before property
revaluation and profits ondisposal of investments and others 22,690 24,122 46,812 100% 20,166 24,773 44,939 100%
(2) see note 3(b) for reconciliation to total EBITDA included in the Group’s income statement.
(j) Additional disclosures of the Group’s EBIT by geographical location are shown below:
Company and Associates Company and AssociatesSubsidiaries and JV Total Subsidiaries and JV Total
HK$ millions HK$ millions HK$ millions % HK$ millions HK$ millions HK$ millions %
Hong Kong 2,923 911 3,834 12% 3,571 1,440 5,011 17%Mainland China 2,071 2,223 4,294 14% 1,769 3,507 5,276 18%Europe 5,169 6,728 11,897 39% 4,127 5,943 10,070 33%Canada (t) 31 4,163 4,194 14% 36 4,047 4,083 14%Asia, Australia and others 2,828 1,541 4,369 14% 2,740 2,005 4,745 16%Finance & Investments
and Others 1,320 962 2,282 7% 224 479 703 2%EBIT before property
revaluation and profits ondisposal of investments and others 14,342 16,528 30,870 100% 12,467 17,421 29,888 100%
Change in fair value of investment properties - - - 7 27 34
EBIT 14,342 16,528 30,870 (3) 12,474 17,448 29,922 (3)
(3) see note 3(c) for reconciliation to total EBIT included in the Group’s income statement.
(2)
Six months ended 30 June 2014 Six months ended 30 June 2013
Revenue
EBIT (n)
Six months ended 30 June 2014 Six months ended 30 June 2013
EBITDA (m)
Six months ended 30 June 2014 Six months ended 30 June 2013
(2)
HWL 2014 Interim Results Page 38 of 55

3 Operating segment information (continued)
(k) Additional disclosures of the Group’s capital expenditure by geographical location are shown below:
Fixed assets, Fixed assets,investment Telecom- Brand names investment Telecom- Brand names
properties and munications and properties and munications andleasehold land licences other rights Total leasehold land licences other rights TotalHK$ millions HK$ millions HK$ millions HK$ millions HK$ millions HK$ millions HK$ millions HK$ millions
Hong Kong 667 2 33 702 942 2 7 951 Mainland China 232 - - 232 476 - - 476 Europe 5,369 4 127 5,500 4,852 2,674 13 7,539 Canada - - - - - - - - Asia, Australia and others 1,526 - 10 1,536 1,993 - 10 2,003 Finance & Investments
and Others 93 - - 93 98 - - 98 7,887 6 170 8,063 8,361 2,676 30 11,067
(l) Additional disclosures of the Group’s total assets by geographical location are shown below:
Investments Investmentsin associated in associated
Deferred companies and Deferred companies andSegment tax interests in Total Segment tax interests in Totalassets (p) assets joint ventures assets assets (p) assets joint ventures assets
HK$ millions HK$ millions HK$ millions HK$ millions HK$ millions HK$ millions HK$ millions HK$ millions
Hong Kong 75,953 372 44,687 121,012 77,353 417 28,724 106,494 Mainland China 14,333 514 67,082 81,929 14,264 495 65,724 80,483 Europe 294,234 16,855 60,530 371,619 294,553 17,424 56,252 368,229 Canada (t) 336 - 48,042 48,378 329 - 47,701 48,030 Asia, Australia and others 77,445 177 24,319 101,941 72,532 182 20,097 92,811 Finance & Investments
and Others 130,426 29 3,026 133,481 114,614 30 4,831 119,475 592,727 17,947 247,686 858,360 573,645 18,548 223,329 815,522
(m) EBITDA (LBITDA) represents the EBITDA (LBITDA) of the Company and subsidiary companies as well as the Group’s share of the EBITDA (LBITDA) of associated companies and joint ventures except for HPH Trust which are included based on theGroup’s effective share of EBITDA for this operation. EBITDA (LBITDA) is defined as earnings (losses) before interest expenses and other finance costs, tax, depreciation and amortisation, and includes profits on disposal of investments and other earnings of a cash nature but excludes change in fair value of investment properties. Information concerning EBITDA (LBITDA) has been included in the Group’s financial information and consolidated financial statements and is used by manyindustries and investors as one measure of gross cash flow generation. The Group considers EBITDA (LBITDA) to be an important performance measure which is used in the Group’s internal financial and management reporting to monitor business performance. EBITDA (LBITDA) is therefore presented as a measure of segment results in accordance with HKFRS 8. EBITDA (LBITDA) is not a measure of cash liquidity or financial performance under generally accepted accounting principles in HongKong and the EBITDA (LBITDA) measures used by the Group may not be comparable to other similarly titled measures of other companies. EBITDA (LBITDA) should not necessarily be construed as an alternative to cash flows or results from operations as determined in accordance with generally accepted accounting principles in Hong Kong.
Six months ended 30 June 2013Six months ended 30 June 2014Capital expenditure
Company andSubsidiaries
30 June 2014 31 December 2013Total assets
Company andSubsidiaries
HWL 2014 Interim Results Page 39 of 55

3 Operating segment information (continued)
(n) EBIT (LBIT) represents the EBIT (LBIT) of the Company and subsidiary companies as well as the Group’s share of the EBIT (LBIT) of associated companies and joint ventures except for HPH Trust which are included based on the Group’s effective share of EBIT for this operation. EBIT (LBIT) is defined as earnings (losses) before interest expenses and other finance costs and tax. Information concerning EBIT (LBIT) has been included in the Group’s financial information and consolidated financial statements and is used by many industries and investors as one measure of results from operations. The Group considers EBIT (LBIT) to be an important performance measure which is used in the Group’s internal financial and management reporting to monitor business performance. EBIT (LBIT) is therefore presented as ameasure of segment results in accordance with HKFRS 8. EBIT (LBIT) is not a measure of financial performance under generally accepted accounting principles in Hong Kong and the EBIT (LBIT) measures used by the Group may not be comparable to other similarly titled measures of other companies. EBIT (LBIT) should not necessarily be construed as an alternative to results from operations as determined in accordance with generally accepted accounting principles in Hong Kong.
(o) Included in capital expenditures of 3 Group Europe for the six months ended 30 June 2014 is the effect of foreign exchange translation of overseas subsidiaries’ fixed assets balances at 30 June 2014 which has an effect of increasing total expenditures by HK$256 million (30 June 2013 - decreasing total expenditures by HK$263 million).
(p) Segment assets comprise fixed assets, investment properties, leasehold land, telecommunications licences, goodwill, brand names and other rights, other non-current assets, liquid funds and other listed investments, cash and cash equivalents and other current assets. As additional information, non-current assets (excluding financial instruments, deferred tax assets, post-employment benefits assets and assets from insurance contracts) for Hong Kong, Mainland China, Europe, Canada, and Asia, Australia and others amounted to HK$109,936 million (31 December 2013 - HK$96,779 million), HK$78,074 million (31 December 2013 - HK$76,967 million), HK$312,254 million (31 December 2013 - HK$305,349 million), HK$48,082 million (31 December 2013 - HK$47,742 million) and HK$74,536 million (31 December 2013 - HK$69,478 million) respectively.
(q) Included in total assets of 3 Group Europe is an unrealised foreign currency exchange gain arising on 30 June 2014 of HK$2,539 million (31 December 2013 - HK$3,129 million) from the translation of overseas subsidiaries accounts toHong Kong dollars with an offsetting amount recorded in other reserves.
(r) Segment liabilities comprise trade and other payables and pension obligations.
(s) Current and non-current borrowings comprise bank and other debts and interest bearing loans from non-controlling shareholders.
(t) Include contribution from the United States of America for Husky Energy.
HWL 2014 Interim Results Page 40 of 55

4 Profits on disposal of investments and others
Attributable toOrdinary Holders of
shareholders perpetual Non-controllingof the Company capital securities interests Total
HK$ millions HK$ millions HK$ millions HK$ millions
Six months ended 30 June 2014Profits on disposal of investments
Share of an associated company’s gain on disposal (a) 16,066 - 4,488 20,554
OthersImpairment of goodwill and store closure
provision (b) (652) - - (652)HTAL - share of operating losses of joint
venture VHA (c) (493) - (68) (561)
(1,145) - (68) (1,213)
Six months ended 30 June 2013Profits on disposal of investments(d) 569 - - 569
Others - HTAL - share of operating losses of joint venture VHA(c) (602) - (83) (685)
(a) The balance represents the Group’s share of gain arising from listed associated company, Power Assets Holdings Limited’s separate listing of its Hong Kong electricity business on the Main Board of the Stock Exchange of HongKong.
(b) During the six months ended 30 June 2014, the Group recognised provisions of HK$652 million on the impairment of goodwill and store closures of the Marionnaud businesses to exit Poland and down-size operations in Portugal and Spain.
(c) VHA is undergoing a shareholder-sponsored restructuring under the leadership of the other shareholder under the applicable terms of the shareholders’ agreement. In order to assist in providing a meaningful analysis of the ongoing operating activities, HTAL’s share of VHA’s results for the six months ended 30 June 2014 and 2013 are presented as a separate item above to separately identify it from the recurring earnings profile during this phase.
(d) During the six months ended 30 June 2013, the Group recognised a one-time net gain of HK$569 million, arisingfrom the disposal of certain non-core telecommunications assets in Austria of HK$2,648 million, upon completion ofthe acquisition of Orange Austria, net with one-time costs of HK$2,079 million mainly relating to the restructuring of 3 Austria’s business on the acquisition of Orange Austria. The related tax effect is a tax credit of HK$389 million.
HWL 2014 Interim Results Page 41 of 55

5 Interest expenses and other finance costs
2014 2013HK$ millions HK$ millions
Interest on borrowings 3,595 3,971 Amortisation of loan facilities fees and premiums or discounts relating
to borrowings 135 128 Notional non-cash interest accretion 207 170 Other finance costs 16 138
3,953 4,407 Less: interest capitalised (49) (72)
3,904 4,335
Notional non-cash interest accretion represents notional adjustments to accrete the carrying amount of certain obligations recognised in the statement of financial position such as asset retirement obligation to the present value of the estimated future cash flows expected to be required for their settlement in the future.
6 Tax
2014 2013HK$ millions HK$ millions
Current tax Hong Kong 315 259 Outside Hong Kong 1,323 1,666
1,638 1,925 Deferred tax
Hong Kong 154 98 Outside Hong Kong 842 798
996 896 2,634 2,821
Hong Kong profits tax has been provided for at the rate of 16.5% (30 June 2013 - 16.5%) on the estimated assessable profitsless estimated available tax losses. Tax outside Hong Kong has been provided for at the applicable rate on the estimatedassessable profits less estimated available tax losses.
7 Earnings per share for profit attributable to ordinary shareholders of the Company
The calculation of earnings per share is based on profit attributable to ordinary shareholders of the Company HK$28,443 million (30 June 2013 - HK$12,398 million) and on 4,263,370,780 shares in issue during the first half of 2014(30 June 2013 - 4,263,370,780 shares).
The Company has no share option scheme. Certain of the Company’s subsidiary and associated companies have employee share options outstanding as at 30 June 2014. The employee share options of these subsidiary and associated companiesoutstanding as at 30 June 2014 did not have a dilutive effect on earnings per share.
Six months ended 30 June
Six months ended 30 June
HWL 2014 Interim Results Page 42 of 55
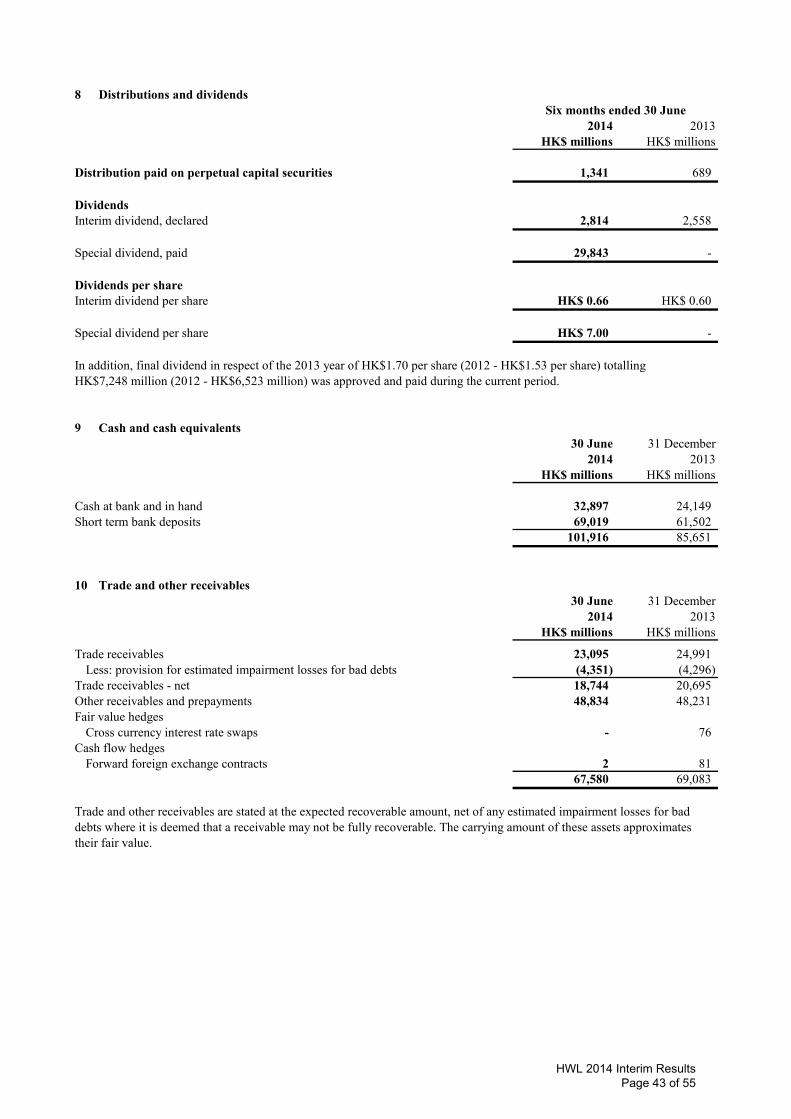
8 Distributions and dividends
2014 2013HK$ millions HK$ millions
Distribution paid on perpetual capital securities 1,341 689
DividendsInterim dividend, declared 2,814 2,558
Special dividend, paid 29,843 -
Dividends per shareInterim dividend per share HK$ 0.66 HK$ 0.60
Special dividend per share HK$ 7.00 -
In addition, final dividend in respect of the 2013 year of HK$1.70 per share (2012 - HK$1.53 per share) totalling HK$7,248 million (2012 - HK$6,523 million) was approved and paid during the current period.
9 Cash and cash equivalents30 June 31 December
2014 2013HK$ millions HK$ millions
Cash at bank and in hand 32,897 24,149 Short term bank deposits 69,019 61,502
101,916 85,651
10 Trade and other receivables30 June 31 December
2014 2013HK$ millions HK$ millions
Trade receivables 23,095 24,991 Less: provision for estimated impairment losses for bad debts (4,351) (4,296)
Trade receivables - net 18,744 20,695 Other receivables and prepayments 48,834 48,231 Fair value hedges
Cross currency interest rate swaps - 76 Cash flow hedges
Forward foreign exchange contracts 2 81 67,580 69,083
Trade and other receivables are stated at the expected recoverable amount, net of any estimated impairment losses for bad debts where it is deemed that a receivable may not be fully recoverable. The carrying amount of these assets approximates their fair value.
Six months ended 30 June
HWL 2014 Interim Results Page 43 of 55

10 Trade and other receivables (continued)
At end of period, the ageing analysis of the trade receivables is as follows:30 June 31 December
2014 2013HK$ millions HK$ millions
Less than 31 days 11,499 13,571 Within 31 to 60 days 2,140 2,091 Within 61 to 90 days 814 870 Over 90 days 8,642 8,459
23,095 24,991
Trade receivables exposures are managed locally in the operating units where they arise and credit limits are set as deemed appropriate for the customer. The Group has established credit policies for customers in each of its core businesses. The average credit period granted for trade receivables ranges from 30 to 45 days. As stated above trade receivables which arepast due at the end of the reporting period are stated at the expected recoverable amount, net of provision for estimated impairment losses for bad debts. Given the profile of our customers and the Group’s different types of businesses, the Group generally does not hold collateral over these balances.
11 Trade and other payables30 June 31 December
2014 2013HK$ millions HK$ millions
Trade payables 20,781 22,309 Other payables and accruals 60,692 61,901 Provisions 866 928 Interest free loans from non-controlling shareholders 1,162 1,181 Cash flow hedges
Interest rate swaps 83 - Forward foreign exchange contracts 723 493
84,307 86,812
At end of period, the ageing analysis of the trade payables is as follows:30 June 31 December
2014 2013HK$ millions HK$ millions
Less than 31 days 12,699 15,176 Within 31 to 60 days 3,177 3,221 Within 61 to 90 days 1,758 1,607 Over 90 days 3,147 2,305
20,781 22,309
HWL 2014 Interim Results Page 44 of 55

12 Notes to condensed consolidated statement of cash flows
(a) Reconciliation of profit after tax to cash generated from operating activities before interest expenses and other finance costs, tax paid and changes in working capital
2014 2013HK$ millions HK$ millions
Profit after tax 37,220 15,936 Less: share of profits less losses after tax of
Associated companies before profits on disposal of investments and others (5,036) (5,225)
Joint ventures (5,039) (5,509) Associated companies’ profits on disposal of investments and
others (20,554) - 6,591 5,202
Adjustments for:Current tax charge 1,638 1,925 Deferred tax charge 996 896 Interest expenses and other finance costs 3,904 4,335 Change in fair value of investment properties - (7) Depreciation and amortisation 8,348 7,699 Others (see note 4) 1,213 685
EBITDA of Company and subsidiaries (i) 22,690 20,735 Profit on disposal of fixed assets, leasehold land, investment properties
and other assets (365) (2,921) Dividends received from associated companies and joint ventures 7,422 8,867 Distribution from property joint ventures 41 1,747 Profit on disposal of subsidiary and associated companies and joint ventures (178) (411) Other non-cash items 106 1,015
29,716 29,032
2014 2013HK$ millions HK$ millions
(i) Reconciliation of EBITDA:
EBITDA of Company and subsidiaries 22,690 20,735
Share of EBITDA of associated companies and joint venturesShare of profits less losses after tax:
Associated companies before profits on disposal of investments and others 5,036 5,225
Joint ventures 5,039 5,509 Associated companies’ profits on disposal of investments and
others 20,554 - Adjustment for:
Depreciation and amortisation 7,704 7,462 Change in fair value of investment properties - (27) Interest expenses and other finance costs 3,434 2,927 Current tax charge 4,240 3,298 Deferred tax charge (credit) (1,185) 511 Non-controlling interests 133 158
44,955 25,063
EBITDA (see notes 3(b) and 3(m)) 67,645 45,798
Six months ended 30 June
Six months ended 30 June
HWL 2014 Interim Results Page 45 of 55

12 Notes to condensed consolidated statement of cash flows (continued)
(b) Changes in working capital
2014 2013HK$ millions HK$ millions
Increase in inventories (318) (33) Decrease (increase) in debtors and prepayments 1,462 (1,362) Decrease in creditors (3,939) (2,052) Other non-cash items (813) (2,042)
(3,608) (5,489)
(c) Purchase of subsidiary companies
The following table summarises the consideration paid for acquisitions completed during the periods, and the amounts of the assets acquired and liabilities assumed recognised at the respective acquisition date.
2014 2013HK$ millions HK$ millions
Fair valueFixed assets - 1,653 Telecommunications licences - 440 Brand names and other rights - 4,297 Interests in joint ventures - 163 Deferred tax assets - 259 Other non-current assets - 6 Trade and other receivables - 973 Inventories - 980 Creditors and current tax liabilities - (1,605) Bank and other debts - (308) Deferred tax liabilities - (489) Other non-current liabilities - (292) Non-controlling interests - (2)
- 6,075 Goodwill arising on acquisition - 11,424 Discharged by cash payment - 17,499
Net cash outflow (inflow) arising from acquisition:Cash payment - 19,018 Cash and cash equivalents acquired - (1,519) Total net cash paid - 17,499
Amounts disclosed for the comparative period mainly related to the acquisition of Orange Austria. The assets acquired and liabilities assumed are recognised at the acquisition date fair value and are recorded at the consolidation level. No fair value adjustments arising from acquisitions are recognised at the underlying companies’ separate financial statements. Goodwill arising on these acquisitions is recorded at the consolidation level and is not expected to be deductible for tax purposes. The contribution to the Group’s revenue and profit after tax for thecomparative period from these subsidiaries acquired since the respective date of acquisition is not material.
Six months ended 30 June
Six months ended 30 June
HWL 2014 Interim Results Page 46 of 55

12 Notes to condensed consolidated statement of cash flows (continued)
(d) Disposal of subsidiary companies 2014 2013
HK$ millions HK$ millionsAggregate net assets disposed at date of disposal
(excluding cash and cash equivalents):Investment properties - 109
- 109 Profit on disposal * - 411
- 520
Satisfied by: Cash and cash equivalents received as consideration - 520
* The profit on disposal for the six months ended 30 June 2013 are recognised in the consolidated income statement and are included in the line item titled other operating expenses.
The effect on the Group’s results from the subsidiaries disposed is not material for the six months ended 30 June 2013.
13 Share capital
In accordance with the transitional provisions set out in section 37 of Schedule 11 to the Hong Kong Companies Ordinance (Cap. 622), on 3 March 2014, the amounts standing to the credit of the share premium account and capital redemption reserve created under the sections 48B and 49H of the predecessor Companies Ordinance (Cap. 32) have become part of the Company’s share capital.
Six months ended 30 June
HWL 2014 Interim Results Page 47 of 55

Group Capital Resources and Liquidity
Treasury Management
The Group’s treasury function sets financial risk management policies in accordance with policies and procedures that are approved by the Executive Directors, and which are also subject to periodic review by the Group’s internal audit function. The Group’s treasury policies are designed to mitigate the impact of fluctuations in interest rates and exchange rates on the Group’s overall financial position and to minimise the Group’s financial risks. The Group’s treasury function operates as a centralised service for managing financial risks, including interest rate and foreign exchange risks, and for providing cost-efficient funding to the Group and its companies. It manages the majority of the Group’s funding needs, interest rate, foreign currency and credit risk exposures. It is the Group’s policy not to have credit rating triggers that would accelerate the maturity dates of the Group’s borrowings. The Group uses interest rate and foreign currency swaps and forward contracts as appropriate for risk management purposes only, for hedging transactions and for managing the Group’s assets and liabilities. It is the Group’s policy not to enter into derivative transactions for speculative purposes. It is also the Group’s policy not to invest liquidity in financial products, including hedge funds or similar vehicles, with significant underlying leverage or derivative exposure.
Cash Management and Funding
The Group operates a central cash management system for all of its unlisted subsidiaries. Except for listed and certain overseas entities conducting businesses in non-HK or non-US dollar currencies, the Group generally obtains long-term financing at the Group level to on-lend or contribute as equity to its subsidiaries and associates to meet their funding requirements and provide more cost-efficient financing. These borrowings include a range of capital market issues and bank borrowings, for which the proportions will change depending upon financial market conditions and projected interest rates. The Group regularly and closely monitors its overall debt position and reviews its funding costs and maturity profile to facilitate refinancing.
Interest Rate Exposure
The Group manages its interest rate exposure with a focus on reducing the Group’s overall cost of debt and exposure to changes in interest rates. When considered appropriate, the Group uses derivatives such as interest rate swaps and forward rate agreements to manage its interest rate exposure. The Group’s main interest rate exposure relates to US dollar, British Pound, Euro and HK dollar borrowings.
At 30 June 2014, approximately 36% of the Group’s total principal amount of bank and other debts were at floating rates and the remaining 64% were at fixed rates. The Group has entered into various interest rate agreements with major financial institution counterparties to swap approximately HK$51,030 million principal amount of fixed interest rate borrowings to effectively become floating interest rate borrowings. In addition, HK$6,801 million principal amount of floating interest rate borrowings were swapped to fixed interest rate borrowings. After taking into consideration these interest rate swaps, approximately 55% of the Group’s total principal amount of bank and other debts were at floating rates and the remaining 45% were at fixed rates at 30 June 2014. All of the aforementioned interest rate derivatives are designated as hedges and these hedges are considered highly effective.
Foreign Currency Exposure
For overseas subsidiaries, associates and other investments, which consist of non-HK dollar or non-US dollar assets, the Group generally endeavours to establish a natural hedge for debt financing with an appropriate level of borrowings in those same currencies. For overseas businesses that are in the development phase, or where borrowings in local currency are not or are no longer attractive, the Group may not borrow in the local currency or may repay existing borrowings and monitor the development of the businesses’ cashflow and the relevant debt markets with a view to refinance these businesses with local currency borrowings in the future when conditions are more appropriate. Exposure to movements in exchange rates for individual transactions (such as major procurement contracts) directly related to the underlying businesses is minimised by using forward foreign exchange contracts and currency swaps where active markets for the relevant currencies exist. The Group generally does not enter into foreign currency hedges in respect of its long-term equity investments in overseas subsidiaries and associates. During the period, the currencies of certain countries where the Group has overseas operations, including Euro, British Pound, the Canadian and Australian dollars as well as Renminbi in the Mainland, fluctuated against the Hong Kong dollar. This gave rise to an unrealised gain of approximately HK$3,082 million (30 June 2013 – loss of HK$12,451 million) on translation of these operations’ net assets to the Group’s Hong Kong dollar reporting currency, including the Group’s share of the translation gains and losses of associated companies and joint ventures. This unrealised gain is reflected as a movement in the Consolidated Statement of Changes in Equity under the heading of Other Reserves.
At 30 June 2014, the Group had currency swap arrangements with banks to swap US dollar principal amount of borrowings equivalent to HK$16,968 million to Hong Kong dollar principal amount of borrowings to match the currency exposures of the underlying businesses. The Group’s total principal amount of bank and other debts, after the above swaps, are denominated as follows: 36% in Euro, 32% in US dollars, 18% in HK dollars, 7% in British Pounds and 7% in other currencies.
HWL 2014 Interim Results Page 48 of 55

Credit Exposure
The Group’s holdings of cash, managed funds and other liquid investments, and interest rate and foreign currency swaps and forward currency contracts with financial institutions expose the Group to credit risk of counterparties. The Group controls its credit risk to non-performance by its counterparties through monitoring their equity share price movements and credit ratings as well as setting approved counterparty credit limits that are regularly reviewed.
The Group is also exposed to counterparties credit risk from its operating activities, which is continuously monitored by the local operational management.
Credit Profile
The Group aims to maintain a capital structure that is appropriate for long-term investment grade ratings of A3 on the Moody’s Investor Service scale, A- on the Standard & Poor’s Rating Services scale and A- on the Fitch Ratings scale. Actual credit ratings may depart from these levels from time to time due to economic circumstances. At 30 June 2014, our long-term credit ratings were A3 from Moody’s, A- from Standard & Poor’s and A- from Fitch, with all three agencies maintaining stable outlooks on the Group’s ratings.
Market Price Risk
The Group’s main market price risk exposures relate to listed/traded debt and equity securities described in “Liquid Assets” below and the interest rate swaps as described in “Interest Rate Exposure” above. The Group’s holding of listed/traded debt and equity securities represented approximately 15% (31 December 2013 – approximately 16%) of the cash, liquid funds and other listed investments (“liquid assets”). The Group controls this risk through active monitoring of price movements and changes in market conditions that may have an impact on the value of these financial assets and instruments.
Liquid Assets
The Group continues to maintain a robust financial position. Liquid assets amounted to HK$120,824 million at 30 June 2014, an increase of 18% from the balance of HK$102,787 million at 31 December 2013, mainly reflecting net cash proceeds of HK$13,853 million, after special dividend of HK$7.00 per share amounting to HK$29,843 million, from Temasek’s acquisition of a 24.95% equity interest in A.S. Watson Holdings Limited during the period, the cash arising from positive funds from operations from the Group’s businesses and cash from new borrowings, net of utilisation of cash for the redemption of perpetual capital securities issued in 2012 of US$300 million (approximately HK$2,340 million) by listed subsidiary, CKI, dividend payments to ordinary and non-controlling shareholders as well as distributions to perpetual capital securities holders, the repayment and early repayment of certain borrowings and the acquisition of fixed assets. Liquid assets were denominated as to 16% in HK dollars, 41% in US dollars, 12% in Renminbi, 15% in Euro, 4% in British Pounds and 12% in other currencies.
Cash and cash equivalents represented 85% (31 December 2013 – 84%) of the liquid assets, US Treasury notes and listed/traded debt securities 6% (31 December 2013 – 8%) and listed equity securities 9% (31 December 2013 – 8%).
The US Treasury notes and listed/traded debt securities, including those held under managed funds, consisted of US Treasury notes of 38%, government and government guaranteed notes of 25%, notes issued by the Group’s associated company, Husky Energy of 3%, notes issued by financial institutions of 3%, and others of 31%. Of these US Treasury notes and listed/traded debt securities, 59% are rated at Aaa/AAA or Aa1/AA+ with an average maturity of 3.3 years on the overall portfolio. The Group has no exposure in mortgage-backed securities, collateralised debt obligations or similar asset classes.
HWL 2014 Interim Results Page 49 of 55

Cash Flow
Consolidated EBITDA1 amounted to HK$67,645 million, an increase of 48% compared to HK$45,798 million for the same period last year which included the share of gain arising of HK$20,554 million from Power Asset Holdings Limited’s separate listing of its Hong Kong electricity business in January 2014. Consolidated funds from operations (“FFO”) before cash profits from disposals, capital expenditures, investments and changes in working capital amounts to HK$24,750 million, a 7% increase compared to same period last year mainly due to higher EBITDA contributions by the Group’s subsidiaries, in particular 3 Group Europe, partly offset by a decrease in dividends and distributions received from associated companies and joint ventures.
The Group’s capital expenditures decreased 27% to total HK$8,063 million during the first half of 2014 (30 June 2013 – HK$11,067 million), primarily due to lower capital expenditures for the acquisition of telecommunications licences in Europe, together with lower capital expenditures for the acquisition of fixed assets, particularly for the ports and related services division. Capital expenditures on fixed assets for the ports and related services division amounted to HK$1,002 million (30 June 2013 – HK$1,799 million); for the property and hotels division HK$36 million (30 June 2013 – HK$247 million); for the retail division2 HK$720 million (30 June 2013 – HK$720 million); for CKI HK$221 million (30 June 2013 – HK$173 million); for 3 Group Europe HK$4,749 million (30 June 2013 – HK$4,154 million); for HTHKH HK$420 million (30 June 2013 – HK$562 million); for HAT HK$646 million (30 June 2013 – HK$608 million); and for the finance and investments and others segment2 HK$93 million (30 June 2013 – HK$98 million). Capital expenditures for licences, brand names and other rights were HK$1 million (30 June 2013 – HK$1 million) for the ports and related services division; for CKI HK$12 million (30 June 2013 – nil); 3 Group Europe HK$131 million (30 June 2013 – HK$2,687 million); and for HTHKH HK$32 million (30 June 2013 – HK$18 million).
During the first half of 2014, no major acquisitions of new investments were carried out by the Group compared to the first half of 2013 for which the Group had spent HK$17,499 million on the acquisition of new investments which included the acquisition of Orange Austria as well as Enviro Waste in New Zealand.
Purchases of and advances to (including deposits from) associated companies and joint ventures, net of repayments from associated companies and joint ventures, resulted in a net cash outflow of HK$1,177 million (30 June 2013 – net cash inflow of HK$3,988 million). This is mainly due to lower repayments from associated companies and joint ventures and higher advances to property joint ventures in the first six months of 2014, which reflects the tightening of monetary policies in the Mainland resulting in the need for short-term cash retention by property joint ventures for construction purposes.
The capital expenditures and investments of the Group are primarily funded by cash generated from continued operations, cash on hand and to the extent appropriate, by external borrowings.
For further information of the Group’s capital expenditures by divisions and cash flow, please see Note 3(e) and the “Consolidated Statement of Cash flows” section of this Interim Report.
Debt Maturity and Currency Profile
The Group’s total principal amount of bank and other debts at 30 June 2014 increased 2% to total HK$229,031 million (31 December 2013 – HK$223,822 million), of which 65% (31 December 2013 – 70%) are notes and bonds and 35% (31 December 2013 – 30%) are bank and other loans. The net increase in principal amount of bank and other debts was primarily due to new borrowings of HK$21,401 million and the unfavourable impact of HK$563 million upon translation of foreign currency-denominated loans to Hong Kong dollars, partially offset by the repayment of debts as they matured as well as the early repayment of certain debts totalling HK$16,931 million. The Group’s weighted average cost of debt at 30 June 2014 increased slightly by 0.1%-points to 3.2% (31 December 2013 – 3.1%). Interest bearing loans from non-controlling shareholders, which are viewed as quasi-equity, totalled HK$5,400 million at 30 June 2014 (31 December 2013 – HK$5,445 million).
1 EBITDA includes the non-controlling interests' share of HPH Trust's EBITDA. 2 The Marionnaud business has been excluded from the retail division for the six months ended 30 June 2014 and 2013, and included under “Others” following the Group’s
strategic review of the retail division in 2013.
HWL 2014 Interim Results Page 50 of 55

The maturity profile of the Group’s total principal amount of bank and other debts at 30 June 2014 is set out below:
HK$ US$ Euro GBP Others Total
In remainder of 2014 1% 1% - 1% - 3%
In 2015 14% - 8% 2% 4% 28%
In 2016 - 1% 13% - - 14%
In 2017 2% 10% 11% 2% 1% 26%
In 2018 1% - 1% - 1% 3%
In 2019 - 2023 - 15% 3% - 1% 19%
In 2024 - 2033 - 5% - 2% - 7%
Beyond 2033 - - - - - -
Total 18% 32% 36% 7% 7% 100%
The non-HK dollar and non-US dollar denominated loans are either directly related to the Group’s businesses in the countries of the currencies concerned, or the loans are balanced by assets in the same currencies. None of the Group’s consolidated borrowings have credit rating triggers that would accelerate the maturity dates of any outstanding consolidated Group debt.
Changes in Debt Financing
The significant financing activities in the first half of 2014 were as follows:
• In January, repaid US$1,309 million (approximately HK$10,206 million) principal amount of fixed rate notes on maturity;
• In February, prepaid HK$800 million of a floating rate term loan facility of HK$2,800 million maturing in November 2014;
• In March, obtained a five-year floating rate loan facility of US$130 million (approximately HK$1,014 million);
• In April, prepaid €100 million (approximately HK$1,055 million) of a floating rate term loan facility of €240 million maturing in July 2015;
• In April and June, prepaid a total of SEK2,500 million (approximately HK$2,925 million) of a floating rate term loan facility of SEK10,000 million maturing in July 2015;
• In April, obtained a five-year floating rate loan facility of SEK1,786 million (approximately HK$2,108 million);
• In May, obtained a three-year floating rate loan facility of HK$3,296 million;
• In May, obtained a three-year floating rate loan facility of €1,113 million (approximately HK$11,738 million);
• In May, listed subsidiary CKI obtained a three-year floating rate term loan facility of AUD705 million (approximately HK$5,139 million); and
• In June, listed subsidiary CKI issued three-year floating rate notes of US$300 million (approximately HK$2,340 million).
HWL 2014 Interim Results Page 51 of 55

Capital, Net Debt and Interest Coverage Ratios
The Group’s total ordinary shareholders’ funds and perpetual capital securities increased 8% to HK$459,039 million at 30 June 2014, compared to HK$426,609 million at 31 December 2013, reflecting the profits for the first half of 2014, an increase of HK$39,026 million in relation to Temasek’s acquisition of a 24.95% equity interest in A.S. Watson Holdings Limited during the period, as well as net exchange gains on translation of the Group’s overseas operations’ net assets to the Group’s Hong Kong dollar reporting currency including the Group’s share of the translation gains and losses of associated companies and joint ventures, partly offset by a special dividend of HK$29,843 million paid following Temasek’s acquisition, 2013 final dividend and distributions paid and other items recognised directly in reserves. At 30 June 2014, the consolidated net debt of the Group, excluding interest bearing loans from non-controlling shareholders which are viewed as quasi-equity, unamortised loan facilities fees and premiums or discounts on issue and fair value changes of interest rate swap contracts, was HK$108,207 million (31 December 2013 – HK$121,035 million), a reduction of 11% compared to the net debt at the beginning of the year. The Group’s net debt to net total capital ratio at 30 June 2014 reduced to 17.1% (31 December 2013 – 20.0%). The Group’s consolidated cash and liquid investments as at 30 June 2014 were sufficient to repay all outstanding consolidated Group debt maturing through 2016 and approximately 32% of the maturities in 2017.
The following table shows the net debt to net total capital ratio calculated on the basis of including interest bearing loans from non-controlling shareholders and also with the Group’s investments in its listed subsidiaries and associated companies marked to market value at 30 June 2014. The net debt to net total capital ratio can be significantly affected by foreign currency translation effects on total ordinary shareholders’ funds and perpetual capital securities and on debt balances. The ratios as at 30 June 2014 before and after the effect of foreign currency translation and other non-cash movements for the period are shown below:
Before the effect of After the effect of foreign currency foreign currency translation and translation and other non-cash other non-cash Net debt/Net total capital ratios at 30 June 2014: movements movements
A1: excluding interest bearing loans from non-controlling shareholders from debt 17.1% 17.1%
A2: as in A1 above and investments in listed subsidiaries and associated companies marked to market value 15.7% 15.8%
B1: including interest bearing loans from non-controlling shareholders as debt 17.9% 18.0%
B2: as in B1 above and investments in listed subsidiaries and associated companies marked to market value 16.5% 16.5%
The Group’s consolidated gross interest expenses and other finance costs of subsidiaries, before capitalisation, decreased 10% in the first half of 2014 to total HK$3,953 million, compared to HK$4,407 million in the same period last year, mainly due to lower average borrowings during the period.
Consolidated EBITDA of HK$67,645 million and FFO of HK$24,750 million for the period covered consolidated net interest expenses and other finance costs 29.8 times and 12.0 times respectively (31 December 2013 – 17.9 times and 10.2 times).
Secured Financing
At 30 June 2014, assets of the Group totalling HK$2,357 million (31 December 2013 – HK$2,299 million) were pledged as security for bank and other debts.
Borrowing Facilities Available
Committed borrowing facilities available to Group companies but not drawn at 30 June 2014 amounted to the equivalent of HK$8,864 million (31 December 2013 – HK$4,479 million).
Contingent Liabilities
At 30 June 2014, the Group provided guarantees in respect of bank and other borrowing facilities to its associated companies and joint ventures totalling HK$24,765 million (31 December 2013 – HK$24,610 million), of which HK$23,056 million (31 December 2013 – HK$22,839 million) has been drawn down as at 30 June 2014, and also provided performance and other guarantees of HK$4,187 million (31 December 2013 – HK$4,131 million).
HWL 2014 Interim Results Page 52 of 55

PURCHASE, SALE OR REDEMPTION OF SHARES
During the six months ended 30 June 2014, neither the Company nor any of its subsidiaries has purchased or sold any of the Company’s ordinary shares. In addition, the Company has not redeemed any of its ordinary shares during the period.
COMPLIANCE WITH THE CORPORATE GOVERNANCE CODE
The Company strives to attain and maintain high standards of corporate governance best suited to the needs and interests of the Group as it believes that effective corporate governance practices are fundamental to safeguarding interests of shareholders and other stakeholders and enhancing shareholder value.
The Company has complied throughout the six months ended 30 June 2014 with all code provisions of the Corporate Governance Code contained in Appendix 14 of the Rules Governing the Listing of Securities on The Stock Exchange of Hong Kong Limited (the “Listing Rules”), other than those in respect of the nomination committee. The Company has considered the merits of establishing a nomination committee but is of the view that it is in the best interests of the Company that the Board collectively reviews, deliberates on and approves the structure, size and composition of the Board as well as the appointment of any new Director, as and when appropriate. The Board is tasked with ensuring that it has a balanced composition of skills and experience appropriate for the requirements of the business of the Group and that appropriate individuals with the relevant expertise and leadership qualities are appointed to the Board to complement the capabilities of the existing Directors. In addition, the Board as a whole is also responsible for reviewing the succession plan for Directors, including the Chairman of the Board and the Group Managing Director.
COMPLIANCE WITH THE MODEL CODE FOR SECURITIES TRANSACTIONS BY DIRECTORS OF THE COMPANY
The Board has adopted its own Model Code for Securities Transactions by Directors (the “HWL Securities Code”) regulating Directors’ dealings in securities (Group and otherwise), on terms no less exacting than the required standard of the Model Code for Securities Transactions by Directors of Listed Issuers set out in Appendix 10 of the Listing Rules. The HWL Securities Code has been updated to reflect the recent amendments to the Listing Rules which took effect in July 2014. In response to specific enquiries made, all Directors have confirmed that they have complied with the HWL Securities Code in their securities transactions throughout the six months ended 30 June 2014.
REVIEW OF ACCOUNTS
The unaudited condensed consolidated accounts of the Company and its subsidiary companies for the six months ended 30 June 2014 have been reviewed by the Company’s auditor, PricewaterhouseCoopers, in accordance with Hong Kong Standard on Review Engagements 2410, “Review of Interim Financial Information Performed by the Independent Auditor of the Entity” issued by the Hong Kong Institute of Certified Public Accountants. The auditor’s independent review report will be included in the Interim Report to shareholders. The unaudited condensed consolidated accounts of the Company and its subsidiary companies for the six months ended 30 June 2014 have also been reviewed by the Audit Committee of the Company.
RECORD DATE FOR INTERIM DIVIDEND The record date for the purpose of determining shareholders’ entitlement to the interim dividend is Friday, 29 August 2014.
In order to qualify for the interim dividend payable on Wednesday, 10 September 2014, all transfers, accompanied by the relevant share certificates, must be lodged with the Company’s Share Registrar (Computershare Hong Kong Investor Services Limited at Rooms 1712-1716, 17th Floor, Hopewell Centre, 183 Queen’s Road East, Wanchai, Hong Kong) for registration no later than 4:30 pm on Friday, 29 August 2014.
CORPORATE STRATEGY
The primary objective of the Company is to enhance long-term total return for our shareholders. To achieve this objective, the Group’s strategy is to place equal emphasis on achieving sustainable recurring earnings growth and maintaining the Group’s strong financial profile. The Chairman’s Statement and the Operations Highlights contain discussions and analyses of the Group’s performance and the basis on which the Group generates or preserves value over the longer term and the basis on which the Group will execute its strategy for delivering the Group’s objective.
PAST PERFORMANCE AND FORWARD LOOKING STATEMENTS
The performance and the results of operations of the Group contained within the 2014 Interim Report are historical in nature, and past performance is no guarantee of the future results of the Group. Any forward-looking statements and opinions contained within the 2014 Interim Report are based on current plans, estimates and projections, and therefore involve risks and uncertainties. Actual results may differ materially from expectations discussed in such forward-looking statements and opinions. The Group, the Directors, employees and agents of the Group assume (a) no obligation to correct or update the forward-looking statements or opinions contained in the 2014 Interim Report; and (b) no liability in the event that any of the forward-looking statements or opinions do not materialise or turn out to be incorrect.
HWL 2014 Interim Results Page 53 of 55

As at the date of this announcement, the Directors of the Company are:
Executive Directors: Mr LI Ka-shing (Chairman)
Mr LI Tzar Kuoi, Victor (Deputy Chairman)
Mr FOK Kin Ning, Canning
Mrs CHOW WOO Mo Fong, Susan
Mr Frank John SIXT
Mr LAI Kai Ming, Dominic
Mr KAM Hing Lam
Non-executive Directors:
Mr LEE Yeh Kwong, Charles
Mr George Colin MAGNUS
Independent Non-executive Directors: Mr CHENG Hoi Chuen, Vincent
The Hon Sir Michael David KADOORIE
Ms LEE Wai Mun, Rose
Mr William Elkin MOCATTA
(Alternate to The Hon Sir Michael David
Kadoorie)
Mr William SHURNIAK
Mr WONG Chung Hin
HWL 2014 Interim Results Page 54 of 55

Financial Performance Summary
Hutchison Whampoa Limited
2014 Interim Report
3
Forthe Forthe sixmonthsended sixmonthsended 30June2014 30June2013
HK$millions % HK$millions % Change%
TotalRevenue(1) Portsandrelatedservices 17,270 8% 16,891 9% 2% Hutchison Ports Group other than HPH Trust 15,920 8% 15,529 8% 3% HPH Trust (1) 1,350 — 1,362 1% -1% Propertyandhotels 7,462 4% 11,186 6% -33% Retail(2) 77,398 38% 71,258 36% 9% CheungKongInfrastructure 22,264 11% 20,133 10% 11% HuskyEnergy 28,660 14% 29,911 15% -4% 3GroupEurope 31,063 15% 30,101 15% 3% HutchisonTelecommunicationsHongKongHoldings 6,227 3% 6,149 3% 1% HutchisonAsiaTelecommunications 3,506 2% 2,981 1% 18% Finance&InvestmentsandOthers 10,635 5% 10,469 5% 2% Finance & Investments 1,169 — 1,035 — 13% Others (2) 9,466 5% 9,434 5% —
TotalReportedRevenue 204,485 100% 199,079 100% 3%
EBITDA(1)
Portsandrelatedservices 5,607 12% 5,410 12% 4% Hutchison Ports Group other than HPH Trust 4,905 10% 4,712 10% 4% HPH Trust (1) 702 2% 698 2% 1% Propertyandhotels 3,873 8% 5,918 13% -35% Retail(2) 6,611 14% 6,068 13% 9% CheungKongInfrastructure 11,819 25% 11,469 26% 3% HuskyEnergy 8,145 18% 7,991 18% 2% 3GroupEurope 6,504 14% 5,661 13% 15% HutchisonTelecommunicationsHongKongHoldings 1,230 3% 1,509 3% -18% HutchisonAsiaTelecommunications 502 1% (59) — 951% Finance&InvestmentsandOthers 2,521 5% 972 2% 159% Finance & Investments 2,013 4% 1,615 4% 25% Others (2) 508 1% (643) -2% 179%
ReportedEBITDAbeforeprofitsondisposalofinvestments&others andpropertyrevaluation 46,812 100% 44,939 100% 4%
EBIT(1)
Portsandrelatedservices 3,531 12% 3,449 12% 2% Hutchison Ports Group other than HPH Trust 3,127 10% 3,049 10% 3% HPH Trust (1) 404 2% 400 2% 1% Propertyandhotels 3,703 12% 5,742 19% -36% Retail(2) 5,336 17% 4,911 16% 9% CheungKongInfrastructure 8,945 29% 8,940 30% — HuskyEnergy 4,329 14% 4,152 14% 4% 3GroupEurope 2,282 7% 1,854 6% 23% HutchisonTelecommunicationsHongKongHoldings 538 2% 834 3% -35% HutchisonAsiaTelecommunications (76) — (697) -2% 89% Finance&InvestmentsandOthers 2,282 7% 703 2% 225% Finance & Investments 2,013 7% 1,615 5% 25% Others (2) 269 — (912) -3% 129%
ReportedEBITbeforeprofitsondisposalofinvestments&others andpropertyrevaluation 30,870 100% 29,888 100% 3%Interestexpensesandotherfinancecosts(1) (7,338) (7,262) -1%
Profitbeforetax 23,532 22,626 4%Tax(1)
–Currenttax (5,878) (5,223) -13% –Deferredtax 189 (1,794) 111%
(5,689) (7,017) 19%
Profitaftertax 17,843 15,609 14%Non-controllinginterestsandperpetualcapitalsecuritiesholders’interests (4,321) (3,599) -20%
Profitattributabletoordinaryshareholdersbeforeprofitsondisposalof investments&othersandpropertyrevaluation 13,522 12,010 13%Propertyrevaluation,aftertax — 32 -100%Profitsondisposalofinvestments&others,aftertax(3) 14,921 356 4,091%
Profitattributabletoordinaryshareholders 28,443 12,398 129%
Note1: Totalrevenue,earningsbeforeinterestexpensesandotherfinancecosts,tax,depreciationandamortisation(“EBITDA”)andearningsbeforeinterestexpensesandotherfinancecostsandtax(“EBIT”),interestexpensesandotherfinancecostsandtaxincludetheGroup’sproportionateshareofassociatedcompanies’andjointventures’respectiveitems.Totalrevenue,EBITDAandEBITwereadjustedtoexcludenon-controllinginterests’shareofresultsofHPHTrustforthesixmonthsended30June2014and2013.
Note2: TheMarionnaudbusinesseshasbeenexcludedfromtheretaildivisionforthesixmonthsended30June2014and2013,andincludedunder“Others”followingtheGroup’sstrategicreviewoftheretaildivisionin2013.
Note3: Profitsondisposalofinvestmentsandothers,aftertaxforthesixmonthsended30June2014whichcomprisestheGroup’sshareofthegainarisingfromPowerAssetsHoldingsLimited’sseparatelistingofitsHongKongelectricitybusinessofHK$16,066million,partlyoffsetbytheprovisionsofHK$652millionontheimpairmentofgoodwillandstoreclosuresoftheMarionnaudbusinessestoexitPolandanddown-sizeoperationsinPortugalandSpainandtheGroup’sshareofoperatinglossesofVodafoneHutchisonAustralia(“VHA”)ofHK$493millionforthefirsthalfof2014.The2013comparativecomprisestheone-timenetgainaftertaxofHK$958million,arisingfromthecompletionoftheOrangeAustriatransaction,partlyoffsetbytheGroup’sshareofoperatinglossesofVHAforthefirsthalfof2013ofHK$602million.
HWL 2014 Interim Results Page 55 of 55

2014 Interim ResultsOperations Analysis

Disclaimer
Potential investors and shareholders of the Company (the “Potential Investors and Shareholders”) are reminded that informationcontained in this Presentation comprises extracts of operational data and financial information of the Group. The informationincluded is solely for the use in this Presentation and certain information has not been independently verified. Norepresentations or warranties, expressed or implied, are made as to, and no reliance should be placed on, the fairness, accuracy,completeness or correctness of the information or opinions presented or contained in this Presentation. Potential Investors andShareholders should refer to the 2014 Interim Report for the unaudited results of the Company which are published inaccordance with the listing rules of the Stock Exchange of Hong Kong Limited.
The performance and the results of operations of the Group contained within this Presentation are historical in nature, and pastperformance is no guarantee of the future results of the Group. Any forward-looking statements and opinions contained withinthis Presentation are based on current plans, estimates and projections, and therefore involve risks and uncertainties. Actualresults may differ materially from expectations discussed in such forward-looking statements and opinions. The Group, theDirectors, employees and agents of the Group assume (a) no obligation to correct or update the forward-looking statements oropinions contained in this Presentation; and (b) no liability in the event that any of the forward-looking statements or opinionsdo not materialise or turn out to be incorrect.
Potential Investors and Shareholders should exercise caution when investing in or dealing in the securities of the Company.
2

Performance in 1H 2014
3
Note (1): Reported revenue, EBITDA and EBIT were adjusted to exclude non-controlling interests’ share of results of HPH Trust.
Note (2): Recurring earnings is before profits on disposal of investments and others and property revaluation, after tax. Profits on disposal of investments and others, after tax in 1H 2014 wereHK$14,921 million which comprises the Group’s share of the gain arising from Power Assets’ separate listing of its Hong Kong electricity businesses of HK$16,066 million, partly offset bythe provisions of HK$652 million on the impairment of goodwill and the store closures of the Marionnaud businesses to exit Poland and down-size operations in Portugal and Spain andthe Group’s share of operating losses of Vodafone Hutchison Australia’s (“VHA”) for 1H 2014 of HK$493 million. There were no property revaluation gains, after tax in 1H 2014. Profits ondisposal of investments and others, after tax in 1H 2013 were HK$356 million which comprises the one-time net gain of HK$958 million, arising from the completion of the Orange Austriatransaction, partly offset by the Group's share of operating losses of VHA for 1H 2013 of HK$602 million. Property revaluation gains, after tax for 1H 2013 totalled HK$32 million.
Reported Revenue(1) HK$204.5bn
Reported EBITDA(1) HK$46.8bn
Reported EBIT(1) HK$30.9bn
Reported Earnings HK$28.4bn
Recurring Earnings(2) HK$13.5bn
Reported Earnings per share HK$6.67
Recurring Earnings per share(2) HK$3.17
Interim Dividend per share HK$0.66
Special Dividend per share HK$7.00
+3%
+3%
+4%
+129%
+13%
+129%
+13%
+10%
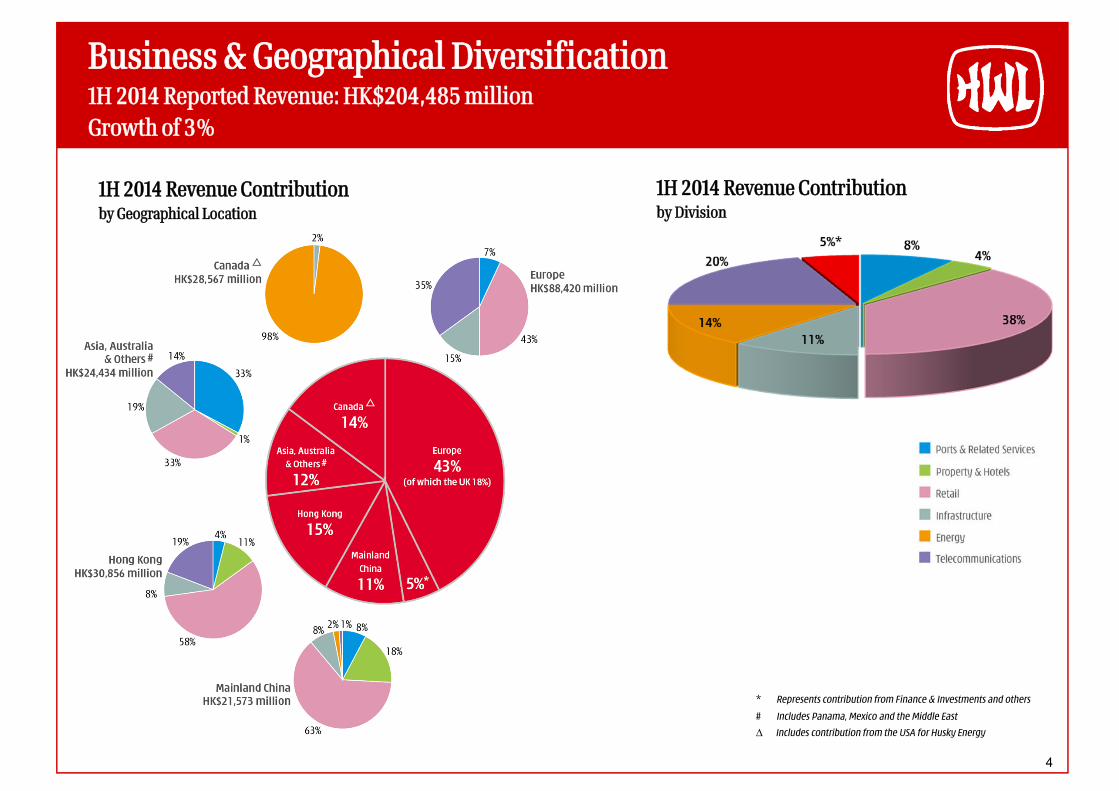
Business & Geographical Diversification 1H 2014 Reported Revenue: HK$204,485 millionGrowth of 3%
1H 2014 Revenue Contribution by Geographical Location
1H 2014 Revenue Contribution by Division
* Represents contribution from Finance & Investments and others
# Includes Panama, Mexico and the Middle East
∆ Includes contribution from the USA for Husky Energy
4

Business & Geographical Diversification 1H 2014 Reported EBITDA: HK$46,812 millionGrowth of 4%
1H 2014 EBITDA Contribution by Geographical Location
1H 2014 EBITDA Contribution by Division
* Represents contribution from Finance & Investments and others
# Includes Panama, Mexico and the Middle East
∆ Includes contribution from the USA for Husky Energy
5

Business & Geographical Diversification EBITDA Growth
6
1H 2014 Reported EBITDA(1) (HK$ millions)
Growth of 4%
Note (1): Reported EBITDA were adjusted to exclude non-controlling interests’ share of results of HPH Trust.
Note (2): Others includes Hutchison Whampoa (China), Hutchison E-Commerce, Hutchison Harbour Ring, Hutchison China MediTech, TOM Group, Hutchison Water, the Marionnaud business and corporateoverhead and expenses

Business & Geographical Diversification 1H 2014 Reported EBIT: HK$30,870 millionGrowth of 3%
1H 2014 EBIT Contribution by Geographical Location
1H 2014 EBIT Contribution by Division
* Represents contribution from Finance & Investments and others
# Includes Panama, Mexico and the Middle East
∆ Includes contribution from the USA for Husky Energy
7

Business & Geographical Diversification EBIT Growth
8
1H 2014 Reported EBIT(1) (HK$ millions)
Growth of 3%
Note (1): Reported EBITDA were adjusted to exclude non-controlling interests’ share of results of HPH Trust.
Note (2): Others includes Hutchison Whampoa (China), Hutchison E-Commerce, Hutchison Harbour Ring, Hutchison China MediTech, TOM Group, Hutchison Water, the Marionnaud business and corporateoverhead and expenses

EBIT - European growth by division (%)
EBITDA - European growth by division (%)
European ContributionRevenue, EBITDA & EBIT
Revenue - European growth by division (%)
# Includes Panama, Mexico and the Middle East
∆ Includes contribution from the USA for Husky Energy
1H 2014 Total Revenue 1H 2014 EBITDA 1H 2014 EBITHK$ billions Change (%)
Europe 88.4 +10%
Non-Europe(1) 116.1 -2%
Total HWL 204.5 +3%
HK$ billions Change (%)
Europe 19.0 +17%
Non-Europe(1) 27.8 -3%
Total HWL 46.8 +4%
HK$ billions Change (%)
Europe 11.9 +18%
Non-Europe(1) 19.0 -4%
Total HWL 30.9 +3%
9
Note (1): Includes Finance & Investments and Others

Ports and Related Services8% of Group Revenue, 12% of Group EBITDA & 12% of Group EBIT
Throughput increased 5% to 39.6 million TEU in 1H 2014 when compared to the same period lastyear, reflecting stable market recovery in all segments of this division.
EBITDA was up 4% against the same period last year mainly due to the strong performances ofthe Europe segment and the Mainland China and other Hong Kong segment, partly offset by theeffect of start-up losses of the Australian ports, lower contributions from Mexico and Indonesia,as well as a lower share of EBITDA in Malaysia as the Group’s share of results decreased from31.45% to 23.55% subsequent to the IPO of Westports Holdings Bhd. in October 2013.
EBIT increased by 2% in 1H 2014. The growth in EBIT was lower mainly due to higherdepreciation charges of HK$114 million on new facilities in Mexico and Panama and the newlyopened ports at Barcelona in Spain and Brisbane and Sydney in Australia.
282 operating berths at the end of 1H 2014, a net increase of 4 operating berths. In 1H 2014, 6new berths commenced operations, with the opening of additional berths in Brisbane, Australia(1), Westports, Malaysia (2) and Sohar, Oman (3). 2 berths of the existing terminal in Omanceased operations and will be returned to the Port Authority as the operations will be fullymigrated to the new 3-berth terminal in 2H 2014.
In March 2014, HPH Trust divested 60% of its equity interest in Asia Container Terminals (“ACTHK”) to the newly established joint venture with COSCO Pacific (40%) and China Shipping Group(20%). HPH Trust currently owns an effective interest of 40% in ACT HK.
1H 2014HK$ millions
1H 2013HK$ millions
ChangeChange in
local currencyTotal Revenue(1) 17,270 16,891 +2% +2%EBITDA(1) 5,607 5,410 +4% +3%EBIT(1) 3,531 3,449 +2% +2%Throughput 39.6 million TEU 37.9 million TEU +5% NA
Note (1): Total revenue, EBITDA and EBIT were adjusted to exclude non-controlling interests’ share of results of HPH Trust.
Note (2): Includes Panama, Mexico and the Middle East
Total Container Throughput (+5%)by Subdivision
10

Ports and Related Services
Outlook
Number of operating berths is expected toincrease to 284 by the end of 2014 with theopening of 2 additional berths in Dammam, SaudiArabia.
The division is expected to grow volumes in 2H2014 and will continue to focus on productivitygains, cost efficiency and selective acquisition anddevelopment opportunities to enhanceprofitability.
Note (1): Includes Panama, Mexico and the Middle East
Total Revenue (+2%)by Subdivision
EBITDA (+4%)by Subdivision
11

Ports and Related ServicesEBITDA Growth
1H 2014 Reported EBITDA(1) (HK$ millions)
Growth of 4%
12
Note (1): Reported EBITDA were adjusted to exclude non-controlling interests’ share of results of HPH Trust.
Note (2): Includes Panama, Mexico and the Middle East

Property and Hotels4% of Group Revenue, 8% of Group EBITDA & 12% of Group EBIT
Investment Properties Overall gross rental income, including share of rental income from the commercial
properties of our hotel division, was 7% higher than 1H 2013 at HK$2,208 million mostlydue to the continuing trend of rising rental renewal rates and improvements inoccupancy levels.
Attributable 11.8 million sq.ft. Gross Floor Area (“GFA”) portfolio of rental properties inHong Kong and attributable 1.6 million sq.ft. GFA portfolio in the Mainland and overseas.
The Group’s investment properties generated 9.1% yield on carrying value ofapproximately HK$48,400 million.
Investment properties average occupancy rate at 95%, up from 94% for the same periodlast year.
Hotels The Group has an average effective interest(2) of approximately 63% in the 8,503 total
rooms of the 11 hotels mainly in Hong Kong (an attributable share of GFA ofapproximately 1.9 million sq.ft. in Hong Kong).
Attributable hotel operating profit (“HOP”)(3) per sq.ft. for Hong Kong hotels ranges fromHK$13 per sq. ft. per month to HK$70 per sq.ft. per month and averages HK$36 per sq. ft.per month.
Total average hotel rooms occupancy rate at 94% in Hong Kong. The Group’s attributable interest in the hotels in Hong Kong generated 19.1% annualised
EBIT yield on its attributable carrying value of these hotels of approximately HK$3,678million.
Note (1): Includes net service income, corporate overheads, impact of foreign exchange rate movements and others
Note (2): Based on room numbers
Note (3): HOP represents EBITDA after depreciation of furniture, fixtures and equipment
1H 2014HK$ millions
1H 2013HK$ millions
ChangeChange in
local currencyTotal Revenue 7,462 11,186 -33% -33%EBITDA 3,873 5,918 -35% -34%EBIT 3,703 5,742 -36% -35%
Total Revenue (-33%)by Subdivision
EBITDA (-35%)by Subdivision
13
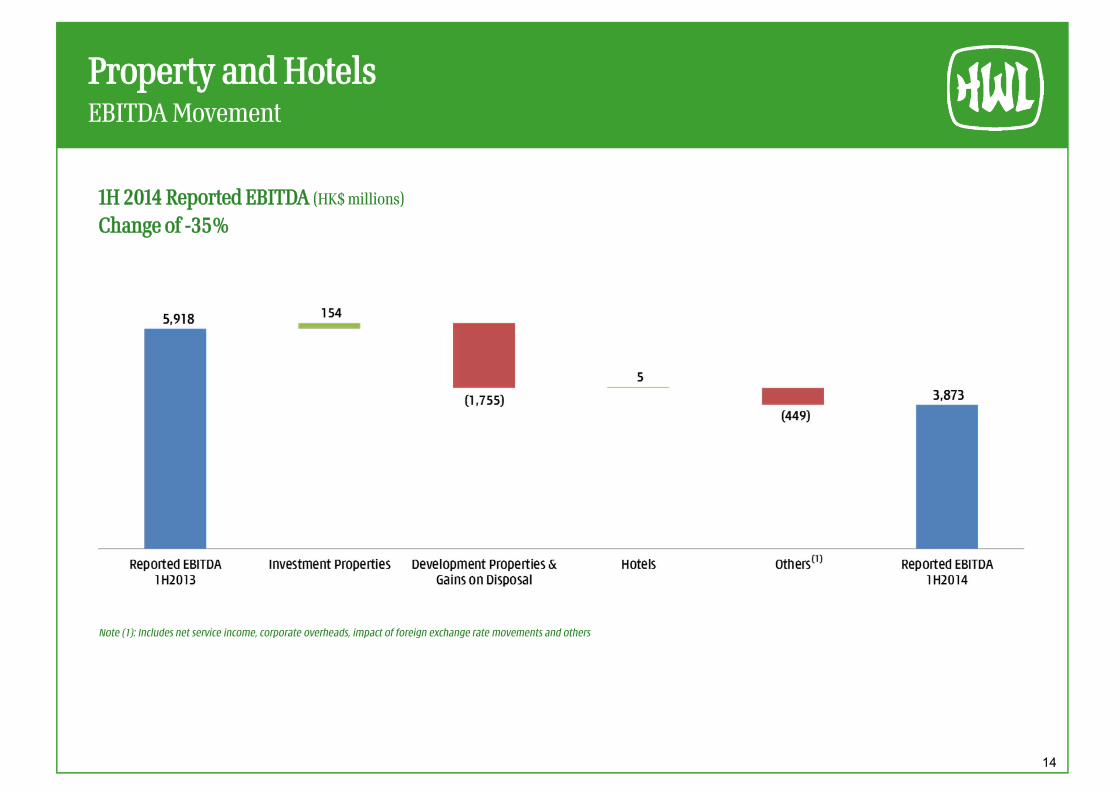
Property and HotelsEBITDA Movement
14
1H 2014 Reported EBITDA (HK$ millions)
Change of -35%
Note (1): Includes net service income, corporate overheads, impact of foreign exchange rate movements and others

Property and Hotels
Development Activities Attributable landbank of approximately 80 million sq.ft., comprising 41 projects in 22
cities. Average land cost of attributable landbank in the Mainland is approximatelyRMB235 per sq.ft. or HK$291 per sq.ft.
Average land cost relating to the recognised sale of residential properties in 1H 2014 inthe Mainland is approximately HK$273 per sq.ft. Average construction cost and averageprofessional, marketing, funding and other costs are approximately HK$493 per sq.ft.and HK$367 per sq.ft. respectively for residential properties.
Completed an attributable share of GFA of approximately 2.9 million sq.ft. in residentialand commercial properties in the Mainland during 1H 2014.
The lower contribution of this segment in 1H 2014 reflects the slower sales experiencedin the Mainland, particularly in Tier 1 and Tier 2 cities that have been significantlyaffected by local purchase and pricing restrictions, and which represented over 90% ofthe division’s recognised sales in terms of GFA. Average selling price (“ASP”) from therecognised sales of residential property increased 25% to HK$1,774 per sq.ft. in 1H2014, reflecting the division’s pricing strategy on prime location products.
The overall gross margin after land appreciation tax (“LAT”) for the period wasapproximately 34%, an increase compared to the 31% for the comparable period lastyear.
Outlook In July 2014, the Group completed the disposal of its interests in the Shanghai Oriental
Financial Center and generated an after tax gain of approximately HK$1,800 million. The Group expects to complete an attributable share of approximately 5.1 million sq.ft.
in GFA of residential and commercial properties during 2H 2014 primarily in 11Mainland cities and in Singapore.
The Group is targeting full year contracted sales of over 7,200 residential units as wellas the disposal of a number of commercial properties primarily in the Mainland. A totalattributable share of over 5.8 million sq.ft. of GFA (which includes an attributable shareof 0.4 million sq.ft. commercial properties) is expected to be sold in 17 cities in theMainland as well as in Singapore and the UK for full year 2014.
Gross Floor Area ofDevelopment Projectsby Geographical Location
Gross Floor Area ofDevelopment Projectsby Property Type
15

Property and Hotels
Development Properties - Mainland China Residential Property SalesBy Geographical Location
1H 2014 1H 2013 % Change
Total Attributable Sales Value (HK$ millions)
Recognised Sales(1) 2,926 5,786 -49%- of which relates to residential property 2,685 3,883 -31%
ASP(2) of residential property (HK$/sq.ft.) 1,774 1,420 +25%Contracted Sales(1) 3,258 6,983 -53%- of which relates to residential property 2,713 5,395 -50%
ASP(2)of residential property (HK$/sq.ft.) 1,959 1,701 +15%
Total Attributable Sales in GFA (‘000 sq.ft.)
Presold Property b/f 1,558 2,321
Recognised Sales in GFA 1,665 3,369 -51%- of which relates to residential property 1,606 2,909 -45%
Contracted Sales in GFA 1,637 3,757 -56%- of which relates to residential property 1,469 3,373 -56%
Presold Property c/f(3) 1,530 2,709
Note (1): Net of business tax
Note (2): ASP is stated inclusive of business tax
Note (3): Presold property value (net of business tax) of HK$3,360 million and HK$4,248 million at the end of 1H 2014 and 1H 2013 respectively
16Shanghai Chengdu Guangdong Province Qingdao Chongqing Xian Changchun Wuhan Nanjing Others

Retail 38% of Group Revenue, 14% of Group EBITDA & 17% of Group EBIT
1H 2014HK$ millions
1H 2013(1)
HK$ millionsChange
Change in local currency
Total Revenue 77,398 71,258 +9% +7%EBITDA 6,611 6,068 +9% +8%EBIT 5,336 4,911 +9% +8%Total Store Numbers 10,812 10,004 +8% NA
Store NumbersComparable Store Sales Growth(3) (%)
1H 2014Stores
1H 2013Stores
Change 1H 2014 1H 2013
Health & Beauty China 1,799 1,524 +18% +4.3% +1.4%Health & Beauty Asia 1,838 1,741 +6% +3.9% +6.0%Health & Beauty Western Europe 4,758 4,601 +3% +3.0% +3.5%Health & Beauty Eastern Europe 1,874 1,621 +16% +2.8% +4.1%Health & Beauty Subtotal 10,269 9,487 +8% +3.3% +3.8%Other Retail(2) 543 517 +5% -0.9% +1.2%Total Retail 10,812 10,004 +8% +2.3% +3.2%
- Asia 4,180 3,782 +11% +1.6% +2.7%- Europe 6,632 6,222 +7% +2.9% +3.6%
Total Revenue
1H 2014HK$ millions
1H 2013(1)
HK$ millionsChange
Change in local
currencyHealth & Beauty China 9,840 8,653 +14% +14%Health & Beauty Asia 10,344 9,785 +6% +9%Health & Beauty Western Europe 31,063 27,722 +12% +6%Health & Beauty Eastern Europe 7,121 6,320 +13% +14%Health & Beauty Subtotal 58,368 52,480 +11% +9%Other Retail(2) 19,030 18,778 +1% +1%Total Retail 77,398 71,258 +9% +7%
- Asia 39,214 37,179 +5% +6%- Europe 38,184 34,079 +12% +7%
Note (1): 1H 2013 results exclude Marionnaud results inthe comparatives as the business is no longerreported under this division following theGroup’s strategic review of its retail division in2013.
Note (2): Other Retail includes PARKnSHOP, Fortress,Watsons Wine, Nuance-Watson andmanufacturing operations for water andbeverage businesses.
Note (3): Comparable store sales growth represents thepercentage change in revenue contributed bystores which, as at the first day of the relevantfinancial year (a) have been operating for over12 months and (b) have not undergone majorresizing within the previous 12 months.
Total Revenue (+9%)by Subdivision
Total Retail Store Numbers (+8%)by Subdivision
17
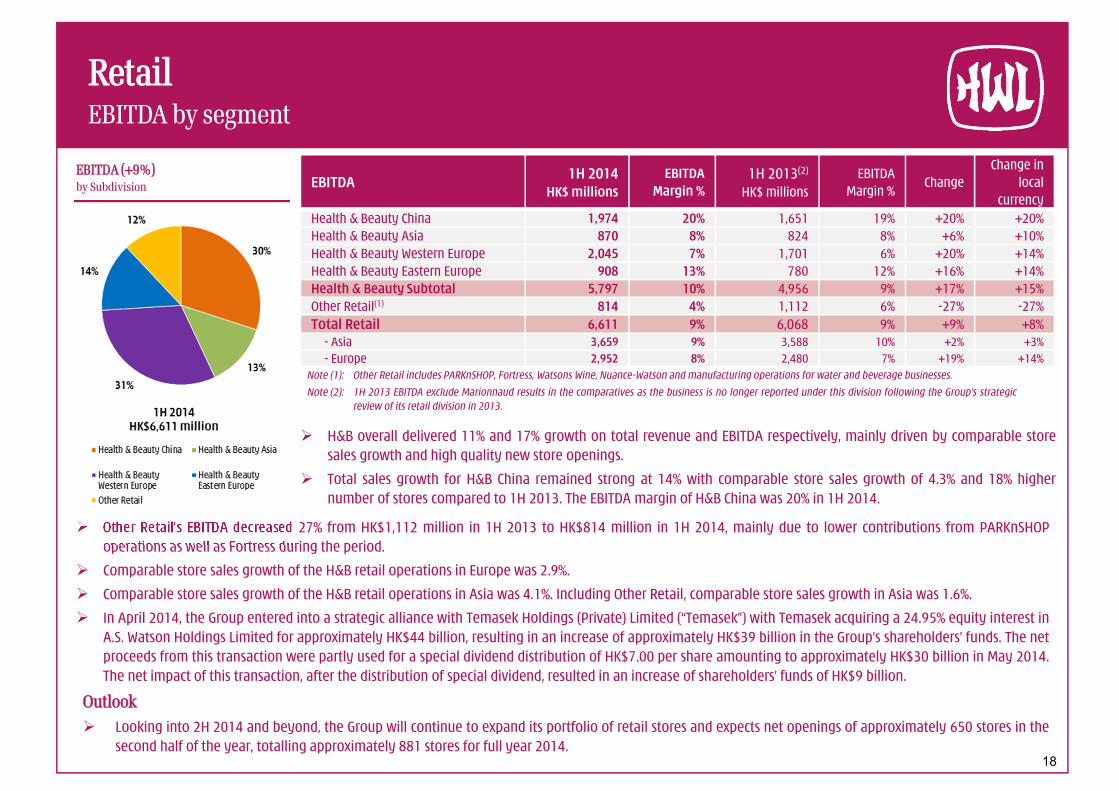
Other Retail’s EBITDA decreased 27% from HK$1,112 million in 1H 2013 to HK$814 million in 1H 2014, mainly due to lower contributions from PARKnSHOPoperations as well as Fortress during the period.
Comparable store sales growth of the H&B retail operations in Europe was 2.9%.
Comparable store sales growth of the H&B retail operations in Asia was 4.1%. Including Other Retail, comparable store sales growth in Asia was 1.6%.
In April 2014, the Group entered into a strategic alliance with Temasek Holdings (Private) Limited (“Temasek”) with Temasek acquiring a 24.95% equity interest inA.S. Watson Holdings Limited for approximately HK$44 billion, resulting in an increase of approximately HK$39 billion in the Group’s shareholders’ funds. The netproceeds from this transaction were partly used for a special dividend distribution of HK$7.00 per share amounting to approximately HK$30 billion in May 2014.The net impact of this transaction, after the distribution of special dividend, resulted in an increase of shareholders’ funds of HK$9 billion.
Outlook Looking into 2H 2014 and beyond, the Group will continue to expand its portfolio of retail stores and expects net openings of approximately 650 stores in the
second half of the year, totalling approximately 881 stores for full year 2014.
Retail EBITDA by segment
EBITDA 1H 2014
HK$ millionsEBITDA
Margin %1H 2013(2)
HK$ millionsEBITDA
Margin %Change
Change in local
currencyHealth & Beauty China 1,974 20% 1,651 19% +20% +20%Health & Beauty Asia 870 8% 824 8% +6% +10%Health & Beauty Western Europe 2,045 7% 1,701 6% +20% +14%Health & Beauty Eastern Europe 908 13% 780 12% +16% +14%Health & Beauty Subtotal 5,797 10% 4,956 9% +17% +15%Other Retail(1) 814 4% 1,112 6% -27% -27%Total Retail 6,611 9% 6,068 9% +9% +8%
- Asia 3,659 9% 3,588 10% +2% +3%- Europe 2,952 8% 2,480 7% +19% +14%
H&B overall delivered 11% and 17% growth on total revenue and EBITDA respectively, mainly driven by comparable storesales growth and high quality new store openings.
Total sales growth for H&B China remained strong at 14% with comparable store sales growth of 4.3% and 18% highernumber of stores compared to 1H 2013. The EBITDA margin of H&B China was 20% in 1H 2014.
Note (1): Other Retail includes PARKnSHOP, Fortress, Watsons Wine, Nuance-Watson and manufacturing operations for water and beverage businesses.
Note (2): 1H 2013 EBITDA exclude Marionnaud results in the comparatives as the business is no longer reported under this division following the Group’s strategicreview of its retail division in 2013.
EBITDA (+9%)by Subdivision
18

Retail EBITDA Growth
1H 2014 Reported EBITDA (HK$ millions)
Growth of 9%
Note (1): 1H 2013 EBITDA exclude Marionnaud results in the comparatives as the business is no longer reported under this division following the Group’s strategic review of its retail division in 2013.
Note (2): Other Retail includes PARKnSHOP, Fortress, Watsons Wine, Nuance-Watson and manufacturing operations for water and beverage businesses.
19
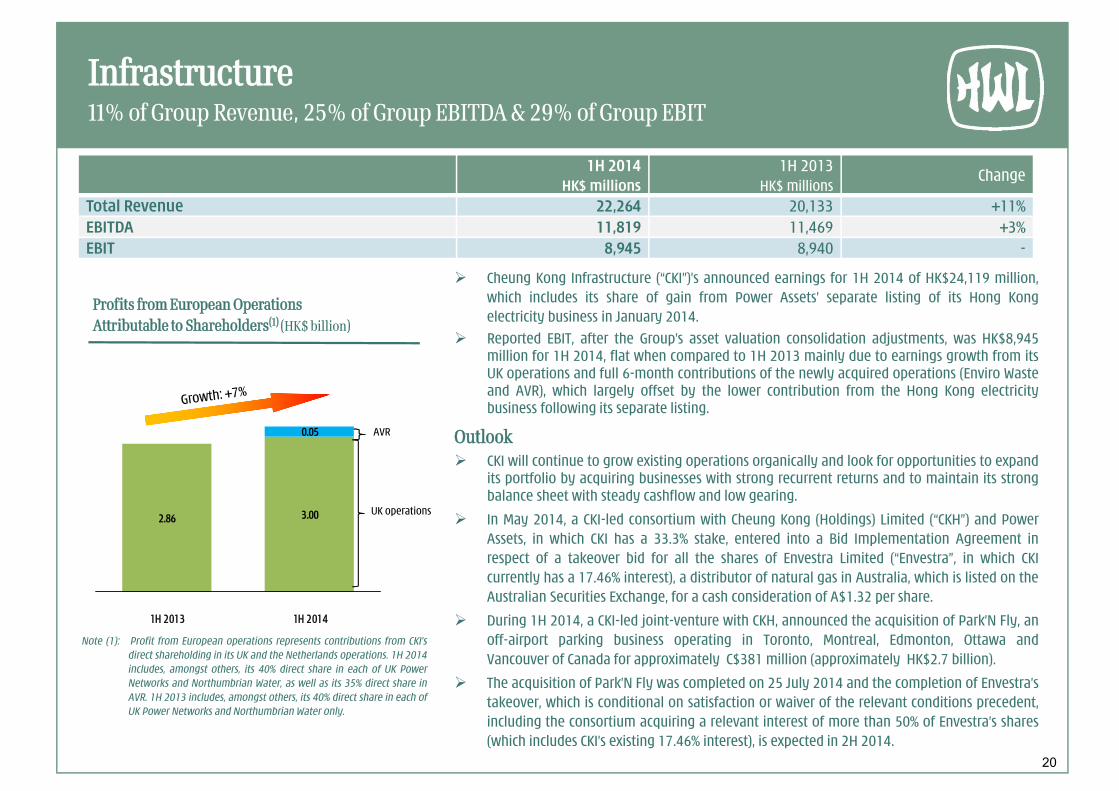
Infrastructure11% of Group Revenue, 25% of Group EBITDA & 29% of Group EBIT
Cheung Kong Infrastructure (“CKI”)’s announced earnings for 1H 2014 of HK$24,119 million,which includes its share of gain from Power Assets’ separate listing of its Hong Kongelectricity business in January 2014.
Reported EBIT, after the Group’s asset valuation consolidation adjustments, was HK$8,945million for 1H 2014, flat when compared to 1H 2013 mainly due to earnings growth from itsUK operations and full 6-month contributions of the newly acquired operations (Enviro Wasteand AVR), which largely offset by the lower contribution from the Hong Kong electricitybusiness following its separate listing.
Outlook CKI will continue to grow existing operations organically and look for opportunities to expand
its portfolio by acquiring businesses with strong recurrent returns and to maintain its strongbalance sheet with steady cashflow and low gearing.
In May 2014, a CKI-led consortium with Cheung Kong (Holdings) Limited (“CKH”) and PowerAssets, in which CKI has a 33.3% stake, entered into a Bid Implementation Agreement inrespect of a takeover bid for all the shares of Envestra Limited (“Envestra”, in which CKIcurrently has a 17.46% interest), a distributor of natural gas in Australia, which is listed on theAustralian Securities Exchange, for a cash consideration of A$1.32 per share.
During 1H 2014, a CKI-led joint-venture with CKH, announced the acquisition of Park’N Fly, anoff-airport parking business operating in Toronto, Montreal, Edmonton, Ottawa andVancouver of Canada for approximately C$381 million (approximately HK$2.7 billion).
The acquisition of Park’N Fly was completed on 25 July 2014 and the completion of Envestra’stakeover, which is conditional on satisfaction or waiver of the relevant conditions precedent,including the consortium acquiring a relevant interest of more than 50% of Envestra’s shares(which includes CKI’s existing 17.46% interest), is expected in 2H 2014.
Note (1): Profit from European operations represents contributions from CKI’sdirect shareholding in its UK and the Netherlands operations. 1H 2014includes, amongst others, its 40% direct share in each of UK PowerNetworks and Northumbrian Water, as well as its 35% direct share inAVR. 1H 2013 includes, amongst others, its 40% direct share in each ofUK Power Networks and Northumbrian Water only.
1H 2014HK$ millions
1H 2013HK$ millions
Change
Total Revenue 22,264 20,133 +11%EBITDA 11,819 11,469 +3%EBIT 8,945 8,940 -
Profits from European OperationsAttributable to Shareholders(1) (HK$ billion)
AVR
2.86 3.00
0.05
1H 2013 1H 2014
UK operations
20

Energy14% of Group Revenue, 18% of Group EBITDA & 14% of Group EBIT
Profit from operations attributable to shareholders for 1H 2014increased by 13% to C$1,290 million, reflecting higher average realisedcommodity prices in Western Canada resulting from higher Brent andWTI market prices and narrowing light/heavy crude oil differentials,improved natural gas prices and increased crude oil and natural gasproduction, partially offset by a decrease in upgrading margins due tolower average upgrading differentials and lower throughput and adecrease in US Refining and Marketing margins as a result of lowermarket crack spreads and reduced throughput from plannedmaintenance.
Average production for 1H 2014 increased by 4% to 329.8 mboe/day,mainly due to commencement of natural gas production from theLiwan Gas Project, commissioning and production ramp up at theSandall heavy oil thermal development, improved operatingperformance at Terra Nova and production from the multilateral well atNorth Amethyst brought on stream in Q4 2013, increased oil andliquids-rich natural gas resource play developments, partially offset bya planned turnaround at a Western Canada oil and gas facility,decreased Western Canada natural gas production due to naturalreservoir declines and limited re-investment and lower production atWenchang due to the planned FPSO vessel offstation.
1H 2014HK$ millions
1H 2013HK$ millions
ChangeChange in
local currencyTotal Revenue 28,660 29,911 -4% +3%EBITDA 8,145 7,991 +2% +9%EBIT 4,329 4,152 +4% +12%Production 329.8 mboe/day 315.6 mboe/day +4% NA
Average Production
21

Energy
Key Projects / Milestonesi. Liwan Gas Project (Husky Energy’s working interest: 49%) First gas from the deep water wells achieved on the Liwan 3-1 gas field was achieved on 30
March 2014. Gas sales to the Guangdong market natural gas grid commenced on 24 April 2014. Production from the Liwan Gas Project is now being sold on a continuous basis into the
Guangdong natural gas market. Natural gas liquids that are separated from the gas sales atthe Gaolan gas plant are also being sold into the Guangdong market.
ii. Heavy Oil The 3,500 bbls/day Sandall thermal development was brought online in Q1 2014 with
production averaging 5,300 bbls/day in Q2 2014.
Outlook Husky Energy will continue to maintain and enhance production in its Heavy Oil and Western
Canada foundation as it repositions these areas towards thermal developments and resourceplays, while advancing its three major growth pillars in the Asia Pacific Region, Oil Sands and inthe Atlantic Region.
Other key projects underway:i. Sunrise Energy Project (Husky Energy’s working interest: 50%) Phase I of the Sunrise Energy Project remains on track for start up by the end of 2014 and
is expected to ramp up production over an 18-24 month period to 60,000 bbls/day(30,000 bbls/day net to Husky Energy); and
The Sunrise Energy Project received Maximum Operating Pressure Approval for the initialdevelopment area of Phase I.
ii. Heavy Oil Construction work continued at the 10,000 bbls/day Rush Lake heavy oil thermal
development with first production expected in 2H 2015; The two 10,000 bbls/day Edam East and Vawn heavy oil thermal development project are
underway with first production expected in 2016; and Work commenced on the 3,500 bbls/day Edam West project with first production expected
in 2016.iii. Asia Pacific Regulatory approval was received for the contract award for an FPSO vessel to develop
the BD field in the Madura Strait offshore Indonesia.
Average Benchmark
22

Telecommunications – 3 Group Europe15% of Group Revenue, 14% of Group EBITDA & 7% of Group EBIT
Postpaid gross additions reduced slightly from 2.29 million in1H 2013 to 1.84 million in 1H 2014. Net additions, excludingthose acquired from Orange Austria reduced from 0.70million in 1H 2013 to 0.20 million in 1H 2014.
In local currencies, 3 Group Europe’s total revenue decreasedby 3%, but EBITDA and EBIT increased 9% and 16% respectivelycompared to 1H 2013, primarily from better performances inthe UK, Austria and Sweden, partially offset by a lowerreported performance in Italy due to intense competition.
Overall, net customer service margin continued to improvereflecting strong contribution from both smartphone andmobile data segments.
Operating cost represented 49% of net customer servicemargin, a reduction from 50% in 1H 2013.
Healthy EBITDA margin of 26%.
Outlook 3 Group Europe is expected to continue to perform well in 2H
2014, particularly with continued improvements in the UKand realisation of additional cost synergies in Austria.
On 15 July 2014, the Group completed the acquisition of O2Ireland from Telefonica. The restructuring exercise to combine3 Ireland and O2 Ireland operations will begin and thecombined operation is expected to provide a meaningfulcontribution to 3 Group Europe in 2015.
3 Group EuropeEBITDA & EBIT
3 Group Europe’sActive Customers and 6 months Data Usage
23

Telecommunications – 3 Group EuropeEBITDA Growth
24
1H 2014 Reported EBITDA (HK$ millions)
Growth of 15%
Note (1): Represents Skype intercompany charge elimination which is not applicable in 2014.

Telecommunications – 3 Group Europe1H 2014 Results by operations
Note (1): Net customer service margin represents net customer service revenue deducting direct variable costs (including interconnection charges and roaming costs).
Note (2): EBITDA margin % represents EBITDA as a % of total revenue excluding handset revenue.
Note (3): Licence costs in 1H 2014 represent incidental costs in relation to licences acquired in the prior year. 25
In millions
1H 2014 1H 2013 1H 2014 1H 2013 1H 2014 1H 2013 1H 2014 1H 2013 1H 2014 1H 2013 1H 2014 1H 2013 1H 2014 1H 2013
Total Revenue 974 1,002 815 891 3,054 2,699 1,008 930 342 369 97 87 31,063 30,101
% Improvement (Reduction) -3% -9% 13% 8% -7% 11% 3%
-3%
- Net Customer Service Revenue 723 667 662 684 2,123 1,833 887 827 271 306 80 72 23,950 22,037 % Improvement (Reduction) 8% -3% 16% 7% -11% 11% 9%
3%
- Handset Revenue 241 321 139 185 827 760 92 62 58 57 13 14 6,490 7,417
- Other Revenue 10 14 14 22 104 106 29 41 13 6 4 1 623 647
Net Customer Service Margin(1) 556 519 502 496 1,811 1,455 772 708 222 230 63 56 18,844 16,831
% Improvement (Reduction) 7% 1% 24% 9% -3% 13% 12%
6%
Net Customer Service Margin % 77% 78% 76% 73% 85% 79% 87% 86% 82% 76% 79% 78% 79% 76%
Other margin 4 11 13 22 26 55 13 27 10 6 2 - 368 507
TOTAL CACs (358) (457) (259) (270) (1,127) (1,012) (216) (172) (70) (75) (22) (23) (10,036) (10,624)
Less: Handset Revenue 241 321 139 185 827 760 92 62 58 57 13 14 6,490 7,417
Total CACs (net of handset revenue) (117) (136) (120) (85) (300) (252) (124) (110) (12) (18) (9) (9) (3,546) (3,207)
Operating Expenses (211) (206) (323) (299) (666) (641) (315) (309) (104) (128) (59) (47) (9,162) (8,470)
Opex as a % of net customer service margin 38% 40% 64% 60% 37% 44% 41% 44% 47% 56% 94% 84% 49% 50%
EBITDA (LBITDA) 232 188 72 134 871 617 346 316 116 90 (3) - 6,504 5,661
% Improvement (Reduction) 23% -46% 41% 9% 29% N/A 15%
9%
EBITDA margin %(2) 32% 28% 11% 19% 39% 32% 38% 36% 41% 29% -4% - 26% 25%
Depreciation & Amortisation (109) (102) (143) (139) (380) (346) (146) (138) (37) (38) (22) (18) (4,222) (3,807)
EBIT (LBIT) 123 86 (71) (5) 491 271 200 178 79 52 (25) (18) 2,282 1,854
% Improvement (Reduction) 43% -1320% 81% 12% 52% -39% 23%
16%
Capex (excluding licence) (116) (87) (151) (187) (392) (461) (69) (91) (53) (35) (60) (21) (4,876) (4,167)
EBITDA (LBITDA) less Capex 116 101 (79) (53) 479 156 277 225 63 55 (63) (21) 1,628 1,494
Licence(3) (0.3) (225) - - - - - - - - - - (4) (2,674)
UK Italy Sweden Denmark Austria
GBP EURO SEK DKK EURO
Local currency change
Local currency change
Local currency change
Local currency change
3 Group
Europe
EURO HK$
Ireland
Local currency change

Telecommunications – 3 Group EuropeKey Business Indicators
Key business indicators for the 3 Group Europe’s businesses are as follows:
Note (1): An active customer is one that generated revenue from an outgoing call, incoming call or data/content service in the preceding 3 months.
26
3 Group
Europe
Postpaid 5,916 4,757 1,586 733 2,525 343 15,860% Variance (June 2014 vs December 2013) 1% 2% 4% 1% 1% -2% 1%
Prepaid 3,799 5,081 201 336 975 684 11,076% Variance (June 2014 vs December 2013) -4% 1% 26% 12% 5% 12% 1%
Total 9,715 9,838 1,787 1,069 3,500 1,027 26,936% Variance (June 2014 vs December 2013) -1% 2% 6% 4% 2% 7% 1%
UK Italy Sweden Denmark Austria Ireland3 Group
Europe
Postpaid 5,777 4,602 1,586 733 2,502 313 15,513% Variance (June 2014 vs December 2013) 1% 2% 4% 1% 1% 1% 1%
Prepaid 2,209 3,819 121 307 370 253 7,079% Variance (June 2014 vs December 2013) - 4% 32% 10% 3% 7% 3%
Total 7,986 8,421 1,707 1,040 2,872 566 22,592% Variance (June 2014 vs December 2013) 1% 3% 5% 3% 1% 3% 2%
Ireland
Customer Base - Registered Customers at 30 June 2014 ('000)
Customer Base - Active Customers(1) at 30 June 2014 ('000)
UK Italy Sweden Denmark Austria

Telecommunications – 3 Group EuropeKey Business Indicators
Key business indicators for the 3 Group Europe’s businesses are as follows:
Note (1): ARPU equals total monthly revenue, including incoming mobile termination revenue and contributions for a handset/device in postpaid contract bundled plans, divided by the average number of active customersduring the period.
Note (2): Net ARPU equals total monthly revenue, including incoming mobile termination revenue but excluding contributions for a handset/device in postpaid contract bundled plans, divided by the average number of activecustomers during the period.
Note (3): Net AMPU equals total monthly revenue, including incoming mobile termination revenue but excluding contributions for a handset/device in postpaid contract bundled plans, less direct variable costs (includinginterconnection charges and roaming costs )(i.e. net customer service margin), divided by the average number of active customers during the period.
27
3 Group
Europe
Average
Postpaid ARPU(1) £27.00 €18.93 SEK310.26 DKK174.26 €21.57 €38.03 €26.64
Prepaid ARPU(1) £5.55 €7.13 SEK114.06 DKK134.90 €7.50 €15.30 €7.81
Blended Total ARPU(1) £21.02 €13.65 SEK298.28 DKK163.22 €19.68 €28.26 €20.80
% Variance compared to 31 December 2013 1% -7% 1% -5% -4% -2% -2%
Postpaid Net ARPU(2) £18.96 €18.93 SEK224.51 DKK161.90 €17.84 €30.48 €21.21
Prepaid Net ARPU(2) £5.55 €7.13 SEK114.06 DKK134.90 €7.50 €15.30 €7.81
Blended Total Net ARPU(2) £15.22 €13.65 SEK217.76 DKK154.33 €16.45 €23.96 €17.06
% Variance compared to 31 December 2013 1% -7% 3% -4% -6% -1% -2%
Postpaid Net AMPU(3) £14.85 €14.32 SEK191.98 DKK140.81 €14.26 €24.80 €16.79
Prepaid Net AMPU(3) £4.79 €5.48 SEK81.78 DKK116.44 €6.45 €11.02 €6.28
Blended Total Net AMPU(3) £12.04 €10.37 SEK185.25 DKK133.97 €13.21 €18.88 €13.53
% Variance compared to 31 December 2013 - -5% 6% -3% -2% - -1%
Ireland
12-month Trailing Average Revenue per Active User ("ARPU")(1) to 30 June 2014
12-month Trailing Net Average Revenue per Active User ("Net ARPU")(2) to 30 June 2014
12-month Trailing Net Average Margin per Active User ("Net AMPU")(3) to 30 June 2014
UK Italy Sweden Denmark Austria

Telecommunications – 3 Group EuropeKey Business Indicators
Key business indicators for the 3 Group Europe’s businesses are as follows:
28
1H 2014 3 GroupUK It a ly Sw eden Denmark A us t r ia Ire land Europe
A verage
Contract customers as a % of the total registered customer base 61% 48% 89% 69% 72% 33% 59%
Contract customers' contribution to the net customer service revenue base (%) 90% 75% 96% 77% 93% 72% 89%
Average monthly churn rate of the total contract registered customer base (%) 1.6% 2.2% 1.4% 2.7% 0.6% 1.3% 1.6%
Active contract customers as a % of the total contract registered customer base 98% 97% 100% 100% 99% 91% 98%
Active customers as a % of the total registered customer base 82% 86% 95% 97% 82% 55% 84%
6 months data usage per active customer (Gigabyte) 12.2
1H 2013 3 GroupUK It a ly Sw eden Denmark A us t r ia Ire land Europe
A verage
Contract customers as a % of the total registered customer base 60% 48% 90% 72% 74% 42% 59%
Contract customers' contribution to the net customer service revenue base (%) 88% 82% 97% 81% 94% 76% 87%
Average monthly churn rate of the total contract registered customer base (%) 1.6% 2.4% 1.2% 2.5% 0.8% 1.2% 1.7%
Active contract customers as a % of the total contract registered customer base 97% 94% 100% 100% 99% 81% 97%
Active customers as a % of the total registered customer base 82% 80% 95% 98% 85% 56% 82%
6 months data usage per active customer (Gigabyte) 8.8

Telecommunications – HTHKH & HAT
HTHKH had a combined active mobile customer base maintained at approximately 3.6 million in Hong Kong and Macau.
The shortfall in HTHKH’s EBITDA and EBIT against the same period last year was primarily due to the weaker performance of the mobile business, resulting from lowerdemand for new handset models and consumers being increasingly price sensitive.
The fixed line business in 1H 2014 continued to perform well and reported 7% and 19% growth in EBITDA and EBIT to HK$597 million and HK$247 million respectively.
1H 2014HK$ millions
1H 2013HK$ millions
Change
Total Revenue 6,227 6,149 +1%EBITDA 1,230 1,509 -18%EBIT 538 834 -35%
HTHKH3% of Group Revenue, 3% of Group EBITDA & 2% of Group EBIT
HAT2% of Group Revenue, 1% of Group EBITDA & -0.2% of Group EBIT
1H 2014HK$ millions
1H 2013HK$ millions
Change
Total Revenue 3,506 2,981 +18%EBITDA / (LBITDA) 502 (59) +951%LBIT (76) (697) +89% HAT had an active customer base of approximately 46.5 million with operations in Indonesia, Vietnam and Sri Lanka.
EBITDA turnaround from an LBITDA of HK$59 million in 1H 2013 to an EBITDA of HK$502 million in 1H 2014, driven by revenue growth in Indonesia and Vietnam.
Indonesia active customer base increased by 34% from the same period last year to over 34.8 million customers with strong revenue growth of 16% compared to 1H2013. Monthly revenue has increased to approximately US$57.9 million in June 2014 representing a 26% increase in monthly revenue in local currency compared toJune 2013. The operation achieved positive EBITDA operationally in both 2H 2013 and 1H 2014.
HAT will continue to grow its customer base, particularly in Indonesia, where a major network rollout was completed in the third quarter of 2013 and the 3G footprintis now extended to 150 cities covering 86% of the population (1H 2013: 124 cities with 75% population coverage).
29
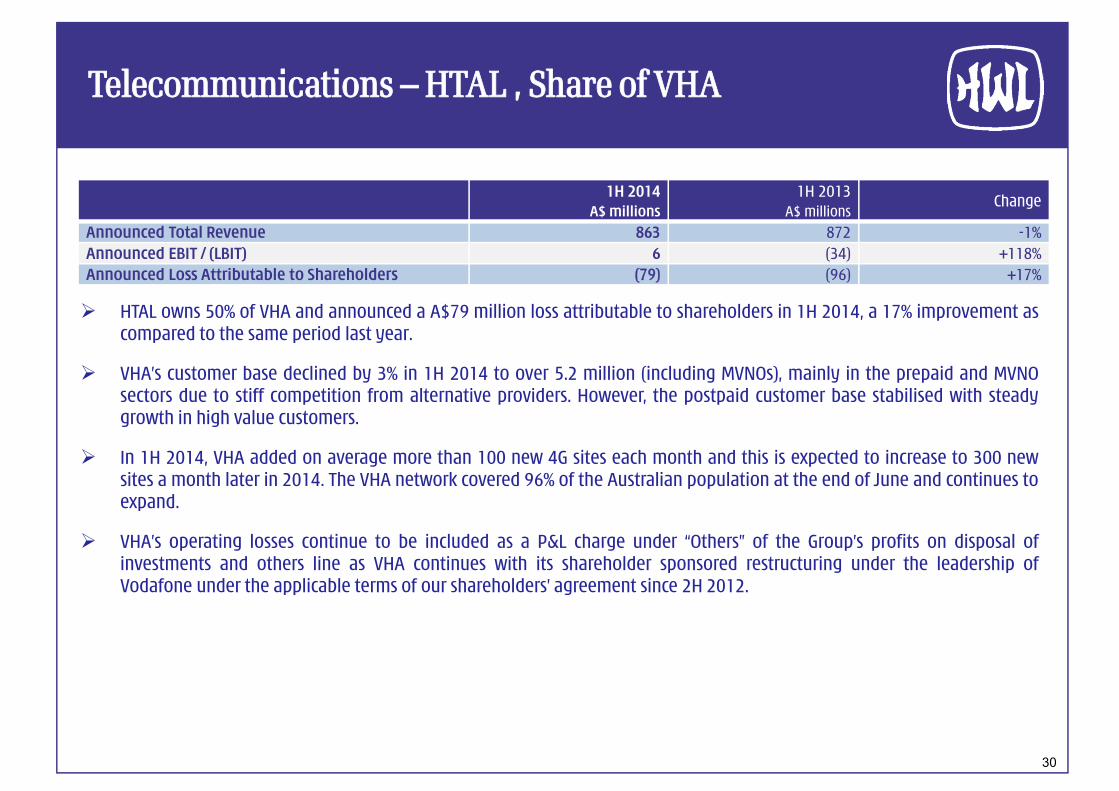
Telecommunications – HTAL , Share of VHA
HTAL owns 50% of VHA and announced a A$79 million loss attributable to shareholders in 1H 2014, a 17% improvement ascompared to the same period last year.
VHA’s customer base declined by 3% in 1H 2014 to over 5.2 million (including MVNOs), mainly in the prepaid and MVNOsectors due to stiff competition from alternative providers. However, the postpaid customer base stabilised with steadygrowth in high value customers.
In 1H 2014, VHA added on average more than 100 new 4G sites each month and this is expected to increase to 300 newsites a month later in 2014. The VHA network covered 96% of the Australian population at the end of June and continues toexpand.
VHA’s operating losses continue to be included as a P&L charge under “Others” of the Group’s profits on disposal ofinvestments and others line as VHA continues with its shareholder sponsored restructuring under the leadership ofVodafone under the applicable terms of our shareholders’ agreement since 2H 2012.
1H 2014A$ millions
1H 2013A$ millions
Change
Announced Total Revenue 863 872 -1%Announced EBIT / (LBIT) 6 (34) +118%Announced Loss Attributable to Shareholders (79) (96) +17%
30

Financial profileNet Debt Ratio remaining below 25% with healthy liquidity
Debt Maturity Profile at 30 June 2014
Net Debt to Net Total Capital Ratio
Liquid Assets by Typeat 30 June 2014
31

Note (1): EBITDA excludes non-controlling interests’ share of results of HPH Trust and the profits on disposal of investment and others.
Financial profile
1H 2014 EBITDA, Dividends and Distributions from Associated Companies and JVs less Capex of Company & Subsidiariesby division
32

2014 Interim Results
Reported revenue grew 3% and recurring earnings up 13% from the same period last year.
Declared an interim dividend of HK$0.66 per share, a 10% increase.
Paid a special dividend of HK$7.00 per share, amounting to approximately HK$30 billion, in May2014 after the Temasek’s acquisition of 24.95% equity interest in A.S. Watson Holdings forapproximately HK$44 billion.
Healthy cash generation with 4% reported EBITDA growth to HK$46.8 billion and a 7% increase infunds from operations to HK$24.8 billion for 1H 2014.
Net Debt ratio reduced to 17.1% at 30 June 2014.
33