
Unaudited Quarterly Financial Report March 31, 2017
44
Unaudited Quarterly Financial Report March 31, 2017 Goldman Sachs International (unlimited company) Company Number: 02263951
Transcript of Unaudited Quarterly Financial Report March 31, 2017

Unaudited Quarterly Financial Report March 31, 2017 Goldman Sachs International (unlimited company) Company Number: 02263951

GOLDMAN SACHS INTERNATIONAL (UNLIMITED COMPANY) UNAUDITED QUARTERLY FINANCIAL REPORT FOR THE QUARTER ENDED MARCH 31, 2017
1
INDEX Page No.
Part I Management Report 2
Introduction 2
Executive Overview 2
Business Environment 3
Critical Accounting Policy 4
Results of Operations 4
Balance Sheet and Funding Sources 8
Equity Capital Management and Regulatory Capital 10
Regulatory Developments 12
Principal Risks and Uncertainties 12
Risk Management 12
Overview and Structure of Risk Management 12
Liquidity Risk Management 13
Market Risk Management 16
Credit Risk Management 18
Operational Risk Management 21
Model Risk Management 22
Directors 22
Date of Issue 22
Part II Unaudited Financial Statements 23
Profit and Loss Account 23
Statements of Comprehensive Income 23
Balance Sheet 24
Statements of Changes in Equity 25
Statements of Cash Flows 26
Notes to the Financial Statements 27
Note 1. General Information 27
Note 2. Summary of Significant Accounting Policies 27
Note 3. Critical Accounting Estimates and Judgements 27
Note 4. Segment Reporting 28
Note 5. Tax on Profit on Ordinary Activities 28
Note 6. Financial Instruments Owned and Financial Instruments Sold, But Not Yet Purchased 29
Note 7. Collateralised Agreements 29
Note 8. Debtors 29
Note 9. Collateralised Financings 30
Note 10. Other Creditors 30
Note 11. Share Capital 32
Note 12. Cash and Cash Equivalents 32
Note 13. Reconciliation of Cash Flows From Operating Activities 32
Note 14. Financial Commitments and Contingencies 33
Note 15. Financial Risk Management and Capital Management 34
Note 16. Financial Assets and Financial Liabilities 34
GOLDMAN SACHS INTERNATIONAL (UNLIMITED COMPANY)
Management Report
2
Introduction
Goldman Sachs International (GSI or the company) provides a
wide range of financial services to clients located worldwide.
The company also operates a number of branches across
Europe, the Middle East and Africa (EMEA) to provide
financial services to clients in those regions.
The company’s primary regulators are the Prudential
Regulation Authority (PRA) and the Financial Conduct
Authority (FCA).
The company’s ultimate parent undertaking and controlling
entity is The Goldman Sachs Group, Inc. (Group Inc.). Group
Inc. is a bank holding company and a financial holding
company regulated by the Board of Governors of the Federal
Reserve System (Federal Reserve Board). Group Inc., together
with its consolidated subsidiaries, form “GS Group” or “the
group”. GS Group is a leading global investment banking,
securities and investment management firm that provides a
wide range of financial services to a substantial and diversified
client base that includes corporations, financial institutions,
governments and individuals. GS Group has a presence in
EMEA through a number of subsidiaries, including GSI.
GSI seeks to be the advisor of choice for its clients and a
leading participant in global financial markets. As part of GS
Group, GSI also enters into transactions with affiliates in the
normal course of business as part of its market-making
activities and general operations. GSI, consistent with GS
Group, reports its activities in four business segments:
Investment Banking; Institutional Client Services; Investing &
Lending; and Investment Management.
References to “the financial statements” are to the unaudited
financial statements as presented in Part II of this financial
report. All references to March 2017 and March 2016 refer to
the periods ended, or the dates, as the context requires, March
31, 2017 and March 31, 2016, respectively. All references to
December 2016 refer to the date December 31, 2016. All
references to “the 2016 Annual Report” are to the company’s
Annual Report for the year ended December 31, 2016.
Unless otherwise stated, all amounts in this financial report are
prepared in accordance with United Kingdom Generally
Accepted Accounting Practices (U.K. GAAP).
Executive Overview
Profit and Loss Account
The profit and loss account is set out on page 23 of this
financial report. The company’s profit for the financial period
was $428 million for the first quarter of 2017, an increase of
16% compared with the first quarter of 2016.
Net revenues were $1.63 billion for the first quarter of 2017,
18% higher than the first quarter of 2016, primarily due to
higher net revenues in Institutional Client Services. In addition,
net revenues in Investing & Lending and Investment
Management were significantly higher. These increases were
partially offset by lower net revenues in Investing Banking.
Administrative expenses were $957 million for the first quarter
of 2017, 22% higher than the first quarter of 2016, primarily
reflecting changes in the mark-to-market impact of share-based
compensation. Excluding the mark-to-market impact of share-
based compensation for both periods, administrative expenses
were $979 million for the first quarter of 2017, 4% higher than
the first quarter of 2016.
See “Results of Operations” below for further information
about the company’s net revenues, segment reporting and
administrative expenses.
Capital Ratios
The company maintained strong capital ratios. As of March
2017, the company’s Common Equity Tier 1 ratio was 12.7%
(under CRD IV as defined in “Equity Capital Management and
Regulatory Capital — Regulatory Capital”).
Liquidity The company maintained strong liquidity. As of March 2017,
the company’s global core liquid assets were $53.58 billion.
See “Risk Management — Liquidity Risk Management” for
further information about the company’s global core liquid
assets.
Balance Sheet
The balance sheet is set out on page 24 of this financial report.
In the subsequent paragraphs, total assets are the sum of “Fixed
assets”, “Current assets” and the company’s “Pension surplus”.
Total liabilities are the sum of “Creditors: amounts falling due
within one year” and “Creditors: amounts falling due after
more than one year”.

GOLDMAN SACHS INTERNATIONAL (UNLIMITED COMPANY)
Management Report
3
As of March 2017, total assets were $912.84 billion, a decrease
of $21.49 billion from December 2016, primarily reflecting a
decrease in financial instruments owned of $45.06 billion,
partially offset by an increase in collateralised agreements of
$21.62 billion. Financial instruments owned decreased
primarily due to the impact of movements in currencies and
interest rates on derivative valuations. Collateralised
agreements increased primarily due to changes in client
activity.
As of March 2017, total liabilities were $884.90 billion, a
decrease of $21.88 billion from December 2016, primarily
reflecting a decrease in financial instruments sold, but not yet
purchased of $43.24 billion, partially offset by an increase in
collateralised financings of $25.17 billion. Financial
instruments sold, but not yet purchased decreased primarily
due to the impact of movements in currencies and interest rates
on derivative valuations. Collateralised financings increased
primarily due to changes in client and firm activity.
U.S. GAAP Results The company also prepares results under United States
Generally Accepted Accounting Principles (U.S. GAAP),
which are included in the consolidated financial statements of
GS Group.
The company’s profit under U.S. GAAP differs from that
under U.K. GAAP primarily due to timing differences in the
recognition of certain revenues and expenses. Under U.S.
GAAP, the company’s profit for the first quarter for 2017 was
not significantly different from that reported under U.K.
GAAP.
The company’s total assets and total liabilities under U.S.
GAAP differ from those reported under U.K. GAAP primarily
due to the company presenting derivative balances gross under
U.K. GAAP if they are not net settled in the normal course of
business, even where it has a legally enforceable right to offset
those balances. Under U.S. GAAP, as of March 2017, total
assets were $396.67 billion, an increase of $36.03 billion from
December 2016. This increase primarily reflected an increase
in collateralised agreements due to changes in client activity.
Total liabilities were $368.65 billion, an increase of $35.67
billion from December 2016. This increase primarily reflected
an increase in collateralised financings due to changes in client
and firm activity.
Business Environment
Global
During the first quarter of 2017, global economic conditions
appeared mixed compared with the previous quarter, as real
gross domestic product (GDP) growth in the U.S., China and
the U.K. slowed, while growth in Japan and India appeared to
improve. Broadly, global macroeconomic data remained strong
throughout the quarter, and volatility in equity, foreign
exchange and commodity markets was low. Major central
banks continued to gradually tighten their stance on monetary
policy. The U.S. Federal Reserve followed an increase in the
target federal funds rate in December 2016 with another
increase in March 2017. In addition, the People’s Bank of
China tightened its stance on monetary policy slightly by
raising certain interest rates, and the European Central Bank
confirmed it intended to decrease the pace of its monthly asset
purchases beginning in April 2017. The price of crude oil
(WTI) ended the quarter at approximately $51 per barrel, a
decrease of 6% from the end of 2016. In investment banking,
industry-wide mergers and acquisitions volumes declined
compared with the robust level of volumes during 2016.
Industry-wide equity underwriting activity continued to
improve from the low levels of activity during 2016 and
industry-wide debt underwriting activity increased after a
slowdown in the fourth quarter of 2016.
Europe
In the Euro area, both real GDP growth and measures of
inflation increased at a similar pace compared to the previous
quarter. The European Central Bank maintained its main
refinancing operations rate at 0.00% and its deposit rate at
(0.40)%. In addition, the European Central Bank maintained
the pace of its monthly asset purchases at €80 billion in the
first quarter, but confirmed it intended to reduce the pace of
purchases to €60 billion beginning in April 2017. Measures of
unemployment remained high and the Euro appreciated by 1%
against the U.S. dollar compared with the end of 2016. In the
U.K., real GDP growth decreased compared with the previous
quarter. The Bank of England maintained its official bank rate
at 0.25%, and the British pound appreciated by 2% against the
U.S. dollar. Yields on 10-year government bonds generally
increased in the region. In equity markets, the DAX Index,
Euro Stoxx 50 Index, CAC 40 Index and FTSE 100 Index
increased by 7%, 6%, 5% and 3%, respectively, compared with
the end of 2016. During the last week of the quarter, the U.K.
activated Article 50 of the E.U. treaty initiating a two-year
negotiation period for its exit from the E.U.
GOLDMAN SACHS INTERNATIONAL (UNLIMITED COMPANY)
Management Report
4
Critical Accounting Policy
For a description of the company’s critical accounting policy,
fair value, see “Critical Accounting Policy” in Part I of the
2016 Annual Report.
The fair values for substantially all of the company’s financial
assets and financial liabilities that are fair valued on a recurring
basis are based on observable prices and inputs and are
classified in levels 1 and 2 of the fair value hierarchy. Total
level 3 financial assets were $5.05 billion and $5.15 billion as
of March 2017 and December 2016, respectively. See Note 16
to the financial statements for further information about level 3
financial assets, including changes in level 3 financial assets
and related fair value measurement.
Results of Operations
The composition of the company’s net revenues has varied
over time as financial markets and the scope of its operations
have changed. The composition of net revenues can also vary
over the shorter term due to fluctuations in economic and
market conditions. See “Principal Risks and Uncertainties” in
Part I of the 2016 Annual Report for further information about
the impact of economic and market conditions on the
company’s results of operations. In addition to transactions
entered into with third parties, the company also enters into
transactions with affiliates in the normal course of business as
part of its market-making activities and general operations.
Net Revenues
Net revenues include the net profit arising from transactions,
with both third parties and affiliates, in securities, foreign
exchange and other financial instruments, and fees and
commissions. This is inclusive of associated interest and
dividends. See “Segment Reporting” below for further details.
Segment Reporting
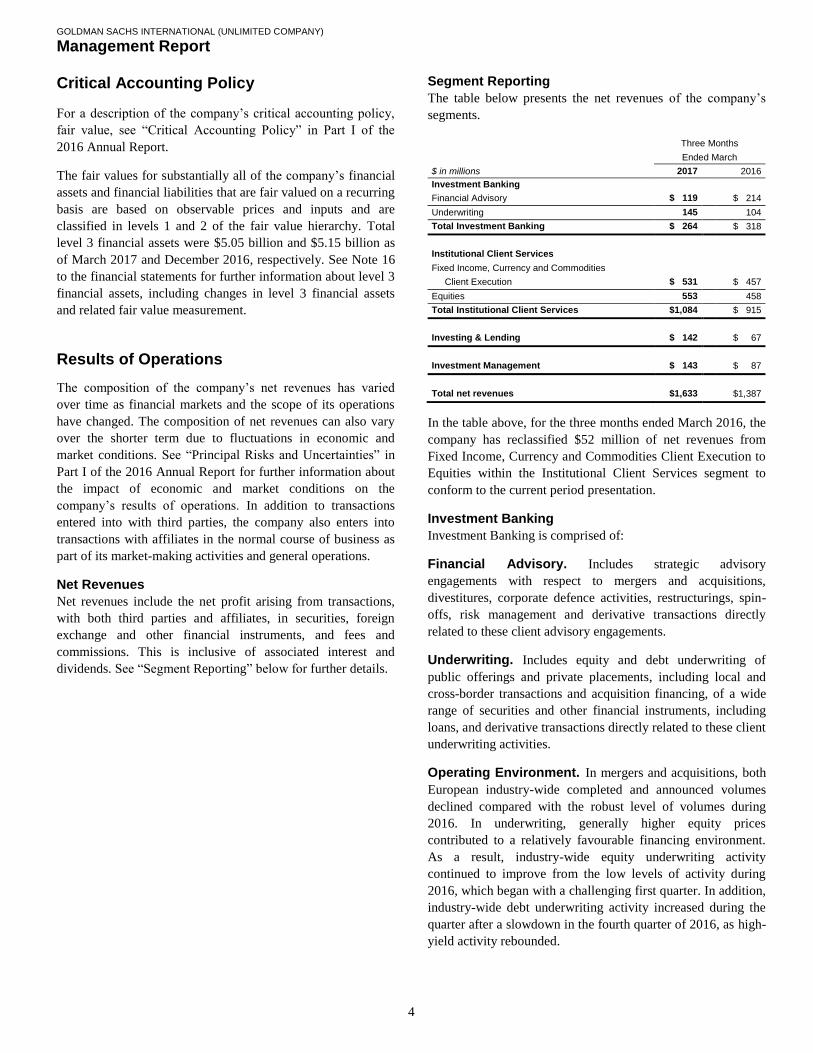
The table below presents the net revenues of the company’s
segments.
Three Months
Ended March
$ in millions 2017 2016
Investment Banking
Financial Advisory $1,119 $ 214
Underwriting 145 104
Total Investment Banking $1,264 $ 318
Institutional Client Services
Fixed Income, Currency and Commodities
Client Execution $0,531 $ 457
Equities 0,553 458
Total Institutional Client Services $1,084 $ 915
Investing & Lending $0,142 $ 67
Investment Management $0,143 $ 87
Total net revenues $1,633 $1,387
In the table above, for the three months ended March 2016, the
company has reclassified $52 million of net revenues from
Fixed Income, Currency and Commodities Client Execution to
Equities within the Institutional Client Services segment to
conform to the current period presentation.
Investment Banking
Investment Banking is comprised of:
Financial Advisory. Includes strategic advisory
engagements with respect to mergers and acquisitions,
divestitures, corporate defence activities, restructurings, spin-
offs, risk management and derivative transactions directly
related to these client advisory engagements.
Underwriting. Includes equity and debt underwriting of
public offerings and private placements, including local and
cross-border transactions and acquisition financing, of a wide
range of securities and other financial instruments, including
loans, and derivative transactions directly related to these client
underwriting activities.
Operating Environment. In mergers and acquisitions, both
European industry-wide completed and announced volumes
declined compared with the robust level of volumes during
2016. In underwriting, generally higher equity prices
contributed to a relatively favourable financing environment.
As a result, industry-wide equity underwriting activity
continued to improve from the low levels of activity during
2016, which began with a challenging first quarter. In addition,
industry-wide debt underwriting activity increased during the
quarter after a slowdown in the fourth quarter of 2016, as high-
yield activity rebounded.

GOLDMAN SACHS INTERNATIONAL (UNLIMITED COMPANY)
Management Report
5
Three Months Ended March 2017 versus March 2016.
Net revenues in Investment Banking were $264 million for the
first quarter of 2017, 17% lower than the first quarter of 2016.
Net revenues in Financial Advisory were $119 million, 44%
lower than the first quarter of 2016. Industry-wide completed
mergers and acquisitions activity levels declined in EMEA
compared with the same prior year period. Net revenues in
Underwriting were $145 million, 39% higher than the first
quarter of 2016, due to significantly higher net revenues in
equity underwriting, reflecting an increase in European
secondary offerings, and significantly higher net revenues in
debt underwriting, primarily reflecting an increase in high-
yield activity.
As of March 2017, the company’s investment banking
transaction backlog decreased compared with both the end of
2016 and the end of the first quarter of 2016. The decrease
compared with the end of 2016 was due to lower estimated net
revenues from potential advisory transactions, reflecting a
decrease in net revenues related to mergers and acquisitions,
and lower estimated net revenues from potential debt
underwriting transactions, principally related to investment-
grade transactions.
The company’s investment banking transaction backlog
represents an estimate of future net revenues from investment
banking transactions where the company believes that future
revenue realisation is more likely than not. The company
believes changes in its investment banking transaction backlog
may be a useful indicator of client activity levels which, over
the long term, impact net revenues. However, the time frame
for completion and corresponding revenue recognition of
transactions in the backlog varies based on the nature of the
engagement, as certain transactions may remain in the backlog
for longer periods of time and others may enter and leave
within the same reporting period. In addition, the company’s
transaction backlog is subject to certain limitations, such as
assumptions about the likelihood that individual client
transactions will occur in the future. Transactions may be
cancelled or modified, and transactions not included in the
estimate may also occur.
Institutional Client Services
Institutional Client Services is comprised of:
Fixed Income, Currency and Commodities Client
Execution. Includes client execution activities related to
making markets in both cash and derivative instruments for
interest rate products, credit products, mortgages, currencies
and commodities.
Interest Rate Products. Government bonds (including
inflation-linked securities) across maturities, other
government-backed securities, securities sold under
agreements to repurchase (repurchase agreements), and
interest rate swaps, options and other derivatives.
Credit Products. Investment-grade corporate securities,
high-yield securities, credit derivatives, exchange-traded
funds, bank and bridge loans, municipal securities, emerging
market and distressed debt, and trade claims.
Mortgages. Commercial mortgage-related securities, loans
and derivatives, residential mortgage-related securities, loans
and derivatives, and other asset-backed securities, loans and
derivatives.
Currencies. Currency options, spot/forwards and other
derivatives on G-10 currencies and emerging-market
products.
Commodities. Commodity derivatives and, to a lesser
extent, physical commodities, involving crude oil and
petroleum products, natural gas, base, precious and other
metals, electricity, coal, agricultural and other commodity
products.
Equities. Includes client execution activities related to
making markets in equity products and commissions and fees
from executing and clearing institutional client transactions on
major stock, options and futures exchanges worldwide, as well
as over-the-counter (OTC) transactions. Equities also includes
the securities services business, which provides financing,
securities lending and other prime brokerage services to
institutional clients, including hedge funds, mutual funds,
pension funds and foundations, and generates revenues
primarily in the form of interest rate spreads or fees.

GOLDMAN SACHS INTERNATIONAL (UNLIMITED COMPANY)
Management Report
6
Operating Environment. After investor sentiment improved
in the fourth quarter of 2016 following strong economic data,
the prospect of higher interest rates and the potential for more
pro-growth policies in the U.S., expectations were tempered in
light of uncertainty regarding European elections and
legislative challenges in the United States. Reduced volatility
negatively affected client activity across businesses with the
VIX falling below 11, Euro-dollar foreign exchange volatility
approaching its lowest level in two years and crude oil
volatility averaging its lowest level in more than two years. In
addition, oil and European natural gas prices declined during
the quarter to approximately $51 per barrel (WTI) and €15.58
per MWh, respectively. European equity markets continued to
increase during the first quarter of 2017 with the MSCI Europe
Index up 7%. In credit markets, spreads were essentially
unchanged compared with the end of 2016. See “Business
Environment” above for further information about economic
and market conditions in the global operating environment
during the quarter.
Three Months Ended March 2017 versus March 2016.
Net revenues in Institutional Client Services were $1.08 billion
for the first quarter of 2017, 18% higher than the first quarter
of 2016.
Net revenues in Fixed Income, Currency and Commodities
Client Execution (FICC Client Execution) were $531 million
for the first quarter of 2017, 16% higher than the first quarter
of 2016.
The following provides details of the company’s FICC Client
Execution net revenues by business, compared with results in
the first quarter of 2016:
Net revenues in interest rate products and credit products
were significantly higher, reflecting improved market-
making conditions, partially offset by lower client activity.
Net revenues in mortgages were significantly higher,
reflecting improved market-making conditions.
Net revenues in currencies were slightly higher.
Net revenues in commodities were significantly lower,
reflecting the impact of changes in market-making conditions
and lower client activity.
Net revenues in Equities were $553 million for the first quarter
of 2017, 21% higher than the first quarter of 2016, primarily
due to significantly higher net revenues in equities client
execution, reflecting significantly higher results in derivatives.
Investing & Lending
Investing & Lending includes direct investments made by the
company, which are typically longer-term in nature, and net
revenues associated with providing investing services to other
GS Group entities.
Three Months Ended March 2017 versus March 2016.
Net revenues in Investing & Lending were $142 million for the
first quarter of 2017, compared with $67 million for the first
quarter of 2016, reflecting significantly higher net gains from
investments in debt instruments.
Investment Management
Investment Management provides investment management and
wealth advisory services, including portfolio management and
financial counselling, and brokerage and other transaction
services to high-net-worth individuals and families. Investment
Management also includes net revenues associated with
providing investing services in respect of funds managed by
GS Group.
Three Months Ended March 2017 versus March 2016.
Net revenues in Investment Management were $143 million for
the first quarter of 2017, 64% higher than the first quarter of
2016, reflecting higher management and other fees, primarily
due to an increase in net revenues from providing investing
services.
GOLDMAN SACHS INTERNATIONAL (UNLIMITED COMPANY)
Management Report
7
Administrative Expenses
Administrative expenses are primarily influenced by
compensation (including the impact of the Group Inc. share
price on share-based compensation), headcount and levels of
business activity. Direct costs of employment include salaries,
allowances, estimated year-end discretionary compensation,
amortisation and mark-to-market of share-based compensation
and other items such as benefits. Discretionary compensation is
significantly impacted by, among other factors, the level of net
revenues, overall financial performance, prevailing labour
markets, business mix, the structure of share-based
compensation programmes and the external environment.
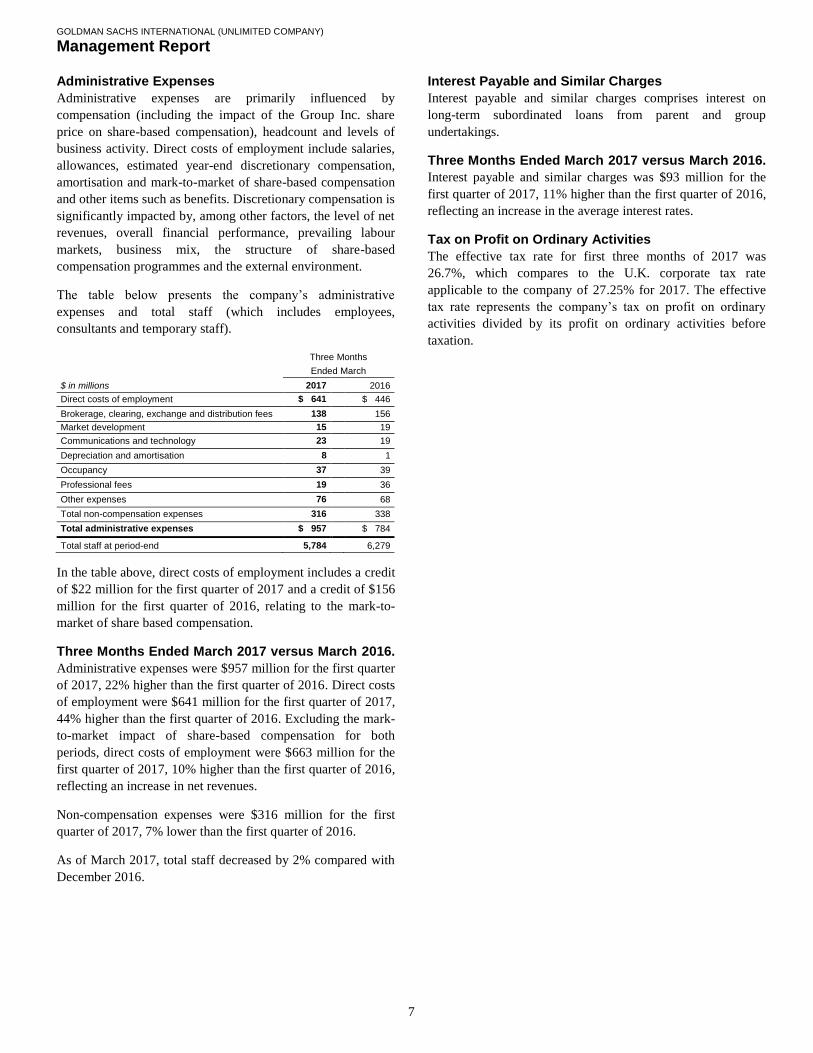
The table below presents the company’s administrative
expenses and total staff (which includes employees,
consultants and temporary staff).
Three Months
Ended March
$ in millions 2017 2016
Direct costs of employment $0,641 $0,446
Brokerage, clearing, exchange and distribution fees 138 156
Market development 15 19
Communications and technology 23 19
Depreciation and amortisation 8 1
Occupancy 37 39
Professional fees 19 36
Other expenses 76 68
Total non-compensation expenses 316 338
Total administrative expenses $0,957 $0,784
Total staff at period-end 5,784 6,279
In the table above, direct costs of employment includes a credit
of $22 million for the first quarter of 2017 and a credit of $156
million for the first quarter of 2016, relating to the mark-to-
market of share based compensation.
Three Months Ended March 2017 versus March 2016.
Administrative expenses were $957 million for the first quarter
of 2017, 22% higher than the first quarter of 2016. Direct costs
of employment were $641 million for the first quarter of 2017,
44% higher than the first quarter of 2016. Excluding the mark-
to-market impact of share-based compensation for both
periods, direct costs of employment were $663 million for the
first quarter of 2017, 10% higher than the first quarter of 2016,
reflecting an increase in net revenues.
Non-compensation expenses were $316 million for the first
quarter of 2017, 7% lower than the first quarter of 2016.
As of March 2017, total staff decreased by 2% compared with
December 2016.
Interest Payable and Similar Charges
Interest payable and similar charges comprises interest on
long-term subordinated loans from parent and group
undertakings.
Three Months Ended March 2017 versus March 2016.
Interest payable and similar charges was $93 million for the
first quarter of 2017, 11% higher than the first quarter of 2016,
reflecting an increase in the average interest rates.
Tax on Profit on Ordinary Activities
The effective tax rate for first three months of 2017 was
26.7%, which compares to the U.K. corporate tax rate
applicable to the company of 27.25% for 2017. The effective
tax rate represents the company’s tax on profit on ordinary
activities divided by its profit on ordinary activities before
taxation.

GOLDMAN SACHS INTERNATIONAL (UNLIMITED COMPANY)
Management Report
8
Balance Sheet and Funding Sources
Balance Sheet Management
One of the company’s risk management disciplines is its ability
to manage the size and composition of its balance sheet. GSI
leverages the firmwide balance sheet management process
performed at the GS Group level to manage these factors.
While the asset base of Group Inc. and its subsidiaries changes
due to client activity, market fluctuations and business
opportunities, the size and composition of the company’s
balance sheet also reflects factors including (i) the overall risk
tolerance of GS Group, (ii) the amount of equity capital held
by GS Group and (iii) the funding profile of GS Group, among
other factors. See “Equity Capital Management and Regulatory
Capital — Equity Capital Management” for information about
the company’s equity capital management process.
In order to ensure appropriate risk management, GSI seeks to
maintain a sufficiently liquid balance sheet and leverages GS
Group’s processes to dynamically manage its assets and
liabilities which include (i) balance sheet planning, (ii)
business-specific limits, (iii) monitoring of key metrics and (iv)
scenario analyses. See “Balance Sheet and Funding Sources —
Balance Sheet Management” in Part I of the 2016 Annual
Report for further information about the company’s balance
sheet management process.
Liquidity and Cash
The company maintains liquidity to meet a broad range of
potential cash outflows and collateral needs in a stressed
environment, referred to as Global Core Liquid Assets
(GCLA). See “Risk Management — Liquidity Risk
Management — Liquidity Risk Management Principles —
Global Core Liquid Assets” for details about the composition
and sizing of the company’s GCLA.
Funding Sources
The company’s primary sources of funding are secured
financings, intercompany unsecured borrowings and external
unsecured borrowings. GSI raises this funding through a
number of different products, including:
Collateralised financings, which are repurchase agreements
and securities loaned;
Intercompany unsecured loans from Group Inc. and other
affiliates; and
Debt securities issued to both external counterparties and
affiliates, which includes securitised derivative products
(including notes, certificates and warrants) and vanilla debt,
as well as transfers of assets accounted for as financings
rather than sales.
GSI generally distributes funding products through its own
sales force and third-party distributors to a large, diverse
creditor base in a variety of global markets. The company
believes that its relationships with external creditors are critical
to its liquidity. These creditors include banks, securities
lenders, pension funds, insurance companies, mutual funds and
individuals. GSI has imposed various internal guidelines to
monitor creditor concentration across its external funding
programmes.
Secured Funding. The company funds a significant amount
of inventory on a secured basis, with external counterparties as
well as with affiliates, including repurchase agreements,
securities loaned and other secured financings. The company
may also pledge its inventory as collateral for securities
borrowed under a securities lending agreement or as collateral
for derivative transactions. The company also uses its own
inventory to cover transactions in which the company or its
clients have sold securities that have not yet been purchased.
Secured funding is less sensitive to changes in Group Inc.
and/or GSI’s credit quality than unsecured funding, due to the
posting of collateral to lenders. Nonetheless, GSI continually
analyses the refinancing risk of its secured funding activities,
taking into account trade tenors, maturity profiles, counterparty
concentrations, collateral eligibility and counterparty rollover
probabilities. GSI seeks to mitigate its refinancing risk by
executing term trades with staggered maturities, diversifying
counterparties, raising excess secured funding, and pre-funding
residual risk through the GCLA.
GOLDMAN SACHS INTERNATIONAL (UNLIMITED COMPANY)
Management Report
9
GSI seeks to raise secured funding with a term appropriate for
the liquidity of the assets that are being financed, and seeks
longer maturities for secured funding collateralised by asset
classes that may be harder to fund on a secured basis,
especially during times of market stress, such as: mortgage and
other asset-backed loans and securities; non-investment-grade
corporate debt securities; equity securities; and emerging
market securities. GSI’s external secured funding, excluding
funding collateralised by liquid government obligations, is
primarily executed for tenors of one month or greater.
A majority of the company’s secured funding for securities not
eligible for inclusion in the GCLA is executed through term
repurchase agreements and securities loaned contracts. The
company also raises financing through debt securities.
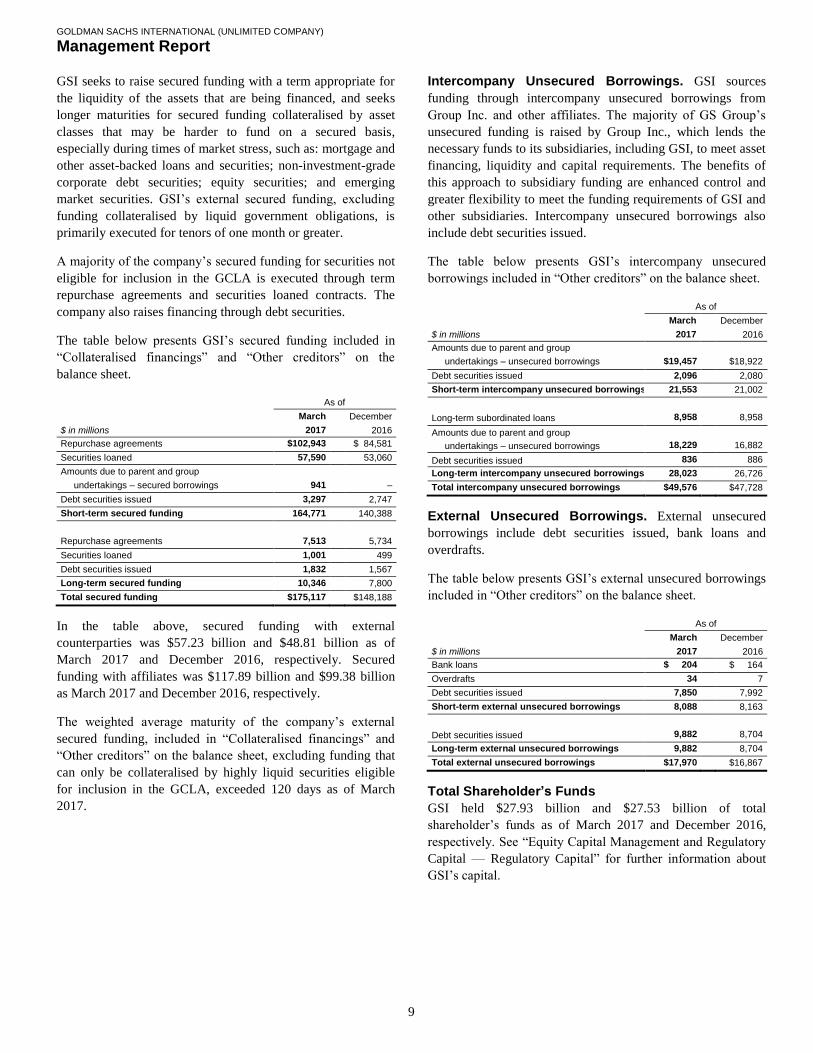
The table below presents GSI’s secured funding included in
“Collateralised financings” and “Other creditors” on the
balance sheet.
As of
March December
$ in millions 2017 2016
Repurchase agreements $102,943 $184,581
Securities loaned 57,590 53,060
Amounts due to parent and group
undertakings – secured borrowings 941 –
Debt securities issued 3,297 2,747
Short-term secured funding 164,771 140,388
Repurchase agreements 7,513 5,734
Securities loaned 1,001 499
Debt securities issued 1,832 1,567
Long-term secured funding 10,346 7,800
Total secured funding $175,117 $148,188
In the table above, secured funding with external
counterparties was $57.23 billion and $48.81 billion as of
March 2017 and December 2016, respectively. Secured
funding with affiliates was $117.89 billion and $99.38 billion
as March 2017 and December 2016, respectively.
The weighted average maturity of the company’s external
secured funding, included in “Collateralised financings” and
“Other creditors” on the balance sheet, excluding funding that
can only be collateralised by highly liquid securities eligible
for inclusion in the GCLA, exceeded 120 days as of March
2017.
Intercompany Unsecured Borrowings. GSI sources
funding through intercompany unsecured borrowings from
Group Inc. and other affiliates. The majority of GS Group’s
unsecured funding is raised by Group Inc., which lends the
necessary funds to its subsidiaries, including GSI, to meet asset
financing, liquidity and capital requirements. The benefits of
this approach to subsidiary funding are enhanced control and
greater flexibility to meet the funding requirements of GSI and
other subsidiaries. Intercompany unsecured borrowings also
include debt securities issued.
The table below presents GSI’s intercompany unsecured
borrowings included in “Other creditors” on the balance sheet.
As of
March December
$ in millions 2017 2016
Amounts due to parent and group
undertakings – unsecured borrowings $19,457 $18,922
Debt securities issued 2,096 2,080
Short-term intercompany unsecured borrowings 21,553 21,002
Long-term subordinated loans 8,958 8,958
Amounts due to parent and group
undertakings – unsecured borrowings 18,229 16,882
Debt securities issued 836 886
Long-term intercompany unsecured borrowings 28,023 26,726
Total intercompany unsecured borrowings $49,576 $47,728
External Unsecured Borrowings. External unsecured
borrowings include debt securities issued, bank loans and
overdrafts.
The table below presents GSI’s external unsecured borrowings
included in “Other creditors” on the balance sheet.
As of
March December
$ in millions 2017 2016
Bank loans $15,204 $15,164
Overdrafts 34 7
Debt securities issued 7,850 7,992
Short-term external unsecured borrowings 8,088 8,163
Debt securities issued 9,882 8,704
Long-term external unsecured borrowings 9,882 8,704
Total external unsecured borrowings $17,970 $16,867
Total Shareholder’s Funds
GSI held $27.93 billion and $27.53 billion of total
shareholder’s funds as of March 2017 and December 2016,
respectively. See “Equity Capital Management and Regulatory
Capital — Regulatory Capital” for further information about
GSI’s capital.

GOLDMAN SACHS INTERNATIONAL (UNLIMITED COMPANY)
Management Report
10
Equity Capital Management and Regulatory
Capital
Capital adequacy is of critical importance to the company. The
company has in place a comprehensive capital management
policy that provides a framework, defines objectives and
establishes guidelines to assist the company in maintaining the
appropriate level and composition of capital in both business-
as-usual and stressed conditions.
Equity Capital Management
The company determines the appropriate level and
composition of its equity capital by considering multiple
factors including the company’s current and future regulatory
capital requirements, the results of the company’s capital
planning and stress testing process and other factors such as
rating agency guidelines, the business environment and
conditions in the financial markets.
The company’s capital planning and stress testing process
incorporates internally designed stress tests and those required
under the PRA’s Internal Capital Adequacy Assessment
Process (ICAAP). It is also designed to identify and measure
material risks associated with business activities, including
market risk, credit risk, operational risk and other risks. The
company’s goal is to hold sufficient capital to ensure that it
remains adequately capitalised after experiencing a severe
stress event. The company’s assessment of capital adequacy is
viewed in tandem with its assessment of liquidity adequacy
and is integrated into its overall risk management structure,
governance and policy framework.
In addition, as part of the company’s comprehensive capital
management policy, a contingency capital plan is maintained
that provides a framework for analysing and responding to a
perceived or actual capital deficiency, including, but not
limited to, identification of drivers of a capital deficiency, as
well as mitigants and potential actions. It outlines the
appropriate communication procedures to follow during a
crisis period, including internal dissemination of information as
well as timely communication with external stakeholders.
Regulatory Capital
The company is subject to the revised capital framework for
E.U.-regulated financial institutions (the fourth E.U. Capital
Requirements Directive and E.U. Capital Requirements
Regulation, collectively known as “CRD IV”). These capital
regulations are largely based on the Basel Committee on
Banking Supervision’s (Basel Committee) final capital
framework for strengthening international capital standards
(Basel III). The Basel Committee is the primary global
standard setter for prudential bank regulation, and its member
jurisdictions implement regulations based on its standards and
guidelines.
The risk-based capital requirements are expressed as capital
ratios that compare measures of regulatory capital to risk-
weighted assets (RWAs). The Common Equity Tier 1 (CET1)
ratio is defined as CET1 divided by RWAs. The Tier 1 capital
ratio is defined as Tier 1 capital divided by RWAs. The total
capital ratio is defined as total capital divided by RWAs.
Under CRD IV, the minimum CET1, Tier 1 capital and Total
capital ratios (collectively the Pillar 1 capital requirements) are
supplemented by:
A capital conservation buffer, consisting entirely of capital
that qualifies as CET1, began to phase in on January 1, 2016,
and will continue to do so in increments of 0.625% per year
until it reaches 2.5% of RWAs on January 1, 2019.
A countercyclical capital buffer of up to 2.5% (and also
consisting entirely of CET1) in order to counteract excessive
credit growth. The buffer only applies to the company’s
exposures to certain types of counterparties based in
jurisdictions which have announced a countercyclical buffer.
Since these exposures are not currently material, the buffer
adds less than 0.01% to the CET1 ratio and has an immaterial
impact on the capital of the company. The countercyclical
capital buffer applicable to the company could change in the
future and, as a result, the company’s minimum ratios could
increase.
Individual capital guidance under Pillar 2A (an additional
amount to cover risks not adequately captured in Pillar 1).
The PRA performs a periodic supervisory review of the
company’s ICAAP, which leads to a final determination by
the PRA of individual capital guidance under Pillar 2A. This
is a point in time assessment of the minimum amount of
capital the PRA considers that a firm should hold.
The table below presents the company’s minimum required
ratios.
March 2017 December 2016
Minimum Ratio Minimum Ratio
CET1 ratio 7.2% 6.5%
Tier 1 capital ratio 9.2% 8.5%
Total capital ratio 11.8% 11.2%
These minimum ratios incorporate the Pillar 2A capital
guidance received from the PRA and could change in the
future. In addition to the Pillar 2A capital guidance, the PRA
also defines forward looking capital guidance which represents
the PRA’s view of the capital that the company would require
to absorb losses in stressed market conditions. This is known
as Pillar 2B or the “PRA buffer” and is not reflected in the
minimum ratios shown above. As the capital conservation
buffer phases in, as described above, it will fully or partially
replace the PRA buffer.

GOLDMAN SACHS INTERNATIONAL (UNLIMITED COMPANY)
Management Report
11
During the three months ended March 2017 and the year ended
December 2016, GSI was in compliance with the capital
requirements set by the PRA.
Regulatory Capital Ratios
The table below presents GSI’s capital ratios under CRD IV.
As of
March December
2017 2016
CET1 ratio 12.7% 12.9%
Total capital ratio 16.7% 17.2%
In the table above, the CET1 ratio and Total capital ratio as of
March 2017 include approximately 20 basis points attributable
to the company’s profit for the three months ended March
2017. This represents the company’s profit for the financial
period divided by its RWAs.
As of March 2017 and December 2016, GSI did not have any
financial instruments which qualified as additional Tier 1
capital and the Tier 1 capital ratio was identical to the CET1
ratio disclosed above.
Certain CRD IV rules are subject to final technical standards
and clarifications, which will be issued by the European
Banking Authority and adopted by the European Commission
and PRA. All capital, RWAs and estimated ratios are based on
current interpretation, expectations and understanding of CRD
IV and may evolve as its interpretation and application is
discussed with the company’s regulators.
Capital Resources
The table below presents GSI’s capital components under CRD
IV.
As of
March December
$ in millions 2017 2016
Called up share capital $ 582 $ 582
Share premium account including capital reserves 4,881 4,881
Retained earnings 22,471 22,070
Total shareholder’s funds 27,934 27,533
Deductions (680) (1,080)
Common Equity Tier 1 and Tier 1 capital $27,254 $26,453
Tier 2 and Total capital
Long-term subordinated loans $08,958 $08,958
Deductions (298) (48)
Tier 2 capital 8,660 8,910
Total capital $35,914 $35,363
Risk-Weighted Assets
The table below presents the components of RWAs within
GSI’s regulatory capital ratios under CRD IV. See “Equity
Capital Management and Regulatory Capital” in Part I of the
2016 Annual Report for a description of each RWA
component.
As of
March December
$ in millions 2017 2016
Credit RWAs $120,173 $114,420
Market RWAs 80,579 77,367
Operational RWAs 14,335 13,305
Total $215,087 $205,092
Leverage Ratio
The company is required to monitor and disclose its leverage
ratio using CRD IV’s definition of exposure as amended by the
European Commission Leverage Ratio Delegated Act. This
leverage ratio compares CRD IV’s definition of Tier 1 capital
to a measure of leverage exposure, defined as the sum of assets
plus certain off-balance-sheet exposures (which include a
measure of derivatives exposures, securities financing
transactions and commitments), less Tier 1 capital deductions.
Any required minimum ratio is expected to become effective
for GSI no earlier than January 1, 2018.
The table below presents GSI’s leverage ratio under CRD IV.
As of
March December
$ in millions 2017 2016
Tier 1 capital $ 27,254 $ 26,453
Leverage exposure $732,817 $697,402
Leverage ratio 3.7% 3.8%
In the table above, the leverage ratio as of March 2017 includes
approximately 6 basis points attributable to the company’s
profit for the three months ended March 2017. This represents
the company’s profit for the financial period divided by its
leverage exposure. This leverage ratio is based on the
company’s current interpretation and understanding of this rule
and may evolve as the interpretation and application of this
rule is discussed with the company’s regulators.
GOLDMAN SACHS INTERNATIONAL (UNLIMITED COMPANY)
Management Report
12
Regulatory Developments
GSI’s businesses are subject to significant and evolving
regulation. Reforms have been adopted or are being considered
by regulators and policy makers worldwide. The expectation is
that the principal areas of impact from regulatory reform for
GSI will be increased regulatory capital requirements and
increased regulation and restriction on certain activities.
However, given that many of the new and proposed rules are
highly complex, the full impact of regulatory reform will not
be known until the rules are implemented and market practices
develop under the final E.U. and/or U.K. regulations.
See “Regulatory Developments” in Part I of the 2016 Annual
Report for further information about the laws, rules and
regulations and proposed laws, rules and regulations that apply
to the company and its operations.
Swaps and Derivatives Regulation
From February 2017, the final margin rules published in the
Official Journal of the E.U. for uncleared derivatives became
effective. These rules were effective for variation margin
requirements in March 2017 and will phase in through
September 2020 for initial margin requirements depending on
counterparty type, the clearing threshold and derivatives
volumes.
As a registered “swap dealer” under the U.S. Commodity
Futures Trading Commission (CFTC) rules, the company is
also subject to the CFTC margin rules. In September 2016, the
final margin rules issued by the U.S. federal bank regulatory
agencies and the CFTC for uncleared swaps became effective.
These rules were effective for variation margin requirements in
March 2017 and will phase in through September 2020 for
initial margin requirements depending on the level of swaps,
security-based swaps and/or exempt foreign exchange
derivative transaction activity of the swap dealer and the
relevant counterparty. The final rules of the U.S. federal bank
regulatory agencies would generally apply to certain of the
company’s inter-affiliate transactions, with limited relief
available from initial margin requirements for affiliates. Under
the CFTC final rules, inter-affiliate transactions are exempt
from initial margin requirements with certain exceptions but
variation margin requirements still apply. The company
expects that its margin requirements will continue to increase
as the rules phase in.
Principal Risks and Uncertainties
GSI faces a variety of risks that are substantial and inherent in
its businesses including market, liquidity, credit, operational,
model, legal, regulatory and reputational risks and
uncertainties. Those risks and uncertainties are consistent with
those described in the 2016 Annual Report.
Risk Management
Risks are inherent in the company’s business and include
liquidity, market, credit, operational, model, legal, compliance,
regulatory and reputational risks. For further information about
the company’s risk management processes, see “Risk
Management — Overview and Structure of Risk Management”
in Part I of the 2016 Annual Report. The company’s risks
include the risks across its risk categories, regions or global
businesses, as well as those which have uncertain outcomes
and have the potential to materially impact the company’s
financial results, its liquidity and its reputation. For further
information about the company’s areas of risk, see “Liquidity
Risk Management”, “Market Risk Management”, “Credit Risk
Management”, “Operational Risk Management”, “Model Risk
Management” below and “Principal Risks and Uncertainties”
in Part I of the 2016 Annual Report.
Overview and Structure of Risk
Management
The company’s overview and structure of risk management is
consistent with the 2016 Annual Report. See “Risk
Management — Overview and Structure of Risk Management”
in Part I of the 2016 Annual Report for further details.

GOLDMAN SACHS INTERNATIONAL (UNLIMITED COMPANY)
Management Report
13
Liquidity Risk Management
Overview
Liquidity risk is the risk that the company will be unable to
fund itself or meet its liquidity needs in the event of company-
specific, broader industry, or market liquidity stress events.
Liquidity is of critical importance to the company, as most of
the failures of financial institutions have occurred in large part
due to insufficient liquidity. Accordingly, the company has in
place a comprehensive and conservative set of liquidity and
funding policies. The principal objective is to be able to fund
the company and to enable the core businesses to continue to
serve clients and generate revenues, even under adverse
circumstances.
Treasury has the primary responsibility for assessing,
monitoring and managing liquidity and funding strategy.
Treasury is independent of the revenue-producing units and
reports to GS Group’s chief financial officer.
GS Group’s Liquidity Risk Management function is an
independent risk management function responsible for control
and oversight of GS Group’s liquidity risk management
framework, including stress testing and limit governance.
Liquidity Risk Management is independent of the revenue-
producing units and Treasury, and reports to GS Group’s chief
risk officer.
Liquidity Risk Management Principles
GSI manages liquidity risk according to three principles (i)
hold sufficient excess liquidity in the form of GCLA to cover
outflows during a stressed period, (ii) maintain appropriate
Asset-Liability Management and (iii) maintain a viable
Contingency Funding Plan. See “Risk Management —
Liquidity Risk Management” in Part I of the 2016 Annual
Report for further details.
Global Core Liquid Assets. GCLA is liquidity that the
company maintains to meet a broad range of potential cash
outflows and collateral needs in a stressed environment. The
company’s most important liquidity policy is to pre-fund its
estimated potential cash and collateral needs during a liquidity
crisis and hold this liquidity in the form of unencumbered,
highly liquid securities and cash. The company believes that
the securities held in its GCLA would be readily convertible to
cash in a matter of days, through liquidation, by entering into
repurchase agreements or from maturities of securities
purchased under agreements to resell (resale agreements), and
that this cash would allow it to meet immediate obligations
without needing to sell other assets or depend on additional
funding from credit-sensitive markets.
Asset-Liability Management. The company’s liquidity risk
management policies are designed to ensure it has a sufficient
amount of financing, even when funding markets experience
persistent stress. The company manages maturities and
diversity of funding across markets, products and
counterparties, and seeks to maintain a diversified external
funding profile with an appropriate tenor, taking into
consideration the characteristics and liquidity profile of its
assets.
Contingency Funding Plan. GS Group maintains a
contingency funding plan, which has a GSI-specific addendum,
to provide a framework for analysing and responding to a
liquidity crisis situation or periods of market stress. The
contingency funding plan outlines a list of potential risk
factors, key reports and metrics that are reviewed on an
ongoing basis to assist in assessing the severity of, and
managing through, a liquidity crisis and/or market dislocation.
The contingency funding plan also describes the company’s
potential responses if assessments indicate that the company
has entered a liquidity crisis, which includes pre-funding for
what the company estimates will be its potential cash and
collateral needs as well as utilising secondary sources of
liquidity. Mitigants and action items to address specific risks
which may arise are also described and assigned to individuals
responsible for execution.
Liquidity Stress Tests
In order to determine the appropriate size of the company’s
GCLA, an internal liquidity model is used, referred to as the
Modeled Liquidity Outflow, which captures and quantifies the
company’s liquidity risks. Other factors are considered
including, but not limited to, an assessment of potential
intraday liquidity needs through an additional internal liquidity
model, referred to as the Intraday Liquidity Model, the results
of the company’s long-term stress testing models, applicable
regulatory requirements and a qualitative assessment of the
condition of the company as well as the financial markets. The
results of the Modeled Liquidity Outflow, the Intraday
Liquidity Model and the long-term stress testing models are
reported to senior management on a regular basis. See “Risk
Management — Liquidity Risk Management” in Part I of the
2016 Annual Report for further details.

GOLDMAN SACHS INTERNATIONAL (UNLIMITED COMPANY)
Management Report
14
GCLA and Unencumbered Metrics
GCLA. Based on the results of the company’s internal
liquidity risk models, described above, as well as consideration
of other factors including, but not limited to, an assessment of
the company’s potential intraday liquidity needs and a
qualitative assessment of the condition of the company as well
as the financial markets, the company believes its liquidity
position as of both March 2017 and December 2016 was
appropriate. As of March 2017 and December 2016, the fair
value of the securities and certain overnight cash deposits
included in GSI’s GCLA totalled $53.58 billion and $59.51
billion, respectively. The company strictly limits its GCLA to a
narrowly defined list of securities and cash because they are
highly liquid, even in a difficult funding environment. The
company does not include other potential sources of excess
liquidity, such as less liquid unencumbered securities or
committed credit facilities, in the GCLA. The fair value of the
company’s GCLA averaged $58.12 billion and $59.44 billion
for the three months ended March 2017 and December 2016,
respectively.
The table below presents the average fair value of the
company’s GCLA by asset class.
Average for the
Three Months Ended
March December
$ in millions 2017 2016
Overnight cash deposits $11,292 $11,651
U.S. government obligations 25,660 26,760
French government obligations 6,117 5,536
U.K. government obligations 6,834 7,121
German government obligations 5,936 6,217
Japanese government obligations 2,277 2,156
Total $58,116 $59,441
The company maintains its GCLA to enable it to meet current
and potential liquidity requirements. The minimum GCLA
required, as calculated by the Modeled Liquidity Outflow and
the Intraday Liquidity Model, is held by the company directly
and is intended for use only by GSI to meet its liquidity
requirements, and is assumed not to be available to Group Inc.
In addition to GCLA held in GSI, GS Group holds a portion of
global GCLA directly at Group Inc., which in some
circumstances may be additionally provided to GSI or other
major subsidiaries.
Other Unencumbered Assets. In addition to its GCLA,
the company has a significant amount of other unencumbered
cash and financial instruments, including other government
obligations, high-grade money market securities, corporate
obligations, marginable equities, loans and cash deposits not
included in its GCLA. The fair value of the company’s other
unencumbered assets averaged $26.15 billion and $28.48
billion for the three months ended March 2017 and December
2016, respectively. GSI does not consider these assets liquid
enough to be eligible for inclusion in its GCLA.
Liquidity Regulatory Framework
The implementation of the Basel Committee’s international
framework for liquidity risk management, standards and
monitoring calls for a liquidity coverage ratio (LCR) and a net
stable funding ratio (NSFR).
The LCR is designed to ensure that the entity maintains an
adequate level of unencumbered high-quality liquid assets
equal to or greater than the expected net cash outflows under
an acute short-term liquidity stress scenario. The LCR rule
issued by the European Commission became effective on
October 1, 2015. The PRA set out a phase-in period whereby
certain financial institutions, including GSI, must have an 80%
minimum ratio initially, increasing to 90% on January 1, 2017
and 100% on January 1, 2018.
The NSFR is designed to promote medium- and long-term
stable funding of the assets and off-balance-sheet activities of
banking organisations over a one-year time horizon. The Basel
Committee’s NSFR framework requires banking organisations
to maintain a minimum NSFR of 100%, and will be effective
on January 1, 2018. In November 2016, the European
Commission issued a proposed rule that would implement an
NSFR for certain E.U. financial institutions, including GSI.
The proposed rule would be effective two years after it is
incorporated into CRD IV.
The implementation of these rules, and any amendments
adopted by the applicable regulatory authorities, could impact
the company’s liquidity and funding requirements and
practices in the future.

GOLDMAN SACHS INTERNATIONAL (UNLIMITED COMPANY)
Management Report
15
Credit Ratings
GSI relies on the debt capital markets to fund a portion of its
day-to-day operations and the cost and availability of debt
financing is influenced by its credit rating and that of Group
Inc. Credit ratings are also important when GSI is competing in
certain markets, such as OTC derivatives, and when GSI seeks
to engage in longer-term transactions. See “Principal Risks and
Uncertainties — Liquidity” in Part I of the 2016 Annual Report
for information about the risks associated with a reduction in
GSI’s and/or Group Inc.’s credit rating.
The table below presents the unsecured credit ratings and
outlook of GSI and Group Inc. by Fitch, Inc. (Fitch), Moody’s
Investors Service (Moody’s) and Standard & Poor’s Ratings
Services (S&P).
As of March 2017
Fitch Moody’s S&P
GSI
Short-term Debt F1 P-1 A-1
Long-term Debt A A1 A+
Ratings Outlook Stable Stable Stable
Group Inc.
Short-term Debt F1 P-2 A-2
Long-term Debt A A3 BBB+
Subordinated Debt A- Baa2 BBB-
Trust Preferred BBB- Baa3 BB
Preferred Stock BB+ Ba1 BB
Ratings Outlook Stable Stable Stable
Certain of the company’s derivatives have been transacted
under bilateral agreements with counterparties who may
require GSI to post collateral or terminate the transactions
based on changes in the credit ratings of either GSI and/or
Group Inc. The company assesses the impact of these bilateral
agreements by determining the collateral or termination
payments that would occur assuming a downgrade by all rating
agencies of both Group Inc. and GSI simultaneously and of
each entity individually. A downgrade by any one rating
agency, depending on the agency’s relative ratings of Group
Inc. and GSI at the time of the downgrade, may have an impact
which is comparable to the impact of a downgrade by all rating
agencies. The company manages its GCLA to ensure that it
would, among other potential requirements, be able to make
the additional collateral or termination payments that may be
required in the event of a two-notch reduction in Group Inc.
and/or GSI’s long-term credit ratings, as well as collateral that
has not been called by counterparties, but is available to them.
The table below presents the additional collateral or
termination payments related to the company’s net derivative
liabilities under bilateral agreements that could have been
called at the reporting date by counterparties in the event of a
one-notch and two-notch downgrade in Group Inc.’s and/or
GSI’s credit ratings.
As of
March December
$ in millions 2017 2016
Additional collateral or termination payments:
One-notch downgrade $1,150 $ 491
Two-notch downgrade $1,364 $1,811
Cash Flows
As a financial institution, the company’s cash flows are
complex and bear little relation to the company’s profitability
and net assets. Consequently, the company believes that
traditional cash flow analysis is less meaningful in evaluating
its liquidity position than the liquidity and asset-liability
management policies described above and in more detail in
“Risk Management — Liquidity Risk Management” in Part I
of the 2016 Annual Report. Cash flow analysis may, however,
be helpful in highlighting certain macro trends and strategic
initiatives in the company’s businesses.
The statements of cash flows are set out on page 26 of this
financial report.
Three Months Ended March 2017. The company’s cash
and cash equivalents increased by $2.07 billion to $19.04
billion at the end of the first quarter of 2017. The company
generated $2.29 billion in net cash from operating activities.
Three Months Ended March 2016. The company’s cash
and cash equivalents increased by $4.08 billion to $14.25
billion at the end of the first quarter of 2016. The company
generated $4.26 billion in net cash from operating activities.

GOLDMAN SACHS INTERNATIONAL (UNLIMITED COMPANY)
Management Report
16
Market Risk Management
Overview
Market risk is the risk of loss in the value of the company’s
inventory, as well as certain other financial assets and financial
liabilities, due to changes in market conditions. The company
employs a variety of risk measures, each described in the
respective sections below, to monitor market risk. The
company holds inventory primarily for market making for
clients. The company’s inventory therefore changes based on
client demands. The company’s inventory is accounted for at
fair value and therefore fluctuates on a daily basis, with the
related gains and losses included in net revenues. Categories of
market risk include the following:
Interest rate risk: results from exposures to changes in the
level, slope and curvature of yield curves, the volatilities of
interest rates, mortgage prepayment speeds and credit
spreads;
Equity price risk: results from exposures to changes in prices
and volatilities of individual equities, baskets of equities and
equity indices;
Currency rate risk: results from exposures to changes in spot
prices, forward prices and volatilities of currency rates; and
Commodity price risk: results from exposures to changes in
spot prices, forward prices and volatilities of commodities,
such as crude oil and metals.
Market Risk Management, which is independent of the
revenue-producing units and reports to the GS Group chief risk
officer, has primary responsibility for assessing, monitoring
and managing market risk. Risks are monitored and controlled
through strong oversight and independent control and support
functions across the global businesses.
Managers in revenue-producing units and Market Risk
Management discuss market information, positions and
estimated risk and loss scenarios on an ongoing basis.
Managers in revenue-producing units are accountable for
managing risk within prescribed limits, both at the GS Group
and GSI level. These managers have in-depth knowledge of
their positions, markets and the instruments available to hedge
their exposures.
Market Risk Management Process
The company manages market risk by diversifying exposures,
controlling position sizes and establishing economic hedges in
related securities or derivatives. This process includes:
Accurate and timely exposure information incorporating
multiple risk metrics;
A dynamic limit setting framework; and
Constant communication among revenue-producing units,
risk managers and senior management.
GSI’s framework for managing market risk is consistent with,
and part of, the GS Group framework, and results are analysed
by business and in aggregate, at both the GS Group and GSI
level.
Risk Measures
Market Risk Management produces risk measures and
monitors them against established market risk limits. These
measures reflect an extensive range of scenarios and the results
are aggregated at the product, business and company-wide
level.
A variety of risk measures are used to estimate the size of
potential losses for both moderate and more extreme market
moves over both short-term and long-term time horizons.
Primary risk measures are VaR, used for shorter-term periods,
and stress tests. The GSI risk report details key risks, drivers
and changes for each business, and is distributed daily to senior
management of both the revenue-producing units and
independent control and support functions.
Value-at-Risk. VaR is the potential loss in value due to
adverse market movements over a defined time horizon with a
specified confidence level. A one-day time horizon with a 95%
confidence level is typically employed. The VaR model is a
single model that captures risks including interest rates, equity
prices, currency rates and commodity prices. As such, VaR
facilitates comparison across portfolios of different risk
characteristics. VaR also captures the diversification of
aggregated risk across GSI. See “Risk Management — Market
Risk Management” in Part I of the 2016 Annual Report for
further details.
Limits. Risk limits are used at various levels (including entity,
business and product) to govern risk appetite by controlling the
size of its exposures to market risk. Limits for GSI are set
based on VaR and on a range of stress tests relevant to the
company’s exposures. Limits are reviewed frequently and
amended on a permanent or temporary basis to reflect
changing market conditions, business conditions or tolerance
for risk.
GOLDMAN SACHS INTERNATIONAL (UNLIMITED COMPANY)
Management Report
17
The GSI Board Risk Committee and the GSI Risk Committee
set market risk limits for the company at an overall, business
and product level, consistent with the company’s risk appetite.
In addition, Market Risk Management (through delegated
authority from the GSI Risk Committee) sets market risk sub-
limits at certain business and product levels.
The purpose of the company-wide limits is to assist senior
management in controlling the overall risk profile. Sub-limits
are set below the approved level of risk limits. Sub-limits set
the desired maximum amount of exposure that may be
managed by any particular business on a day-to-day basis
without additional levels of senior management approval,
effectively leaving day-to-day decisions to individual desk
managers and traders. Accordingly, sub-limits are a
management tool designed to ensure appropriate escalation
rather than to establish maximum risk tolerance. Sub-limits
also distribute risk among various businesses in a manner that
is consistent with their level of activity and client demand,
taking into account the relative performance of each area.
Market risk limits are monitored daily by Market Risk
Management, which is responsible for identifying and
escalating, on a timely basis, instances where limits have been
exceeded.
When a risk limit has been exceeded (e.g., due to positional
changes or changes in market conditions, such as increased
volatilities or changes in correlations), it is escalated to senior
managers in Market Risk Management and the appropriate risk
committee. Such instances are remediated by an inventory
reduction and/or a temporary or permanent increase to the risk
limit.
Metrics
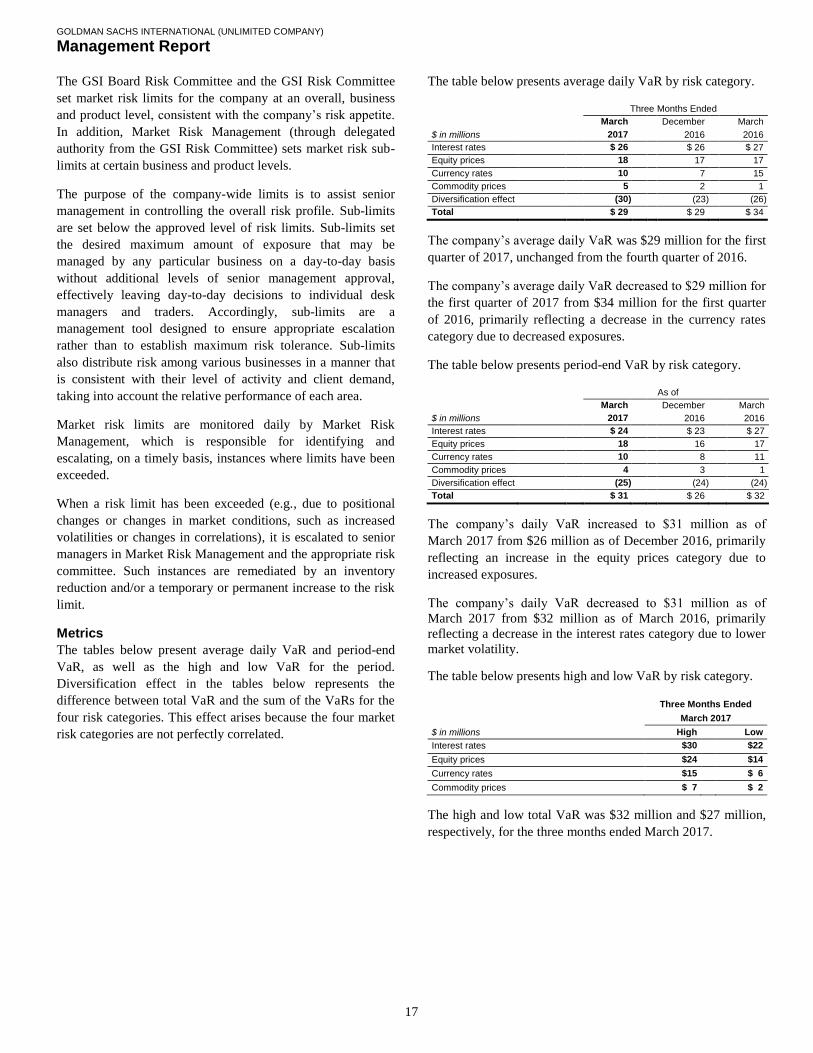
The tables below present average daily VaR and period-end
VaR, as well as the high and low VaR for the period.
Diversification effect in the tables below represents the
difference between total VaR and the sum of the VaRs for the
four risk categories. This effect arises because the four market
risk categories are not perfectly correlated.
The table below presents average daily VaR by risk category.
Three Months Ended
March December March
$ in millions 2017 2016 2016
Interest rates $ 26 $ 26 $ 27
Equity prices 18 17 17
Currency rates 10 7 15
Commodity prices 5 2 1
Diversification effect (30) (23) (26)
Total $ 29 $ 29 $ 34
The company’s average daily VaR was $29 million for the first
quarter of 2017, unchanged from the fourth quarter of 2016.
The company’s average daily VaR decreased to $29 million for
the first quarter of 2017 from $34 million for the first quarter
of 2016, primarily reflecting a decrease in the currency rates
category due to decreased exposures.
The table below presents period-end VaR by risk category.
As of
March December March
$ in millions 2017 2016 2016
Interest rates $ 24 $ 23 $ 27
Equity prices 18 16 17
Currency rates 10 8 11
Commodity prices 4 3 1
Diversification effect (25) (24) (24)
Total $ 31 $ 26 $ 32
The company’s daily VaR increased to $31 million as of
March 2017 from $26 million as of December 2016, primarily
reflecting an increase in the equity prices category due to
increased exposures.
The company’s daily VaR decreased to $31 million as of
March 2017 from $32 million as of March 2016, primarily
reflecting a decrease in the interest rates category due to lower
market volatility.
The table below presents high and low VaR by risk category.
Three Months Ended
March 2017
$ in millions High Low
Interest rates $30 $22
Equity prices $24 $14
Currency rates $15 $06
Commodity prices $07 $02
The high and low total VaR was $32 million and $27 million,
respectively, for the three months ended March 2017.

GOLDMAN SACHS INTERNATIONAL (UNLIMITED COMPANY)
Management Report
18
Sensitivity Measures
Certain portfolios and individual positions are not included in
VaR because VaR is not the most appropriate risk measure for
these positions.
10% Sensitivity Measures. The table below presents
market risk for positions, accounted for at fair value, that are
not included in VaR by asset category. The market risk of these
positions is determined by estimating the potential reduction in
net revenues of a 10% decline in the value of these positions.
As of
March December
$ in millions 2017 2016
Equity $10.1 $11.8
Debt 0.1 0.1
Total $10.2 $11.9
Credit Risk Management
Overview
Credit risk represents the potential for loss due to the default or
deterioration in credit quality of a counterparty (e.g., an OTC
derivatives counterparty or a borrower) or an issuer of
securities or other instruments the company holds. The
company’s exposure to credit risk comes mostly from client
transactions in OTC derivatives. Credit risk also comes from
cash placed with banks, securities financing transactions (i.e.,
resale and repurchase agreements and securities borrowing and
lending activities) and debtors.
Credit Risk Management, which is independent of the
revenue-producing units and reports to GS Group’s chief risk
officer, has primary responsibility for assessing, monitoring
and managing credit risk. GSI’s framework for managing
credit risk is consistent with the framework of GS Group. GS
Group’s Credit Policy Committee and Firmwide Risk
Committee establish and review credit policies and parameters
for GS Group as a whole. In addition, the company holds other
positions that give rise to credit risk (e.g., bonds held in
inventory). These credit risks are captured as a component of
market risk measures, which are monitored and managed by
Market Risk Management, consistent with other inventory
positions. The company also enters into derivatives to manage
market risk exposures. Such derivatives also give rise to credit
risk which is monitored and managed by Credit Risk
Management.
Credit Risk Management Process
Effective management of credit risk requires accurate and
timely information, a high level of communication and
knowledge of customers, countries, industries and products.
The process for managing credit risk includes:
Approving transactions and setting and communicating credit
exposure limits;
Monitoring compliance with established credit exposure
limits;
Assessing the likelihood that a counterparty will default on
its payment obligations;
Measuring the company’s current and potential credit
exposure and losses resulting from counterparty default;
Reporting of credit exposures to senior management, the GSI
board of directors and regulators;
Using credit risk mitigants, including collateral and hedging;
and
Communicating and collaborating with other independent
control and support functions such as operations, legal and
compliance.
As part of the risk assessment process, Credit Risk
Management performs credit reviews, which include initial and
ongoing analyses of the company’s counterparties. For
substantially all of the company’s credit exposures, the core of
the process is an annual counterparty credit review. A credit
review is an independent analysis of the capacity and
willingness of a counterparty to meet its financial obligations,
resulting in an internal credit rating. The determination of
internal credit ratings also incorporates assumptions with
respect to the nature of and outlook for the counterparty’s
industry and the economic environment. Senior personnel
within Credit Risk Management, with expertise in specific
industries, inspect and approve credit reviews and internal
credit ratings.
The global credit risk management systems capture credit
exposure to individual counterparties and on an aggregate basis
to counterparties and their subsidiaries (economic groups).
These systems also provide management with comprehensive
information on aggregate credit risk by product, internal credit
rating, industry, country and region.

GOLDMAN SACHS INTERNATIONAL (UNLIMITED COMPANY)
Management Report
19
Risk Measures and Limits
Credit risk is measured based on the potential loss in the event
of non-payment by a counterparty using current and potential
exposure. For derivatives and securities financing transactions,
current exposure represents the amount presently owed to the
company after taking into account applicable netting and
collateral arrangements while potential exposure represents the
company’s estimate of the future exposure that could arise over
the life of a transaction based on market movements within a
specified confidence level. Potential exposure also takes into
account netting and collateral arrangements.
Credit limits are used at various levels (e.g., counterparty,
economic group, industry and country) to control the size and
nature of the company’s credit exposures. Limits for
counterparties and economic groups are reviewed regularly and
revised to reflect changing risk appetites for a given
counterparty or group of counterparties. Limits for industries
and countries are based on the company’s risk tolerance and
are designed to allow for regular monitoring, review, escalation
and management of credit risk concentrations.
The GSI Board Risk Committee and the GSI Risk Committee
approve credit risk limits for the company at the company-
wide, business and product level, consistent with the
company’s risk appetite. Furthermore, the GSI Risk Committee
approves the framework that governs the setting of credit risk
sub-limits at the GSI level, which is delegated to the GSI
Credit Committee. Credit Risk Management (through
delegated authority from GS Group’s Risk Governance
Committee and the GSI Credit Committee) sets credit limits
for individual counterparties, economic groups, industries and
countries. Policies authorised by GS Group’s Firmwide Risk
Committee, Risk Governance Committee and Credit Policy
Committee prescribe the level of formal approval required for
GS Group to assume credit exposure to a counterparty across
all product areas, taking into account any applicable netting
provisions, collateral or other credit risk mitigants.
Credit Exposures
GSI’s credit exposures are described further below.
Financial Instruments Owned. Financial instruments
owned includes cash instruments and derivatives. The
company’s credit exposure on derivatives arises primarily from
market-making activities. As a market maker, the company
enters into derivative transactions to provide liquidity to clients
and to facilitate the transfer and hedging of their risks. The
company also enters into derivatives to manage market risk
exposures. In the table below cash instruments are included in
the gross exposure; however, to the extent that they have been
captured by market risk they are removed to arrive at net credit
exposure. Derivatives are reported at fair value on a gross by
counterparty basis in the company’s financial statements unless
it has current legal right of set-off and also intends to settle on
a net basis. OTC derivatives are risk managed using the risk
processes, measures and limits described above, and in more
detail in “Risk Management — Credit Risk Management” in
Part I of the 2016 Annual Report.
Collateralised Agreements. The company bears credit risk
related to collateralised agreements only to the extent that cash
advanced to the counterparty exceeds the value of the collateral
received. The company’s credit exposure on these transactions
is therefore significantly lower than the amounts recorded on
the balance sheet, which represent fair values or contractual
value before consideration of collateral received. The company
also has credit exposure on collateralised financings, which are
liabilities on its balance sheet, to the extent that the value of
collateral pledged to the counterparty for these transactions
exceeds the amount of cash or collateral received.
Debtors. The company is exposed to credit risk from its
debtors through its amounts due from broker/dealers and
customers; and amounts due from parent and group
undertakings. These primarily comprise receivables related to
cash collateral paid to counterparties and clearing organisations
in respect of derivative financial instrument liabilities. Debtors
also includes collateralised receivables related to customer
securities transactions, which generally have minimal credit
risk due to both the value of the collateral received and the
short-term nature of these receivables.
Cash at Bank and in Hand. Cash at bank and in hand
include both interest-bearing and non-interest-bearing deposits.
To mitigate the risk of credit loss, the company places
substantially all of its deposits with highly-rated banks and
central banks.

GOLDMAN SACHS INTERNATIONAL (UNLIMITED COMPANY)
Management Report
20
The tables below present the company’s gross credit exposure
to financial assets and net credit exposure after taking account
of assets captured by market risk in the company’s risk
management process, counterparty netting (i.e., the netting of
financial assets and financial liabilities for a given counterparty
when a legal right of setoff exists under an enforceable netting
agreement), and cash and security collateral received and cash
collateral posted under credit support agreements, which
management considers when determining credit risk. This is
presented by financial asset class and by credit rating
equivalent (internally determined public rating agency
equivalents).
Assets
captured Security
Gross by market Counterparty Cash collateral Net credit
$ in millions exposure risk netting collateral received exposure
Financial Asset Class
As of March 2017
Financial instruments owned $617,888 $(64,512) $(485,081) $(33,511) $ (14,970) $19,814
Collateralised agreements 206,223 – (99,364) – (104,851) 2,008
Debtors 68,788 – (4,483) (34,291) (5,703) 24,311
Cash at bank and in hand 19,070 – – – – 19,070
Total $911,969 $(64,512) $(588,928) $(67,802) $(125,524) $65,203
As of December 2016
Financial instruments owned $662,945 $(58,759) $(525,887) $(42,921) $ (16,136) $19,242
Collateralised agreements 184,600 – (85,692) – (95,741) 3,167
Debtors 68,960 – (3,531) (37,476) (4,864) 23,089
Cash at bank and in hand 16,888 – – – – 16,888
Total $933,393 $(58,759) $(615,110) $(80,397) $(116,741) $62,386
Assets
captured Security
Gross by market Counterparty Cash collateral Net credit
$ in millions exposure risk netting collateral received exposure
Credit Rating Equivalent
As of March 2017
AAA/Aaa $ 19,544 $ – $ (2,383) $ (1,596) $ (2,608) $12,957
AA/Aa2 125,125 – (52,907) (19,484) (33,473) 19,261
A/A2 568,873 – (468,139) (23,404) (62,590) 14,740
BBB/Baa2 89,826 – (53,987) (16,438) (11,374) 8,027
BB/Ba2 or lower 39,756 – (11,426) (6,845) (15,005) 6,480
Unrated 68,845 (64,512) (86) (35) (474) 3,738
Total $911,969 $(64,512) $(588,928) $(67,802) $(125,524) $65,203
As of December 2016
AAA/Aaa $ 14,117 $ – $ (2,633) $ (2,172) $ (235) $19,077
AA/Aa2 124,593 – (56,064) (23,156) (26,761) 18,612
A/A2 603,808 – (488,712) (30,600) (66,657) 17,839
BBB/Baa2 91,020 – (56,285) (16,746) (9,573) 8,416
BB/Ba2 or lower 37,809 – (11,315) (7,709) (12,966) 5,819
Unrated 62,046 (58,759) (101) (14) (549) 2,623
Total $933,393 $(58,759) $(615,110) $(80,397) $(116,741) $62,386
GOLDMAN SACHS INTERNATIONAL (UNLIMITED COMPANY)
Management Report
21
The unrated net credit exposure of $3.74 billion and $2.62
billion as of March 2017 and December 2016, respectively,
relates to financial assets for which the company has not
assigned an internally determined public rating agency
equivalent.
In addition to credit risk on financial assets, the company also
has credit exposure in respect of contingent and forward
starting resale and securities borrowing agreements. The
company’s gross credit exposure related to these activities is
$63.20 billion and $43.60 billion as of March 2017 and
December 2016, respectively. However, this will be mitigated
by collateral of approximately $62.80 billion and $43.26
billion as of March 2017 and December 2016, respectively, if
these commitments are fulfilled. As a result, the company’s net
credit exposure to these commitments was $405 million and
$340 million as of March 2017 and December 2016,
respectively.
As of March 2017 and December 2016, financial assets past
due or impaired were not material.
Operational Risk Management
Overview
Operational risk is the risk of loss resulting from inadequate or
failed internal processes, people and systems or from external
events. Exposure to operational risk arises from routine
processing errors as well as extraordinary incidents, such as
major systems failures or legal and regulatory matters.
Potential types of loss events related to internal and external
operational risk include:
Clients, products and business practices;
Execution, delivery and process management;
Business disruption and system failures;
Employment practices and workplace safety;
Damage to physical assets;
Internal fraud; and
External fraud.
GSI’s framework for managing operational risk is fully
integrated in GS Group’s comprehensive control framework
designed to provide a well-controlled environment to minimise
operational risks. In GSI, the EMEA Operational Risk
Committee provides regional oversight for ongoing
development and implementation of the operational risk
framework and promotion of a robust overall control
environment. Operational Risk Management is a risk
management function independent of revenue-producing units,
reports to GS Group’s chief risk officer, and is responsible for
developing and implementing policies, methodologies and a
formalised framework for operational risk management with
the goal of maintaining the company’s exposure to operational
risk at levels that are within its risk appetite.
Operational Risk Management Process
Managing operational risk requires timely and accurate
information as well as a strong control culture. Operational risk
is managed through:
Training, supervision and development of people;
Active participation of senior management in identifying and
mitigating key operational risks;
Independent control and support functions that monitor
operational risk on a daily basis, and implementation of
extensive policies and procedures, and controls designed to
prevent the occurrence of operational risk events;
Proactive communication between revenue-producing units
and independent control and support functions; and
A network of systems to facilitate the collection of data used
to analyse and assess operational risk exposure.
Top-down and bottom-up approaches are combined to manage
and measure operational risk. From a top-down perspective,
senior management assesses company-wide and business-level
operational risk profiles. From a bottom-up perspective,
revenue-producing units and independent control and support
functions are responsible for risk identification and risk
management on a day-to-day basis, including escalating
operational risks to senior management.
The operational risk management framework is in part
designed to comply with the operational risk measurement
rules under Basel III and has evolved based on the changing
needs of the company’s businesses and regulatory guidance.
The operational risk management framework comprises the
following practices:
Risk identification and assessment;
Risk measurement; and
Risk monitoring and reporting.
Internal Audit performs an independent review of the
operational risk management framework, including key
controls, processes and applications, on an annual basis to
assess the effectiveness of the framework.

GOLDMAN SACHS INTERNATIONAL (UNLIMITED COMPANY)
Management Report
22
Model Risk Management
Overview
Model risk is the potential for adverse consequences from
decisions made based on model outputs that may be incorrect
or used inappropriately. GS Group relies on quantitative
models across its business activities primarily to value certain
financial assets and liabilities, to monitor and manage its risk,
and to measure and monitor its regulatory capital.
GSI’s framework for managing model risk is consistent with
and part of GS Group’s framework. GS Group’s model risk
management framework is managed through a governance
structure and risk management controls, which encompass
standards designed to ensure it maintains a comprehensive
model inventory, including risk assessment and classification,
sound model development practices, independent review and
model-specific usage controls. GS Group’s Firmwide Risk
Committee and GS Group’s Firmwide Model Risk Control
Committee oversee the model risk management framework.
Model Risk Management, which is independent of model
developers, model owners and model users, reports to GS
Group’s chief risk officer, is responsible for identifying and
reporting significant risks associated with models, and provides
periodic updates to senior management, risk committees and
GS Group’s Risk Committee of the Board.
Model Review and Validation
Model Risk Management consists of quantitative professionals
who perform an independent review, validation and approval
of the models. This review includes an analysis of the model
documentation, independent testing, an assessment of the
appropriateness of the methodology used, and verification of
compliance with model development and implementation
standards. Model Risk Management reviews all existing
models on an annual basis, as well as new models or
significant changes to models.
The model validation process incorporates a review of models
and trade and risk parameters across a broad range of scenarios
(including extreme conditions) in order to critically evaluate
and verify:
The model’s conceptual soundness, including the
reasonableness of model assumptions, and suitability for
intended use;
The testing strategy utilised by the model developers to
ensure that the models function as intended;
The suitability of the calculation techniques incorporated in
the model;
The model’s accuracy in reflecting the characteristics of the
related product and its significant risks;
The model’s consistency with models for similar products;
and
The model’s sensitivity to input parameters and assumptions.
Directors
There were no changes in the directorship of the company
between the date of issue of this financial report and the 2016
Annual Report.
Date of Issue
This financial report was issued on May 12, 2017.

Unaudited Financial Statements GOLDMAN SACHS INTERNATIONAL (UNLIMITED COMPANY)
Profit and Loss Account (Unaudited)
23
Three Months
Ended March
$ in millions Note 2017 2016
Net revenues 4 $1,633 $1,387
Administrative expenses (957) (784)
Operating profit 676 603
Interest payable and similar charges (93) (84)
Net finance income 1 2
Profit on ordinary activities before taxation 584 521
Tax on profit on ordinary activities 5 (156) (153)
Profit for the financial period $ ,428 $ 368
Net revenues and operating profit of the company are derived from continuing operations in the current and prior periods.
Statements of Comprehensive Income (Unaudited) Three Months
Ended March
$ in millions Note 2017 2016
Profit for the financial period $0,428 $ 368
Other comprehensive income
Items that will not be reclassified subsequently to profit or loss
Actuarial profit relating to the pension scheme 15 152
Debt valuation adjustment 10 (51) 24
U.K. deferred tax attributable to the components of other comprehensive income 9 (46)
Other comprehensive income/(loss) for the financial period, net of tax (27) 130
Total comprehensive income for the financial period $0,401 $0,498
The accompanying notes are an integral part of these financial statements.

GOLDMAN SACHS INTERNATIONAL (UNLIMITED COMPANY)
Balance Sheet (Unaudited)
24
As of
March December
$ in millions Note 2017 2016
Fixed assets $ 154 $ 140
Current assets
Financial instruments owned (includes $24,315 and $20,110 pledged as collateral) 6 617,888 662,945
Collateralised agreements 7 206,223 184,600
Debtors 8 69,382 69,696
Cash at bank and in hand 19,070 16,888
912,563 934,129
Creditors: amounts falling due within one year
Financial instruments sold, but not yet purchased 6 (570,676) (613,911)
Collateralised financings 9 (160,533) (137,641)
Other creditors 10 (104,993) (110,931)
(836,202) (862,483)
Net current assets 76,361 71,646
Total assets less current liabilities 76,515 71,786
Creditors: amounts falling due after more than one year
Collateralised financings 9 (8,514) (6,233)
Other creditors 10 (40,186) (38,073)
(48,700) (44,306)
Net assets excluding pension surplus 27,815 27,480
Pension surplus
119 53
Net assets including pension surplus $ 27,934 $ 27,533
Capital and reserves
Called up share capital 11 $ 582 $ 582
Share premium account 4,864 4,864
Capital reserve (non-distributable) 17 17
Profit and loss account 22,471 22,070
Total shareholder’s funds $ 27,934 $ 27,533
The accompanying notes are an integral part of these financial statements. Company number: 02263951

GOLDMAN SACHS INTERNATIONAL (UNLIMITED COMPANY)
Statements of Changes in Equity (Unaudited)
25
Three Months
Ended March
$ in millions 2017 2016
Called up share capital
Beginning balance $00,582 $00,582
Ending balance 582 582
Share premium account
Beginning balance 4,864 4,864
Ending balance 4,864 4,864
Capital reserve (non-distributable)
Beginning balance 17 17
Ending balance 17 17
Profit and loss account
Beginning balance 22,070 20,890
Profit for the financial period 428 368
Other comprehensive income/(loss) (27) 130
Share-based payments 272 385
Management recharge related to share-based payments (272) (385)
Ending balance 22,471 21,388
Total shareholder’s funds $27,934 $26,851
No dividends were paid for the three months ended March 2017 and March 2016. The accompanying notes are an integral part of these financial statements.

GOLDMAN SACHS INTERNATIONAL (UNLIMITED COMPANY)
Statements of Cash Flows (Unaudited)
26
Three Months
Ended March
$ in millions Note 2017 2016
Cash flows from operating activities
Cash generated from operations 13 $12,469 $04,438
Taxation paid (177) (181)
Net cash from operating activities 2,292 4,257
Cash flows from investing activities
Capital expenditure for fixed assets (21) –
Net cash used in investing activities (21) –
Cash flows from financing activities
Interest paid on long-term subordinated loans (204) (182)
Net cash used in financing activities (204) (182)
Net increase in cash and cash equivalents 2,067 4,075
Cash and cash equivalents, beginning balance 16,881 9,970
Foreign exchange gains on cash and cash equivalents 88 208
Cash and cash equivalents, ending balance 12 $19,036 $14,253
The accompanying notes are an integral part of these financial statements.

GOLDMAN SACHS INTERNATIONAL (UNLIMITED COMPANY)
Notes to the Financial Statements (Unaudited)
27
Note 1.
General Information
The company is a private unlimited company and is
incorporated and domiciled in England and Wales. The address
of its registered office is Peterborough Court, 133 Fleet Street,
London, EC4A 2BB, United Kingdom.
The company’s immediate parent undertaking is Goldman
Sachs Group UK Limited, a company incorporated and
domiciled in England and Wales.
The ultimate controlling undertaking and the parent company
of the smallest and largest group for which consolidated
financial statements are prepared is The Goldman Sachs
Group, Inc., a company incorporated in the United States of
America. Copies of its consolidated financial statements, as
well as certain regulatory filings, for example Quarterly
Reports on Form 10-Q and the Annual Report on Form 10-K,
that provide additional information about GS Group and its
business activities, can be obtained from Investor Relations,
200 West Street, New York, NY 10282, United States of
America, GS Group’s principal place of business, or at
www.goldmansachs.com/shareholders/.
Note 2.
Summary of Significant Accounting Policies
Basis of Preparation
The company prepares financial statements under U.K. GAAP.
These financial statements have been prepared in accordance
with FRS 104 ‘Interim Financial Reporting’. The financial
statements should be read in conjunction with the 2016 Annual
Report, which has been prepared in accordance with FRS 101
‘Reduced Disclosure Framework’.
Accounting Policies
The accounting policies and applicable disclosure exemptions
applied are consistent with those described in the 2016 Annual
Report.
Following the endorsement of IFRS 9 ‘Financial Instruments’
(IFRS 9) by the E.U. in November 2016, the company adopted
the provisions of IFRS 9 that require changes in the fair value
of financial liabilities attributable to own credit spreads (debt
valuation adjustment or DVA) to be presented in other
comprehensive income, if it does not create or enlarge an
accounting mismatch, in its financial statements for the year
ended December 2016, effective from January 2016. As a
result, comparatives for the three months ended March 2016
have been updated to reflect the adoption of these provisions of
IFRS 9.
Note 3.
Critical Accounting Estimates and
Judgements
The critical accounting estimates and judgements are
consistent with those described in the 2016 Annual Report with
the exception of the below.
Estimated Year-End Discretionary Compensation
A substantial portion of the company’s compensation and
benefits represents discretionary compensation, which is
finalised at year-end. The company believes the most
appropriate way to allocate estimated annual discretionary
compensation among interim periods is in proportion to the net
revenues earned in such periods.
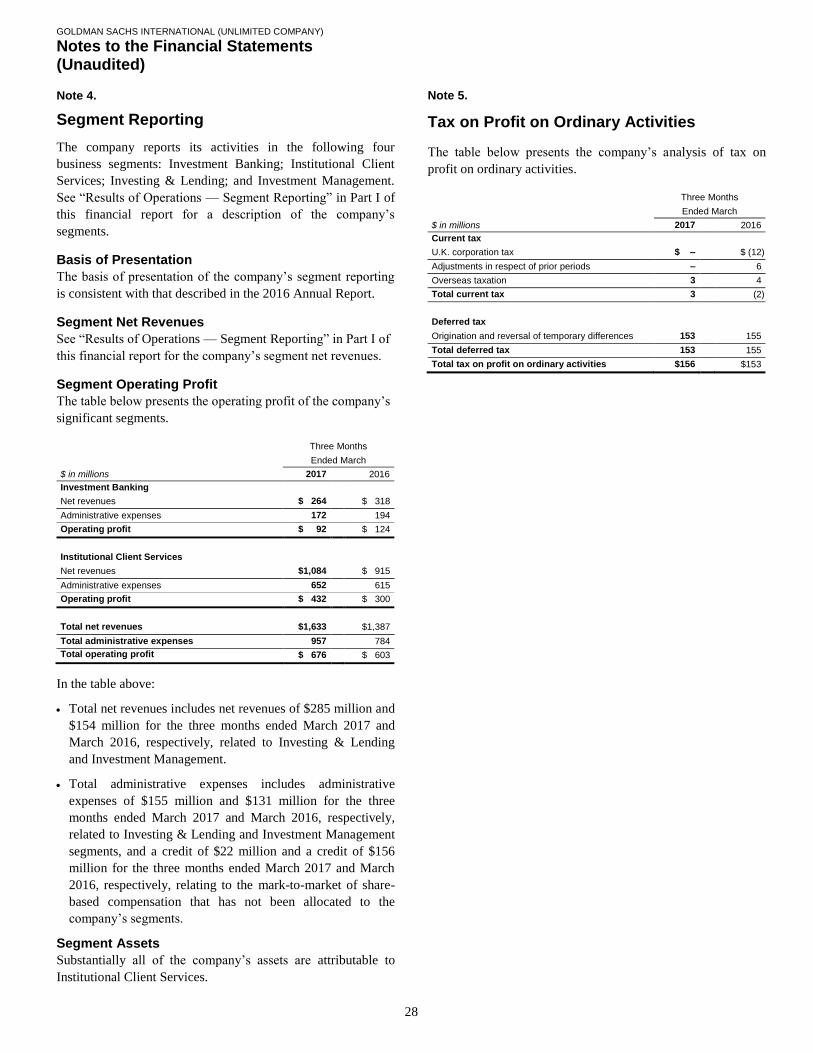
GOLDMAN SACHS INTERNATIONAL (UNLIMITED COMPANY)
Notes to the Financial Statements (Unaudited)
28
Note 4.
Segment Reporting
The company reports its activities in the following four
business segments: Investment Banking; Institutional Client
Services; Investing & Lending; and Investment Management.
See “Results of Operations — Segment Reporting” in Part I of
this financial report for a description of the company’s
segments.
Basis of Presentation
The basis of presentation of the company’s segment reporting
is consistent with that described in the 2016 Annual Report.
Segment Net Revenues
See “Results of Operations — Segment Reporting” in Part I of
this financial report for the company’s segment net revenues.
Segment Operating Profit
The table below presents the operating profit of the company’s
significant segments.
Three Months
Ended March
$ in millions 2017 2016
Investment Banking
Net revenues $1,264 $1,318
Administrative expenses 172 194
Operating profit $1,092 $1,124
Institutional Client Services
Net revenues $1,084 $1,915
Administrative expenses 652 615
Operating profit $1,432 $1,300
Total net revenues $1,633 $1,387
Total administrative expenses 957 784
Total operating profit
$0,676 $1,603
In the table above:
Total net revenues includes net revenues of $285 million and
$154 million for the three months ended March 2017 and
March 2016, respectively, related to Investing & Lending
and Investment Management.
Total administrative expenses includes administrative
expenses of $155 million and $131 million for the three
months ended March 2017 and March 2016, respectively,
related to Investing & Lending and Investment Management
segments, and a credit of $22 million and a credit of $156
million for the three months ended March 2017 and March
2016, respectively, relating to the mark-to-market of share-
based compensation that has not been allocated to the
company’s segments.
Segment Assets
Substantially all of the company’s assets are attributable to
Institutional Client Services.
Note 5.
Tax on Profit on Ordinary Activities
The table below presents the company’s analysis of tax on
profit on ordinary activities.
Three Months
Ended March
$ in millions 2017 2016
Current tax
U.K. corporation tax $ – $ (12)
Adjustments in respect of prior periods – 6
Overseas taxation 3 4
Total current tax 3 (2)
Deferred tax
Origination and reversal of temporary differences 153 155
Total deferred tax 153 155
Total tax on profit on ordinary activities $156 $153
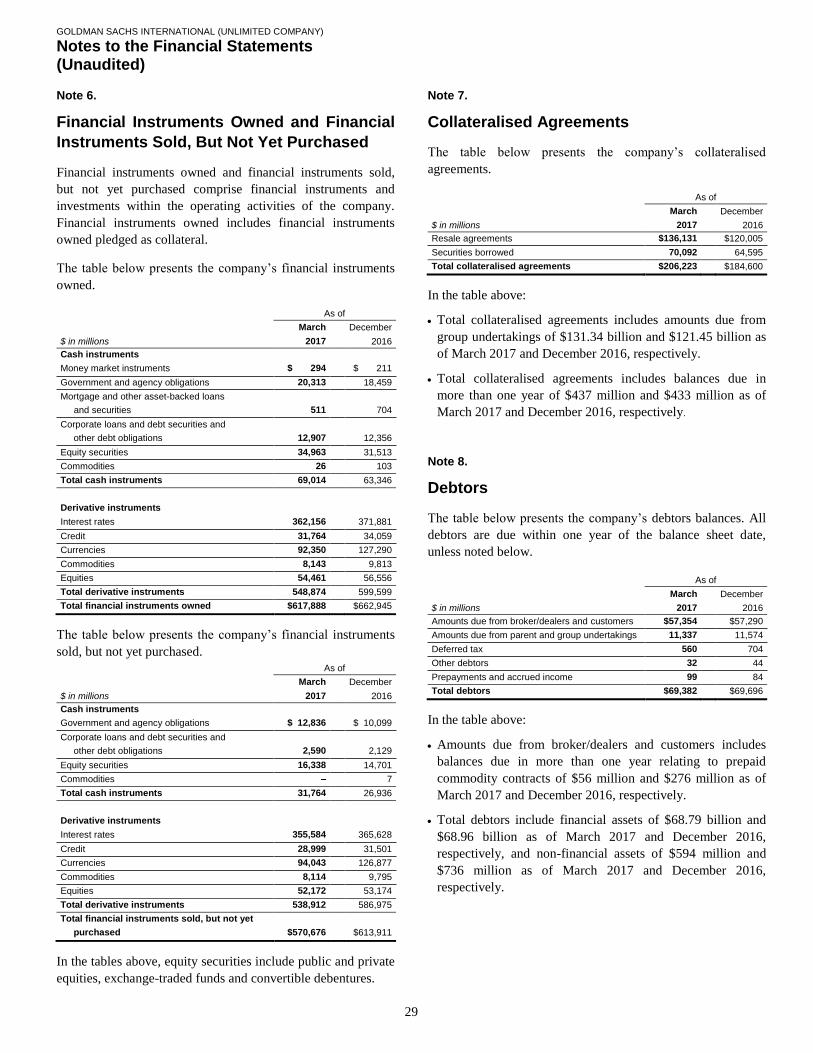
GOLDMAN SACHS INTERNATIONAL (UNLIMITED COMPANY)
Notes to the Financial Statements (Unaudited)
29
Note 6.
Financial Instruments Owned and Financial
Instruments Sold, But Not Yet Purchased
Financial instruments owned and financial instruments sold,
but not yet purchased comprise financial instruments and
investments within the operating activities of the company.
Financial instruments owned includes financial instruments
owned pledged as collateral.
The table below presents the company’s financial instruments
owned.
As of
March December
$ in millions 2017 2016
Cash instruments
Money market instruments $ 294 $ 211
Government and agency obligations 20,313 18,459
Mortgage and other asset-backed loans
and securities 511 704
Corporate loans and debt securities and
other debt obligations 12,907 12,356
Equity securities 34,963 31,513
Commodities 26 103
Total cash instruments 69,014 63,346
Derivative instruments
Interest rates 362,156 371,881
Credit 31,764 34,059
Currencies 92,350 127,290
Commodities 8,143 9,813
Equities 54,461 56,556
Total derivative instruments 548,874 599,599
Total financial instruments owned $617,888 $662,945
The table below presents the company’s financial instruments
sold, but not yet purchased.
As of
March December
$ in millions 2017 2016
Cash instruments
Government and agency obligations $112,836 $610,099
Corporate loans and debt securities and
other debt obligations 2,590 2,129
Equity securities 16,338 14,701
Commodities – 7
Total cash instruments 31,764 26,936
Derivative instruments
Interest rates 355,584 365,628
Credit 28,999 31,501
Currencies 94,043 126,877
Commodities 8,114 9,795
Equities 52,172 53,174
Total derivative instruments 538,912 586,975
Total financial instruments sold, but not yet
purchased $570,676 $613,911
In the tables above, equity securities include public and private
equities, exchange-traded funds and convertible debentures.
Note 7.
Collateralised Agreements
The table below presents the company’s collateralised
agreements.
As of
March December
$ in millions 2017 2016
Resale agreements $136,131 $120,005
Securities borrowed 70,092 64,595
Total collateralised agreements $206,223 $184,600
In the table above:
Total collateralised agreements includes amounts due from
group undertakings of $131.34 billion and $121.45 billion as
of March 2017 and December 2016, respectively.
Total collateralised agreements includes balances due in
more than one year of $437 million and $433 million as of
March 2017 and December 2016, respectively.
Note 8.
Debtors
The table below presents the company’s debtors balances. All
debtors are due within one year of the balance sheet date,
unless noted below.
As of
March December
$ in millions 2017 2016
Amounts due from broker/dealers and customers $57,354 $57,290
Amounts due from parent and group undertakings 11,337 11,574
Deferred tax 560 704
Other debtors 32 44
Prepayments and accrued income 99 84
Total debtors $69,382 $69,696
In the table above:
Amounts due from broker/dealers and customers includes
balances due in more than one year relating to prepaid
commodity contracts of $56 million and $276 million as of
March 2017 and December 2016, respectively.
Total debtors include financial assets of $68.79 billion and
$68.96 billion as of March 2017 and December 2016,
respectively, and non-financial assets of $594 million and
$736 million as of March 2017 and December 2016,
respectively.
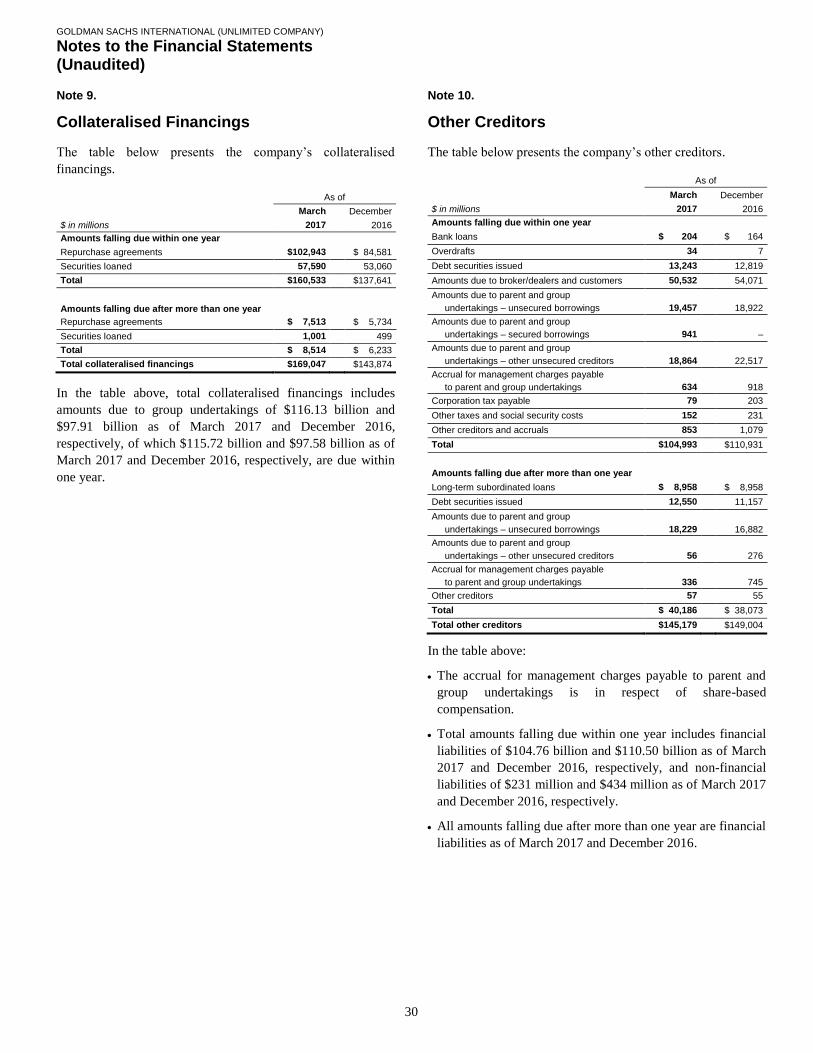
GOLDMAN SACHS INTERNATIONAL (UNLIMITED COMPANY)
Notes to the Financial Statements (Unaudited)
30
Note 9.
Collateralised Financings
The table below presents the company’s collateralised
financings.
As of
March December
$ in millions 2017 2016
Amounts falling due within one year
Repurchase agreements $102,943 $ 84,581
Securities loaned 57,590 53,060
Total $160,533 $137,641
Amounts falling due after more than one year
Repurchase agreements $117,513 $135,734
Securities loaned 1,001 499
Total $118,514 $136,233
Total collateralised financings $169,047 $143,874
In the table above, total collateralised financings includes
amounts due to group undertakings of $116.13 billion and
$97.91 billion as of March 2017 and December 2016,
respectively, of which $115.72 billion and $97.58 billion as of
March 2017 and December 2016, respectively, are due within
one year.
Note 10.
Other Creditors
The table below presents the company’s other creditors.
As of
March December
$ in millions 2017 2016
Amounts falling due within one year
Bank loans $1,00204 $1,00164
Overdrafts 34 7
Debt securities issued 13,243 12,819
Amounts due to broker/dealers and customers 50,532 54,071
Amounts due to parent and group
undertakings – unsecured borrowings 19,457 18,922
Amounts due to parent and group
undertakings – secured borrowings 941 –
Amounts due to parent and group
undertakings – other unsecured creditors 18,864 22,517
Accrual for management charges payable
to parent and group undertakings 634 918
Corporation tax payable 79 203
Other taxes and social security costs 152 231
Other creditors and accruals 853 1,079
Total $104,993 $110,931
Amounts falling due after more than one year
Long-term subordinated loans $008,958 $008,958
Debt securities issued 12,550 11,157
Amounts due to parent and group
undertakings – unsecured borrowings 18,229 16,882
Amounts due to parent and group
undertakings – other unsecured creditors 56 276
Accrual for management charges payable
to parent and group undertakings 336 745
Other creditors 57 55
Total $140,186 $138,073
Total other creditors $145,179 $149,004
In the table above:
The accrual for management charges payable to parent and
group undertakings is in respect of share-based
compensation.
Total amounts falling due within one year includes financial
liabilities of $104.76 billion and $110.50 billion as of March
2017 and December 2016, respectively, and non-financial
liabilities of $231 million and $434 million as of March 2017
and December 2016, respectively.
All amounts falling due after more than one year are financial
liabilities as of March 2017 and December 2016.
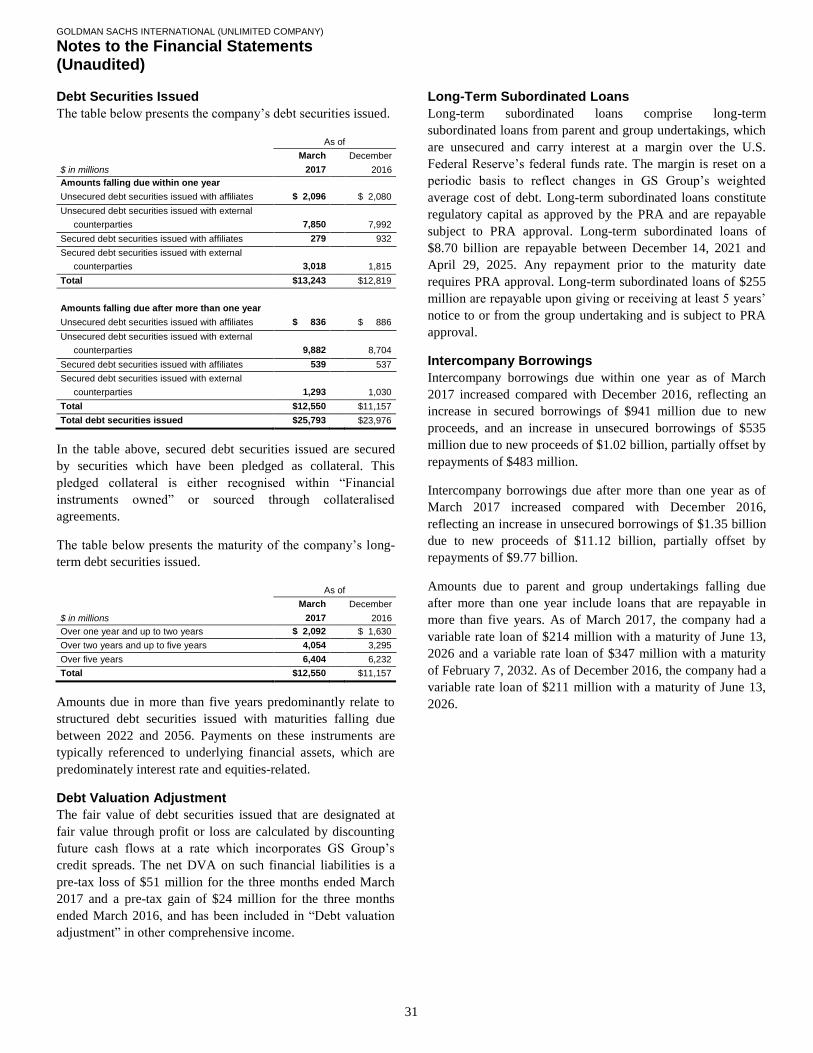
GOLDMAN SACHS INTERNATIONAL (UNLIMITED COMPANY)
Notes to the Financial Statements (Unaudited)
31
Debt Securities Issued
The table below presents the company’s debt securities issued.
As of
March December
$ in millions 2017 2016
Amounts falling due within one year
Unsecured debt securities issued with affiliates $22,096 $12,080
Unsecured debt securities issued with external
counterparties 7,850 7,992
Secured debt securities issued with affiliates 279 932
Secured debt securities issued with external
counterparties 3,018 1,815
Total $13,243 $12,819
Amounts falling due after more than one year
Unsecured debt securities issued with affiliates $13,836 $15,886
Unsecured debt securities issued with external
counterparties 9,882 8,704
Secured debt securities issued with affiliates 539 537
Secured debt securities issued with external
counterparties 1,293 1,030
Total $12,550 $11,157
Total debt securities issued $25,793 $23,976
In the table above, secured debt securities issued are secured
by securities which have been pledged as collateral. This
pledged collateral is either recognised within “Financial
instruments owned” or sourced through collateralised
agreements.
The table below presents the maturity of the company’s long-
term debt securities issued.
As of
March December
$ in millions 2017 2016
Over one year and up to two years $12,092 $11,630
Over two years and up to five years 4,054 3,295
Over five years 6,404 6,232
Total $12,550 $11,157
Amounts due in more than five years predominantly relate to
structured debt securities issued with maturities falling due
between 2022 and 2056. Payments on these instruments are
typically referenced to underlying financial assets, which are
predominately interest rate and equities-related.
Debt Valuation Adjustment
The fair value of debt securities issued that are designated at
fair value through profit or loss are calculated by discounting
future cash flows at a rate which incorporates GS Group’s
credit spreads. The net DVA on such financial liabilities is a
pre-tax loss of $51 million for the three months ended March
2017 and a pre-tax gain of $24 million for the three months
ended March 2016, and has been included in “Debt valuation
adjustment” in other comprehensive income.
Long-Term Subordinated Loans
Long-term subordinated loans comprise long-term
subordinated loans from parent and group undertakings, which
are unsecured and carry interest at a margin over the U.S.
Federal Reserve’s federal funds rate. The margin is reset on a
periodic basis to reflect changes in GS Group’s weighted
average cost of debt. Long-term subordinated loans constitute
regulatory capital as approved by the PRA and are repayable
subject to PRA approval. Long-term subordinated loans of
$8.70 billion are repayable between December 14, 2021 and
April 29, 2025. Any repayment prior to the maturity date
requires PRA approval. Long-term subordinated loans of $255
million are repayable upon giving or receiving at least 5 years’
notice to or from the group undertaking and is subject to PRA
approval.
Intercompany Borrowings
Intercompany borrowings due within one year as of March
2017 increased compared with December 2016, reflecting an
increase in secured borrowings of $941 million due to new
proceeds, and an increase in unsecured borrowings of $535
million due to new proceeds of $1.02 billion, partially offset by
repayments of $483 million.
Intercompany borrowings due after more than one year as of
March 2017 increased compared with December 2016,
reflecting an increase in unsecured borrowings of $1.35 billion
due to new proceeds of $11.12 billion, partially offset by
repayments of $9.77 billion.
Amounts due to parent and group undertakings falling due
after more than one year include loans that are repayable in
more than five years. As of March 2017, the company had a
variable rate loan of $214 million with a maturity of June 13,
2026 and a variable rate loan of $347 million with a maturity
of February 7, 2032. As of December 2016, the company had a
variable rate loan of $211 million with a maturity of June 13,
2026.

GOLDMAN SACHS INTERNATIONAL (UNLIMITED COMPANY)
Notes to the Financial Statements (Unaudited)
32
Note 11.
Share Capital
The table below presents the company’s share capital.
Ordinary shares
Allotted, called up and fully paid of $1 each $ in millions
As of January 1, 2017 581,964,161 $582
As of March 31, 2017 581,964,161 $582
Note 12.
Cash and Cash Equivalents
The table below presents the company’s cash and cash
equivalents for the purpose of the statements of cash flows.
As of March
$ in millions 2017 2016
Cash at bank and in hand $19,070 $14,361
Overdrafts (see Note 10) (34) (108)
Total cash and cash equivalents $19,036 $14,253
Note 13.
Reconciliation of Cash Flows From
Operating Activities
The table below presents the company’s reconciliation of cash
flows from operating activities.
Three Months
Ended March
$ in millions 2017 2016
Profit on ordinary activities before taxation $ 00,584 $ 521
Adjustments for
Depreciation and amortisation 8 1
Charge/(credit) for defined benefit plan (1) 7
Foreign exchange gains (86) (208)
Share-based compensation expense/(credit) 22 (117)
Provisions for liabilities – 25
Interest payable and similar charges 93 84
Cash generated before changes in operating
assets and liabilities 620 313
Changes in operating assets
Decrease/(increase) in financial instruments owned 45,057 (157,291)
Increase in collateralised agreements (21,623) (29,869)
Decrease/(increase) in debtors 156 (11,806)
Changes in operating assets 23,590 (198,966)
Changes in operating liabilities
Increase/(decrease) in financial instruments
sold, but not yet purchased (43,235) 170,056
Increase in collateralised financings 25,173 12,984
Increase/(decrease) in other creditors (3,629) 20,059
Changes in operating liabilities (21,691) 203,099
Contributions paid to defined benefit plan (50) (8)
Cash generated from operations $ (22,469 $ 4,438
Cash generated from operations includes interest paid of $476
million and $386 million for the three months ended March
2017 and March 2016, respectively, and interest received of
$611 million and $495 million for the three months ended
March 2017 and March 2016, respectively.

GOLDMAN SACHS INTERNATIONAL (UNLIMITED COMPANY)
Notes to the Financial Statements (Unaudited)
33
Note 14.
Financial Commitments and Contingencies
Commitments and Contingencies
The table below presents the company’s commitments and
contingencies.
As of
March December
$ in millions 2017 2016
Contingent and forward starting resale
and securities borrowing agreements $63,201 $43,599
Forward starting repurchase and secured
lending agreements 18,781 11,806
Other 2,839 3,993
Total $84,821 $59,398
The company enters into resale and securities borrowing
agreements and repurchase and secured lending agreements
that settle at a future date, generally within three business days.
The company also enters into commitments to provide
contingent financing to its clients and counterparties through
resale agreements. The company’s funding of these
commitments depends on the satisfaction of all contractual
conditions to the resale agreement and these commitments can
expire unused.
Other commitments primarily relate to collateral commitments
and commitments to extend credit.
In addition, there are registered charges on the company’s
assets which have arisen in the ordinary course of business.
Leases
The company leases certain buildings under non-cancellable
long-term lease agreements. Under these lease agreements,
which are subject to renegotiation at various intervals specified
in the leases, the company pays all insurance, maintenance and
repairs of these properties.
Legal Proceedings
The company is involved in a number of judicial, regulatory
and arbitration proceedings (including those described below)
concerning matters arising in connection with the conduct of
the company’s business, however it is not practicable to
reliably estimate an impact, if any, of these proceedings.
Interest Rate Swap Antitrust Litigation. GSI is among
the defendants named in putative antitrust class actions relating
to the trading of interest rate swaps, filed beginning in
November 2015 and consolidated in the U.S. District Court for
the Southern District of New York. The second consolidated
amended complaint filed on December 9, 2016 generally
alleges a conspiracy among the defendants since at least
January 1, 2007 to preclude exchange trading of interest rate
swaps. The complaint seeks declaratory and injunctive relief as
well as treble damages in an unspecified amount. Defendants
moved to dismiss on January 20, 2017.
GSI is among the defendants named in antitrust actions relating
to the trading of interest rate swaps filed in the U.S. District
Court for the Southern District of New York beginning in April
2016 by two operators of swap execution facilities and certain
of their affiliates. These actions have been consolidated with
the class action described above for pretrial proceedings. The
second consolidated amended complaint filed on December 9,
2016 generally asserts claims under federal and state antitrust
laws and state common law in connection with an alleged
conspiracy among the defendants to preclude trading of interest
rate swaps on the plaintiffs’ respective swap execution
facilities and seeks declaratory and injunctive relief as well as
treble damages in an unspecified amount. Defendants moved to
dismiss on January 20, 2017.
Commodities-Related Litigation. GSI is among the
defendants named in putative class actions relating to trading
in platinum and palladium, filed beginning on November 25,
2014 and most recently amended on July 27, 2015, in the U.S.
District Court for the Southern District of New York. The
complaints generally allege that the defendants violated federal
antitrust laws and the Commodity Exchange Act in connection
with an alleged conspiracy to manipulate a benchmark for
physical platinum and palladium prices and seek declaratory
and injunctive relief as well as treble damages in an
unspecified amount. On March 28, 2017, the district court
dismissed the antitrust claims but permitted certain of the
Commodity Exchange Act claims to proceed against certain
defendants, including GSI.

GOLDMAN SACHS INTERNATIONAL (UNLIMITED COMPANY)
Notes to the Financial Statements (Unaudited)
34
Regulatory Investigations and Reviews and Related
Litigation. Group Inc. and certain of its affiliates, including
GSI, are subject to a number of other investigations and
reviews by, and in some cases have received subpoenas and
requests for documents and information from, various
governmental and regulatory bodies and self-regulatory
organisations and litigation relating to various matters relating
to the GS Group’s businesses and operations, including:
The 2008 financial crisis;
The public offering process;
Investment management and financial advisory services;
Conflicts of interest;
Transactions involving government-related financings and
other matters, including those related to 1Malaysia
Development Berhad (1MDB), a sovereign wealth fund in
Malaysia;
The offering, auction, sales, trading and clearance of
corporate and government securities, currencies,
commodities and other financial products and related sales
and other communications and activities, as well as GS
Group’s supervision and controls relating to such activities,
including compliance with short sale rules, algorithmic, high-
frequency and quantitative trading, futures trading, options
trading, when-issued trading, transaction reporting,
technology systems and controls, securities lending practices,
trading and clearance of credit derivative instruments and
interest rate swaps, commodities activities and metals
storage, private placement practices, allocations of and
trading in securities, and trading activities and
communications in connection with the establishment of
benchmark rates, such as currency rates;
Compliance with the U.K. Bribery Act and the U.S. Foreign
Corrupt Practices Act;
Hiring and compensation practices;
System of risk management and controls; and
Insider trading, the potential misuse and dissemination of
material non-public information regarding corporate and
governmental developments and the effectiveness of insider
trading controls and information barriers.
In addition, investigations, reviews and litigation involving the
company’s affiliates and such affiliates’ businesses and
operations, including various matters referred to above but also
other matters, may have an impact on the company’s
businesses and operations.
Note 15.
Financial Risk Management and Capital
Management
Certain disclosures in relation to the company’s financial risk
management and capital management have been presented
alongside other risk management and regulatory information in
Part I of this financial report.
Note 16.
Financial Assets and Financial Liabilities
Financial Assets and Financial Liabilities by Category
The tables below present the carrying value of the company’s
financial assets and financial liabilities by category.
Financial Assets
Held for Designated Loans and
$ in millions trading at fair value receivables Total
As of March 2017
Financial instruments owned $617,888 $ – $ – $617,888
Collateralised agreements – 158,586 47,637 206,223
Debtors – 845 67,943 68,788
Cash at bank and in hand – – 19,070 19,070
Total financial assets $617,888 $159,431 $134,650 $911,969
As of December 2016
Financial instruments owned $662,945 $ – $ – $662,945
Collateralised agreements – 139,732 44,868 184,600
Debtors – 1,432 67,528 68,960
Cash at bank and in hand – – 16,888 16,888
Total financial assets $662,945 $141,164 $129,284 $933,393
Financial Liabilities
Held for Designated Amortised
$ in millions trading at fair value cost Total
As of March 2017
Amounts falling due within one year
Financial instruments sold,
but not yet purchased $570,676 $ – $ – $570,676
Collateralised financings – 115,322 45,211 160,533
Other creditors – 14,527 90,235 104,762
Total 570,676 129,849 135,446 835,971
Amounts falling due after more than one year
Collateralised financings – 8,514 – 8,514
Other creditors – 21,505 18,681 40,186
Total – 30,019 18,681 48,700
Total financial liabilities $570,676 $159,868 $154,127 $884,671
As of December 2016
Amounts falling due within one year
Financial instruments sold,
but not yet purchased $613,911 $ – $ – $613,911
Collateralised financings – 96,427 41,214 137,641
Other creditors – 13,542 96,955 110,497
Total 613,911 109,969 138,169 862,049
Amounts falling due after more than one year
Collateralised financings – 6,233 – 6,233
Other creditors – 19,407 18,666 38,073
Total – 25,640 18,666 44,306
Total financial liabilities $613,911 $135,609 $156,835 $906,355

GOLDMAN SACHS INTERNATIONAL (UNLIMITED COMPANY)
Notes to the Financial Statements (Unaudited)
35
In the table above, financial instruments owned held for trading
include $38 million and $37 million as of March 2017 and
December 2016, respectively, of derivative instruments
designated as hedges.
Fair Value Hierarchy
The fair value of a financial instrument is the amount that
would be received to sell an asset or paid to transfer a liability
in an orderly transaction between market participants at the
measurement date. Financial assets are marked to bid prices
and financial liabilities are marked to offer prices. Fair value
measurements do not include transaction costs. The company
measures certain financial assets and financial liabilities as a
portfolio (i.e., based on its net exposure to market and/or credit
risks).
U.K. GAAP has a three-level fair value hierarchy for
disclosure of fair value measurements. The fair value hierarchy
prioritises inputs to the valuation techniques used to measure
fair value, giving the highest priority to level 1 inputs and the
lowest priority to level 3 inputs. A financial asset or financial
liability’s level in the fair value hierarchy is based on the
lowest level of input that is significant to its fair value
measurement.
The fair value hierarchy is as follows:
Level 1. Inputs are unadjusted quoted prices in active markets
to which the company had access at the measurement date for
identical, unrestricted assets or liabilities.
Level 2. Inputs to valuation techniques are observable, either
directly or indirectly.
Level 3. One or more inputs to valuation techniques are
significant and unobservable.
The fair values for substantially all of the company’s financial
assets and financial liabilities that are fair valued on a recurring
basis are based on observable prices and inputs and are
classified in levels 1 and 2 of the fair value hierarchy. Certain
level 2 and level 3 financial assets and financial liabilities may
require appropriate valuation adjustments that a market
participant would require to arrive at fair value for factors such
as counterparty and GS Group’s credit quality, funding risk,
transfer restrictions, liquidity and bid/offer spreads. Valuation
adjustments are generally based on market evidence.
Valuation Techniques and Significant Inputs
Cash Instruments. Cash instruments include government
and agency obligations, corporate loans and debt securities and
other debt obligations, equity securities, and other non-
derivative financial instruments owned and financial
instruments sold, but not yet purchased. Valuation techniques
and significant inputs for each level of the fair value hierarchy
include:
Level 1 Cash Instruments
Level 1 cash instruments are valued using quoted prices for
identical unrestricted instruments in active markets. The
company defines active markets for equity instruments based
on the average daily trading volume both in absolute terms and
relative to the market capitalisation for the instrument. The
company defines active markets for debt instruments based on
both the average daily trading volume and the number of days
with trading activity.
Level 2 Cash Instruments
Level 2 cash instruments can be verified to quoted prices,
recent trading activity for identical or similar instruments,
broker or dealer quotations or alternative pricing sources with
reasonable levels of price transparency. Consideration is given
to the nature of the quotations (e.g., indicative or firm) and the
relationship of recent market activity to the prices provided
from alternative pricing sources.
Valuation adjustments are typically made to level 2 cash
instruments (i) if the cash instrument is subject to transfer
restrictions and/or (ii) for other premiums and liquidity
discounts that a market participant would require to arrive at
fair value. Valuation adjustments are generally based on
market evidence.
Level 3 Cash Instruments
Level 3 cash instruments have one or more significant
valuation inputs that are not observable. Absent evidence to the
contrary, level 3 cash instruments are initially valued at
transaction price, which is considered to be the best initial
estimate of fair value. Subsequently, the company uses other
methodologies to determine fair value, which vary based on the
type of instrument. Valuation inputs and assumptions are
changed when corroborated by substantive observable
evidence, including values realised on sales of financial assets.
Valuation techniques of level 3 cash instruments vary by
instrument, but are generally based on discounted cash flow
techniques. The valuation techniques and the nature of
significant inputs used to determine the fair values of each type
of level 3 cash instrument are described below:

GOLDMAN SACHS INTERNATIONAL (UNLIMITED COMPANY)
Notes to the Financial Statements (Unaudited)
36
Mortgages and Other Asset-Backed Loans and
Securities. Significant inputs are generally determined
based on relative value analyses and include:
Market yields implied by transactions of similar or related
assets;
Current performance of the borrower or loan collateral and
recovery assumptions if a default occurs; and
Timing of expected future cash flows (duration) which, in
certain cases, may incorporate the impact of other
unobservable inputs (e.g., prepayment speeds).
Equity Securities. Equity securities include private equity
securities and convertible debentures. Recent third-party
completed or pending transactions (e.g., merger proposals,
tender offers, debt restructurings) are considered to be the
best evidence for any change in fair value. When these are
not available, the following valuation methodologies are
used, as appropriate:
Industry multiples and public comparables;
Transactions in similar instruments; and
Discounted cash flow techniques.
Corporate Obligations and Other Cash Instruments.
Corporate obligations and other cash instruments consists of
corporate loans and debt securities and other debt obligations
and government and agency obligations. Significant inputs
are generally determined based on relative value analyses,
which incorporate comparisons both to prices of credit
default swaps that reference the same or similar underlying
instrument or entity and to other debt instruments for the
same issuer for which observable prices or broker quotations
are available. Significant inputs include:
Market yields implied by transactions of similar or related
assets;
Current levels and changes in market indices such as the
iTraxx, CDX and LCDX (indices that track the
performance of corporate credit and loans, respectively);
Current performance of the borrower or loan collateral and
recovery assumptions if a default occurs; and
Maturity and coupon profile of the instrument.
Derivative Instruments. Derivatives may be traded on an
exchange (exchange-traded) or they may be privately
negotiated contracts, which are usually referred to as OTC
derivatives. Certain of the company’s OTC derivatives are
cleared and settled through central clearing counterparties
(OTC-cleared), while others are bilateral contracts between
two counterparties (bilateral OTC).
The company’s level 2 and level 3 derivatives are valued using
derivative pricing models (e.g., discounted cash flow models,
correlation models, and models that incorporate option pricing
methodologies, such as Monte Carlo simulations). Price
transparency of derivatives can generally be characterised by
product type, as described below.
Interest Rate. In general, the key inputs used to value
interest rate derivatives are transparent, even for most long-
dated contracts. Interest rate swaps and options denominated
in the currencies of leading industrialised nations are
characterised by high trading volumes and tight bid/offer
spreads. Interest rate derivatives that reference indices, such
as an inflation index, or the shape of the yield curve (e.g., 10-
year swap rate vs. 2-year swap rate) are more complex, but
the key inputs are generally observable.
Credit. Price transparency for credit default swaps,
including both single names and baskets of credits, varies by
market and underlying reference entity or obligation. Credit
default swaps that reference indices, large corporates and
major sovereigns generally exhibit the most price
transparency. For credit default swaps with other underliers,
price transparency varies based on credit rating, the cost of
borrowing the underlying reference obligations, and the
availability of the underlying reference obligations for
delivery upon the default of the issuer. Credit default swaps
that reference loans, asset-backed securities and emerging
market debt instruments tend to have less price transparency
than those that reference corporate bonds. In addition, more
complex credit derivatives, such as those sensitive to the
correlation between two or more underlying reference
obligations, generally have less price transparency.
Currency. Prices for currency derivatives based on the
exchange rates of leading industrialised nations, including
those with longer tenors, are generally transparent. The
primary difference between the price transparency of
developed and emerging market currency derivatives is that
emerging markets tend to be observable for contracts with
shorter tenors.

GOLDMAN SACHS INTERNATIONAL (UNLIMITED COMPANY)
Notes to the Financial Statements (Unaudited)
37
Equity. Price transparency for equity derivatives varies by
market and underlier. Options on indices and the common
stock of corporates included in major equity indices exhibit
the most price transparency. Equity derivatives generally
have observable market prices, except for contracts with long
tenors or reference prices that differ significantly from
current market prices. More complex equity derivatives, such
as those sensitive to the correlation between two or more
individual stocks, generally have less price transparency.
Liquidity is essential to observability of all product types. If
transaction volumes decline, previously transparent prices and
other inputs may become unobservable. Conversely, even
highly structured products may at times have trading volumes
large enough to provide observability of prices and other
inputs.
Level 1 Derivatives
Level 1 derivatives include short-term contracts for future
delivery of securities when the underlying security is a level 1
instrument, and exchange-traded derivatives if they are actively
traded and are valued at their quoted market price.
Level 2 Derivatives
Level 2 derivatives include OTC derivatives for which all
significant valuation inputs are corroborated by market
evidence and exchange-traded derivatives that are not actively
traded and/or that are valued using models that calibrate to
market-clearing levels of OTC derivatives. In evaluating the
significance of a valuation input, the company considers,
among other factors, a portfolio’s net risk exposure to that
input.
The selection of a particular model to value a derivative
depends on the contractual terms of and specific risks inherent
in the instrument, as well as the availability of pricing
information in the market. For derivatives that trade in liquid
markets, model selection does not involve significant
management judgement because outputs of models can be
calibrated to market-clearing levels.
Valuation models require a variety of inputs, such as
contractual terms, market prices, yield curves, discount rates
(including those derived from interest rates on collateral
received and posted as specified in credit support agreements
for collateralised derivatives), credit curves, measures of
volatility and correlations of such inputs. Significant inputs to
the valuations of level 2 derivatives can be verified to market
transactions, broker or dealer quotations or other alternative
pricing sources with reasonable levels of price transparency.
Consideration is given to the nature of the quotations (e.g.,
indicative or firm) and the relationship of recent market
activity to the prices provided from alternative pricing sources.
Level 3 Derivatives
Level 3 derivatives are valued using models which utilise
observable level 1 and/or level 2 inputs, as well as
unobservable level 3 inputs. Unobservable inputs include
certain correlations as well as credit spreads and equity
volatility inputs.
Subsequent to the initial valuation of a level 3 derivative, the
company updates the level 1 and level 2 inputs to reflect
observable market changes and any resulting gains and losses
are recorded in level 3. Level 3 inputs are changed when
corroborated by evidence such as similar market transactions,
third-party pricing services and/or broker or dealer quotations
or other empirical market data. In circumstances where the
company cannot verify the model value by reference to market
transactions, it is possible that a different valuation model
could produce a materially different estimate of fair value. See
below for further information about significant unobservable
inputs used in the valuation of level 3 derivatives.
Where there is a difference between the initial transaction price
and the fair value calculated by internal models, a gain or loss
is recognised after initial recognition only to the extent that it
arises from a change in a factor (including time) that market
participants would consider in setting a price.
Valuation Adjustments
Valuation adjustments are integral to determining the fair value
of derivative portfolios and are used to adjust the mid-market
valuations produced by derivative pricing models to the
appropriate exit price valuation. These adjustments incorporate
bid/offer spreads, the cost of liquidity, credit valuation
adjustments and funding valuation adjustments, which account
for the credit and funding risk inherent in the uncollateralised
portion of derivative portfolios. The company also makes
funding valuation adjustments to collateralised derivatives
where the terms of the agreement do not permit the company to
deliver or repledge collateral received. Market-based inputs are
generally used when calibrating valuation adjustments to
market-clearing levels.
In addition, for derivatives that include significant
unobservable inputs, the company makes model or exit price
adjustments to account for the valuation uncertainty present in
the transaction.

GOLDMAN SACHS INTERNATIONAL (UNLIMITED COMPANY)
Notes to the Financial Statements (Unaudited)
38
Other Financial Assets and Financial Liabilities.
Valuation techniques and significant inputs of other financial
assets and financial liabilities include:
Collateralised Agreements and Collateralised
Financings. The significant inputs to the valuation of resale
and repurchase agreements and securities borrowed and
loaned are funding spreads, the amount and timing of
expected future cash flows and interest rates.
Debtors. Debtors measured at fair value are primarily
comprised of secured lending and prepaid commodity
contracts. The significant inputs to the valuation of such
receivables are commodity prices, interest rates, the amount
and timing of expected future cash flows and funding
spreads.
Other Creditors. Other creditors primarily comprise hybrid
financial instruments and prepaid commodity contracts.
The significant inputs to the valuation of secured other
creditors measured at fair value are the amount and timing of
expected future cash flows, interest rates, funding spreads,
the fair value of the collateral delivered by the company
(which is determined using the amount and timing of
expected future cash flows, market prices, market yields and
recovery assumptions) and the frequency of additional
collateral calls.
The significant inputs to the valuation of unsecured other
creditors measured at fair value are the amount and timing of
expected future cash flows, interest rates, the credit spreads
of GS Group, as well as commodity prices in the case of
prepaid commodity contracts. The inputs used to value the
embedded derivative component of hybrid financial
instruments are consistent with the inputs used to value the
company’s other derivative instruments.
Fair Value of Financial Assets and Financial
Liabilities by Level
The tables below present, by level within the fair value
hierarchy, financial assets and financial liabilities measured at
fair value on a recurring basis.
Financial Assets and Financial Liabilities
at Fair Value as of March 2017
$ in millions Level 1 Level 2 Level 3 Total
Financial Assets
Cash instruments $50,211 $ 17,733 $11,070 $ 69,014
Derivative instruments 63 544,834 3,977 548,874
Financial instruments owned 50,274 562,567 5,047 617,888
Collateralised agreements – 158,586 – 158,586
Debtors – 845 – 845
Total financial assets $50,274 $721,998 $15,047 $777,319
Financial Liabilities
Amounts falling due within one year
Cash instruments $27,698 $004,062 $1,0004 $ 31,764
Derivative instruments 12 536,756 2,144 538,912
Financial instruments sold,
but not yet purchased 27,710 540,818 2,148 570,676
Collateralised financings – 115,258 64 115,322
Other creditors – 10,412 4,115 14,527
Total 27,710 666,488 6,327 700,525
Amounts falling due after more than one year
Collateralised financings – 8,514 – 8,514
Other creditors – 17,584 3,921 21,505
Total – 26,098 3,921 30,019
Total financial liabilities $27,710 $692,586 $10,248 $730,544
Net derivative instruments $00,051 $118,078 $11,833 $119,962
Financial Assets and Financial Liabilities
at Fair Value as of December 2016
$ in millions Level 1 Level 2 Level 3 Total
Financial Assets
Cash instruments $43,678 $ 18,633 $11,035 $ 63,346
Derivative instruments 47 595,435 4,117 599,599
Financial instruments owned 43,725 614,068 5,152 662,945
Collateralised agreements – 139,732 – 139,732
Debtors – 1,432 – 1,432
Total financial assets $43,725 $755,232 $15,152 $804,109
Financial Liabilities
Amounts falling due within one year
Cash instruments $23,837 $003,095 $11,004 $ 26,936
Derivative instruments 34 584,717 2,224 586,975
Financial instruments sold,
including financial
but not yet purchased 23,871 587,812 2,228 613,911
Collateralised financings – 96,361 66 96,427
Other creditors – 9,941 3,601 13,542
Total 23,871 694,114 5,895 723,880
Amounts falling due after more than one year
Collateralised financings – 6,233 – 6,233
Other creditors – 15,674 3,733 19,407
Total – 21,907 3,733 25,640
Total financial liabilities $23,871 $716,021 $19,628 $749,520
Net derivative instruments $00,013 $010,718 $11,893 $ 12,624
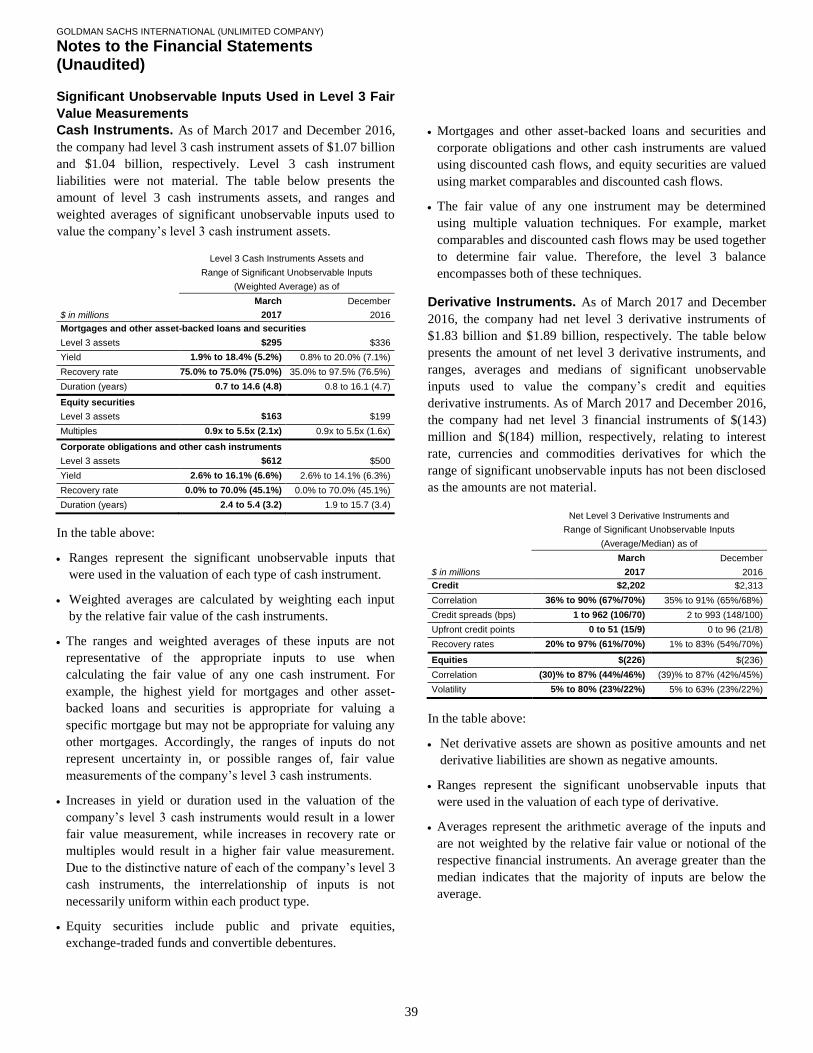
GOLDMAN SACHS INTERNATIONAL (UNLIMITED COMPANY)
Notes to the Financial Statements (Unaudited)
39
Significant Unobservable Inputs Used in Level 3 Fair
Value Measurements
Cash Instruments. As of March 2017 and December 2016,
the company had level 3 cash instrument assets of $1.07 billion
and $1.04 billion, respectively. Level 3 cash instrument
liabilities were not material. The table below presents the
amount of level 3 cash instruments assets, and ranges and
weighted averages of significant unobservable inputs used to
value the company’s level 3 cash instrument assets.
Level 3 Cash Instruments Assets and
Range of Significant Unobservable Inputs
(Weighted Average) as of
March December
$ in millions 2017 2016
Mortgages and other asset-backed loans and securities
Level 3 assets $295 $336
Yield 1.9% to 18.4% (5.2%) 0.8% to 20.0% (7.1%)
Recovery rate 75.0% to 75.0% (75.0%) 35.0% to 97.5% (76.5%)
Duration (years) 0.7 to 14.6 (4.8) 0.8 to 16.1 (4.7)
Equity securities
Level 3 assets $163 $199
Multiples 0.9x to 5.5x (2.1x) 0.9x to 5.5x (1.6x)
Corporate obligations and other cash instruments
Level 3 assets $612 $500
Yield 2.6% to 16.1% (6.6%) 2.6% to 14.1% (6.3%)
Recovery rate 0.0% to 70.0% (45.1%) 0.0% to 70.0% (45.1%)
Duration (years) 2.4 to 5.4 (3.2) 1.9 to 15.7 (3.4)
In the table above:
Ranges represent the significant unobservable inputs that
were used in the valuation of each type of cash instrument.
Weighted averages are calculated by weighting each input
by the relative fair value of the cash instruments.
The ranges and weighted averages of these inputs are not
representative of the appropriate inputs to use when
calculating the fair value of any one cash instrument. For
example, the highest yield for mortgages and other asset-
backed loans and securities is appropriate for valuing a
specific mortgage but may not be appropriate for valuing any
other mortgages. Accordingly, the ranges of inputs do not
represent uncertainty in, or possible ranges of, fair value
measurements of the company’s level 3 cash instruments.
Increases in yield or duration used in the valuation of the
company’s level 3 cash instruments would result in a lower
fair value measurement, while increases in recovery rate or
multiples would result in a higher fair value measurement.
Due to the distinctive nature of each of the company’s level 3
cash instruments, the interrelationship of inputs is not
necessarily uniform within each product type.
Equity securities include public and private equities,
exchange-traded funds and convertible debentures.
Mortgages and other asset-backed loans and securities and
corporate obligations and other cash instruments are valued
using discounted cash flows, and equity securities are valued
using market comparables and discounted cash flows.
The fair value of any one instrument may be determined
using multiple valuation techniques. For example, market
comparables and discounted cash flows may be used together
to determine fair value. Therefore, the level 3 balance
encompasses both of these techniques.
Derivative Instruments. As of March 2017 and December
2016, the company had net level 3 derivative instruments of
$1.83 billion and $1.89 billion, respectively. The table below
presents the amount of net level 3 derivative instruments, and
ranges, averages and medians of significant unobservable
inputs used to value the company’s credit and equities
derivative instruments. As of March 2017 and December 2016,
the company had net level 3 financial instruments of $(143)
million and $(184) million, respectively, relating to interest
rate, currencies and commodities derivatives for which the
range of significant unobservable inputs has not been disclosed
as the amounts are not material.
Net Level 3 Derivative Instruments and
Range of Significant Unobservable Inputs
(Average/Median) as of
March December
$ in millions 2017 2016
Credit $2,202 $2,313
Correlation 36% to 90% (67%/70%) 35% to 91% (65%/68%)
Credit spreads (bps) 1 to 962 (106/70) 2 to 993 (148/100)
Upfront credit points 0 to 51 (15/9) 0 to 96 (21/8)
Recovery rates 20% to 97% (61%/70%) 1% to 83% (54%/70%)
Equities $(226) $(236)
Correlation (30)% to 87% (44%/46%) (39)% to 87% (42%/45%)
Volatility 5% to 80% (23%/22%) 5% to 63% (23%/22%)
In the table above:
Net derivative assets are shown as positive amounts and net
derivative liabilities are shown as negative amounts.
Ranges represent the significant unobservable inputs that
were used in the valuation of each type of derivative.
Averages represent the arithmetic average of the inputs and
are not weighted by the relative fair value or notional of the
respective financial instruments. An average greater than the
median indicates that the majority of inputs are below the
average.

GOLDMAN SACHS INTERNATIONAL (UNLIMITED COMPANY)
Notes to the Financial Statements (Unaudited)
40
The ranges, averages and medians of these inputs are not
representative of the appropriate inputs to use when
calculating the fair value of any one derivative. For example,
the highest correlation for credit derivatives is appropriate for
valuing a specific credit derivative but may not be
appropriate for valuing any other credit derivative.
Accordingly, the ranges of inputs do not represent
uncertainty in, or possible ranges of, fair value measurements
of the company’s level 3 derivatives.
Credit derivatives are valued using option pricing, correlation
and discounted cash flow models, and equities derivatives are
valued using option pricing models.
The fair value of any one instrument may be determined
using multiple valuation techniques. For example, option
pricing models and discounted cash flows models are
typically used together to determine fair value. Therefore, the
level 3 balance encompasses both of these techniques.
Correlation within equities includes cross-product
correlation.
Range of Significant Unobservable Inputs
The following is information about the ranges of significant
unobservable inputs used to value the company’s level 3
derivative instruments:
Correlation. Ranges for correlation cover a variety of
underliers both within one market (e.g., equity index and
equity single stock names) and across markets (e.g.,
correlation of an equity index and a foreign exchange rate),
as well as across regions.
Volatility. Ranges for volatility cover numerous underliers
across a variety of markets, maturities and strike prices. For
example, volatility of equity indices is generally lower than
volatility of single stocks.
Credit spreads, upfront credit points and recovery
rates. The ranges for credit spreads, upfront credit points
and recovery rates cover a variety of underliers (index and
single names), regions, sectors, maturities and credit qualities
(high-yield and investment-grade). The broad range of this
population gives rise to the width of the ranges of significant
unobservable inputs.
Sensitivity of Fair Value Measurement to Changes in
Significant Unobservable Inputs
The following is a description of the directional sensitivity of
the company’s level 3 fair value measurements to changes in
significant unobservable inputs, in isolation:
Correlation. In general, for contracts where the holder
benefits from the consistent directional performance of the
underlying asset or index prices (e.g., interest rates, credit
spreads, foreign exchange rates, inflation rates and equity
prices), an increase in correlation results in a higher fair value
measurement.
Volatility. In general, for purchased options, an increase in
volatility results in a higher fair value measurement.
Credit spreads, upfront credit points and recovery
rates. In general, the fair value of purchased credit
protection increases as credit spreads or upfront credit points
increase or recovery rates decrease. Credit spreads, upfront
credit points and recovery rates are strongly related to
distinctive risk factors of the underlying reference
obligations, which include reference entity-specific factors
such as leverage, volatility and industry, market-based risk
factors, such as borrowing costs or liquidity of the underlying
reference obligation; and macroeconomic conditions.
Due to the distinctive nature of each of the company’s level 3
derivatives, the interrelationship of inputs is not necessarily
uniform within each product type.
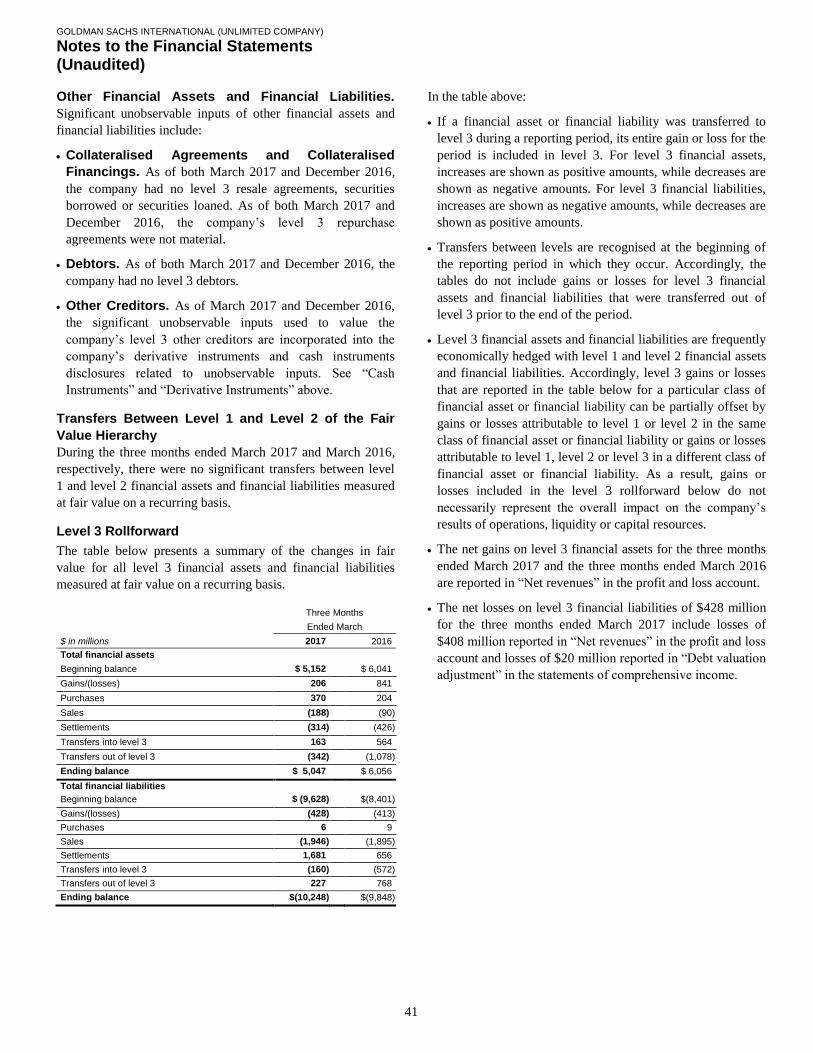
GOLDMAN SACHS INTERNATIONAL (UNLIMITED COMPANY)
Notes to the Financial Statements (Unaudited)
41
Other Financial Assets and Financial Liabilities.
Significant unobservable inputs of other financial assets and
financial liabilities include:
Collateralised Agreements and Collateralised
Financings. As of both March 2017 and December 2016,
the company had no level 3 resale agreements, securities
borrowed or securities loaned. As of both March 2017 and
December 2016, the company’s level 3 repurchase
agreements were not material.
Debtors. As of both March 2017 and December 2016, the
company had no level 3 debtors.
Other Creditors. As of March 2017 and December 2016,
the significant unobservable inputs used to value the
company’s level 3 other creditors are incorporated into the
company’s derivative instruments and cash instruments
disclosures related to unobservable inputs. See “Cash
Instruments” and “Derivative Instruments” above.
Transfers Between Level 1 and Level 2 of the Fair
Value Hierarchy
During the three months ended March 2017 and March 2016,
respectively, there were no significant transfers between level
1 and level 2 financial assets and financial liabilities measured
at fair value on a recurring basis.
Level 3 Rollforward
The table below presents a summary of the changes in fair
value for all level 3 financial assets and financial liabilities
measured at fair value on a recurring basis.
Three Months
Ended March
$ in millions 2017 2016
Total financial assets
Beginning balance $ 5,152 $ 6,041
Gains/(losses) 206 841
Purchases 370 204
Sales (188) (90)
Settlements (314) (426)
Transfers into level 3 163 564
Transfers out of level 3 (342) (1,078)
Ending balance $ 5,047 $ 6,056
Total financial liabilities
Beginning balance $ (9,628) $(8,401)
Gains/(losses) (428) (413)
Purchases 6 9
Sales (1,946) (1,895)
Settlements 1,681 656
Transfers into level 3 (160) (572)
Transfers out of level 3 227 768
Ending balance $(10,248) $(9,848)
In the table above:
If a financial asset or financial liability was transferred to
level 3 during a reporting period, its entire gain or loss for the
period is included in level 3. For level 3 financial assets,
increases are shown as positive amounts, while decreases are
shown as negative amounts. For level 3 financial liabilities,
increases are shown as negative amounts, while decreases are
shown as positive amounts.
Transfers between levels are recognised at the beginning of
the reporting period in which they occur. Accordingly, the
tables do not include gains or losses for level 3 financial
assets and financial liabilities that were transferred out of
level 3 prior to the end of the period.
Level 3 financial assets and financial liabilities are frequently
economically hedged with level 1 and level 2 financial assets
and financial liabilities. Accordingly, level 3 gains or losses
that are reported in the table below for a particular class of
financial asset or financial liability can be partially offset by
gains or losses attributable to level 1 or level 2 in the same
class of financial asset or financial liability or gains or losses
attributable to level 1, level 2 or level 3 in a different class of
financial asset or financial liability. As a result, gains or
losses included in the level 3 rollforward below do not
necessarily represent the overall impact on the company’s
results of operations, liquidity or capital resources.
The net gains on level 3 financial assets for the three months
ended March 2017 and the three months ended March 2016
are reported in “Net revenues” in the profit and loss account.
The net losses on level 3 financial liabilities of $428 million
for the three months ended March 2017 include losses of
$408 million reported in “Net revenues” in the profit and loss
account and losses of $20 million reported in “Debt valuation
adjustment” in the statements of comprehensive income.

GOLDMAN SACHS INTERNATIONAL (UNLIMITED COMPANY)
Notes to the Financial Statements (Unaudited)
42
The table below disaggregates, by the balance sheet line items,
the information for financial liabilities included in the
summary table above. The information for financial assets
included in the summary table above has not been
disaggregated as it solely relates to “Financial instruments
owned” on the balance sheet.
Three Months
Ended March
$ in millions 2017 2016
Financial instruments sold, but not yet purchased
Beginning balance $(2,228) $(2,727)
Gains/(losses) (124) (445)
Purchases 6 9
Sales (72) (95)
Settlements 157 340
Transfers into level 3 (102) (233)
Transfers out of level 3 215 551
Ending balance $(2,148) $(2,600)
Collateralised financings
Beginning balance $ (66) $ (71)
Gains/(losses) – (2)
Settlements 2 –
Ending balance $ ((64) $ (73)
Other creditors
Beginning balance $(7,334) $(5,603)
Gains/(losses) (304) 34
Sales (1,874) (1,800)
Settlements 1,522 316
Transfers into level 3 (58) (339)
Transfers out of level 3 12 217
Ending balance $(8,036) $(7,175)
Transfers Between Level 2 and Level 3 of the Fair
Value Hierarchy
Three Months Ended March 2017. Transfers into level 3
primarily reflected transfers of certain credit derivatives from
level 2, principally due to unobservable credit spread and yield
inputs becoming significant to the valuation of these
instruments, and transfers of certain equity derivatives from
level 2, principally due to unobservable volatility and
correlation inputs becoming significant to the valuation of
these derivatives.
Transfers out of level 3 primarily reflected transfers of certain
credit derivatives to level 2, principally due to unobservable
credit spread and yield inputs no longer being significant to the
net risk of certain portfolios, and transfers of certain equity
derivatives to level 2, principally due to unobservable volatility
and correlation inputs no longer being significant to the
valuation of these derivatives.
Three Months Ended March 2016. Transfers into level 3
primarily reflected transfers of certain credit derivatives from
level 2, principally due to unobservable credit spread inputs
becoming significant to the valuation of these instruments, and
transfers of certain equity derivatives from level 2, principally
due to unobservable volatility and correlation inputs becoming
significant to the valuation of these derivatives.
Transfers out of level 3 primarily reflected transfers of certain
credit derivatives to level 2, principally due to unobservable
credit spread inputs no longer being significant to the net risk
of certain portfolios, and transfers of certain interest rate
derivatives to level 2, due to unobservable long-dated interest
rates becoming observable.

GOLDMAN SACHS INTERNATIONAL (UNLIMITED COMPANY)
Notes to the Financial Statements (Unaudited)
43
Fair Value Financial Assets and Financial Liabilities
Valued Using Techniques That Incorporate
Unobservable Inputs
The fair value of financial assets and financial liabilities may
be determined in whole or part using a valuation technique
based on assumptions that are not supported by prices from
observable current market transactions in the same instrument
or based on available observable market data and changing
these assumptions will change the resultant estimate of fair
value. The potential impact of using reasonable possible
alternative assumptions for the valuations, including significant
unobservable inputs, has been quantified as of March 2017 and
March 2016, as approximately $282 million and $380 million,
respectively, for favourable changes, and $260 million and
$305 million, respectively, for unfavourable changes. In
determining reasonably possible alternative unfavourable
assumptions, a detailed business and position level review has
been performed to identify and quantify instances where
potential uncertainty exists. This has taken into account the
positions’ fair value as compared to the range of available
market information.
The table below presents the amounts not recognised in the
profit and loss account relating to the difference between the
fair value of financial instruments held for trading at initial
recognition (the transaction price) and the amounts determined
at initial recognition using the valuation techniques (day 1
P&L).
Three Months
Ended March
$ in millions 2017 2016
As of January 1 $149 $139
New transactions 71 50
Amounts recognised in the profit and loss account
during the period (16) (15)
As of March 31 $204 $174
Fair Value of Financial Assets and Financial
Liabilities Not Measured at Fair Value
As of March 2017 and December 2016, the company had
$134.65 billion and $129.28 billion, respectively, of current
financial assets and $135.45 billion and $138.17 billion,
respectively, of current financial liabilities that are not
measured at fair value. Given the short-term nature of these
instruments, their carrying amounts in the balance sheet are a
reasonable approximation of fair value.
As of March 2017 and December 2016, the company had
$18.68 billion and $18.67 billion, respectively, of financial
liabilities that are due after more than one year that are not
measured at fair value which predominantly relate to long-term
intercompany borrowings. The interest rates of these
borrowings are variable in nature and approximate prevailing
market interest rates for instruments with similar terms and
characteristics. As such, their carrying amounts in the balance
sheet are a reasonable approximation of fair value.