UNAUDITED INTERIM GROUP RESULTS - Home | Group Five
48
UNAUDITED INTERIM GROUP RESULTS for the six months ended 31 December 2013
Transcript of UNAUDITED INTERIM GROUP RESULTS - Home | Group Five

UNAUDITED INTERIM
GROUP RESULTS for the six months ended 31 December 2013

2
2
Agenda
Overview of H1 F2014
01 SECTION 1
Financial review
02 SECTION 2
Segmental review and prospects
03 SECTION 3
Group prospects
04 SECTION 4
3
Overview of H1 F2014
01 SECTION 1

4
Financial summary
* Including fair value adjustments, losses from Middle East operations and provision for competition commission administrative penalty raised in H2 F2013, excluding amounts from associates and joint ventures
** Including Middle East losses
H1 F2014 vs.
H1 F2013
H1 F2014 Unaudited
H1 F2013 Unaudited^
H2 F2013 Unaudited^
Revenue – Rm from continuing operations
+56% 7 660 4 919 5 802
Operating profit – Rm* +28% 328 257 271
HEPS – Rand +41% 2,04 1,45 1,38
Fully diluted HEPS – Rand +40% 2,01 1,44 1,37
Fully diluted HEPS from continuing operations – Rand**
+15% 2,02 1,75 1,43
EPS – Rand +50% 2,00 1,33 1,31
Fully diluted EPS – Rand +48% 1,96 1,32 1,30
Dividends per share – cents +41% 45 32 35
Overview
Headline earnings: includes operating losses from both
Middle East operations and Construction Materials
Earnings: includes all operating losses and
all impairments
^ restated for first time adoption of IFRS 11 and IAS 19 (Revised)
5
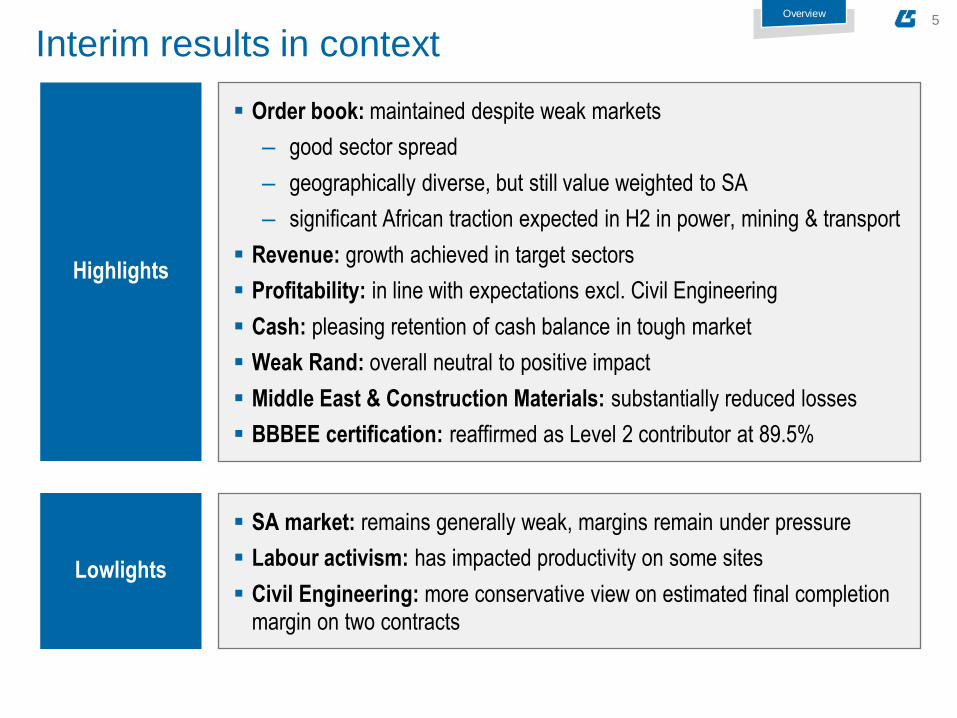
Order book: maintained despite weak markets
‒ good sector spread
‒ geographically diverse, but still value weighted to SA
‒ significant African traction expected in H2 in power, mining & transport
Revenue: growth achieved in target sectors
Profitability: in line with expectations excl. Civil Engineering
Cash: pleasing retention of cash balance in tough market
Weak Rand: overall neutral to positive impact
Middle East & Construction Materials: substantially reduced losses
BBBEE certification: reaffirmed as Level 2 contributor at 89.5%
Highlights
Overview
SA market: remains generally weak, margins remain under pressure
Labour activism: has impacted productivity on some sites
Civil Engineering: more conservative view on estimated final completion margin on two contracts
Lowlights
Interim results in context
6
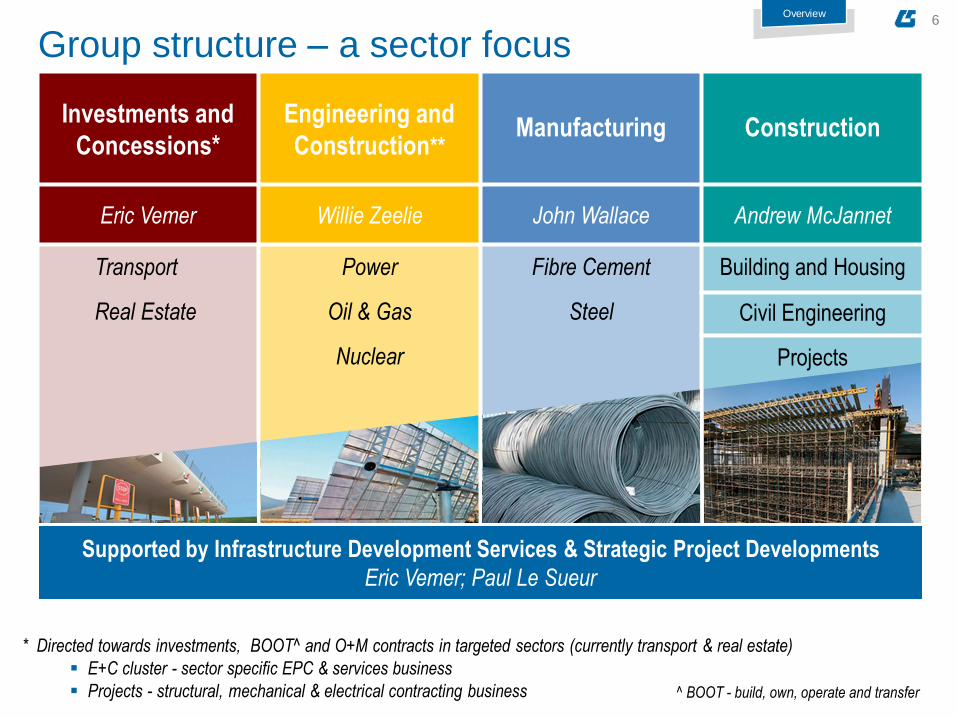
Investments and
Concessions*
Engineering and
Construction** Manufacturing Construction
Eric Vemer Willie Zeelie John Wallace Andrew McJannet
Transport
Real Estate
Power
Oil & Gas
Nuclear
Fibre Cement
Steel
Building and Housing
Civil Engineering
Projects
* Directed towards investments, BOOT^ and O+M contracts in targeted sectors (currently transport & real estate)
E+C cluster - sector specific EPC & services business
Projects - structural, mechanical & electrical contracting business
Group structure – a sector focus
Overview
^ BOOT - build, own, operate and transfer
Supported by Infrastructure Development Services & Strategic Project Developments
Eric Vemer; Paul Le Sueur

7
Financial review
02 SECTION 2

8
Income statement Rm
H1 F2014 vs.
H1 F2013
H1 F2014 Unaudited
H1 F2013 Unaudited ̂
H2 F2013 Unaudited^
Revenue from continuing operations +56% 7 660 4 919 5 802
Operating profit and margin % Incl:
‒ fair value adjustments
‒ losses from Middle East operations
‒ provision for compcom penalty in H2 F2013
Excl: profit from associates and joint ventures
+28%
328
4.3%
257
5.2%
271
4.7%
Profit before interest and taxation +29% 340 264 279
Finance (cost)/income ‒ net - (2) (3) 1
Profit before taxation +30% 338 261 280
Effective tax rate % - 34% 31% 44%
Profit from continuing operations +23% 222 180 155
Loss from discontinued operations Including operating losses from Construction Materials
and impairment from Construction Materials
- (3) (38) (10)
Net profit +54% 219 142 145
Financial review
Earnings: includes all operating losses and all impairments
Headline earnings: includes operating losses from Middle East operations and Construction Materials, provision for competition commission administrative penalty raised in H2 F2013
^ restated for first time adoption of IFRS 11 and IAS 19 (Revised)
9
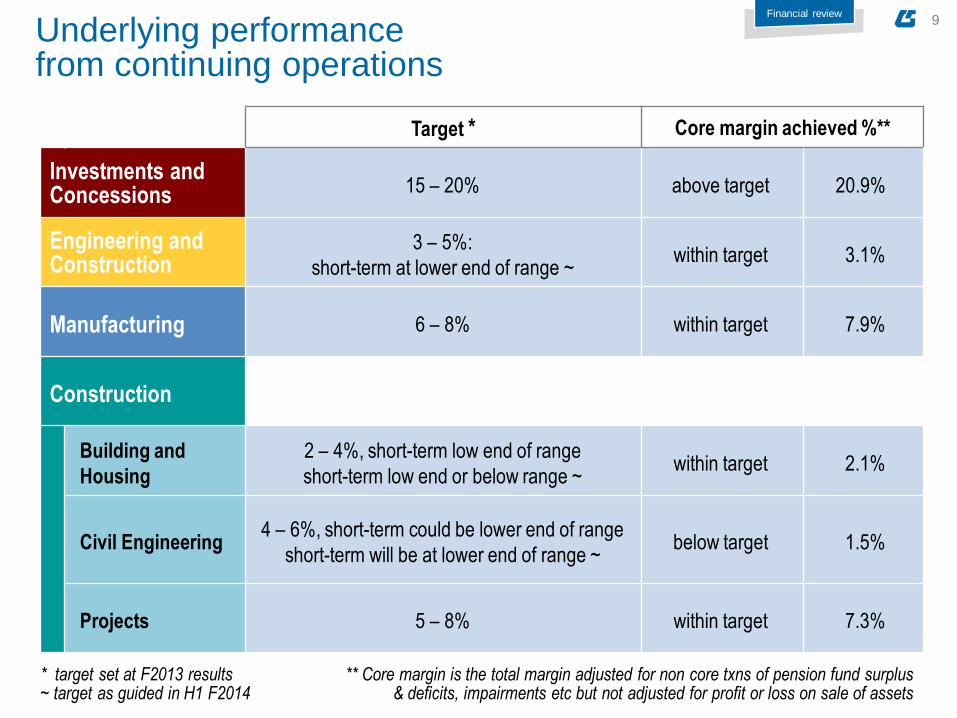
* target set at F2013 results ~ target as guided in H1 F2014
** Core margin is the total margin adjusted for non core txns of pension fund surplus & deficits, impairments etc but not adjusted for profit or loss on sale of assets
Target * Core margin achieved %**
Investments and Concessions 15 – 20% above target 20.9%
Engineering and Construction
3 – 5%:
short-term at lower end of range ~ within target 3.1%
Manufacturing 6 – 8% within target 7.9%
Construction
Building and
Housing
2 – 4%, short-term low end of range
short-term low end or below range ~ within target 2.1%
Civil Engineering 4 – 6%, short-term could be lower end of range
short-term will be at lower end of range ~ below target
1.5%
Projects 5 – 8% within target 7.3%
Financial review
Underlying performance from continuing operations
10
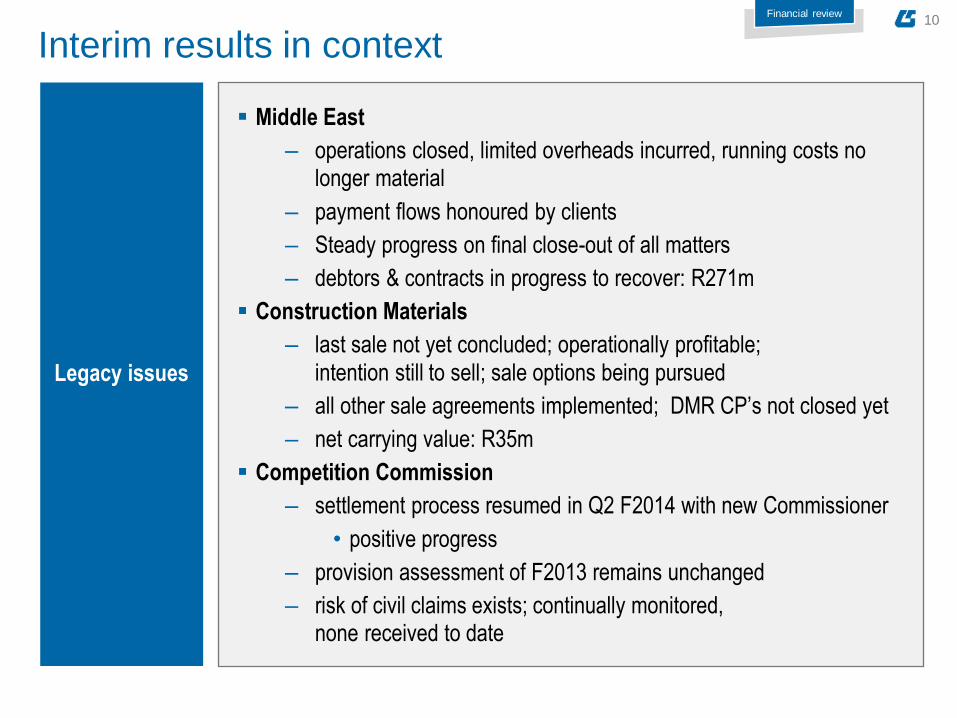
Middle East
‒ operations closed, limited overheads incurred, running costs no longer material
‒ payment flows honoured by clients
‒ Steady progress on final close-out of all matters
‒ debtors & contracts in progress to recover: R271m
Construction Materials
‒ last sale not yet concluded; operationally profitable;
intention still to sell; sale options being pursued
‒ all other sale agreements implemented; DMR CP’s not closed yet
‒ net carrying value: R35m
Competition Commission
‒ settlement process resumed in Q2 F2014 with new Commissioner
• positive progress
‒ provision assessment of F2013 remains unchanged
‒ risk of civil claims exists; continually monitored, none received to date
Interim results in context
Legacy issues
Financial review
11
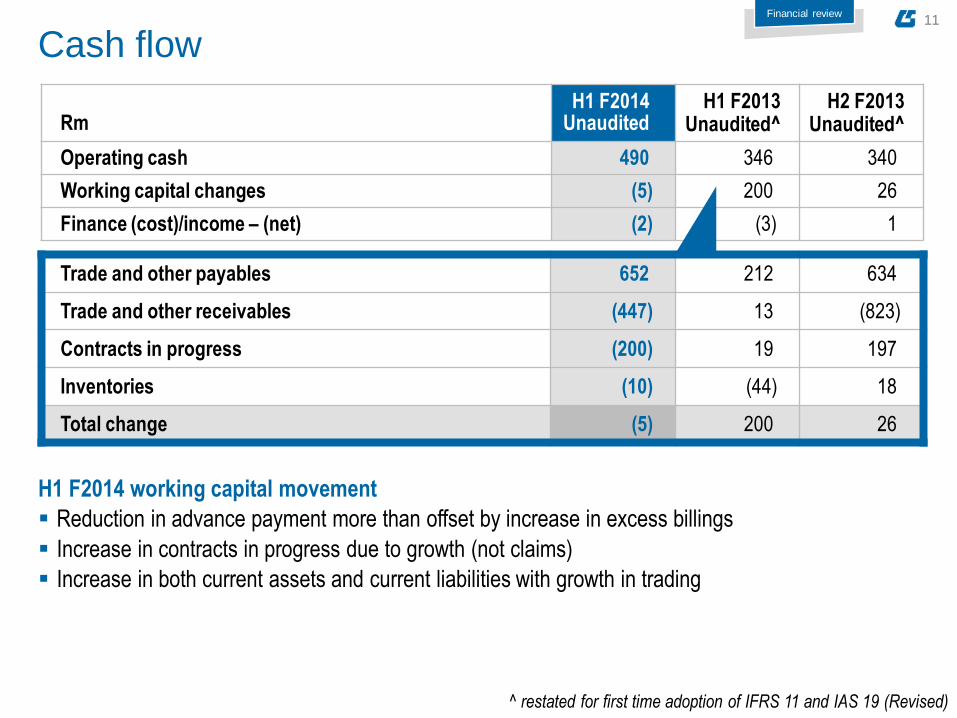
Rm
H1 F2014 Unaudited
H1 F2013 Unaudited^
H2 F2013 Unaudited^
Operating cash 490 346 340
Working capital changes (5) 200 26
Finance (cost)/income – (net) (2) (3) 1
Cash flow
H1 F2014 working capital movement
Reduction in advance payment more than offset by increase in excess billings
Increase in contracts in progress due to growth (not claims)
Increase in both current assets and current liabilities with growth in trading
Trade and other payables 652 212 634
Trade and other receivables (447) 13 (823)
Contracts in progress (200) 19 197
Inventories (10) (44) 18
Total change (5) 200 26
Financial review
^ restated for first time adoption of IFRS 11 and IAS 19 (Revised)
12
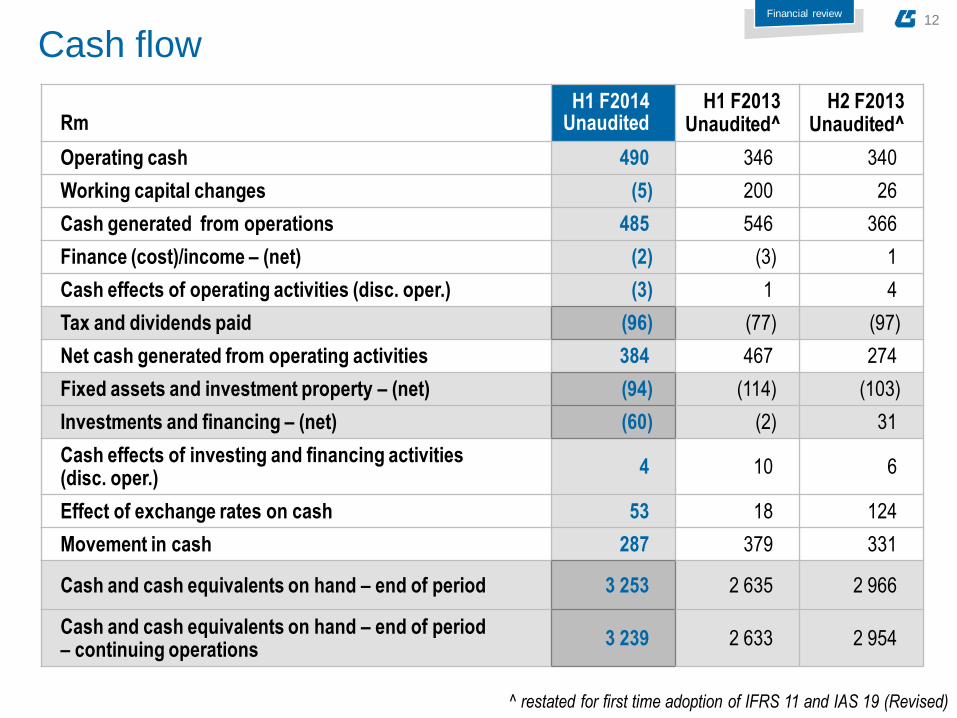
Cash flow
Rm
H1 F2014 Unaudited
H1 F2013 Unaudited^
H2 F2013 Unaudited^
Operating cash 490 346 340
Working capital changes (5) 200 26
Cash generated from operations 485 546 366
Finance (cost)/income – (net) (2) (3) 1
Cash effects of operating activities (disc. oper.) (3) 1 4
Tax and dividends paid (96) (77) (97)
Net cash generated from operating activities 384 467 274
Fixed assets and investment property – (net) (94) (114) (103)
Investments and financing – (net) (60) (2) 31
Cash effects of investing and financing activities (disc. oper.)
4 10 6
Effect of exchange rates on cash 53 18 124
Movement in cash 287 379 331
Cash and cash equivalents on hand – end of period 3 253 2 635 2 966
Cash and cash equivalents on hand – end of period – continuing operations
3 239 2 633 2 954
Financial review
^ restated for first time adoption of IFRS 11 and IAS 19 (Revised)

13
Cash flow
1 195 956
327
(871)
33
689 287
1 824
2 778 3 106
2 235 2 268
2 954 3 239
-1500
-500
500
1500
2500
3500
F2008 F2009 F2010 F2011 F2012 F2013 H1 F2014
Cash generated/(utilised) - net^ Net cash balance on hand at period-end *^
Nil
Cash on hand is healthy in current environment
Excess cash will be applied to future equity investments and growth strategies
Rm
Net gearing
%
* From continuing operations
Financial review
Net inflow of R1.4bn from F2008 to H1 F2014
^ restated for first time adoption of IFRS 11
14
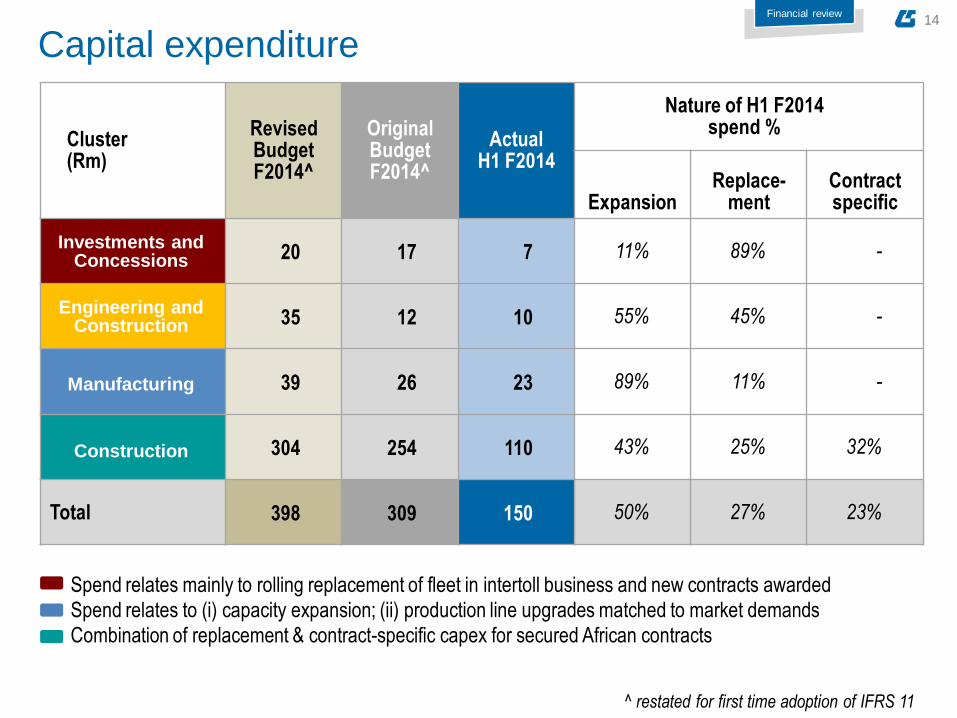
Cluster (Rm)
Revised Budget F2014^
Original Budget F2014^
Actual H1 F2014
Nature of H1 F2014 spend %
Expansion Replace-
ment Contract specific
20 17 7 11% 89% -
35 12 10 55% 45% -
39 26 23 89% 11% -
304 254 110 43% 25% 32%
Total 398 309 150 50% 27% 23%
Capital expenditure
Investments and Concessions
Manufacturing
Construction
Spend relates mainly to rolling replacement of fleet in intertoll business and new contracts awarded
Spend relates to (i) capacity expansion; (ii) production line upgrades matched to market demands
Combination of replacement & contract-specific capex for secured African contracts
Engineering and Construction
Financial review
^ restated for first time adoption of IFRS 11

15
Key financial ratios
H1 F2014 Unaudited
H1 F2013 Unaudited^
F2013 Unaudited^ Targets
Net gearing – debt to equity ratio % - - - maximum 33
Cash from operations before working
capital changes (Rm) 490 346 685 cash generative
Cash generated from operations (Rm) 485 546 911 cash generative
Net increase in cash (Rm) - total 287 379 710 cash generative
Cash on hand at period end (Rm)
- continuing operations 3 239 2 633 2 954 n/a
External guarantees unutilised (Rm)
Total facility at period end (Rm)
7 903 11 579
6 135 10 731
5 652 10 021
Sufficient for tender
Return on shareholders equity – % * 16.7% 13.2% 13.0% 15% - 20%
Return on shareholders equity – % *
- continuing operations ** 17.3% 18.7% 15.9% 15% - 20%
** Excludes Construction Materials, includes Middle East
Financial review
* Annualised
^ restated for first time adoption of IFRS 11 and IAS 19 (Revised)
medium - long term
medium - long term
16
Segmental review and prospects
03 SECTION 3
17
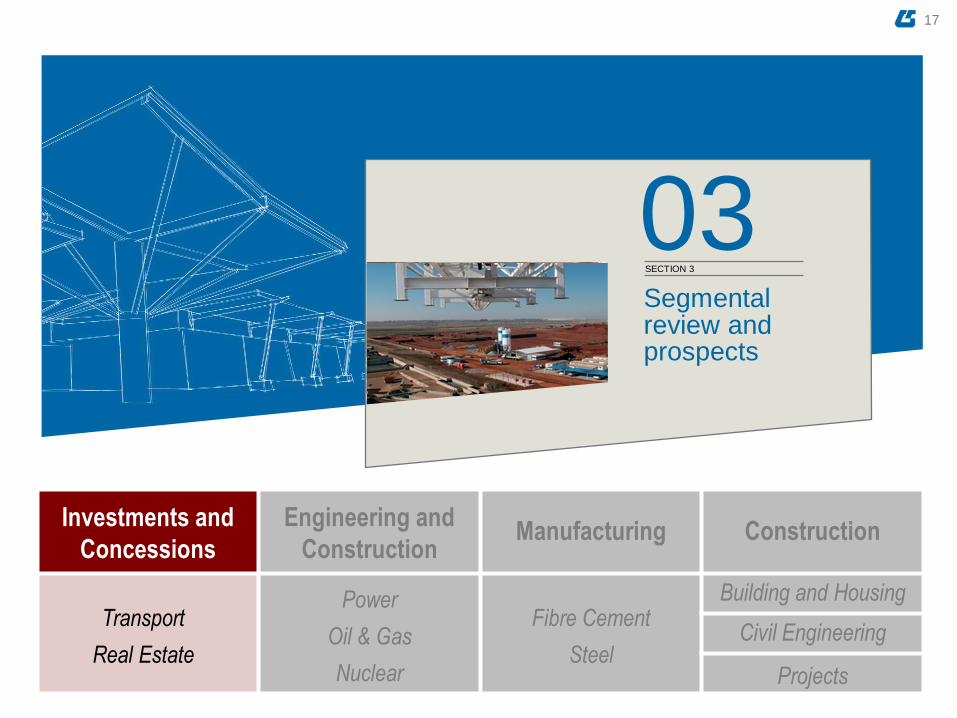
Investments and
Concessions
Engineering and
Construction Manufacturing Construction
Transport
Real Estate
Power
Oil & Gas
Nuclear
Fibre Cement
Steel
Building and Housing
Civil Engineering
Projects
Segmental review and prospects
03 SECTION 3

18
335
394
427
310
330
350
370
390
410
430
450
H1 F13 H2 F13 H1 F14
Investments and Concessions
76
98
89
60
70
80
90
100
110
120
H1 F13 H2 F13 H1 F14
Core Operating Profit (incl. FVAs^) + 18%* Revenue +27%*
Rm Rm * H1 F2014 versus H1 F2013
Core Operating Margin % - above cluster medium term target range
^ FVA = Fair Value Adjustments - Refer Note 11 F2013 AFS for detail of basis of valuation
22.6
25.1
20.9
H1 F13 H2 F13 H1 F14
%
Investments and Concessions
Segmental review
of group core
operating profit
27%
19
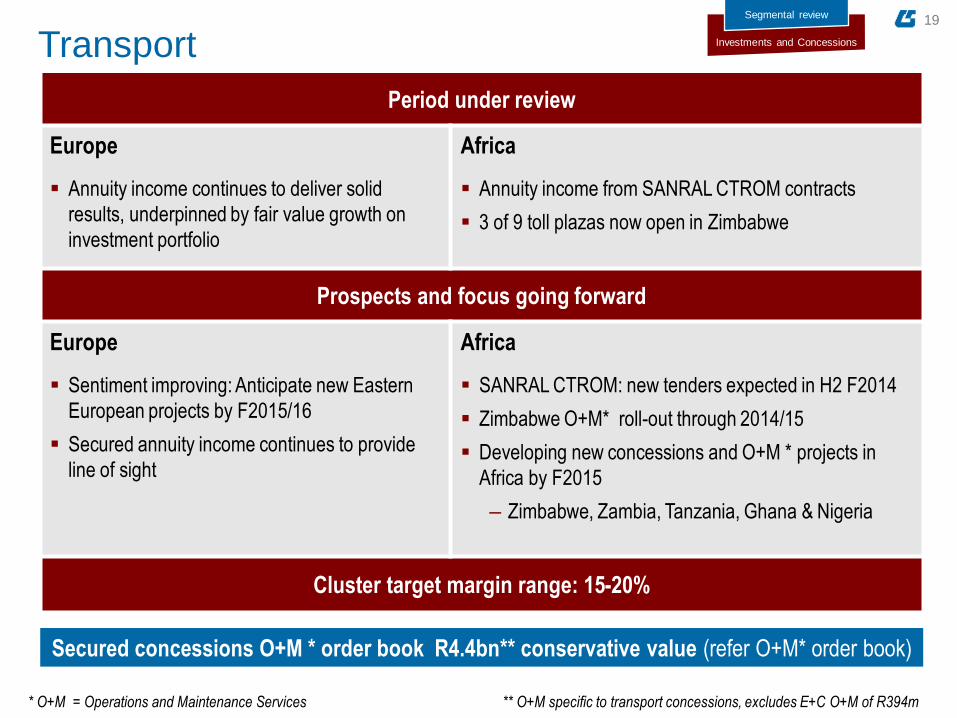
Transport Investments and Concessions
Segmental review
* O+M = Operations and Maintenance Services ** O+M specific to transport concessions, excludes E+C O+M of R394m
Period under review
Europe
Annuity income continues to deliver solid
results, underpinned by fair value growth on
investment portfolio
Africa
Annuity income from SANRAL CTROM contracts
3 of 9 toll plazas now open in Zimbabwe
Prospects and focus going forward
Europe
Sentiment improving: Anticipate new Eastern
European projects by F2015/16
Secured annuity income continues to provide
line of sight
Africa
SANRAL CTROM: new tenders expected in H2 F2014
Zimbabwe O+M* roll-out through 2014/15
Developing new concessions and O+M * projects in
Africa by F2015
‒ Zimbabwe, Zambia, Tanzania, Ghana & Nigeria
Cluster target margin range: 15-20%
Secured concessions O+M * order book R4.4bn** conservative value (refer O+M* order book)
20
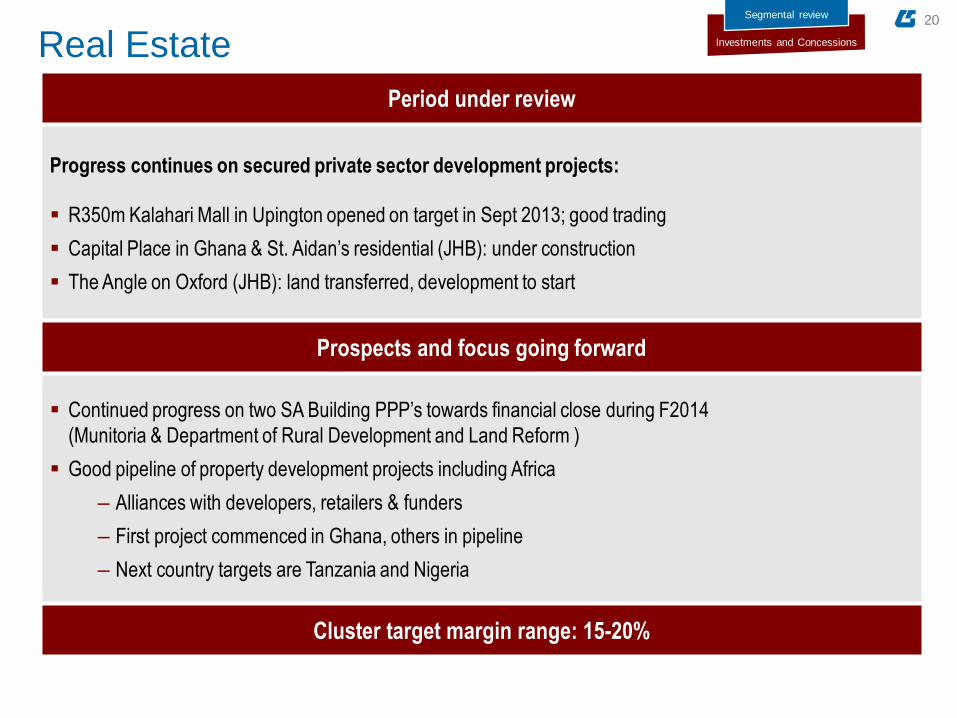
Real Estate Investments and Concessions
Segmental review
Period under review
Progress continues on secured private sector development projects:
R350m Kalahari Mall in Upington opened on target in Sept 2013; good trading
Capital Place in Ghana & St. Aidan’s residential (JHB): under construction
The Angle on Oxford (JHB): land transferred, development to start
Prospects and focus going forward
Continued progress on two SA Building PPP’s towards financial close during F2014
(Munitoria & Department of Rural Development and Land Reform )
Good pipeline of property development projects including Africa
‒ Alliances with developers, retailers & funders
‒ First project commenced in Ghana, others in pipeline
‒ Next country targets are Tanzania and Nigeria
Cluster target margin range: 15-20%
21
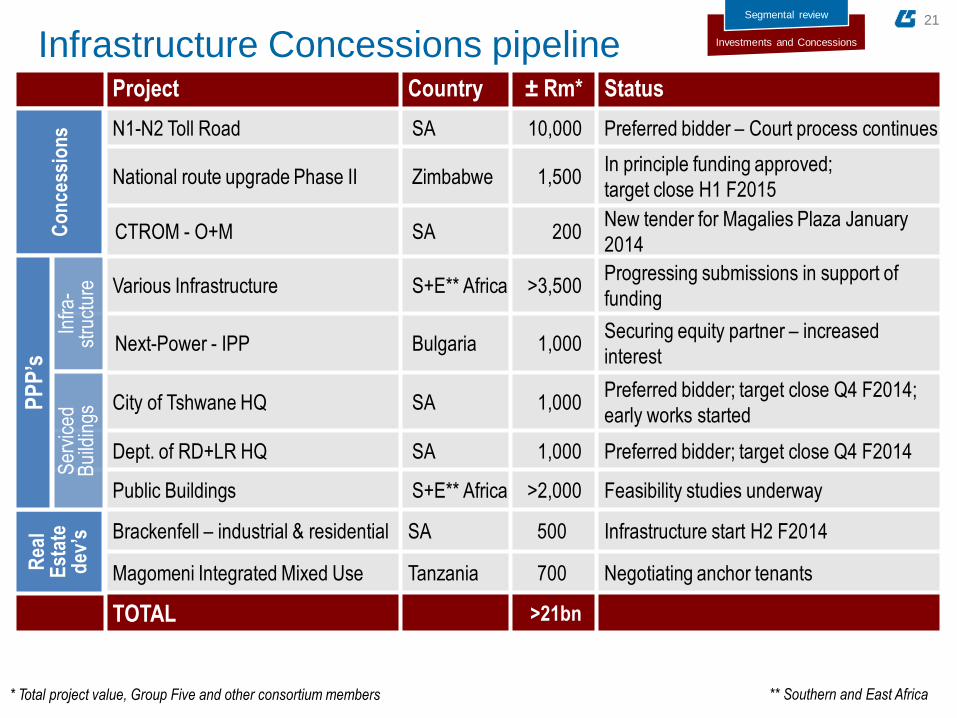
Infrastructure Concessions pipeline Project Country ± Rm* Status
N1-N2 Toll Road SA 10,000 Preferred bidder – Court process continues
National route upgrade Phase II Zimbabwe 1,500 In principle funding approved;
target close H1 F2015
CTROM - O+M SA 200 New tender for Magalies Plaza January
2014
Various Infrastructure S+E** Africa >3,500 Progressing submissions in support of
funding
Next-Power - IPP Bulgaria 1,000 Securing equity partner – increased
interest
City of Tshwane HQ SA 1,000 Preferred bidder; target close Q4 F2014;
early works started
Dept. of RD+LR HQ SA 1,000 Preferred bidder; target close Q4 F2014
Public Buildings S+E** Africa >2,000 Feasibility studies underway
Brackenfell – industrial & residential SA 500 Infrastructure start H2 F2014
Magomeni Integrated Mixed Use Tanzania 700 Negotiating anchor tenants
TOTAL >21bn
* Total project value, Group Five and other consortium members ** Southern and East Africa
C
on
cess
ion
s
Rea
l E
stat
e dev
’s
PPP’s
Infr
a-
stru
ctur
e S
ervi
ced
Bui
ldin
gs
Investments and Concessions
Segmental review
22
Investments and
Concessions
Engineering and
Construction Manufacturing Construction
Transport
Real Estate
Power
Oil & Gas
Nuclear
Fibre Cement
Steel
Building and Housing
Civil Engineering
Projects
Segmental review and prospects
03 SECTION 3
23
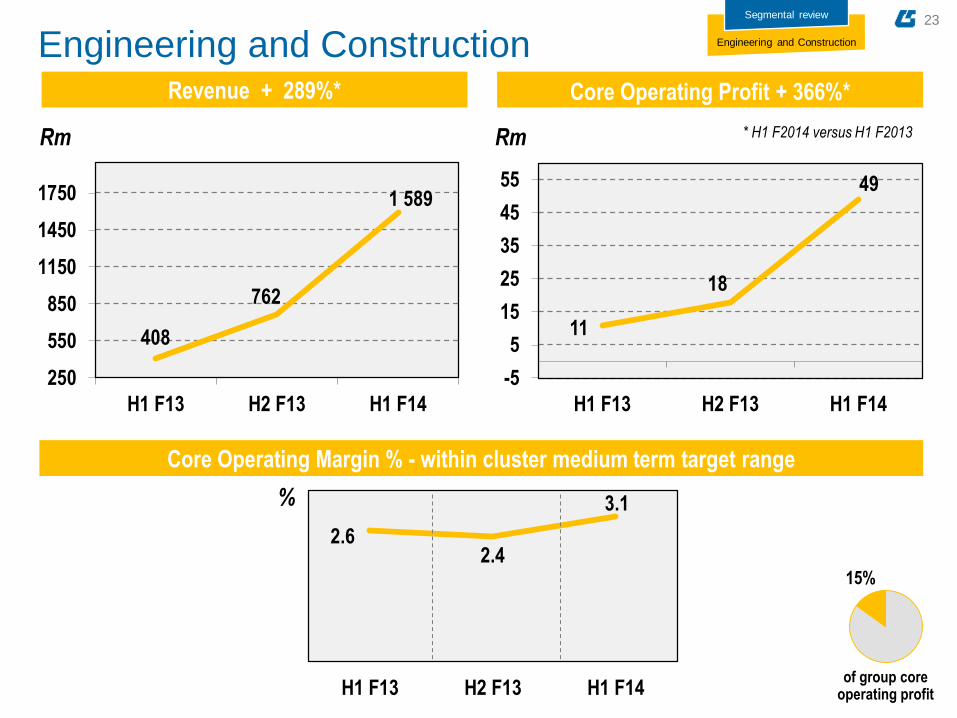
Engineering and Construction
408
762
1 589
250
550
850
1150
1450
1750
H1 F13 H2 F13 H1 F14
11
18
49
-5
5
15
25
35
45
55
H1 F13 H2 F13 H1 F14
Revenue + 289%* Core Operating Profit + 366%*
Rm Rm
2.6 2.4
3.1
H1 F13 H2 F13 H1 F14
%
Core Operating Margin % - within cluster medium term target range
* H1 F2014 versus H1 F2013
of group core
operating profit
15%
Engineering and Construction
Segmental review

24
Engineering and Construction
Excellent growth in a relatively new cluster
Engineering and Construction
Segmental review
* Renewable Energy Independent Power Producer Programme
Period under review
Power Oil and Gas
South Africa
Mid-stage of large project delivery
Tender activity high on REIPP* renewables
South Africa
All oil & gas majors are now clients
Tender activity high but very competitive
Rest of Africa
Gas finds in East and West Africa attracting IPP’s
Foreign funding for power more readily available
Time to reach financial close still very long
Rest of Africa
Cautious entry into East Africa oil & gas markets
Nuclear
South Africa
First project secured at Eskom Koeberg Power Station in early stage
Government’s announcement about New Build Nuclear expected during 2014
25
Engineering and Construction
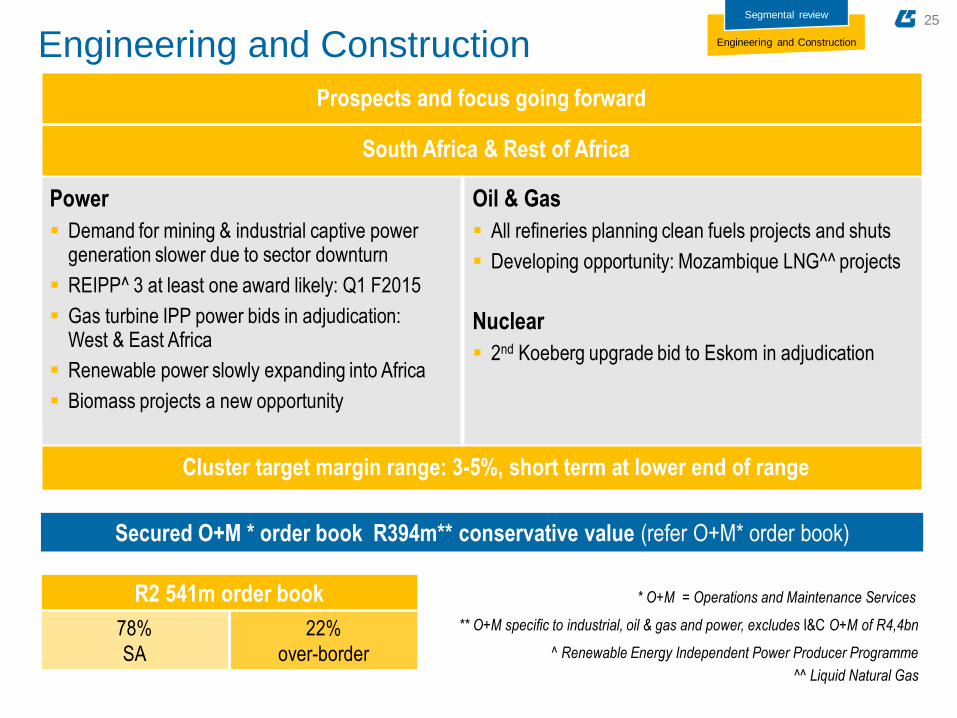
22%
over-border
78%
SA
R2 541m order book
Prospects and focus going forward
South Africa & Rest of Africa
Power
Demand for mining & industrial captive power generation slower due to sector downturn
REIPP^ 3 at least one award likely: Q1 F2015
Gas turbine IPP power bids in adjudication: West & East Africa
Renewable power slowly expanding into Africa
Biomass projects a new opportunity
Oil & Gas
All refineries planning clean fuels projects and shuts
Developing opportunity: Mozambique LNG^^ projects
Nuclear
2nd Koeberg upgrade bid to Eskom in adjudication
Cluster target margin range: 3-5%, short term at lower end of range
Engineering and Construction
Segmental review
Secured O+M * order book R394m** conservative value (refer O+M* order book)
^ Renewable Energy Independent Power Producer Programme
^^ Liquid Natural Gas
* O+M = Operations and Maintenance Services
** O+M specific to industrial, oil & gas and power, excludes I&C O+M of R4,4bn
26
Investments and
Concessions
Engineering and
Construction Manufacturing Construction
Transport
Real Estate
Power
Oil & Gas
Nuclear
Fibre Cement
Steel
Building and Housing
Civil Engineering
Projects
Segmental review and prospects
03 SECTION 3
27
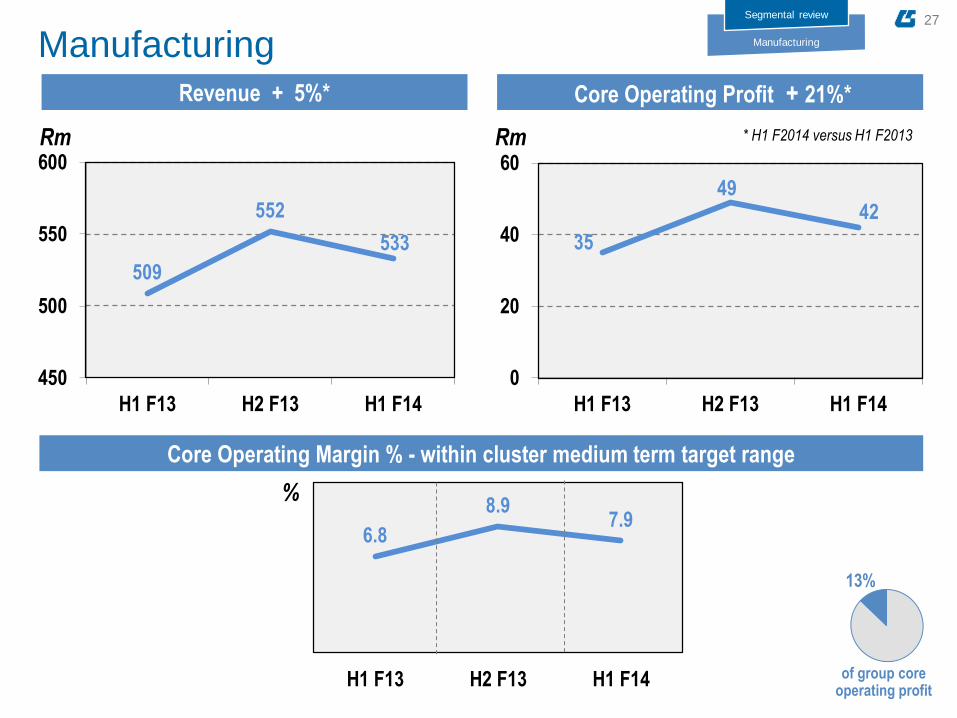
509
552
533
450
500
550
600
H1 F13 H2 F13 H1 F14
35
49 42
0
20
40
60
H1 F13 H2 F13 H1 F14
Manufacturing
Revenue + 5%* Core Operating Profit + 21%*
Rm Rm
6.8
8.9 7.9
H1 F13 H2 F13 H1 F14
%
Core Operating Margin % - within cluster medium term target range
* H1 F2014 versus H1 F2013
Manufacturing
Segmental review
of group core
operating profit
13%
28
Manufacturing Manufacturing
Segmental review
Period under review
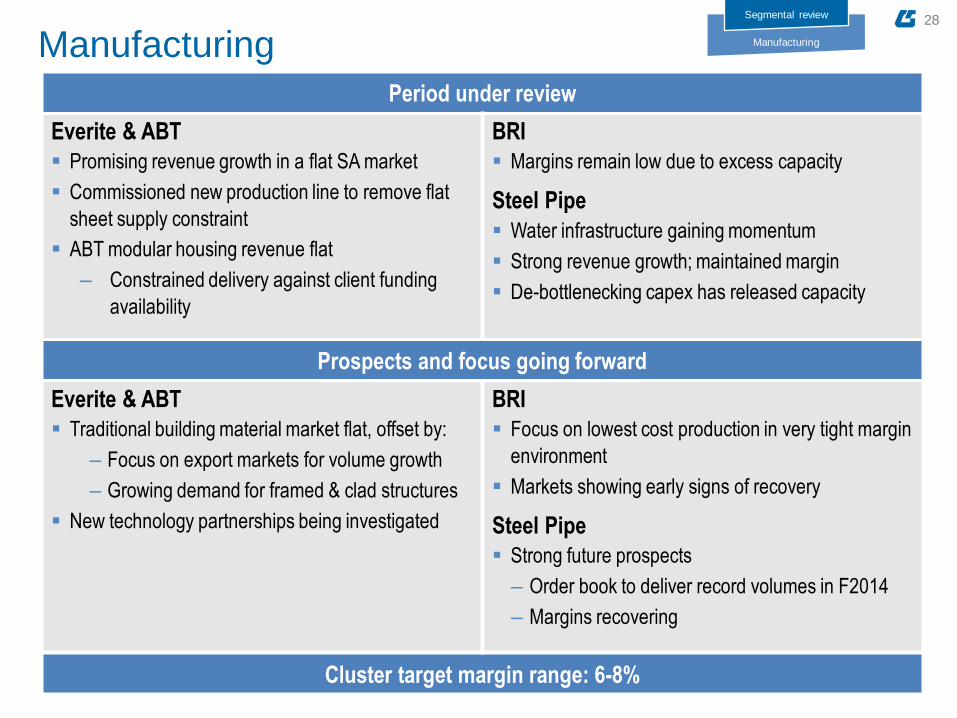
Everite & ABT
Promising revenue growth in a flat SA market
Commissioned new production line to remove flat
sheet supply constraint
ABT modular housing revenue flat
‒ Constrained delivery against client funding
availability
BRI
Margins remain low due to excess capacity
Steel Pipe
Water infrastructure gaining momentum
Strong revenue growth; maintained margin
De-bottlenecking capex has released capacity
Prospects and focus going forward
Everite & ABT
Traditional building material market flat, offset by:
‒ Focus on export markets for volume growth
‒ Growing demand for framed & clad structures
New technology partnerships being investigated
BRI
Focus on lowest cost production in very tight margin
environment
Markets showing early signs of recovery
Steel Pipe
Strong future prospects
‒ Order book to deliver record volumes in F2014
‒ Margins recovering
Cluster target margin range: 6-8%
29
Investments and
Concessions
Engineering and
Construction Manufacturing Construction
Transport
Real Estate
Power
Oil & Gas
Nuclear
Fibre Cement
Steel
Building and Housing
Civil Engineering
Projects
Segmental review and prospects
03 SECTION 3
30
1526 1710
2230
1459
1758 2052
873 845 1020
3 858
4 313
5 301
500
1000
1500
2000
2500
3000
3500
4000
4500
5000
5500
6000
H1 F13 H2 F13 H1 F14
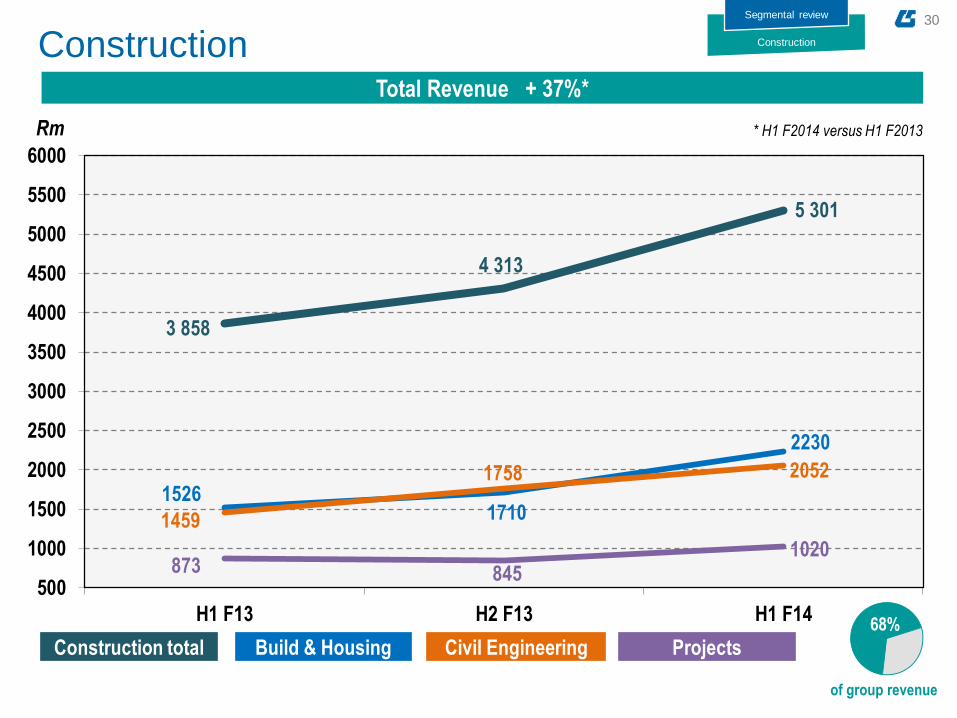
Construction Total Revenue + 37%*
Rm * H1 F2014 versus H1 F2013
Construction
Segmental review
of group revenue
68%
Projects Construction total Build & Housing Civil Engineering
31
Construction
3.6 2.9 2.9
H1 F13 H2 F13 H1 F14
%
2.0 0.6
2.1
H1 F13 H2 F13 H1 F14
6.9 6.6 7.3
H1 F13 H2 F13 H1 F14
Projects Construction total Build & Housing
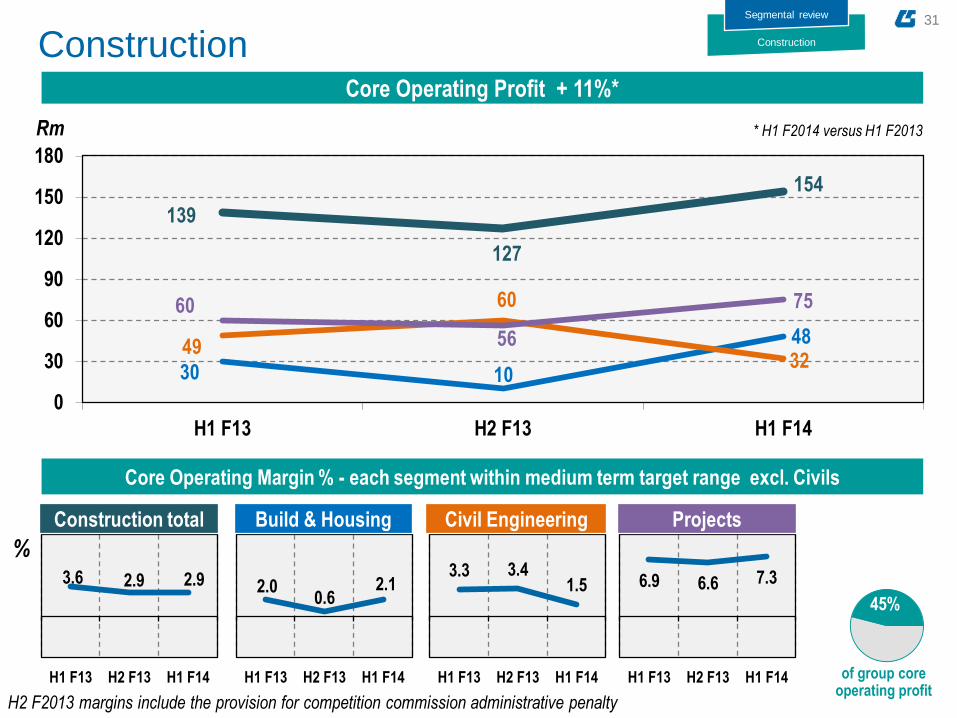
Core Operating Margin % - each segment within medium term target range excl. Civils
segmental review
30 10
48
139
127
154
49
60
32
60
56
75
0
30
60
90
120
150
180
H1 F13 H2 F13 H1 F14
3.3 3.4 1.5
H1 F13 H2 F13 H1 F14
Civil Engineering
Construction
Segmental review
of group core
operating profit
45%
H2 F2013 margins include the provision for competition commission administrative penalty
Core Operating Profit + 11%*
* H1 F2014 versus H1 F2013 Rm
32
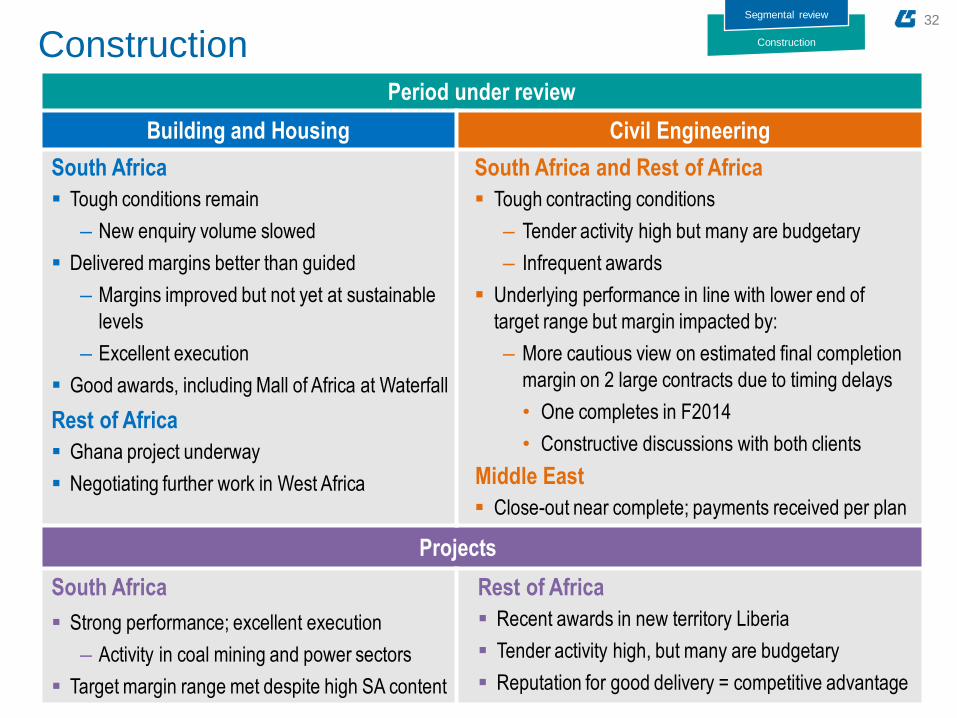
Construction Period under review
Building and Housing Civil Engineering
South Africa
Tough conditions remain
‒ New enquiry volume slowed
Delivered margins better than guided
‒ Margins improved but not yet at sustainable
levels
‒ Excellent execution
Good awards, including Mall of Africa at Waterfall
Rest of Africa
Ghana project underway
Negotiating further work in West Africa
South Africa and Rest of Africa
Tough contracting conditions
‒ Tender activity high but many are budgetary
‒ Infrequent awards
Underlying performance in line with lower end of
target range but margin impacted by:
‒ More cautious view on estimated final completion
margin on 2 large contracts due to timing delays
• One completes in F2014
• Constructive discussions with both clients
Middle East
Close-out near complete; payments received per plan
Projects
South Africa
Strong performance; excellent execution
‒ Activity in coal mining and power sectors
Target margin range met despite high SA content
Rest of Africa
Recent awards in new territory Liberia
Tender activity high, but many are budgetary
Reputation for good delivery = competitive advantage
Construction
Segmental review
33
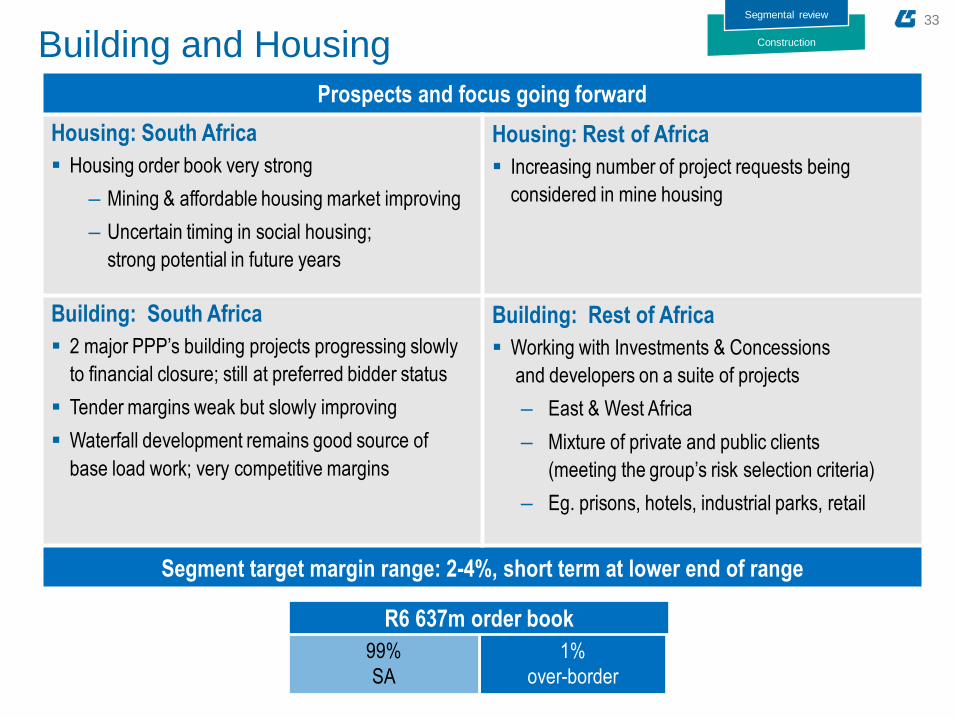
1%
over-border
99%
SA
R6 637m order book
Prospects and focus going forward
Housing: South Africa
Housing order book very strong
‒ Mining & affordable housing market improving
‒ Uncertain timing in social housing;
strong potential in future years
Housing: Rest of Africa
Increasing number of project requests being
considered in mine housing
Building: South Africa
2 major PPP’s building projects progressing slowly
to financial closure; still at preferred bidder status
Tender margins weak but slowly improving
Waterfall development remains good source of
base load work; very competitive margins
Building: Rest of Africa
Working with Investments & Concessions
and developers on a suite of projects
‒ East & West Africa
‒ Mixture of private and public clients
(meeting the group’s risk selection criteria)
‒ Eg. prisons, hotels, industrial parks, retail
Segment target margin range: 2-4%, short term at lower end of range
Construction Building and Housing Segmental review

34
37%
over-border
63%
SA
R3 357m order book
Construction Civil Engineering Segmental review
Prospects and focus going forward
Record revenue levels in F2014
H2 margin to recover to lower end of target range
Generally tough contracting conditions:
‒ Focus on contract completion and commercial compensation
Rebuilding order book – focus on over-border targets
South Africa
Still awaiting budgeted public expenditure
Margins still tight in general
Activity generally quiet across most sectors
Rest of Africa
Significant tender activity in oil & gas, mining,
transport and energy sectors
Segment target margin range: 4-6%; short term at lower end of range
35
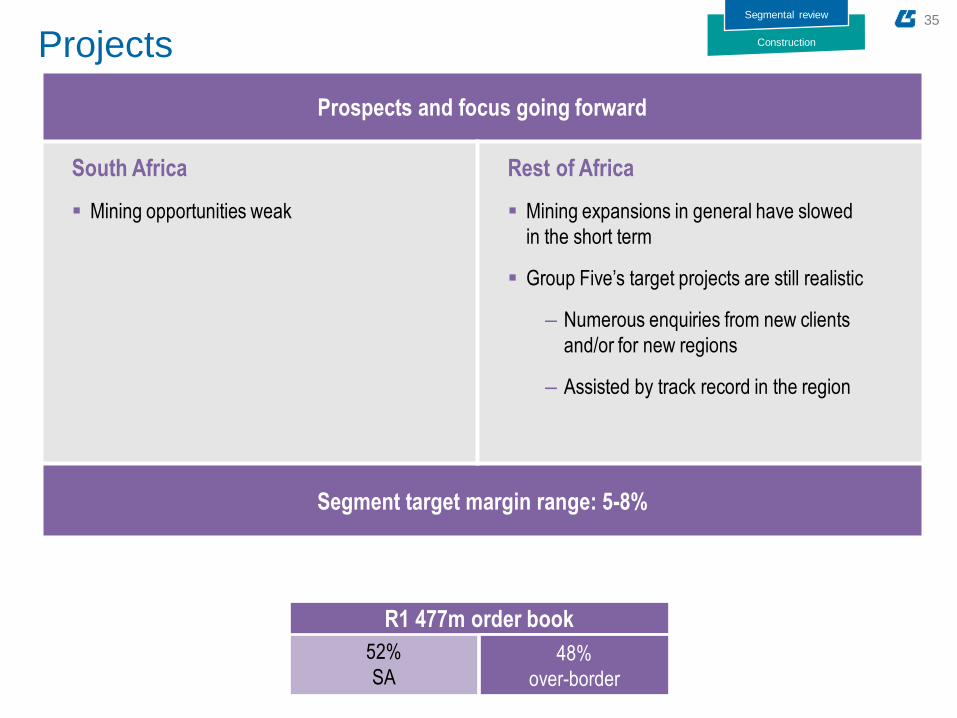
52%
SA
R1 477m order book
48%
over-border
Prospects and focus going forward
South Africa
Mining opportunities weak
Rest of Africa
Mining expansions in general have slowed
in the short term
Group Five’s target projects are still realistic
‒ Numerous enquiries from new clients
and/or for new regions
‒ Assisted by track record in the region
Segment target margin range: 5-8%
Construction Projects Segmental review
36
Group prospects
04 SECTION 4
Order books
Group outlook
37
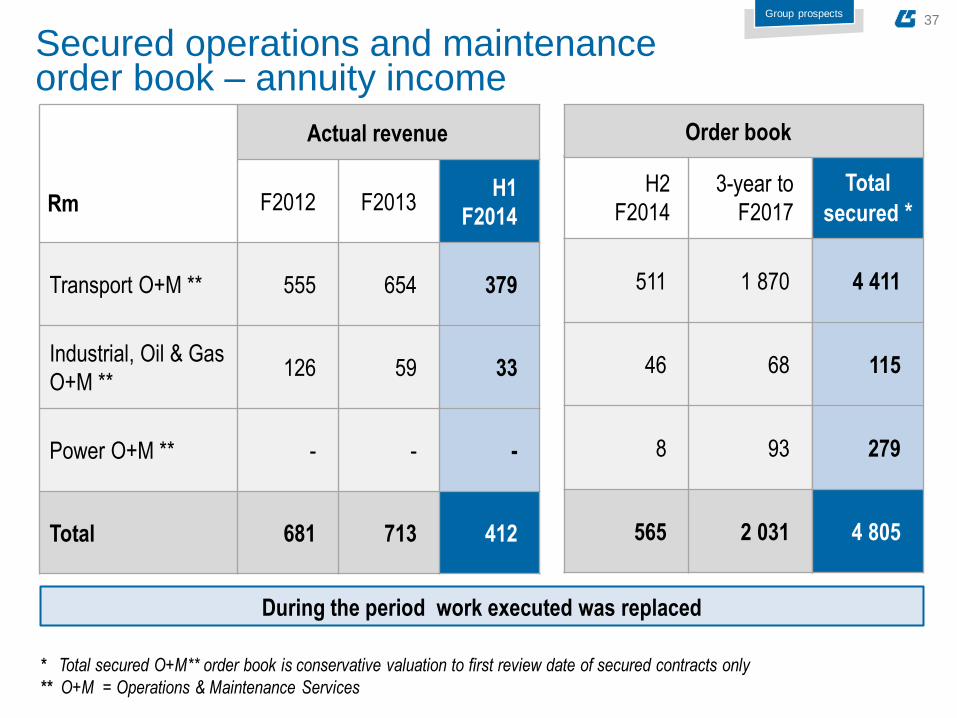
Rm
Actual revenue
F2012 F2013 H1
F2014
Transport O+M ** 555 654 379
Industrial, Oil & Gas
O+M ** 126 59 33
Power O+M ** - - -
Total 681 713 412
Secured operations and maintenance order book – annuity income
H2
F2014
3-year to
F2017
511 1 870
46 68
8 93
565 2 031
During the period work executed was replaced
* Total secured O+M** order book is conservative valuation to first review date of secured contracts only
** O+M = Operations & Maintenance Services
Total
secured *
4 411
115
279
4 805
Order book
Group prospects

38
Building & Housing Strong reputation in building market wins work not at lowest bid
Mine housing component has doubled & margin enhancing
to meet segment range guidance
Civil Engineering Worked hard to achieve R3,3bn in slow market
Large order book traded, replaced by smaller contracts pending next award cycle
Projects Order book now trading at H1 F2013 levels; replenished more than traded
E+C High base created by successful entry into Power, Oil & Gas market
Contracts are large; replenishment is lumpy by nature
Secured Contracting (Construction and E+C) order book*
Group prospects
* Values include only Group Five’s portion of fully secured construction work
* Total R14,0bn order book
R14,6bn at Oct 2013
R14,2bn at June 2013
R13,5bn at Dec 2012
Total
Building &
Housing
Civil
Engineering Projects E+C
Total order book – Rm 14 012 * 6 637 3 357 1 477 2 541
39
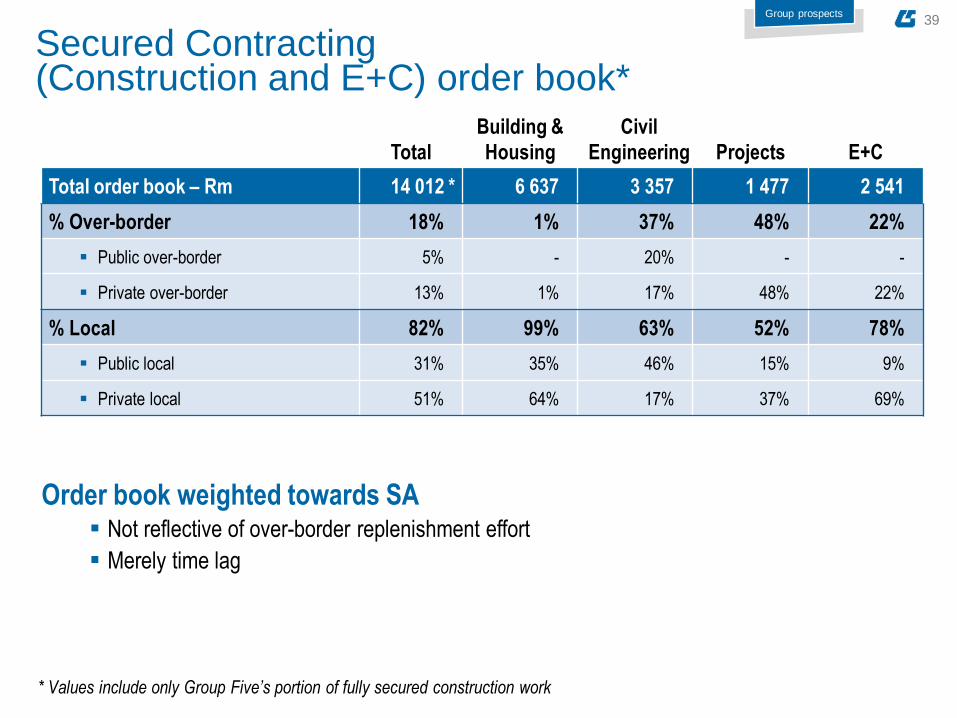
Secured Contracting (Construction and E+C) order book*
* Values include only Group Five’s portion of fully secured construction work
Group prospects
Order book weighted towards SA Not reflective of over-border replenishment effort
Merely time lag
Total
Building &
Housing
Civil
Engineering Projects E+C
Total order book – Rm 14 012 * 6 637 3 357 1 477 2 541
% Over-border 18% 1% 37% 48% 22%
Public over-border 5% - 20% - -
Private over-border 13% 1% 17% 48% 22%
% Local 82% 99% 63% 52% 78%
Public local 31% 35% 46% 15% 9%
Private local 51% 64% 17% 37% 69%

40
Secured Contracting (Construction and E+C) order book*
Total
Building &
Housing
Civil
Engineering Projects E+C
Total order book – Rm 14 012 * 6 637 3 357 1 477 2 541
% Over-border 18% 1% 37% 48% 22%
Public over-border 5% - 20% - -
Private over-border 13% 1% 17% 48% 22%
% Local 82% 99% 63% 52% 78%
Public local 31% 35% 46% 15% 9%
Private local 51% 64% 17% 37% 69%
1 year order book from 1 Jan14 Rm 10 229 4 357 2 660 1 195 2 017
1 year order book as % of F2013 revenue 110% 135% 82% 70% 172%
Total order book as % of F2013 revenue 150% 205% 104% 86% 217%
Group prospects
* Values include only Group Five’s portion of fully secured construction work
One-year and total order book both at satisfactory levels
against F2013 revenue
41
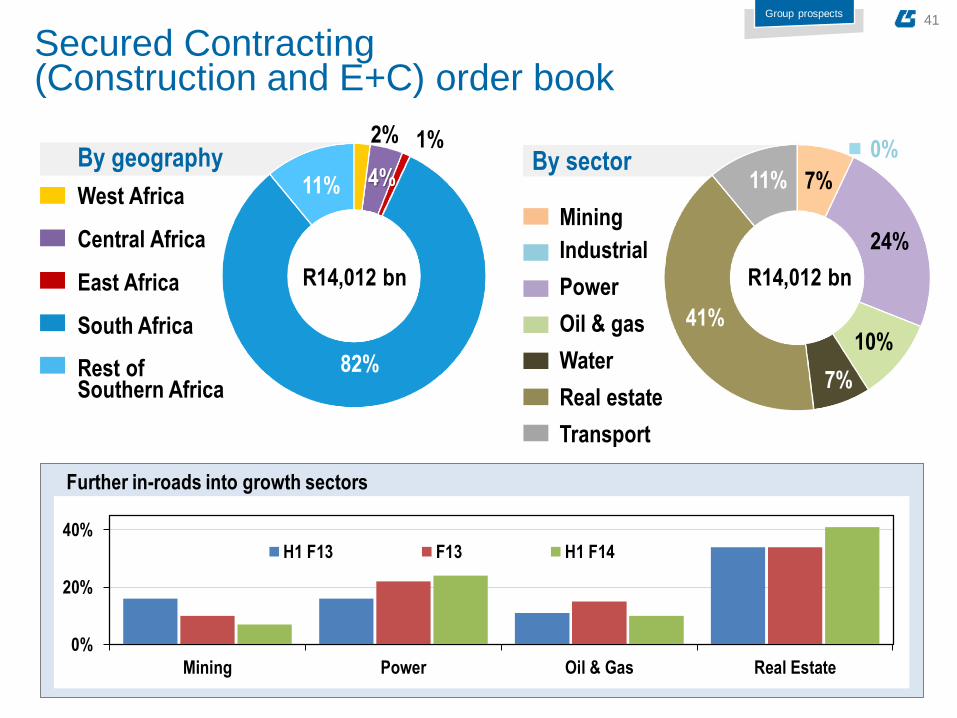
By sector
Mining
Industrial
Power
Oil & gas
Water
Real estate
Transport
2%
4%
1%
82%
11%
R14,012 bn R14,233 bn
Group prospects
Secured Contracting (Construction and E+C) order book
By geography
West Africa
Central Africa
East Africa
South Africa
Rest of Southern Africa
7%
0%
24%
10%
7%
41%
11%
R14,012 bn
Further in-roads into growth sectors
0%
20%
40%
Mining Power Oil & Gas Real Estate
H1 F13 F13 H1 F14
42
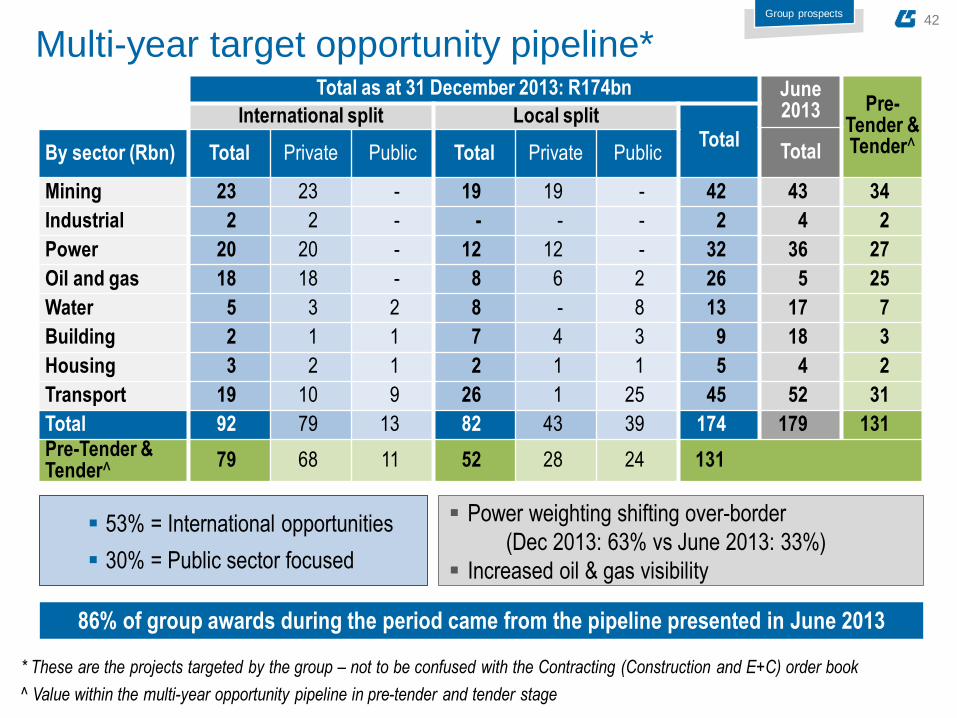
Multi-year target opportunity pipeline* Total as at 31 December 2013: R174bn June
2013 Pre-Tender & Tender^
International split Local split Total
Total By sector (Rbn) Total Private Public Total Private Public
Mining 23 23 - 19 19 - 42 43 34
Industrial 2 2 - - - - 2 4 2
Power 20 20 - 12 12 - 32 36 27
Oil and gas 18 18 - 8 6 2 26 5 25
Water 5 3 2 8 - 8 13 17 7
Building 2 1 1 7 4 3 9 18 3
Housing 3 2 1 2 1 1 5 4 2
Transport 19 10 9 26 1 25 45 52 31
Total 92 79 13 82 43 39 174 179 131
Pre-Tender & Tender^
79 68 11 52 28 24 131
86% of group awards during the period came from the pipeline presented in June 2013
53% = International opportunities
30% = Public sector focused
* These are the projects targeted by the group – not to be confused with the Contracting (Construction and E+C) order book
Group prospects
^ Value within the multi-year opportunity pipeline in pre-tender and tender stage
Power weighting shifting over-border
(Dec 2013: 63% vs June 2013: 33%)
Increased oil & gas visibility

43
Group prospects
04 SECTION 4
Order books
Group outlook
44
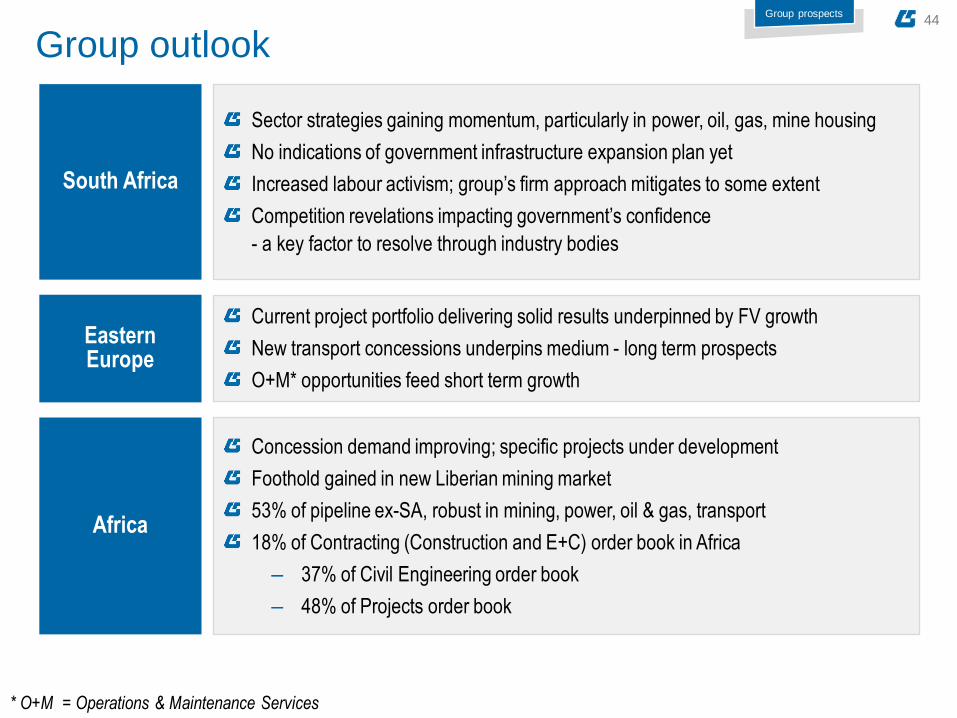
Group outlook
* O+M = Operations & Maintenance Services
Group prospects
South Africa
Sector strategies gaining momentum, particularly in power, oil, gas, mine housing
No indications of government infrastructure expansion plan yet
Increased labour activism; group’s firm approach mitigates to some extent
Competition revelations impacting government’s confidence
- a key factor to resolve through industry bodies
Africa
Concession demand improving; specific projects under development
Foothold gained in new Liberian mining market
53% of pipeline ex-SA, robust in mining, power, oil & gas, transport
18% of Contracting (Construction and E+C) order book in Africa
‒ 37% of Civil Engineering order book
‒ 48% of Projects order book
Eastern Europe
Current project portfolio delivering solid results underpinned by FV growth
New transport concessions underpins medium - long term prospects
O+M* opportunities feed short term growth
45
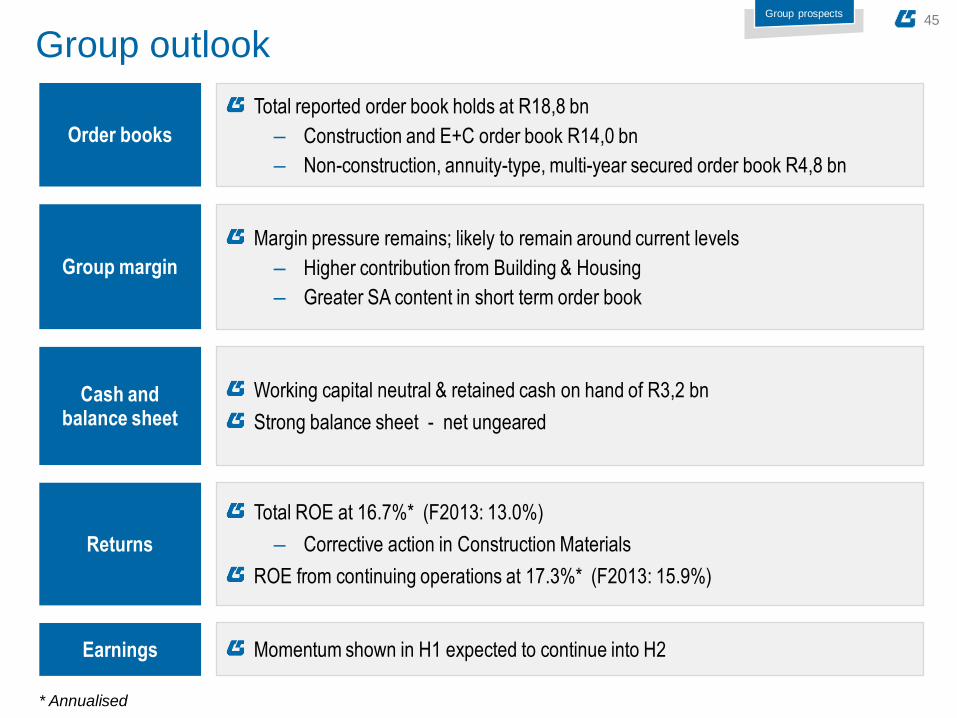
Group outlook
Order books
Total reported order book holds at R18,8 bn
‒ Construction and E+C order book R14,0 bn
‒ Non-construction, annuity-type, multi-year secured order book R4,8 bn
Cash and balance sheet
Working capital neutral & retained cash on hand of R3,2 bn
Strong balance sheet - net ungeared
Earnings Momentum shown in H1 expected to continue into H2
Group prospects
Group margin
Margin pressure remains; likely to remain around current levels
‒ Higher contribution from Building & Housing
‒ Greater SA content in short term order book
Returns
* Annualised
Total ROE at 16.7%* (F2013: 13.0%)
‒ Corrective action in Construction Materials
ROE from continuing operations at 17.3%* (F2013: 15.9%)
46
Questions & answers
47
Forward looking statements
This presentation which sets out the year end results for Group Five Limited for six months ended 31 December 2013 contains ‘forward-
looking statements’, which have not been reviewed or reported on by the Group’s auditors, with respect to the Group’s financial condition,
results of operations and businesses and certain of the Group’s plans and objectives. In particular, such forward looking statements
include statements relating to, amongst others, the Group’s future performance; future capital expenditures, acquisitions, divestitures,
expenses, revenues, financial conditions, dividend policy, and future prospects; business and management strategies relating to the
expansion and growth of the Group; the effects of regulation of the Group’s businesses by governments in the countries in which it
operates; expectations regarding the operating environment and market conditions.
Forward-looking statements are sometimes, but not always, identified by their use of a date in the future or such words as ‘will’,
‘anticipates’, ‘aims’, ‘could’, ‘may’, ‘should’, ‘expects’, ‘believes’, ‘intends’, ‘plans’ or ‘targets’. By their nature, forward-looking statements
are inherently predictive, speculative and involve risk and uncertainty because they relate to events and depend on circumstances that will
occur in the future, involve known and unknown risks, uncertainties and other facts or factors which may cause the actual results,
performance or achievements of the Group, or its industry to be materially different from any results, performance or achievement
expressed or implied by such forward-looking statements.
Forward-looking statements are not guarantees of future performance and are based on assumptions regarding the Group’s present and
future business strategies and the environments in which it operates now and in the future. Undue reliance should not be placed on such
statements and opinions because by nature, they are subjective to known and unknown risk and uncertainties and can be affected by
other factors that could cause actual results and Group plans and objectives to differ materially from those expressed or implied in the
forward looking statements. Neither the Group nor any of its respective affiliates, advisors or representatives shall have any liability
whatsoever (based on negligence or otherwise) for any loss howsoever arising from any use of this presentation or its contents or
otherwise arising in connection with this presentation and do not undertake to publicly update or revise any of its opinions or forward
looking statements whether to reflect new information or future events or circumstances otherwise.

48
For more information please contact:
Chief Financial Officer
Telephone: +2710 060 1555
Email: [email protected]
Mike Upton
Chief Executive Officer
Telephone: +2710 060 1555
Email: [email protected]
Cristina Teixeira
Our website: www.groupfive.co.za