Unaudited financial statements of Zagrebačka banka … · Unaudited financial statements of...
13
Unaudited financial statements of Zagrebačka banka Group for the period from 1 January 2017 to 30 June 2017 Content: 1. Management report for the period from 1 January 2017 to 30 June 2017 2. Statement of the persons responsible for the preparation of the financial statements 3. Financial statements (TFI-KI statements) 3.1. Balance sheet as at 30 June 2017 3.2. Income statement for the period from 1 January 2017 to 30 June 2017 3.3. Cash flow statement for the period from 1 January 2017 to 30 June 2017 3.4. Statement of changes in equity for the period from 31 December 2016 to 30 June 2017 3.5. Notes to the financial statements
Transcript of Unaudited financial statements of Zagrebačka banka … · Unaudited financial statements of...

Unaudited financial statements of Zagrebačka banka Group
for the period from 1 January 2017 to 30 June 2017 Content: 1. Management report for the period from 1 January 2017 to 30 June 2017 2. Statement of the persons responsible for the preparation of the financial statements 3. Financial statements (TFI-KI statements)
3.1. Balance sheet as at 30 June 2017 3.2. Income statement for the period from 1 January 2017 to 30 June 2017 3.3. Cash flow statement for the period from 1 January 2017 to 30 June 2017 3.4. Statement of changes in equity for the period from 31 December 2016 to 30 June 2017 3.5. Notes to the financial statements

Management report for the period from 1 January to 30 June 2017
Zagrebačka banka Group recorded operating result of HRK 1,312 million in the first half of 2017. The profit after tax is HRK 365 million, impacted by the increase in impairment losses on placements to companies. The total volume of loans decreased due to the sale of a part of the non-performing portfolio. The Group realised positive operating result in all its members, the major contributors were Zagrebačka banka d.d., UniCredit Bank d.d. Mostar, UniCredit Leasing Croatia d.o.o. and Prva stambena štedionica d.d. In the upcoming period the Group will be focused on stimulating loan activity, transformation of business aiming at the introduction of new products and services based on digital technologies, as well as on further increase in efficiency.
Key performance indicators in the first half of 2017:
Zagrebačka banka Group operating income totals HRK 2,605 million (-4.6%)
Total operating expenses amount to HRK 1,293 million (+2.3%)
Profit before impairment and other provisions amounts to HRK 1,312 million (-10.6%)
Impairment and other provisions amount to HRK 903 million
Net loans to customers amount to HRK 80,254 million
Deposits from customers amount to HRK 89,035 million

Management report for the period from 1 January to 30 June 2017 (continued)
Operating income amounted to HRK 2,605 million, decreased by HRK 127 million (-4.6%):
Net interest income amounted to HRK 1,743 million, the increase of HRK 10 million (+0.6%) is a result of stable average volume of loans during the period and lower funding costs.
Net fee and commission income amounted to HRK 664 million which is HRK 57 million (+9.4%) higher, due to the increase in payment transaction fees, credit card fees and fees from asset management, brokerage and consulting services.
Net trading and other income amounted to HRK 198 million, decreased by HRK 194 million (-49.5%). The prior year result has been positively impacted by the net gain from sale of share of Visa Europe Limited to Visa Inc.
Operating expenses amounted to HRK 1,293 million and increased by HRK 29 million (+2.3%). The Group’s cost to income ratio (“C/I ratio”) has remained good and equals 49.6%.
Profit before impairment and other provisions amounted to HRK 1,312 million, lower by HRK 156 million (-10.6%), as a result of the previously described movements in Operating income and Operating expenses.
Impairment and other provisions amounted to HRK 903 million, they have increased by HRK 560 million, mainly due to the increase in impairment losses on placements to companies.
Total assets of the Group amounted to HRK 123,429 million and have decreased by HRK 4,899 million (-3.8%), mainly under the influence of optimisation of funding sources.
Net loans to customers amounted to HRK 80,254 million, decreased by HRK 492 million (-0.6%). The total volume of loans decreased due to the sale of part of non-performing portfolio.
Deposits from customers represent primary source of funding. At the end of the period they
amounted to HRK 89,035 million and have decreased by HRK 3,193 million (-3.5%). Loans to deposits ratio amounts to 90.1%.
Deposits from banks and borrowings amounted to HRK 12,148 million. The decrease of HRK
716 million (-5.6%) is a result of lower funding needs. Capital and reserves of the Group - at HRK 17,293 million.

Financial results for the period from 1 January to 30 June 2017
Zagrebačka banka Group Balance Sheet (HRK mln)
Δ 2017 vs. 2016
31 Dec 2016 30 Jun 2017 % HRK mln
1 2 3 (4/1) 4 (2-1)
Cash and deposits with the CNB 15,164 16,725 10.3% 1,561
Loans to and receivables from banks 16,116 10,335 (35.9%) (5,781)
Securities 9,802 10,124 3.3% 322
Net loans to customers 80,746 80,254 (0.6%) (492)
Tangible and intangible assets 2,392 2,771 15.8% 379
Other assets 4,108 3,220 (21.6%) (888)
Total assets 128,328 123,429 (3.8%) (4,899)
Deposits from customers 92,228 89,035 (3.5%) (3,193)
Deposits from banks and borrowings 12,864 12,148 (5.6%) (716)
Other liabilities 4,542 4,953 9.0% 411
Capital and reserves 18,694 17,293 (7.5%) (1.401)
Total liabilities and equity 128,328 123,429 (3.8%) (4.899)
Equity attributable to equity holders of the Bank 128,306 123,407 (3.8%) (4.899)
Equity attributable to non-controlling interests 22 22 - -
Zagreb, 28 July 2017
Chairman of the Management Board
Miljenko Živaljić
Zagrebačka banka Group Income Statement (HRK mln)
Δ 2017 vs. 2016
2016 2017 % HRK mln
1 2 3 (4/1) 4 (2-1)
Interest income 3,091 2,796 (9.5%) (295)
Interest expense (1,358) (1,053) (22.5%) 305
Net interest income 1,733 1,743 0.6% 10
Fee and commission income 675 740 9.6% 65
Fee and commission expense (68) (76) 11.8% (8)
Net fee and commission income 607 664 9.4% 57
Net trading and other income 392 198 (49.5%) (194)
Operating income 2,732 2,605 (4.6%) (127)
Operating expenses (1,264) (1,293) 2.3% (29)
Profit before impairment and other provisions
1,468 1,312 (10.6%) (156)
Impairment and other provisions (343) (903) 163.3% (560)
Profit from operations 1,125 409 (63.6%) (716)
Share of profit from associates 20 21 5.0% 1
Profit before tax 1,145 430 (62.4%) (715)
Income tax (214) (65) (69.6%) 149
Net profit 931 365 (60.8%) (566)
Attributable to equity holders of the Bank 930 364 (60.9%) (566)
Attributable to non-controlling interests 1 1 - -
Net profit 931 365 (60.8%) (566)

Statement of the persons responsible for the preparation of financial statements
Pursuant to the provisions of the Capital Market Act, to the best of our knowledge:
1. the set of summary financial statements of Zagrebačka banka Group prepared in accordance with the applicable standards for financial reporting for banks in the Republic of Croatia gives a true and complete view of the assets and liabilities, profit and loss, the financial position and business operations of Zagrebačka banka Group;
2. the Management Report gives a true view of business developments, operating results and the position of Zagrebačka banka Group
Head of Accounting and Member of the Management Board
Regulatory Reporting Lorenzo Ramajola
Marijana Brcko
Additional info: Public Relations Tel: 00385(1) 6104153 e-mail: [email protected] www.zaba.hr

1.1.2017 to 30.6.2017
133
21 Number of employees: 5557
(as at the quarter-end)
YES 6419
Subsidiaries and associates of the Bank which are included in Zagrebačka banka Group are shown in Note 4:
(only name and surname of contact person is included)
Telefax:
Documentation to be published:
and notes to financial statements)
2. Interim Management report
M.P.
E-mail address:
Surname and name: Živaljić Miljenko
Contact person:
Ivana Lučića 2a, 10000 Zagreb 02638541
Allianz ZB d.o.o., Zagreb Nike Grškovića 31, 10000 Zagreb 01581864
Jurič Ana
(person representing the company)
Accounting:
Allianz ZB d.o.o., Zagreb Ivana Lučića 2a, 10000 Zagreb 01637886
UniCreditLeasing d.o.o. Ložionička 7, 71000 Sarajevo 79535370
UniCredit Broker d.o.o. Obala Kulina bana 15, 71000 Sarajevo 79535362
Multiplus card d.o.o., Zagreb
(signature of the President of the Management Board)
Phone: 01/ 4801-663
3. Statement of persons responsible for preparation of financial reports
1. Financial reports (balance, income statement, cash flow statement, statement on changes in equity
UniCredit Leasing Croatia d.o.o. Heinzelova 33, 10000 Zagreb 01329162
Zane BH d.o.o. Branilaca Sarajeva 20, 71000 Sarajevo 79524093
04089014
01598465
UniCredit Partner d.o.o. Damira Tomljanovića Gavrana 17, 10000 Zagreb
Pominvest d.d. Gundulićeva 26a, 21000 Split 03891984
Zagreb nekretnine d.o.o. Nova Ves 17, 10000 Zagreb 03709124
ZB Invest d.o.o. Ivana Lučića 2a, 10000 Zagreb 01500937
Centar Kaptol d.o.o. Nova Ves 17, 10000 Zagreb 01149440
Companies included in consolidation (according to IFRS): Headquarters: MB:
Prva stambena štedionica d.d. Savska 62, 10000 Zagreb 01391178
Code and name of municipality/city: Zagreb
Code and name of county: Grad Zagreb
Consolidated report: Code in NKD:
Street and number: Trg bana Josipa Jelačića 10
E-mail address: [email protected]
Internet address: www.zaba.hr
Personal identification number
(OIB):
92963223473
Issuer company: Zagrebačka banka d.d.
Post office number and city: 10000 Zagreb
Appendix 3.Reporting period:
Quarterly financial report for credit institutions-TFI-KI
Identification number (MB): 03234495
Subjects identification number 080000014
01972669
ALLIB NEKRETNINE d.o.o. Damira Tomljanovića Gavrana 17, 10000 Zagreb 01569465
Damira Tomljanovića Gavrana 17, 10000 ZagrebLocat Croatia d.o.o.
UniCredit Bank d.d. Kardinala Stepinca bb, 88000 Mostar 07700822
BACAL ALPHA d.o.o. Damira Tomljanovića Gavrana 17, 10000 Zagreb 02001365
ZABA Partner d.o.o. Augusta Cesarca 2, 10000 Zagreb
AOP
codePrevious period Current period
2 3 4
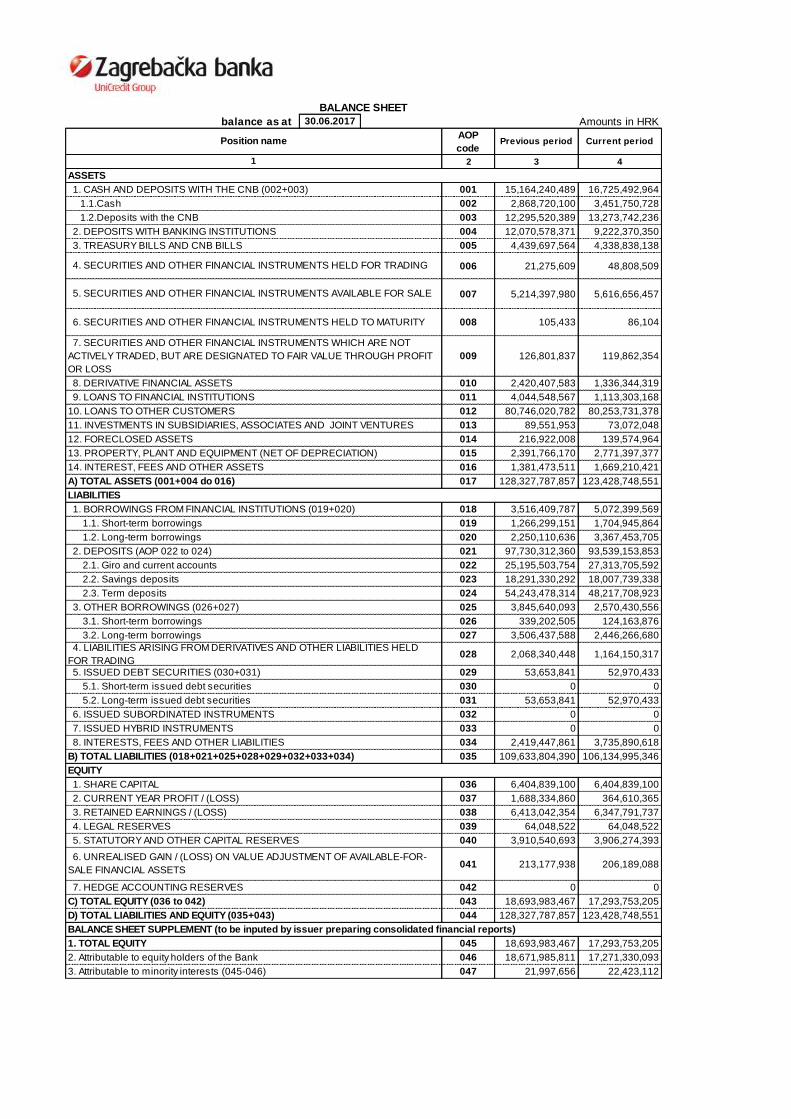
001 15,164,240,489 16,725,492,964
002 2,868,720,100 3,451,750,728
003 12,295,520,389 13,273,742,236
004 12,070,578,371 9,222,370,350
005 4,439,697,564 4,338,838,138
006 21,275,609 48,808,509
007 5,214,397,980 5,616,656,457
008 105,433 86,104
009 126,801,837 119,862,354
010 2,420,407,583 1,336,344,319
011 4,044,548,567 1,113,303,168
012 80,746,020,782 80,253,731,378
013 89,551,953 73,072,048
014 216,922,008 139,574,964
015 2,391,766,170 2,771,397,377
016 1,381,473,511 1,669,210,421
017 128,327,787,857 123,428,748,551
018 3,516,409,787 5,072,399,569
019 1,266,299,151 1,704,945,864
020 2,250,110,636 3,367,453,705
021 97,730,312,360 93,539,153,853
022 25,195,503,754 27,313,705,592
023 18,291,330,292 18,007,739,338
024 54,243,478,314 48,217,708,923
025 3,845,640,093 2,570,430,556
026 339,202,505 124,163,876
027 3,506,437,588 2,446,266,680
028 2,068,340,448 1,164,150,317
029 53,653,841 52,970,433
030 0 0
031 53,653,841 52,970,433
032 0 0
033 0 0
034 2,419,447,861 3,735,890,618
035 109,633,804,390 106,134,995,346
036 6,404,839,100 6,404,839,100
037 1,688,334,860 364,610,365
038 6,413,042,354 6,347,791,737
039 64,048,522 64,048,522
040 3,910,540,693 3,906,274,393
041 213,177,938 206,189,088
042 0 0
043 18,693,983,467 17,293,753,205
044 128,327,787,857 123,428,748,551
045 18,693,983,467 17,293,753,205
046 18,671,985,811 17,271,330,093
047 21,997,656 22,423,112
3. TREASURY BILLS AND CNB BILLS
13. PROPERTY, PLANT AND EQUIPMENT (NET OF DEPRECIATION)
5. SECURITIES AND OTHER FINANCIAL INSTRUMENTS AVAILABLE FOR SALE
A) TOTAL ASSETS (001+004 do 016)
8. DERIVATIVE FINANCIAL ASSETS
Amounts in HRK
ASSETS
1. CASH AND DEPOSITS WITH THE CNB (002+003)
1.1.Cash
1.2.Deposits with the CNB
2. DEPOSITS WITH BANKING INSTITUTIONS
3. RETAINED EARNINGS / (LOSS)
4. SECURITIES AND OTHER FINANCIAL INSTRUMENTS HELD FOR TRADING
1.1. Short-term borrowings
6. SECURITIES AND OTHER FINANCIAL INSTRUMENTS HELD TO MATURITY
7. SECURITIES AND OTHER FINANCIAL INSTRUMENTS WHICH ARE NOT
ACTIVELY TRADED, BUT ARE DESIGNATED TO FAIR VALUE THROUGH PROFIT
OR LOSS
2. DEPOSITS (AOP 022 to 024)
9. LOANS TO FINANCIAL INSTITUTIONS
10. LOANS TO OTHER CUSTOMERS
11. INVESTMENTS IN SUBSIDIARIES, ASSOCIATES AND JOINT VENTURES
4. LEGAL RESERVES
LIABILITIES
2. Attributable to equity holders of the Bank
5. STATUTORY AND OTHER CAPITAL RESERVES
6. UNREALISED GAIN / (LOSS) ON VALUE ADJUSTMENT OF AVAILABLE-FOR-
SALE FINANCIAL ASSETS
B) TOTAL LIABILITIES (018+021+025+028+029+032+033+034)
EQUITY
2. CURRENT YEAR PROFIT / (LOSS)
1.2. Long-term borrowings
1. BORROWINGS FROM FINANCIAL INSTITUTIONS (019+020)
2.1. Giro and current accounts
2.2. Savings deposits
2.3. Term deposits
3. OTHER BORROWINGS (026+027)
5.1. Short-term issued debt securities
3.2. Long-term borrowings
3.1. Short-term borrowings
3. Attributable to minority interests (045-046)
Position name
1
7. HEDGE ACCOUNTING RESERVES
C) TOTAL EQUITY (036 to 042)
D) TOTAL LIABILITIES AND EQUITY (035+043)
BALANCE SHEET SUPPLEMENT (to be inputed by issuer preparing consolidated financial reports)
1. SHARE CAPITAL
5. ISSUED DEBT SECURITIES (030+031)
1. TOTAL EQUITY
BALANCE SHEET
balance as at 30.06.2017
8. INTERESTS, FEES AND OTHER LIABILITIES
5.2. Long-term issued debt securities
6. ISSUED SUBORDINATED INSTRUMENTS
7. ISSUED HYBRID INSTRUMENTS
4. LIABILITIES ARISING FROM DERIVATIVES AND OTHER LIABILITIES HELD
FOR TRADING
12. FORECLOSED ASSETS
14. INTEREST, FEES AND OTHER ASSETS

to Amounts in HRK
AOP
code
Cumulated Quarterly Cumulated Quarterly
2 3 4 5 6
048 3,090,075,586 1,541,703,844 2,796,410,982 1,349,932,404
049 1,357,576,096 668,247,888 1,053,328,136 476,640,797
050 1,732,499,490 873,455,956 1,743,082,846 873,291,607
051 675,085,699 354,061,583 739,761,211 385,464,116
052 67,818,760 36,871,212 75,842,418 44,005,541
053 607,266,939 317,190,371 663,918,793 341,458,575
054 20,228,128 10,672,470 20,664,335 11,080,722
055 -20,434,626 -10,176,857 -144,350,201 -72,526,401
056 0 0 0 0
057 -2,768,848 531,591 -1,899,092 -3,224,389
058 148,131,551 144,570,225 7,275,531 6,084,364
059 0 0 0 0
060 0 0 0 0
061 0 0 0 0
062 10,684,932 10,684,932 10,964,019 10,889,017
063 103,101,420 72,774,627 130,039,841 77,599,628
064 153,060,592 90,886,297 196,596,890 111,942,830
065 173,748,571 69,437,805 180,851,185 65,112,595
066 1,089,684,341 554,458,091 1,112,264,458 556,201,229
067 1,488,336,666 886,693,716 1,333,177,319 735,282,129
068 343,686,772 282,795,381 903,421,359 113,316,115
069 1,144,649,894 603,898,335 429,755,960 621,966,014
070 213,537,053 112,806,104 65,145,596 104,559,799
071 931,112,841 491,092,231 364,610,364 517,406,215
072 5 5 2 2
073 931,112,841 491,092,231 364,610,364 517,406,215
074 929,996,757 490,516,472 363,520,112 516,930,711
075 1,116,084 575,759 1,090,253 475,505
Previous period
1
1. Interest income
2. Interest expense
for the period 01.01.2017 30.06.2017
Position name
3. Net interest income (048-049)
4. Fee and commission income
5. Fee and commission expense
6. Net income from commissions and fees (051-052)
7. Gains / losses from investment in subsidiaries, associates and joint ventures
8. Gains / losses from trading activities
9. Gains / losses from embedded derivatives
10. Gains / losses from assets which are not actively traded, but are designated at fair
11. Gains / losses from activities related to available-for-sale financial assets
12. Gains / losses from activities related to held-to-maturity investments
13. Gains / losses from hedging transactions
14. Income from investments in subsidiaries, associates and joint ventures
1. PROFIT / LOSS FOR THE PERIOD
15. Income from other equity investments
16. Gains / losses from foreign exchange differences
17. Other income
18. Other expenses
19. General administrative expenses and depreciation
20. Net income from operations before impairment and other provisions
INCOME STATEMENT
Current period
2. Attributable to equity holders of the Bank
3. Attributable to minority interests (073-074)
INCOME STATEMENT SUPPLEMENT (to be inputed by issuer preparing consolidated financial statements)
21. Impairment losses and other provisions
22. PROFIT / LOSS BEFORE TAX (067-068)
23. INCOME TAX EXPENSE
24. PROFIT / LOSS FOR THE PERIOD (069-070)
25. Earnings per share

to
Share capital Treasury shares
Legal,
statutory,
capital
and other
reserves
Retained
earnings/
loss
Profit/loss
for the
year
Unrealised
gain/loss
from
revaluation
on AFS
financial
assets
2 3 4 5 6 7 8 9 10
001 6,404,839,100 0 3,974,589,215 6,393,255,283 1,686,124,275 213,177,938 21,997,656 18,693,983,467
002 0 0 0 0 0 0 0 0
003 6,404,839,100 0 3,974,589,215 6,393,255,283 1,686,124,275 213,177,938 21,997,656 18,693,983,467
004 0 0 0 0 0 -7,320,033 0 -7,320,033
005 0 0 0 0 0 -1,547,016 21,988 -1,525,028
006 0 0 0 0 0 1,871,330 0 1,871,330
007 0 0 -1,234 -55,645,904 0 6,869 -391,217 -56,031,486
008 0 0 -1,234 -55,645,904 0 -6,988,850 -369,229 -63,005,217
009 0 0 0 0 363,520,112 0 1,090,253 364,610,365
010 0 0 -1,234 -55,645,904 363,520,112 -6,988,850 721,024 301,605,148
011 0 0 0 0 0 0 0 0
012 0 0 -1,018,425 0 0 0 0 -1,018,425
013 0 0 -3,246,641 0 0 0 0 -3,246,641
014 0 0 0 1,686,124,275 -1,686,124,275 0 0 0
015 0 0 0 -1,697,274,775 0 0 -295,569 -1,697,570,344
016 0 0 0 -11,150,500 -1,686,124,275 0 -295,569 -1,697,570,344
017 6,404,839,100 0 3,970,322,915 6,326,458,879 363,520,112 206,189,088 22,423,111 17,293,753,205
Total
1
Balance as at 1 January of the current period
Position nameAOP
code
Attributable to shareholders of the Bank
Changes in accounting policies and errors
Restated balance as at 1 January of the current period
(001+002)
Disposal of available-for-sale f inancial assets
Increase / decrease of share capital
Changes in fair value of available-for-sale f inancial assets
Minority
interests
Other movements
Deferred tax on movements in fair value reserve of available-for-sale
f inancial assets
Other gains/losses recognised directly in equity
Net gains/losses recognised directly
in equity (004+005+006+007)
Profit / loss for the period
Total recognised income and expense for the current period
(008+009)
Acquisition / disposal of treasury shares
Amounts in HRK
Banks w hich prepare consolidated annual f inancial statements separately disclose changes in minority interests in the relevant sections of equity.
STATEMENT OF CHANGES IN EQUITY31.12.2016. 30.06.2017 in the period from
Transfer to reserves
Dividends payouts
Distribution of profit (014+015)
Balance as at 31 December of the current period
(003+010+011+012+013+016)
to
AOP code Previous period Current period
2 3 4
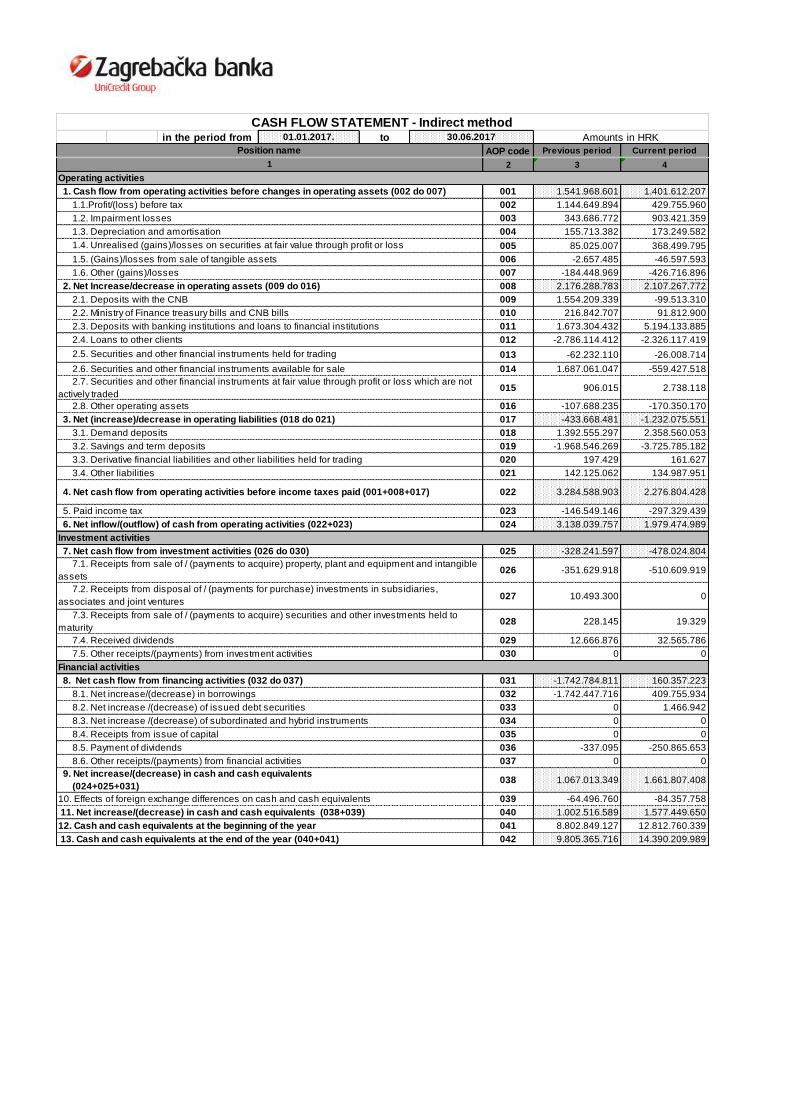
001 1.541.968.601 1.401.612.207
002 1.144.649.894 429.755.960
003 343.686.772 903.421.359
004 155.713.382 173.249.582
005 85.025.007 368.499.795
006 -2.657.485 -46.597.593
007 -184.448.969 -426.716.896
008 2.176.288.783 2.107.267.772
009 1.554.209.339 -99.513.310
010 216.842.707 91.812.900
011 1.673.304.432 5.194.133.885
012 -2.786.114.412 -2.326.117.419
013 -62.232.110 -26.008.714
014 1.687.061.047 -559.427.518
015 906.015 2.738.118
016 -107.688.235 -170.350.170
017 -433.668.481 -1.232.075.551
018 1.392.555.297 2.358.560.053
019 -1.968.546.269 -3.725.785.182
020 197.429 161.627
021 142.125.062 134.987.951
022 3.284.588.903 2.276.804.428
023 -146.549.146 -297.329.439
024 3.138.039.757 1.979.474.989
025 -328.241.597 -478.024.804
026 -351.629.918 -510.609.919
027 10.493.300 0
028 228.145 19.329
029 12.666.876 32.565.786
030 0 0
031 -1.742.784.811 160.357.223
032 -1.742.447.716 409.755.934
033 0 1.466.942
034 0 0
035 0 0
036 -337.095 -250.865.653
037 0 0
038 1.067.013.349 1.661.807.408
039 -64.496.760 -84.357.758
040 1.002.516.589 1.577.449.650
041 8.802.849.127 12.812.760.339
042 9.805.365.716 14.390.209.989
CASH FLOW STATEMENT - Indirect methodin the period from 01.01.2017. 30.06.2017 Amounts in HRK
Position name
1
Operating activities
1. Cash flow from operating activities before changes in operating assets (002 do 007)
1.1.Profit/(loss) before tax
1.2. Impairment losses
1.3. Depreciation and amortisation
1.4. Unrealised (gains)/losses on securities at fair value through profit or loss
1.5. (Gains)/losses from sale of tangible assets
1.6. Other (gains)/losses
2. Net Increase/decrease in operating assets (009 do 016)
2.1. Deposits with the CNB
2.2. Ministry of Finance treasury bills and CNB bills
2.3. Deposits with banking institutions and loans to financial institutions
2.4. Loans to other clients
2.5. Securities and other financial instruments held for trading
2.6. Securities and other financial instruments available for sale
2.7. Securities and other financial instruments at fair value through profit or loss which are not
actively traded
2.8. Other operating assets
3. Net (increase)/decrease in operating liabilities (018 do 021)
3.1. Demand deposits
3.2. Savings and term deposits
3.3. Derivative financial liabilities and other liabilities held for trading
3.4. Other liabilities
4. Net cash flow from operating activities before income taxes paid (001+008+017)
5. Paid income tax
6. Net inflow/(outflow) of cash from operating activities (022+023)
Investment activities
7. Net cash flow from investment activities (026 do 030)
7.1. Receipts from sale of / (payments to acquire) property, plant and equipment and intangible
assets
7.2. Receipts from disposal of / (payments for purchase) investments in subsidiaries,
associates and joint ventures
7.3. Receipts from sale of / (payments to acquire) securities and other investments held to
maturity
7.4. Received dividends
7.5. Other receipts/(payments) from investment activities
Financial activities
8. Net cash flow from financing activities (032 do 037)
8.1. Net increase/(decrease) in borrowings
10. Effects of foreign exchange differences on cash and cash equivalents
11. Net increase/(decrease) in cash and cash equivalents (038+039)
12. Cash and cash equivalents at the beginning of the year
13. Cash and cash equivalents at the end of the year (040+041)
8.2. Net increase /(decrease) of issued debt securities
8.3. Net increase /(decrease) of subordinated and hybrid instruments
8.4. Receipts from issue of capital
8.5. Payment of dividends
8.6. Other receipts/(payments) from financial activities
9. Net increase/(decrease) in cash and cash equivalents
(024+025+031)

NOTES TO THE FINANCIAL STATEMENTS
in HRK
Net liquid assets 31.12.2016. 30.6.2017
Cash 2,868,720,100 3,451,750,728
Deposits w ith the CNB 12,295,520,389 13,273,742,236
Deposits w ith banking institutions 12,070,578,371 9,222,370,350
Treasury bills and CNB bills 4,439,697,564 4,338,838,138
Securities and other f inancial instruments held for trading 21,275,609 48,808,509
Secutiries and other f inancial instruments available for sale 5,214,397,980 5,616,656,457
Securities and other f inancial instruments w hich are not actively
traded, but are designated to fair value in income statement 126,801,837 119,862,354
37,036,991,850 36,072,028,772
Loans to and receivables from customers 31.12.2016. 30.6.2017
Companies and similar organisations and government 54,656,455,841 53,158,842,182
Individuals and unincorporated businesses 35,992,652,625 34,843,400,600
Total gross loans 90,649,108,465 88,002,242,782
Companies and similar organisations and government (7,123,667,755) (6,067,371,604)
Individuals and unincorporated businesses (2,779,419,928) (1,681,139,800)
Impairment allowance (9,903,087,683) (7,748,511,404)
80,746,020,782 80,253,731,378
Deposits and borrowings 31.12.2016. 30.6.2017
Companies and similar organisations and government 31,715,293,702 29,575,045,026
Individuals and unincorporated businesses 60,512,513,791 59,460,106,815
Banks and other f inancial institutions 12,864,554,746 12,146,832,132
105,092,362,240 101,181,983,973

Fully consolidated subsidiaries:
Company GroupGroup
ownership in %
UniCredit Bank d.d., Mostar Banking 99.3
Prva stambena štedionica d.d. Banking 100.0
ZB Invest d.o.o. Fund management 100.0
Centar Kaptol d.o.o. Property investment 100.0
Pominvest d.d.
Property
management 88.7
Zagreb nekretnine d.o.o. Real estate agency 100.0
Zane BH d.o.o. Real estate agency 100.0
UniCredit Leasing Croatia d.o.o. Leasing 100.0
Locat Croatia d.o.o.
Real estate
business 100.0
UniCredit Partner d.o.o. Trading activities 80.0
ALLIB NEKRETNINE d.o.o.
Real estate
business 100.0
BACAL ALPHA d.o.o.
Real estate
business 100.0
ZABA Partner d.o.o. Insurance brokerage 100.0
UniCreditLeasing d.o.o., Sarajevo Leasing 99.3
Equity accounted associated companies:
Company GroupGroup
ownership in %
Allianz ZB d.o.o., Zagreb
Obligatory pension
fund management 49.0
Allianz ZB d.o.o., Zagreb
Voluntary pension
fund management 49.0
Multiplus card d.o.o., Zagreb
Advertising and
marketing services 25.0
UniCredit Broker d.o.o. Sarajevo brokersko društvo u osiguranju Insurance brokerage 48.7
Change in scope of consolidation
In June 2016 Locat Croatia d.o.o. disposed its 100% stake in the subsidiary Bacal Beta Nekretnine d.o.o.
In January 2017 a full legal merger w as completed w hereby the company Suvremene poslovne komunikacije
d.o.o. (100% ow ned by Zagrebačka banka d.d.) w as merged to Zagreb Nekretnine d.o.o. (also 100%
ow ned by Zagrebačka banka d.d.)
List of subsidiaries and associatesZagrebačka banka d.d. is a licensed bank operating in Croatia and the holding company for the Zagrebačka
banka Group. The Bank's subsidiaries and associated companies are presented below :
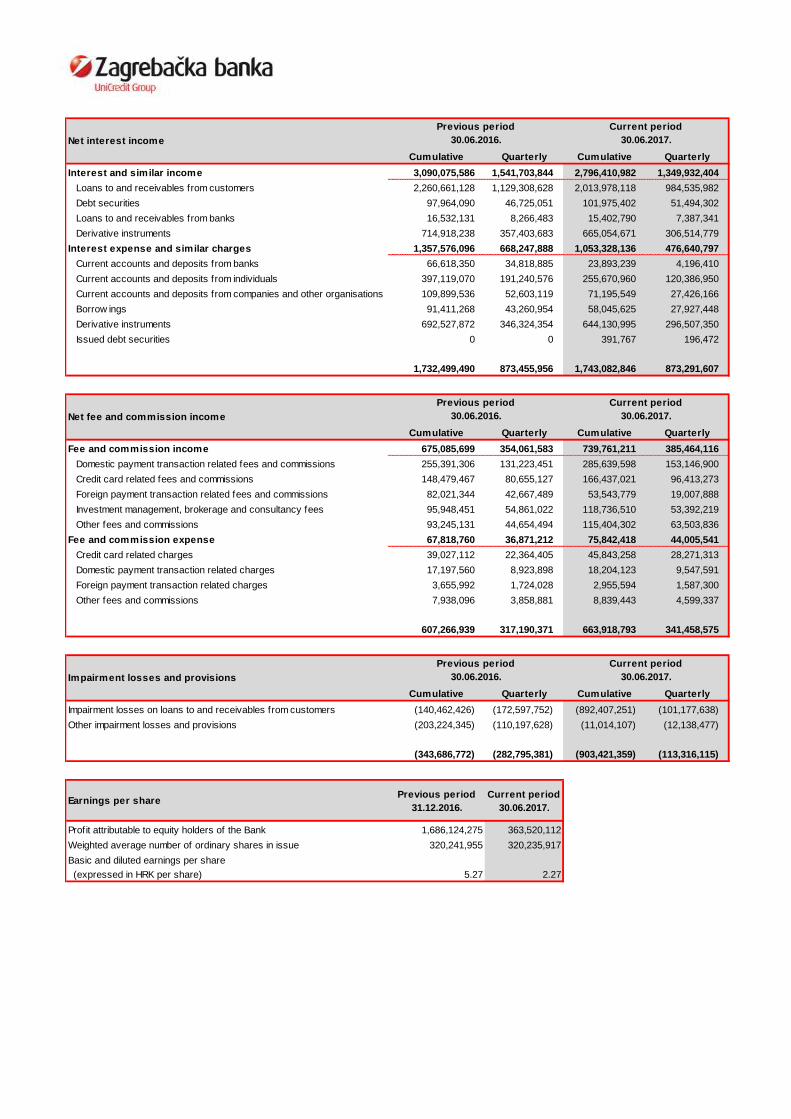
Cumulative Quarterly Cumulative Quarterly
Interest and similar income 3,090,075,586 1,541,703,844 2,796,410,982 1,349,932,404
Loans to and receivables from customers 2,260,661,128 1,129,308,628 2,013,978,118 984,535,982
Debt securities 97,964,090 46,725,051 101,975,402 51,494,302
Loans to and receivables from banks 16,532,131 8,266,483 15,402,790 7,387,341
Derivative instruments 714,918,238 357,403,683 665,054,671 306,514,779
Interest expense and similar charges 1,357,576,096 668,247,888 1,053,328,136 476,640,797
Current accounts and deposits from banks 66,618,350 34,818,885 23,893,239 4,196,410
Current accounts and deposits from individuals 397,119,070 191,240,576 255,670,960 120,386,950
Current accounts and deposits from companies and other organisations 109,899,536 52,603,119 71,195,549 27,426,166
Borrow ings 91,411,268 43,260,954 58,045,625 27,927,448
Derivative instruments 692,527,872 346,324,354 644,130,995 296,507,350
Issued debt securities 0 0 391,767 196,472
1,732,499,490 873,455,956 1,743,082,846 873,291,607
Cumulative Quarterly Cumulative Quarterly
Fee and commission income 675,085,699 354,061,583 739,761,211 385,464,116
Domestic payment transaction related fees and commissions 255,391,306 131,223,451 285,639,598 153,146,900
Credit card related fees and commissions 148,479,467 80,655,127 166,437,021 96,413,273
Foreign payment transaction related fees and commissions 82,021,344 42,667,489 53,543,779 19,007,888
Investment management, brokerage and consultancy fees 95,948,451 54,861,022 118,736,510 53,392,219
Other fees and commissions 93,245,131 44,654,494 115,404,302 63,503,836
Fee and commission expense 67,818,760 36,871,212 75,842,418 44,005,541
Credit card related charges 39,027,112 22,364,405 45,843,258 28,271,313
Domestic payment transaction related charges 17,197,560 8,923,898 18,204,123 9,547,591
Foreign payment transaction related charges 3,655,992 1,724,028 2,955,594 1,587,300
Other fees and commissions 7,938,096 3,858,881 8,839,443 4,599,337
607,266,939 317,190,371 663,918,793 341,458,575
Cumulative Quarterly Cumulative Quarterly
Impairment losses on loans to and receivables from customers (140,462,426) (172,597,752) (892,407,251) (101,177,638)
Other impairment losses and provisions (203,224,345) (110,197,628) (11,014,107) (12,138,477)
(343,686,772) (282,795,381) (903,421,359) (113,316,115)
Earnings per sharePrevious period
31.12.2016.
Current period
30.06.2017.
Profit attributable to equity holders of the Bank 1,686,124,275 363,520,112
Weighted average number of ordinary shares in issue 320,241,955 320,235,917
Basic and diluted earnings per share
(expressed in HRK per share) 5.27 2.27
Impairment losses and provisions
Previous period
30.06.2016.
Current period
30.06.2017.
Net interest income
Previous period
30.06.2016.
Current period
30.06.2017.
Net fee and commission income
Previous period
30.06.2016.
Current period
30.06.2017.