Unaudited Consolidated Financial Statements
46
1 Gorenje Group and the parent company Gorenje, d.d., prepared pursuant to International Financial Reporting Standards (IFRSs) Management Board of Gorenje, d.d.,Velenje Velenje, May 2017 Unaudited Consolidated Financial Statements January-March 2017
Transcript of Unaudited Consolidated Financial Statements

1
Gorenje Group and the parent company Gorenje,
d.d., prepared pursuant to International Financial
Reporting Standards (IFRSs)
Management Board of Gorenje, d.d.,Velenje
Velenje, May 2017
Unaudited Consolidated Financial Statements
January-March 2017
2
Table of Contents
PERFORMANCE HIGHLIGHTS OF THE GORENJE GROUP 3 CORE FINANCIAL INDICATORS FOR Q1 2017 3
MANAGEMENT REPORT 5 OPERATING PERFORMANCE OF THE GORENJE GROUP 5
SALES 6 DEVELOPMENT AND NEW PRODUCTS 7 MARKETS OF THE CORE ACTIVITY HOME 7 SALES BY GORENJE GROUP'S ACTIVITIES 8 PROFITABILITY OF THE GORENJE GROUP 9 COST MANAGEMENT 9 OPERATING RESULT OF THE REPORTING PERIOD 12
OPERATING PERFORMANCE BY ACTIVITY 12 CORE ACTIVITY HOME 12 NON-CORE ACTIVITIES 13
FINANCIAL OPERATIONS OF THE GORENJE GROUP 14 GROUP'S FINANCIAL PERFORMANCE 14 WORKING CAPITAL 16
OPERATING PERFORMANCE OF GORENJE, D.D. 18 OWNERSHIP STRUCTURE AND THE GRVG SHARE 20
OWNERSHIP STRUCTURE 20 GRVG SHARE IN THE FIRST QUARTER OF 2017 21
SIGNIFICANT EVENTS AFTER THE BALANCE SHEET DATE 22 SIGNIFICANT BUSINESS EVENTS IN 2017 23
ACCOUNTING REPORT 26 Unaudited Condensed Consolidated Financial Statements of the Gorenje Group 30
Condensed Consolidated Balance Sheet of the Gorenje Group 30 Condensed Consolidated Income Statement of the Gorenje Group 31 Condensed Consolidated Statement of Other Comprehensive Income of the Gorenje Group 31 Condensed Consolidated Statement of Cash Flows of the Gorenje Group 32 Condensed Consolidated Statement of Change in Equity of the Gorenje Group 33 Notes to the Condensed Consolidated Financial Statements of the Gorenje Group 35 Financial indicators 38
Unaudited Condensed Financial Statements of Gorenje, d.d. 39 Condensed Balance Sheet of Gorenje, d.d. 39 Condensed Income Statement of Gorenje, d.d. 40 Condensed Statement of Other Comprehensive Income of Gorenje, d.d. 40 Condensed Statement of Cash Flows of Gorenje, d.d. 41 Condensed Statement of Changes in Equity of Gorenje, d.d. 42 Notes to the Condensed Financial Statements of Gorenje, d.d. 44 Financial indicators 45
INFORMATION REGARDING THE REPORT AND ITS PUBLIC ANNOUNCEMENT 46
Unaudited Consolidated Financial Statements January-March 2017
3
PERFORMANCE HIGHLIGHTS OF THE GORENJE GROUP
CORE FINANCIAL INDICATORS FOR Q1 2017
The Group continues with successful operations also in the first quarter of 2017.
EUR 305.7m of revenue was generated, which is 7.1% more than in the
first quarter of 2016.
The generated volume and growth in revenue is 3.4% higher than planned by the Group for the Q1 2017.
Revenue generated by the Core activity Home was recorded at EUR 250.9m (3.4% more than in Q1 2016) or on levels that are comparable to the planned dynamics.
EBITDA was EUR 20.6m showing an increase of 11.6% over the previous
year's result. EBITDA margin grew to 6.7%, which is 0.2 p.p. more than in the first quarter of 2016.
EBIT was recorded at EUR 7.9m and indicates more than 16 percent
growth over the EBIT achieved in Q1 2016. EBIT margin grew to 2.6%, which is 0.2 p.p. more than in the same period in 2016.
The Group generated a profit of EUR 2.1m or EUR 1.5m more than in
the previous year's same period.
Operations in the first quarter of 2017 were marked by successful operations of the Core activity Home as a result of:
achieved favourable sales structure of brands; enhancing the sale of Asko and Atag, Pelgrim and Etna brands,
achieved favourable sales structure of large household appliances; enhancing the sales of premium appliances (13.3 percent growth in revenue), of innovative appliances (9.9 percent growth in revenue), of dishwashers (20.0 percent growth in revenue), and of cooking appliances (equal amount of revenue),
high growth in sales of small household appliances and appliances from the heating line,
achieved favourable geographical sales structure; enhancing the sales on markets outside of Europe, Benelux, Eastern Europe,
well-managed costs of material and raw materials and logistics.
Business operations were in the first quarter of 2017 marked also by successful performance by the Non-core activities, which are attributable to higher revenue generated by the domains of ecology, coal, medical equipment and catering.
In Q1 2017, the Group made development-related investments worth EUR 7.6m, which equals a 2.5 percent share in its revenue structure. EUR 6.4m was invested in marketing, which equals to a 2.1 percent share in the Group's revenue structure. Accordingly, investments in
development projects and marketing remained within the comparable scope of Q1 2016.
The negative result in financing activities recorded at EUR 3.5m improved by EUR 1.6m if compared to the previous year's same period. The result in financing activities was impacted by interest expenses that declined by 14.4% over the Q1 2016 balance. Exchange differences had a neutral
impact on Group's operations in the first quarter of 2017.
Unaudited Consolidated Financial Statements January-March 2017
4
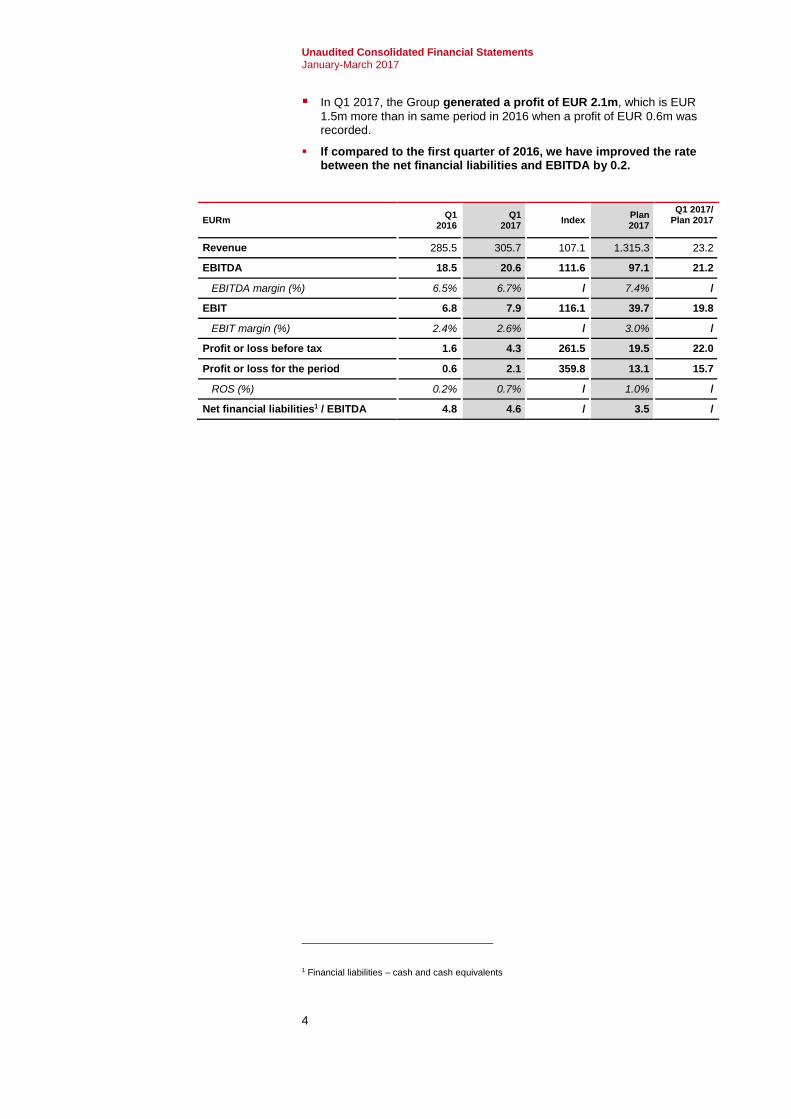
In Q1 2017, the Group generated a profit of EUR 2.1m, which is EUR
1.5m more than in same period in 2016 when a profit of EUR 0.6m was recorded.
If compared to the first quarter of 2016, we have improved the rate between the net financial liabilities and EBITDA by 0.2.
EURm Q1
2016 Q1
2017 Index
Plan 2017
Q1 2017/ Plan 2017
Revenue 285.5 305.7 107.1 1.315.3 23.2
EBITDA 18.5 20.6 111.6 97.1 21.2
EBITDA margin (%) 6.5% 6.7% / 7.4% /
EBIT 6.8 7.9 116.1 39.7 19.8
EBIT margin (%) 2.4% 2.6% / 3.0% /
Profit or loss before tax 1.6 4.3 261.5 19.5 22.0
Profit or loss for the period 0.6 2.1 359.8 13.1 15.7
ROS (%) 0.2% 0.7% / 1.0% /
Net financial liabilities1 / EBITDA 4.8 4.6 / 3.5 /
1 Financial liabilities – cash and cash equivalents
Unaudited Consolidated Financial Statements January-March 2017
5
MANAGEMENT REPORT
OPERATING PERFORMANCE OF THE GORENJE GROUP
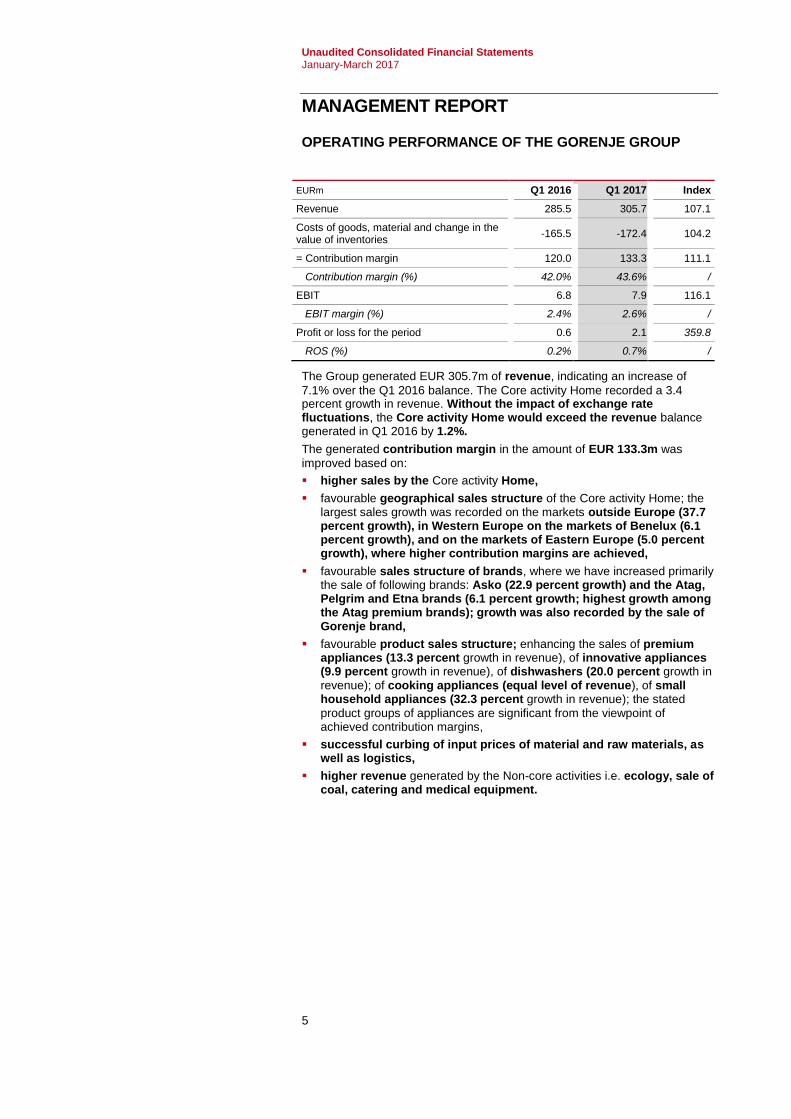
EURm Q1 2016 Q1 2017 Index
Revenue 285.5 305.7 107.1
Costs of goods, material and change in the value of inventories
-165.5 -172.4 104.2
= Contribution margin 120.0 133.3 111.1
Contribution margin (%) 42.0% 43.6% /
EBIT 6.8 7.9 116.1
EBIT margin (%) 2.4% 2.6% /
Profit or loss for the period 0.6 2.1 359.8
ROS (%) 0.2% 0.7% /
The Group generated EUR 305.7m of revenue, indicating an increase of
7.1% over the Q1 2016 balance. The Core activity Home recorded a 3.4 percent growth in revenue. Without the impact of exchange rate fluctuations, the Core activity Home would exceed the revenue balance generated in Q1 2016 by 1.2%.
The generated contribution margin in the amount of EUR 133.3m was
improved based on:
higher sales by the Core activity Home,
favourable geographical sales structure of the Core activity Home; the largest sales growth was recorded on the markets outside Europe (37.7 percent growth), in Western Europe on the markets of Benelux (6.1 percent growth), and on the markets of Eastern Europe (5.0 percent growth), where higher contribution margins are achieved,
favourable sales structure of brands, where we have increased primarily the sale of following brands: Asko (22.9 percent growth) and the Atag, Pelgrim and Etna brands (6.1 percent growth; highest growth among the Atag premium brands); growth was also recorded by the sale of Gorenje brand,
favourable product sales structure; enhancing the sales of premium appliances (13.3 percent growth in revenue), of innovative appliances (9.9 percent growth in revenue), of dishwashers (20.0 percent growth in revenue); of cooking appliances (equal level of revenue), of small household appliances (32.3 percent growth in revenue); the stated
product groups of appliances are significant from the viewpoint of achieved contribution margins,
successful curbing of input prices of material and raw materials, as well as logistics,
higher revenue generated by the Non-core activities i.e. ecology, sale of coal, catering and medical equipment.
Unaudited Consolidated Financial Statements January-March 2017
6
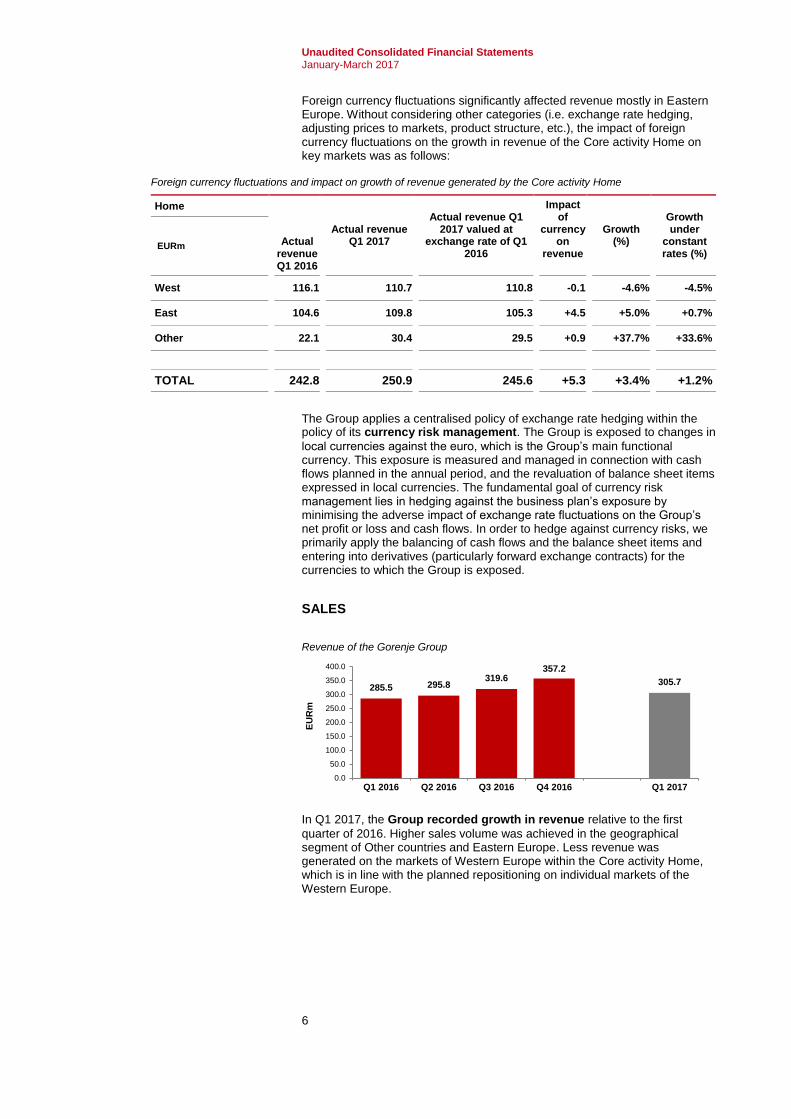
Foreign currency fluctuations significantly affected revenue mostly in Eastern Europe. Without considering other categories (i.e. exchange rate hedging, adjusting prices to markets, product structure, etc.), the impact of foreign currency fluctuations on the growth in revenue of the Core activity Home on key markets was as follows:
Foreign currency fluctuations and impact on growth of revenue generated by the Core activity Home
Home
Actual revenue Q1 2016
Actual revenue Q1 2017
Actual revenue Q1 2017 valued at
exchange rate of Q1 2016
Impact of
currency on
revenue
Growth (%)
Growth under
constant rates (%)
EURm
West 116.1 110.7 110.8 -0.1 -4.6% -4.5%
East 104.6 109.8 105.3 +4.5 +5.0% +0.7%
Other 22.1 30.4 29.5 +0.9 +37.7% +33.6%
TOTAL 242.8 250.9 245.6 +5.3 +3.4% +1.2%
The Group applies a centralised policy of exchange rate hedging within the policy of its currency risk management. The Group is exposed to changes in
local currencies against the euro, which is the Group’s main functional currency. This exposure is measured and managed in connection with cash flows planned in the annual period, and the revaluation of balance sheet items expressed in local currencies. The fundamental goal of currency risk management lies in hedging against the business plan’s exposure by minimising the adverse impact of exchange rate fluctuations on the Group’s net profit or loss and cash flows. In order to hedge against currency risks, we primarily apply the balancing of cash flows and the balance sheet items and entering into derivatives (particularly forward exchange contracts) for the currencies to which the Group is exposed.
SALES
Revenue of the Gorenje Group
In Q1 2017, the Group recorded growth in revenue relative to the first
quarter of 2016. Higher sales volume was achieved in the geographical segment of Other countries and Eastern Europe. Less revenue was generated on the markets of Western Europe within the Core activity Home, which is in line with the planned repositioning on individual markets of the Western Europe.
285.5 295.8319.6
357.2
305.7
0.0
50.0
100.0
150.0
200.0
250.0
300.0
350.0
400.0
Q1 2016 Q2 2016 Q3 2016 Q4 2016 Q1 2017
EU
Rm

Unaudited Consolidated Financial Statements January-March 2017
7
Revenue by geographical segment
EURm Q1 2016 % Q1 2017 % Change
(%)
Western Europe 119.6 41.9 114.1 37.3 -4.6%
Eastern Europe 143.8 50.4 161.2 52.7 +12.1%
Other 22.1 7.7 30.4 10.0 +37.7%
Total Group 285.5 100.0 305.7 100.0 +7.1%
Western Europe 116.1 47.8 110.7 44.1 -4.6%
Eastern Europe 104.6 43.1 109.8 43.8 +5.0%
Other 22.1 9.1 30.4 12.1 +37.7%
Total Home 242.8 100.0 250.9 100.0 +3.4%
Western Europe includes Austria, Germany, Italy, France, Denmark, Sweden, Belgium, Finland, Great Britain, Greece, Norway, the Netherlands, Spain, Switzerland, Ireland, Luxembourg, Malta, Portugal;
Eastern Europe includes Ukraine, Russia, Macedonia, Croatia, Serbia, Montenegro, Albania, Bosnia and Herzegovina, Belarus, Kosovo, Moldova, Latvia, Lithuania, Estonia, Slovenia, Czech Republic, Hungary, Poland, Bulgaria, Romania, Slovakia;
Other refers to all other countries outside of Europe.
DEVELOPMENT AND NEW PRODUCTS
Pursuant to the strategic goal, the Group invested in the development of 3.0% of revenue generated by the Core activity Home and 2.5% of Group's revenue.
Key innovations that were launched in 2017:
the new modular platform of built-in cooler-freezer appliances for the Gorenje brand,
the new Gorenje Retro Special Edition refrigerator in partnership with VW,
the new appliances design line for the Gorenje Ora Ito 2 kitchen.
MARKETS OF THE CORE ACTIVITY HOME
In view of sales generated in Q1 2016, the Core activity Home achieved sales growth in the first quarter of 2017.
Based on higher sales outside Europe, Gorenje is reducing dependency from European markets and thereby improving the sales structure (increasing the share of premium appliances and premium brands). As for the markets outside Europe, we have achieved significant growth in North America, Australia, Near and Far East, Caucasus and Asia. Markets outside Europe account for a 12.1 percent share (3.0
p.p. more than in the same period in 2016) in the revenue structure of the Core activity Home.
Growth in revenue was recorded on individual markets of Eastern Europe i.e. Slovakia, Hungary, Poland, Croatia, Bulgaria, Macedonia, Serbia, and Albania.
Important growth was recorded also on markets of Ukraine (more than 50%). The level of revenue generated in Russia equals those recorded in
the first quarter of 2016.
As for Western Europe, sales growth was recorded on the markets of Benelux, mostly in the Netherlands where our market share is growing based on sales of the Atag brand. Higher sales were recorded also in Austria. Lower revenue were generated on markets of Germany and Great Britain, which is in line with the planned price repositioning on

Unaudited Consolidated Financial Statements January-March 2017
8
these markets. We have for this purpose cancelled certain promotions (low-price appliances), where no acceptable margins are generated.
Higher revenue from sales of Asko brand appliances increases the overall sales of the premium segment. Sales of Asko brand appliances accounted within the Core activity Home’s revenue structure a 12.0 percent share (+1.9 p.p. over the Q1 2016 balance). Higher sales
of the Asko brand products were achieved on the markets of Scandinavia, America, Australia, Russia, and Asia.
The sales of small household appliances recorded a 32.3 percent growth in revenue. The sale of small household appliances accounted within the Core activity Home’s revenue structure a 4.0 percent share (+0.9 p.p. over the Q1 2016 balance). Growth was recorded on markets of Poland, Hungary, Slovenia, Croatia, Romania and Bosnia and Herzegovina. Essential growth in sales of small household appliances was achieved also on the markets of Russia and Ukraine.
We have increased the sales of innovative2 appliances, whose share
within the structure of revenue generated through the sales of large household appliance by the Core activity Home grew to 22.4% (+ 2.4 p.p.). Growth was also recorded by the sale of premium3 appliances,
whose share within the structure of revenue generated through the sales of large household appliance by the Core activity Home increased to 29.6% (+3.1 p.p.).
SALES BY GORENJE GROUP'S ACTIVITIES
Revenue by activities
EUR 250.9m of revenue was generated by the Core activity Home, which
indicates a 3.4 percent growth over the Q1 2016 balance.
EUR 54.8m of revenue was generated by the Non-core activities, which is
28.2% more than in the previous year’s same period. Increase in revenue is attributable to the domains of ecology, catering, medical equipment and sale of coal.
2 Innovative appliances: appliances within individual group of products with the so-called »innovative functionalities« are more energy efficient (efficient storage, lower energy and water consumption). 3 Premium appliances: Atag and Asko brands, appliances from the Gorenje design lines (Gorenje Simplicity, Gorenje OraIto, Gorenje Pininfarina, Gorenje Classico, Gorenje One, Gorenje Karim Rashid, Gorenje Color edition, Gorenje +, Gorenje Retro, and Gorenje by Starck).
Q1 2016 Q2 2016 Q3 2016 Q4 2016 Q1 2017
Home 242.8 256.7 282.7 309.5 250.9
Non-core activities 42.7 39.1 36.9 47.7 54.8
0.0
50.0
100.0
150.0
200.0
250.0
300.0
350.0
400.0
EU
Rm
Unaudited Consolidated Financial Statements January-March 2017
9
Structure of Group's revenue by activity
The achieved revenue structure by activity indicates that the Core activity
Home generated 82.1% of Group's total revenue (-2.9 p.p.). The change in the share is the result of an above-average growth in revenue generated by the Non-core activities.
PROFITABILITY OF THE GORENJE GROUP
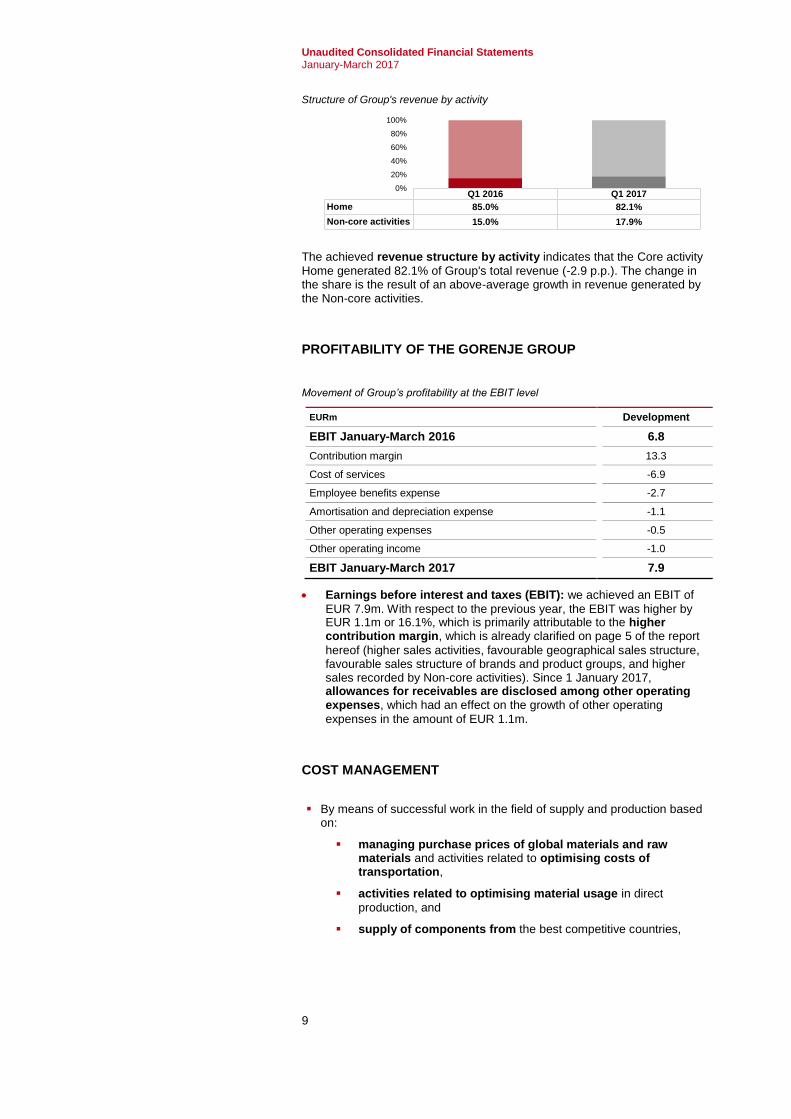
Movement of Group’s profitability at the EBIT level
EURm Development
EBIT January-March 2016 6.8
Contribution margin 13.3
Cost of services -6.9
Employee benefits expense -2.7
Amortisation and depreciation expense -1.1
Other operating expenses -0.5
Other operating income -1.0
EBIT January-March 2017 7.9
Earnings before interest and taxes (EBIT): we achieved an EBIT of
EUR 7.9m. With respect to the previous year, the EBIT was higher by EUR 1.1m or 16.1%, which is primarily attributable to the higher contribution margin, which is already clarified on page 5 of the report
hereof (higher sales activities, favourable geographical sales structure, favourable sales structure of brands and product groups, and higher sales recorded by Non-core activities). Since 1 January 2017, allowances for receivables are disclosed among other operating expenses, which had an effect on the growth of other operating
expenses in the amount of EUR 1.1m.
COST MANAGEMENT
By means of successful work in the field of supply and production based on:
managing purchase prices of global materials and raw materials and activities related to optimising costs of transportation,
activities related to optimising material usage in direct
production, and
supply of components from the best competitive countries,
Q1 2016 Q1 2017
Home 85.0% 82.1%
Non-core activities 15.0% 17.9%
0%
20%
40%
60%
80%
100%

Unaudited Consolidated Financial Statements January-March 2017
10
we have adjusted the costs of material and raw materials with respect to the volume of sales and production. The latter is attributable also to activities related to optimising the supply chain.
Compared to the Q1 2016 balance, costs of services grew by 15.0% or EUR 6.9m. Upon the elimination of the divested companies Publicus
and Ekogor in 2016, the costs of services increased within Non-core activities by EUR 2.1m. Higher costs of services recorded by the domain Non-core activities are related to the high growth in operating activities, mainly in the area of ecology, catering, as well as projects implemented in the field of medicine, ecology and municipal projects; the performance of these projects resulted also in higher revenue and income.
The domain of Core activity Home recorded higher costs of services by EUR 4.8m, whereof EUR 2.3m refers to uniforming the accounting recording: recording of costs of quality relating to warranty repairs, where
stated costs in certain subsidiaries were previously recorded partly among costs of material and partly among employee benefits expense, and
recording of costs earmarked for better positioning of products that were in accordance with local specifics previously recorded by the subsidiary as lowering of income.
Higher production activities within the Core activity Home are also accompanied by higher costs of maintenance, of temporary leased workers through agencies and other costs linked to the volume of business activities. The Core activity Home successfully curbed the costs of logistics on the side of the sale, which regardless of higher sales of appliances slightly declined. Higher investments in marketing and development are further targeted, which thereby ensure Group's long-term competition ability.
Employee benefits expense increased by 4.7% or EUR 2.7m. In
addition to planned promotions and wage increases, as required under the collective agreement, the employee benefits expense increased due to:
o higher average number of employees as a result of larger volume of production and orders for the second quarter, mostly on production locations in Velenje and Valjevo,
o retirement benefits that were higher in the observed period if compared to the same period in 2016.
Growth in employee benefits expense lags behind the growth in revenue, which increased by 7.1% and the growth of the contribution margin that is higher by 11.1%.
EBIT and EBIT margin
The Gorenje Group's average number of employees was 10,978 or an
average of 448 more than in the first quarter of 2016. The average number of staff in the production of the Core activity Home grew by 370 (relating mostly to the production facilities in Velenje and Valjevo due to higher volume of production activities), whereby in trade companies of the Core activity Home the number of employees increased by 74 as a result of the changed business model applied by retail studios in Eastern Europe (employing workers that were previously employed via employment agencies). The
6.89.9 8.5
15.0
7.9
2.4%
3.4%
2.7%
4.2%
2.6%
0.0%
1.0%
2.0%
3.0%
4.0%
5.0%
0.0
5.0
10.0
15.0
20.0
Q1 2016 Q2 2016 Q3 2016 Q4 2016 Q1 2017
EU
Rm

Unaudited Consolidated Financial Statements January-March 2017
11
average number of employees in Non-core activities increased by 6. The aforesaid increase refers mostly to the catering domain (expanding the activity). The reduction of staff relates to the ecology domain due to the sale of two companies in 2016.
Average number of employees by activity
Total: 10,530 10,743 11,083 11,201 10,978
The Group recorded earnings before interest, taxes, depreciation and amortisation (EBITDA) of EUR 20.6m, which is EUR 2.1m or 11.6% more
than in Q1 2016.
EBITDA and EBITDA margin
The Group's negative result from financing activities at EUR 3.5m is by EUR 1.6m more favourable than in the previous year's same period. The result from financing activities was impacted by interest expenses, which declined by 14.4% over the Q1 2016 balance. Exchange differences had a neutral
effect on Group's operations in the first quarter of 2017.
Income tax expense, disclosed at EUR 2.2m and higher by EUR 1.2m in
comparison to Q1 2016, includes current and deferred income tax. The higher income tax expense is the result of the improved profitability over the Q1 2016 and consequently higher current tax.
Current tax refers to the tax that will be paid on profit for the period per individual Group companies. Deferred tax is disclosed upon the accounting of temporary differences between the carrying amount of assets and liabilities for financial reporting purposes and the amounts for tax reporting purposes. Temporary differences, which generally have through deferred tax assets and liabilities the biggest impact on deferred taxes, are tax relief amounts that are disclosed in connection with investments, investments relating to research and development, and amounts of tax losses from previous periods, which relate mostly to the parent company.
Q1 2016 Q2 2016 Q3 2016 Q4 2016 Q1 2017
Home 9,077 9,289 9,640 9,743 9,519
Non-core activities 1,453 1,454 1,443 1,458 1,459
0
2,000
4,000
6,000
8,000
10,000
12,000
18.521.7 20.3
26.7
20.6
6.5%
7.4%
6.4%
7.5%
6.7%
5.8%
6.0%
6.2%
6.4%
6.6%
6.8%
7.0%
7.2%
7.4%
7.6%
0.0
5.0
10.0
15.0
20.0
25.0
30.0
Q1 2016 Q2 2016 Q3 2016 Q4 2016 Q1 2017
EU
Rm

Unaudited Consolidated Financial Statements January-March 2017
12
OPERATING RESULT OF THE REPORTING PERIOD
Gorenje Group’s operating profit for the period amounted to EUR 2.1m.
Operating profit for the period and ROS
OPERATING PERFORMANCE BY ACTIVITY
Comments on the operating performance in terms of activity are provided within the section operating performance of the Gorenje Group and include the Core activity Home as well as Non-core activities.
CORE ACTIVITY HOME
EURm Q1 2016 Q1 2017 Index
Revenue 242.8 250.9 103.4
Costs of goods, material and change in value of inventories
-142.9 -140.6 98.4
= Contribution margin 99.9 110.3 110.4
Contribution margin (%) 41.2% 44.0% /
EBIT 4.5 4.7 103.7
EBIT margin (%) 1.8% 1.9% /
Revenue and EBIT margin of the Core activity Home
0.61.5
2.0
4.3
2.10.2%
0.5%0.6%
1.2%
0.7%
0.0%
0.2%
0.4%
0.6%
0.8%
1.0%
1.2%
1.4%
0.0
1.0
2.0
3.0
4.0
5.0
Q1 2016 Q2 2016 Q3 2016 Q4 2016 Q1 2017
EU
Rm
242.8 256.7 282.7 309.5 250.9
1.8%
2.9%2.2%
4.3%
1.9%
0.0%
0.5%
1.0%
1.5%
2.0%
2.5%
3.0%
3.5%
4.0%
4.5%
5.0%
0.0
50.0
100.0
150.0
200.0
250.0
300.0
350.0
Q1 2016 Q2 2016 Q3 2016 Q4 2016 Q1 2017
EU
Rm

Unaudited Consolidated Financial Statements January-March 2017
13
Movement of profitability at the EBIT level
EURm Development
EBIT January-March 2016 4.5
Contribution margin 10.4
Cost of services -4.8
Employee benefits expense -2.9
Amortisation and depreciation expense -1.1
Other operating expenses -0.6
Other operating income -0.8
EBIT January-March 2017 4.7
NON-CORE ACTIVITIES
EURm Q1 2016 Q1 2017 Index
Revenue 42.7 54.8 128.2
Costs of goods, material and change in value of inventories
-22.6 -31.8 140.7
= Contribution margin 20.1 23.0 114.2
Contribution margin (%) 47.1% 41.9% /
EBIT 2.3 3.2 140.4
EBIT margin (%) 5.4% 5.9% /
Revenue and EBIT margin of Non-core activities
Movement of profitability at the EBIT level
EURm Development
EBIT January-March 2016 2.3
Contribution margin 2.9
Cost of services -2.1
Employee benefits expense 0.2
Amortisation and depreciation expense 0.0
Other operating expenses 0.1
Other operating income -0.2
EBIT January-March 2017 3.2
42.7 39.1 36.9 47.7 54.8
5.4%6.6% 5.8%
3.5%
5.9%
0.0%
1.0%
2.0%
3.0%
4.0%
5.0%
6.0%
7.0%
0.0
10.0
20.0
30.0
40.0
50.0
60.0
Q1 2016 Q2 2016 Q3 2016 Q4 2016 Q1 2017
EU
Rm

Unaudited Consolidated Financial Statements January-March 2017
14
FINANCIAL OPERATIONS OF THE GORENJE GROUP
GROUP'S FINANCIAL PERFORMANCE
The core goal of the Group's financial function is reducing the relative borrowing rate and ensuring short-term and long-term stability with minimum possible costs and risks. With respect to the previous year's same period, the net financial liabilities/EBITDA ratio was reduced by 0.2 to 4.6, interest expenses by 14.4%, whereby the maturity structure of financial liabilities was improved by 3.1 p.p. to 65.9% of non-current sources.
Ongoing repayment of due liabilities is ensured based on inflows from sales activities of the Home core and Non-core activities and the related free cash flow, and by timely provision of substitute financing. The Group endeavours for constant optimisation of the net working capital. The Group observes the policy of replacing currently due long-term financial sources by raising new long-term financial sources and spreading to bank and non-bank sources, whereby we focus on maintaining the quality of the maturity structure. In addition, we are constantly renewing current loans or increasing them for the purpose of the liquidity reserve.
In Q1 2017, we have repaid EUR 12.0m of currently due long-term borrowings and performed the fifth issue of commercial papers in the total par value of EUR 40.0m that shall be paid at the year-end of 2017. The issue of short-term commercial papers is earmarked for balancing the interim dynamics of generating cash flow.
Movement of total and net financial liabilities in the 2013-2017 period (EURm), movement of the relative borrowing rate or the net financial liabilities/EBIDTA ratio, and the maturity structure of financial liabilities
As at 31 March 2017, total financial liabilities amounted to EUR 430.1m,
showing an increase of EUR 11.9m relative to the same period in 2016. Movement of financial liabilities is in accord with the interim seasonal dynamics, where most of Group's negative cash flows from operating and investing activities is generated in the first half-year of a fiscal year. The increase is almost fully the result of higher inventories if compared to the Q1 2016 balance. As for the maturity structure of financial liabilities, 65.9%
refer to non-current sources, whereby the remaining stake represents current sources. The maturity structure thus improved by 3.1. p.p. if compared to the same period last year.
As at 31 March 2017, net financial liabilities (measured as the difference
between total financial liabilities and cash and cash equivalents) amounted to EUR 408.0m and indicate an increase of EUR 12.2m over the same period in 2016.
As at 31 March 2017, the Group disclosed a liquidity reserve in the amount of EUR 79.9m in form of approved but undrawn current and non-current borrowings in addition to bank balances, which may also be used to bridge payments on currently due liabilities.
473.4418.2 422.5 418.2 430.1
452.1
392.4 402.5 395.9 408.0
5.3
4.7 4.9 4.8 4.6
0
1
2
3
4
5
6
0.0
50.0
100.0
150.0
200.0
250.0
300.0
350.0
400.0
450.0
500.0
31.3.2013 31.3.2014 31.3.2015 31.3.2016 31.3.2017
Total financial debt Net financial liabilities
Net financial liabilities/EBITDA
57.1%46.4%
60.2% 62.8% 65.9%
42.9%53.6%
39.8% 37.2% 34.1%
0%
10%
20%
30%
40%
50%
60%
70%
80%
90%
100%
31.3.2013 31.3.2014 31.3.2015 31.3.2016 31.3.2017
Current financial liabilities
Non-current financial liabilities

Unaudited Consolidated Financial Statements January-March 2017
15
Together with existing bank and other partners, the Group is engaged in activities to further servicing maturing financial liabilities and optimising the costs of financing, to an additional maintaining of the loans' maturity structure, and balancing the amount of the liquidity reserve. Accordingly, Gorenje, d.d., issued on 11 May 2017 bonds in a total par value of EUR 19,456,000.00, bearing interest at 2.45% p.a. and the maturity in May 2022. The results of these activities, as well as their continuance, already to a large extent ensure sources for servicing currently due non-current borrowings for the entire year 2017 and the current balancing of cash flow requirements. In the first quarter of 2017, the Group recorded EUR 67.5m of negative cash flow from operating and investing activities, which is on the same level of the previous year’s equal period (worsened by EUR 0.9m). This is primarily attributable to the strong positive cash flow generated in Q4 2016 and the very low level of net working capital as at 31 December 2016. However, this is consistent dynamics as the Group most of its negative cash flows from operating and investing activities always incurs in the first half-year, while most of the positive cash flow in the last quarter.
Cash flows from operating and investing activities
Investments amounted in the first quarter of 2017 to EUR 14.8m and show
an increase of EUR 3.1m relative to the Q1 2016 balance. Investments in property, plant and equipment amounted to EUR 9.9m, whereof the largest share of EUR 8.7m was earmarked for technological equipment, mostly relating to the development of new products. The largest share of investments in the amount of EUR 13.2m was recorded within the Core activity Home. As for the structure of total investments, EUR 4.8m relates to non-material investments, where most of them (EUR 4.2m) were earmarked for the development of new products. Investments made within the domain of Non-core activities amounted in Q1 2017 to EUR 1.6m, whereof mostly refers to ecology (EUR 1.3m).
Investments by activities
Total 11.7 18.4 21.9 31.2 83.2 14.8
-66.6
-12.3
6.8
60.6
-11.5
-67.5
Q1 2016 Q2 2016 Q3 2016 Q4 2016 2016 Q1 2017
mio
EU
R
Q1 2016 Q2 2016 Q3 2016 Q4 2016 2016 Q1 2017
Home 10.2 17.4 20.7 29.4 77.7 13.2
Non-core activities 1.5 1.0 1.2 1.8 5.5 1.6
CAPEX margin (%) 4.1% 6.2% 6.9% 8.7% 6.6% 4.8%
0.0%
1.0%
2.0%
3.0%
4.0%
5.0%
6.0%
7.0%
8.0%
9.0%
10.0%
0.0
10.0
20.0
30.0
40.0
50.0
60.0
70.0
80.0
90.0
EU
Rm

Unaudited Consolidated Financial Statements January-March 2017
16
WORKING CAPITAL
As at 31 March 2017, Group’s investments in the net working capital4 amounted to EUR 215.2m and, compared to 31 December 2016 balance (used as the basis for calculating the development of cash flows from operating and investing activities for 2017) show an increase of EUR 70.3m. With respect to the same period in 2016, they increased by EUR 3.4m.
Investments in net working capital
EURm 31 Mar 2013
31 Mar 2014
31 Mar 2015
31 Mar 2016
31 Dec 2016
31 Mar 2017
Difference 31 Mar 2017 / 31 Mar 2016
+ Inventories 265.3 238.0 238.1 238.1 225.9 250.1 +12.0
+ Trade receivables 241.9 214.3 193.4 177.6 165.8 191.3 +13.7
+ Other current assets 67.2 47.7 52.0 49.0 58.8 52.1 +3.1
- Trade payables -178.9 -168.3 -171.1 -169.1 -223.7 -181.6 -12.5
- Other current liabilities -88.5 -86.9 -85.0 -83.8 -81.9 -96.7 -12.9
= Net working capital 307.0 244.8 227.4 211.8 144.9 215.2 +3.4
Movement of net working capital in the 2013-2017 period (EURm) and its share in the net revenue for the past 12 months (in %)
As at 31 March 2017, trade receivables were recorded at EUR 191.3m and
show an increase over the 31 December 2016 balance (as the basis for calculating the cash flow movement for 2017) by EUR 25.5m. With respect to Q1 2016, trade receivables increased by EUR 13.7m due to higher value of revenue (7.1%) relative to the same period last year. The average turnover of receivables was 55 days or 3 days shorter from the average turnover of receivables in Q1 2016.
As at 31 March 2017, inventories amounted to EUR 250.1m and indicate an
increase of EUR 24.2m relative to the 31 December 2016 balance. With respect to the same period last year, inventories grew by EUR 12.0m, which is mostly attributable to higher volume of activities. Inventory turnover amounted to 69 days, which is 2 days shorter if compared to the first quarter of 2016.
Trade payables amounted to EUR 181.6m as at 31 March 2016 and indicate
a decline of EUR 42.1m over the 31 December 2016 balance. If compared to the Q1 2016 balance, trade payables increased by EUR 12.5m. Turnover of liabilities was 68 days or 3 days less than in the same period in 2016.
4 Net working capital = inventories + trade receivables +other current assets – trade payables – other current liabilities
307.0
244.8 227.4 211.8 215.2
23.9%
19.6%18.5%
17.0% 16.8%
0.0%
5.0%
10.0%
15.0%
20.0%
25.0%
30.0%
0.0
50.0
100.0
150.0
200.0
250.0
300.0
350.0
31.3.2013 31.3.2014 31.3.2015 31.3.2016 31.3.2017

Unaudited Consolidated Financial Statements January-March 2017
17
Certain financial risks have a significant impact on the Group's cash flow management
The Group pays ongoing special attention to managing financial risks, in particular an efficient credit risk management. Credit risk is balanced through
regular control of credit limits approved by credit insurance companies, the appropriate collection of receivables, and regular communication with credit insurance companies and business partners. The Group has also launched the system of permanent recourse-free factoring, which is carried out when costs of such activities do not exceed the Group's average costs of financing or we reduce credit and currency risks by means of performing these activities. The balance of bad debts is reviewed and analysed on an on-going basis, and proper measures are implemented (e.g. collection, collection of mortgages, suspension of supplies to customers with weak credit ratings, etc.). We have a strict set of rules on what is deemed suitable collateral for the sale of goods, and a defined level of the maximum possible exposure to individual companies, customers, etc.
Currency risks are to the greatest extent possible minimised through natural
cash flow balancing for each currency that, mostly in the case of companies, is impossible to be fully implemented. The Group systematically applies forward exchange contracts for most of the currencies that are not part of the euro zone in order to hedge against currency risk. In addition, we are seeking additional possibilities for increasing the scope of natural hedging. In the medium term, we hedge against currency risk by adjusting sales prices on an on-going basis, by applying cost optimisation and by means of increasing natural hedging on the purchase/sale side.
As at 31 March 2017, the Group recorded exchange losses in the amount of EUR 0.1m, which is by EUR 1.3m worse than in the same period last year.
We are managing the risk of short-term liquidity by means of approved
revolving credit lines per Group companies, approved bank account overdrafts, and bank balances. As at the end of 31 March 2017, the undrawn part of current and non-current credit lines amounted to EUR 57.8m and bank balances to an additional EUR 22.1m.

Unaudited Consolidated Financial Statements January-March 2017
18
OPERATING PERFORMANCE OF GORENJE, D.D.
Operating performance of Gorenje, d.d.
EURm Q1 2016 Q1 2017 Index
Revenue 170.9 182.7 106.9
Costs of goods, material and change in value of inventories
-119.8 -125.2 104.5
= Contribution margin 51.1 57.5 112.5
Contribution margin (%) 29.9% 31.4% /
EBITDA 10.1 12.6 124.8
EBITDA margin (%) 5.9% 6.9% /
EBIT 4.1 5.9 142.0
EBIT margin (%) 2.4% 3.2% /
Profit before tax 1.6 3.7 230.1
Profit for the period 1.3 3.1 240.8
ROS (%) 0.8% 1.7% /
Revenue generated by the parent company amounted to EUR 182.7m in the
first quarter of 2017 and shows an increase over the Q1 2016 balance by EUR 11.8m or 6.9%.
Revenue generated through the Core activity Home within the parent company amounted to EUR 165.9m and shows an increase of 5.7% over the Q1 2016 balance, which is primarily the result of higher sales of in-house manufactured products (by 7.7%) and home appliances via dealers by 3.3% (which includes primarily the supplementary and the heater system programme).
Revenue generated through sales beyond the Core activity Home was recorded at EUR 16.7m and increased by 32.2% if compared to the previous year’s same period, which is mostly the result of higher revenue from the sale of coal.
The contribution margin grew over the Q1 2016 balance by EUR 6.4m, which is mainly attributable to:
- higher sales of in-house manufactured appliances (dishwashers and cookers),
- higher sales of small household appliances,
- higher sales of premium brand appliances and premium appliances, and
- successful management of input prices for material and raw materials.
Compared to the same period in 2016, costs of services have gone up by EUR 1.3m or 7.5%, while revenue increased by 6.9%. Higher production of large household appliances by 14.0% over the Q1 2016 balance was followed by higher costs of production services, brands and licence fees.
Employee benefits expense increased by 6.2% if compared to the same period in 2016, primarily due to higher number of staff in Q1 2017 (in average 5.6% more staff than in Q1 2016), which is in line with the production's higher volume.
With respect to the first three months of 2016, amortisation and depreciation expense increased in 2017 by 13.1%, primarily due to activated production lines and tools in individual programmes (mainly dishwashers, driers and ovens), and due to higher amortisation of intangible assets earmarked for the development of new advances products (built-in ovens, new generation of washing machines, new dishwashers).
Unaudited Consolidated Financial Statements January-March 2017
19
The result from financing activities improved over the Q1 2016 by EUR 335k, which is primarily attributable to the interest on borrowings received, lower costs of loans received and letters of credit issued, and higher exchange gains recorded in this year relative to the same period in 2016.
The improvement of the EBIT for the January-March 2017 period over the same period last year is mostly attributable to the higher contribution margin.
Movement of the parent company’s profitability at the EBIT level
EURm Development
EBIT January-March 2016 4.1
Contribution margin 6.4
Cost of services -1.3
Employee benefits expense -1.5
Amortisation and depreciation expense -0.8
Other operating expenses -1.0
Other operating income 0.0
EBIT January-March 2017 5.9
As at 31 March 2017, trade receivables were recorded at EUR 149.7m and
show a decrease of EUR 4.7m in comparison to Q1 2016. The average turnover of receivables was 69 days, which is 10 days shorter than the average turnover of receivables in the same period in 2016. Most of the trade receivables refer to related entities (67.8%).
Inventories amounted to EUR 100.4m and with respect to 31 March 2016
show an increase of EUR 6.3m. Inventory turnover amounted to 47 days, which is 2 days shorter than in the same period in 2016 due to higher volume of operations.
Trade payables amounted as at 31 March 2017 to EUR 139.2m and show an
increase over the same period in 2016 by EUR 14.8m. The turnover of payables was 95 days and accordingly remained on the level as recorded on 31 March 2016.
As at 31 March 2017, total financial liabilities amounted to EUR 456.3m,
showing an increase of EUR 36.2m in comparison to Q1 2016 and reflecting the ever growing centralisation of Group’s financial debt management through the parent company. As for the maturity structure of financial liabilities,
57.3% refer to non-current sources whereby the remaining stake represents current sources. Compared to the same period in 2016, the maturity structure worsened by 0.9 p.p.
As at 31 March 2017, net financial liabilities (measured as the difference
between total financial liabilities and cash and cash equivalents) amounted to EUR 454.7m and indicate an increase of EUR 36.4m over the Q1 2016 balance.
EUR 60.4m of negative cash flows from operating and investing activities were incurred in the first quarter of 2017, which is EUR 16.6m less than in the same period last year. The negative cash flow corresponds to the interim dynamics since the cash flow is always worse in the first months of the year in view of its seasonal component.
Investments amounted to EUR 8.1m in the first quarter of 2017. Overall
investments in property, plant and equipment amounted to EUR 4.3m, the largest portion thereof in the amount of EUR 3.9m refers to investments in technological equipment, mostly for developing new products. As for the total investments structure, whereby EUR 3.8m refers to non-material investments which comprise capitalised costs of developing new products.

Unaudited Consolidated Financial Statements January-March 2017
20
OWNERSHIP STRUCTURE AND THE GRVG SHARE
OWNERSHIP STRUCTURE
As at 31 March 2017, 12,912 shareholders were entered in the share register,
indicating that the number of shareholders declined by 3.7% over the year-end balance of 2016 (13,415).
Gorenje's ten major shareholders and owners
Ten major shareholders No. of shares (31 Mar 2017)
Share in %
KAPITALSKA DRUŽBA, D.D. 3,998,653 16.37%
INTERNATIONAL FINANCE CORPORATION 2,881,896 11.80%
PANASONIC CORPORATION 2,623,664 10.74%
KDPW – FIDUCIARY ACCOUNT 1,889,632 7.74%
HOME PRODUCTS EUROPE B.V. 1,221,231 5.00%
RAIFFEISEN BANK AUSTRIA D.D. – FIDUCIARY ACCOUNT 1,125,573 4.61%
ZAGREBAČKA BANKA D.D. – FIDUCIARY ACCOUNT 881,667 3.61%
BNP PARIBAS SECURITIES SERVICES S.C.A. 825,379 3.38%
Alpen.SI, mixed flexible sub-fund 713,208 2.92%
AUERBACH GRAYSON & COMPANY LLC 647,165 2.65%
Total major shareholders 16,808,068 68.82%
Treasury shares 121,311 0.50%
Other shareholders 7,495,234 30.68%
Total 24,424,613 100%
Ownership structure as at 31 March 2016 Ownership structure as at 31 March 2017
The number of own shares or treasury shares equals the 2016 year-end balance i.e. at 121,311 treasury shares, which accounts for 0.4967% of total share capital.
The number of shares held by Supervisory Board and Management Board members
Supervisory Board 31 Mar 2016 31 Mar 2017
Total: 3,508 0.0144% 3,570 0.0147%
Peter Kobal 1,355 0.0055% 1,355 0.0055%
Krešimir Martinjak 115 0.0005% 115 0.0005%
Jurij Slemenik 2,038 0.0083% 2,038 0.0083%
Miha Košak 62 0.0003% 62 0.0003%
Kapitalska družba, d. d.
16.37%
IFC 11.80%
Panasonic10.74%KDPW -
Fiduciary account8.05%
Other financial investors 36.91%
Individuals12.38%
Employees3.25%
Treasury shares0.50%
Kapitalska družba, d. d.
16.37%
IFC 11.80%
Panasonic10.74%
KDPW -Fiduciary account7.74%
Other financial investors 38.74%
Individuals11.27%
Employees2.84%
Treasury shares0.50%
Unaudited Consolidated Financial Statements January-March 2017
21
Management Board 31 Mar 2016 31 Mar 2017
Total: 20,944 0.08575% 13,804 0.00566%
Franc Bobinac 4,096 0.0168% 4,096 0.0168%
Branko Apat 626 0.0026% 626 0.0026%
Drago Bahun 9,082 0.0372% 9,082 0.0372%
Peter Groznik 7,140 0.0292%
The number of the company's shares held by Supervisory Board members has not changed in the period from 31 March 2017 to the date of this public announcement. Since 28 February 2017, Peter Groznik no longer acts as Management Board member for corporate finance and the business segment of ecology, trade and industrial services, hence the total sum of shares owned as at 31 March 2017 by the Management Board declined to 13,804 shares.
In the period from 31 March 2017 to the date of this public announcement, the number of shares owned by the parent company’s Management Board changed as Žiga Debeljak, who owns 9,044 shares, took over as Management Board member on 1 May 2017 and is in charge of activities of CFO and ETIS business; the total sum of shares owned by the Management Board grew consequently by 9,044 shares i.e. to 22,848 shares.
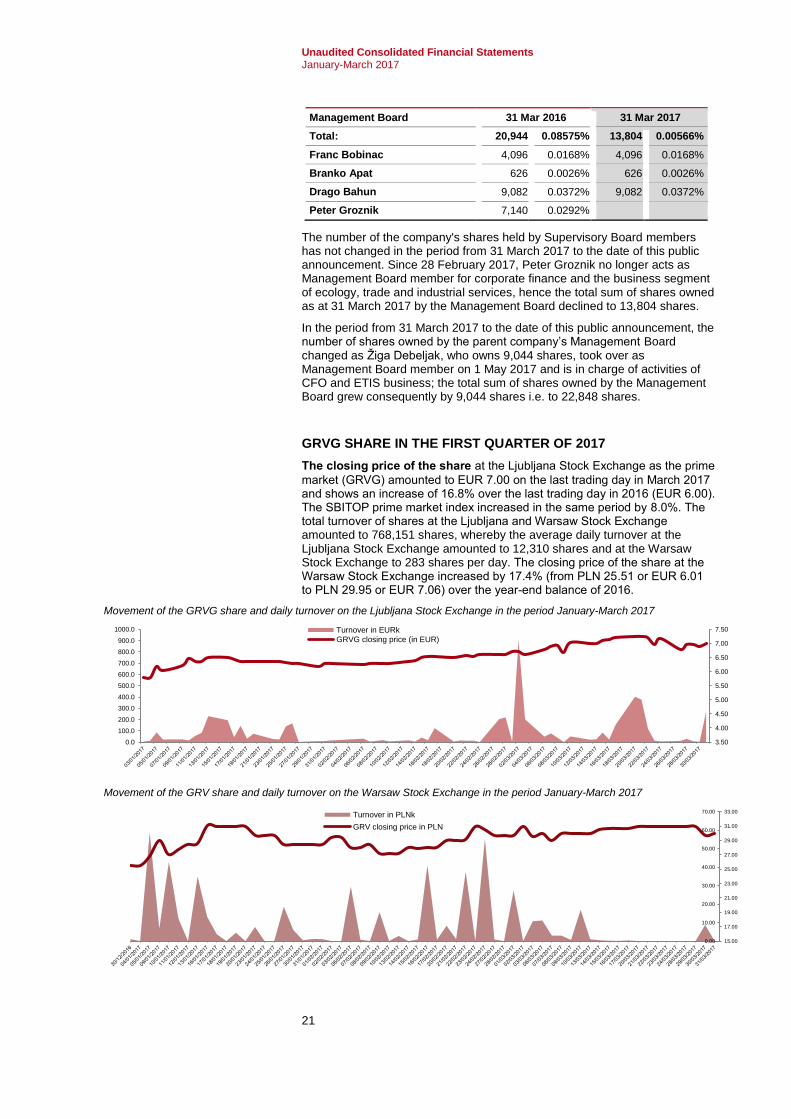
GRVG SHARE IN THE FIRST QUARTER OF 2017
The closing price of the share at the Ljubljana Stock Exchange as the prime
market (GRVG) amounted to EUR 7.00 on the last trading day in March 2017 and shows an increase of 16.8% over the last trading day in 2016 (EUR 6.00). The SBITOP prime market index increased in the same period by 8.0%. The total turnover of shares at the Ljubljana and Warsaw Stock Exchange amounted to 768,151 shares, whereby the average daily turnover at the Ljubljana Stock Exchange amounted to 12,310 shares and at the Warsaw Stock Exchange to 283 shares per day. The closing price of the share at the Warsaw Stock Exchange increased by 17.4% (from PLN 25.51 or EUR 6.01 to PLN 29.95 or EUR 7.06) over the year-end balance of 2016.
Movement of the GRVG share and daily turnover on the Ljubljana Stock Exchange in the period January-March 2017
Movement of the GRV share and daily turnover on the Warsaw Stock Exchange in the period January-March 2017
3.50
4.00
4.50
5.00
5.50
6.00
6.50
7.00
7.50
0.0
100.0
200.0
300.0
400.0
500.0
600.0
700.0
800.0
900.0
1000.0 Turnover in EURk
GRVG closing price (in EUR)
15.00
17.00
19.00
21.00
23.00
25.00
27.00
29.00
31.00
33.00
0.00
10.00
20.00
30.00
40.00
50.00
60.00
70.00Turnover in PLNk
GRV closing price in PLN

Unaudited Consolidated Financial Statements January-March 2017
22
Basic and diluted earnings per share are calculated as the ratio between
the profit or loss of the parent company’s owners and the average number of shares issued, less the average balance of treasury shares (24,303,302 shares), amounts to EUR 0.08 (2016: EUR 0.33).
The book value of the GRVG share as at 31 March 2017 amounted to EUR
15.10 (EUR 15.40 as at 31 December 2016). It is calculated as the ratio between the book value of capital of Gorenje, d.d., and the number of issued shares, exclusive of the number of treasury shares as at 31 March 2017 (24,303,302 shares).
The ratio between the market value and the book value of the GRVG share is recorded at 0.46 (0.29 as at 31 December 2016).
SIGNIFICANT EVENTS AFTER THE BALANCE SHEET DATE
In the industrial premises of the Gorenje affiliated company Kemis, d. o. o., which is also a location for storage of hazardous waste, fire spread on 15 May 2017 at around 8 p.m. The waste which is stored at the location and intended for further processing, is categorized as hazardous waste, mainly fuels, waste oil, solvents and medicinal products. The fire, which has been extinguished during the night with great efforts of the firemen, has destroyed part of the business premises and the warehouse for storage of low hazardous solid and liquid waste. The warehouse was built in 2009 in compliance with requirements defined in most strict standards related to management of hazardous wastes. The company has all the required permits for operation. The cause of fire is yet to be determined during the investigation, while we have already contacted our insurance house to launch the procedures for damage estimation.
The company Gorenje d.d., Velenje issued on May 11, 2017 5-year corporate notes with a fixed interest rate of 2.45% p.a. and total nominal value of EUR 19.5 million. The notes were issued in dematerialized form by registration to the note holders' accounts with the KDD (Central Securities Clearing Corporation d.d., Ljubljana), in compliance with the KDD rules. In the first offering, the notes were subscribed and paid up by 63 investors.
As at 21 April 2017, the Supervisory Board confirmed the annual report of the Gorenje Group and the parent company for the fiscal year 2016, which was compiled on accordance with the Global Reporting Initiative, the G4 version, and observes the selected principles and elements of the overall reporting, in compliance with the guidelines of the International Integrated Reporting Council (IIRC). The Supervisory Board appointed Žiga Debeljak as the new Management Board member to take over the activities of CFO and ETIS business. He assumed the new function on 1 May 2017 with a mandate that expires on 19 July 2018. In addition, members of the Supervisory Board were informed about founding the GRVG Shareholders Association. The Supervisory Board supports the activities of Gorenje's small shareholders in terms of enhanced information transparency.
As at 10 April 2017, Gorenje, d.d. received a statement of resignation from the Supervisory Board member Toshibumi Tanimoto. He acted as Gorenje's Supervisory Board member since 20 July and resigned due to health reasons. His mandate was terminated during the Supervisory Board's session on 21 April 2017.
No other significant events occurred after the date of compiling the balance sheet as of 31 March 2017.

Unaudited Consolidated Financial Statements January-March 2017
23
SIGNIFICANT BUSINESS EVENTS IN 2017
JANUARY
Admission of commercial paper GRV05 issued by Gorenje, d.d., to trading on the regulated market
As of 31 January 2017, Gorenje, d.d. successfully completed the offering of commercial paper. The commercial paper with the identification code GRV05 has a 1.30% interest rate. The total par value of the issue amounts to EUR 40.0m. The purpose of the commercial paper issue is to diversify the short-term financing sources, financing of operations with a pronounced seasonal dynamic, and optimisation of financing costs.
FEBRUARY
Gorenje once again the best foreign brand produced in Serbia
For the twelfth year in a row, the Serbian Chamber of Commerce, and the Ministry of Commerce, Tourism, and Telecommunication, selected in the campaign titled "The Best from Serbia" the best brands and companies as rated based on their financial and market achievements. Gorenje was once again found the best
foreign brand made in Serbia. The sign "The Best from Serbia" is a symbol of quality and trust from both the customers and business partners. "For Gorenje, this proves that the customers have recognized the innovation, modern technology, quality, and reliability of our appliances, as well as the comprehensive service that we provide through our after-sales services, and by which we have been building their trust for many years," stresses Gorenje Belgrade managing director Stanka Pejanović.
Gorenje a proud sponsor of the Slovenian Nordic Ski Team for 25 years
This year, Gorenje celebrates a quarter century of partnership with the Slovenian Nordic Ski Teams – ski jumpers, cross-country skiers, and the Nordic combined team. Years of general sponsorship have turned into an inspiring and honest friendship as today's sports champions grew up at their clubs with Gorenje by their side through all their ups and downs. With consistent support through all the years, we made it possible for Slovenian ski jumping and cross-country skiing to be at the very top in the world today. To commemorate 25 years of our cooperation with the Nordic Ski Team, Gorenje is preparing a travelling exhibition and many promotional activities. Moreover, we
will again invite the buyers of our products to the grand finale of the ski jumping season in Planica.
Resignation of a Management Board member
As of 28 February 2017, Dr. Peter Groznik resigned as Management Board member and tendered his resignation by mutual agreement and consensus of the Supervisory Board. Until the appointment of a new Board member, the

Unaudited Consolidated Financial Statements January-March 2017
24
activities of CFO and ETIS business will be managed by Jožica Turk, Executive Vice President Corporate Finance.
MARCH
Gorenje donates a cooking hob adapted for blind and partially sighted persons
Gorenje Group's donation will allow students of the Iris Centre for Education, Rehabilitation, Inclusion and Counselling for the Blind and Partially Sighted to safely cook, which is an important step on their path to living an independent life. The cooking hob of our premium Atag brand, fitted with specially adapted silicone coating that allows safe use for the blind and visually impaired, is the first of its kind in Slovenia. Humanitarian efforts are an integral part of Gorenje Group's corporate social responsibility, and we are looking to assist those in need both in Slovenia and in other countries of our presence by donating appliances and funds, and by taking part in humanitarian projects.
ASKO holds a glamorous Pro Home Laundry launch in Stockholm
Gorenje Group's premium brand ASKO, a Scandinavian specialist in high quality kitchen and laundry appliances, announced the launch of its new laundry products, ASKO Pro Home Laundry.
Creating the new Pro Home Laundry series ASKO applied the user-centred design development process, translating and implementing it into the user interface of the new laundry products. By using key insights obtained from hours of consumer interviews and observational studies, the ASKO Pro Home Laundry range of washing machines and tumble dryers therefore deliver both: premium design and functionality. ASKO washers compared to competitors’ have unique features – Steel Seal and the Quattro Construction, with addition of a premium look and feel as ASKO uses steel where competitors use plastic.
Unaudited Consolidated Financial Statements January-March 2017
25
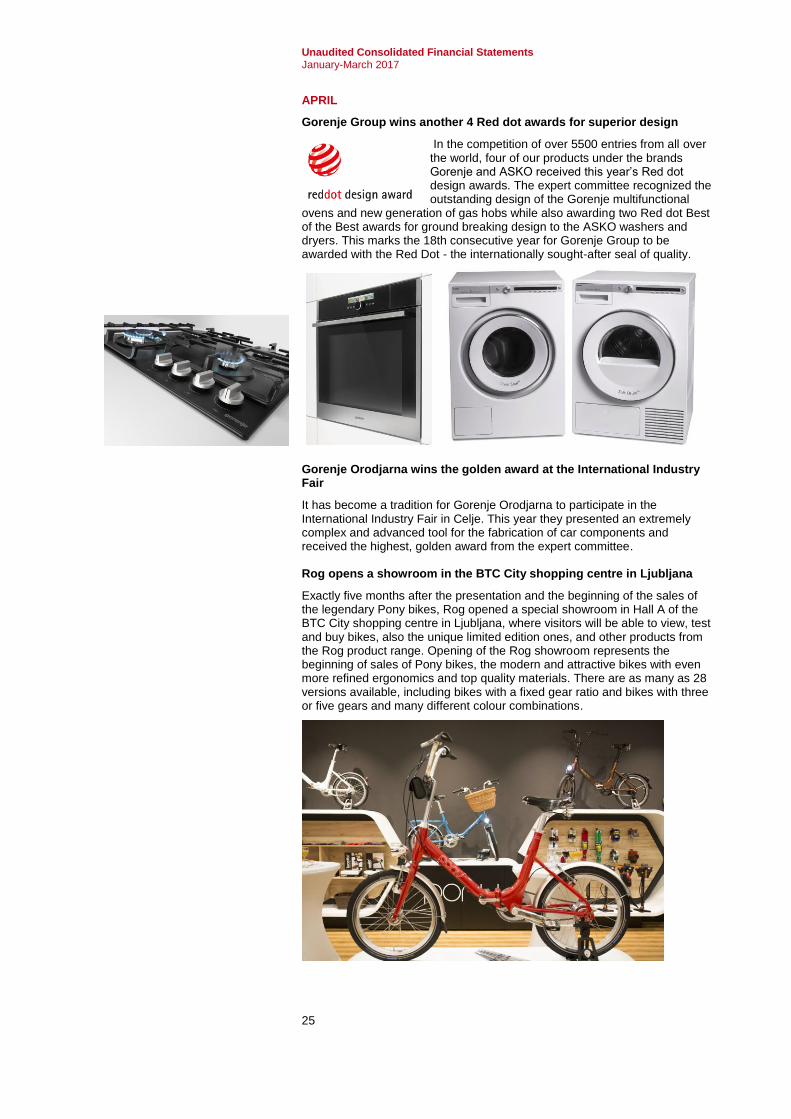
APRIL
Gorenje Group wins another 4 Red dot awards for superior design
In the competition of over 5500 entries from all over the world, four of our products under the brands Gorenje and ASKO received this year’s Red dot design awards. The expert committee recognized the outstanding design of the Gorenje multifunctional
ovens and new generation of gas hobs while also awarding two Red dot Best of the Best awards for ground breaking design to the ASKO washers and dryers. This marks the 18th consecutive year for Gorenje Group to be awarded with the Red Dot - the internationally sought-after seal of quality.
Gorenje Orodjarna wins the golden award at the International Industry Fair
It has become a tradition for Gorenje Orodjarna to participate in the International Industry Fair in Celje. This year they presented an extremely complex and advanced tool for the fabrication of car components and received the highest, golden award from the expert committee. Rog opens a showroom in the BTC City shopping centre in Ljubljana
Exactly five months after the presentation and the beginning of the sales of the legendary Pony bikes, Rog opened a special showroom in Hall A of the BTC City shopping centre in Ljubljana, where visitors will be able to view, test and buy bikes, also the unique limited edition ones, and other products from the Rog product range. Opening of the Rog showroom represents the beginning of sales of Pony bikes, the modern and attractive bikes with even more refined ergonomics and top quality materials. There are as many as 28 versions available, including bikes with a fixed gear ratio and bikes with three or five gears and many different colour combinations.

Unaudited Consolidated Financial Statements January-March 2017
26
ACCOUNTING REPORT
Reporting entity
Gorenje, d.d., is a company headquartered in Slovenia. The address of the registered head office is at Partizanska 12, SI-3320 Velenje.
Consolidated financial statements of Gorenje, d.d., for the period January-March that ended 31 March 2017 include the parent company and its subsidiaries (hereinafter jointly referred to as 'the Group'), equity interests in jointly controlled companies, and equity interests in associated companies. The Group's core activity is manufacturing and sale of home appliances.
Basis of preparation
(a) Statement of compliance
Consolidated interim financial statements are compiled pursuant to IAS 34 – Interim Financial Reporting, and pursuant to provisions of the Companies Act. The financial statements do not include all information required by the entire IFRSs. The selected explanatory information is included in the report in order to clarify the business events and transactions material for the understanding of the changes in the financial position and income or results of the Gorenje Group in the period since the compilation of the latest annual consolidated financial statements.
The Management Board of Gorenje, d.d., confirmed these interim financial statements on 3 May 2017.
(b) Use of estimates and judgements
In the course of drawing up these interim financial statements, the company management made judgements, estimates, and assumptions that affect the application of accounting policies and the reported amounts of assets, liabilities, income and expenses. Actual results may differ from these estimates.
Material estimates of uncertainty and critical judgements or evaluations made by the management in the process of pursuing the accounting policies, which have the strongest effect on the amounts in the financial statements are similar to those used by the management when drawing up the consolidated financial statements as at 31 December 2016.
Fundamental Accounting Policies and Significant Notes to the Financial Statements
Accounting policies applied in these interim financial statements are in material aspects identical to those used in the consolidated financial statements compiled as at 31 December 2016.
Comparable information is in a material scope harmonised with the presentation of information during the current year. Where necessary, comparable information was adjusted in such a way that it matched the presentation of information for the current year.

Unaudited Consolidated Financial Statements January-March 2017
27
Changes in the Composition of the Gorenje Group
Changes that occurred in the composition of the Gorenje Group up to and including 31 March 2017 were as follows:
as at 1 January 2017, the company Gorenje Studio, d.o.o., Ljubljana, was merged with the company Gorenje GSI, d.o.o., Ljubljana.
as at 1 January 2017, the company Gorenje Studio, d.o.o., Serbia, was merged with the company Gorenje, d.o.o., Serbia.
In addition to the parent company Gorenje, d.d., the following companies were included in the consolidated financial statements of the Gorenje Group:
Companies operating in Slovenia Equity
interest in %
Business segment
1. Gorenje I.P.C., d.o.o., Velenje 100.00 CAH
2. Gorenje GTI, d.o.o., Velenje 100.00 NCA
3. Gorenje Gostinstvo, d.o.o., Velenje 100.00 NCA
4. Energygor, d.o.o., Velenje 100.00 NCA
5. Kemis, d.o.o., Vrhnika 100.00 NCA
6. Gorenje Orodjarna, d.o.o., Velenje 100.00 NCA
7. ZEOS, d.o.o., Ljubljana 51.00 NCA
8. Gorenje Surovina, d.o.o., Maribor 100.00 NCA
9. Indop, d.o.o., Šoštanj 100.00 NCA
10. ERICo, d.o.o., Velenje 51.00 NCA
11. Gorenje GAIO, d.o.o., Šoštanj 100.00 NCA
12. Gorenje GSI, d.o.o., Ljubljana 100.00 CAH
13. Gorenje Keramika, d.o.o., Velenje 100.00 NCA
14. Gorenje EKOINVEST, d.o.o., Velenje 100.00 NCA
15. Gorenje HS, d.o.o., Velenje 65.00 NCA
Foreign operations Equity
interest in %
Business segment
1. Gorenje Beteiligungs GmbH, Austria 100.00 CAH
2. Gorenje Austria Handels GmbH, Austria 100.00 CAH
3. Gorenje Vertriebs GmbH, Germany 100.00 CAH
4. Gorenje Körting Italia S.r.l., Italy 100.00 CAH
5. Gorenje France S.A.S., France 100.00 CAH
6. Gorenje Espana, S.L., Spain 100.00 CAH
7. Gorenje UK Ltd., Great Britain 100.00 CAH
8. Gorenje Group Nordic A/S, Denmark 100.00 CAH
9. Gorenje spol. s r.o., Czech Republic 100.00 CAH
10. Gorenje real spol. s r.o., Czech Republic 100.00 CAH
11. Gorenje Slovakia s.r.o., Slovakia 100.00 CAH
12. Gorenje Magyarország Kft., Hungary 100.00 CAH
13. Gorenje Polska Sp. z o.o., Poland 100.00 CAH
14. Gorenje Bulgaria EOOD, Bulgaria 100.00 CAH

Unaudited Consolidated Financial Statements January-March 2017
28
15. Gorenje Zagreb, d.o.o., Croatia 100.00 CAH
16. Gorenje Skopje, d.o.o., Macedonia 100.00 CAH
17. Gorenje Commerce, d.o.o., Bosnia and Herzegovina 100.00 CAH
18. Gorenje, d.o.o., Serbia 100.00 CAH
19. Gorenje Podgorica , d.o.o., Montenegro 99.975 CAH
20. Gorenje Romania S.r.l., Romania 100.00 CAH
21. Gorenje aparati za domaćinstvo, d.o.o., Serbia 100.00 CAH
22. Mora Moravia s r.o., Czech Republic 100.00 CAH
23. Gorenje - kuchyně spol. s r.o., Czech Republic 100.00 CAH
24. KEMIS-Termoclean, d.o.o., Croatia 100.00 NCA
25. Kemis - BH, d.o.o., Bosnia and Herzegovina 100.00 NCA
26. Gorenje Gulf FZE, United Arab Emirates 100.00 CAH
27. Gorenje Tiki, d.o.o., Serbia 100.00 CAH
28. Gorenje Istanbul Ltd., Turkey 100.00 CAH
29. Gorenje TOV, Ukraine 100.00 CAH
30. ST Bana Nekretnine, d.o.o., Serbia 100.00 NCA
33. Kemis Valjevo, d.o.o, Serbia 100.00 NCA
32. ATAG Nederland BV, the Netherlands 100.00 CAH
33. ATAG België NV, Belgium 100.00 CAH
34. Intell Properties BV, the Netherlands 100.00 CAH
35. Gorenje Nederland BV, the Netherlands 100.00 CAH
36. Gorenje Kazakhstan, TOO, Kazakhstan 100.00 CAH
37. OOO Gorenje BT, Russia 100.00 CAH
38. Gorenje GTI, d.o.o., Beograd, Serbia 100.00 NCA
39. Asko Appliances AB, Sweden 100.00 CAH
40. Gorenje North America, Inc., USA 100.00 CAH
41. Asko Appliances Pty, Australia 100.00 CAH
42. Asko Appliances OOO, Russia 100.00 CAH
43. »Gorenje Albania« SHPK, Albania 100.00 CAH
44. Gorenje Home d.o.o., Zaječar, Serbia 100.00 CAH
45. Gorenje Ekologija, d.o.o., Stara Pazova, Serbia 100.00 NCA
46. Gorenje Corporate GmbH, Austria 100.00 CAH
47. Cleaning system S, d.o.o., Serbia 100.00 NCA
48. ZEOS eko-sistem d.o.o., Bosnia and Herzegovina 49.45 NCA
49. Gorenje do Brasil Ltda., Brasil 100.00 CAH
50. Gorenje Asia Ltd., China 100.00 CAH
51. Gorenje MDM d.o.o. Kragujevac, Serbia 100.00 NCA
52. Gorenje Chile SpA, Chile 100.00 CAH
53. Gorenje AEC, LLC, Thailand 100.00 CAH
54. INDOP GORENJE GmbH, Germany 100.00 NCA
55. Novi Elind, d.o.o., Serbia 100.00 CAH
CAH –Core activity Home NCA – Non-core activities
Unaudited Consolidated Financial Statements January-March 2017
29
Associates:
Gorenje Projekt, d.o.o., Velenje
GGE, d.o.o., Ljubljana
Gorenje Projekt, d.o.o., Serbia
EKON ELEKTRON, d.o.o., Macedonia
K.Tivoli, d.o.o., Ljubljana
GGE EOL, d.o.o., Ljubljana (inactive)
GGE, d.o.o., Croatia
GGE Montenegro, d.o.o., Montenegro
GGE Bulgaria OOD, Bulgaria
GGE Netherlands B.V., the Netherlands
GOR Kolesa, d.o.o., Velenje
GGE ESCO, d.o.o., Serbia
Representative offices of Gorenje, d.d., abroad:
in Kiev (Ukraine),
in Almaty (Kazakhstan), and
in Kishinev (Moldova).

Unaudited Consolidated Financial Statements January-March 2017
30
Unaudited Condensed Consolidated Financial Statements of the Gorenje Group
Condensed Consolidated Balance Sheet of the Gorenje Group
EURk Balance at
31 Mar 2016 %
Balance at 31 Dec 2016
% Balance at
31 Mar 2017 %
ASSETS 1,110,938 100.0% 1,131,829 100.0% 1,162,458 100.0%
Non-current assets 610,365 55.0% 637,181 56.3% 636,241 54.7%
Intangible assets 198,425 17.9% 208,872 18.4% 211,273 18.2%
Property, plant and equipment 361,769 32.6% 375,709 33.2% 374,094 32.2%
Investment property 16,624 1.5% 14,957 1.3% 13,803 1.2%
Non-current investments 2,941 0.3% 6,563 0.6% 6,475 0.5%
Investments in associates 1,433 0.1% 2,945 0.3% 2,844 0.2%
Non-current trade receivables 4,796 0.4% 2,481 0.2% 2,547 0.2%
Deferred tax assets 24,377 2.2% 25,654 2.3% 25,205 2.2%
Current assets 500,573 45.0% 494,648 43.7% 526,217 45.3%
Non-current assets held for sale 310 0.0% 314 0.0% 318 0.0%
Inventories 238,129 21.4% 225,954 20.0% 250,062 21.5%
Current investments 13,561 1.2% 8,821 0.8% 10,668 0.9%
Trade receivables 177,602 16.0% 165,786 14.6% 191,294 16.5%
Other current assets 48,624 4.4% 58,531 5.2% 51,791 4.5%
Cash and cash equivalents 22,347 2.0% 35,242 3.1% 22,084 1.9%
EQUITY AND LIABILITIES 1,110,938 100.0% 1,131,829 100.0% 1,162,458 100.0%
Equity 366,865 33.0% 374,238 33.1% 379,023 32.6%
Share capital 101,922 9.2% 101,922 9.0% 101,922 8.8%
Share premium 174,502 15.7% 174,502 15.4% 174,502 15.0%
Revenue reserves 99,301 8.9% 46,015 4.1% 46,015 4.0%
Treasury shares -3,170 -0.3% -3,170 -0.3% -3,170 -0.3%
Retained earnings 2,421 0.2% 63,152 5.6% 65,130 5.6%
Translation reserve -19,080 -1.7% -17,071 -1.5% -14,259 -1.2%
Fair value reserve 7,728 0.7% 6,724 0.6% 6,779 0.5%
Equity of holders of the parent 363,624 32.7% 372,074 32.9% 376,919 32.4%
Equity of non-controlling interests
3,241 0.3% 2,164 0.2% 2,104 0.2%
Non-current liabilities 335,776 30.2% 350,687 31.0% 358,491 30.8%
Provisions 61,418 5.5% 64,143 5.7% 64,293 5.5%
Deferred income 5,298 0.5% 5,037 0.4% 5,088 0.4%
Non-current operating liabilities 3,650 0.3% 3,672 0.3% 3,443 0.3%
Deferred tax liabilities 2,587 0.2% 2,219 0.2% 2,210 0.2%
Non-current financial liabilities 262,823 23.7% 275,616 24.4% 283,457 24.4%
Current liabilities 408,297 36.8% 406,904 35.9% 424,944 36.6%
Current financial liabilities 155,403 14.0% 101,226 8.9% 146,657 12.6%
Trade payables 169,092 15.2% 223,725 19.8% 181,608 15.7%
Other current liabilities 83,802 7.6% 81,953 7.2% 96,679 8.3%

Unaudited Consolidated Financial Statements January-March 2017
31
Condensed Consolidated Income Statement of the Gorenje
Group
EURk Jan-Mar % Jan-Mar %
2016 2017
Revenue 285,461 94.3% 305,673 93.7%
Change in inventories 10,807 3.6% 15,291 4.7%
Other operating income 6,365 2.1% 5,314 1.6%
Gross profit 302,633 100.0% 326,278 100.0%
Cost of goods, materials and services -222,401 -73.5% -240,757 -73.8%
Employee benefits expense -56,588 -18.7% -59,243 -18.2%
Amortisation and depreciation expense -11,710 -3.9% -12,770 -3.9%
Other operating expenses -5,168 -1.7% -5,653 -1.7%
Operating profit 6,766 2.2% 7,855 2.4%
Finance income 2,132 0.7% 2,513 0.8%
Finance expenses -7,230 -2.4% -5,994 -1.9%
Net finance expenses -5,098 -1.7% -3,481 -1.1%
Share in profits or losses in associates -34 0.0% -101 0.0%
Profit before tax 1,634 0.5% 4,273 1.3%
Income tax expense -1,064 -0.3% -2,222 -0.7%
Profit for the period 570 0.2% 2,051 0.6%
Attributable to non-controlling interests 92 0.0% 73 0.0%
Attributable to equity holders of the parent 478 0.2% 1,978 0.6%
Basic and diluted earnings per share (in EUR) 0.02 0.08
Condensed Consolidated Statement of Other Comprehensive
Income of the Gorenje Group
EURk Jan-Mar Jan-Mar
2016 2017
Profit or loss for the period 570 2,051
Other comprehensive income
Items that will not be reclassified subsequently to profit or loss 0 0
Change in fair value of land
Items that may be reclassified subsequently to profit or loss -1,788 2,867
Net change in fair value of available-for-sale financial instruments -9 -2
Effective portion of changes in gains and losses from hedging instruments in cash flow hedges
-2,033 10
Effective portion of changes in gains and losses from hedging instruments on cash flow hedges, reclassified to profit or loss
75 100
Income tax on other comprehensive income 210 -53
Translation reserve -31 2,812
Other comprehensive income for the period -1,788 2,867
Total comprehensive income for the period -1,218 4,918
Attributable to equity holders of the parent 92 73
Attributable to non-controlling interests -1,310 4,845

Unaudited Consolidated Financial Statements January-March 2017
32
Condensed Consolidated Statement of Cash Flows of the
Gorenje Group
EURk Jan-Mar Jan-Mar
2016 2017
A. CASH FLOWS FROM OPERATING ACTIVITIES
Profit or loss for the period 570 2,051
Adjustments for:
-Depreciation of property, plant and equipment 9,496 10,144
-Amortisation of intangible assets 2,214 2,626
-Investment income -2,132 -2,513
-Finance expenses 7,264 5,994
-Gain on sale of property, plant and equipment 5 -670
-Income tax expense 1,064 2,222
Operating profit before changes in net operating current assets and provisions 18,481 19,854
Change in trade and other receivables -14,679 -18,479
Change in inventories -12,223 -24,108
Change in provisions -903 201
Change in trade and other payables -43,230 -27,676
Cash generated from operations -71,035 -70,062
Interest paid -3,874 -3,351
Income tax paid -691 -1,196
Net cash from operating activities -57,119 -54,755
B. CASH FLOWS FROM INVESTING ACTIVITIES
Proceeds from sale of property, plant and equipment 533 3,446
Interest received 158 167
Dividends received -34 49
Acquisition of property, plant and equipment -6,742 -9,911
Other investments 2,671 -1,854
Acquisition of intangible assets -4,932 -4,840
Net cash used in investing activities -8,346 -12,943
C. CASH FLOWS FROM FINANCING ACTIVITIES
Borrowings/Repayment of borrowings 56,202 54,540
Net cash used in financing activities 56,202 54,540
Net change in cash and cash equivalents -9,263 -13,158
Cash and cash equivalents at beginning of period 31,610 35,242
Cash and cash equivalents at end of period 22,347 22,084

Unaudited Consolidated Financial Statements January-March 2017
33
Condensed Consolidated Statement of Change in Equity of the Gorenje Group
EURk Share capital
Share premium
Revenue reserves
Treasury shares
Retained earnings or losses
Translation reserve
Fair value reserve
Equity holders of the parent
Non-controlling interests
Total Legal reserves
Statutory reserves
Treasury share reserve
Other revenue reserves
Profit or loss from previous periods
Profit or loss for the period
Opening balance at 1 Jan 2016
101,922 174,502 12,896 7,556 3,170 75,679 -3,170 6,145 -4,202 -19,049 9,485 364,934 3,128 368,062
Total comprehensive income for the period
Profit or loss for the period 478 478 92 570
Total other comprehensive income
-31 -1,757 -1,788 0 -1,788
Total comprehensive income for the period
0 0 0 0 0 0 0 0 478 -31 -1,757 -1,310 92 -1,218
Transactions with owners (when acting as owners) recognised directly in equity
Contributions by owners and distribution to owners Transfer of profit or loss from previous period to retained earnings or losses
-4,202 4,202 0 0
Total contributions by owners and distributions to owners
0 0 0 0 0 0 0 -4,202 4,202 0 0 0 0 0
Change in equity interests in subsidiaries that do not result in a loss of control
Change in equity interests 0 21 21
Total changes in equity interests in subsidiaries
0 0 0 0 0 0 0 0 0 0 0 0 21 21
Total transactions with owners
0 0 0 0 0 0 0 -4,202 4,202 0 0 0 21 21
Closing balance at 31 Mar 2016
101,922 174,502 12,896 7,556 3,170 75,679 -3,170 1,943 478 -19,080 7,728 363,624 3,241 366,865

Unaudited Consolidated Financial Statements January-March 2017
34
EURk Share capital
Share premium
Revenue reserves
Treasury shares
Retained earnings or losses
Translation reserve
Fair value reserve
Equity holders of the parent
Non-controlling interests
Total Legal reserves
Statutory reserves
Treasury share reserve
Other revenue reserves
Profit or loss from previous periods
Profit or loss for the period
Opening balance at 1 Jan 2017
101,922 174,502 12,896 7,919 3,170 22,030 -3,170 55,592 7,560 -17,071 6,724 372,074 2,164 374,238
Total comprehensive income for the period
Profit or loss for the period 1,978 1,978 73 2,051
Total other comprehensive income
2,812 55 2,867 0 2,867
Total comprehensive income for the period
0 0 0 0 0 0 0 0 1,978 2,812 55 4,845 73 4,918
Transactions with owners (when acting as owners) recognised directly in equity
Contributions by owners and distribution to owners Transfer of profit or loss from previous period to retained earnings or losses
7,560 -7,560 0 0
Total contributions by owners and distributions to owners
0 0 0 0 0 0 0 7,560 -7,560 0 0 0 0 0
Change in equity interests in subsidiaries that do not result in a loss of control
Change in equity interests 0 -133 -133
Total changes in equity interests in subsidiaries
0 0 0 0 0 0 0 0 0 0 0 0 -133 -133
Total transactions with owners
0 0 0 0 0 0 0 7,560 -7,560 0 0 0 -133 -133
Closing balance at 31 Mar 2017
101,922 174,502 12,896 7,919 3,170 22,030 -3,170 63,152 1,978 -14,259 6,779 376,919 2,104 379,023

Unaudited Consolidated Financial Statements January-March 2017
35
Notes to the Condensed Consolidated Financial Statements of
the Gorenje Group
Fair Value
Fair values and book values of assets and liabilities
EURk Book value Fair value Book value Fair value
31 Dec 2016 31 Dec 2016 31 Mar 2017 31 Mar 2017
Available-for-sale investments 2,247 2,247 2,225 2,225
Land and investment property 53,608 53,608 52,006 52,006
Non-current loans and deposits 2,403 2,403 2,388 2,388
Non-current trade receivables 2,481 2,481 2,547 2,547
Current loans and deposits 5,931 5,931 7,934 7,934
Derivatives -2,509 -2,509 -1,438 -1,438
Trade receivables 165,786 165,786 191,294 191,294
Other current assets 47,333 47,333 41,988 41,988
Cash and cash equivalents 35,242 35,242 22,084 22,084
Non-current financial liabilities (variable interest rate)
-183,758 -183,758 -191,586 -191,586
Non-current financial liabilities (fixed interest rate) -91,858 -81,917 -91,871 -82,524
Non-current operating liabilities -3,672 -3,672 -3,443 -3,443
Current financial liabilities -98,201 -98,201 -144,900 -144,900
Trade payables -223,725 -223,725 -181,608 -181,608
Other current payables -44,420 -44,420 -45,827 -45,827
Total -333,112 -323,171 -338,207 -328,860
Fair value scale
31 December 2016
EURk Level 15 Level 26 Level 37 Total
Available-for-sale financial assets 510 79 1,658 2,247 Derivatives – assets - 516 - 516
Derivatives – liabilities - -3,025 - -3,025 Land and investment property - - 53,608 53,608
31 March 2017
EURk Level 1 Level 2 Level 3 Total
Available-for-sale financial assets 509 82 1,634 2,225 Derivatives – assets - 320 - 320
Derivatives – liabilities - -1,758 - -1,758
Land and investment property - - 52,006 52,006
Related party transactions
Transaction value Balance
EURk Jan-Mar Jan-Mar 31 Mar
2016 31 Mar 2017 2016 2017
Revenue Gorenje Group companies 47 231 496 576
Costs Gorenje Group companies 36 480 41 1,173
5 Level 1: stock price (unadjusted) on the active market of identical assets and liabilities, 6 Level 2: data differing from stock price data (these are included in Level 1) monitored with the
intention of direct or indirect valuation of assets and liabilities, 7 Level 3: data on the value of assets and liabilities not based on the active market.

Unaudited Consolidated Financial Statements January-March 2017
36
Significant events after the balance sheet date
In the industrial premises of the Gorenje affiliated company Kemis, d. o. o., which is also a location for storage of hazardous waste, fire spread on 15 May 2017 at around 8 p.m. The waste which is stored at the location and intended for further processing, is categorized as hazardous waste, mainly fuels, waste oil, solvents and medicinal products. The fire, which has been extinguished during the night with great efforts of the firemen, has destroyed part of the business premises and the warehouse for storage of low hazardous solid and liquid waste. The warehouse was built in 2009 in compliance with requirements defined in most strict standards related to management of hazardous wastes. The company has all the required permits for operation. The cause of fire is yet to be determined during the investigation, while we have already contacted our insurance house to launch the procedures for damage estimation.
The company Gorenje d.d., Velenje issued on May 11, 2017 5-year corporate notes with a fixed interest rate of 2.45% p.a. and total nominal value of EUR 19.5 million. The notes were issued in dematerialized form by registration to the note holders' accounts with the KDD (Central Securities Clearing Corporation d.d., Ljubljana), in compliance with the KDD rules. In the first offering, the notes were subscribed and paid up by 63 investors.
As at 21 April 2017, the Supervisory Board confirmed the annual report of the Gorenje Group and the parent company for the fiscal year 2016, which was compiled on accordance with the Global Reporting Initiative, the G4 version, and observes the selected principles and elements of the overall reporting, in compliance with the guidelines of the International Integrated Reporting Council (IIRC). The Supervisory Board appointed Žiga Debeljak as the new Management Board member to take over the activities of CFO and ETIS business. He assumed the new function on 1 May 2017 with a mandate that expires on 19 July 2018. In addition, members of the Supervisory Board were informed about founding the GRVG Shareholders Association. The Supervisory Board supports the activities of Gorenje's small shareholders in terms of enhanced information transparency.
As at 10 April 2017, Gorenje, d.d. received a statement of resignation from the Supervisory Board member Toshibumi Tanimoto. He acted as Gorenje's Supervisory Board member since 20 July 2014 and resigned due to health reasons. His mandate was terminated during the Supervisory Board's session on 21 April 2017.
No other significant events occurred after the date of compiling the balance sheet as of 31 March 2017.

Unaudited Consolidated Financial Statements January-March 2017
37
Business and Geographical Segments of the Gorenje Group
EURk
Core activity Home Non-core activities Group
Jan-Mar Jan-Mar Jan-Mar Jan-Mar Jan-Mar Jan-Mar
2016 2017 2016 2017 2016 2017
Revenue from sales to third parties 242,721 250,873 42,740 54,800 285,461 305,673
Inter-segment sale 1,160 1,518 4,356 1,752 5,516 3,270
Interest income 140 111 18 56 158 167
Interest expenses -3,665 -3,184 -134 -67 -3,799 -3,251
Amortisation and depreciation expense -10,348 -11,492 -1,362 -1,278 -11,710 -12,770
Operating profit or loss before tax -412 1,033 2,046 3,240 1,634 4,273
Income tax expense -907 -1,917 -157 -305 -1,064 -2,222
Profit or loss for the period -1,319 -884 1,889 2,935 570 2,051
Total assets * 1,026,001 1,050,397 105,828 112,061 1,131,829 1,162,458
Total liabilities * 707,792 729,445 49,799 53,990 757,591 783,435
* Note: data used for 2016 were recorded as at 31 December 2016
EURk
Western Europe Eastern Europe Other Group
Jan-Mar Jan-Mar Jan-Mar Jan-Mar Jan-Mar Jan-Mar Jan-Mar Jan-Mar
2016 2017 2016 2017 2016 2017 2016 2017
Revenue from sales to the third parties
118.992 114,101 143,276 161,131 23,193 30,441 285,461 305,673

Unaudited Consolidated Financial Statements January-March 2017
38
Financial indicators
This report discloses financial statements prepared in accordance with International Financial Reporting Standards (IFRSs). In addition to these statements and notes, the report provides financial and other ratios as well as indicators that are earmarked for monitoring trends in the Gorenje Group's business operations. Following methodology is applied when calculating these ratios and indicators:
indicators referring to individual average categories of the balance sheet are calculated on the basis of the average balances of the reporting period and previous three quarters,
indicators referring to the income statement are categories disclosed on the annual level and taken into account the operations in the reporting period and the previous three quarters.
Jan-Mar Jan-Mar
2016 2017
INDICATORS OF PROFITABILITY
Net return on sales (ROS) 0.2% 0.7%
Return on assets (ROA) 3.3% 3.6%
Net return on equity (ROE) -1.5% 2.7%
ASSET INDICATORS
Asset turnover ratio 1.10 1.11
Inventory turnover ratio 5.16 5.27
Current trade receivables turnover ratio 6.51 6.71
INVESTMENT INDICATORS
Fixed assets (PPE) to total assets 0.50 0.50
Current assets to total assets 0.55 0.55
INDICATORS OF FINANCIAL COMPOSITION
Long-term coverage of non-current assets 1.15 1.16
Equity to total liabilities 0.33 0.33
Long-term to total liabilities 0.63 0.63
Equity to fixed assets (carrying value) 0.65 0.65
Quick ratio (liquid assets to current liabilities) 0.09 0.08
(Liquid assets + current receivables) to current liabilities 0.64 0.65
Current ratio 1.23 1.24
Net financial liabilities to equity 1.04 1.05
OPERATING PERFORMANCE INDICATORS
Operating income to operating expenses 1.02 1.02
Revenue per employee (EUR) 27,109 27,844
Value added per employee (EUR) 7,129 7,275

Unaudited Consolidated Financial Statements January-March 2017
39
Unaudited Condensed Financial Statements of Gorenje, d.d.
Condensed Balance Sheet of Gorenje, d.d.
EURk Balance at
31 Mar 2016 %
Balance at 31 Dec 2016
% Balance at
31 Mar 2017 %
ASSETS 951,590 100.0% 987,867 100.0% 1,008,596 100.0%
Non-current assets 520,570 54.7% 596,127 60.3% 596,414 59.1%
Intangible assets 47,267 5.0% 59,396 6.0% 61,852 6.1%
Property, plant and equipment 191,925 20.1% 205,416 20.8% 204,271 20.3%
Investment property 14,769 1.6% 12,948 1.3% 12,356 1.2%
Investments in subsidiaries 246,863 25.9% 295,745 29.9% 295,745 29.3%
Investments in associates 509 0.1% 2,064 0.2% 2,064 0.2%
Other non-current investments 1,690 0.2% 2,029 0.2% 2,075 0.2%
Deferred tax assets 17,547 1.8% 18,529 1.9% 18,051 1.8%
Current assets 431,020 45.3% 391,740 39.7% 412,182 40.9%
Inventories 94,128 9.9% 88,564 9.0% 100,420 10.0%
Current investments 169,854 17.8% 144,432 14.6% 146,622 14.5%
Trade receivables 154,388 16.2% 130,860 13.3% 149,707 14.8%
Other current assets 10,922 1.2% 13,141 1.3% 13,864 1.4%
Cash and cash equivalents 1,728 0.2% 14,743 1.5% 1,569 0.2%
EQUITY AND LIABILITIES 951,590 100.0% 987,867 100.0% 1,008,596 100.0%
Equity 359,192 37.7% 361,554 36.6% 364,922 36.2%
Share capital 101,922 10.7% 101,922 10.3% 101,922 10.1%
Share premium 156,639 16.5% 156,639 15.9% 156,639 15.5%
Revenue reserves 99,301 10.4% 46,015 4.6% 46,015 4.6%
Treasury shares -3,170 -0.3% -3,170 -0.3% -3,170 -0.3%
Retained earnings 1,305 0.1% 56,914 5.8% 60,056 6.0%
Fair value reserve 3,195 0.3% 3,234 0.3% 3,460 0.3%
Non-current liabilities 265,019 27.9% 276,592 28.0% 282,512 28.0%
Provisions 20,368 2.2% 20,940 2.1% 20,917 2.1%
Non-current financial liabilities 244,651 25.7% 255,652 25.9% 261,595 25.9%
Current liabilities 327,379 34.4% 349,721 35.4% 361,162 35.8%
Current financial liabilities 175,421 18.4% 151,489 15.3% 194,699 19.3%
Trade payables 124,407 13.1% 177,734 18.0% 139,215 13.8%
Other current liabilities 27,551 2.9% 20,498 2.1% 27,248 2.7%
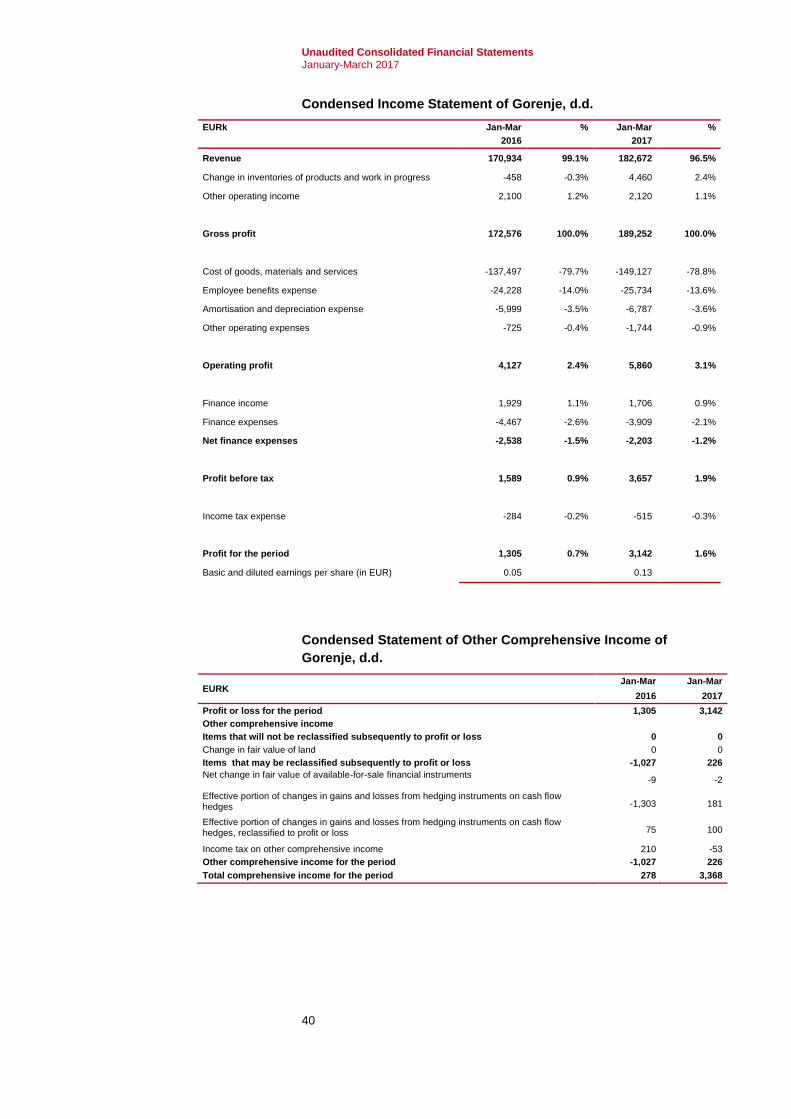
Unaudited Consolidated Financial Statements January-March 2017
40
Condensed Income Statement of Gorenje, d.d.
EURk Jan-Mar % Jan-Mar %
2016 2017
Revenue 170,934 99.1% 182,672 96.5%
Change in inventories of products and work in progress -458 -0.3% 4,460 2.4%
Other operating income 2,100 1.2% 2,120 1.1%
Gross profit 172,576 100.0% 189,252 100.0%
Cost of goods, materials and services -137,497 -79.7% -149,127 -78.8%
Employee benefits expense -24,228 -14.0% -25,734 -13.6%
Amortisation and depreciation expense -5,999 -3.5% -6,787 -3.6%
Other operating expenses -725 -0.4% -1,744 -0.9%
Operating profit 4,127 2.4% 5,860 3.1%
Finance income 1,929 1.1% 1,706 0.9%
Finance expenses -4,467 -2.6% -3,909 -2.1%
Net finance expenses -2,538 -1.5% -2,203 -1.2%
Profit before tax 1,589 0.9% 3,657 1.9%
Income tax expense -284 -0.2% -515 -0.3%
Profit for the period 1,305 0.7% 3,142 1.6%
Basic and diluted earnings per share (in EUR) 0.05 0.13
Condensed Statement of Other Comprehensive Income of
Gorenje, d.d.
EURK Jan-Mar Jan-Mar
2016 2017
Profit or loss for the period 1,305 3,142
Other comprehensive income
Items that will not be reclassified subsequently to profit or loss 0 0
Change in fair value of land 0 0
Items that may be reclassified subsequently to profit or loss -1,027 226
Net change in fair value of available-for-sale financial instruments -9 -2
Effective portion of changes in gains and losses from hedging instruments on cash flow hedges -1,303 181
Effective portion of changes in gains and losses from hedging instruments on cash flow hedges, reclassified to profit or loss 75 100
Income tax on other comprehensive income 210 -53
Other comprehensive income for the period -1,027 226
Total comprehensive income for the period 278 3,368

Unaudited Consolidated Financial Statements January-March 2017
41
Condensed Statement of Cash Flows of Gorenje, d.d.
EURk Jan-Mar Jan-Mar
2016 2017
A. CASH FLOWS FROM OPERATING ACTIVITIES
Profit or loss for the period 1,305 3,142
Adjustments for:
-Depreciation of property, plant and equipment 4,944 5,401
-Amortisation of intangible assets 1,055 1,386
-Investment income -1,929 -1,706
-Finance expenses 4,467 3,909
-Gain on sale of property, plant and equipment -23 -9
-Income tax expense 284 515
Operating profit before changes in net operating assets and provisions
10,103 12,638
Change in trade and other receivables -8,436 -19,809
Change in inventories -2,142 -11,856
Change in provisions -1,050 -23
Change in trade and other payables -33,950 -29,971
Cash generated from operations -45,578 -61,659
Interest paid -3,817 -4,180
Net cash from operating activities -39,292 -53,201
B. CASH FLOWS FROM INVESTING ACTIVITIES
Proceeds from sale of property, plant and equipment 12 0
Proceeds from sale of investment property 444 345
Interest received 1,216 396
Acquisition of property, plant and equipment -3,350 -4,251
Other investments 14,539 -4,559
Acquisition of intangible assets -3,813 -3,855
Net cash used in investing activities 9,048 -11,924
C. CASH FLOWS FROM FINANCING ACTIVITIES
Borrowing / Repayment of borrowings 24,373 51,951
Net cash used in financing activities 24,373 51,951
Net change in cash and cash equivalents -5,871 -13,174
Cash and cash equivalents at beginning of period 7,599 14,743
Cash and cash equivalents at end of period 1,728 1,569

Unaudited Consolidated Financial Statements January-March 2017
42
Condensed Statement of Changes in Equity of Gorenje, d.d.
EURk Share capital
Share premium
Revenue reserves
Treasury shares
Retained earnings or losses
Fair value
reserve Total
Legal reserves
Statutory reserves
Treasury share reserve
Other re-venue reserves
Profit or loss from previous periods
Profit or loss for the period
Opening balance at 1 Jan 2016 101,922 156,639 12,896 7,556 3,170 75,679 -3,170 0 0 4,222 358,914
Total comprehensive income for the period
Profit for the period 1,305 1,305
Total other comprehensive income -1,027 -1,027
Total comprehensive income for the period 0 0 0 0 0 0 0 0 1,305 -1,027 278
Transactions with owners (when acting as owners) recognised directly in equity
0
Contributions by owners and distribution to owners 0
Total contributions by owners and distribution to owners
0 0 0 0 0 0 0 0 0 0 0
Total transactions with owners 0 0 0 0 0 0 0 0 0 0 0
Closing balance at 31 Mar 2016 101,922 156,639 12,896 7,556 3,170 75,679 -3,170 0 1,305 3,195 359,192

Unaudited Consolidated Financial Statements January-March 2017
43
EURk Share capital
Share premium
Revenue reserves
Treasury shares
Retained earnings or losses
Fair value
reserve Total
Legal reserves
Statutory reserves
Treasury share reserve
Other re-venue reserves
Profit or loss from previous periods
Profit or loss for the period
Opening balance at 1 Jan 2017 101,922 156,639 12,896 7,919 3,170 22,030 -3,170 56,914 0 3,234 361,554
Total comprehensive income for the period
Profit for the period 3,142 3,142
Total other comprehensive income 226 226
Total comprehensive income for the period 0 0 0 0 0 0 0 0 3,142 226 3,368
Transactions with owners (when acting as owners) recognised directly in equity
0
Contributions by owners and distribution to owners 0
Total contributions by owners and distribution to owners
0 0 0 0 0 0 0 0 0 0 0
Total transactions with owners 0 0 0 0 0 0 0 0 0 0 0
Closing balance at 31 Mar 2017 101,922 156,639 12,896 7,919 3,170 22,030 -3,170 56,914 3,142 3,460 364,922
Profit from previous periods amounted to EUR 56,914k, whereof EUR 54,484k cannot be distributed to owners pursuant to provisions of the Companies Act. The Company is namely obliged to observe the Slovenian legislation and thus also Article 66 of the Companies Act, which defines the category of accumulated profit. Non-current deferred costs of development are in the accumulated profit for 2016 considered as a deductible item, which as at 31 December 2016 amounted to EUR 54,484k. Accordingly, the accumulated profit available for distribution amounted in 2016 to EUR 2,430k. The Shareholders' Meeting will decide on its distribution in 2017.

Unaudited Consolidated Financial Statements January-March 2017
44
Notes to the Condensed Financial Statements of Gorenje, d.d.
Fair values and book values of assets and liabilities
EURk
Book value Fair value Book value Fair value
31 Dec 2016 31 Dec 2016 31 Mar 2017 31 Mar 2017
Available-for-sale investments 1,617 1,617 1,620 1,620
Land and investment property 34,750 34,750 34,158 34,158
Non-current loans 1,357 1,357 1,403 1,403
Current loans 138,563 138,563 143,116 143,116
Derivatives -1,853 -1,853 -1,335 -1,335
Trade receivables 130,860 130,860 149,707 149,707
Other current assets 10,726 10,726 10,352 10,352
Cash and cash equivalents 14,743 14,743 1,569 1,569
Non-current financial liabilities -140,578 -140,578 -169,819 -169,819
Non-current financial liabilities (fixed interest rate)
-115,074 -81,849 -91,776 -82,457
Current financial liabilities -148,399 -148,399 -192,994 -192,994
Trade payables -177,734 -177,734 -139,215 -139,215
Other current liabilities -13,142 -13,142 -12,426 -12,426
Total -264,164 -230,939 -265,640 -256,321
Fair value scale
31 December 2016
EURk Level 18 Level 29 Level 310 Total
Available-for-sale financial assets 132 - 1,485 1,617
Derivatives - assets - 1,237 - 1,237
Derivatives - liabilities - -3,090 - -3,090
Land and investment property - - 34,750 34,750
31 March 2017
EURk Level 1 Level 2 Level 3 Total
Available-for-sale financial assets 130 - 1,490 1,620
Derivatives - assets - 370 - 370
Derivatives - liabilities - -1,705 - -1,705
Land and investment property - - 34,158 34,158
Related party transactions
EURk
Value of transaction Balance
Jan-Mar 2016
Jan-Mar 2017
31 Mar 2016 31 Mar 2017
Revenue 118,528 123,165
Trade receivables 112,678 101,512
Trade payables 23,895 27,721
Loans granted 159,924 138,187
Borrowings raised 60,795 64,162
8 Level 1: stock price (unadjusted) on the active market of identical assets and liabilities, 9 Level 2: data differing from stock price data (these are included in Level 1) monitored with the
intention of direct or indirect valuation of assets and liabilities, 10 Level 3: data on the value of assets and liabilities not based on the active market.

Unaudited Consolidated Financial Statements January-March 2017
45
Financial indicators
This report discloses financial statements prepared in accordance with International Financial Reporting Standards (IFRSs). In addition to these statements and notes, the report provides financial and other ratios as well as indicators that are earmarked for monitoring trends in the Gorenje Group's business operations. Following methodology is applied when calculating these ratios and indicators:
indicators referring to individual average categories of the balance sheet are calculated on the basis of the average balances of the reporting period and previous three quarters,
indicators referring to the income statement are categories disclosed on the annual level and taken into account the operations in the reporting period and the previous three quarters.
Jan-Mar Jan-Mar
2016 2017
INDICATORS OF PROFITABILITY
Net return on sales (ROS) 0.76% 1.72%
Return on assets (ROA) 1.84% 1.07%
Net return on equity (ROE) 1.12% 1.53%
ASSET INDICATORS
Asset turnover ratio 0.72 0.73
Inventory turnover ratio 7.38 7.55
Current trade receivables turnover ratio 4.28 4.96
INVESTMENT INDICATORS
Fixed assets (PPE) to total assets 0.27 0.28
Current assets to total assets 0.55 0.59
INDICATORS OF FINANCIAL COMPOSITION
Long-term coverage of non-current assets 1.20 1.09
Equity to total liabilities 0.38 0.36
Long-term to total liabilities 0.66 0.64
Equity to fixed assets (carrying value) 1.41 1.31
Quick ratio (liquid assets to current liabilities) 0.52 0.41
(Liquid assets + current receivables) to current liabilities
1.03 0.86
Current ratio 1.32 1.14
Net financial liabilities to equity 0.69 0.84
OPERATING PERFORMANCE INDICATORS
Operating income to operating expenses 1.02 1.03
Revenue per employee (EUR) 41,388 41,897
Value added per employee (EUR) 8,318 8,803
Unaudited Consolidated Financial Statements January-March 2017
46
INFORMATION REGARDING THE REPORT AND ITS PUBLIC ANNOUNCEMENT
Pursuant to provisions of the Code of Warsaw Stock Exchange, Rules and Regulations of the Ljubljana Stock Exchange and the applicable legislation, the company Gorenje, d.d., Partizanska 12, SI-3320 Velenje, hereby announces the unaudited non-consolidated financial statements of Gorenje, d.d., and unaudited consolidated financial statements of the Gorenje Group for the period January–March 2017. The unaudited
financial statements of Gorenje, d.d., and the Gorenje Group were presented to the Supervisory Board at its 34th regular session held on 23 May 2017.
The financial statements are available for review at the headquarters of Gorenje, d.d., at Partizanska 12, SI-3320 Velenje, whereas announcements shall be available in the Ljubljana Stock Exchange electronic info system, the SEOnet (www.ljse.si), the Warsaw Stock Exchange via the ESPI system (www.gpw.pl), and the company’s web site at www.gorenjegroup.com, on 24 May 2017.
Forward-looking Statements
This announcement includes forward-looking information and forecasts – i.e. statements regarding the future, rather than the past, and regarding events within the framework and in relation to the currently effective legislation on publicly traded companies and securities and pursuant to the Rules and Regulations of the Ljubljana and Warsaw Stock Exchange. These statements can be identified by the words such as "expected", "anticipated", "forecast", "intended", "planned or budgeted", "probable or likely", "strive/invest effort to", "estimated", "will", "projected", or similar expressions. These statements include, among others, financial goals and targets of the parent company Gorenje, d.d., and the Gorenje Group for the upcoming periods, planned or budgeted operations, and financial plans. These statements are based on current expectations and forecasts and are subject to risk and uncertainty, which may affect the actual results, which may in turn differ from the information stated herein for various reasons. Various factors, many of which are beyond reasonable control by Gorenje, affect the operations, performance, business strategy, and results of Gorenje. Thus actual results, performance, or achievements of Gorenje may differ materially from the expected results, performance, or achievements as stated in these forward-looking statements. These factors include but are not necessarily limited to following: consumer demand and market conditions in geographical segments or regions and in industries in which the Gorenje Group is conducting its operating activities; effects of exchange rate fluctuations; competitive downward pressure on downstream prices; major loss of business with a major account/customer; the possibility of late payment on the part of customers; decrease in prices as a result of persistently harsh market conditions, in an extent much higher than currently expected by Gorenje's Management Board; success of development of new products and their implementation in the market; development of manufacturer's liability for the product; progress of attainment of operative and strategic goals regarding efficiency; successful identification of opportunities for growth and mergers and acquisitions, and integration of such opportunities into the existing operations; further volatility and aggravation of circumstances in capital markets; progress in attainment of goals regarding structural reorganisation and reorganisation in purchasing. If one or more risks or uncertainties are in fact materialised or if the said assumptions are proven wrong, actual results may deviate materially from those stated as expected, hoped for, forecast, projected, planned, probable, estimated, or anticipated in this announcement. Gorenje allows any update or revision of these forecasts in light of development differing from the expected events.